Embed Size (px)
Citation preview
ROBERT D. MCHUGH, JR., Ph.D. Weekend Market Newsletter
A Publication of Main Line Investors, Inc. P.O. Box 1026 Issue No. 1006 Email Address: Kimberton, PA 19442 Friday, January 30th, 2009 [email protected]
Sep 8 9 2 9 1 1 Sep 9 9 2 1 1 1 Sep 10 9 2 1 1 1 Sep 11 9 2 1 1 1 Sep 12 9 2 9 1 1
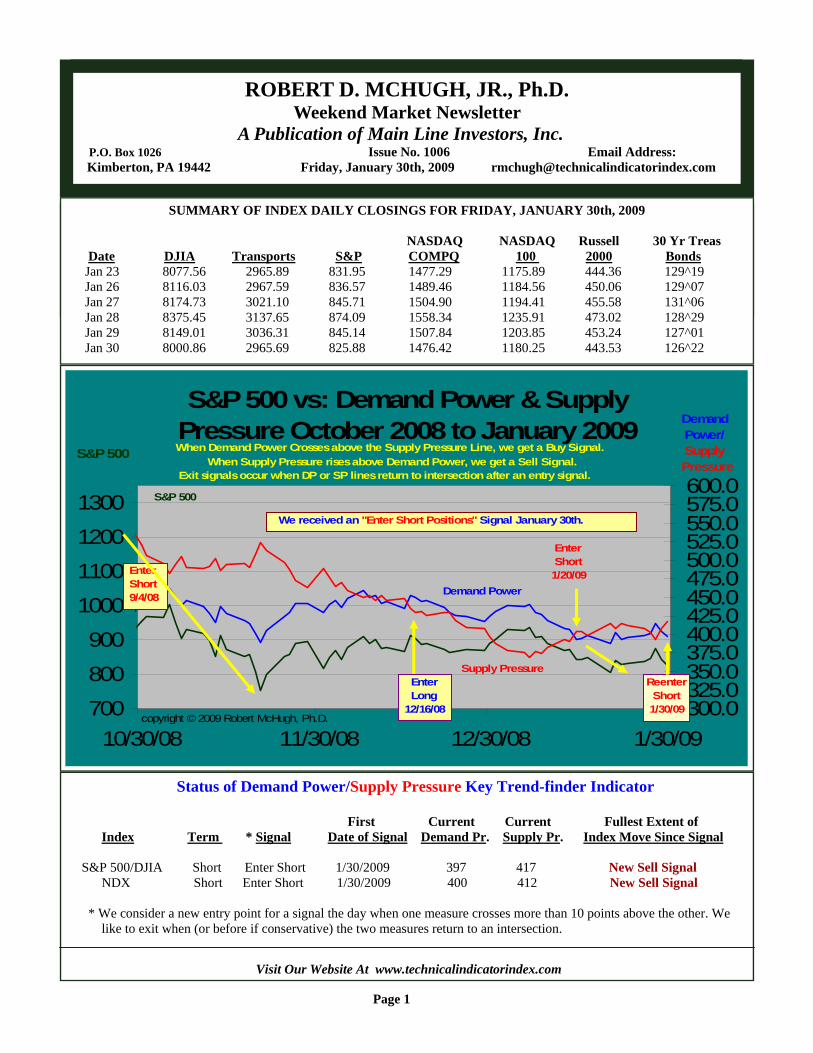
Status of Demand Power/Supply Pressure Key Trend-finder Indicator First Current Current Fullest Extent of Index Term * Signal Date of Signal Demand Pr. Supply Pr. Index Move Since Signal S&P 500/DJIA Short Enter Short 1/30/2009 397 417 New Sell Signal NDX Short Enter Short 1/30/2009 400 412 New Sell Signal * We consider a new entry point for a signal the day when one measure crosses more than 10 points above the other. We like to exit when (or before if conservative) the two measures return to an intersection.
Page 1
Visit Our Website At www.technicalindicatorindex.com
SUMMARY OF INDEX DAILY CLOSINGS FOR FRIDAY, JANUARY 30th, 2009
NASDAQ NASDAQ Russell 30 Yr Treas Date DJIA Transports S&P COMPQ 100 2000 Bonds Jan 23 8077.56 2965.89 831.95 1477.29 1175.89 444.36 129^19 Jan 26 8116.03 2967.59 836.57 1489.46 1184.56 450.06 129^07 Jan 27 8174.73 3021.10 845.71 1504.90 1194.41 455.58 131^06 Jan 28 8375.45 3137.65 874.09 1558.34 1235.91 473.02 128^29 Jan 29 8149.01 3036.31 845.14 1507.84 1203.85 453.24 127^01 Jan 30 8000.86 2965.69 825.88 1476.42 1180.25 443.53 126^22
S&P 500 vs: Demand Power & Supply Pressure October 2008 to January 2009
700800900
1000110012001300
10/30/08 11/30/08 12/30/08 1/30/09300.0325.0350.0375.0400.0425.0450.0475.0500.0525.0550.0575.0600.0
S&P 500
When Demand Power Crosses above the Supply Pressure Line, we get a Buy Signal. When Supply Pressure rises above Demand Power, we get a Sell Signal. Exit signals occur when DP or SP lines return to intersection after an entry signal.
S&P 500
Demand Power/ Supply Pressure
Supply Pressure
Demand Power
copyright © 2009 Robert McHugh, Ph.D.
We received an "Enter Short Positions" Signal January 30th.
Enter Short 9/4/08
Enter Long 12/16/08
Reenter Short 1/30/09
Enter Short1/20/09
MCHUGH’S DAILY MARKET BRIEFING Friday, January 30th, 2009
Page 2
The Dow Industrials fell 148.15 points Friday, or 1.82 percent, closing at 8,000.86. NYSE vol-ume rose to 93 percent of its 10 day average. Downside volume led at 86 percent, with declining is-sues leading at 73 percent, with downside points at 93 percent. S&P 500 Demand Power fell 8 points to 397, while Supply Pressure rose 10 points to 417, telling us the decline was strong, with deep pock-ets mildly supporting prices by buying the market. Signals remain in conflict for the short term, which is typical wave b action. Sideways is the overall suggestion for prices as of Friday. Once they move into consensus, we will point out the new direction prices should be headed. Until then, we expect a lot of back and forth, narrow trading range action. The Long-term primary trend remains down, as the Grand Supercycle wave {IV} Bear mar-ket remains in control. The Dow Theory Primary trend Sell signal from November 21st, 2007 re-mains intact. Should the Industrials drop below their November 20th, 2008 closing low of 7,552.29, before both the Industrials and Trannies rise above their January 2009 highs, we will have a reconfir-mation of this Dow Theory Sell signal, a long-term indicator. Further, this weekend’s report covers the latest from our Primary Trend Indicator, another long-term trend indicator. It continues to worsen, and remains solidly on a Sell signal. Regardless of short term movements, these two key long term indicators warn that Grand Supercycle wave {IV} down has further to go. We fear this Bear market will devolve into a Great Depression as bad or worse than the 1930’s, and have strongly urged sub-scribers to consider raising cash, whether that is accomplished by cutting back on expenses, getting a second job, or selling select unnecessary assets or investments. How cash is raised is up to you and your personal financial advisor. But in a depression, cash is king as credit becomes scarce, as we are seeing now. Build up savings, and don’t shy from FDIC insured bank deposit accounts. Our conserva-tive investment portfolio model at the button on our home page at www.technicalindicatorindex.com gives a picture of what we have been doing for several years in preparation for this time. This week we present our next phi mate turn date, and our Primary Trend indicator on page 8.
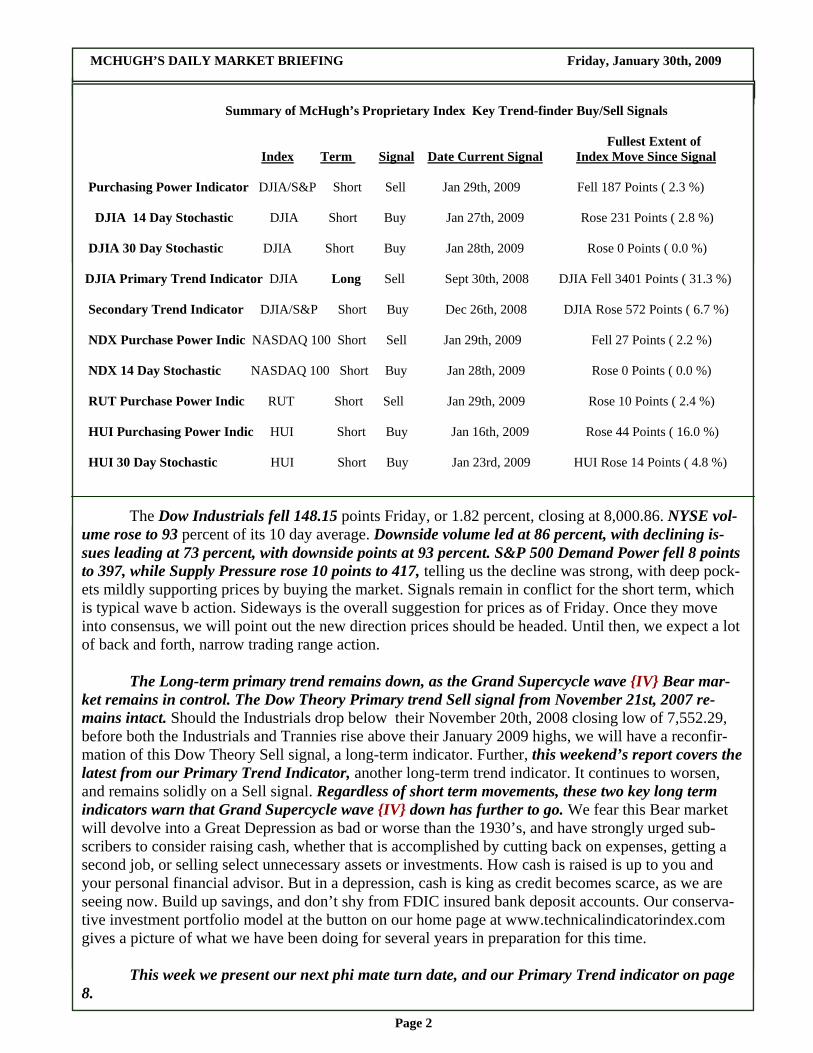
Summary of McHugh’s Proprietary Index Key Trend-finder Buy/Sell Signals Fullest Extent of Index Term Signal Date Current Signal Index Move Since Signal Purchasing Power Indicator DJIA/S&P Short Sell Jan 29th, 2009 Fell 187 Points ( 2.3 %) DJIA 14 Day Stochastic DJIA Short Buy Jan 27th, 2009 Rose 231 Points ( 2.8 %) DJIA 30 Day Stochastic DJIA Short Buy Jan 28th, 2009 Rose 0 Points ( 0.0 %) DJIA Primary Trend Indicator DJIA Long Sell Sept 30th, 2008 DJIA Fell 3401 Points ( 31.3 %) Secondary Trend Indicator DJIA/S&P Short Buy Dec 26th, 2008 DJIA Rose 572 Points ( 6.7 %) NDX Purchase Power Indic NASDAQ 100 Short Sell Jan 29th, 2009 Fell 27 Points ( 2.2 %) NDX 14 Day Stochastic NASDAQ 100 Short Buy Jan 28th, 2009 Rose 0 Points ( 0.0 %) RUT Purchase Power Indic RUT Short Sell Jan 29th, 2009 Rose 10 Points ( 2.4 %) HUI Purchasing Power Indic HUI Short Buy Jan 16th, 2009 Rose 44 Points ( 16.0 %) HUI 30 Day Stochastic HUI Short Buy Jan 23rd, 2009 HUI Rose 14 Points ( 4.8 %)
MCHUGH’S DAILY MARKET BRIEFING Friday, January 30th, 2009
Page 3
The Commerce department reported Friday that GDP fell 3.8 percent in the fourth quarter 2008, the biggest drop since 1982. We expect unemployment to be the key crisis for 2009, and expect it to surpass 10 percent, and head toward 15 percent. The problems continue to compound, as folks cannot even downsize because of the housing depression, with buyers nonexistent, and housing credit scarce. The focus of the Master Planner’s stimulus efforts has been on foreclosures, with little attention to getting cash into the hands of every American household, enough to increase the velocity of money, which would translate into a free flow of credit, increasing demand for goods and services, and the cleansing of bad assets into good assets as delinquent loans get caught up and debts get paid off. A lot of money is being thrown at this mess, but little of it will be effective. The best solution is a trickle up strategy where three years of past income taxes are rebated, half required to be used to payoff debt, with a minimum payment of $50,000 per household, coupled with permanent income tax cuts going forward, and elimination of the wealth confiscation real estate tax. Revenue replacement can come from sales taxes. Because the Master Planners are so far off the mark, we can expect a hyperinflationary eco-nomic Depression, which will hit hard when cataclysmic Supercycle wave (C ) down hits, either later in 2009, or 2010. The January Barometer for markets has been uncannily accurate since 1950. The theory is simply, as goes January, so goes the rest of the year. Since 1950, if you exclude years that markets were flat, it has been accurate 91 percent of the time, and if you consider flat years as being incorrect, this ba-rometer has been right 74 percent of the time. Well, in January 2009, the S&P 500 fell 8.57 percent. We got more whipsawing in several indicators Friday, typical action for a wave b. The Demand Power and Supply Pressure indicators for the S&P 500 and the NDX both generated new sell signals, as did the Plunge Protection Team indicator. All our other key indicators remained the same, with many on sideways signals. This technical picture is being shadowed by fundamentals as markets try and figure out what the heck the Master Planners are going to do to try and fix this mess. There is far too much uncer-tainty at this time, and markets hate uncertainty. They see legislation attacking bonuses to middle man-agement and sales positions, which is an all-out attack on capitalism and is nothing more than pure un-adulterated socialism, and markets are not happy about this. Spending for infrastructure sounded like a great component to a comprehensive stimulus plan, but only $150 billion out of $1.6 trillion has been earmarked for infrastructure, enough to fund a big bridge for each state. Big stink’n deal. The tax solu-tion? $1,000 for families, and $500 for singles. Enough to cover your next trip to the dentist or car re-pair. Big stink’n deal. This is a farce, yet so much money is being spent and wasted that the Dollar will tank. If it has to tank, why not get hundreds of thousands of dollars into the hands of each American household? Brutal. We believe we are either in wave B-down or the start of C-up in Supercycle wave (B) up. It is just a question of how high wave C is going, which depends upon which pattern is unfolding, either a zigzag (which suggests the Industrials could be headed for 10,000ish), or a sideways symmetrical trian-gle (which suggests a rise to around 9,000ish). There should be a 6 week to two month rally that is sig-nificant, maybe 10 to 20 percent coming, as wave C-up of (B) up gets legs. We show Large Bullish di-vergences in the Advance/Decline Line indicators this weekend arguing such a rally is coming. The monthly Full Stochastics are supportive of this Bullish intermediate term view. The Weekly Full Sto-chastics allow for more decline short-term, and the Daily Full Stochastics, a shorter-term indicator, sug-gest prices could fall before wave C-up gets legs. Very short-term, with a time horizon of a day or two, the 15 and 30 minute Full Stochastics sug-gest prices could bounce Monday or Tuesday.
MCHUGH’S DAILY MARKET BRIEFING Friday, January 30th, 2009
Page 4
The Demand Power/Supply Pressure indicators generated an enter short position signal Janu-ary 30th. Friday’s McClellan Oscillator fell to negative –72.54. The Summation Index fell to positive + 1,513.42. NYSE New Highs remained anemic at 4, with New Lows rising to 82. The percent of DJIA stocks above their 30 day moving average fell to 3.33 from 10.00. The per-cent above 10 day fell to 26.67 from 43.33. The percent above 5 day fell to 6.67 from 33.33. The NYSE 10 day average Advance/Decline Line Indicator worsened to negative –34.7, remaining on a “buy” signal from January 29th, when it rose above the positive + 120.00 threshold necessary for a new “buy.” Our three Blue Chip key trend-finder indicators (other than the Demand Power/Supply Pres-sure Indicator) remain on a “sideways” signal Friday. The DJIA 30 day Stochastic Fast fell to 3.33, below the Slow at 13.33, but not decisively below, remaining on a “buy” signal from January 28th. The DJIA 14 day Stochastic fell to 16.67, below the Slow at 25.00, but not decisively below, remaining on a “buy” signal from January 27th. The Fast had to cross more than 10 points above the Slow for a new “buy.” The S&P 500 Purchasing Power Indicator fell 4 points to negative –123.41, remaining on a “sell” signal from January 29th. The Plunge Protection Team Risk Indicator fell to positive + 12.75 Friday, January 30th, trig-gering a new sell signal. A rise above positive + 20.0 or a drop below –16.0 triggers a new “buy” sig-nal. When the reading rises above positive + 20.00, or falls below negative –16.00, we usually see multi-week rallies. On the other hand, declines can (don’t have to) occur when this reading falls within the range of negative –16.00 to positive + 20.00. The PPT Indicator was in the range where declines typi-cally occur, between negative –16.00 and positive + 20.00 for most of the late December/January de-cline, which saw the DJIA drop over 1,100 points. It then rose above + 20.00 January 14th. Rallies usu-ally start about a week or two after this measure exceeds positive +20.00. When this indicator last went below negative –16.00, triggering a new “buy” signal, on February 7th, 2008, the Industrials closed at 12,247. After that the Industrials rose 509 points. After they rose above negative –16.00 on March 3rd, the DJIA dropped over 500 points. From May to July 2008 we saw a significant decline within this range, 1,650 points. After this indicator generated a sell signal October 1st, the Industrials declined 2,948 points. After this indicator generated a sell signal November 17th, the Industrials fell 824 points, or 10 percent. The DJIA Call/Put Ratio rose to 1.15 Friday, remaining on a “buy” signal from January 28th,(moving below 1.00 and above 1.40 is neutral, while rising decisively above 1.00 (above 1.10) triggers a new “buy”). On Friday, the Secondary Trend Indicator fell 6 points to positive + 26, remaining on a buy signal from December 26th when it went positive for the first time in three months. Above zero is Bullish. Below zero is Bearish. The closer it moves toward zero, the greater the risk of a developing trend turn, thus caution with open positions would be recommended. After it turned Bearish on Decem-ber 31st, 2007, the Industrials fell 1,630 Points, or 12.3 percent. After it generated a sell, on June 17th, the Industrials fell 1,200 points. After it triggered a sell signal on October 2nd, the Industrials fell 2,600 points. This indicator correlates well with price trends. Shorting should only be done with funds that are speculative and the investor is willing to ac-cept a substantial loss on. That is because the PPT is very active at this time.
MCHUGH’S DAILY MARKET BRIEFING Friday, January 30th, 2009
Page 5
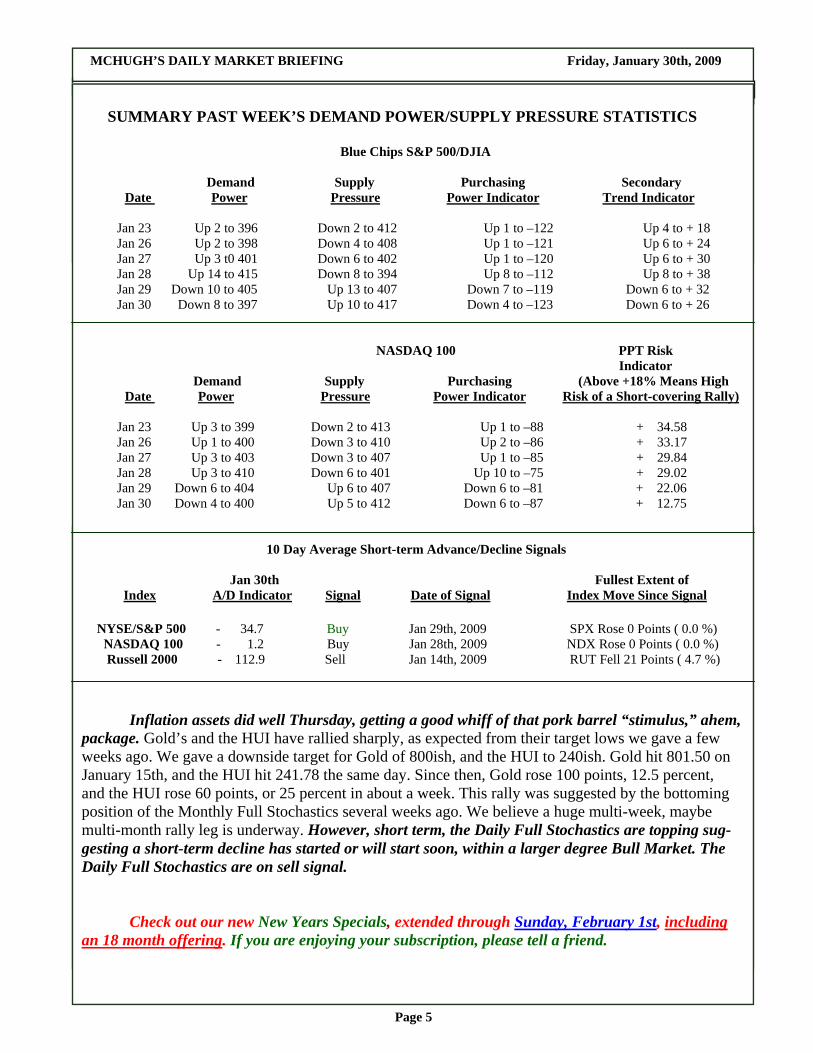
SUMMARY PAST WEEK’S DEMAND POWER/SUPPLY PRESSURE STATISTICS Blue Chips S&P 500/DJIA Demand Supply Purchasing Secondary Date Power Pressure Power Indicator Trend Indicator Jan 23 Up 2 to 396 Down 2 to 412 Up 1 to –122 Up 4 to + 18 Jan 26 Up 2 to 398 Down 4 to 408 Up 1 to –121 Up 6 to + 24 Jan 27 Up 3 t0 401 Down 6 to 402 Up 1 to –120 Up 6 to + 30 Jan 28 Up 14 to 415 Down 8 to 394 Up 8 to –112 Up 8 to + 38 Jan 29 Down 10 to 405 Up 13 to 407 Down 7 to –119 Down 6 to + 32 Jan 30 Down 8 to 397 Up 10 to 417 Down 4 to –123 Down 6 to + 26 NASDAQ 100 PPT Risk Indicator Demand Supply Purchasing (Above +18% Means High Date Power Pressure Power Indicator Risk of a Short-covering Rally) Jan 23 Up 3 to 399 Down 2 to 413 Up 1 to –88 + 34.58 Jan 26 Up 1 to 400 Down 3 to 410 Up 2 to –86 + 33.17 Jan 27 Up 3 to 403 Down 3 to 407 Up 1 to –85 + 29.84 Jan 28 Up 3 to 410 Down 6 to 401 Up 10 to –75 + 29.02 Jan 29 Down 6 to 404 Up 6 to 407 Down 6 to –81 + 22.06 Jan 30 Down 4 to 400 Up 5 to 412 Down 6 to –87 + 12.75 10 Day Average Short-term Advance/Decline Signals Jan 30th Fullest Extent of Index A/D Indicator Signal Date of Signal Index Move Since Signal NYSE/S&P 500 - 34.7 Buy Jan 29th, 2009 SPX Rose 0 Points ( 0.0 %) NASDAQ 100 - 1.2 Buy Jan 28th, 2009 NDX Rose 0 Points ( 0.0 %) Russell 2000 - 112.9 Sell Jan 14th, 2009 RUT Fell 21 Points ( 4.7 %) Inflation assets did well Thursday, getting a good whiff of that pork barrel “stimulus,” ahem, package. Gold’s and the HUI have rallied sharply, as expected from their target lows we gave a few weeks ago. We gave a downside target for Gold of 800ish, and the HUI to 240ish. Gold hit 801.50 on January 15th, and the HUI hit 241.78 the same day. Since then, Gold rose 100 points, 12.5 percent, and the HUI rose 60 points, or 25 percent in about a week. This rally was suggested by the bottoming position of the Monthly Full Stochastics several weeks ago. We believe a huge multi-week, maybe multi-month rally leg is underway. However, short term, the Daily Full Stochastics are topping sug-gesting a short-term decline has started or will start soon, within a larger degree Bull Market. The Daily Full Stochastics are on sell signal. Check out our new New Years Specials, extended through Sunday, February 1st, including an 18 month offering. If you are enjoying your subscription, please tell a friend.
MCHUGH’S DAILY MARKET BRIEFING Friday, January 30th, 2009
Page 6
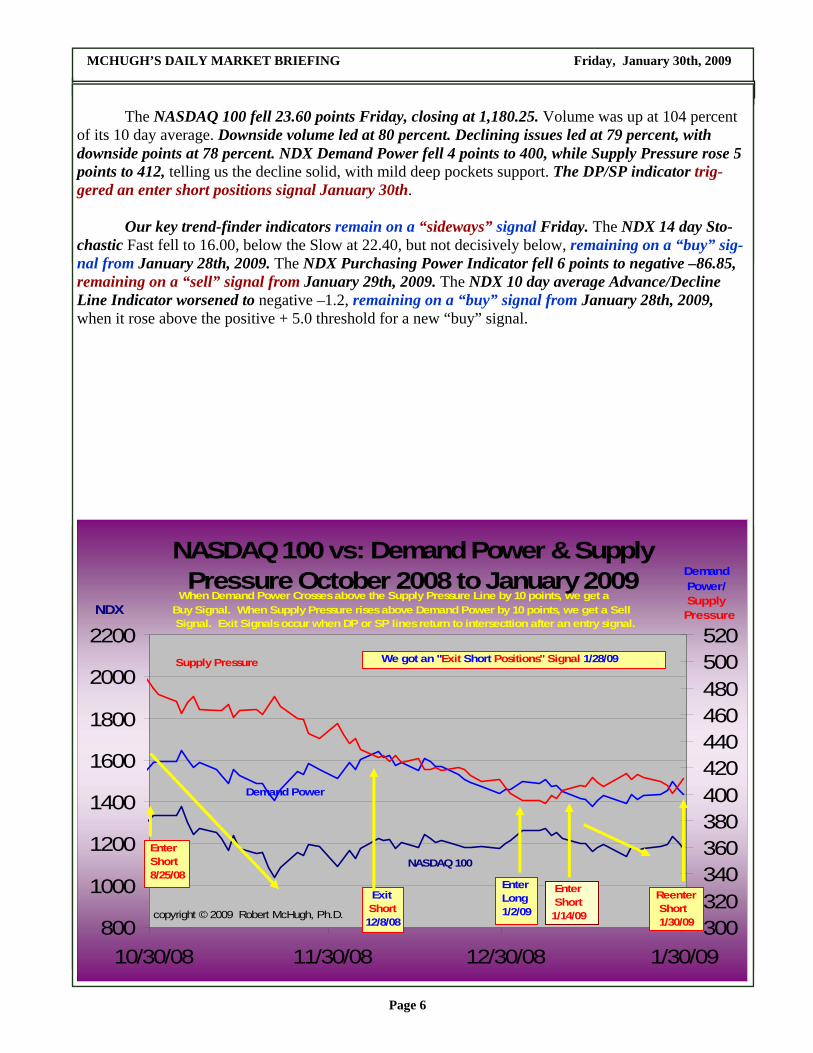
The NASDAQ 100 fell 23.60 points Friday, closing at 1,180.25. Volume was up at 104 percent of its 10 day average. Downside volume led at 80 percent. Declining issues led at 79 percent, with downside points at 78 percent. NDX Demand Power fell 4 points to 400, while Supply Pressure rose 5 points to 412, telling us the decline solid, with mild deep pockets support. The DP/SP indicator trig-gered an enter short positions signal January 30th. Our key trend-finder indicators remain on a “sideways” signal Friday. The NDX 14 day Sto-chastic Fast fell to 16.00, below the Slow at 22.40, but not decisively below, remaining on a “buy” sig-nal from January 28th, 2009. The NDX Purchasing Power Indicator fell 6 points to negative –86.85, remaining on a “sell” signal from January 29th, 2009. The NDX 10 day average Advance/Decline Line Indicator worsened to negative –1.2, remaining on a “buy” signal from January 28th, 2009, when it rose above the positive + 5.0 threshold for a new “buy” signal.
NASDAQ 100 vs: Demand Power & Supply Pressure October 2008 to January 2009
800
1000
1200
1400
1600
1800
2000
2200
10/30/08 11/30/08 12/30/08 1/30/09300320340360380400420440460480500520
NASDAQ 100
NDX
Demand Power/ Supply Pressure
Supply Pressure
Demand Power
copyright © 2009 Robert McHugh, Ph.D.
When Demand Power Crosses above the Supply Pressure Line by 10 points, we get a Buy Signal. When Supply Pressure rises above Demand Power by 10 points, we get a Sell Signal. Exit Signals occur when DP or SP lines return to intersecttion after an entry signal.
We got an "Exit Short Positions" Signal 1/28/09
Enter Short 8/25/08
Exit Short 12/8/08
Enter Long 1/2/09
Enter Short 1/14/09
Reenter Short 1/30/09
MCHUGH’S DAILY MARKET BRIEFING Friday, January 30th, 2009
Page 7
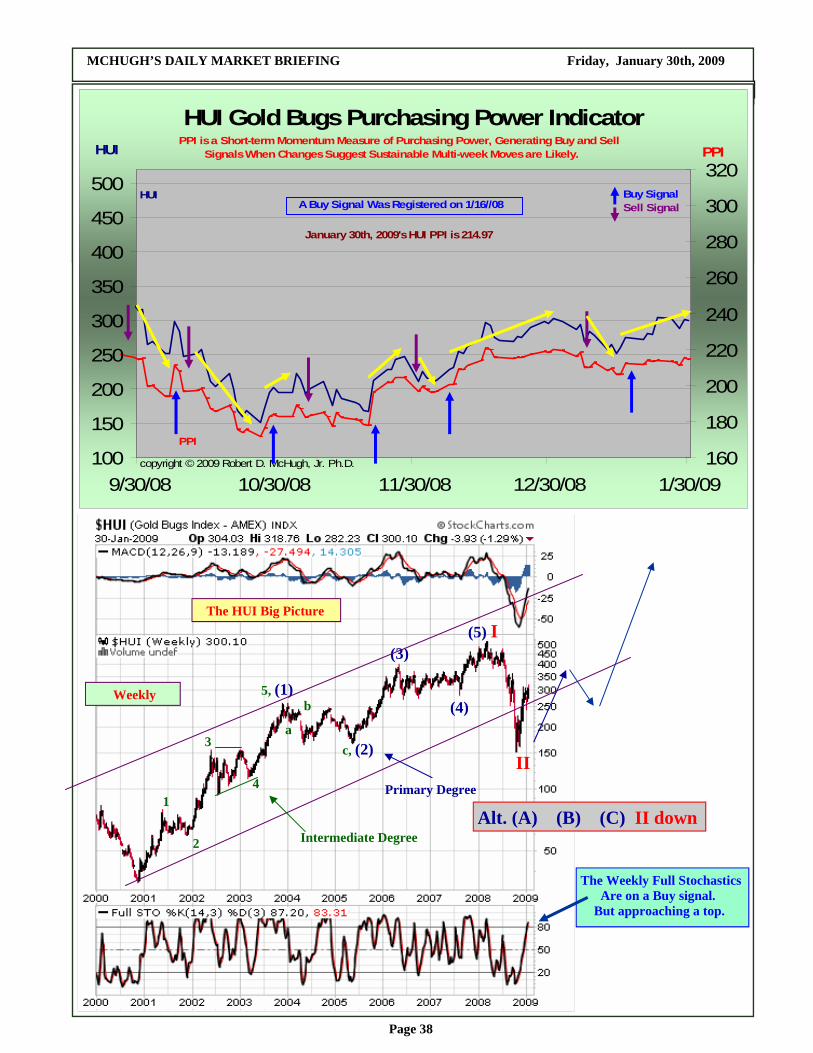
The Russell 2000 fell 9.71 points Friday, closing at 443.53. Volume rose to 100 percent of its 10 day average, with downside volume leading at 75 percent, with declining issues leading at 79 percent. The RUT Purchasing Power Indicator fell to negative –18.26, remaining on a “sell” signal from January 29th, 2009. The RUT 10 day average Advance/Decline Line Indicator worsened to negative - 112.90, remaining on a “sell” signal from January 14th, needing to rise above the positive + 180.00 threshold for a new “buy” signal. The HUI Amex Gold Bugs Index fell 1.75 points Friday, closing at 300.10. Volume was lower at 96 percent of its 10 day average. Downside volume led at 57 percent, with declining issues at 65 per-cent, and downside points at 91 percent. Our key trend-finder indicators remain on a “buy” signal Fri-day. The HUI 30 day Stochastic Fast remained at 95.00, above the Slow at 83.33, remaining on a “buy” signal from January 23rd. The Fast had to rise more than 20 points above the Slow to trigger a new “buy.” The HUI Purchasing Power Indicator fell slightly to 214.97, remaining on a “buy” signal from January 16th. February Gold rose sharply to 927.3. Silver rose to 12.56, while March Oil rose slightly to 41.75. The Dollar rose 0.55 to 85.89. Bonds fell half a point to 126^22. The PPT has to buy the long end to keep Bonds headed in the right direction, to support the housing market, especially now that AMBAC and MBIA are no longer rated AAA, Fannie Mae and Freddie Mac — who hold half of all mortgages - have collapsed, and credit markets have frozen, requiring lower interest rates, and Master Planner interest rate (bond) intervention. Bernanke finally suggested they will. The powerful rally in Bonds confirms they are monetizing Treasury debt. The VIX rose 2.21 to 44.84. The Australia SPASX200 rose 14.50 points, or 0.41 percent, to 3,526.20 Friday. Click on the Weekend Australia Report, which includes EW charts of the FTSE and DAX, for the latest analysis. Bottom Line: The Fed has to continue hyperinflating to bail out this sick economy, feeding a major trend up in precious metals. Households, not just Wall Street, must be bailed out. If this doesn’t happen we are headed for an economic depression.
New Years Specials: 6 Months for $175, or 10 Months for $215, or, 12 Months for $300, or 13 Months for $249, or 18 Months for $359, or * 24 Months for $449 * Extended through Sunday, February 1st, 2009 Simply go to www.technicalindicatorindex.com and click on the Subscribe Today or Renew Today buttons. Note: The 24 Month Subscription gets you a free copy of the book, Elliott Wave Principle. Simply email us your shipping address
MCHUGH’S DAILY MARKET BRIEFING Friday, January 30th, 2009
Page 8
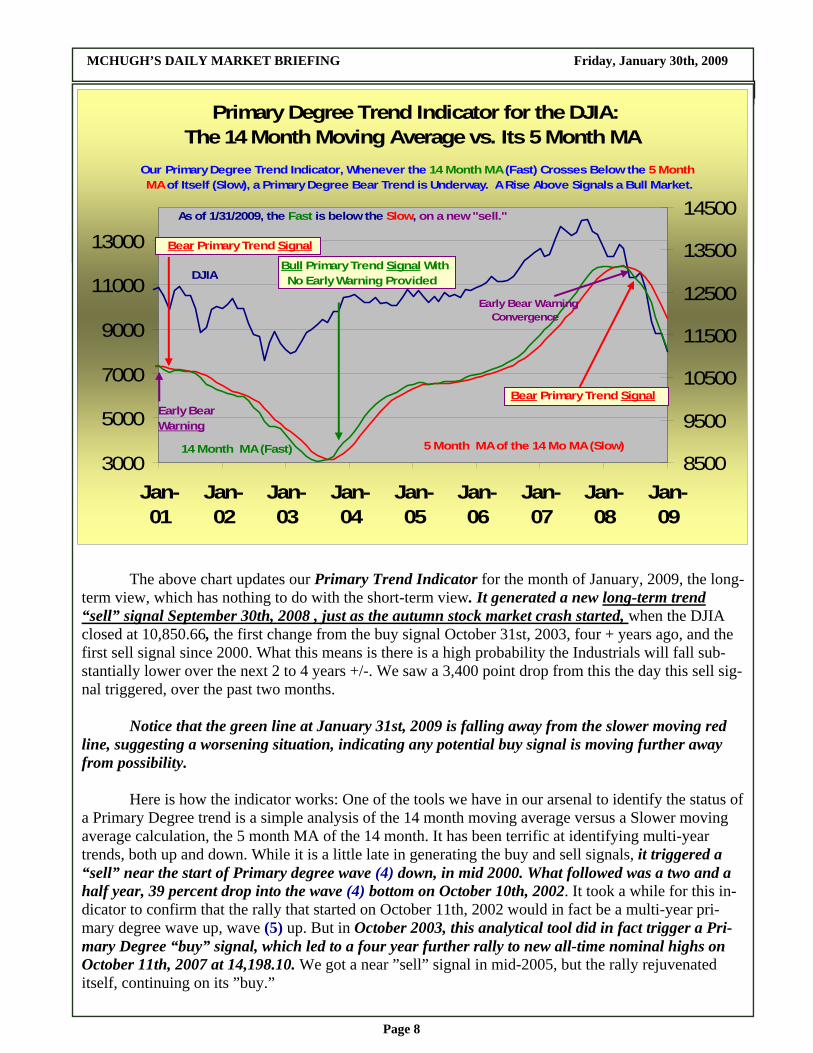
The above chart updates our Primary Trend Indicator for the month of January, 2009, the long-term view, which has nothing to do with the short-term view. It generated a new long-term trend “sell” signal September 30th, 2008 , just as the autumn stock market crash started, when the DJIA closed at 10,850.66, the first change from the buy signal October 31st, 2003, four + years ago, and the first sell signal since 2000. What this means is there is a high probability the Industrials will fall sub-stantially lower over the next 2 to 4 years +/-. We saw a 3,400 point drop from this the day this sell sig-nal triggered, over the past two months. Notice that the green line at January 31st, 2009 is falling away from the slower moving red line, suggesting a worsening situation, indicating any potential buy signal is moving further away from possibility. Here is how the indicator works: One of the tools we have in our arsenal to identify the status of a Primary Degree trend is a simple analysis of the 14 month moving average versus a Slower moving average calculation, the 5 month MA of the 14 month. It has been terrific at identifying multi-year trends, both up and down. While it is a little late in generating the buy and sell signals, it triggered a “sell” near the start of Primary degree wave (4) down, in mid 2000. What followed was a two and a half year, 39 percent drop into the wave (4) bottom on October 10th, 2002. It took a while for this in-dicator to confirm that the rally that started on October 11th, 2002 would in fact be a multi-year pri-mary degree wave up, wave (5) up. But in October 2003, this analytical tool did in fact trigger a Pri-mary Degree “buy” signal, which led to a four year further rally to new all-time nominal highs on October 11th, 2007 at 14,198.10. We got a near ”sell” signal in mid-2005, but the rally rejuvenated itself, continuing on its ”buy.”
Primary Degree Trend Indicator for the DJIA: The 14 Month Moving Average vs. Its 5 Month MA
3000
5000
7000
9000
11000
13000
Jan-01
Jan-02
Jan-03
Jan-04
Jan-05
Jan-06
Jan-07
Jan-08
Jan-09
8500
9500
10500
11500
12500
13500
14500
Our Primary Degree Trend Indicator, Whenever the 14 Month MA (Fast) Crosses Below the 5 Month MA of Itself (Slow), a Primary Degree Bear Trend is Underway. A Rise Above Signals a Bull Market.
DJIA
5 Month MA of the 14 Mo MA (Slow)14 Month MA (Fast)
Bear Primary Trend Signal
Early Bear Warning
Bull Primary Trend Signal With No Early Warning Provided
As of 1/31/2009, the Fast is below the Slow, on a new "sell."
Early Bear Warning Convergence
Bear Primary Trend Signal
MCHUGH’S DAILY MARKET BRIEFING Friday, January 30th, 2009
Page 9
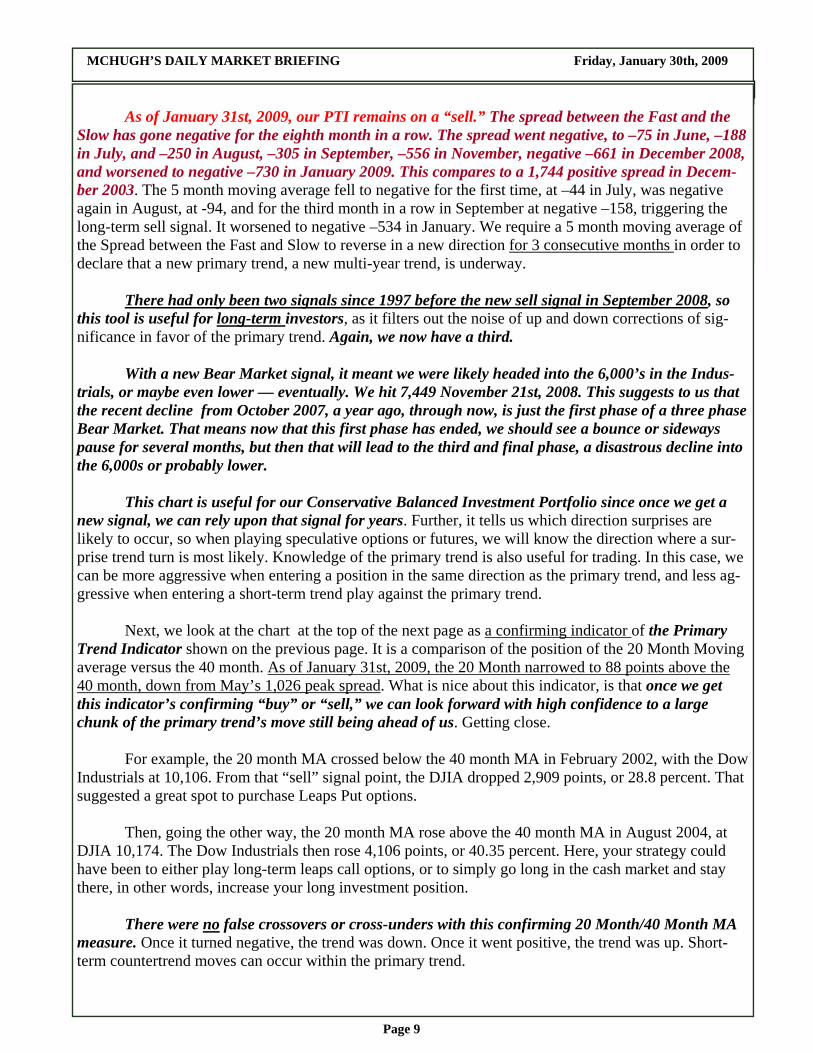
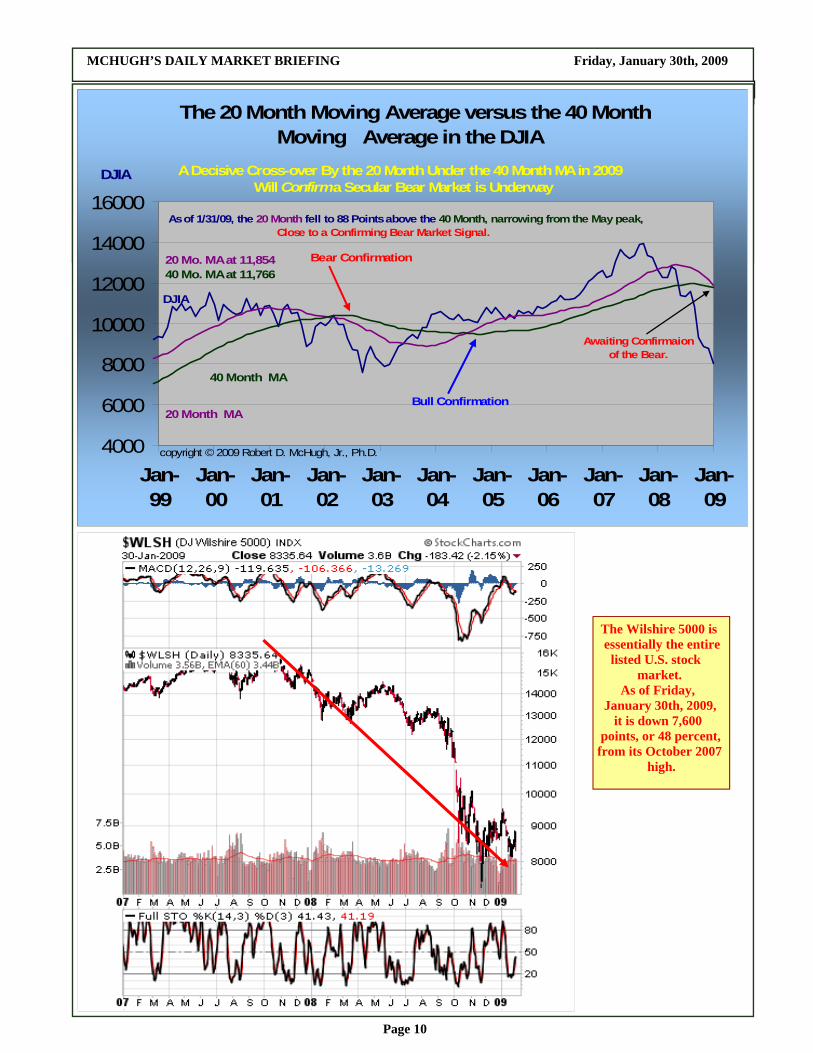
As of January 31st, 2009, our PTI remains on a “sell.” The spread between the Fast and the Slow has gone negative for the eighth month in a row. The spread went negative, to –75 in June, –188 in July, and –250 in August, –305 in September, –556 in November, negative –661 in December 2008, and worsened to negative –730 in January 2009. This compares to a 1,744 positive spread in Decem-ber 2003. The 5 month moving average fell to negative for the first time, at –44 in July, was negative again in August, at -94, and for the third month in a row in September at negative –158, triggering the long-term sell signal. It worsened to negative –534 in January. We require a 5 month moving average of the Spread between the Fast and Slow to reverse in a new direction for 3 consecutive months in order to declare that a new primary trend, a new multi-year trend, is underway. There had only been two signals since 1997 before the new sell signal in September 2008, so this tool is useful for long-term investors, as it filters out the noise of up and down corrections of sig-nificance in favor of the primary trend. Again, we now have a third. With a new Bear Market signal, it meant we were likely headed into the 6,000’s in the Indus-trials, or maybe even lower — eventually. We hit 7,449 November 21st, 2008. This suggests to us that the recent decline from October 2007, a year ago, through now, is just the first phase of a three phase Bear Market. That means now that this first phase has ended, we should see a bounce or sideways pause for several months, but then that will lead to the third and final phase, a disastrous decline into the 6,000s or probably lower. This chart is useful for our Conservative Balanced Investment Portfolio since once we get a new signal, we can rely upon that signal for years. Further, it tells us which direction surprises are likely to occur, so when playing speculative options or futures, we will know the direction where a sur-prise trend turn is most likely. Knowledge of the primary trend is also useful for trading. In this case, we can be more aggressive when entering a position in the same direction as the primary trend, and less ag-gressive when entering a short-term trend play against the primary trend. Next, we look at the chart at the top of the next page as a confirming indicator of the Primary Trend Indicator shown on the previous page. It is a comparison of the position of the 20 Month Moving average versus the 40 month. As of January 31st, 2009, the 20 Month narrowed to 88 points above the 40 month, down from May’s 1,026 peak spread. What is nice about this indicator, is that once we get this indicator’s confirming “buy” or “sell,” we can look forward with high confidence to a large chunk of the primary trend’s move still being ahead of us. Getting close. For example, the 20 month MA crossed below the 40 month MA in February 2002, with the Dow Industrials at 10,106. From that “sell” signal point, the DJIA dropped 2,909 points, or 28.8 percent. That suggested a great spot to purchase Leaps Put options. Then, going the other way, the 20 month MA rose above the 40 month MA in August 2004, at DJIA 10,174. The Dow Industrials then rose 4,106 points, or 40.35 percent. Here, your strategy could have been to either play long-term leaps call options, or to simply go long in the cash market and stay there, in other words, increase your long investment position. There were no false crossovers or cross-unders with this confirming 20 Month/40 Month MA measure. Once it turned negative, the trend was down. Once it went positive, the trend was up. Short-term countertrend moves can occur within the primary trend.
MCHUGH’S DAILY MARKET BRIEFING Friday, January 30th, 2009
Page 10
The 20 Month Moving Average versus the 40 Month Moving Average in the DJIA
4000
6000
8000
10000
12000
14000
16000
Jan-99
Jan-00
Jan-01
Jan-02
Jan-03
Jan-04
Jan-05
Jan-06
Jan-07
Jan-08
Jan-09
A Decisive Cross-over By the 20 Month Under the 40 Month MA in 2009 Will Confirma Secular Bear Market is Underway
DJIA
20 Month MA
40 Month MA
Bear Confirmation
Bull Confirmation
20 Mo. MA at 11,85440 Mo. MA at 11,766
DJIA
As of 1/31/09, the 20 Month fell to 88 Points above the 40 Month, narrowing from the May peak, Close to a Confirming Bear Market Signal.
copyright © 2009 Robert D. McHugh, Jr., Ph.D.
Awaiting Confirmaion of the Bear.
The Wilshire 5000 is essentially the entire listed U.S. stock market. As of Friday, January 30th, 2009, it is down 7,600 points, or 48 percent, from its October 2007 high.
MCHUGH’S DAILY MARKET BRIEFING Friday, January 30th, 2009
Page 11
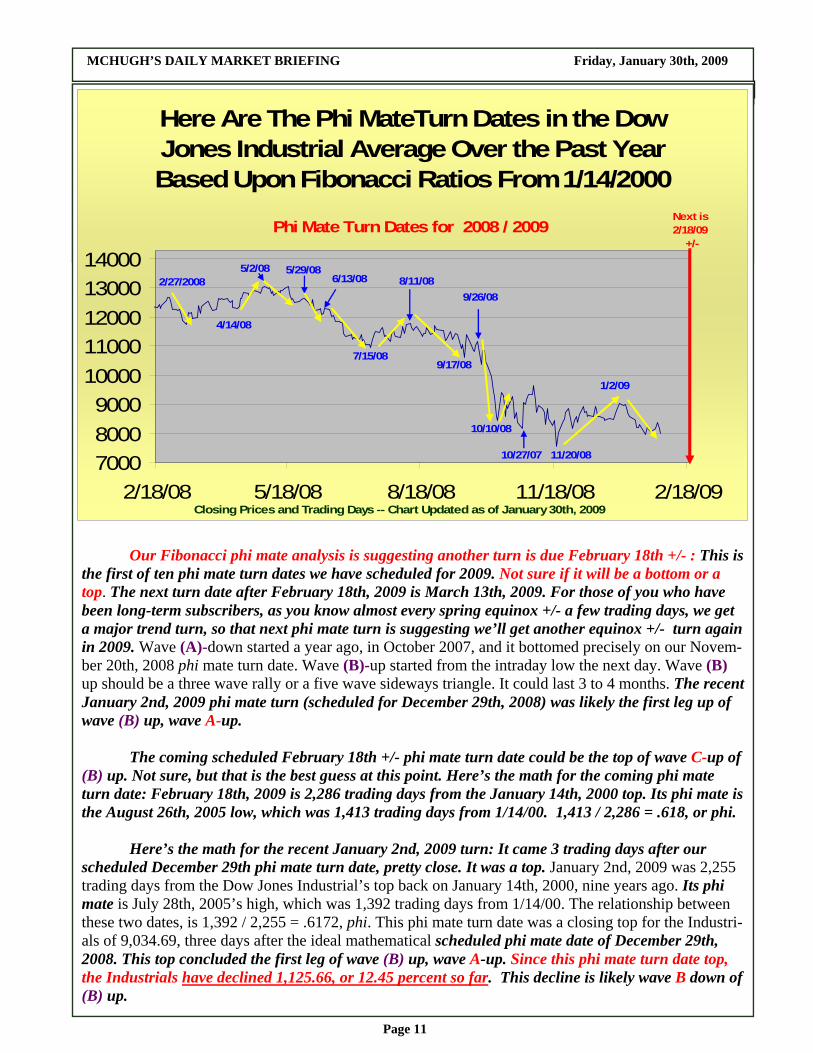
Our Fibonacci phi mate analysis is suggesting another turn is due February 18th +/- : This is the first of ten phi mate turn dates we have scheduled for 2009. Not sure if it will be a bottom or a top. The next turn date after February 18th, 2009 is March 13th, 2009. For those of you who have been long-term subscribers, as you know almost every spring equinox +/- a few trading days, we get a major trend turn, so that next phi mate turn is suggesting we’ll get another equinox +/- turn again in 2009. Wave (A)-down started a year ago, in October 2007, and it bottomed precisely on our Novem-ber 20th, 2008 phi mate turn date. Wave (B)-up started from the intraday low the next day. Wave (B) up should be a three wave rally or a five wave sideways triangle. It could last 3 to 4 months. The recent January 2nd, 2009 phi mate turn (scheduled for December 29th, 2008) was likely the first leg up of wave (B) up, wave A-up. The coming scheduled February 18th +/- phi mate turn date could be the top of wave C-up of (B) up. Not sure, but that is the best guess at this point. Here’s the math for the coming phi mate turn date: February 18th, 2009 is 2,286 trading days from the January 14th, 2000 top. Its phi mate is the August 26th, 2005 low, which was 1,413 trading days from 1/14/00. 1,413 / 2,286 = .618, or phi. Here’s the math for the recent January 2nd, 2009 turn: It came 3 trading days after our scheduled December 29th phi mate turn date, pretty close. It was a top. January 2nd, 2009 was 2,255 trading days from the Dow Jones Industrial’s top back on January 14th, 2000, nine years ago. Its phi mate is July 28th, 2005’s high, which was 1,392 trading days from 1/14/00. The relationship between these two dates, is 1,392 / 2,255 = .6172, phi. This phi mate turn date was a closing top for the Industri-als of 9,034.69, three days after the ideal mathematical scheduled phi mate date of December 29th, 2008. This top concluded the first leg of wave (B) up, wave A-up. Since this phi mate turn date top, the Industrials have declined 1,125.66, or 12.45 percent so far. This decline is likely wave B down of (B) up.
Here Are The Phi MateTurn Dates in the Dow Jones Industrial Average Over the Past Year Based Upon Fibonacci Ratios From 1/14/2000
700080009000
1000011000120001300014000
2/18/08 5/18/08 8/18/08 11/18/08 2/18/09 Closing Prices and Trading Days -- Chart Updated as of January 30th, 2009
Phi Mate Turn Dates for 2008 / 2009
1/2/09
Next is 2/18/09 +/-
6/13/08
10/27/07
2/27/2008
4/14/08
5/2/08 5/29/08
7/15/08
8/11/08
9/17/08
9/26/08
10/10/08
11/20/08
MCHUGH’S DAILY MARKET BRIEFING Friday, January 30th, 2009
Page 12
What the phi mate analysis has demonstrated consistently since January 2000, is that whatever trend is going into the turn will reverse, nearly every single time, into a tradable trend. The value here is that aggressive traders don’t care which way a trend goes, as long as they know when it is coming, to be alert to trade it. While phi analysis will not find every significant trend, it finds most of them, and when it does identify the probability of one coming, we have always gotten it since January 2000. These trends are not subject to intraday reversals. They are not for day-traders. They are multi-week trends. Prior to our recent phi mate turn date of January 2nd, 2009, we had a phi mate turn date on November 20th, 2008. November 20th, 2008 was 2,227 trading days from the Dow Jones Industrial’s top back on January 14th, 2000, eight years ago. Its phi mate is July 6th, 2005’s low, which was 1,376 trading days from 1/14/00. The relationship between these two dates, is 1,376 / 2,227 = .618, phi. In fact, the Industrials had a closing bottom, “the” closing bottom for the decline from October 2007 precisely on this scheduled phi mate date. Since this phi mate turn date bottomed on a closing basis at 7,552.29 on November 20th, the Industrials rose 1,482.40, or 19.6 percent into the January 2nd, 2009 phi mate turn date. Prior to that, we had a phi mate turn date on Monday, October 27th, 2008, which was a closing bottom (phi mate analysis uses dates where closing prices are tops or bottoms) that came 2 trading days after the ideal mathematical scheduled date of Thursday, October 23rd. The Industrials closed at 8,175.77 on October 27th, then the Industrials rallied 1,449.51 points, or 17.72 percent through Tues-day, November 4th’s Election Day top of 9,625.28. October 27th, 2008 was 2,209 trading days from the Dow Jones Industrial’s top back on January 14th, 2000, eight years ago. Its phi mate is June 17th, 2005’s high, which was 1,364 trading days from 1/14/00. The relationship between these two dates, is 1,364 / 2,209 = .618, or phi. Prior to that, we had a phi mate turn on October 10th, 2008, a closing bottom (phi mate analysis uses dates where closing prices are tops or bottoms) that came 1 trading day early from the ideal mathe-matical scheduled date of October 13th. The Industrials closed at 8,451.19 on October 10th, then the In-dustrials rallied 936.42 points, or 11.08 percent Monday, October 13th, the largest one day rally ever. October 10th, 2008 was 2,198 trading days from the Dow Jones Industrial’s top back on January 14th, 2000, eight years ago. Its phi mate was May 20th, 2003’s high, which was 840 trading days from 1/14/00. The relationship between these two dates, is 840 / 2,198 = .382, or 1 minus phi (.618). Prior to that we had a phi mate turn date on September 26th, 2008. It was a top, the Industrials closing at 11,143.13. The Industrials then crashed 3,260.62 points, or 29.26 percent through October 10th, 2008’s intraday low of 7,882.51. Its phi mate was the June 2nd, 2005 high, which came 1,353 trad-ing days from January 14th, 2000’s top. September 26th, 2008 was 2,188 trading days from the January 2000 top. 1,353 / 2,188 = .618, precisely phi. Prior to that, we had a phi mate turn date on September 17th, 2008. It was a bottom, the Industri-als closing at 10,609.66. It came 2 trading days early from the ideal mathematical scheduled date of Sep-tember 19th. The Industrials the rose 558 points through September 26th’s intraday high of 11,168.06. Its phi mate was the May 12th, 2003 high, which came 834 trading days from January 14th, 2000’s top. September 17th, 2008 was 2,181 trading days from the January 2000 top. 834 / 2,181 = .382, precisely the value 1 minus phi, .618. Prior to that, we had a phi mate turn date on August 11th, 2008, when the Industrials closed at 11,782.35, a top, then plunged 1,322 points through September 18th’s intraday low of 10,459.44. Its phi mate was the May 9th, 2005 high, which came 1,336 trading days from January 14th, 2000’s top. August 11th, 2008, was 2,155 trading days from the January 2000 top. 1,336 / 2,155 = .6199, or approximately phi, .618.
MCHUGH’S DAILY MARKET BRIEFING Friday, January 30th, 2009
Page 13
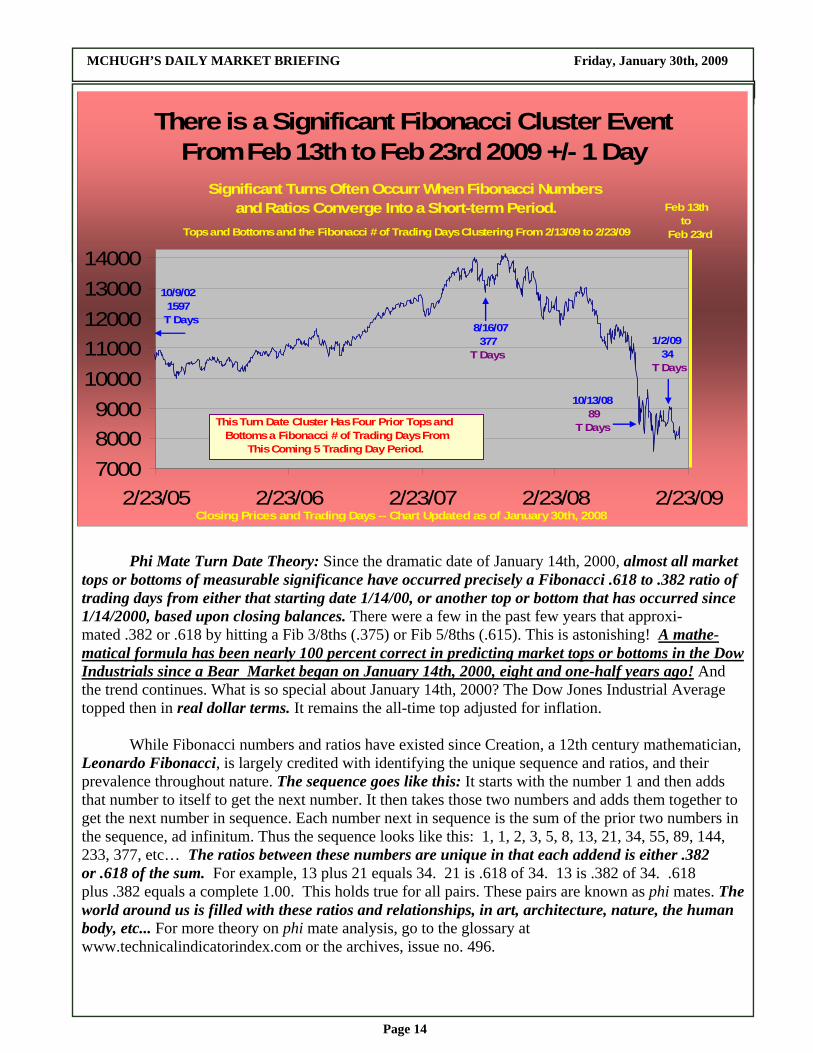
Prior to that, we had a phi mate turn on July 15th, 2008, a bottom that came 5 trading days early from the ideal mathematical scheduled date of July 22nd. The Industrials closed at 10,962 on July 15th, and rallied 904.57 points through August 11th’s intraday high of 11,867.11. Its phi mate was the April 20th, 2005 bottom, which came 1,323 trading days from January 14th, 2000’s top. July 15th, 2008 was 2,136 trading days from the January 2000 top. 1,323 / 2,136 = .619, or approximately phi. Prior to that we had a phi mate turn date ideally scheduled for June 20th, and it was a very small top on June 13th, five trading days early, the Industrials closing at 12,307.35. Its phi mate, the April 1st, 2005 low, was 1,310 trading days from 1/14/00. June 13th, 2008 was 2,115 TD’s from 1/14/00. 1,310 / 2,115 = .619, or approximately phi. Since then the Industrials declined 1,345 points to July 15th’s 10,962 closing low. Prior to that phi mate turn date, there were minor tops on May 2nd, and May 29th that led to strong declines (see chart above). Prior to them the April phi mate turn had two mates, and was ideally scheduled for April 10th or 11th. One mate preferred the 10th, the other the 11th. We saw a closing bot-tom in the Industrials on April 14th, one trading day from the 11th’s ideal date, and only two from the 10th. The closing low was 12,302.06. The Industrials rallied 830 points after that bottom. Another cycle turn tool we like is the Fibonacci Cluster turn window. Here, we identify periods of a week or two where there were prior tops and bottoms that are a Fibonacci number of trading days from that coming week. We identified high potential for a major stock move later in September through early October in our September 12th Weekend newsletter. We wrote, “There is a Fibonacci turn win-dow set up for the end of September into early October, around the two phi mate turn dates shown for September. It is a window of 10 days, and has six prior tops or bottoms a Fibonacci number of trading days from this ten day period: May 17th, 2002’s top is 1,597 trading days from 9/22/08. October 25th, 2004’s bottom is 987 trading days from 9/26/08. February 27th, 2008’s top is 144 trading days from 9/23/08. May 29th, 2008’s top is 89 trading days from 10/3/08. July 15th, 2008’s low is 55 trading days from 10/1/08, and August 11th, 2008’s top is 34 trading days from 9/29/08. This Cluster points to some strong trend action later this month.” Of course that proved prescient. Focusing on the future, we have a Fibonacci Cluster window coming for the five trading day period from February 13th, 2009 through February 23rd, 2009. It is a window of 5 trading days, and has four prior tops or bottoms a Fibonacci number of trading days from this eleven day period: February 13th, 2009 is a Fibonacci 1,597 Trading Days from October 9th, 2002’s Major Low. February 17th, 2009 is a Fibonacci 377 Trading Days from August 16th, 2007’s Major Low. February 20th, 2009 is a Fibonacci 89 Trading Days from October 13th, 2008’s Low. February 23rd, 2009 is a Fibonacci 34 Trading Days from January 2nd, 2009’s Top. While four tops or bottoms a Fibonacci number of trading days from a two week window in February is not that many, the particular tops or bottoms pointing to this turn window are significant tops and bottoms, and the window surrounds the coming February 18th phi mate turn date. With both this window and the phi mate turn date pointing to the same week, we can have high confidence a ma-jor turn is coming in mid-February.
MCHUGH’S DAILY MARKET BRIEFING Friday, January 30th, 2009
Page 14
Phi Mate Turn Date Theory: Since the dramatic date of January 14th, 2000, almost all market tops or bottoms of measurable significance have occurred precisely a Fibonacci .618 to .382 ratio of trading days from either that starting date 1/14/00, or another top or bottom that has occurred since 1/14/2000, based upon closing balances. There were a few in the past few years that approxi-mated .382 or .618 by hitting a Fib 3/8ths (.375) or Fib 5/8ths (.615). This is astonishing! A mathe-matical formula has been nearly 100 percent correct in predicting market tops or bottoms in the Dow Industrials since a Bear Market began on January 14th, 2000, eight and one-half years ago! And the trend continues. What is so special about January 14th, 2000? The Dow Jones Industrial Average topped then in real dollar terms. It remains the all-time top adjusted for inflation. While Fibonacci numbers and ratios have existed since Creation, a 12th century mathematician, Leonardo Fibonacci, is largely credited with identifying the unique sequence and ratios, and their prevalence throughout nature. The sequence goes like this: It starts with the number 1 and then adds that number to itself to get the next number. It then takes those two numbers and adds them together to get the next number in sequence. Each number next in sequence is the sum of the prior two numbers in the sequence, ad infinitum. Thus the sequence looks like this: 1, 1, 2, 3, 5, 8, 13, 21, 34, 55, 89, 144, 233, 377, etc… The ratios between these numbers are unique in that each addend is either .382 or .618 of the sum. For example, 13 plus 21 equals 34. 21 is .618 of 34. 13 is .382 of 34. .618 plus .382 equals a complete 1.00. This holds true for all pairs. These pairs are known as phi mates. The world around us is filled with these ratios and relationships, in art, architecture, nature, the human body, etc... For more theory on phi mate analysis, go to the glossary at www.technicalindicatorindex.com or the archives, issue no. 496.
There is a Significant Fibonacci Cluster Event From Feb 13th to Feb 23rd 2009 +/- 1 Day
700080009000
1000011000120001300014000
2/23/05 2/23/06 2/23/07 2/23/08 2/23/09 Closing Prices and Trading Days -- Chart Updated as of January 30th, 2008
Significant Turns Often Occurr When Fibonacci Numbers and Ratios Converge Into a Short-term Period.
Tops and Bottoms and the Fibonacci # of Trading Days Clustering From 2/13/09 to 2/23/09
Feb 13th to Feb 23rd
This Turn Date Cluster Has Four Prior Tops and Bottoms a Fibonacci # of Trading Days From This Coming 5 Trading Day Period.
1/2/09 34 T Days
10/13/08 89 T Days
8/16/07 377 T Days
10/9/02 1597 T Days
MCHUGH’S DAILY MARKET BRIEFING Friday, January 30th, 2009
Page 15
NYSE 10 Day Moving Average Advance/Decline Line vs. the S&P 500
400
500
600
700
800
900
1000
1100
1200
1300
9/30/08 10/30/08 11/30/08 12/30/08 1/30/09-2000
-1500
-1000
-500
0
500
1000
1500
2000
2500
3000
Bullish Divergence Bearish Divergence
Oftentimes Trend Reversals are Forewarned By Bullish and Bearish Divergences Between the NYSE 10 Day MA Adv/Dec Line and the Prices of of Equities.
S&P 500
NYSE A/D S&P 500
A/D
BullishDivergence
The Green converging lines show a huge Bullish Divergence suggesting a strong rally leg in prices could be coming.
NASDAQ 100 10 Day Moving Average Advance/Decline Line vs. the NASDAQ 100
800
950
1100
1250
1400
1550
1700
1850
2000
2150
2300
8/30/08 9/30/08 10/30/08 11/30/08 12/30/08 1/30/09-50
-25
0
25
50
75
100Bullish Divergence Bearish Divergence
Oftentimes Trend Reversals are Forewarned By Bullish and Bearish Divergences Between the $NDX 10 Day MA Adv/Dec Line and the Prices of $NDX Equities.
NASDAQ 100
$NDX A/D
NASDAQ 100
A/D Line
Bullish Divergence
There is a huge Bullish Divergence in the NDX 10 Day Advance Decline Line Indicator Suggesting a Large Rally Could Be Coming.
MCHUGH’S DAILY MARKET BRIEFING Friday, January 30th, 2009
Page 16
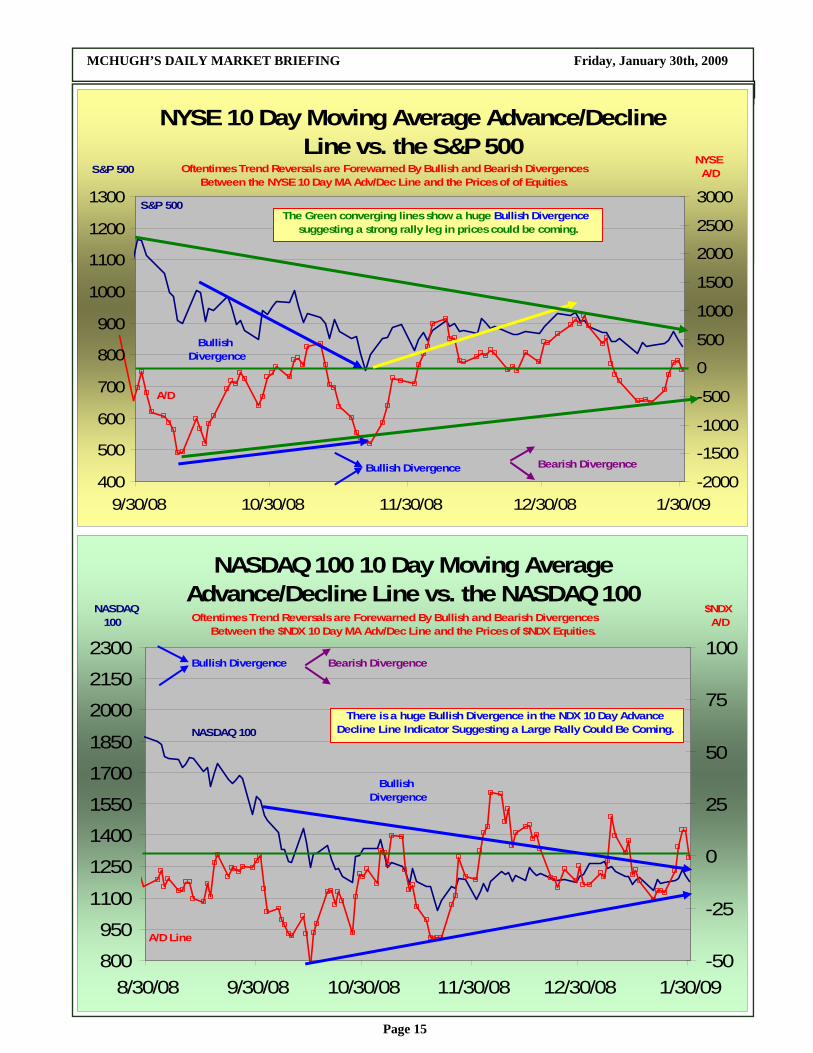
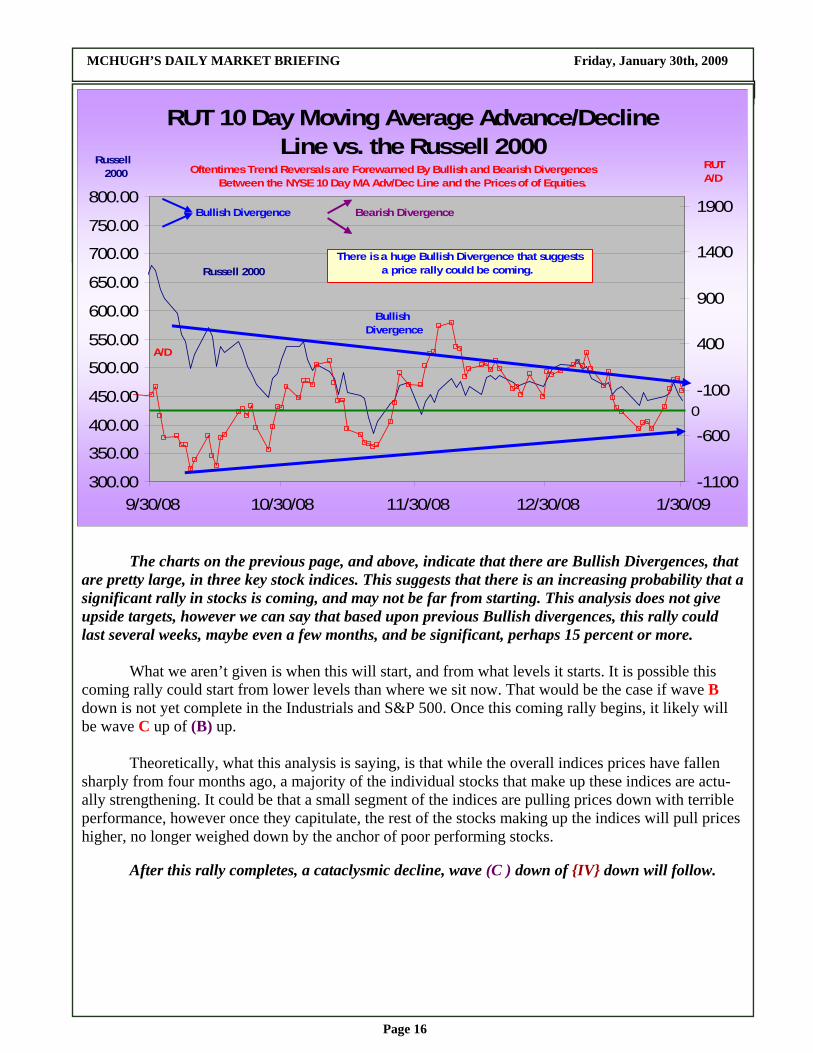
The charts on the previous page, and above, indicate that there are Bullish Divergences, that are pretty large, in three key stock indices. This suggests that there is an increasing probability that a significant rally in stocks is coming, and may not be far from starting. This analysis does not give upside targets, however we can say that based upon previous Bullish divergences, this rally could last several weeks, maybe even a few months, and be significant, perhaps 15 percent or more. What we aren’t given is when this will start, and from what levels it starts. It is possible this coming rally could start from lower levels than where we sit now. That would be the case if wave B down is not yet complete in the Industrials and S&P 500. Once this coming rally begins, it likely will be wave C up of (B) up. Theoretically, what this analysis is saying, is that while the overall indices prices have fallen sharply from four months ago, a majority of the individual stocks that make up these indices are actu-ally strengthening. It could be that a small segment of the indices are pulling prices down with terrible performance, however once they capitulate, the rest of the stocks making up the indices will pull prices higher, no longer weighed down by the anchor of poor performing stocks. After this rally completes, a cataclysmic decline, wave (C ) down of {IV} down will follow.
RUT 10 Day Moving Average Advance/Decline Line vs. the Russell 2000
300.00
350.00
400.00
450.00
500.00
550.00
600.00
650.00
700.00
750.00
800.00
9/30/08 10/30/08 11/30/08 12/30/08 1/30/09-1100
-600
-100
400
900
1400
1900Bullish Divergence Bearish Divergence
Oftentimes Trend Reversals are Forewarned By Bullish and Bearish Divergences Between the NYSE 10 Day MA Adv/Dec Line and the Prices of of Equities.
Russell 2000
RUT A/D
Russell 2000
A/D
0
There is a huge Bullish Divergence that suggests a price rally could be coming.
BullishDivergence

MCHUGH’S DAILY MARKET BRIEFING Friday, January 30th, 2009
Page 17
The above chart is a closer look at the big picture. We originally hoped that the decline we are seeing now would be the bottom of wave 2, however with the new “Sell” signal in our long-term PTI signal, clearly there is more substantial downside coming. This fits with November 20th’s develop-ment where the S&P 500 fell decisively below their 2002 lows, confirming we are in Grand Supercycle wave {IV} down. If Grand Supercycle wave {IV} down forms a Zig-zag pattern, it means time-wise, the Grand Supercycle wave could be short relative to other Grand Supercycle degree waves, however price-wise the decline will be dramatic, and therefore worthy of Grand Supercycle degree status. Above we show the Zig-zag scenario. A multi-week bottom, perhaps multi-month bottom, occurred on Novem-ber 20th. The Monthly Full Stochastics are oversold. This suggests the first leg of the Bear Market is complete, wave (A) down within an (A)-down, (B)-up, (C)-down Grand Supercycle Wave {IV} down. Wave (B) up is underway. This rally should consist of three waves, A-up, B-down, C-up within wave (B)-up. There is a possibility that wave (B) forms a triangle pattern, as shown on page 24. If so, it will consist of five violent swings, each successive wave smaller than its preceding wave. We will identify which pattern is developing as soon as evident. The height that wave C-up reaches will tell us whether a zigzag or triangle are forming for wave (B). The bad news is, that once this wave (B) rally finishes, maybe early to mid 2009, a nasty de-cline will follow, the third leg of the Bear Market, wave (C) down. That bottom suggests something along the lines of Armageddon is transpiring, in its early stages, which no doubt will lead to change in our political structure, installing either fascism or socialism to a degree never before imagined. What we are saying is, this should be worse than the 1930’s, which led to World War II. That politi-cal environment is where holding actual gold coins would be beneficial.
C of (4)
1
2
3
4 b
d
c a
(3)
A
B
C
X
A
B
C
X
A B
Here’s the Big Picture “Bear Market” Zig-zag Worst Case Scenario
(B)
(C ), {IV}
(A)
e of 5 of (5) of V (V) {III}
MCHUGH’S DAILY MARKET BRIEFING Friday, January 30th, 2009
Page 18
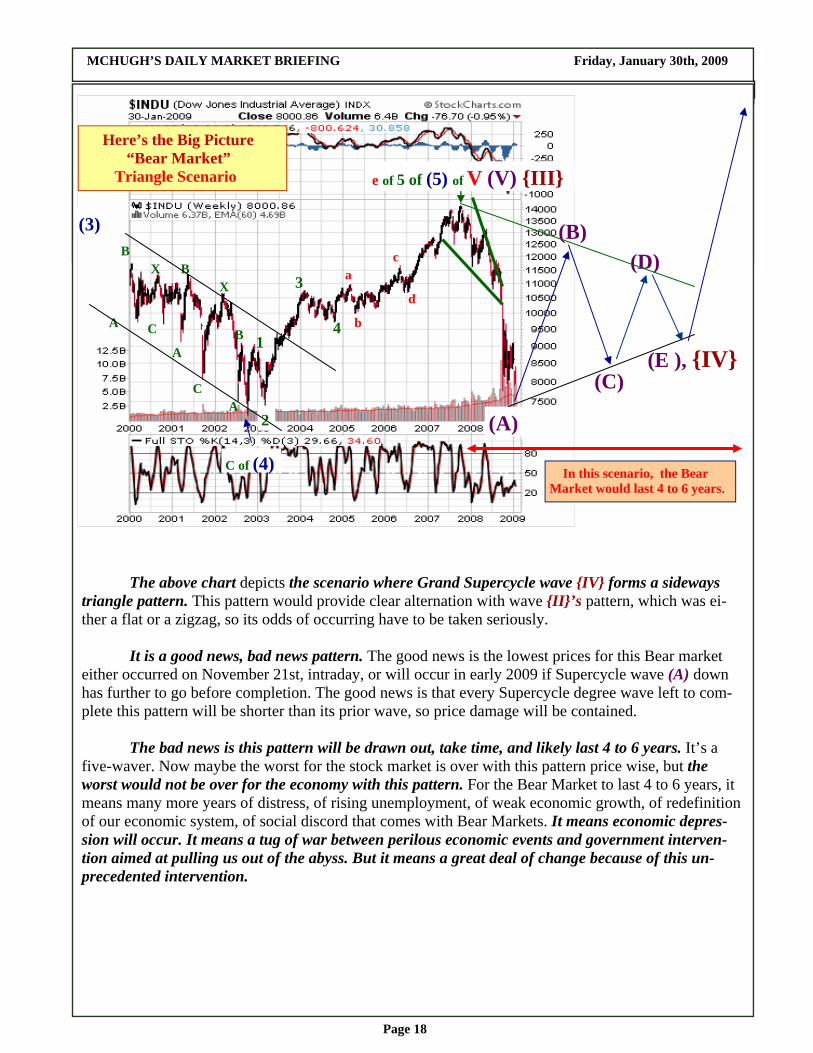
The above chart depicts the scenario where Grand Supercycle wave {IV} forms a sideways triangle pattern. This pattern would provide clear alternation with wave {II}’s pattern, which was ei-ther a flat or a zigzag, so its odds of occurring have to be taken seriously. It is a good news, bad news pattern. The good news is the lowest prices for this Bear market either occurred on November 21st, intraday, or will occur in early 2009 if Supercycle wave (A) down has further to go before completion. The good news is that every Supercycle degree wave left to com-plete this pattern will be shorter than its prior wave, so price damage will be contained. The bad news is this pattern will be drawn out, take time, and likely last 4 to 6 years. It’s a five-waver. Now maybe the worst for the stock market is over with this pattern price wise, but the worst would not be over for the economy with this pattern. For the Bear Market to last 4 to 6 years, it means many more years of distress, of rising unemployment, of weak economic growth, of redefinition of our economic system, of social discord that comes with Bear Markets. It means economic depres-sion will occur. It means a tug of war between perilous economic events and government interven-tion aimed at pulling us out of the abyss. But it means a great deal of change because of this un-precedented intervention.
C of (4)
1
2
3
4 b
d
c a
(3)
A
B
C
X
A
B
C
X
A B
Here’s the Big Picture “Bear Market” Triangle Scenario
(B)
(E ), {IV}
(A)
e of 5 of (5) of V (V) {III}
(C)
(D)
In this scenario, the Bear Market would last 4 to 6 years.
MCHUGH’S DAILY MARKET BRIEFING Friday, January 30th, 2009
Page 19
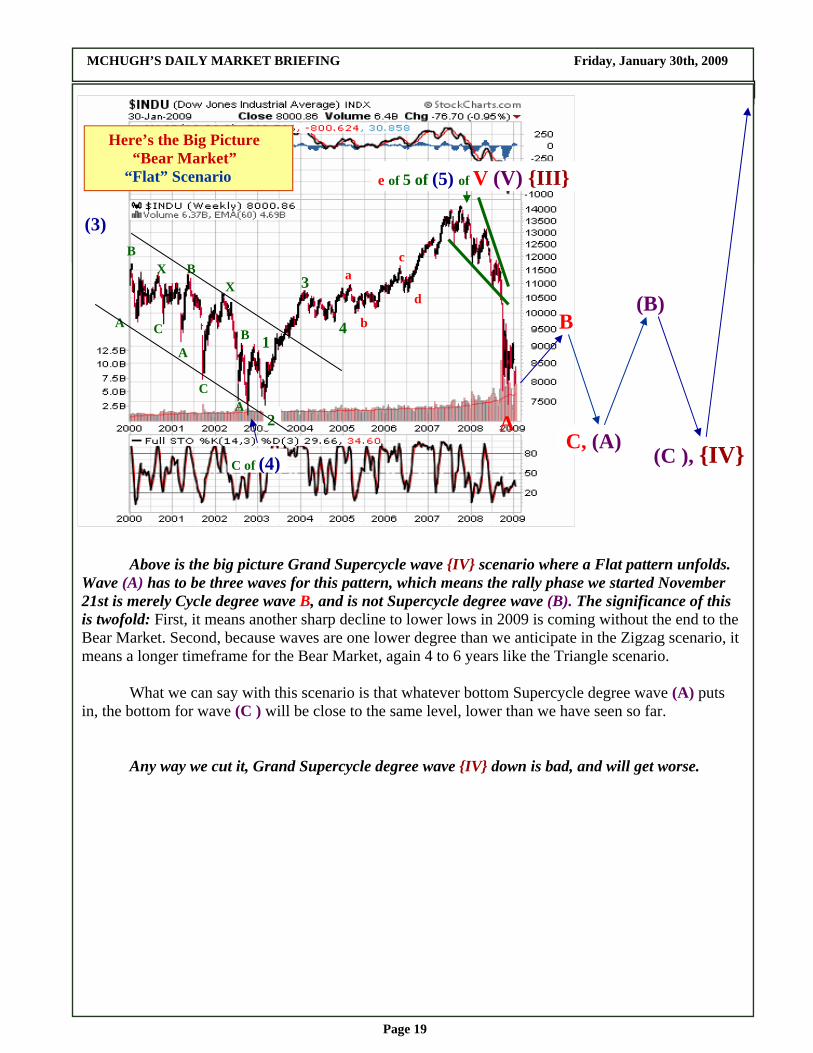
Above is the big picture Grand Supercycle wave {IV} scenario where a Flat pattern unfolds. Wave (A) has to be three waves for this pattern, which means the rally phase we started November 21st is merely Cycle degree wave B, and is not Supercycle degree wave (B). The significance of this is twofold: First, it means another sharp decline to lower lows in 2009 is coming without the end to the Bear Market. Second, because waves are one lower degree than we anticipate in the Zigzag scenario, it means a longer timeframe for the Bear Market, again 4 to 6 years like the Triangle scenario. What we can say with this scenario is that whatever bottom Supercycle degree wave (A) puts in, the bottom for wave (C ) will be close to the same level, lower than we have seen so far. Any way we cut it, Grand Supercycle degree wave {IV} down is bad, and will get worse.
C of (4)
1
2
3
4 b
d
c a
(3)
A
B
C
X
A
B
C
X
A B
Here’s the Big Picture “Bear Market” “Flat” Scenario
(B)
(C ), {IV} C, (A)
e of 5 of (5) of V (V) {III}
A
B
MCHUGH’S DAILY MARKET BRIEFING Friday, January 30th, 2009
Page 20
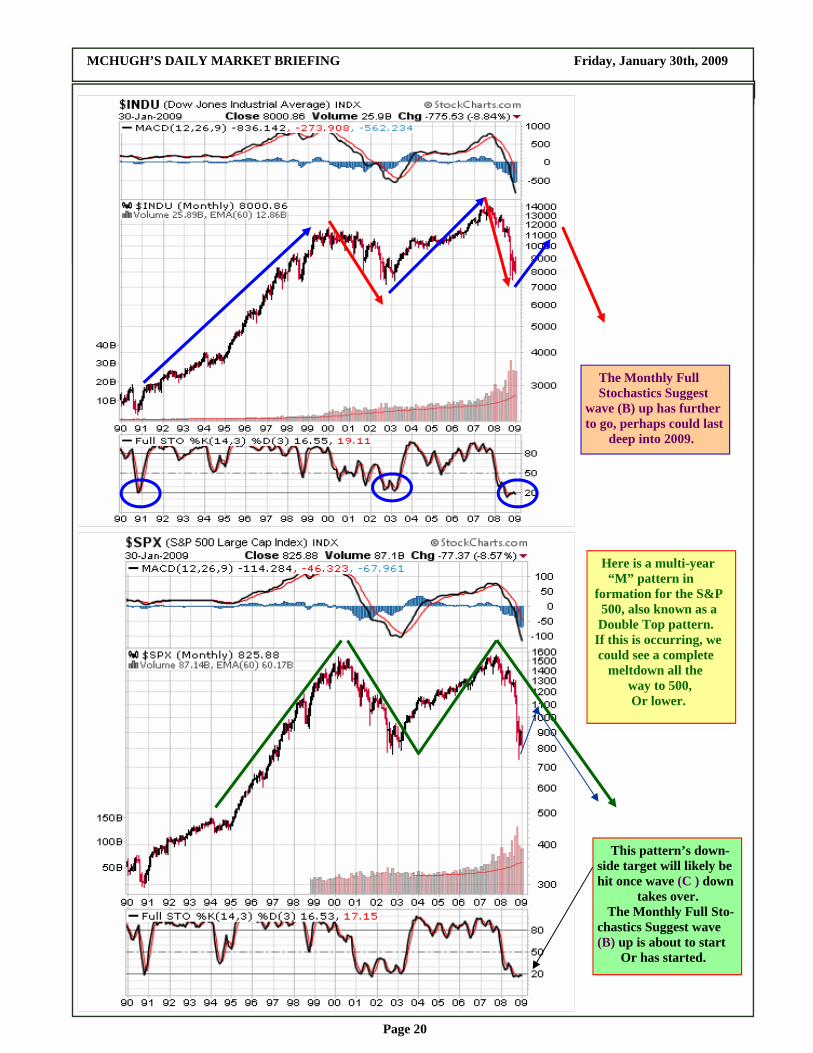
The Monthly Full Stochastics Suggest wave (B) up has further to go, perhaps could last deep into 2009.
Here is a multi-year “M” pattern in formation for the S&P 500, also known as a Double Top pattern. If this is occurring, we could see a complete meltdown all the way to 500, Or lower.
This pattern’s down-side target will likely be hit once wave (C ) down takes over. The Monthly Full Sto-chastics Suggest wave (B) up is about to start Or has started.
MCHUGH’S DAILY MARKET BRIEFING Friday, January 30th, 2009
Page 21
C, (C ), {IV}
{V}
e of 5 of (5) of V (V) {III}
C, (A)
(A)
(B)
(C)
(D)
(E), A
B (B)
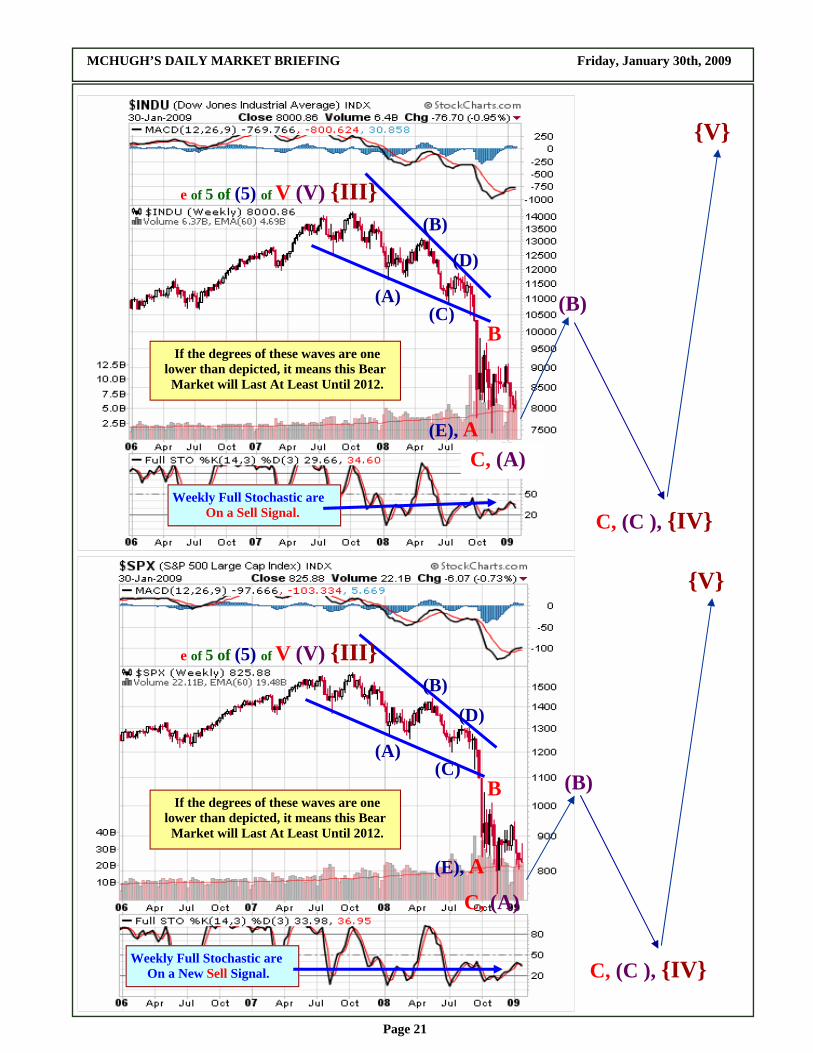
If the degrees of these waves are one lower than depicted, it means this Bear Market will Last At Least Until 2012.
Weekly Full Stochastic are On a Sell Signal.
C, (C ), {IV}
{V}
e of 5 of (5) of V (V) {III}
C, (A)
(A)
(B)
(C)
(D)
(E), A
B (B) If the degrees of these waves are one lower than depicted, it means this Bear Market will Last At Least Until 2012.
Weekly Full Stochastic are On a New Sell Signal.
MCHUGH’S DAILY MARKET BRIEFING Friday, January 30th, 2009
Page 22
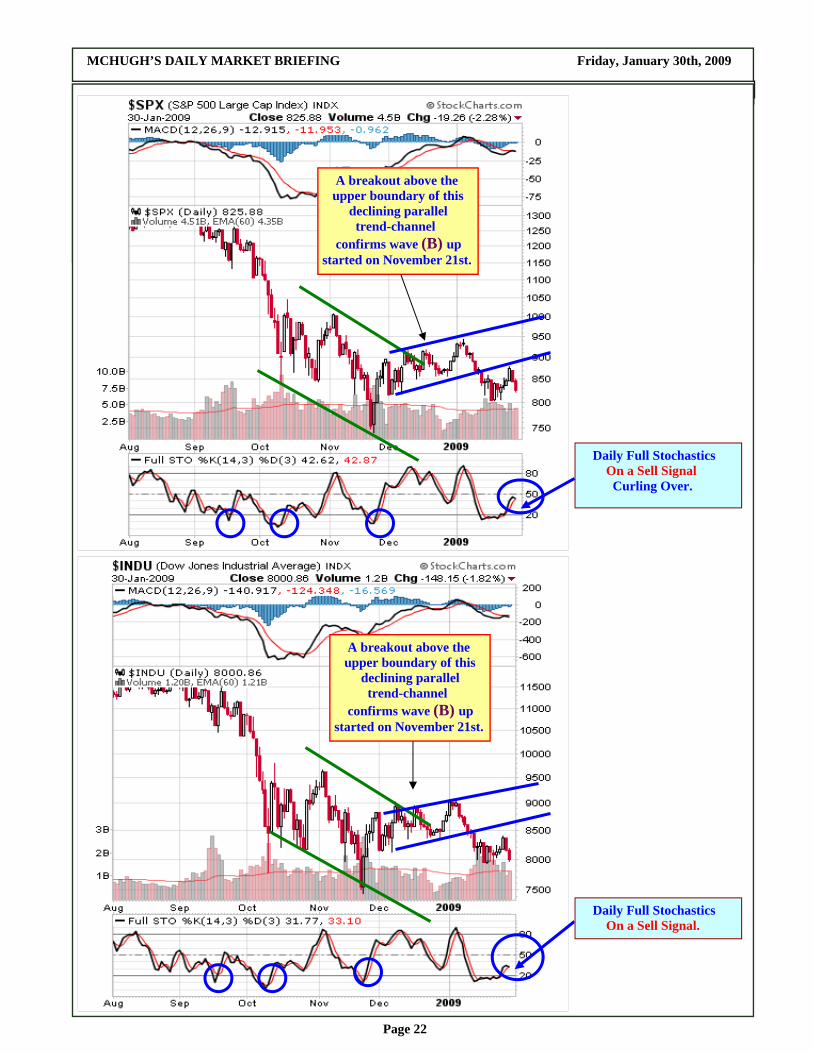
A breakout above the upper boundary of this declining parallel trend-channel confirms wave (B) up started on November 21st.
Daily Full Stochastics On a Sell Signal Curling Over.
A breakout above the upper boundary of this declining parallel trend-channel confirms wave (B) up started on November 21st.
Daily Full Stochastics On a Sell Signal.
MCHUGH’S DAILY MARKET BRIEFING Friday, January 30th, 2009
Page 23
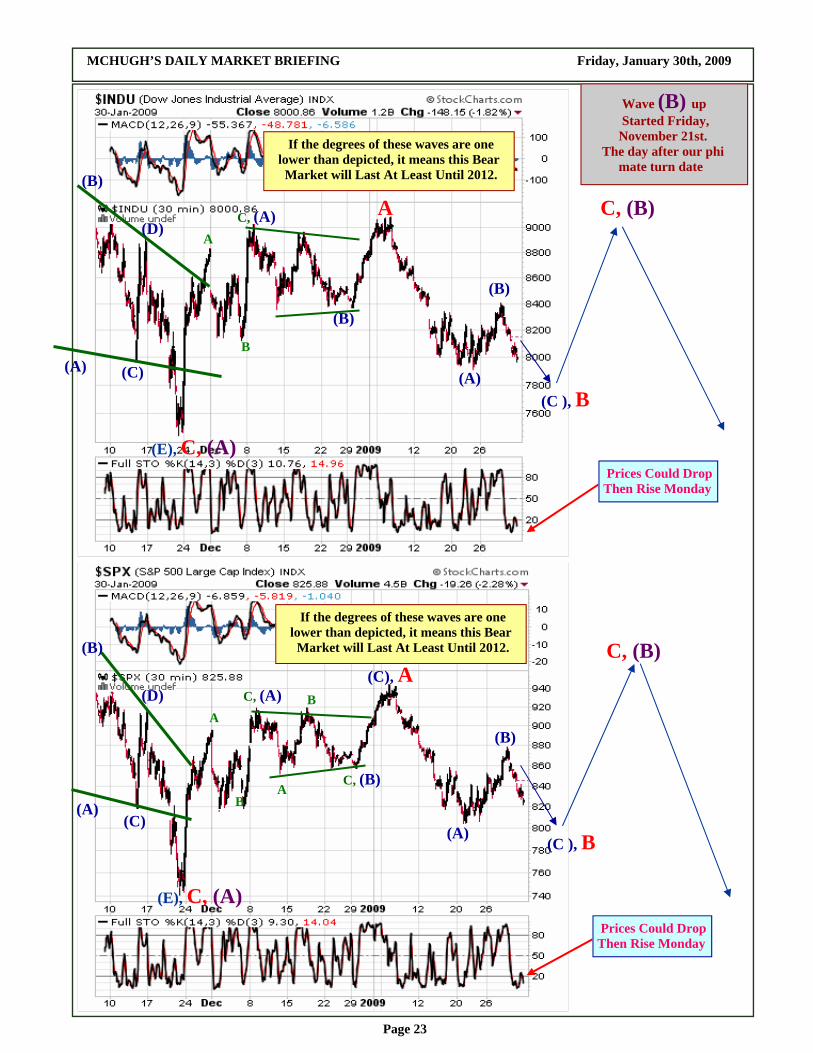
If the degrees of these waves are one lower than depicted, it means this Bear Market will Last At Least Until 2012.
(E), C, (A)
(A)
(B)
(C)
(D) A C, (A)
(B)
C, (B)
(C ), B
A
B
Wave (B) up Started Friday, November 21st. The day after our phi mate turn date
(B)
(A)
(E), C, (A)
(A)
(B)
(C)
(D)
If the degrees of these waves are one lower than depicted, it means this Bear Market will Last At Least Until 2012.
(C), A
C, (B)
(C ), B
C, (B)
C, (A) A
B A
B
(A)
(B)
Prices Could Drop Then Rise Monday
Prices Could Drop Then Rise Monday
MCHUGH’S DAILY MARKET BRIEFING Friday, January 30th, 2009
Page 24
(E), C, (A)
(A)
(B)
(C)
(D) (C), A
C, (B)
B
C, (A) A
B A
B
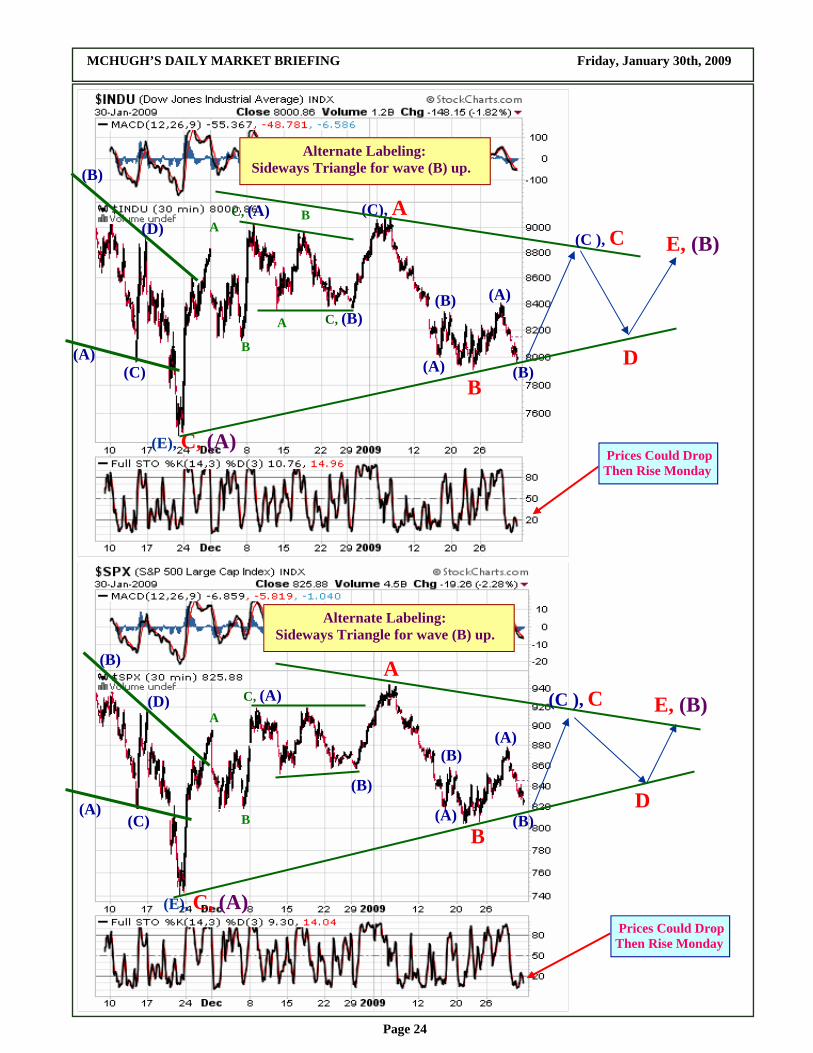
E, (B) (C ), C
D
Alternate Labeling: Sideways Triangle for wave (B) up.
(A)
(B) (A)
(B)
Alternate Labeling: Sideways Triangle for wave (B) up.
(E), C, (A)
(A)
(B)
(C)
(D)
A C, (A)
(B)
E, (B)
B
A
B
(C ), C
D (A)
(B) (A)
(B)
Prices Could Drop Then Rise Monday
Prices Could Drop Then Rise Monday
MCHUGH’S DAILY MARKET BRIEFING Friday, January 30th, 2009
Page 25
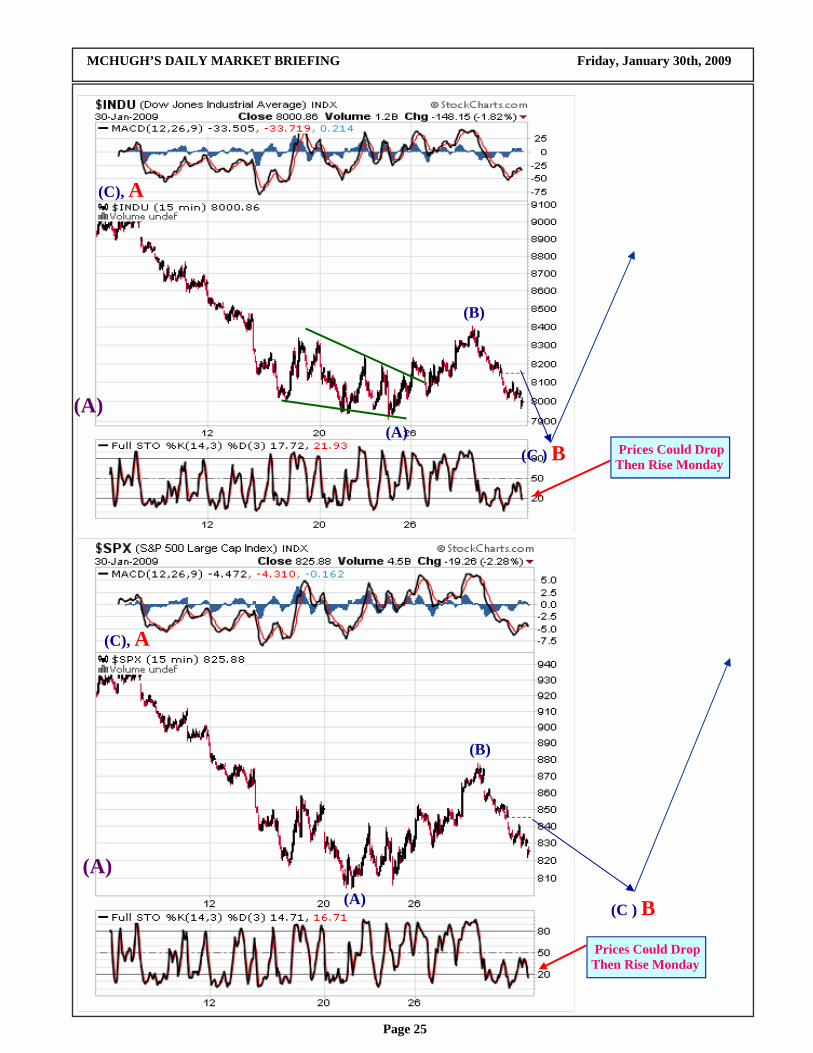
(A)
(C), A
(C ) B (A)
(B)
(A)
(C), A
(C ) B (A)
(B)
Prices Could Drop Then Rise Monday
Prices Could Drop Then Rise Monday
MCHUGH’S DAILY MARKET BRIEFING Friday, January 30th, 2009
Page 26
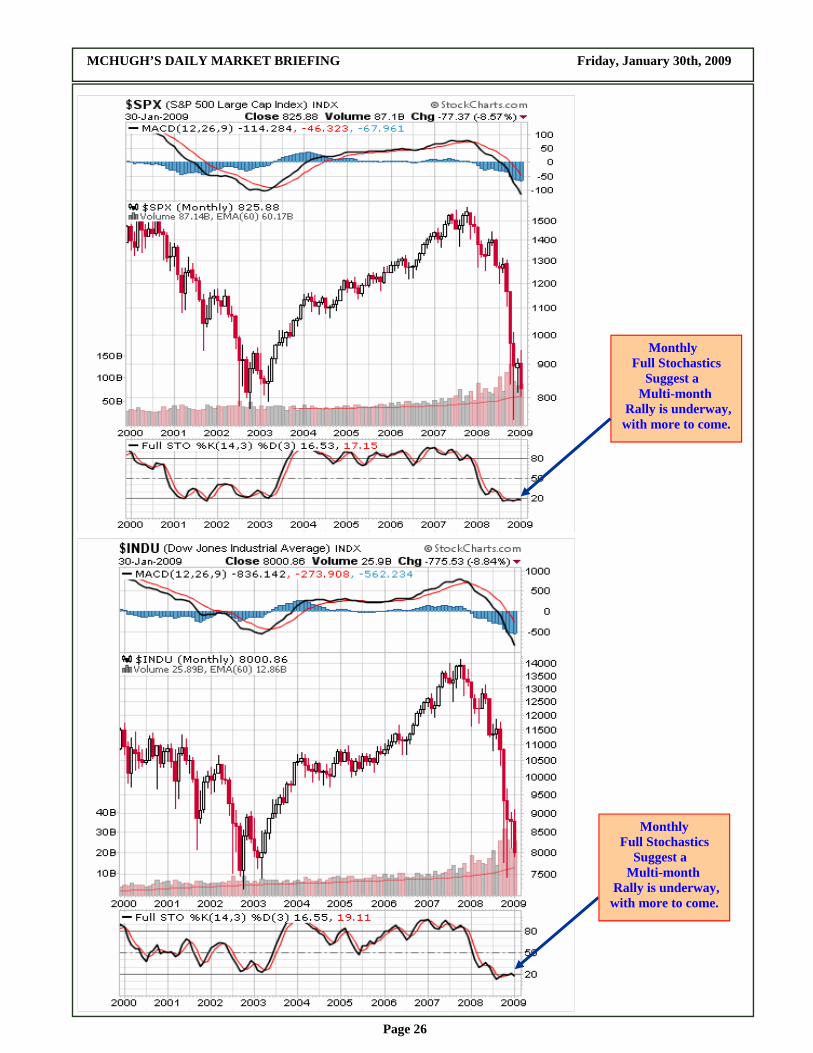
Monthly Full Stochastics Suggest a Multi-month Rally is underway, with more to come.
Monthly Full Stochastics Suggest a Multi-month Rally is underway, with more to come.
MCHUGH’S DAILY MARKET BRIEFING Friday, January 30th, 2009
Page 27
(4)
1
2
5, 3
c, 4 a
b
1
2
3
4
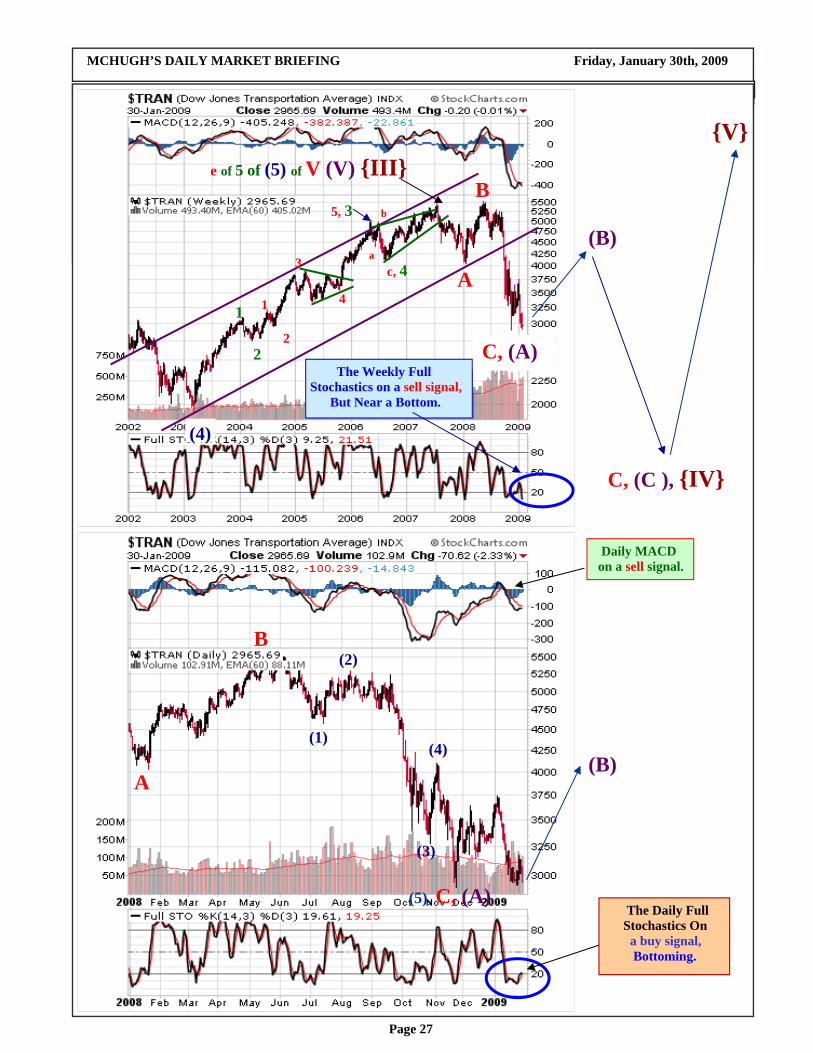
The Weekly Full Stochastics on a sell signal, But Near a Bottom.
e of 5 of (5) of V (V) {III}
C, (C ), {IV}
{V}
C, (A)
A
B
(B)
(5), C, (A)
A
B
(B)
(1)
(2)
(3)
(4)
Daily MACD on a sell signal.
The Daily Full Stochastics On a buy signal, Bottoming.
MCHUGH’S DAILY MARKET BRIEFING Friday, January 30th, 2009
Page 28
(A ii
a
b
e, 5, A
1
c
d
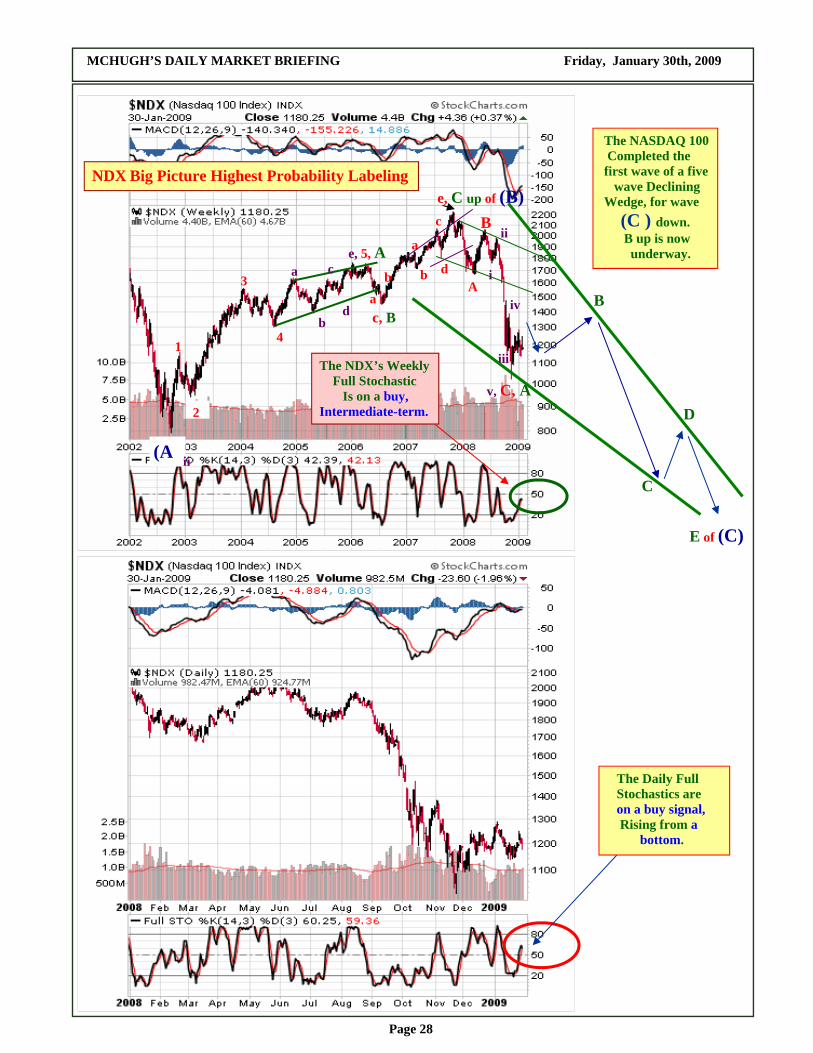
The NASDAQ 100 Completed the first wave of a five wave Declining Wedge, for wave (C ) down. B up is now underway.
c, B
e, C up of (B)
a b
2
3
4
a
b
c
d A
B
NDX Big Picture Highest Probability Labeling
The NDX’s Weekly Full Stochastic Is on a buy, Intermediate-term.
i
ii
iii
iv
v, C, A
B
C
D
E of (C)
The Daily Full Stochastics are on a buy signal, Rising from a bottom.
MCHUGH’S DAILY MARKET BRIEFING Friday, January 30th, 2009
Page 29
iv
C, (C)
c, B
e, v, C, A
a
b
c
d
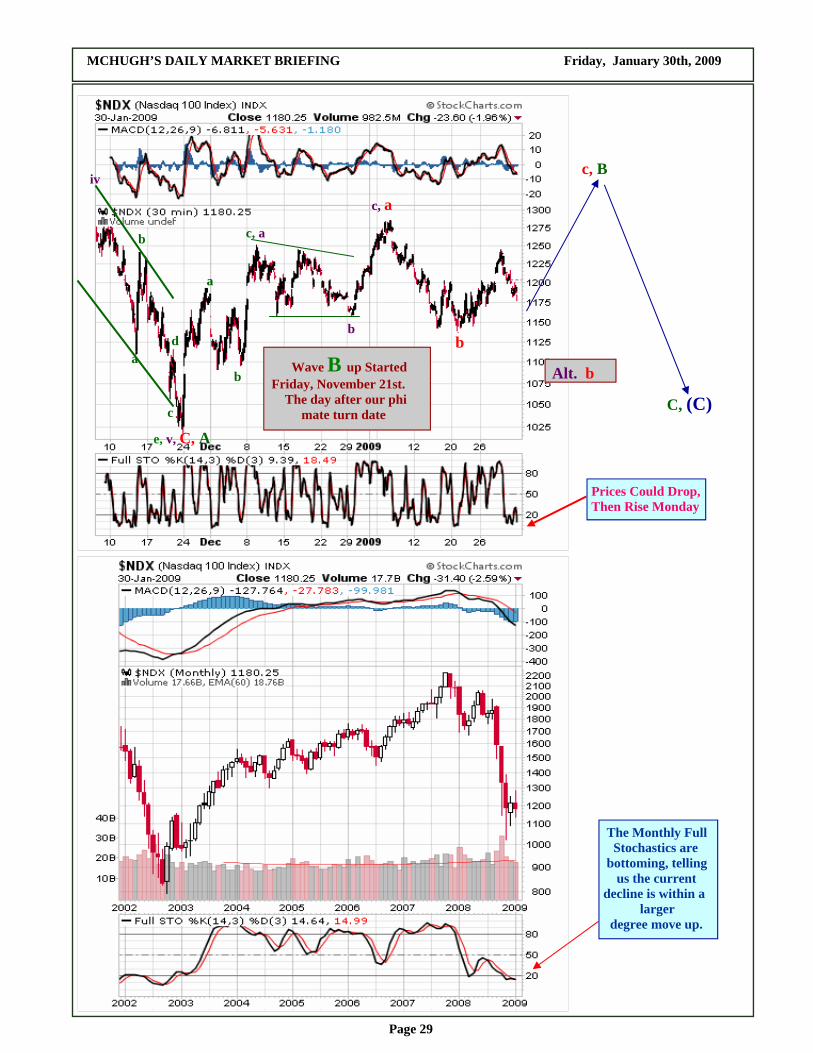
Wave B up Started Friday, November 21st. The day after our phi mate turn date
c, a
b
c, a
b
a
b
Prices Could Drop, Then Rise Monday
Alt. b
The Monthly Full Stochastics are bottoming, telling us the current decline is within a larger degree move up.
MCHUGH’S DAILY MARKET BRIEFING Friday, January 30th, 2009
Page 30
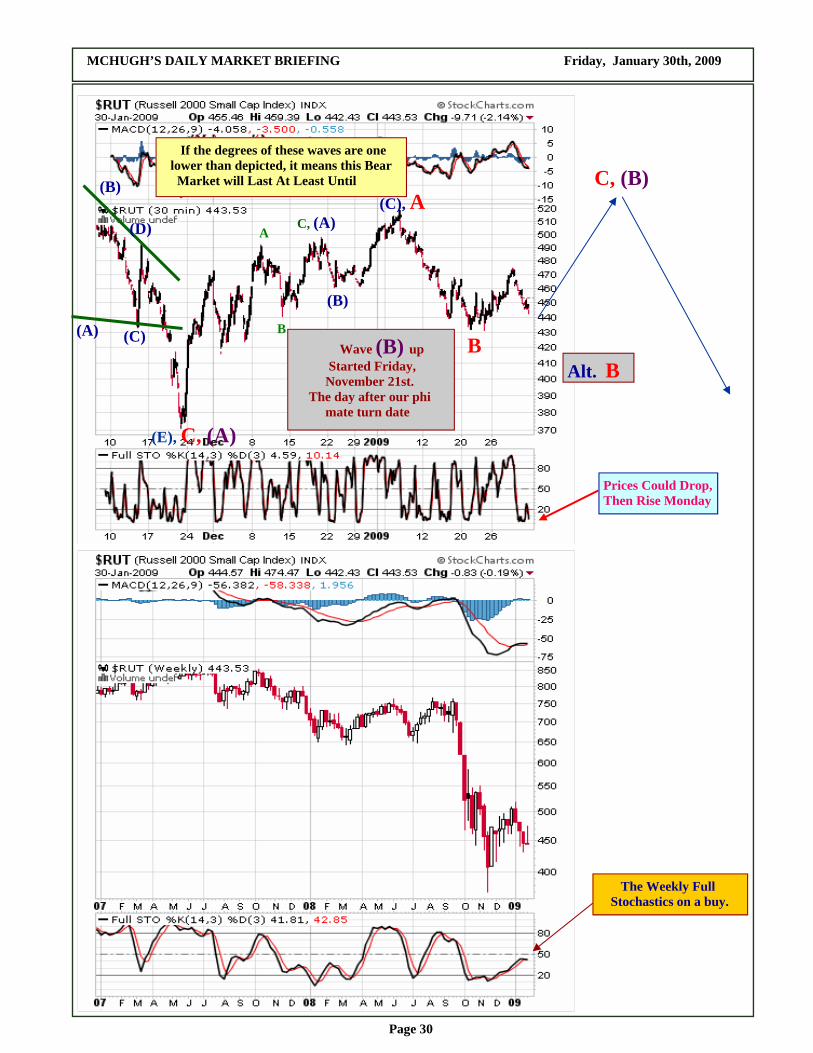
If the degrees of these waves are one lower than depicted, it means this Bear Market will Last At Least Until
(E), C, (A)
(A)
(B)
(C)
(D)
Wave (B) up Started Friday, November 21st. The day after our phi mate turn date
(C), A C, (A)
(B)
C, (B)
B
A
B
Alt. B
Prices Could Drop, Then Rise Monday
The Weekly Full Stochastics on a buy.
MCHUGH’S DAILY MARKET BRIEFING Friday, January 30th, 2009
Page 31
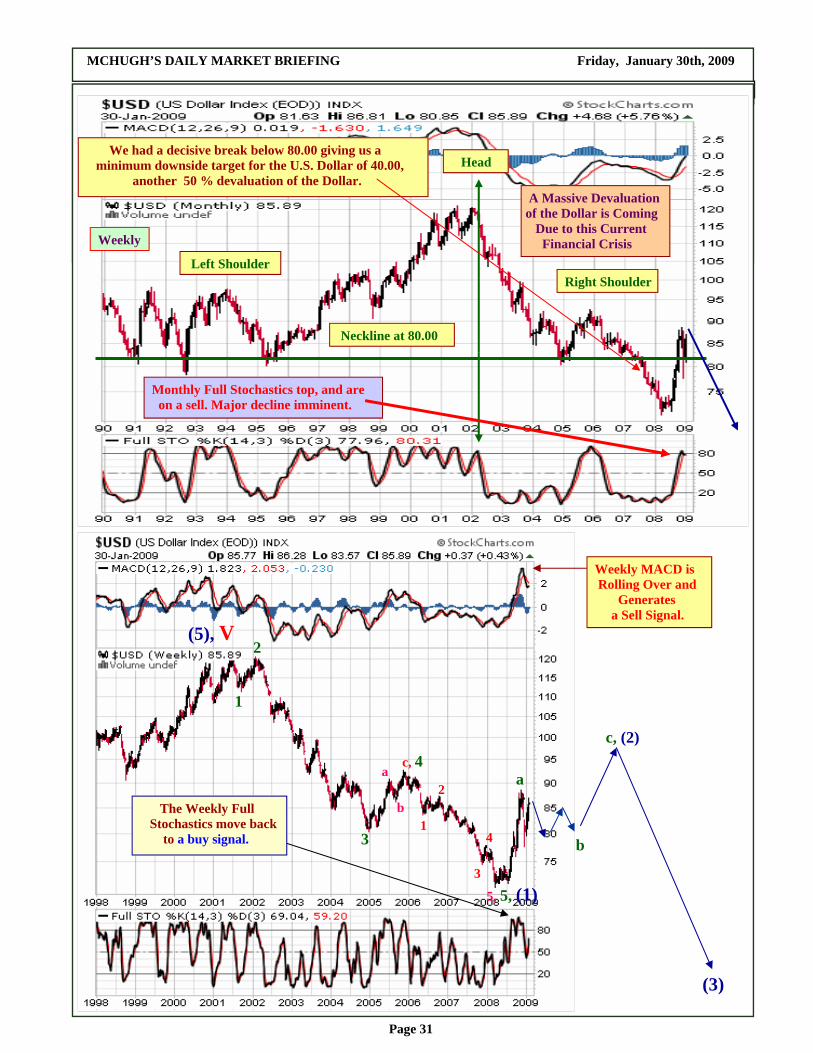
Left Shoulder
Head
Right Shoulder
We had a decisive break below 80.00 giving us a minimum downside target for the U.S. Dollar of 40.00, another 50 % devaluation of the Dollar.
Neckline at 80.00
Weekly
A Massive Devaluation of the Dollar is Coming Due to this Current Financial Crisis
Monthly Full Stochastics top, and are on a sell. Major decline imminent.
5, 5, (1)
1
2
3
c, 4 c, (2)
a
b
(3)
1
2
(5), V
3
4
The Weekly Full Stochastics move back to a buy signal.
a
b
Weekly MACD is Rolling Over and Generates a Sell Signal.
MCHUGH’S DAILY MARKET BRIEFING Friday, January 30th, 2009
Page 32
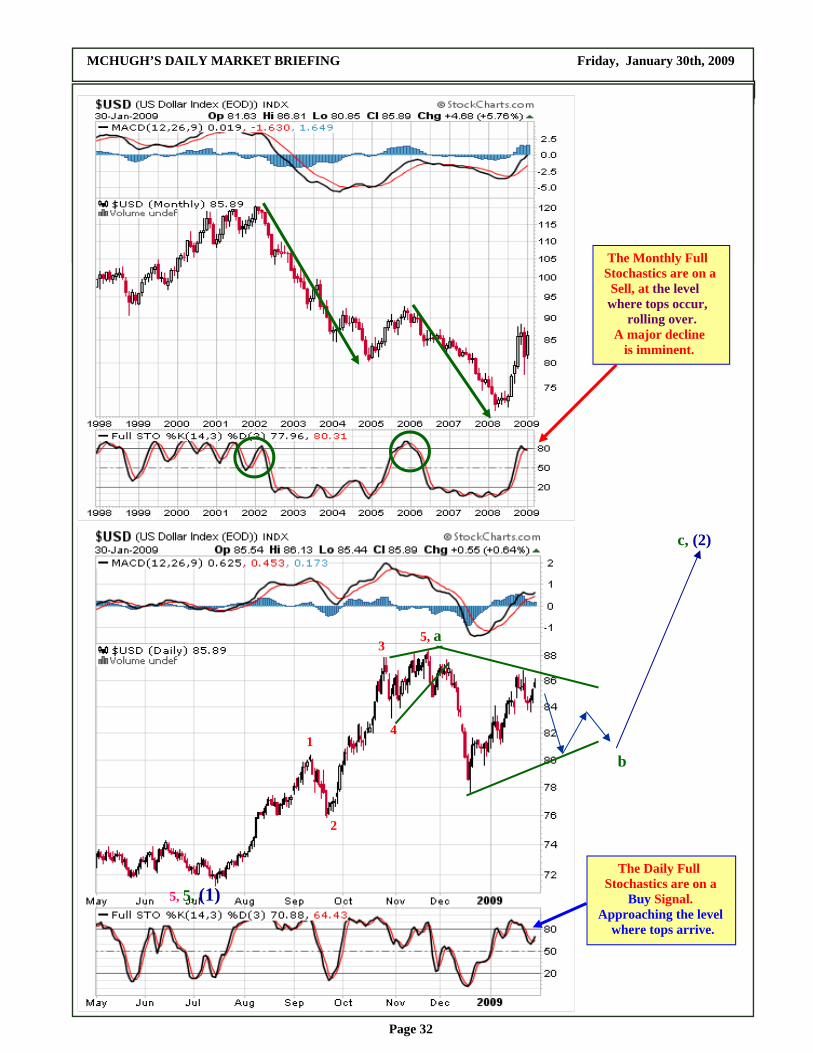
The Monthly Full Stochastics are on a Sell, at the level where tops occur, rolling over. A major decline is imminent.
The Daily Full Stochastics are on a Buy Signal. Approaching the level where tops arrive.
c, (2)
5, a
b
5, 5, (1)
1
2
3
4
MCHUGH’S DAILY MARKET BRIEFING Friday, January 30th, 2009
Page 33
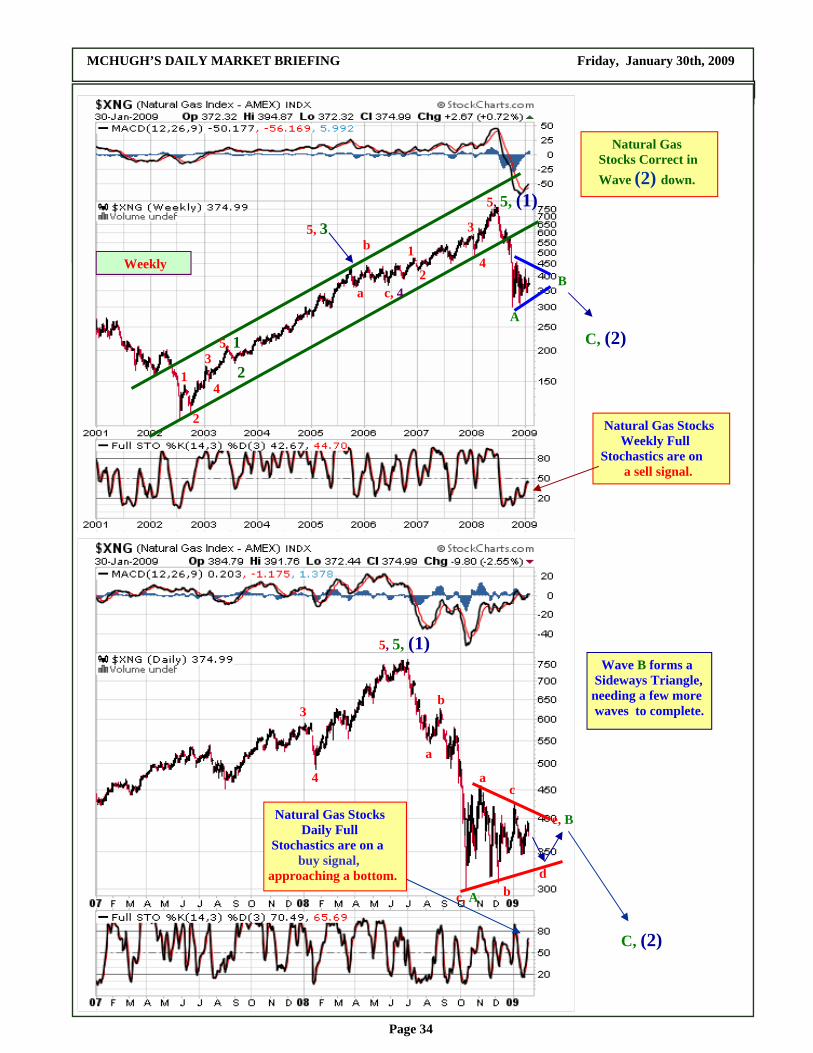
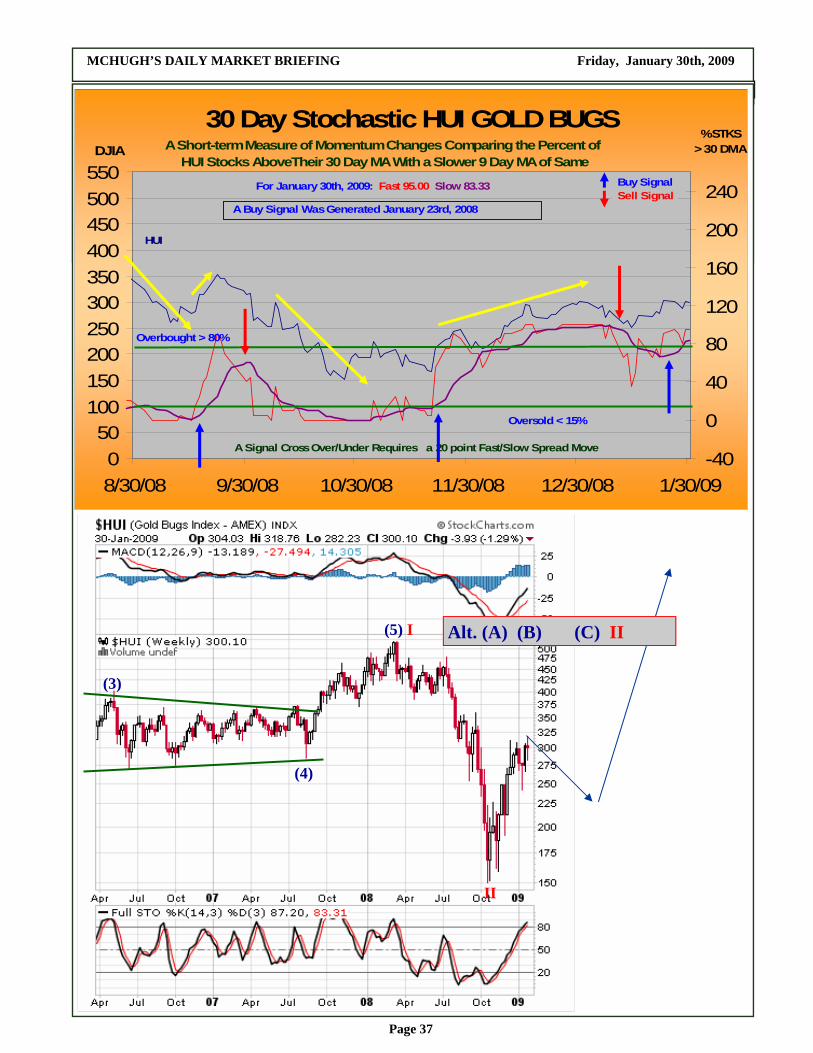
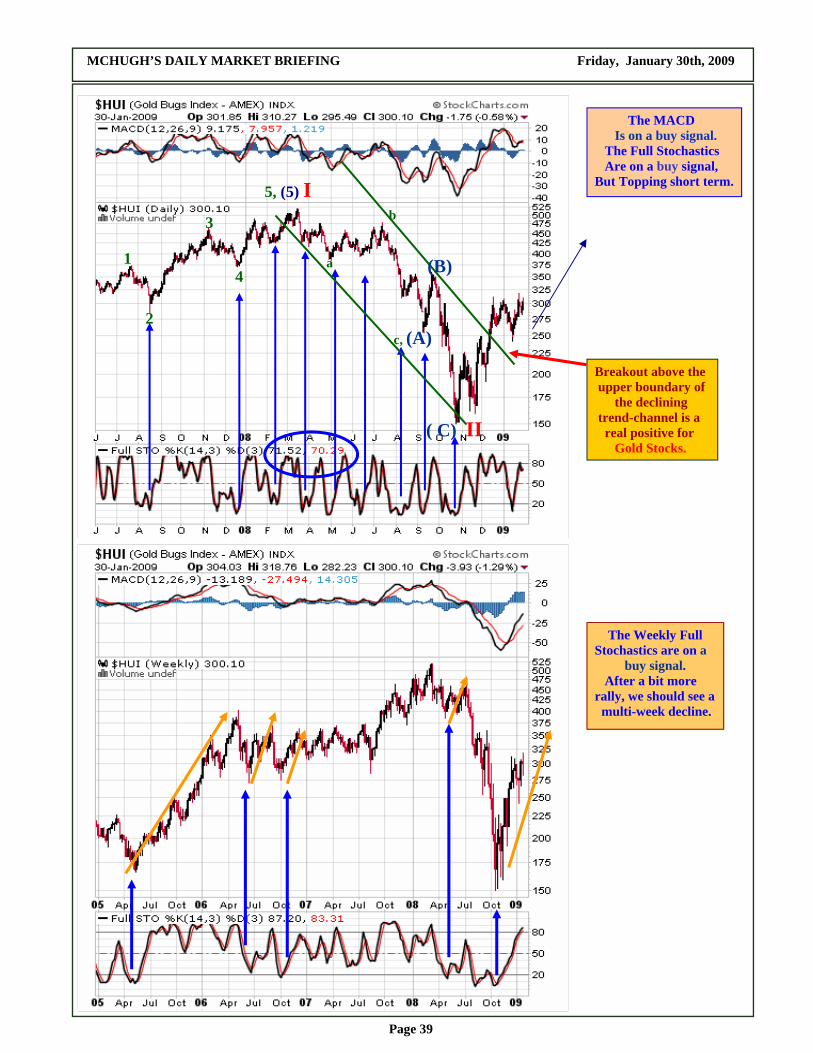
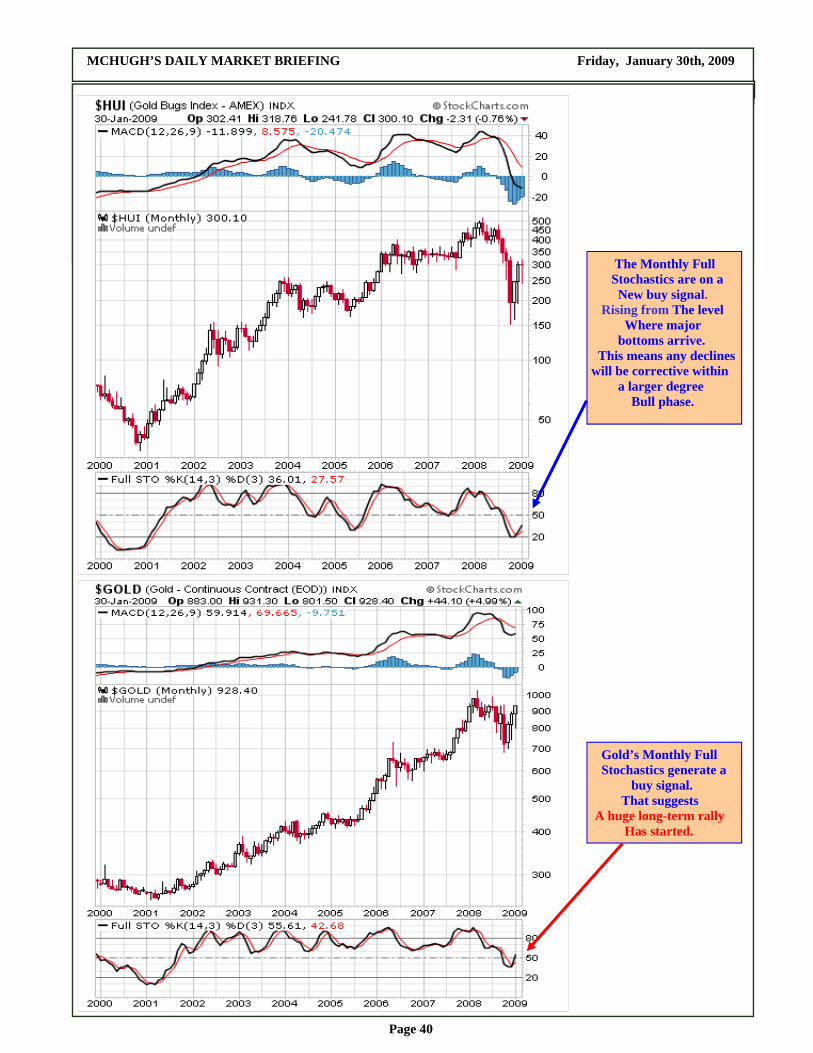
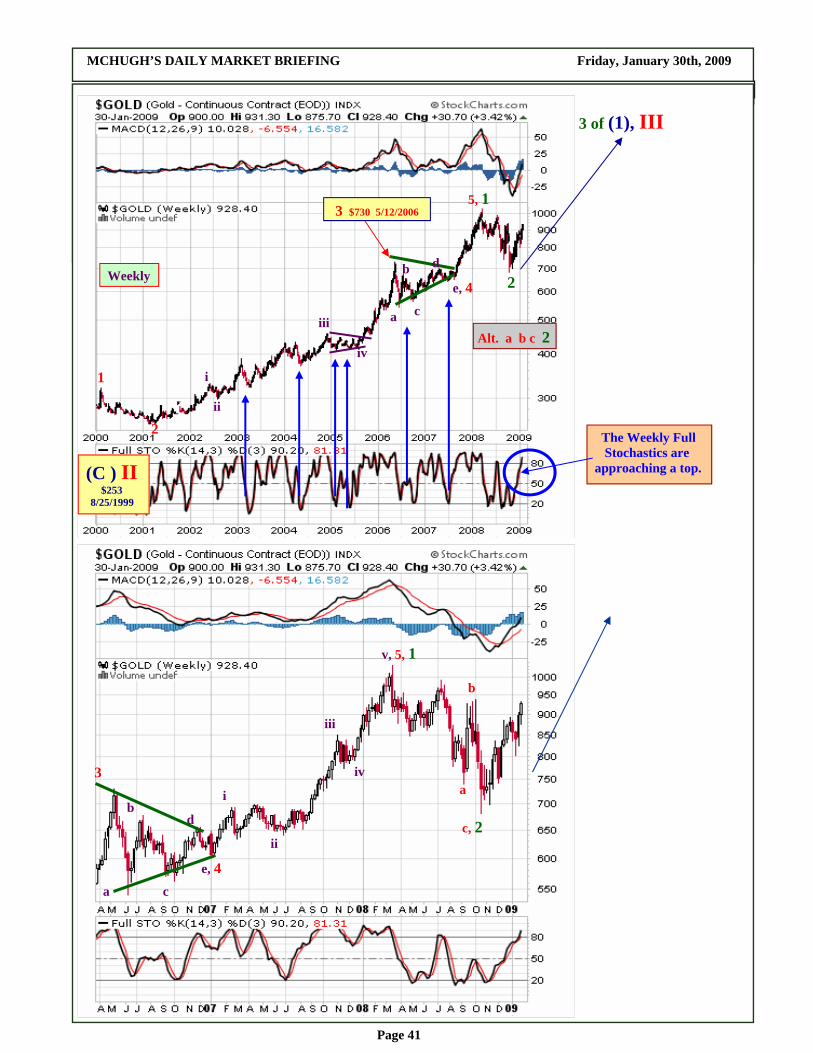
Take notice of the Dollar’s Monthly Full Stochastics shown on the chart at the top of page 31. It has just generated a sell signal from overbought levels. This means a massive devaluation of the Dollar is about to start, one that could take several months, maybe a year. It should cut the value of the Dol-lar in half, which of course should be positive for Gold, and to a lesser extent Silver. Intermediate term, the Dollar is working through a wave (2) rise, and appears to be in the middle wave of that move, wave b-down, which may be forming a triangle. The Weekly Full Stochastsics generated a new buy, but not from oversold levels, suggesting a whipsawing triangle may be in formation. This wave (2) pattern could take several weeks, maybe a few months, to complete. Short-term, the Dollar completed wave a up. The Dollar is now descending into its wave b-down leg, which could be a triangle and last another few weeks. The Daily Full Stochastics just generated a new buy signal suggesting more upside is possible before a decline begins. Fundamentally, the Dollar has been in high demand during this crisis, as over 10 trillion dollars of wealth have been destroyed in the stock market and the housing market. That is an entire year’s GDP. That creates a shortage of Dollars. A credit market freeze has also caused increasing demand for dollars. As lines of credit were/continue to be cut, and credit card companies will cut $2 trillion more of lines soon, as the ability to borrow is being cut off, it means that cash is in demand, helping dollars increase in value. Further, given the international scope of this crisis, a flight to quality, to U.S. Dollars as well as U.S. Treasuries has been occurring, increasing demand for Dollars. Under these conditions, the Dollar should have rallied to 100. It did not, only rising from the high 70’s to the mid 80’s. Technically, this confirms that the Dollar’s rally is corrective in an ongoing long-term Bear market. Our forecast re-mains the same, that the Dollar will fall sharply, long-term into the 40’s. This means hyperinflation or competition from another currency that backs itself with gold is coming. Or it means economic collapse will require repudiation of Dollar denominated debts and a new currency is coming. A major devalua-tion of the dollar is coming. As for Oil, the depth of the decline is arguing that this is a primary degree correction going on, which means we should expect an A-down, B-up, C-down for wave (2) down. A bottom of significance completed, wave A-down. Wave B-up is now underway. The Daily Weekly, and Monthly Full Stochas-tics are bottoming, suggesting hyperinflation, or supply limitations, or a combination of both are about to drive Oil prices higher. Any further decline should be within the context of a larger degree rally. Gold has held up relatively well during this worldwide financial crisis, its intrinsic monetary na-ture providing a floor for its value during deflationary times. It gained 5.4 percent in 2008. The HUI, which is gold below ground, does not hold gold in the form of money, so it behaved more like a stock and experienced a similar crash to the general stock market. However, the HUI rallied hard recently, as the Daily Full Stochastics suggested it would. Daily Full Stochastics are now approaching a top, sug-gesting a short-term corrective decline is coming. The Weekly Full Stochastics are also topping. Wave III up has started, which could be dramatic. If you study the Monthly chart, it is on a buy, with room for more upside. Rallies starting from monthly bottoms tend to be impressive, and this rally has done just that. Any declines should be within the context of a larger degree rally. Silver’s Daily and Weekly Full Stochastics suggest a top is approaching. But the monthly Full Stochastics argue any decline will be corrective within the context of a large Bull Market. This implies huge hyperinflation injections into world-wide economies by central banks. Bonds have rallied dramatically as we have been calling for weeks and months. The Daily Full Stochastics are bottoming suggesting a short-term rally is coming. The Weekly and Monthly Full Sto-chastics suggest Bonds are topping longer term. They could decline sharply over the first half of 2009.
MCHUGH’S DAILY MARKET BRIEFING Friday, January 30th, 2009
Page 34
5, 1
2
5, 3
1
2
3
4
5, 5, (1)
Natural Gas Stocks Correct in Wave (2) down.
a
b Weekly
c, 4
1
2
3
4
Natural Gas Stocks Weekly Full Stochastics are on a sell signal.
A
B
C, (2)
5, 5, (1)
3
4
c, A
e, B
C, (2)
a
b
a
b
Natural Gas Stocks Daily Full Stochastics are on a buy signal, approaching a bottom.
c
d
Wave B forms a Sideways Triangle, needing a few more waves to complete.
MCHUGH’S DAILY MARKET BRIEFING Friday, January 30th, 2009
Page 35
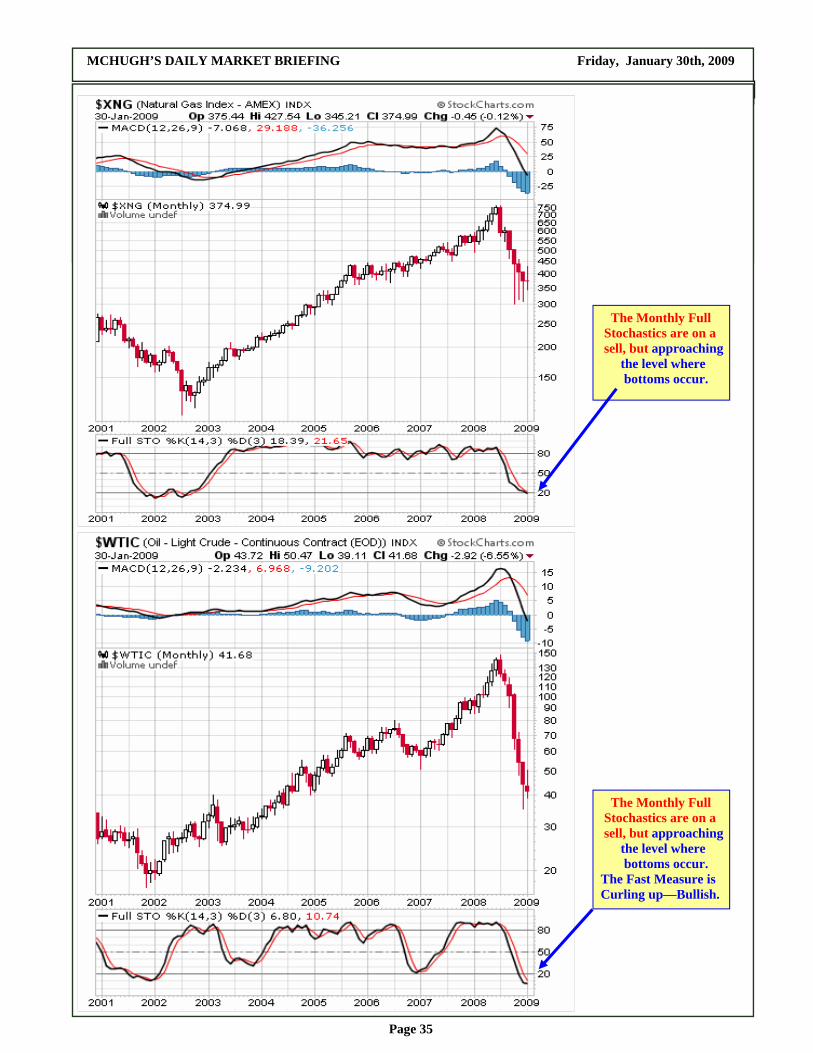
The Monthly Full Stochastics are on a sell, but approaching the level where bottoms occur.
The Monthly Full Stochastics are on a sell, but approaching the level where bottoms occur. The Fast Measure is Curling up—Bullish.
MCHUGH’S DAILY MARKET BRIEFING Friday, January 30th, 2009
Page 36
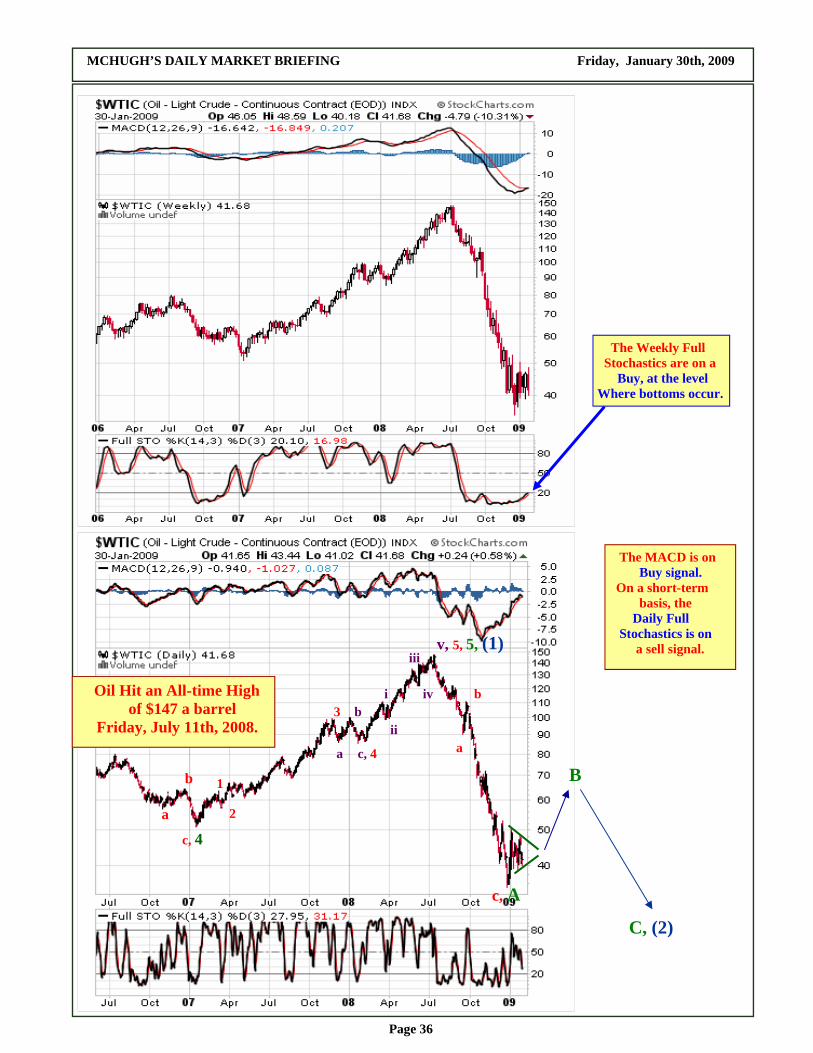
The Weekly Full Stochastics are on a Buy, at the level Where bottoms occur.
c, 4
a
b
iii
1
2
3
c, 4
The MACD is on Buy signal. On a short-term basis, the Daily Full Stochastics is on a sell signal.
a
b
c, A
i
ii
Oil Hit an All-time High of $147 a barrel Friday, July 11th, 2008.
v, 5, 5, (1)
iv b
a
B
C, (2)
MCHUGH’S DAILY MARKET BRIEFING Friday, January 30th, 2009
Page 37
30 Day Stochastic HUI GOLD BUGS
050
100150200250300350400450500550
8/30/08 9/30/08 10/30/08 11/30/08 12/30/08 1/30/09-40
0
40
80
120
160
200
240
HUI
A Short-term Measure of Momentum Changes Comparing the Percent of HUI Stocks AboveTheir 30 Day MA With a Slower 9 Day MA of Same
Overbought > 80%
Oversold < 15%
For January 30th, 2009: Fast 95.00 Slow 83.33
DJIA % STKS > 30 DMA
Buy Signal Sell Signal
A Signal Cross Over/Under Requires a 20 point Fast/Slow Spread Move
A Buy Signal Was Generated January 23rd, 2008
(5) I
II
(4)
(3)
Alt. (A) (B) (C) II
MCHUGH’S DAILY MARKET BRIEFING Friday, January 30th, 2009
Page 38
HUI Gold Bugs Purchasing Power Indicator
100
150
200
250
300
350
400
450
500
9/30/08 10/30/08 11/30/08 12/30/08 1/30/09160
180
200
220
240
260
280
300
320
PPI is a Short-term Momentum Measure of Purchasing Power, Generating Buy and Sell Signals When Changes Suggest Sustainable Multi-week Moves are Likely. HUI PPI
Buy SignalSell Signal
January 30th, 2009's HUI PPI is 214.97
PPI
HUI A Buy Signal Was Registered on 1/16//08
copyright © 2009 Robert D. McHugh, Jr. Ph.D.
1
2
3
4
5, (1)
c, (2) a
b
(3)
The HUI Big Picture
Intermediate Degree
Primary Degree
Weekly (4)
(5) I
II
Alt. (A) (B) (C) II down
The Weekly Full Stochastics Are on a Buy signal. But approaching a top.
MCHUGH’S DAILY MARKET BRIEFING Friday, January 30th, 2009
Page 39
c, (A)
1
The MACD Is on a buy signal. The Full Stochastics Are on a buy signal, But Topping short term.
a
b
5, (5) I
2
3
4 (B)
( C) II
Breakout above the upper boundary of the declining trend-channel is a real positive for Gold Stocks.
The Weekly Full Stochastics are on a buy signal. After a bit more rally, we should see a multi-week decline.
MCHUGH’S DAILY MARKET BRIEFING Friday, January 30th, 2009
Page 40
The Monthly Full Stochastics are on a New buy signal. Rising from The level Where major bottoms arrive. This means any declines will be corrective within a larger degree Bull phase.
Gold’s Monthly Full Stochastics generate a buy signal. That suggests A huge long-term rally Has started.
MCHUGH’S DAILY MARKET BRIEFING Friday, January 30th, 2009
Page 41
1
2
iii
i
iv
ii
3 $730 5/12/2006
(C ) II $253 8/25/1999
a
b
c
d e, 4
3 of (1), III
Weekly
The Weekly Full Stochastics are approaching a top.
5, 1
2
Alt. a b c 2
a
b
c
d
e, 4
v, 5, 1
c, 2
3 i
ii
iii
iv a
b
MCHUGH’S DAILY MARKET BRIEFING Friday, January 30th, 2009
Page 42
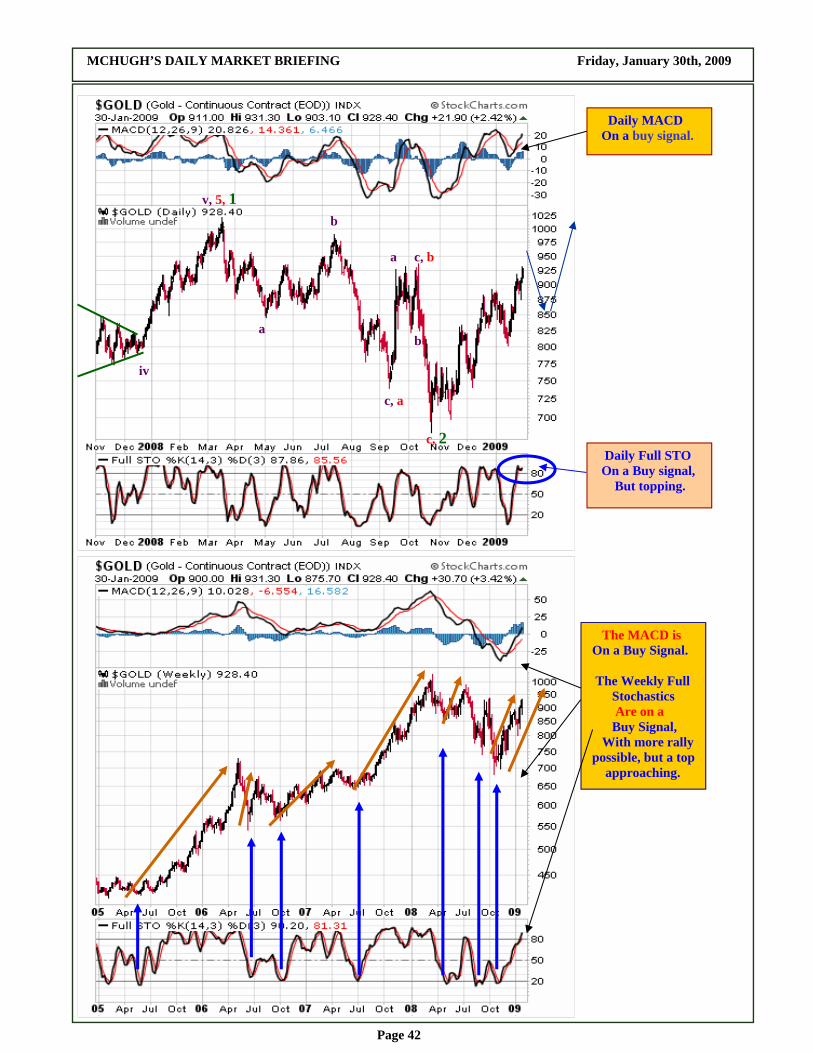
v, 5, 1
c, 2
iv
c, a
c, b
a
b
a
b
Daily MACD On a buy signal.
Daily Full STO On a Buy signal, But topping.
The MACD is On a Buy Signal. The Weekly Full Stochastics Are on a Buy Signal, With more rally possible, but a top approaching.
MCHUGH’S DAILY MARKET BRIEFING Friday, January 30th, 2009
Page 43
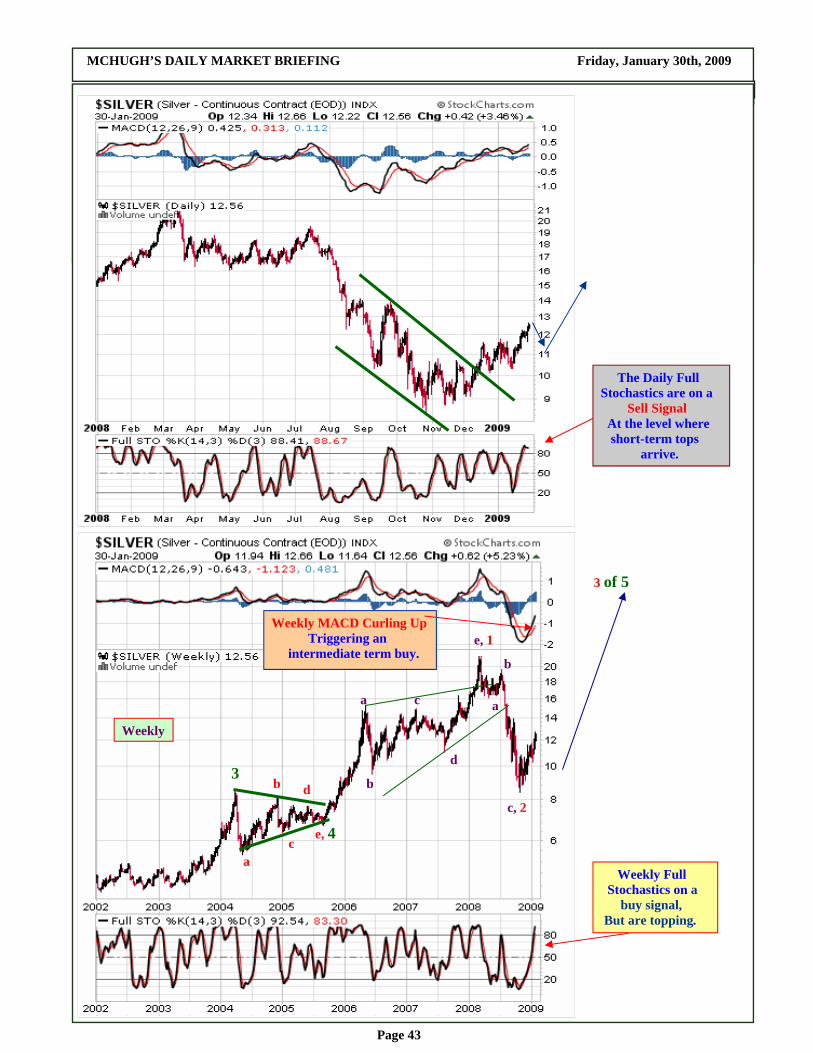
The Daily Full Stochastics are on a Sell Signal At the level where short-term tops arrive.
3
a
b
c
d
e, 4
3 of 5
a
Weekly
c, 2
e, 1
b
c
d
Weekly Full Stochastics on a buy signal, But are topping.
a
b
Weekly MACD Curling Up Triggering an intermediate term buy.
MCHUGH’S DAILY MARKET BRIEFING Friday, January 30th, 2009
Page 44
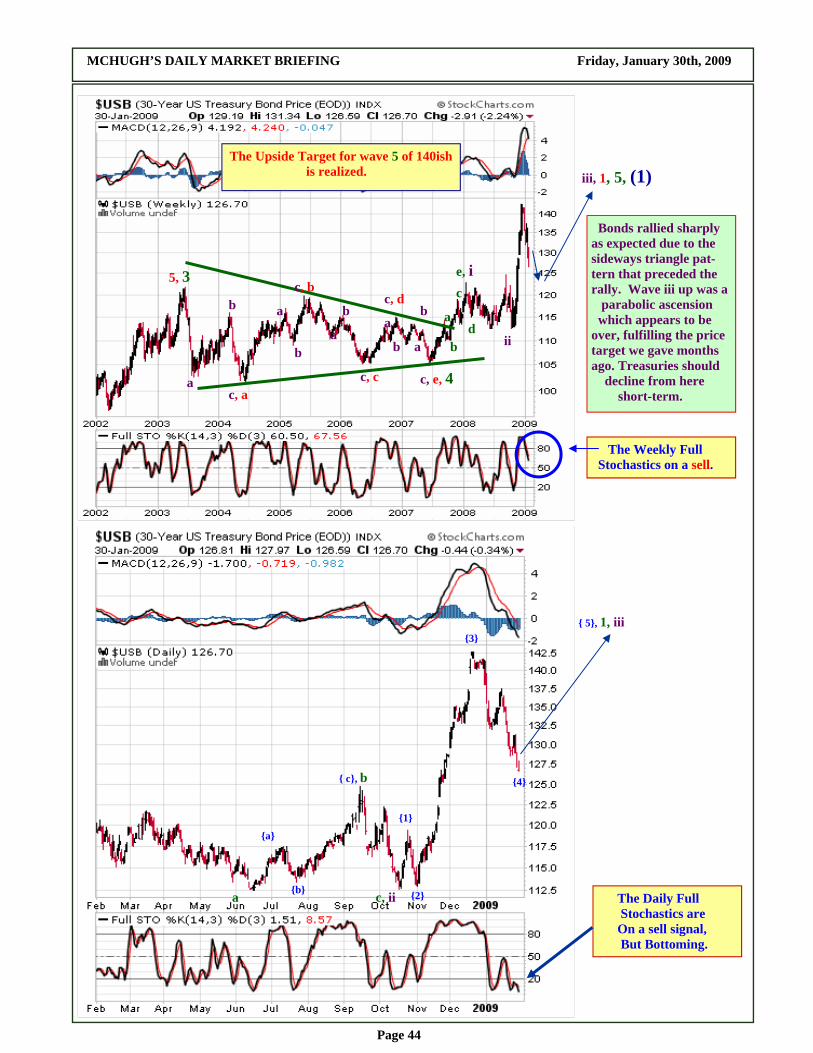
iii, 1, 5, (1)
c, e, 4
5, 3
c, a a
b a
b
c, b
a
b
c, c
a
b
c, d
Bonds rallied sharply as expected due to the sideways triangle pat-tern that preceded the rally. Wave iii up was a parabolic ascension which appears to be over, fulfilling the price target we gave months ago. Treasuries should decline from here short-term.
a
b a
b
c
d
e, i
ii
The Upside Target for wave 5 of 140ish is realized.
The Weekly Full Stochastics on a sell.
c, ii a
{a}
{b}
{ c}, b
{1}
{2}
{3}
{4}
{ 5}, 1, iii
The Daily Full Stochastics are On a sell signal, But Bottoming.

Page 6 of 6
MCHUGH’S FINANCIAL MARKETS FORECAST & ANALYSIS Issue No. 7 Bonds and Interest Rates:
Page 45
New Years Specials: 6 Months for $175, or 10 Months for $215, or, 12 Months for $300, or 13 Months for $249, or 18 Months for $359, or * 24 Months for $449 *
Good through Sunday, February 1st, 2009 Simply go to www.technicalindicatorindex.com click on the Subscribe Today or Renew Today buttons.
MCHUGH’S DAILY MARKET BRIEFING Friday January 30th, 2009
Key Economic Statistics 1 Week Avg. Date VIX U.S. $ Euro CRB Gold Silver Crude Oil M-3 1/16/09 46.11 83.97 132.95 221.09 839.9 11.20 35.88 Hidden 1/23/09 47.27 85.52 129.68 225.79 899.4 11.87 45.65 Hidden 1/30/09 44.84 85.89 128.18 220.37 927.3 12.56 41.75 Hidden Note: VIX, Euro, and Oil fall; Dollar, Gold and Silver rise.
Conservative Balanced Portfolio Recent Transactions As of Friday January 30th, 2009 * On 8/25/08 we increased the Market Timing segment allocation of our conservative portfolio from 5 percent to 10 percent, by moving $50,000 of cash to this segment. * On 8/25/08, we sold 50 shares of IYT, an ETF that mirrors the Trannies, at $89.17 per share. We also sold 100 shares of QQQQ, the ETF that mirrors the NDX, at $46.50 per share. * On 8/25/08, we purchased 50 shares of SLV, at $136.89 per share, an ETF that mirrors Silver. We also pur-chased 300 shares of GDX, at $36.91 per share, an ETF that mirrors the HUI Amex Gold bugs Index. We also purchased 100 shares of GLD, at $80.95 per share, an ETF that mirrors the price of Gold. These purchases were made within the Market Timing Segment of our Conservative portfolio. * On 8/25/08, we purchased 12 ounces of actual Gold at $820 an ounce, in the Gold segment of our portfolio. Note: Our Conservative Portfolio Model substantially outperformed the S&P 500 in the first quarter, 2008. Check it out! Click on the Conservative Portfolio button at the left side of the home page. We posted an updated Balances/Market Value Portfolio as of November 30th, 2008, available in the Conser-vative Portfolio section.

Page 6 of 6
MCHUGH’S FINANCIAL MARKETS FORECAST & ANALYSIS Issue No. 7 Bonds and Interest Rates:
Page 46
Robert McHugh Ph.D. is President and CEO of Main Line Investors, Inc., a registered investment advisor in the Commonwealth of Pennsylvania, and can be reached at www.technicalindicatorindex.com. The statements, opinions, buy and sell signals, and analyses presented in this newsletter are provided as a general information and education service only. Opin-ions, estimates, buy and sell signals, and probabilities expressed herein constitute the judgment of the author as of the date indicated and are sub-ject to change without notice. The information contained in the newsletter is expressed in good faith, but its accuracy is not guaranteed. Nothing contained in this newsletter is intended to be, nor shall it be construed as, investment advice, nor is it to be relied upon in making any investment or other decision. Prior to making any investment decision, you are ad-vised to consult with your broker, investment advisor or other appropriate tax or financial professional to determine the suitability of any invest-ment. Neither Main Line Investors, Inc. nor Robert D. McHugh, Jr., Ph.D. Editor shall be responsible or have any liability for investment decisions based upon, or the results obtained from, the information provided. Copy-right 2009, Main Line Investors, Inc. All Rights Reserved. “Jesus said to them, “I am the bread of life; he who comes to Me shall not hunger, and he who believes in Me shall never thirst. For I have come down from heaven, For this is the will of My Father, that everyone who beholds the Son and believes in Him, may have eternal life; and I Myself will raise him up on the last day.” John 6: 35, 38, 40 If you are enjoying your subscription, please tell a friend. Let them know about our free — one time — 30 day trial subscription.
Here are the symbols for Exchange Traded Funds for the Major Indices: DIA Dow Industrials IYT Trannies SPY S&P 500 GDX HUI Amex Gold Bugs* QQQQ NASDAQ 100 GLD Gold IWM Russell 2000 SLV Silver EWA Australia * Note: The GDX actually tracks the GDM, a grouping of 45 mining stocks, but the GDX has very high correlation to the HUI so we mention that as a suitable ETF for the HUI.
MCHUGH’S DAILY MARKET BRIEFING Friday, January 30th, 2009