Embed Size (px)
DESCRIPTION
artículo
Citation preview

SPEIDOESocloty 0/ U.S. Oepmtmant
Potrobum Errgheera ofEnergy
SPEIDOE 17351
Weeks Island Bravity Stable C02 Pilotby J.FL Johnston, ShellOffshore Inc.
SPE Member
@@irht 19SS, Sooletyof Petroleum En@naare
Thk paper wea prepared for Praaentalbn at the SPEIOOE Enhanced011Flaoc+erySympeium held in Tube, Oklahoma, A@l 17-20, 19SS.
This paper wea ealectad for praaantatlonby an SPE ProgramCornmkfaafotlmvlngravbw of Informatlomcontained In an ebefracf aubmfffedby theauthor(8).Contenteof the paper, ee preeentad,have not been revbwed by the Sooiafyof Petrokum Englnaaraand are aubjacf 10oorwtkn by theauthor(s).The matarkf, ea presented,does notnacaeearityreflectany poeltkn of the Soclatyof PetroleumEnglnaera,ttaoffkara, or rnamfmra.Peperepresentedat SPE meatinga are subjectto publioetlonreview by EdlforlelCemmitteeeof the Sookty of Petrokum Engimre. Perrriaebn to copy Isreefriofadto an ebatrect of not more than 300 w .ds. Illuatralionsmay not Lwcopied, The ebetrect shouldcontainconepkuoua mknowledgmantofwhere and by vhom the paper la presented.Write Publketiona Manager,SPE, P.O. Sox S3.3eS6,Rlchardaon,TX 7SOWSS3S. Taiex, 730SSSSPEDAL.
ABSTRACT Residual oil volumes remaining in the “largerreservoirs represent sizeable enhanced oi1 recovery
The Weeks Island S sand Reservoir B (S RB) (EOR) targets. The reservoirs at Weeks 1s1 and aregravity-stable C02 field test is almost complete. deep and hot, e.g., 13,000 feet and 225°F in theInjection started in October 1978 and production pilot. The dip in the S RB is about 26 degrees andbegan in January 1981 in this high-permeability, permeability is high. Under these reservoirsteeply dipping saitdstonereservoir. Through 1987, conditions, gravity-stable CO flooding is theabout 261,000 barrels of oil or about 64 percent of selected EOR process. The im~lcmentation and aboutthe starting volume has been recovered. A half of the operational life of the pilot were a24-percent pore-volume slug of CO mixed with about joint effort with the U. S.lIllpartmentof Energy.six mole percent of natural gas (~ostly methane) Reports by Perry and others document pilotwas injected at the start of the pilot. During design, implementation and early results for the1983, when gas production rates started to 1977 to June 1981 time period.increase, C02 containing produced gas wasreinfected. Through 1987, CO usage statistics are RESERVOIR DESCRIPTION7.90MCF/BOwith recycle and ~.26MCF/BO based on
.—
purchased C02. The S sand Reservoir B was chosen for the
This report is a review of early pilot historypilot because it has properties similar to thelargest EOR candidate reservoir at Weeks Island and
and a more detailed account of the post-June 1981 because it is relatively small and well confined byresults. A reservoir-simulation history match of faulting. The S RB originally contained aboutpilot performance plus core and log data from a1983 swept-zone evaluation well are included.
three million STB of oil underlying a 38-8CF gascap. The oil column was first produced by gas-capexpansion and later by water injection. The one
INTRODUCTION oil production well was completed near the gas-oilcontact.
The Weeks Island field is located in NewIberia Parish, Louisiana. The structural features Figure 1 is a structure map of the pilotof the Weeks Island reservoirs are typical of many portion of the S RB illustrating the relativepiercement salt-dome fields in the Gulf Coast. Sandquality and continuity in most reservoirs in the
position of the pilot wells. The gas cap extends
field are exceptionally good. Oil recoveries arealong the face of the dome to the right in thisfigure. Table 1 shows key reservoir parameters
typically 60 to 70 percent of original oil in plus production and injection volumes prior to theplace, and water-displacement sweep efficiencies start of C02 injection. The original oil-waterare very high in these strong water-drive contact was not logged in this reservoir;reservoirs. therefore, the original oil in place is uncertain.
The pre-pilot oil-column production historyended in July 1978 in preparation of C02 injection.
??eferencesand illustrations at end of paper. At that time, Weeks Island State Unit A No. 16A was
317

producing at relatively low oil rates, high water Late January 1981 marked the start ofcuts, and increasing gas/oil ratios (GOR). A sustained production from the pilot. Uell A-17relatively thin oil column, about 23 feet of mobile produced with a high water cut andoil, remained at the start of the pilot injection higher-than-expectedCO content from the start.when A-16A was converted for C02 injection. see ?Fig, 2 is a composite p oduction and injectionRefs. 1 and 2 for more details. history of the total pilot. The oil-production
history until early 1983 is from Well A-170nly. APILOT HISTORY second producer and swept-zone evaluation well was
drilled, cored, and completed on about theThe logging monitor and first pilot production beginning of 1983.
well, Weeks Island State Unit A No. 17, wasdrilled, cored and evaluated for remaining oil The first 1 l/2years of production weresaturation early in 1978. Several techniques were characterized by greater than 50 percent water,used to measure Sor including fluid extraction of about 50 percent CO in the separator vapor phase,conventional core, laboratory core measurements, and solution GOR, ?he rapid increase in water cutopen-hole logs and log-inject-log (pulsed neutron during August through October 1981 was caused bylogs), The average S in the pilot portion of theS RB was about 22 per~~nt based on th~se
injecting water into Well G-2 to prevent the oilcolumn from moving below the production
evaluations (see Kidwell and Guillory and Ref. 1). perforations, The increasing water-cut response inWell A-17 was rapid and caused the well to stop
SLUG INJECTION HISTORY flowing, Injection was stopped after less thanthree months or about 45 thousand barrels of water,
The C02P1US hydrocarbon-gas slug was injected Uncertainty exists in the actual volume of waterinto Well A-16A from October 1978 until February injection during this period because of an1980. The slug volume was 853 BCFof CO (about ineffectiv~ meter run. This fact is important to24 percent pore volume) and 55 BCF of na?ural gas. the reservoir simulation of the pilot.The natural gas was added, as discussed in Ref. 1,to help achieve gravity stability by reducing slug Ouring the Fall 1981 shut-in period, adensity. At S RB reservoir conditions, C02 densityis slightly greater than the density of CO -free
gas-lift system was installed and, in addition, thewell was squeezed and perforated to eliminate any
oil; however, the added, lighter natural g~s had extraneous water production. Well A-17 thenlittle if any impact on gravity stability because produced by gas lift until free-gas productionof the properties of the CO -crude phase behavior.
fbegan in Fall 1982 which is indicated on Fig. 2 by
Fluid mixing in the reservo r provides vapor and the increase in gas-production rate. Well A-17 wasliquid phase compositions which are different from shut in during December 1982 to allow anythe injected or originally present compositions. fluid-bank instability to stabilize prior toAlthough this was known at the OutSet, the C02 slu9 logging the new evaluation well, Weeks Island Statewas diluted to lessen the risk of gravity Unit A No, 18.instability. The dilution had little effect on oilrecovery from sand pack floods as shown in fief.1. EVALUATION OF WELL A-18
During slug injection and the following eleven Well A-18 was designed to evaluate themonths until oil production started, water was CO -swept part of the reservoir for remaining oilproduced from a downdip well, Smith State Unit G-2, ?sa uration and to provide a second drainage point.to allow the CO rich vapor bank to displace the The well penetrated the S sand slightly lower thangrowing oil ban? structurally downward to the and about 260 feet southwest from Well A-17.production well. Ouring this time, the position of Fig, 3 is a comparison of the neutron andthe CO -rich as front was monitored by pulsed
i fresistivity log response from Well A-18 and a
neutro logs PNC) run in Well A-17, The neutron log from Well A-17, The logs were runmonitoring program and results are described in during January 1983, The logs show that the C02Ref, 4. The oil bank could not be monitored by front was essentially flat at that time, The A-17neutron logs because water salinity varied with perforations and the approximate position of thestructure as a result of fresh water injection into oil bank are also shown on Fig, 3, Well A-18a saline reservoir, found the S sand between 12,794 feet and
13,009 feet measured depth or -12,746 to -12,961EARLY PRODUCTION RESPONSE feet subsea, The high-gas saturation zone was
obvious from the neutron response and extended toThe oil bank was monitored by production -12,870 feet subsea depth.
testing from two sets of perforations in Well A-17,The log-inject-log (LIL) perforations were tested Core analyses for Well A-18 are plotted infirst, Then the final pilot production Fig, 4. The well was cored froma subsea depth ofperforations, which are located 130 feet -12,780 to the base of the S sand. The CO floodedstructurally lower than the injection wellperforations, were tested. The results of these
part of the wel1 was cored with one 30-foo?conventional core and four 15-foot pressure cores.
tests, which were reported in Ref. 4, defined Conventional and pressure-retaining cores were cutoil-bank arrival time. The oil bank grew to about in the lower, high-liquid-saturationpart of the S57 feet by early 1981 from the starting 23-foot sand. The A-18 core results show greater than athickness, 90 percent recovery of r(sidual oil by
gravity-stable CO flooding in 59 feet of core in$the gassed-out pa t of the well, Much of the
,— —

SPE/OOE 17351 J. R. JOHNSTON 3
:0-flooded core had no remaining residual oil fromk& Stark core extractions. Overall in the C02;weptzone, the oil saturation.was reduced fromhut 22 percent to an average of 1.9 percent.~hese and the oil saturations presented in Fig. 4Ire corrected to in-situ conditions by oilformation volume factors and by stressed porosity.rhe correction for stressed porosity is base; on;everal A-17 and A-18 core measurements.maturations measured from the cores below thegassed-out section are of questionable valuebecause loss of liquid volume prior to coreextraction was observed. Well A-17 core data from1978 is plotted in Fig. 5 for comparison with theA-18 data.
The position of the oil bank at Well A-18 isnot precisely known. Based on log analysis, the:::s::nk is located at -12,870 to -12,908 feet
The gas-oil contact was easily identifiedby a n~utron porosity log. The position of theoil-water contact is not obvious because of theapparent elongated water-saturation profileobserved in the oil bank. The existence of asalinity gradient makes resistivity-log evaluationsuncertain. Short duration production tests wereconducted to obtain water samples and to determineoil productivity. The results are presented inTable 2.
The upper set of perforations are certainly inthe oil bank. The middle set of test perforationsfalls within the identified oil-bank limits; but,the short-duration, low-production rate testresulted in only d trace of oil. Subsequentproduction from the middle set of perforations athigher, sustained rates resulted in substantial oilproduction. Coning might resolve part of thedifference in tested productivity. Obviously, theelongated water-saturation profile or transitionzone, plus the salinity gradient, do not allowidentification of an “oil-water” contact. Thewater-saturation profile calculated fromopen-hole-log data is plotted in Fig. 4. Thecalculation is based on a salinity profile definedby analysis of produced water. The production testperforations are identified in Fig. 4,
LATE PRODUCTION RESPONSE
Well A-17 resumed and A-18 started productionduring the second quarter 1983. Since that time,both wells have produced with high water cuts,increasing GOR’s and declining oil rates. Theinjection of produced gas, which is a combinationof C02 and hydrocarbon 9asess started during July1983. Production has been continuous except for atwo-month shutdown for repair of the recyclecompressor during late 1983. Table 3 is a su~aryof recent and cumulative pilot performance.
The pilot is at a mature stage of operation.Cumulative oil recovery significantly exceeds the21oMSTB target set at the start. The pilot isexpected to produce about 270 MSTB or 66 percent ofthe starting oil volume at abandonment probablyduring 1988. The expected primary recovery fromthe oil rim remaining at the beginning of the pilot(23 feet thick) is 65 MSTB. Therefore, tertiaryrecovery at termination will be about 205 MSTB or60 percent of the estimated oil volume notrecoverable by water displacement.
PILOT INTERPRETATION - SIMULATION
Shell’s MULTISIM reservoir simulator was usedto model the pilot performance. The version ofMULTISIM used in this study is a multicomponent,multiphase and compressible reservoir-simulationpackage which is used to model compositionallydependent phase behavior with ternary diagrams.Ternary diagrams are stacked to providepressure-dependent phase definition, Phase densityand viscosity values used in the simulation arebased on pressure and composition. Amixing-parameter model was not used because phasebehavior data show that the process is moreimmiscible than miscible. Complex geology andreservoir rock properties can be represented inMULTISIM. A fully implicit model was used.
Data from the pilot used for the simulationhistory match include production r{!cords,theposition of the CO front, and fluiC saturation
8data from cores an open-hole logs. The history ofthe position of the CO front was provided by
?pulsed-neutron log eva uations. The firstsimulation model used was a 2-D vertical crosssection. This model proved useful in establishingthe swept-zone pore volume by matching the advanceof the CO front.
?“Predictions with the
cross-see l-n model indicate that coning of bothgas and water strongly influenced the performanceof Well A-17. This model was abandoned and a 2-Dcylindrical-coordinate (coning) model was used tosimulate the performance of the pilot from start ofinjection through the time Well A-18was drilledand Ingged. When two wells were on production, a3-D model was required. Pseudo-relative-permeability functions were employed to approximatethe coning phenomena in the large grid-block model.
FLUID PROPERTIES
CO -crude phase-behavior measurements arereporte~ in Ref. 1. A ternary diagram of the S RBCO -crude phase behavior based on laboratory data6re orted in Refs. 1 and 2 is shown on Fig 6.
Compositions from pilot production are alsoillustrated on Fig 6. The phase behavior input toMULTISIM is represented on Figs. 7 and 8. Thefluid property description was created with the aidof an equation-of-state (EOS) computer program toextrapolate experimental data to differentpressures and to provide estimates whereexperimental data were not available. Comparisonof the 5,100-psi phi~seenvelopes from Figs. 6 and 7shows good agreement.of MULTISIM input toexperimental data. The split of the hydrocarboncomponents for the ternary pseudocomponents wassubjective. Methane is the dominant component inthe light hydrocarbon pseudocomponent. Table 4shows the composition of the bubblepoint oil at SRB reservoir conditions from Ref. 1. The EOSprogram used for phase behavior descriptionemployed twelve pseudocomponents to characterizethe ternary heptanes plus (C +) pseudocomponent andto match the experimental da~a. Ternary diagramswere also used for phase-behavior-model input forthe high-pressure and ir’termediate-pressureseparators and the stock tank.
319

4 WEEKS ISLAND GRAVITY STABLE C02 pILOT SPE/OOE 17351
The EOS program together with a regression exponent of 3.2 for the final simulation modelpackage was used to correlate phase density and contrasts with approximately 4.5 from centrifugeviscosity values with composition and pressure. measurements. Capillary-pressure curves measuredThe model predictions ‘L” density and viscosity by centrifuge are compared to the simulation inputalong the liquid and vapor phase boundaries at5,100 psi and 225°F are compared to experimental
on the center and right-hand panels of Fig. 11.Either capillary-pressure function can provide the
data on Fig. 8. same accuracy in matching production history, but
CONING MODELnot the water-saturation profile. This occursbecause the production pe~formance is stronglyinfluenced by coning.
T!ie2-D cylindrical-coordinate (radial) gridused for this phase of simulation plus the The rapid increase in water production fromnon-fluid input parameters are shown on Fig. 9. Well A-17, shown on Fig. 2, followed a short periodThis grid provides small grid blocks around the of water injection in Well G-2 during 1981. Thisperforated interval of Well A-17 and progressivelylarger grid blocks away from the well. Other S RB
response proved difficult to model. Changes tomodel pore volume, relative-permeability curves or
wells were located in larger grid blocks consistent capillary-pressure cl!rvesfailed to allow a matchwith their structural position. The porosity ofthe grid blocks in the top and bottom layers was
of water cut just before and after the well A-17shut-in period during 1981. One or the other of
increased to represent the pore volume of the gas the water production periods could be matched bycap and water legs of the reservoir. The variable changing relative-permeability curves, but notwidth of the reservoir was modeled by changing the both. Increasing the field-recorded waterporosity and permeability by layer consistent withelevation. The pore volume in the oil column is
injection volume during the three-month period
the same as the 2-O cross-section model which wassignificantly improved the match. An increase of afactor of almost three to an average of about
used to match the C02 frontal advance. Reservoirdip was neglected as a practical necessity because
1,100 BPD provided the match shown in Fig. 12.Justification for using the increased volume is
that would require a 3-D cylir,drical-coordinate weak even though the added volume is a smallgrid. We do not believe dip is necessary to fraction of the pore volume and the water volumeaccurately model coning in this application because measurements are relatively inaccurate.of reservoir characteristics and geometry and
The
because the process is gravity stable.increased volume made no noticeable impact on thereservoir pressure. A very drastic chan~e to
Injection and production rates were input forrelative-permeability and/or capillary-pressurefunctions in the imbibition cycle might account for
all wells except for A-17. Total stock-tank liquid the water cut behavior during that time period;rates were input for Well A-17. Therefore, water however, this was not tested.cuts and GOR’s or gas rates were the parametersused to gauge the accuracy of the predictions. As shown in Fig. 12, gas breakthrough and GOR
were accurately modeled, GOR predictions proved toAbsolute permeability, relative permeability be a strong function of absolute permeability and a
and capillary pressure relationships were alteredto achieve a match. Core measurements represented
weak function of the ratio of vertical tohorizontal permeability. The values selected for
by Corey functions were used as a starting point the match (i.e., l,200md and k /k = 1.0) arefor the simulations. Fig. 10 is a plot of the ! Thereasonably consistent with corevda a.final relative-permeability functions used. TheCorey exponents for the two-phase
predicted volume of CO production was understatedin all simulations. T~is will be discussed later.
relative-permeability functions are shown onFig. 10. Composition and saturation paths and histories
for the coning model for a grid block locatedAs previously discussed, an unusual feature of between the injector and the producer are shown on
the pilot which strongly influenced the capillary Fig. 13. Water has been excluded from thepressure used in the model was the water-saturation compositional plots. These diagrams illustrate theprofile. Relative permeability functions I,idlittle impact on the predicted water-saturation
simulated displacement processes for the WeeksIsland pilot. The panels on the left show changes
profile. This is so because the process is gravity with time. The ternary diagrams Si]ow changesstable and because Well A-17 was shut in for about compared to phase compositional boundaries anda month prior to logging A-18. However, an compared to oil relative permeabilities. The plotsoil-water capillary-pressure curve drasticallydifferent from laboratory measurements did allow an
start just before invasion of C02 rich vapor phaseat saturation conditions of S = 22% and S =
acceptable match of the profile. Fig, 11 shows the .s = 8%. The composition pa!h begins at gear zerosaturation-profile match and the resultant C8C. As C02 content increases, the path iscapillary-pressure curve. ?pa allel to and near the liquid phase boundary
until the gas front invades the grid block. TheThe simulated oil saturation behind the C02
front is low and is in agreement with A-18 coreoverall composition is then near the vapor phaseboundary. Subsequent changes of path occur toward
data. The curvature of the oil lower CO content along the vapor phase boundary.relative-permeability curve for gas-oil ;The satu atirm path is from residual oil saturationdisplacement (k in Fig. 10), has a significant to higher oil saturation at constant critical gasimpact on the o!?gsaturation profile. A Corey saturation as the oil bank invades the grid block.

SPE/DOE 17351 J. R. JOHNSTON 5
1Then the oil saturation decreases at ever for grid-block flow were changed slightly com aredincreasing gas saturation and almost constant water !to those used in the coning study. This shou d besaturation as the oil bank is displaced by gas. true for the liquid phases even with gravitySeveral oil relative permeability isoperms are stability because of the long capillary-pressureshown on the saturation path ternary. transition zone. However, the opposite is true for
the gas-oil functions. With the assumption of zero3-D MODEL gas-oil capillary pressure, and with low
displacement velocities, pseudo-relative-The coning model was abandoned for a cartesian ~m#e;bility functions should be approximately
grid in order to continue the simulation beyond However, a linear relative-permeability1982 when two wells were on production. A 17x1OX5, functi~n caused MULTISIM to oscillate and to run850-grid-block, three-dimensional cartesian, very slowly. Therefore, Corey function exponentsvariable-mesh grid was used. Grid-block porosity as small as practical (about 1.5) were used. Theand y-direction permeability were defined to be a variable-mesh grid caused significant cusping-likefunction of elevation to include the variable-width flow artifacts with this model. This is due ingeometry. The variable-sized grid was used to keep part to the solution routine and is aggravated bya practical number of grid blocks and to keep the contrasting grid block widths. To minimize thisproducer grid blocks a reasonable size for coning effect, the Corey function exponent for the gaspseudo-relative-permeabilityfunctions. The50x50x35-foot producer grid block size is large
phase was made as small as possible.
enough to acconnnodatethe gross dimensions of the Relatively few simulations were made with thisgas and the water cones based on the 2-D coning model because of the long computer timemodel results. Larger grid blocks would dwarf the experienced. The 850-grid-block simulationcone and make the use of pseudo functions required 7,500 to 10,000 CPU seconds to simulateineffective. about eight years of pilot history on a CRAY
X-MP/14 computer.The coning pseudo functions were constructed
from 2-D radial simulations in a ~anner similar to The method of achieving the match ofthe technique used by Woods et al . The procedure production data was to make minor alterations towas: relative-permeability functions and pore volume.
The pore volume from the final match run was the(a) model the displacement at several, same as defined by the coning model and the 2-0
constant rates, vertical cross-section simulation that matched theCO frontal advance rate. The match illustrated on
(b) average the saturations at several times Fit. 14 shows oil, water and gas production volumesduring the displacement from each of the for Wells A-17 and A-18 compared to history.constant-rate simulations over theradial-model grid-block range that The agreement is not perfect but it isrepresents in size the 3-D model acceptable. Improvements could be made withproduction grid block, further adjustments to relative-permeability input
for grid-block flow and for well production. The(c) record reservoir-condition fractional significant features of pilot performance are
flow for each production phase, and represented in the history match. As with theconing model, prediction of CO production volumes
(d) solve for the oil relative permeability $was understated by about 30 pe cent. In bothassuming phase viscosities and models, CO production was relatively insensitivewater-phase and vapor-phase 8to simulat r input such as relative permeabilitiesrelative-permeability functions. The end and grid block size. Increased dispersion did notproduct is a,table of improve the match. Only an exaggerated change inrelative-permeability values representing the boundaries of the two-phase region on ternaryeach of the constant-rate simulations. diagrams increased the CO production volume. This
zalteration is not support d by experimental dataThe water relative-permeability function was and is not used in the reported results.
selected from the simulation period prior to the Similarly, scouting studies with a mixing parameterinvasion of mobile gas into the grid blocks of model show no improvement in C02 volume prediction.interest. Similarly, the gas relative-permeabilityfunction was selected from later simulation times Composition and saturation paths and historieswhen water mobility was low. The resultant coning discussed earlier and plotted on Fig. 13 show thepseudo-relative-permeabilityinput data were significant features of the process. Similarly,assigned to Wells A-17 and A-18 based on the the modeled outflow performance on Fig. 15 providesrelative position of the perforations in their 3-D added understanding of the pilot. These plots aremodel grid block and based on well voidage rates.Only three such tables were used. A greater number
phase flow rate and fractional flow rate historiesat simulated bottomhole conditions for Well A-17
of tables could more accurately account for changes from the 3-D model. The illustrations provide ain voidage rate. visualization of process mechanisms showing that
after gas breakthrough, liquid oil production isThe oil-water relative permeability and primarily from the vapor phase at the wellbore.
capillary-pressure functions used in the 3-D model
I
.
6 WEEKS ISLAND GRAVITY STABLE C02P1L0T SPE/DOE 17351
CONCLUSIONS AND SUMMARY
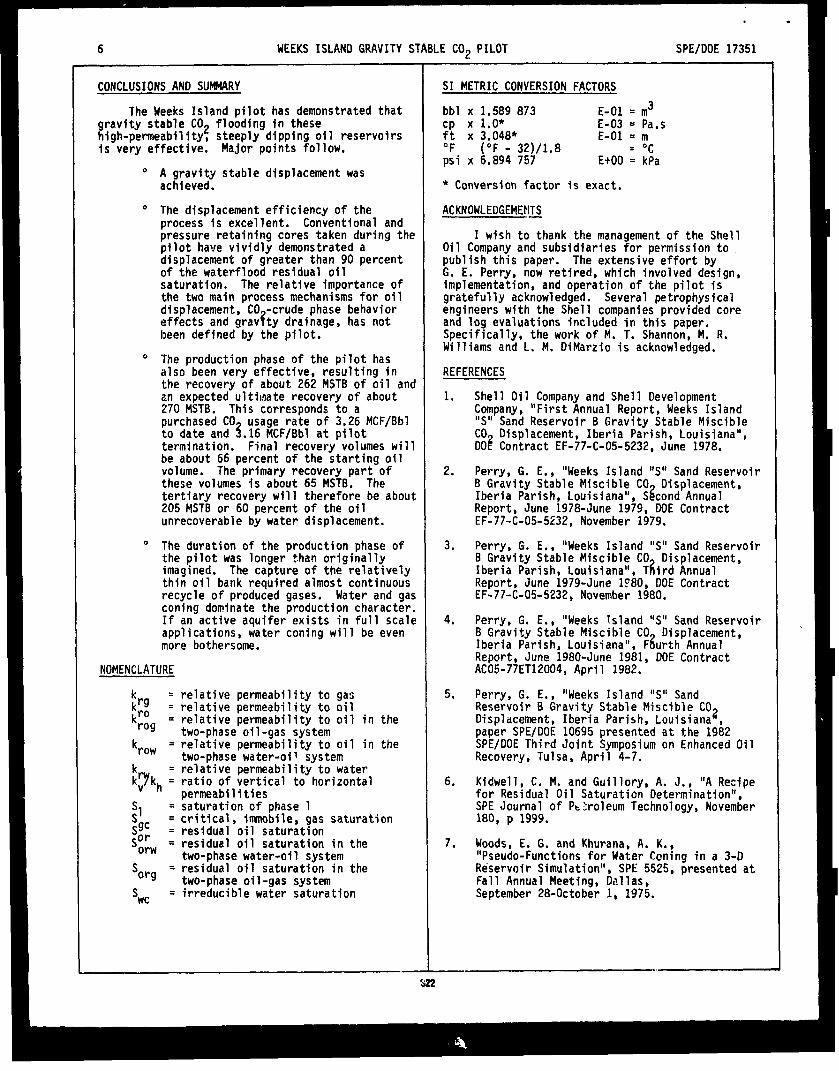
The!deeks Island pilot has demonstrated thatgravity stable C02 flooding in thesehigh-permeability, steeply dipping oil reservoirsis very effective, Major points follow.
0
0
0
0
A gravity stable displacement wasachieved.
The displacement efficiency of theprocess is excellent. Conventional andpressure retaining cores taken during thepilot have vividly demonstrated adisplacement of greater than 90 percentof the waterflood residual oilsaturation. The relative importance ofthe two main process mechanisms for oildisplacement, CO -crude phase behavior
?effects and grav ty drainage, has notbeen defined by the pilot.
The production phase of the pilot hasalso been very effective, resulting inthe recovery of about 262 MSTB of oil andan expected ultimate recovery of about270 MSTB. This corresponds to apurchased CO usage rate of 3.26MCF/Bblto date and $.~:n~~F{~;~v;:yp~$~mes willtermination.be about 66 percent of the starting oilvolume. The primary recovery part ofthese volumes is about 65 MSTB. Thetertiary recovery will therefore be about205MSTB or 60 percent of the oilunrecoverable by water displacement.
The duration of the rn’oductiontihaSeofthe pilot was longer’than originallyimagined. The capture of the relativelythin oil bank required almost continuousrecycle of produced gases. Water and gasconing dominate the production character.If an active aquifer exists in full scaleapplications, water coning will be evenmore bothersome.
NOMENCLATURE
k .k:: =krog =
krow =
k=k~kh =
:1 :Sgc .s;~ =
sorg =
L_sWc =
relative oermeabilitv to aasrelative permeabi’relative permeabi”two-phase oil-gasrelative permeabi’two-phase water-orelative permeabi’ratio of verticalDermeabilities
i[y to ;ility to oil in thesysternity to oil in the1 systemity to waterto horizontal
saturation of phase 1critical, i!mnobile,gas saturationresidual oil saturationresidual oil saturation in thetwo-phase water-oil systemresidual oil saturation in thetwo-Dhase oil-aas svstemirreducible wa{er s~turation
S1 METRIC CONVERSION FACTORS
bbl X 1.589873 E-01 = m3Cp x 1.0* E-03 = Pasft X 3.048* E-01 = m“F (“F - 32)/1.8 = “cpsi x 6.894 757 E+OO = kPa
* Conversion factor is exact.
ACKNOWLEDGEMENTS—
I wish to thank the management of the ShellOil Company and subsidiaries for permission to,publish this paper. The extensive effort byG. E. Perry, now retired, which involved design,implementation, and operation of the pilot isgratefully acknowledged. Several petrophysicalengineers with the Shell companies provided coreand log evaluations included in this paper.Specifically, the work ofM. T. Shannon, M. R.Williams and L. M. CliMarziois acknowledged.
REFERENCES
1.
2.
3.
4.
5.
6.
7.
Shell Oi’Company,“S” SandCO- DisD”
Company and Shell Development“FirstAnnual Report, Weeks IslandReservoir B Gravity Stable Miscibleacement. Iberia Parish. Louisiana”.
DOg Contract EF-77-C-05-5232, June 1978. -
Perry, G. E., “Weeks Island “S” Sand ReservoirB Gravity Stable Miscible CO Displacement,
2Iberia Parish, Louisiana”, S cond AnnualReport, June 1978-June 1979, DOE ContractEF-77-C-05-5232, November 1979.
Perry, G. E., “Weeks Island “S” Sand ReservoirB Gravity Stable Miscible CO Displacement,
$“Iberia Parish, Louisiana”, T lrd AnnualReport, June 1979-June 1~80, DOE ContractEF-77-C-05-5232, November 1980.
Perry, G. E., “Weeks Island “S” Sand ReservoirB Gravity Stable Miscible CO Displacement,
iIberia Parish, Louisiana”, F urth AnnualReport, June 1980-June 1981, DOE ContractAC05-77ET12004, Apri1 1982.
Perry, G. E., “Weeks Island “S” SandReservoir B Gravity Stable Miscible C02Displacement, Iberia Parish, Louisiana ,paper SPE/DOE 10695 presented at the 1982SPE/DOE Third Joint Symposium on Enhanced OilRecovery, Tulsa, April 4-7.
Kidwell, C. M. and Guillory, A. J., “A Recipefor Residual Oil Saturation Determination”,SPE Journal of Pttroleum Technology, November180, p 1999.
Woods, E, G. and Khurana, A. K.,“Pseudo-Functions for Water Coning in a 3-DReservoir Simulation”, SPE 5525, presented atFall Annual Meeting, Dallas,September 28-October 1, 1975.
●
‘s22

T.sble1S R8 Param-nd Vo1unes
Originaloil in placeOriginalgas cap sizeGrJsccP areaOil webOi1 zone net payReservoirpreswrti@-12,W0’:
OriginalDuringpilot
AverageporosityAveragepermaabilityOil formationvolunwfactorGas Cap formationvol factorvolumes8 10/78(pilotstart):
Oi1 producedOil-well-gasproducedOil in place
3.0 14UB37.7 BCF61 acres29 acres
186 feet
6013 p5i4;gg psi
1.2 darcy1,62 at 6013 psi.00358RCF/SCFat Pi
2.61 t#4B2.84 t@iCF408 USTB
Table2Re~”lt$of Sh6Z_W6dUCtiOn Tests
Hell A-lB
Measured oil SalinityArchle ca~~,dOepth Productionpm Cl- n Sw
12,928-29 44%oil 3,950 1.99 31%
12,945-49 Traceoil 13,300 1,99 40%
12,963-65 Traceoil 29,700 2.12 61%
Table3Summaryof Pilot Inje-nd ProductionVolumes
VolumesThrough1987
OecembarAverage Cumulative(MCF/Oor BPO) (144CFor Hi)
InjectioncoNa?uralGasTotalGasMater
ProductionOi1~ter Cut (%)
To?alGasGOR (MCF/Bbl)
8818370677.9
243236796111763
261.5
2i65623523.8
To Date ProcessStatisties
Oil Recwery: 64,1gof oil in placeat startof pilotC02 Usage: 7.90f4CF/BOtotal injection)
[3.26MCF/BO purchasedC02)
able 4BubblePoin- Composition
Component
carbondioxidenitrogenmethaneethanepropaneiso-butanen-butaneiso-pentanen-pentanehexanes
Mole Fraction
.0061
.0043
.5772
.0293
.0155
.0057::::;
.0049
.0121
Subtotal
heptanesplus
Total
Oowc /3058Esr8E61UNINCGOC 12760
A-18
.6690
.3310
1.0000
WEEKS ISLANDC02 PILOT
“S”SANDSTRUCTURE
PILOTWELLS
A CO?INJECTORS● PROOUCERSA WATERPIIOOJINJ.
o 500’
SCALE
Fig.1—S RB structuremap.
323SPE 17551

.
/---------.J;;;,:--.-t....fl
-.
;%~gg:gg
g.................................
a
.............................................................................................................................................................................
.
0m
]ti J’y-m#-~.......................................................................RW$ ...... .... .. .................... ..................................ki : ““’o’”” .m g .......... ““d”””-””””~ ~~ ~~~~~~~~~~~.............................................................
I.i+dsppe.msmew
q+dep pe.mmw
324
SI% 17351

1.....,,.,.;...............................
x:m:2.:n:
# . . . . . .
Tg“
-=
:
&
-Jd
.-L8
h.
.
,
s0aCJ
Is

3-Phase Kro Model
100%Sg
A\‘\
\
/Kro ~ ‘\,“+ >,,,
+ ?’,+ ‘\ k
‘,1O(I● Sw 100% so
1nZ-phaaaell-water :’
0,8 ,.,
0.6
,..
0.4,..’
...
0,2 ,..”.,”
0 ““’”””O 0.2 0.4 0.6 0.8 1
● Kro CXP= 2,1——
● K~,,,,.oxp=,3:9
Swl,-mgsts~?i$fd
0,8 ‘:,,
● Kro0,6 “c,,
Oxp= 3.5
“ !%I .....!I?=.I?..,,,
0.4 ‘.,...
0“1-i24-JO 0.2 0.4 0.6 0.8 1
Iiquldsaturation
FIs. 10–Fldatlv# pmno.bllltf functions for mnlng nwd.1,
WI A-V
i
!
o 0.2 0,4 od OaSotumtlon
o OiWatk Mwotlon
Fig. i 1–S. profile hlmofy match mu! P.C.WW, contv mrdd.
ACNAL
,.
/
...’
p-, _, :,;”,,.
,---
400
Soo
200
100
100
:0
60
=,2 ~.-8,../
,’ 0
,,
i’ 4
,’,,--,.,
,’ 1-------~‘../---
0et 82
Year
FIQ,12-W.11A.;?prcductl.mhlstwyfn.tch, cunl~ nwdol,

1
0.8
0.6
0.4
0.2
01
0.8
0.6
0.4
0.2
0
time
Fig, 13-Comp8111c.n mtd wlwallo. ps!hs and hibt.arlea, r,c.r.lng mcdbl
YEAR
S RB A-18
F1o. 14-3.D mtiet proauctlon IWorq match, Wells A.f7 hnd A.18.
two
4doo
moo
$1000
1000
0
81 82 83 84 S5 as
FroctionolFlow1,00
0.75
0.s0
0.2s
0.00St 02 93 84 85 83
YearFig. 15—Well A.f7 model+d remw.alr condition oult!ow pwlormance, 3.D model.
SPE 17351