Embed Size (px)
Citation preview

Special Eurobarometer 459
Survey requested by the European Commission, Directorate-General for Climate Action and co-ordinated by the Directorate-
General for Communication
This document does not represent the point of view of the European Commission. The interpretations and opinions contained in it are solely those of the authors.
Special Eurobarometer 459 – Wave EB87.1 – TNS opinion & social
Climate change
Report
Fieldwork
March 2017 Publication
September 2017
Special Eurobarometer 459
Report
Climate Change
March 2017
Survey conducted by TNS political & social at the request of the European Commission,
Directorate-General for Climate Action (DG CLIMA)
Survey co-ordinated by the European Commission, Directorate-General for Communication (DG COMM “Media monitoring and analysis” Unit)
Project number 2017.4763 Project title Special Eurobarometer 459 “Climate Change”
Report Language version EN Catalogue number ML-04-17-622-EN-N ISBN 978-92-79-70220-4 doi:10.2834/92702 © European Union, 2017
http://ec.europa.eu/commfrontoffice/publicopinion

1
Climate Change March 2017
Report
Special Eurobarometer 459
TABLE OF CONTENTS INTRODUCTION 2EXECUTIVE SUMMARY 5I. EUROPEAN PERCEPTIONS OF CLIMATE CHANGE 6
1 Perceptions of climate change as a global problem 62 Perceived seriousness of climate change 18
II. TAKING ACTION TO TACKLE CLIMATE CHANGE 231 Responsibility for tackling climate change 232 Personal action to tackle climate change 313 Types of individual action 36
III. ATTITUDES TOWARDS FIGHTING CLIMATE CHANGE AND TRANSITION TO
CLEAN ENERGIES 45
1 Attitudes towards fighting climate change 452 Attitudes towards reducing fossil fuel imports 503 Attitudes towards the economic benefits of promoting EU expertise in clean technologies outside the EU 584 Attitudes towards public financial support to clean energies vis-à-vis subsidies to fossil fuels 61
IV. LOOKING TO THE FUTURE 641 Targets for renewable energy 642 Energy efficiency targets 69
CONCLUSION 73
ANNEXES Technical specifications
Questionnaire
Tables

2
Climate Change March 2017
Report
Special Eurobarometer 459
INTRODUCTION
Climate change represents one of the biggest challenges for humankind in the 21st century and taking action to address it is one of the top priorities for the European Union (EU).
By 2012, the average global surface temperature was 0.85°C higher than in 1880, according to the UN Intergovernmental Panel on Climate Change (IPCC), which brings together thousands of the world’s leading climate scientists. In addition, each of the past three decades has been warmer than any preceding decade since records began in 1850.
There is widespread consensus within the scientific community that these changes are caused by greenhouse gases emitted due to human activity, and particularly by carbon dioxide (CO2), which is at its highest level for at least 800,000 years.
According to the ‘Climate change, impacts and vulnerability in Europe 2016’ report by the European Environment Agency1, climate change is also affecting ecosystems, economic sectors and human health and well-being in Europe. Average European temperatures and sea levels are rising, while sea ice in the Arctic region is shrinking. Precipitation patterns are changing, generally making wet regions in Europe wetter and dry regions drier. At the same time, climate-related extremes such as heatwaves, heavy rainfall and droughts are increasing in frequency and intensity in many regions.
This Eurobarometer survey comes after the historic United Nations Climate Change Conference (COP21) held in December 2015 in Paris, where 195 countries agreed on the world's first universal action plan to tackle climate change by limiting global warming to ‘well below’ 2°C.
The EU has set itself ambitious greenhouse gas emissions reduction targets for 2030, on top of targets for 2020, under a wider 2030 climate and energy package which sets three key objectives: at least a 40% cut in greenhouse gas emissions (from 1990 levels); at least a 27% share for renewable energy; and at least a 27% improvement in energy efficiency (potentially rising to 30%)2. The European Commission has also issued a ‘roadmap’ for further EU emissions cuts by 20503.
The EU is on track to meet the targets under its 2020 climate and energy package: a 20% cut in greenhouse gas emissions (from 1990 levels); 20% of EU energy from renewables; and a 20% improvement in energy efficiency4. According to the Second Report on the State of the Energy Union5, EU emissions in 2015 were 22% below 1990 levels, while the economy grew by 50% over the same period6.
In 2016, the Commission also presented a European low-emission mobility strategy7. By mid-century, greenhouse gas emissions from transport should be at least 60% lower than in 1990 and be firmly on the path towards zero, while ensuring the mobility needs of people and goods as well as global connectivity.
1 http://www.eea.europa.eu/publications/climate-change-impacts-and-vulnerability-2016 2 https://ec.europa.eu/clima/policies/strategies/2030_en 3 COM (2011) 112: A Roadmap for moving to a competitive low carbon economy in 2050 (08 Mar 2011). 4 https://ec.europa.eu/clima/policies/strategies/2020_en 5 The Energy Union strategy launched in 2015 aims to ensure affordable, secure and sustainable energy for Europe and its citizens. The strategy will lead to a sustainable, low-carbon and environmentally friendly economy, putting Europe at the forefront of renewable energy production and the fight against climate change. 6 https://ec.europa.eu/commission/second-report-state-energy-union_en 7 http://europa.eu/rapid/press-release_MEMO-16-2497_en.htm

3
Climate Change March 2017
Report
Special Eurobarometer 459
Previous rounds of this Eurobarometer survey on climate change were carried out in 2008, 2009, 2011, 2013 and 2015. This latest edition of the report covers four main areas:
§ Perceptions of climate change: where climate change ranks alongside other global challenges, and how serious the problem of climate change itself is considered to be;
§ Taking action on climate change: who has primary responsibility for addressing the problem, and personal steps taken to help reduce greenhouse gas emissions;
§ Attitudes to fighting climate change and reducing fossil fuel imports: whether fighting climate change, reducing fossil fuel imports and promoting EU expertise in clean technologies is considered good for the economy; and whether more public financial support should be given to the transition to clean energies even if it means subsidies to fossil fuels are reduced;
§ Looking to the future: whether national governments should set targets for renewable energy, and whether they should support energy efficiency.
This survey was carried out by TNS opinion & social network in the 28 Member States of the European Union between 18 and 27 March 20178. 27,901 respondents from different social and demographic groups were interviewed face-to-face at home in their mother tongue on behalf of the Directorate-General for Climate Action (DG CLIMA). The methodology used is that of Eurobarometer surveys as carried out by the Directorate-General for Communication (“Media monitoring and analysis” Unit)9. A technical note on the manner in which interviews were conducted by the Institutes within the TNS opinion & social network is appended as an annex to this report. Also included are the interview methods and confidence intervals10.
8 It is important to note that this survey was conducted in late winter/early spring (March 2017), while the previous edition, Special Eurobarometer 435, was carried out in late spring/early summer (May-June 2015). The edition prior to that, Special Eurobarometer 409, was conducted in winter (November-December 2013). 9 http://ec.europa.eu/commfrontoffice/publicopinion/index.cfm 10 The results tables are included in the annex. It should be noted that the total of the percentages in the tables of this report may exceed 100% in cases where the respondent could give several answers to a question.

4
Climate Change March 2017
Report
Special Eurobarometer 459
Note: In this report, Member States are referred to by their official abbreviation. The abbreviations used in this report correspond to:
Belgium BE Lithuania LT Bulgaria BG Luxembourg LU Czech Republic CZ Hungary HU Denmark DK Malta MT Germany DE The Netherlands NL Estonia EE Austria AT Greece EL Poland PL Spain ES Portugal PT France FR Romania RO Croatia HR Slovenia SI Ireland IE Slovakia SK Italy IT Finland FI Republic of Cyprus* CY Sweden SE Latvia LV United Kingdom UK
European Union – weighted average for the 28 EU Member States EU28 * Cyprus as a whole is one of the 28 EU Member States. However, the acquis communautaire has been suspended in the part of the country not controlled by the government of the Republic of Cyprus. For practical reasons, only the interviews carried out in the part of the country controlled by the government of the Republic of Cyprus are included in the “CY” category and the EU28 average.
We wish to thank the people throughout Europe who have given their time to take part in this survey.
Without their active participation, this study would not have been possible.

5
Climate Change March 2017
Report
Special Eurobarometer 459
EXECUTIVE SUMMARY
- Around three-quarters of Europeans see climate change as a very serious problem -
§ Around three-quarters of European Union (EU) citizens (74%) consider climate change to be a very serious problem and more than nine in ten (92%) see it as a serious problem.
§ The share of respondents seeing climate change as a very serious problem has risen by 5 percentage points (pp) since the previous Eurobarometer survey in 2015 (69%). Differences between socio-demographic groups have also narrowed since 2015, indicative of a growing consensus.
§ Since 2015, there has been an increase of at least 5 pp in the proportion of citizens seeing climate change as a very serious problem (those rating it 7-10 out of 10) in 16 Member States.
§ Around one in ten EU citizens (12%) consider climate change to be the single most serious problem facing the world as a whole and more than four in ten (43%) see climate change as one of the most serious global problems.
§ The proportion of respondents who consider climate change to be the most serious global problem has increased since 2015 in six Member States, notably in the Netherlands (27%, +11 pp), Spain (13%, +5 pp) and Estonia (9%, +3 pp).
§ Climate change is now seen as the third most serious global problem, after poverty, hunger and lack of drinking water (28%) and international terrorism (24%). A notable change since the previous Eurobarometer is the decline of the economic situation and the rise of international terrorism among citizens' top concerns, with the economic situation now fifth.
§ As in 2015, there are some notable regional variations. Climate change is seen as the single most serious problem facing the world in Sweden (38%) and Denmark (29%), while this view is held by fewer than one in ten respondents in parts of Eastern and Southern Europe.
- 90% of Europeans say that they have personally taken action to fight climate change -
§ Nearly half of EU citizens say they have personally taken action to fight climate change in the past six months (49%), yet when given examples this rises to 90%. The share of respondents who have taken at least one personal action has fallen by 4 pp since 2015. However, over seven in ten (71%) reduce their waste and regularly separate it for recycling.
§ Over four in ten respondents (43%) think national governments are responsible for tackling climate change, while just under four in ten think the EU (39%) and business and industry (38%) have responsibility.
§ A large majority of EU citizens agree that fighting climate change and using energy more efficiently can boost the economy and jobs in the EU (79%) and that promoting EU expertise in new clean technologies to countries outside the EU (77%) and reducing fossil fuel imports from outside the EU (65%) can benefit the EU economically.
§ Similarly, a clear majority of citizens agree that reducing fossil fuel imports can increase the security of EU energy supplies (64%) and that more public financial support should be given to the transition to clean energies even if it means reducing fossil fuels subsidies (79%).
§ An overwhelming majority of respondents also believe it is important for their national government to set targets to increase the amount of renewable energy used (89%) and provide support for improving energy efficiency (88%) by 2030.

6
Climate Change March 2017
Report
Special Eurobarometer 459
I. EUROPEAN PERCEPTIONS OF CLIMATE CHANGE
At the start of the survey, respondents were asked what they consider to be the single most serious problem facing the world. They were also asked what they believe are the other most serious global problems. Respondents were then asked how serious a problem they consider climate change to be.
1 Perceptions of climate change as a global problem
- More than one in ten respondents think climate change is the single most serious problem facing the world -
Respondents were given a list of problems currently facing the world as a whole and asked which they consider to be the single most serious one11 12.
Poverty, hunger and lack of drinking water is mentioned by almost three in ten respondents (28%) as the most serious problem facing the world. Just under a quarter of people (24%) think that international terrorism is the most serious problem, while around one in ten choose climate change (12%), the economic situation (9%) and armed conflicts (9%). Finally, fewer than one in ten respondents consider the proliferation of nuclear weapons (6%), the increasing global population (6%) or the spread of infectious diseases (3%) to be the single most serious global problem.
Despite a drop of 3 percentage points (pp) since 2015, climate change is now considered the third single most serious global problem (fourth in 2015). This is mainly due to a big decline in the proportion of Europeans citing the economic situation (the third most mentioned problem in 2015), which, after having surged in 2013, has fallen consistently in the past two surveys (-8 pp in 2015; -7 pp in 2017).
11 QC1a: Which of the following do you consider to be the single most serious problem facing the world as a whole? 12 The order in which the possible answers were listed was rotated for each respondent. This was not the case in the previous survey in 2015 (Special Eurobarometer 435), when the possible answers were always listed in the same order.
QC1a Whichofthefollowingdoyouconsidertobethesinglemostseriousproblemfacingtheworldasa
whole?
(%-EU28)
28
24
12
9
9
6
6
3
1
1
1
30
19
15
9
16
4
2
3
1
1
35
8
16
4
24
5
3
3
1
1
28
11
20
4
16
5
3
4
2
POVERTY,HUNGERAND
LACKOFDRINKINGWATER
INTERNATIONAL TERRORISM
CLIMATECHANGE
ARMEDCONFLICTS
THEECONOMIC SITUATION
THEINCREASINGGLOBALPOPULATION
PROLIFERATIONOFNUCLEARWEAPONS
SPREADOFINFECTIOUSDISEASES
OTHER(SPONTANEOUS)
NONE(SPONTANEOUS)
DON'TKNOW
Mar.2017 May-June2015 Nov.-Dec.2013 June2011

7
Climate Change March 2017
Report
Special Eurobarometer 459
The largest increases are seen in the proportions of respondents who think that international terrorism (24%, +5 percentage points) and the proliferation of nuclear weapons (6%, +4 pp) are the single most serious global problems. There is also a slight increase in the proportion who are most concerned about the world's increasing population (6%, +2 pp).
Conversely, the proportion of individuals who consider poverty, hunger and lack of drinking water (28%, -2 pp) to be the single most serious problem facing the world has fallen slightly since 2015.
Finally, the proportions of respondents who are most concerned about armed conflicts (9%) and the spread of infectious diseases (3%) have remained the same since 2015.
The following map shows the EU Member States in which respondents are most likely to see climate change as the single most serious problem facing the world. In three Member States, at least a quarter of respondents say that climate change is the most serious problem: Sweden (38%), Denmark (29%) and the Netherlands (27%). At the other end of the scale, fewer than one in ten respondents consider it to be the most serious problem in 13 Member States, with the lowest scores in Portugal and Greece (both 4%) and the Czech Republic and Poland (both 6%).

8
Climate Change March 2017
Report
Special Eurobarometer 459
A relative majority of respondents identify poverty, hunger and lack of drinking water as the single most serious problem facing the world as a whole in 18 Member States, led by Spain (40%), Luxembourg (38%) and France (37%). By contrast, people in Poland (16%), Estonia and Italy (both 17%) are the least likely to choose this problem.
International terrorism is seen as the single most serious problem facing the world in six Member States, notably in Malta (44%), the Czech Republic (39%) and Estonia and Italy (both 32%). However, fewer than one in six respondents in Greece (11%) and Spain and Sweden (both 14%) choose this answer. In Latvia, equal proportions of respondents mention poverty, hunger and lack of drinking water and international terrorism (20%).
In two Member States, climate change is seen as the single most serious global problem: Sweden (38%) and Denmark (29%). The economic situation is seen as the single most serious global problem in only one Member State, Greece, where just over a third of respondents (36%) give this answer.
Since 2015, some Member States have seen noticeable changes in the proportions of respondents who consider certain issues to be the single most serious problem facing the world as a whole:
§ The proportion of respondents who consider climate change to be the single most serious problem facing the world has increased since 2015 in six Member States, especially the Netherlands (27%, +11 pp), Spain (13%, +5 pp) and Estonia (9%, +3 pp). The proportion of respondents choosing climate change has fallen most in Slovenia (11%, -14 pp), Germany (14%, -12 pp) and Croatia (8%, -9 pp).
§ The proportion of respondents who think that poverty, hunger and lack of drinking water is the single most serious global problem has increased slightly in eight Member States since 2015. The biggest increases can be found in Cyprus (36%, +5 pp), Germany (32%, +4 pp), Slovakia (31%, +3 pp) and Finland (27%, +3 pp). The proportion has declined most in Portugal (34%, -13 pp), Spain (40%, -11 pp) and Romania (26%, -10 pp).
QC1a Whichofthefollowingdoyouconsidertobethesinglemostseriousproblemfacingtheworldasawhole?(%-THEMOSTMENTIONEDANSWERBYCOUNTRY)
40 38 37 36 35 35 34 34 34 32 31 30 28 28 27 26 26 26 242020
4439
32 32 30 29
38
29
36
ES LU FR CY HU SI IE HR PT DE SK NL EU28 BE FI AT RO UK LT LV MT CZ EE IT PL BG SE DK EL
Poverty,hungerandlackofdrinkingwater Internationalterrorism Climatechange Theeconomicsituation

9
Climate Change March 2017
Report
Special Eurobarometer 459
§ The proportion of respondents citing international terrorism has increased in 23 of the 28 Member States, led by Portugal (30%, +22 pp), the Czech Republic (39%, +15 pp), Estonia (32%, +14 pp) and Bulgaria (29%, +14 pp). It has fallen only in the Netherlands (17%, -5 pp), Belgium (23%, -4 pp) and the United Kingdom (25%, -3 pp).
§ Reflecting the EU-wide results, ratings for armed conflicts have remained largely stable in all Member States. The largest increases are seen in Croatia (10%, +5 pp) and Slovenia (8%, +5 pp), while the biggest decreases can be seen in Estonia (18%, -7 pp), Latvia (19%, -7 pp) and Poland (18%, -6 pp).
§ The proportion of respondents naming the economic situation has declined in all Member States but one (it remained the same in Greece). The biggest falls can be seen in Cyprus (17%, -17 pp), Bulgaria (9%, -16 pp), Croatia (13%, -14 pp) and Hungary (6%, -14 pp).

10
Climate Change March 2017
Report
Special Eurobarometer 459
QC1a
Poverty,hun
gera
ndlackofd
rinking
water
2017-
2015
Internationalterrorism
2017-
2015
Clim
atechange
2017-
2015
Armed
con
flicts
2017-
2015
Theecon
omicsituation
2017-
2015
EU28 28 2 24 5 12 3 9 = 9 7
BE 28 1 23 4 17 2 7 1 8 6BG 27 1 29 14 7 6 11 = 9 16CZ 19 3 39 15 6 2 11 3 7 10DK 21 7 20 2 29 1 9 = 2 2DE 32 4 21 1 14 12 12 1 2 3EE 17 1 32 14 9 3 18 7 5 12IE 34 7 23 8 13 2 6 = 11 3EL 35 6 11 6 4 5 5 2 36 =ES 40 11 14 6 13 5 6 4 18 8FR 37 1 24 = 14 4 7 3 4 8HR 34 = 22 12 8 9 10 5 13 14IT 17 = 32 8 7 2 6 = 21 11CY 36 5 20 8 8 3 8 4 17 17LV 20 3 20 6 9 2 19 7 9 7LT 24 2 22 11 8 4 15 3 12 9LU 38 = 21 = 12 6 8 1 4 2HU 35 1 20 11 10 4 7 4 6 14MT 22 1 44 4 13 3 4 = 2 4NL 30 1 17 5 27 11 8 4 1 5AT 26 1 17 6 16 3 10 = 11 8PL 16 2 30 10 6 5 18 6 4 9PT 34 13 30 22 4 1 7 2 12 10RO 26 10 20 10 9 3 9 4 14 10SI 35 = 22 13 11 14 8 5 10 8SK 31 3 23 7 8 5 13 = 8 11FI 27 3 18 4 20 6 11 2 3 3SE 23 5 14 2 38 1 10 = 2 1UK 26 4 25 3 14 = 8 = 4 2
Which of the following do you consider to be the single most seriousproblemfacingtheworldasawhole?(%)

11
Climate Change March 2017
Report
Special Eurobarometer 459
After having identified what they saw as the single most serious problem facing the world, respondents were asked what other problems they considered to be serious, naming up to a maximum of three13 14. The results of both questions combined are as follows:
Poverty, hunger and lack of drinking water is considered by seven in ten respondents (70%) to be among the most serious problems. International terrorism is mentioned by more than six in ten respondents (62%), while slightly over four in ten mention climate change (43%). Although only 9% of respondents think that armed conflicts are the single most serious problem, more than four in ten (42%), nevertheless consider them to be a serious problem. Just over a third of respondents (34%) name the economic situation and just over a quarter (27%) cite the proliferation of nuclear weapons. Finally, nearly a quarter of respondents identify the increasing global population (23%) and the spread of infectious diseases (22%) as among the most serious global problems.
Although climate change is now the third most mentioned problem, respondents are less likely to mention it than in 2015 (-4 pp), and the proportion doing so has consistently decreased over the last six years (-8 pp since 2011). A much sharper decline can be observed in the proportion mentioning the economic situation: -13 pp since 2015 and -24 pp compared with 2013. Conversely, respondents are much more likely to mention international terrorism than in 2015 (+6 pp) and this trend is even more evident when compared with 2013 (+26 pp).
Since 2015, there have also been increases in the proportions of respondents citing the proliferation of nuclear weapons (27%, +11 pp) and the increasing global population (23%, +4 pp) as serious problems facing the world, while the proportion citing armed conflicts (42%, +1 pp) has remained largely stable.
In the same way, stability can be observed in the proportion of respondents for whom poverty, hunger and lack of drinking water (70%, -1 pp) is among the most serious problems. Meanwhile, the proportion mentioning the spread of infectious diseases (22%) has remained the same since 2015.
13 QC1b: Which others do you consider to be serious problems? 14 The order in which the possible answers were listed was rotated for each respondent. This was not the case in the previous survey in 2015 (Special Eurobarometer 435), when the possible answers were always listed in the same order.
QC1T Whichofthefollowingdoyouconsidertobethesinglemostseriousproblemfacingtheworldasa
whole?Whichothersdoyouconsidertobeseriousproblems?(MAX.4ANSWERS)
(%-EU28)
70
62
43
42
34
27
23
22
2
1
1
71
56
47
41
47
16
19
22
3
1
1
76
36
50
31
58
19
20
20
2
1
1
64
38
51
28
45
18
21
27
1
2
POVERTY,HUNGERAND
LACKOFDRINKINGWATER
INTERNATIONAL TERRORISM
CLIMATECHANGE
ARMEDCONFLICTS
THEECONOMIC SITUATION
PROLIFERATIONOFNUCLEARWEAPONS
THEINCREASINGGLOBALPOPULATION
SPREADOFINFECTIOUSDISEASES
OTHER(SPONTANEOUS)
NONE(SPONTANEOUS)
DON'TKNOW
Mar.2017 May-June2015 Nov.-Dec.2013 June2011
MAX. 4 ANSWERS

12
Climate Change March 2017
Report
Special Eurobarometer 459
At national level, around three-quarters of respondents in Sweden (76%) think that climate change is one of the most serious problems facing the world as a whole. Around seven in ten also give this answer in the Netherlands (71%) and Denmark (69%). Respondents are least likely to give this answer in the Czech Republic (22%) and Portugal and Poland (both 27%).
MAX. 4 ANSWERS
Poverty, hunger and lack of drinking water is the most commonly cited serious problem in 19 Member States, led by Spain, Cyprus and Sweden (all 81%). At the lower end of the scale, over half of respondents in Poland (52%), Italy (54%) and Latvia (57%) agree, still considerably high results.
In eight Member States, international terrorism is the most cited problem. This issue is chosen the most in Malta (77%), the Czech Republic (76%) and Portugal (71%). The lowest proportions – though still relatively high – can be observed in Greece (52%), Sweden and Romania (both 53%), but are still relatively high.
Armed conflicts are cited most in Poland (60%), Lithuania (59%) and Estonia (58%) but chosen least in Malta (31%) and Ireland and Romania (both 32%).
The economic situation is the top answer in only one Member State (Greece, 81%), but is identified as the second most serious problems in Cyprus (61%) and Spain (59%). At the other end of the scale, respondents in Malta (14%), the Netherlands (15%) and Sweden and Germany (both 16%) are the least likely to cite this issue.
The proliferation of nuclear weapons is named most in the Czech Republic (42%), Poland (37%) and Lithuania, Bulgaria and Finland (all 36%) and least in Spain (17%), Estonia (20%) and the United Kingdom, Romania, Ireland, the Netherlands and Cyprus (all 24%).
13
Climate Change March 2017
Report
Special Eurobarometer 459
The increasing global population is the most commonly chosen answer in Denmark (39%), the Netherlands (38%) and Austria (37%) this year. At the other extreme, no more than one in ten respondents in Cyprus (6%), Portugal, Spain and Lithuania (all 10%) give this answer.
More than four in ten respondents in Hungary (43%) and nearly four in ten in Romania (39%) and Latvia (37%) consider the spread of infectious diseases to be one of the most serious global problems. This is cited the least by respondents in Spain (13%), Germany (15%) and Belgium (16%).
There have been some substantial shifts in responses since the last survey in 2015.
§ The Netherlands (71%, +17 pp) is the only Member State with a sharp increase in the proportion of respondents naming climate change as one of the most serious problems facing the world today. Since the previous survey in 2015, the proportions citing climate change have fallen most markedly in Slovenia (46%, -15 pp), Greece (34%, -14 pp), Bulgaria (30%, -13 pp) and Germany (53%, -12 pp).
§ Since the last survey, the proportion of respondents citing international terrorism has risen dramatically in Portugal (71%, +25 pp), Cyprus (69%, +24 pp) and Lithuania (64%, +22 pp). The Netherlands is the only Member State where this proportion has fallen (61%, -3 pp).
§ Poverty, hunger and lack of drinking water has gained ground since 2015 in Malta (72%, +8 pp), Germany (79%, +7 pp), Finland (73%, +6 pp) and Estonia (59%, +6 pp). The response is cited less but still seen as a significant problem in Portugal (79%, -12 pp), Spain (81%, -8 pp), Romania (62%, -8 pp) and Greece (80%, -7 pp).
§ Slovenia (35%, +15 pp), Croatia (44%, +15 pp) and Malta (31%, +13 pp) have witnessed a large increase in the proportion of respondents naming armed conflicts as one of the most serious global problems. Meanwhile, the largest decreases are seen in Latvia (52%, -7 pp), Estonia (58%, -6 pp) and the Netherlands (50%, -5 pp).
§ The share of respondents naming the economic situation has fallen in all 28 Member States since 2015, with the largest falls coming in Hungary (28%, -28 pp), Slovenia (38%, -27 pp), Slovakia (26%, -25 pp), Bulgaria (37%, -24 pp) and the Czech Republic (24%, -23 pp).

14
Climate Change March 2017
Report
Special Eurobarometer 459
MAX. 4 ANSWERS
QC1T
Poverty,hun
gera
ndlackofd
rinking
water
2017-
2015
Internationalterrorism
2017-
2015
Clim
atechange
2017-
2015
Armed
conflicts
2017-
2015
Theecon
omicsituation
2017-
2015
EU28 70 1 62 6 43 4 42 1 34 13
BE 65 2 62 = 53 2 41 5 31 11BG 62 4 68 12 30 13 48 3 37 24CZ 58 4 76 11 22 7 56 1 24 23DK 73 2 61 7 69 4 44 3 20 5DE 79 7 60 1 53 12 51 5 16 11EE 59 6 68 17 31 7 58 6 28 20IE 72 5 56 4 42 8 32 1 32 14EL 80 7 52 13 34 14 36 3 81 1ES 81 8 58 13 42 1 39 8 59 8FR 78 1 65 2 50 2 35 6 31 16HR 71 5 61 18 35 8 44 15 47 18IT 54 = 70 7 33 4 33 2 58 14CY 81 3 69 24 35 2 38 8 61 12LV 57 2 60 16 29 4 52 7 31 17LT 64 5 64 22 29 9 59 = 38 15LU 75 = 64 7 52 5 40 7 23 10HU 73 1 58 20 42 7 34 7 28 28MT 72 8 77 4 49 3 31 13 14 18NL 80 1 61 3 71 17 50 5 15 14AT 70 = 57 14 50 3 46 2 36 20PL 52 = 62 10 27 = 60 2 23 16PT 79 12 71 25 27 = 39 4 49 10RO 62 8 53 12 35 4 32 = 42 20SI 71 5 60 17 46 15 35 15 38 27SK 68 1 59 7 31 10 47 1 26 25FI 73 6 60 13 60 3 47 3 20 9SE 81 1 53 = 76 = 56 4 16 9UK 66 5 61 = 44 2 37 4 21 11
Which of the following do you consider to be the single most seriousproblem facing the world as a whole? Which others do you consider tobeseriousproblems?(MAX.4ANSWERS)(%)

15
Climate Change March 2017
Report
Special Eurobarometer 459
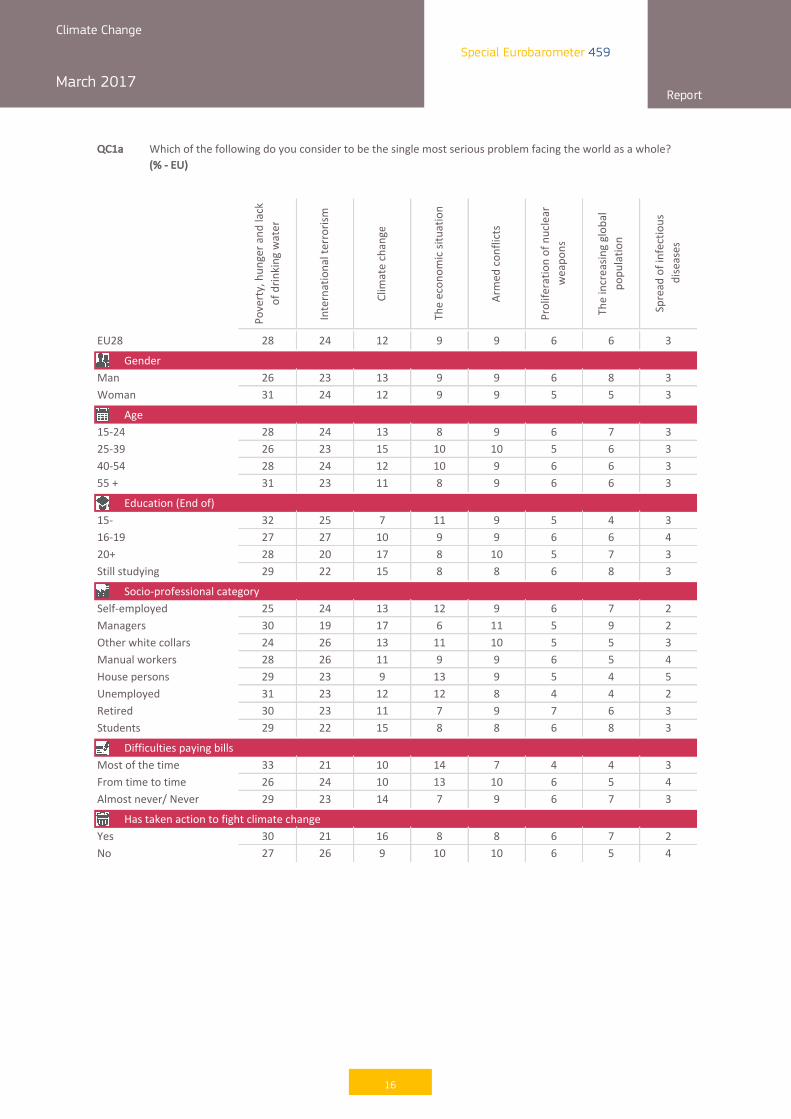
In terms of the single most serious problem, socio-demographic results indicate that:
§ Women (31%) are more likely than men (26%) to name poverty, hunger and lack of drinking water as the single most serious problem facing the world. There is almost no difference between the proportion of men (13%) and women (12%) who see climate change as the most serious global problem.
§ Respondents aged 55 or over are the most likely to name poverty, hunger and lack of drinking water as the single most serious global problem (31%). Respondents aged between 25 and 39 years are the least likely to express a similar view (26%), but are more likely than any other age group to choose climate change (15%).
§ Respondents educated to age 20 or over are most likely to think that climate change is the single most serious global problem (17%), while those who left school at or before the age of 15 are least likely to do so (7%). Those who ended full-time education at the age of 16-19 are the most likely to mention international terrorism (27% vs. 20% of those educated to age 20 or over). Respondents who left school aged 15 or younger (32%) are more likely than those educated to the age of 16-19 (27%) to think that poverty, hunger and lack of drinking water is the most serious problem.
§ Managers (17%) are the occupational group most likely to mention climate change as the single most serious issue facing the world, while only 9% of house persons and 11% of manual workers and retired people do so. Other white collar workers and manual workers (both 26%) are more likely than managers (19%) to think that international terrorism is the most serious problem. Unemployed people are the most likely to name poverty, hunger and lack of drinking water as the single most serious problem (31% vs. 24% of other white collar workers). House persons are the most likely to think the economic situation is the most serious problem (13% vs. 6% of managers). Finally, managers (9%) tend to cite the increasing global population more than house persons and the unemployed (both 4%).
§ Respondents who almost never face difficulties paying their bills are more likely than those who have difficulties most or some of the time to mention climate change (14% vs. 10%).
§ Unsurprisingly, those who have taken personal action to fight climate change (16%) are more likely than those who have not (9%) to see climate change as the most serious problem.
16
Climate Change March 2017
Report
Special Eurobarometer 459
QC1a
Poverty,hun
gera
ndlack
ofdrin
kingwater
Internationalterrorism
Clim
atechange
Theecon
omicsituation
Armed
conflicts
Prolife
ratio
nofnuclear
weapo
ns
Theincreasin
gglob
al
popu
latio
n
Spreadofinfectio
us
diseases
EU28 28 24 12 9 9 6 6 3
GenderMan 26 23 13 9 9 6 8 3Woman 31 24 12 9 9 5 5 3
Age15-24 28 24 13 8 9 6 7 325-39 26 23 15 10 10 5 6 340-54 28 24 12 10 9 6 6 355+ 31 23 11 8 9 6 6 3
Education(Endof)15- 32 25 7 11 9 5 4 316-19 27 27 10 9 9 6 6 420+ 28 20 17 8 10 5 7 3Stillstudying 29 22 15 8 8 6 8 3
Socio-professionalcategorySelf-employed 25 24 13 12 9 6 7 2Managers 30 19 17 6 11 5 9 2Otherwhitecollars 24 26 13 11 10 5 5 3Manualworkers 28 26 11 9 9 6 5 4Housepersons 29 23 9 13 9 5 4 5Unemployed 31 23 12 12 8 4 4 2Retired 30 23 11 7 9 7 6 3Students 29 22 15 8 8 6 8 3
DifficultiespayingbillsMostofthetime 33 21 10 14 7 4 4 3Fromtimetotime 26 24 10 13 10 6 5 4Almostnever/Never 29 23 14 7 9 6 7 3
HastakenactiontofightclimatechangeYes 30 21 16 8 8 6 7 2No 27 26 9 10 10 6 5 4
Whichofthefollowingdoyouconsidertobethesinglemostseriousproblemfacingtheworldasawhole?(%-EU)
17
Climate Change March 2017
Report
Special Eurobarometer 459
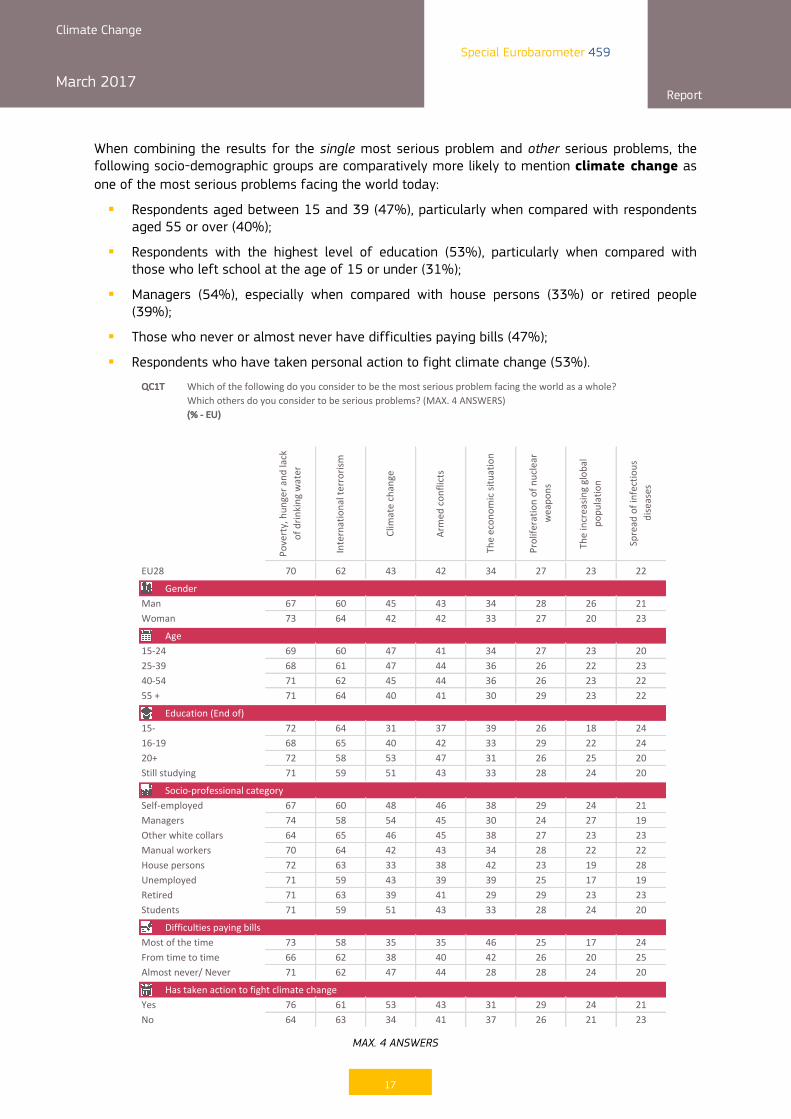
When combining the results for the single most serious problem and other serious problems, the following socio-demographic groups are comparatively more likely to mention climate change as one of the most serious problems facing the world today:
§ Respondents aged between 15 and 39 (47%), particularly when compared with respondents aged 55 or over (40%);
§ Respondents with the highest level of education (53%), particularly when compared with those who left school at the age of 15 or under (31%);
§ Managers (54%), especially when compared with house persons (33%) or retired people (39%);
§ Those who never or almost never have difficulties paying bills (47%);
§ Respondents who have taken personal action to fight climate change (53%).
MAX. 4 ANSWERS
QC1T
Poverty,hun
gera
ndlack
ofdrin
kingwater
Internationalterrorism
Clim
atechange
Armed
con
flicts
Theecon
omicsituation
Prolife
ratio
nofnuclear
weapo
ns
Theincreasin
gglob
al
popu
latio
n
Spreadofinfectio
us
diseases
EU28 70 62 43 42 34 27 23 22
GenderMan 67 60 45 43 34 28 26 21Woman 73 64 42 42 33 27 20 23
Age15-24 69 60 47 41 34 27 23 2025-39 68 61 47 44 36 26 22 2340-54 71 62 45 44 36 26 23 2255+ 71 64 40 41 30 29 23 22
Education(Endof)15- 72 64 31 37 39 26 18 2416-19 68 65 40 42 33 29 22 2420+ 72 58 53 47 31 26 25 20Stillstudying 71 59 51 43 33 28 24 20
Socio-professionalcategorySelf-employed 67 60 48 46 38 29 24 21Managers 74 58 54 45 30 24 27 19Otherwhitecollars 64 65 46 45 38 27 23 23Manualworkers 70 64 42 43 34 28 22 22Housepersons 72 63 33 38 42 23 19 28Unemployed 71 59 43 39 39 25 17 19Retired 71 63 39 41 29 29 23 23Students 71 59 51 43 33 28 24 20
DifficultiespayingbillsMostofthetime 73 58 35 35 46 25 17 24Fromtimetotime 66 62 38 40 42 26 20 25Almostnever/Never 71 62 47 44 28 28 24 20
HastakenactiontofightclimatechangeYes 76 61 53 43 31 29 24 21No 64 63 34 41 37 26 21 23
Whichofthefollowingdoyouconsidertobethemostseriousproblemfacingtheworldasawhole?Whichothersdoyouconsidertobeseriousproblems?(MAX.4ANSWERS)(%-EU)

18
Climate Change March 2017
Report
Special Eurobarometer 459
2 Perceived seriousness of climate change
Respondents were asked how serious a problem they perceive climate change to be today, choosing an answer from 1 to 10, where 10 means “an extremely serious problem” and 1 “not at all a serious problem”15. For the purpose of analysis, individual scores have been grouped together as follows:
§ Ratings of 7-10 – “A very serious problem”;
§ Ratings of 5-6 – “A fairly serious problem”;
§ Ratings of 1-4 – “Not a serious problem”.
- Around three-quarters of Europeans now see climate change as a very serious problem -
The average score of respondents seeing climate change as a very serious problem has increased slightly (7.7, +0.4 since 2015). Over a quarter of respondents (27%, +7 percentage points) see climate change as an extremely serious problem, rating it “10”.
Nearly three-quarters of respondents (74%, +5 pp) see climate change as a very serious problem (rating it 7-10), while almost one in five (18%, -4 pp) think it is a fairly serious problem (rating it 5-6). Fewer than one in ten (6%, -2 pp) think it is not a serious problem (scoring it 1-4).
There has been a notable increase of 5 pp in the proportion of respondents rating climate change as a very serious problem. This is significant, as the percentage remained stable from 2011 to 2015.
15 QC2: And how serious a problem do you think climate change is at this moment? Please use a scale from 1 to 10, with '1' meaning it is "not at all a serious problem" and '10' meaning it is "an extremely serious problem".
QC2R Andhowseriousaproblemdoyouthinkclimatechangeisatthismoment?Pleaseuseascalefrom1to10,with'1'meaningitis"notatallaseriousproblem"and'10'meaningitis"anextremelyseriousproblem".(%-EU28)
6
18
74
2
8
22
69
1
9
21
69
1
9
21
68
2
TOTAL'NOTASERIOUSPROBLEM'(1-4)
TOTAL'A FAIRLYSERIOUSPROBLEM' (5-6)
TOTAL'A VERYSERIOUSPROBLEM'(7-10)
DON'TKNOW
Mar.2017 May-June2015 Nov.-Dec.2013 June2011
19
Climate Change March 2017
Report
Special Eurobarometer 459
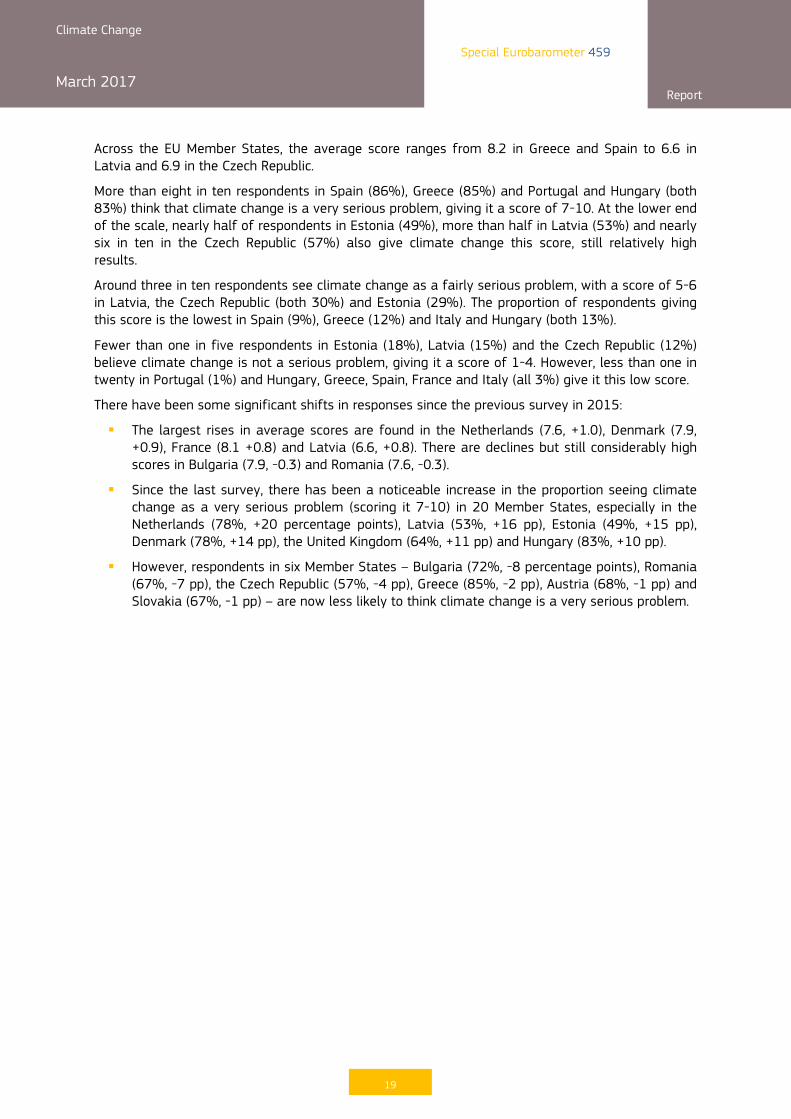
Across the EU Member States, the average score ranges from 8.2 in Greece and Spain to 6.6 in Latvia and 6.9 in the Czech Republic.
More than eight in ten respondents in Spain (86%), Greece (85%) and Portugal and Hungary (both 83%) think that climate change is a very serious problem, giving it a score of 7-10. At the lower end of the scale, nearly half of respondents in Estonia (49%), more than half in Latvia (53%) and nearly six in ten in the Czech Republic (57%) also give climate change this score, still relatively high results.
Around three in ten respondents see climate change as a fairly serious problem, with a score of 5-6 in Latvia, the Czech Republic (both 30%) and Estonia (29%). The proportion of respondents giving this score is the lowest in Spain (9%), Greece (12%) and Italy and Hungary (both 13%).
Fewer than one in five respondents in Estonia (18%), Latvia (15%) and the Czech Republic (12%) believe climate change is not a serious problem, giving it a score of 1-4. However, less than one in twenty in Portugal (1%) and Hungary, Greece, Spain, France and Italy (all 3%) give it this low score.
There have been some significant shifts in responses since the previous survey in 2015:
§ The largest rises in average scores are found in the Netherlands (7.6, +1.0), Denmark (7.9, +0.9), France (8.1 +0.8) and Latvia (6.6, +0.8). There are declines but still considerably high scores in Bulgaria (7.9, -0.3) and Romania (7.6, -0.3).
§ Since the last survey, there has been a noticeable increase in the proportion seeing climate change as a very serious problem (scoring it 7-10) in 20 Member States, especially in the Netherlands (78%, +20 percentage points), Latvia (53%, +16 pp), Estonia (49%, +15 pp), Denmark (78%, +14 pp), the United Kingdom (64%, +11 pp) and Hungary (83%, +10 pp).
§ However, respondents in six Member States – Bulgaria (72%, -8 percentage points), Romania (67%, -7 pp), the Czech Republic (57%, -4 pp), Greece (85%, -2 pp), Austria (68%, -1 pp) and Slovakia (67%, -1 pp) – are now less likely to think climate change is a very serious problem.

20
Climate Change March 2017
Report
Special Eurobarometer 459
QC2R
Notase
riousproblem
(1-4)
2017-
2015
Afairlyserio
usproblem
(5-6)
2017-
2015
Averyse
riousproblem
(7-10)
2017-
2015
Don'tk
now
Average
2017-
2015
EU28 6 2 18 4 74 5 2 7.7 0.4
ES 3 1 9 7 86 7 2 8.2 0.4EL 3 = 12 2 85 2 0 8.2 =FR 3 3 17 8 79 10 1 8.1 0.8HU 3 3 13 8 83 10 1 8.1 0.4IT 3 1 13 1 81 = 3 8.1 0.2SE 4 2 14 8 81 10 1 8.0 0.7MT 4 1 16 8 79 9 1 8.0 0.6PT 1 3 14 3 83 5 2 8.0 0.2DK 5 4 17 10 78 14 0 7.9 0.9CY 4 2 18 1 76 = 2 7.9 0.1BG 5 = 16 4 72 8 7 7.9 0.3LU 5 4 18 3 76 7 1 7.8 0.5DE 9 1 15 4 75 3 1 7.7 0.2NL 5 5 16 15 78 20 1 7.6 1.0LT 8 4 21 4 70 8 1 7.6 0.6SI 7 1 20 5 71 5 2 7.6 0.2RO 8 4 23 4 67 7 2 7.6 0.3FI 8 1 17 9 74 9 1 7.5 0.5BE 6 1 23 1 70 2 1 7.5 0.3HR 11 2 18 3 70 1 1 7.5 0.2SK 4 5 26 4 67 1 3 7.5 0.2AT 10 1 21 = 68 1 1 7.4 0.1IE 7 3 23 6 68 9 2 7.3 0.5UK 10 5 22 8 64 11 4 7.2 0.7PL 9 3 27 3 58 2 6 7.0 0.2CZ 12 = 30 5 57 4 1 6.9 0.1LV 15 6 30 9 53 16 2 6.6 0.8EE 18 7 29 7 49 15 4 6.3 0.6
And how serious a problem do you think climate change is at this moment?Pleaseuse a scale from 1 to10,with '1'meaning it is "notat all a serious problem" and '10'meaningitis"anextremelyseriousproblem".(%)

21
Climate Change March 2017
Report
Special Eurobarometer 459
This year, there are only slight differences between socio-demographic groups. The differences have narrowed since in 2015, indicating a growing consensus on the issue. Nevertheless, it can be observed that the socio-demographic groups that are most likely to say that climate change is a very serious problem are: § Women (76%), compared with men (72%);
§ Respondents aged 25-54 (75-76%), especially compared with respondents aged 55+ (72%);
§ Those who finished full-time education aged 20 or above (78%), compared with 70% of those who left school before the age of 15;
§ Students (79%) and managers (78%), especially compared with unemployed and retired people (both 71%);
§ Respondents who think climate change is the single biggest problem facing the world (93%), compared with 63% of those who did not mention climate change as a serious problem;
§ Respondents who have taken personal action to fight climate change (82%), compared with those who have not (66%).

22
Climate Change March 2017
Report
Special Eurobarometer 459
QC2R
Notaseriousproblem(1-4)
Afairlyseriousproblem(5-6)
Averyseriousproblem(7-10)
Average
EU28 6 18 74 7.7
Man 8 18 72 7.6
Woman 5 17 76 7.8
15-24 6 19 73 7.6
25-39 6 16 76 7.8
40-54 6 17 75 7.8
55+ 6 19 72 7.7
15- 6 20 70 7.6
16-19 7 19 72 7.6
20+ 6 15 78 7.9
Stillstudying 6 14 79 7.9
Self-employed 7 15 77 7.9
Managers 7 14 78 7.8
Otherwhitecollars 6 18 75 7.7
Manualworkers 7 19 72 7.6
Housepersons 5 17 76 7.8
Unemployed 7 18 71 7.8
Retired 7 19 71 7.6
Students 6 14 79 7.9
Biggestproblem 1 6 93 8.8
Oneoftheproblems 2 10 88 8.4
Notaproblem 10 24 63 7.1
Yes 4 13 82 8.1
No 9 22 66 7.3
Hastakenactiontofightclimatechange
And howserious a problemdo you think climate change is at this moment? Pleaseusea scale from 1 to 10, with '1' meaning it is "not at all a serious problem" and '10'meaningitis"anextremelyseriousproblem".(%-EU)
Gender
Age
Education(Endof)
Socio-professionalcategory
Climatechange

23
Climate Change March 2017
Report
Special Eurobarometer 459
II. TAKING ACTION TO TACKLE CLIMATE CHANGE
This second chapter focuses on taking action to address climate change. Respondents were initially asked who within the EU they think is responsible for tackling climate change and whether they themselves have taken any personal action to fight it. They were then given a list of environmentally-friendly actions, such as recycling, and asked whether they do any of these things.
1 Responsibility for tackling climate change
- Over four in ten respondents say that responsibility for tackling climate change lies with national governments -
Respondents were asked to say who within the EU they believe is responsible for tackling climate change. They were able to choose as many responses as they wished, from a list of options presented to them16.
National governments is the most commonly given answer, mentioned by at least four in ten respondents (43%). Nearly four in ten respondents say that the European Union (39%) and business and industry (38%) are responsible for tackling climate change, while just over one in five respondents (22%) mention regional and local authorities or say that they are personally responsible. Environmental groups are mentioned by just over one in five respondents (21%).
Meanwhile, one in five respondents (20%) say that responsibility for tackling climate change lies with all of the actors listed.
The proportion of people who think that environmental groups (+7 percentage points), regional and local authorities (+6 pp), the European Union (+4 pp), business and industry (+3 pp), or all of actors (+4 pp) have responsibility for tackling climate change has increased substantially since 2015. The proportion believing that they are personally responsible has also risen marginally since 2015 (+3 pp). The proportion of individuals mentioning national governments (+1 pp) remains stable.
16 QC3: In your opinion, who within the EU is responsible for tackling climate change? (MULTIPLE ANSWERS POSSIBLE)

24
Climate Change March 2017
Report
Special Eurobarometer 459
MULTIPLE ANSWERS POSSIBLE
QC3 Inyouropinion,whowithintheEUisresponsiblefortacklingclimatechange? (%-EU28)
43
39
38
22
22
21
1
20
1
5
42
35
35
16
19
14
2
16
1
4
48
39
41
19
25
19
1
10
1
4
41
35
35
17
21
1
23
1
5
NATIONALGOVERNMENTS
THEEUROPEANUNION
BUSINESSANDINDUSTRY
REGIONALANDLOCALAUTHORITIES
YOUPERSONALLY
ENVIRONMENTAL GROUPS
OTHER(SPONTANEOUS)
ALLOFTHEM(SPONTANEOUS)
NONE(SPONTANEOUS)
DON'TKNOW
Mar.2017 May-June2015 Nov.-Dec.2013 June2011

25
Climate Change March 2017
Report
Special Eurobarometer 459
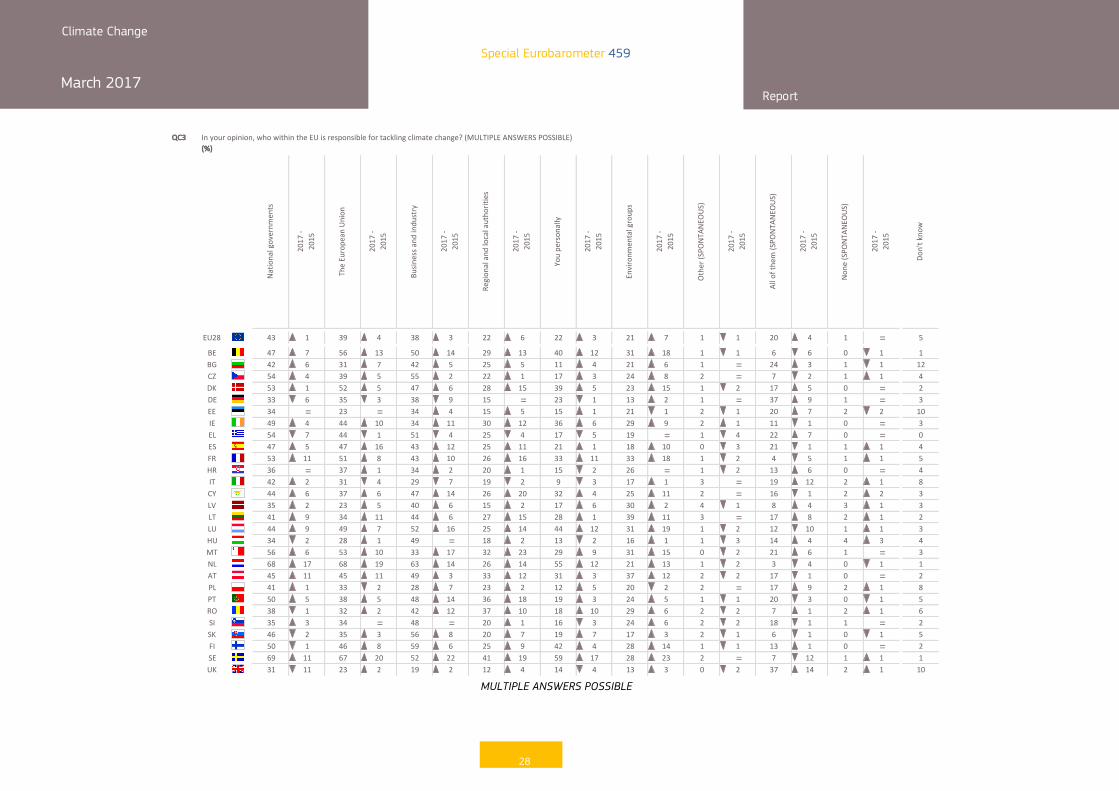
At national level, respondents are most likely to say that national governments are responsible for tackling climate change in 10 Member States, led by Sweden (69%). National governments is also the most cited answer together with the European Union in the Netherlands (68%) and Spain (47%). In Bulgaria (42%) and Estonia (34%), national governments is the most mentioned answer together with business and industry. An absolute majority in Malta (56%) share this opinion. At the other extreme, respondents in the United Kingdom (31%), Germany (33%), Estonia and Hungary (both 34%) are the least likely to cite this answer.
Respondents are most likely to say business and industry are responsible for tackling climate change in 12 Member States, most strikingly in the Netherlands (63%), Finland (59%) and Slovakia (56%). Conversely, this answer is given the least in the United Kingdom (19%), Poland (28%) and Italy (29%).
A majority of respondents think that the European Union is responsible for tackling climate change in only two Member States. The Netherlands aside (68%), this answer is cited most in Sweden (67%) and Belgium (56%) and least in the United Kingdom, Estonia and Latvia (all 23%).
Regional and local authorities are most likely to be seen as being responsible for tackling climate change in Sweden (41%), Romania (37%) and Portugal (36%). Fewer than one in six respondents mention them in the United Kingdom (12%), Germany, Estonia and Latvia (all 15%).
Around six in ten respondents in Sweden (59%) think that they personally have responsibility for tackling climate change, as do more than half in the Netherlands (55%) and over four in ten in Luxembourg (44%). On the other hand, relatively few people agree in Italy (9%), Bulgaria (11%) and Poland (12%).
Environmental groups are most likely to be seen as responsible for tackling climate change in Lithuania (39%), Austria (37%) and France (33%), and least so in the United Kingdom and Germany (both 13%) and Hungary (16%).
In one Member State, the UK, a relative majority of respondents say that all of the actors listed are responsible for tackling climate change (37%). The same proportion of respondents give this answer in Germany (37%), while just under a quarter in Bulgaria (24%) do so. Respondents in the Netherlands (3%), France (4%) and Slovakia and Belgium (both 6%) are the least likely to say that all the actors are responsible.
MULTIPLE ANSWERS POSSIBLE
QC3 Inyouropinion,whowithintheEUisresponsiblefortacklingclimatechange?(%-THEMOSTMENTIONEDANSWERBYCOUNTRY)
69 68
56 54 53 5350 49 47
43 42 42 41
3431
68
47
56
3742
34
5956 55
5249 49 48 47
44 42 40 38
SE NL MT EL DK FR PT IE ES EU28 BG IT PL EE UK BE HR FI SK CZ LU HU AT SI CY LT RO LV DE
NationalGovernments TheEuropeanUnion Businessandindustry

26
Climate Change March 2017
Report
Special Eurobarometer 459
MULTIPLE ANSWERS POSSIBLE
QC3
Nationalgovernm
ents
TheEu
rope
anUnion
Busine
ssand
indu
stry
Region
aland
localautho
rities
Youpe
rson
ally
Environm
entalgroup
s
Other(SPO
NTA
NEO
US)
Allofthe
m(SPO
NTA
NEO
US)
Non
e(SPO
NTA
NEO
US)
Don
'tkno
w
EU28 43 39 38 22 22 21 1 20 1 5
BE 47 56 50 29 40 31 1 6 0 1
BG 42 31 42 25 11 21 1 24 1 12
CZ 54 39 55 22 17 24 2 7 1 4
DK 53 52 47 28 39 23 1 17 0 2
DE 33 35 38 15 23 13 1 37 1 3
EE 34 23 34 15 15 21 2 20 2 10
IE 49 44 34 30 36 29 2 11 0 3
EL 54 44 51 25 17 19 1 22 0 0
ES 47 47 43 25 21 18 0 21 1 4
FR 53 51 43 26 33 33 1 4 1 5
HR 36 37 34 20 15 26 1 13 0 4
IT 42 31 29 19 9 17 3 19 2 8
CY 44 37 47 26 32 25 2 16 2 3
LV 35 23 40 15 17 30 4 8 3 3
LT 41 34 44 27 28 39 3 17 2 2
LU 44 49 52 25 44 31 1 12 1 3
HU 34 28 49 18 13 16 1 14 4 4
MT 56 53 33 32 29 31 0 21 1 3
NL 68 68 63 26 55 21 1 3 0 1
AT 45 45 49 33 31 37 2 17 0 2
PL 41 33 28 23 12 20 2 17 2 8
PT 50 38 48 36 19 24 1 20 0 5
RO 38 32 42 37 18 29 2 7 2 6
SI 35 34 48 20 16 24 2 18 1 2
SK 46 35 56 20 19 17 2 6 0 5
FI 50 46 59 25 42 28 1 13 0 2
SE 69 67 52 41 59 28 2 7 1 1
UK 31 23 19 12 14 13 0 37 2 10
Inyouropinion,whowithintheEUisresponsiblefortacklingclimatechange?(MULTIPLEANSWERSPOSSIBLE)(%)
Highestpercentagepercountry
Highestpercentageperitem
Lowestpercentagepercountry
Lowestpercentageperitem

27
Climate Change March 2017
Report
Special Eurobarometer 459
Since 2015, there have been some changes in results at national level across the EU.
Since the previous survey, respondents in the Netherlands (68%, +17 percentage points), Sweden (69%, +11 pp), Austria (45%, +11 pp) and France (53%, +11 pp) have become more likely to think that national governments have responsibility for tackling climate change. Conversely, fewer respondents now cite national governments in the United Kingdom (31%, -11 pp), Germany (33%, -6 pp) and Greece, but over half of those in Greece still consider national governments to be responsible (54%, -7 pp).
There is a growing trend in some Member States for respondents to think that the European Union is responsible for tackling climate change, especially in Sweden (67%, +20 percentage points). The largest decline in the proportion assigning responsibility to the EU is found in Italy (31%, -4 pp) and Germany (35%, -3 pp).
Since the previous survey, the sharpest rises in the proportion of respondents who say that responsibility for tackling climate change lies with business and industry are observed in Sweden (52%, +22 percentage points), Malta (33%, +17 pp) and Luxembourg (52%, +16 pp). The biggest falls are seen in Germany (38%, -9 pp), Italy (29%, -7 pp) and Greece (51%, -4 pp) - where over half of respondents still see business and industry as having responsibility.
The proportion of people who think that responsibility for tackling climate change lies with regional and local authorities has increased noticeably since 2015 in Malta (32%, +23 percentage points), Cyprus (26%, +20 pp) and Sweden (41%, +19 pp). It has fallen the most in Greece (25%, -4 pp).
Compared with the last survey, respondents in Sweden (59%, +17 percentage points), Luxembourg (44%, +12 pp), Belgium (40%, +12 pp) and the Netherlands (55%, +12 pp) are now more likely to think that they personally have responsibility for tackling climate change. Respondents in Greece (17%, -5 pp), the United Kingdom (14%, -4 pp), Slovenia (16%, -3 pp) and Italy (9%, -3 pp) are less likely than in 2015 to do so, however.
The proportion believing that environmental groups are responsible for tackling climate change has risen in Sweden (28%, +23 percentage points), Luxembourg (31%, +19 pp), France (33%, +18 pp) and Belgium (31%, +18 pp). A very small decrease is observed in Poland (20%, -2 pp).
The United Kingdom (37%, +14 percentage points), Italy (19%, +12 pp), Germany (37%, +9 pp) and Poland (17%, +9 pp) all have an increase in the share of respondents believing that all actors listed have responsibility, while the biggest decrease is in Sweden (7%, -12 pp), Luxembourg (12%, -10 pp) and Belgium (6%, -6 pp).
28
Climate Change
March 2017 Report
Special Eurobarometer 459
MULTIPLE ANSWERS POSSIBLE
QC3
Nationalgovernm
ents
2017-
2015
TheEu
rope
anUnion
2017-
2015
Busin
essa
ndindu
stry
2017-
2015
Region
aland
localautho
rities
2017-
2015
Youpe
rson
ally
2017-
2015
Environm
entalgroup
s
2017-
2015
Other(SPO
NTA
NEO
US)
2017-
2015
Allofthe
m(SPO
NTA
NEO
US)
2017-
2015
Non
e(SPO
NTA
NEO
US)
2017-
2015
Don'tk
now
EU28 43 1 39 4 38 3 22 6 22 3 21 7 1 1 20 4 1 = 5
BE 47 7 56 13 50 14 29 13 40 12 31 18 1 1 6 6 0 1 1BG 42 6 31 7 42 5 25 5 11 4 21 6 1 = 24 3 1 1 12CZ 54 4 39 5 55 2 22 1 17 3 24 8 2 = 7 2 1 1 4DK 53 1 52 5 47 6 28 15 39 5 23 15 1 2 17 5 0 = 2DE 33 6 35 3 38 9 15 = 23 1 13 2 1 = 37 9 1 = 3EE 34 = 23 = 34 4 15 5 15 1 21 1 2 1 20 7 2 2 10IE 49 4 44 10 34 11 30 12 36 6 29 9 2 1 11 1 0 = 3EL 54 7 44 1 51 4 25 4 17 5 19 = 1 4 22 7 0 = 0ES 47 5 47 16 43 12 25 11 21 1 18 10 0 3 21 1 1 1 4FR 53 11 51 8 43 10 26 16 33 11 33 18 1 2 4 5 1 1 5HR 36 = 37 1 34 2 20 1 15 2 26 = 1 2 13 6 0 = 4IT 42 2 31 4 29 7 19 2 9 3 17 1 3 = 19 12 2 1 8CY 44 6 37 6 47 14 26 20 32 4 25 11 2 = 16 1 2 2 3LV 35 2 23 5 40 6 15 2 17 6 30 2 4 1 8 4 3 1 3LT 41 9 34 11 44 6 27 15 28 1 39 11 3 = 17 8 2 1 2LU 44 9 49 7 52 16 25 14 44 12 31 19 1 2 12 10 1 1 3HU 34 2 28 1 49 = 18 2 13 2 16 1 1 3 14 4 4 3 4MT 56 6 53 10 33 17 32 23 29 9 31 15 0 2 21 6 1 = 3NL 68 17 68 19 63 14 26 14 55 12 21 13 1 2 3 4 0 1 1AT 45 11 45 11 49 3 33 12 31 3 37 12 2 2 17 1 0 = 2PL 41 1 33 2 28 7 23 2 12 5 20 2 2 = 17 9 2 1 8PT 50 5 38 5 48 14 36 18 19 3 24 5 1 1 20 3 0 1 5RO 38 1 32 2 42 12 37 10 18 10 29 6 2 2 7 1 2 1 6SI 35 3 34 = 48 = 20 1 16 3 24 6 2 2 18 1 1 = 2SK 46 2 35 3 56 8 20 7 19 7 17 3 2 1 6 1 0 1 5FI 50 1 46 8 59 6 25 9 42 4 28 14 1 1 13 1 0 = 2SE 69 11 67 20 52 22 41 19 59 17 28 23 2 = 7 12 1 1 1UK 31 11 23 2 19 2 12 4 14 4 13 3 0 2 37 14 2 1 10
Inyouropinion,whowithintheEUisresponsiblefortacklingclimatechange?(MULTIPLEANSWERSPOSSIBLE)(%)

29
Climate Change March 2017
Report
Special Eurobarometer 459
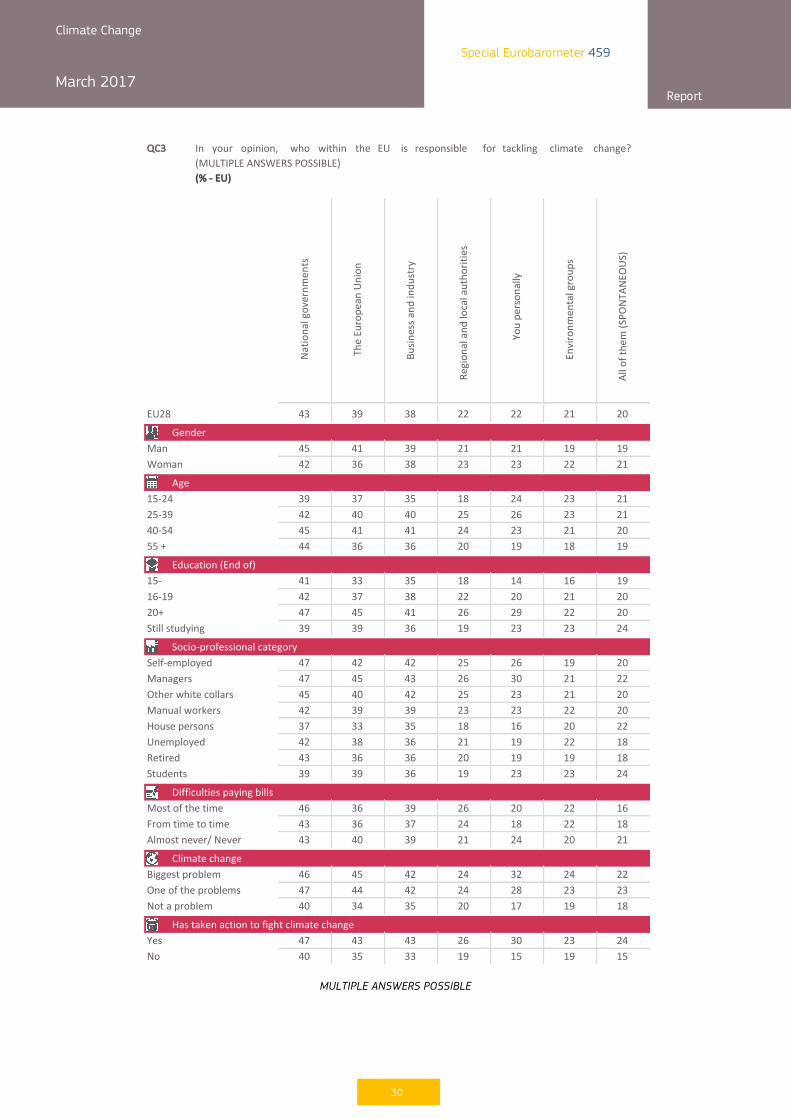
According to the socio-demographic results:
§ Men (41%) are more likely than women (36%) to say that the European Union is responsible for tackling climate change.
§ People aged 40 or over are more likely to believe that national governments are responsible for tackling climate change (44-45% vs. 39-42% of other age groups). Respondents aged 25-54 are the most likely to say that the European Union (40-41% vs. 36-37%), regional and local authorities (24-25% vs. 18-20%) and business and industry (40-41% vs. 35-36%) are responsible.
§ Respondents who finished their full-time education aged 20 or over are the most likely to name five out of the six actors listed as responsible. For example, 29% of this group cite personal responsibility, compared with only 14% of those who left school before the age of 15.
§ Managers (30%) are more likely than house persons (16%) to say they are personally responsible for tackling climate change and to cite the European Union (45% vs. 33% of house persons), regional and local authorities (26% vs. 18%) and business and industry (43% vs. 35%). Managers, together with the self-employed, are also the most likely to name national governments (both 47% vs. 37% of house persons). Students (24%) are more likely than unemployed and retired people (both 18%) to say that all of these actors are responsible.
§ Respondents who never or almost never have difficulties paying their bills are the most likely to think that they have personal responsibility for tackling climate change (24% vs. 18-20% of those who often or sometimes have difficulties paying bills). Those who struggle to pay their bills most of the time are the most likely to mention regional and local authorities (26%), especially compared with those who never or almost never have this problem (21%). Those who never or almost never have difficulties paying bills are the most likely to say that all of the actors have responsibility for tackling climate change (21% vs. 16% of those who struggle to pay their bills most of the time).
§ Respondents who think that climate change is the single biggest or one of the most serious problems facing the world are more likely than those who do not consider it among the most serious global problems to see all of the actors as responsible.
§ Respondents who have taken personal action to fight climate change are more likely than those who have not to think that all actors are responsible.
30
Climate Change March 2017
Report
Special Eurobarometer 459
MULTIPLE ANSWERS POSSIBLE
QC3
Natio
nalgovernm
ents
TheEu
rope
anUnion
Busin
essa
ndindu
stry
Region
aland
localautho
rities
Youpe
rson
ally
Environm
entalgroup
s
Allofthe
m(SPO
NTAN
EOUS
)
EU28 43 39 38 22 22 21 20
GenderMan 45 41 39 21 21 19 19Woman 42 36 38 23 23 22 21
Age15-24 39 37 35 18 24 23 2125-39 42 40 40 25 26 23 2140-54 45 41 41 24 23 21 2055+ 44 36 36 20 19 18 19
Education(Endof)15- 41 33 35 18 14 16 1916-19 42 37 38 22 20 21 2020+ 47 45 41 26 29 22 20Stillstudying 39 39 36 19 23 23 24
Socio-professionalcategorySelf-employed 47 42 42 25 26 19 20Managers 47 45 43 26 30 21 22Otherwhitecollars 45 40 42 25 23 21 20Manualworkers 42 39 39 23 23 22 20Housepersons 37 33 35 18 16 20 22Unemployed 42 38 36 21 19 22 18Retired 43 36 36 20 19 19 18Students 39 39 36 19 23 23 24
DifficultiespayingbillsMostofthetime 46 36 39 26 20 22 16Fromtimetotime 43 36 37 24 18 22 18Almostnever/Never 43 40 39 21 24 20 21
ClimatechangeBiggestproblem 46 45 42 24 32 24 22Oneoftheproblems 47 44 42 24 28 23 23Notaproblem 40 34 35 20 17 19 18
HastakenactiontofightclimatechangeYes 47 43 43 26 30 23 24No 40 35 33 19 15 19 15
In your opinion, who within the EU is responsible for tackling climate change?(MULTIPLEANSWERSPOSSIBLE)(%-EU)
31
Climate Change March 2017
Report
Special Eurobarometer 459
2 Personal action to tackle climate change
- Half of respondents say they take personal action to fight climate change -
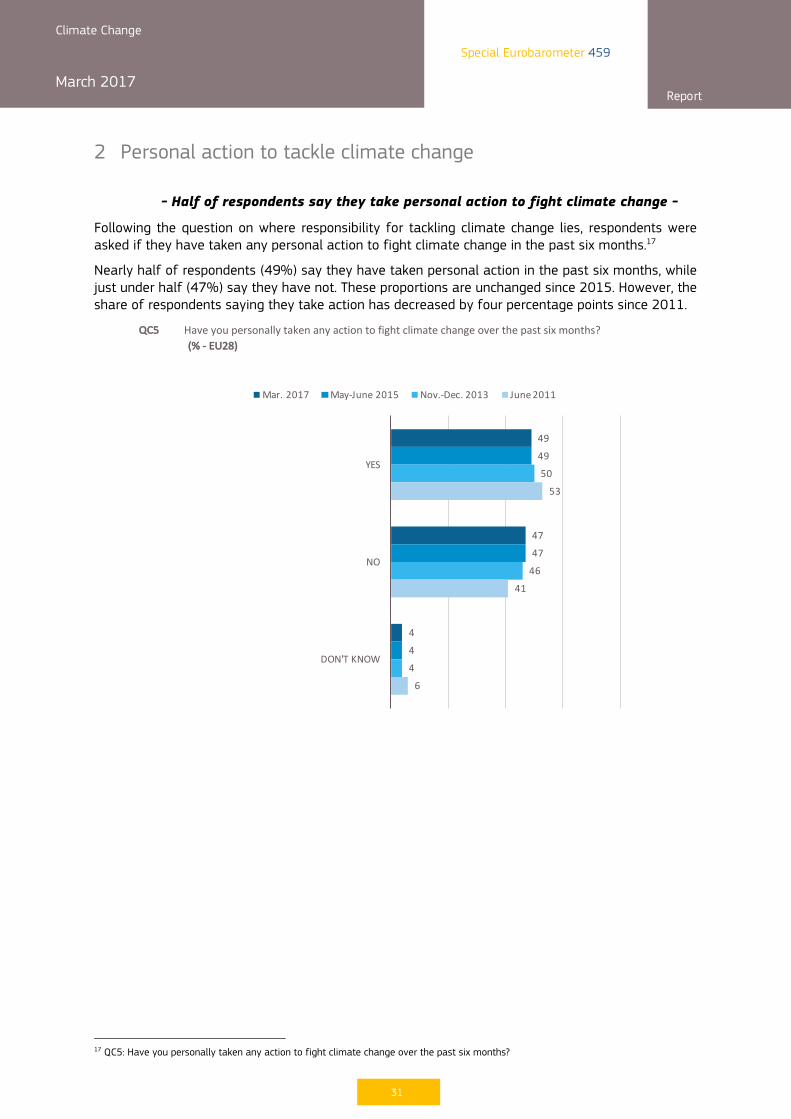
Following the question on where responsibility for tackling climate change lies, respondents were asked if they have taken any personal action to fight climate change in the past six months.17
Nearly half of respondents (49%) say they have taken personal action in the past six months, while just under half (47%) say they have not. These proportions are unchanged since 2015. However, the share of respondents saying they take action has decreased by four percentage points since 2011.
17 QC5: Have you personally taken any action to fight climate change over the past six months?
QC5 Haveyoupersonallytakenanyactiontofightclimatechangeoverthepastsixmonths?
(%-EU28)
49
47
4
49
47
4
50
46
4
53
41
6
YES
NO
DON'TKNOW
Mar.2017 May-June2015 Nov.-Dec.2013 June2011

32
Climate Change March 2017
Report
Special Eurobarometer 459
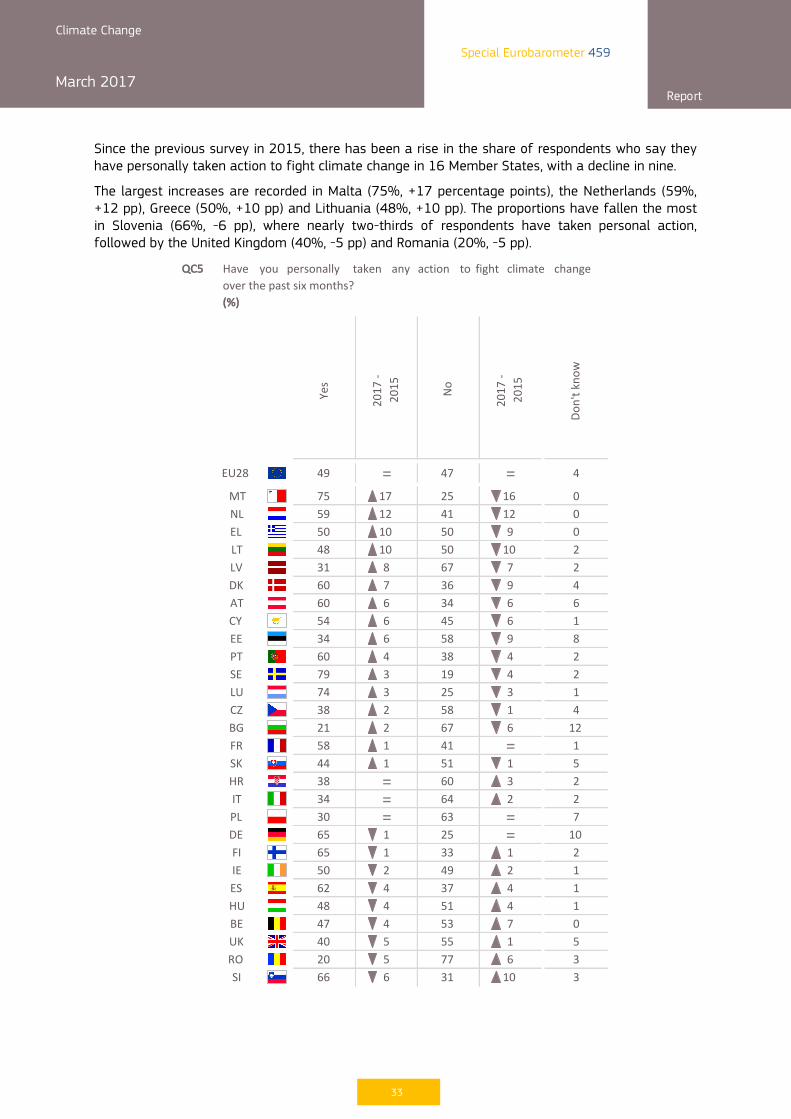
Absolute majorities say they have personally taken action to fight climate change over the past six months in 13 Member States, led by Sweden (79%), Malta (75%) and Luxembourg (74%). In Ireland, a relative majority say they have done so (50% vs. 49%), while in Greece the proportions are equally split. However, in 13 Member States a minority say they have taken personal action, with the lowest proportions in Romania (20%), Bulgaria (21%) and Poland (30%).
33
Climate Change March 2017
Report
Special Eurobarometer 459
Since the previous survey in 2015, there has been a rise in the share of respondents who say they have personally taken action to fight climate change in 16 Member States, with a decline in nine.
The largest increases are recorded in Malta (75%, +17 percentage points), the Netherlands (59%, +12 pp), Greece (50%, +10 pp) and Lithuania (48%, +10 pp). The proportions have fallen the most in Slovenia (66%, -6 pp), where nearly two-thirds of respondents have taken personal action, followed by the United Kingdom (40%, -5 pp) and Romania (20%, -5 pp).
QC5
Yes
2017-
2015 No
2017-
2015
Don'tk
now
EU28 49 = 47 = 4
MT 75 17 25 16 0NL 59 12 41 12 0EL 50 10 50 9 0LT 48 10 50 10 2LV 31 8 67 7 2DK 60 7 36 9 4AT 60 6 34 6 6CY 54 6 45 6 1EE 34 6 58 9 8PT 60 4 38 4 2SE 79 3 19 4 2LU 74 3 25 3 1CZ 38 2 58 1 4BG 21 2 67 6 12FR 58 1 41 = 1SK 44 1 51 1 5HR 38 = 60 3 2IT 34 = 64 2 2PL 30 = 63 = 7DE 65 1 25 = 10FI 65 1 33 1 2IE 50 2 49 2 1ES 62 4 37 4 1HU 48 4 51 4 1BE 47 4 53 7 0UK 40 5 55 1 5RO 20 5 77 6 3SI 66 6 31 10 3
Have you personally taken any action to fight climate changeoverthepastsixmonths?(%)
34
Climate Change March 2017
Report
Special Eurobarometer 459
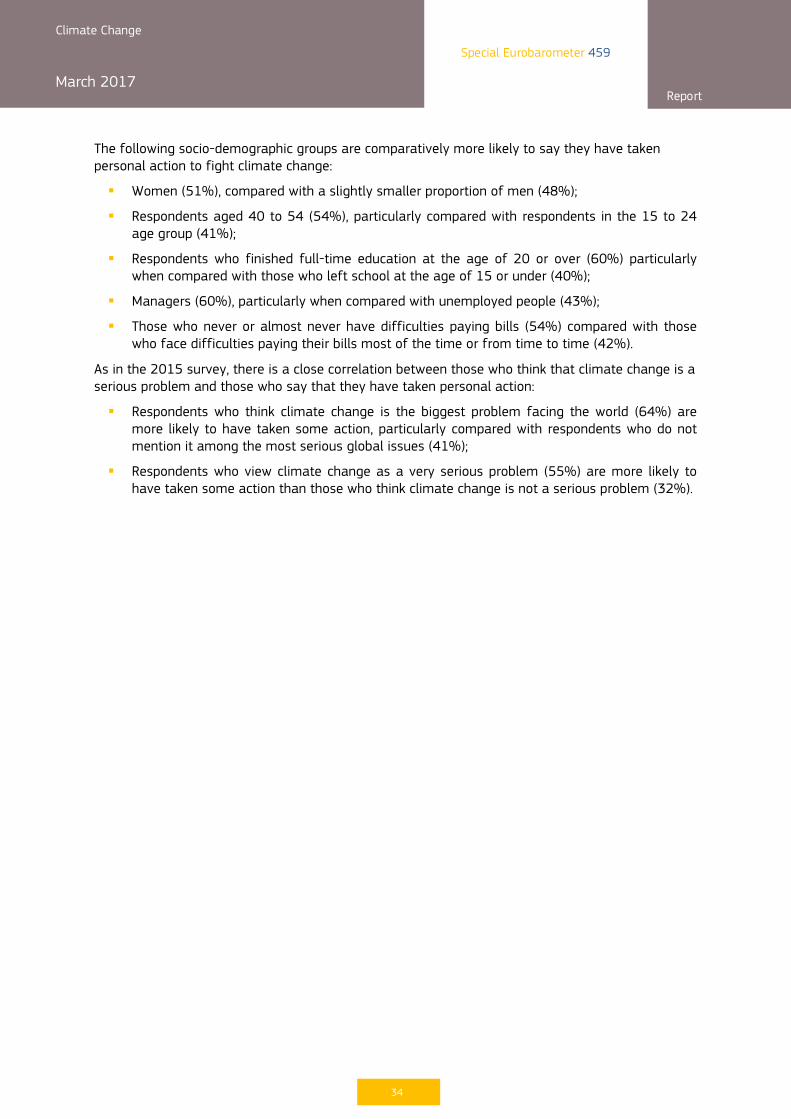
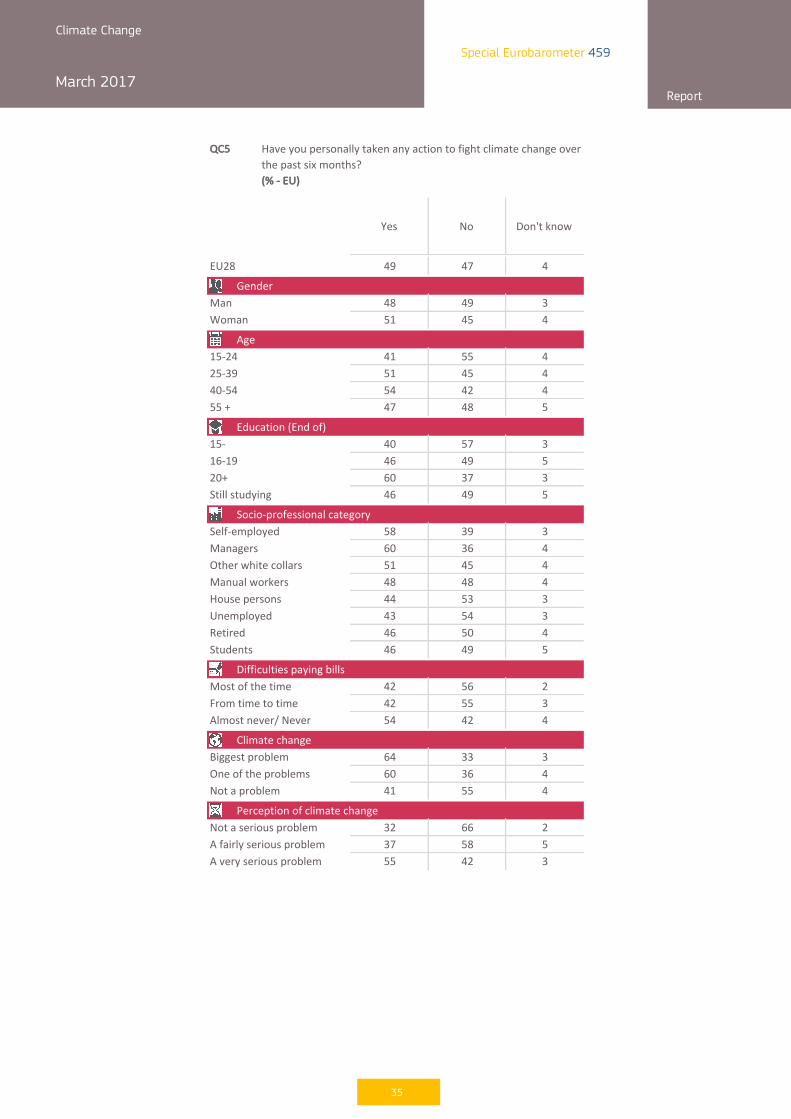
The following socio-demographic groups are comparatively more likely to say they have taken personal action to fight climate change:
§ Women (51%), compared with a slightly smaller proportion of men (48%);
§ Respondents aged 40 to 54 (54%), particularly compared with respondents in the 15 to 24 age group (41%);
§ Respondents who finished full-time education at the age of 20 or over (60%) particularly when compared with those who left school at the age of 15 or under (40%);
§ Managers (60%), particularly when compared with unemployed people (43%);
§ Those who never or almost never have difficulties paying bills (54%) compared with those who face difficulties paying their bills most of the time or from time to time (42%).
As in the 2015 survey, there is a close correlation between those who think that climate change is a serious problem and those who say that they have taken personal action:
§ Respondents who think climate change is the biggest problem facing the world (64%) are more likely to have taken some action, particularly compared with respondents who do not mention it among the most serious global issues (41%);
§ Respondents who view climate change as a very serious problem (55%) are more likely to have taken some action than those who think climate change is not a serious problem (32%).
35
Climate Change March 2017
Report
Special Eurobarometer 459
QC5
Yes No Don'tknow
EU28 49 47 4
Man 48 49 3Woman 51 45 4
15-24 41 55 425-39 51 45 440-54 54 42 455+ 47 48 5
15- 40 57 316-19 46 49 520+ 60 37 3Stillstudying 46 49 5
Self-employed 58 39 3Managers 60 36 4Otherwhitecollars 51 45 4Manualworkers 48 48 4Housepersons 44 53 3Unemployed 43 54 3Retired 46 50 4Students 46 49 5
Mostofthetime 42 56 2Fromtimetotime 42 55 3Almostnever/Never 54 42 4
Biggestproblem 64 33 3Oneoftheproblems 60 36 4Notaproblem 41 55 4
Notaseriousproblem 32 66 2Afairlyseriousproblem 37 58 5Averyseriousproblem 55 42 3
Climatechange
Perceptionofclimatechange
Haveyoupersonallytakenanyactiontofightclimatechangeoverthepastsixmonths?(%-EU)
Gender
Age
Education(Endof)
Socio-professionalcategory
Difficultiespayingbills

36
Climate Change March 2017
Report
Special Eurobarometer 459
3 Types of individual action
- 90% of respondents have taken at least one personal action that helps tackle climate change -
All respondents, including those who say they have taken no personal action to fight climate change in answer to the previous question, were shown a list of actions and asked which, if any, apply to them18.
This question, which was also asked in 2015 and 2013, was changed slightly for this survey, with the introduction of two new actions (“You have bought an electric car” and “You have installed solar panels in your home”)19.
At least seven in ten respondents (71%) try to reduce their waste and regularly separate it for recycling. Nearly six in ten (56%) try to cut down on their consumption of disposable items, such as plastic bags from the supermarket and excessive packaging. More than four in ten respondents (41%) say they try to buy locally produced and seasonal food. Almost one in five (18%) have better insulated their home to reduce their energy consumption, and one in ten (10%) try to avoid taking short-haul flights. Fewer than one in ten (9%) have bought a new car partly for its low fuel consumption, switched to an energy supplier which offers a greater share of energy from renewable sources than their previous supplier (7%) or installed solar panels in their home (4%). Finally, fewer than one in twenty respondents have bought a low-energy home (3%) or an electric car (1%).
Fewer than one in ten individuals (9%) say that they have taken none of the listed actions, while fewer than one in twenty respondents (3%) say they have taken other actions.
It is interesting to compare these responses with those given to the previous question. Nearly half (49%) of all respondents say they have taken personal action to fight climate change - and this rises to nine in ten (90%) when they are asked about particular steps they may have taken.
When it comes to the evolution of the responses, however, while it should be noted that the question and possible answers have been modified, we see a general decrease in all actions for which comparison with the 2015 survey is possible, while the proportion who mention none of these measures has risen by 3 pp. The decrease is particularly clear among those who regularly use environmentally-friendly alternatives to their private car (-10 percentage points) and those who buy locally produced and seasonal food whenever possible (-8 pp). A decrease of 5 pp or more is recorded for all of the other actions compared with 2015.
18 QC6: Which of the following actions, if any, apply to you? (MULTIPLE ANSWERS POSSIBLE) 19 Two actions were also slightly modified since 2015: "When buying a new household appliance e.g. washing machine, fridge or TV, you choose it mainly because it was more energy efficient than other models" was changed to "When buying a new household appliance e.g. washing machine, fridge or TV, lower energy consumption is an important factor in your choice"; and "You have installed equipment in your home to control and reduce your energy consumption" was changed to "You have installed equipment in your home to control and reduce your energy consumption (e.g. smart meter)".

37
Climate Change March 2017
Report
Special Eurobarometer 459
MULTIPLE ANSWERS POSSIBLE (*Heavily modified item/**New items)
QC6 Whichofthefollowingactions,ifany,applytoyou?(MULTIPLEANSWERSPOSSIBLE)
(%-EU28)
71
56
41
37
26
18
10
9
8
7
4
3
1
3
9
1
74
57
49
42
36
23
13
13
9
5
3
6
1
69
51
36
34
28
21
9
11
7
4
2
10
1
66
46
36
30
26
18
9
10
7
3
3
13
2
YOUTRYTOREDUCEYOURWASTEAND
YOUREGULARLYSEPARATE ITFORRECYCLING
YOUTRYTOCUTDOWNONYOURCONSUMPTIONOFDISPOSABLEITEMS
WHENEVER POSSIBLE,E.G.PLASTICBAGS
FROMTHESUPERMARKET, EXCESSIVEPACKAGING
YOUBUYLOCALLYPRODUCEDANDSEASONAL FOOD
WHENEVER POSSIBLE
WHENBUYINGANEWHOUSEHOLDAPPLIANCE
E.G.WASHINGMACHINE,FRIDGEORTV,LOWERENERGY CONSUMPTIONISAN
IMPORTANT FACTORINYOURCHOICE
YOUREGULARLYUSEENVIRONMENTALLY-FRIENDLY ALTERNATIVES TOYOUR
PRIVATECARSUCHASWALKING,CYCLING,TAKINGPUBLICTRANSPORTORCAR-
SHARING
YOUHAVE INSULATEDYOURHOMEBETTER
TOREDUCEYOURENERGY CONSUMPTION
YOUAVOIDTAKINGSHORT-HAULFLIGHTSWHENEVER POSSIBLE
YOUHAVEBOUGHTANEWCARANDITSLOWFUELCONSUMPTIONWASAN
IMPORTANT FACTORINYOURCHOICE
YOUHAVE INSTALLEDEQUIPMENT INYOURHOME
TOCONTROLANDREDUCEYOURENERGY
CONSUMPTION(E.G.SMARTMETER)*
YOUHAVE SWITCHEDTOANENERGY SUPPLIER
WHICHOFFERSAGREATER SHAREOFENERGY
FROMRENEWABLE SOURCESTHANYOURPREVIOUSONE
YOUHAVE INSTALLEDSOLARPANELSINYOURHOME**
YOUHAVEBOUGHTALOW-ENERGYHOME
YOUHAVEBOUGHTANELECTRICCAR**
OTHER(SPONTANEOUS)
NONE(SPONTANEOUS)
DON'TKNOW
Mar.2017 May-June2015 Nov.-Dec.2013 June2011
38
Climate Change March 2017
Report
Special Eurobarometer 459
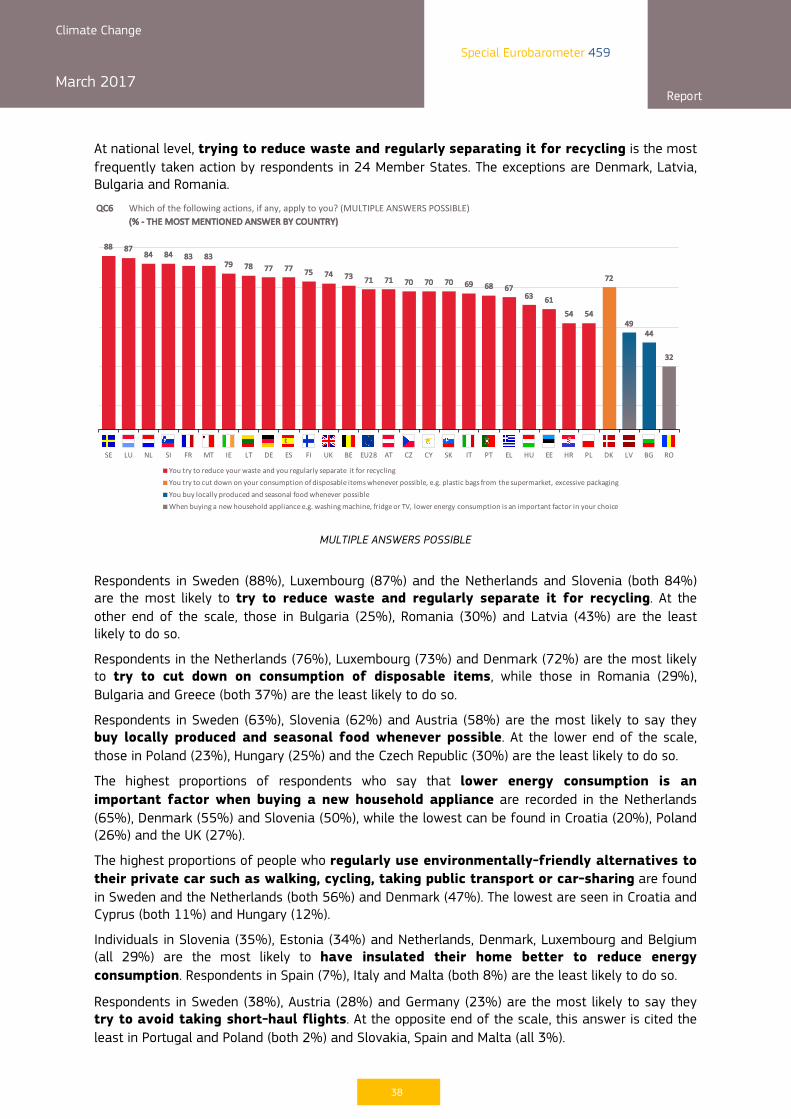
At national level, trying to reduce waste and regularly separating it for recycling is the most frequently taken action by respondents in 24 Member States. The exceptions are Denmark, Latvia, Bulgaria and Romania.
MULTIPLE ANSWERS POSSIBLE
Respondents in Sweden (88%), Luxembourg (87%) and the Netherlands and Slovenia (both 84%) are the most likely to try to reduce waste and regularly separate it for recycling. At the other end of the scale, those in Bulgaria (25%), Romania (30%) and Latvia (43%) are the least likely to do so.
Respondents in the Netherlands (76%), Luxembourg (73%) and Denmark (72%) are the most likely to try to cut down on consumption of disposable items, while those in Romania (29%), Bulgaria and Greece (both 37%) are the least likely to do so.
Respondents in Sweden (63%), Slovenia (62%) and Austria (58%) are the most likely to say they buy locally produced and seasonal food whenever possible. At the lower end of the scale, those in Poland (23%), Hungary (25%) and the Czech Republic (30%) are the least likely to do so.
The highest proportions of respondents who say that lower energy consumption is an important factor when buying a new household appliance are recorded in the Netherlands (65%), Denmark (55%) and Slovenia (50%), while the lowest can be found in Croatia (20%), Poland (26%) and the UK (27%).
The highest proportions of people who regularly use environmentally-friendly alternatives to their private car such as walking, cycling, taking public transport or car-sharing are found in Sweden and the Netherlands (both 56%) and Denmark (47%). The lowest are seen in Croatia and Cyprus (both 11%) and Hungary (12%).
Individuals in Slovenia (35%), Estonia (34%) and Netherlands, Denmark, Luxembourg and Belgium (all 29%) are the most likely to have insulated their home better to reduce energy consumption. Respondents in Spain (7%), Italy and Malta (both 8%) are the least likely to do so.
Respondents in Sweden (38%), Austria (28%) and Germany (23%) are the most likely to say they try to avoid taking short-haul flights. At the opposite end of the scale, this answer is cited the least in Portugal and Poland (both 2%) and Slovakia, Spain and Malta (all 3%).
QC6 Whichofthefollowingactions,ifany,applytoyou?(MULTIPLEANSWERSPOSSIBLE)
(%-THEMOSTMENTIONEDANSWERBYCOUNTRY)
88 8784 84 83 83
79 78 77 7775 74 73
71 71 70 70 70 69 68 67
6361
54 54
72
49
44
32
SE LU NL SI FR MT IE LT DE ES FI UK BE EU28 AT CZ CY SK IT PT EL HU EE HR PL DK LV BG RO
Youtrytoreduceyourwasteandyouregularlyseparate itforrecycling
Youtrytocutdownonyourconsumptionofdisposableitemswheneverpossible,e.g.plasticbagsfromthesupermarket,excessive packaging
Youbuylocallyproducedandseasonalfoodwheneverpossible
Whenbuyinganewhouseholdappliancee.g.washingmachine,fridgeorTV,lowerenergyconsumptionisanimportantfactorinyourchoice

39
Climate Change March 2017
Report
Special Eurobarometer 459
Respondents in Denmark (26%) and Luxembourg and Sweden (both 22%) are the most likely to have bought a new car partly for its low fuel consumption. Respondents in Bulgaria, Portugal and Poland (all 3%) are least likely to have done so.
Individuals in the Netherlands (25%) and Denmark and Luxembourg (both 18%) are the most likely to have installed equipment in their home to control and reduce their energy consumption (e.g. smart meter), while respondents in Bulgaria (1%), Cyprus and Greece (both 2%) are the least likely to have done so.
The highest proportions of individuals saying they have switched to an energy supplier which offers a greater share of energy from renewable sources than their previous one are found in Sweden (24%), the Netherlands (22%), Austria and Belgium (both 17%), while the lowest are recorded in Bulgaria and Lithuania (both 0%) and Greece, Malta and Poland (all 1%).
Just over one in five respondents in Cyprus (21%) have installed solar panels in their home, as have just under one in six in the Netherlands (15%) and Greece and Malta (both 14%). However, very small minorities of respondents in Sweden, Slovakia, Romania, Poland, Estonia, Spain, Hungary, Lithuania and Croatia (all 1%) say they have done so.
At least one in ten respondents in the Netherlands (11%) and Luxembourg (10%) have bought a low-energy home, while only 1% in nine Member States say they have done so.
Meanwhile, less than 5% in all Member States have bought an electric car.
Finally, more than one in ten respondents in 11 Member States have not done any of these actions, notably in Romania (25%), Bulgaria (20%) and France and Hungary (both 16%).

40
Climate Change March 2017
Report
Special Eurobarometer 459
MULTIPLE ANSWERS POSSIBLE
QC6
Youtrytore
duceyou
rwasteand
youregularly
separateitfo
rrecycling
Youtrytocutdow
non
you
rcon
sumptionof
disposableitem
swhe
neverp
ossib
le,e.g.plastic
bagsfrom
thesupe
rmarket,excessivepackaging
Youbu
ylocallyprodu
cedand
season
alfo
odwhe
neverp
ossib
le
Whe
nbu
yinganew
hou
seho
ldapp
liancee.g.
washingm
achine
,frid
georT
V,lowerene
rgy
consum
ptionisanim
portantfactorinyourcho
ice
Youregularly
useenviro
nmen
tally-friend
ly
alternativesto
you
rpriv
atecarsuchaswalking,
cycling,ta
kingpub
lictransporto
rcar-sharin
g
Youhaveinsulatedyourhom
ebe
tter
tore
duceyou
rene
rgyconsum
ption
Youavoidtakingsh
ort-haulflightsw
hene
verp
ossib
le
Youhavebou
ghta
new
carand
itslow
fuel
consum
ptionwasanim
portantfactorinyourcho
ice
Youhaveinstalledeq
uipm
entinyourhom
etocon
trol
andredu
ceyou
rene
rgyconsum
ption(e.g.smartm
eter)
Youhavesw
itche
dtoanen
ergysu
pplierw
hich
offersagreatersh
areofene
rgyfrom
rene
wableso
urces
thanyou
rpreviou
sone
Youhaveinstalledsolarp
anelsinyourhom
e
Youhavebou
ghta
low-ene
rgyho
me
Youhavebou
ghta
nelectriccar
Other(SPO
NTA
NEO
US)
Non
e(SPO
NTA
NEO
US)
Don'tk
now
EU28 71 56 41 37 26 18 10 9 8 7 4 3 1 3 9 1
BE 73 59 42 46 30 29 9 12 9 17 11 6 4 2 1 0BG 25 37 44 36 17 25 4 3 1 0 3 1 0 3 20 3CZ 70 47 30 41 21 19 14 8 6 5 3 2 1 3 7 1DK 70 72 46 55 47 29 13 26 18 11 5 5 1 4 5 1DE 77 71 56 43 41 17 23 14 7 14 9 3 1 1 5 2EE 61 57 45 44 30 34 6 14 7 4 1 5 0 2 5 3IE 79 66 40 31 23 25 9 12 10 11 4 4 0 2 3 2EL 67 37 35 32 20 18 5 4 2 1 14 1 0 4 14 0ES 77 58 32 30 19 7 3 4 8 2 1 1 0 3 10 0FR 83 60 53 43 25 24 6 11 10 4 2 5 1 3 4 0HR 54 44 35 20 11 15 5 4 3 2 1 1 0 5 16 2IT 69 48 37 35 13 8 8 7 5 3 5 2 1 3 9 2CY 70 40 39 41 11 18 7 11 2 3 21 3 1 3 13 1LV 43 46 49 49 36 19 7 9 9 3 2 1 0 3 10 1LT 78 62 33 29 18 18 6 6 5 0 1 1 1 2 7 1LU 87 73 51 45 31 29 17 22 18 10 10 10 2 2 2 1HU 63 53 25 37 12 14 8 4 4 3 1 3 1 2 16 0MT 83 68 54 46 18 8 3 9 15 1 14 5 0 2 5 1NL 84 76 41 65 56 29 14 15 25 22 15 11 1 4 1 0AT 71 61 58 40 34 15 28 9 8 17 10 4 2 5 4 0PL 54 45 23 26 13 10 2 3 5 1 1 2 0 7 13 2PT 68 55 31 33 13 13 2 3 4 2 2 2 0 3 13 0RO 30 29 31 32 23 24 5 4 5 2 1 1 0 5 25 4SI 84 65 62 50 35 35 8 16 11 11 5 5 0 2 4 0SK 70 53 35 30 18 14 3 4 4 2 1 1 0 6 7 3FI 75 67 42 38 43 16 22 14 15 12 2 1 1 2 6 2SE 88 69 63 47 56 13 38 22 8 24 1 2 1 2 1 0UK 74 50 36 27 25 27 7 13 15 10 3 3 1 0 10 2
Whichofthefollowingactions,ifany,applytoyou?(MULTIPLEANSWERSPOSSIBLE)(%)
Highestpercentagepercountry LowestpercentagepercountryHighestpercentageperitem Lowestpercentageperitem
41
Climate Change March 2017
Report
Special Eurobarometer 459
Although the question and list of answers were modified from the 2015 survey, where comparison is possible, a number of changes in responses can be seen across the Member States.
§ The largest increases in the proportion of respondents who try to reduce their waste and regularly separate it for recycling are recorded in Lithuania (78%, +11 percentage points), Malta (83%, +5 pp) and Hungary (63%, +5 pp).
§ Respondents in Bulgaria (25%, -12 percentage points) and Estonia (61%, -10 pp) are much less likely to try to reduce their waste and regularly separate it for recycling than they were in 2015.
§ The share of people who try to cut down their consumption of disposable items such as supermarket plastic bags and excessive packaging has increased markedly since 2015 in Lithuania (62%, +19 percentage points) and Malta (68%, +12 pp). Respondents in Bulgaria (37%, -11 pp), Slovenia (65%, -8 pp) and Estonia (57%, -8 pp) are now much less likely to give this answer.
§ Since the previous survey, the proportion of respondents who buy locally produced and seasonal food has fallen most notably in Latvia (49%, -15 percentage points), Slovakia (35%, -14 pp), Italy (37%, -14 pp) and Portugal (31%, -14 pp).
§ Since 2015, the proportion who have better insulated their home to reduce their energy consumption has decreased or remained stable in all but one Member State, with the biggest falls in the United Kingdom (27%, -14 percentage points), Luxembourg (29%, -9 pp), Ireland (25%, -9 pp), Romania (24%, -9 pp) and Slovakia (14%, -9 pp). Slovenia is the exception, seeing a five-point increase in the share of respondents who have better insulated their homes (35%).
§ Individuals in Cyprus (7%, +3 percentage points) and Romania (5%, +2 pp) are now slightly more likely to avoid taking short-haul flights when possible. Conversely, Slovenia (8%, -8 percentage points), Luxembourg (17%, -6 pp) and Sweden (38%, -6 pp) saw a drop in the proportion of people doing this.
§ The largest decreases in the share of respondents buying a new car partly for its low fuel consumption can be seen in Luxembourg (22%, -13 percentage points), the United Kingdom (13%, -9 pp) and Malta (9%, -9 pp).
§ People in the Netherlands (22%, +4 percentage points) are now slightly more likely to switch to an energy supplier offering a greater share of supply from renewable sources. The proportion of respondents doing so has declined most in Ireland (11%, -6 pp) and Italy (3%, -6 pp).
§ Respondents in Hungary (3%, -5 percentage points), Luxembourg (10%, -4 pp) and Belgium (6%, -4 pp) are now somewhat less likely to have bought a low-energy home.
§ The proportion of respondents mentioning none of these actions has risen in Romania (25%, +14 percentage points), Bulgaria (20%, +10 pp) and Latvia (10%, +6 pp).
§ Since 2015, the share of individuals who take other personal actions has somewhat increased in Poland (7%, +5 percentage points), Slovakia (6%, +4 pp) and Austria (5%, +3 pp).

42
Climate Change
March 2017 Report
Special Eurobarometer 459
MULTIPLE ANSWERS POSSIBLE
QC6
Youtrytore
duceyou
rwasteand
youregularly
separateitfo
rrecycling
2017-
2015
Youtrytocutdow
non
you
rcon
sumptionof
disposableitem
swhe
neverp
ossib
le,e.g.plastic
bagsfrom
thesupe
rmarket,excessivepackaging
2017-
2015
Youbu
ylocallyprodu
cedand
season
alfo
odwhe
neverp
ossib
le
2017-
2015
Whe
nbu
yinganew
hou
seho
ldapp
liancee.g.
washingm
achine
,frid
georT
V,lowerene
rgy
consum
ptionisanim
portantfactorinyourcho
ice
2017-
2015
Youregularly
useenviro
nmen
tally-friend
lyalternativesto
you
rpriv
atecarsuchaswalking,
cycling,ta
kingpub
lictransporto
rcar-sharin
g
2017-
2015
Youhaveinsulatedyourhom
ebe
tter
tore
duceyou
rene
rgyconsum
ption
2017-
2015
Youavoidtakingsh
ort-h
aulflights
whe
neverp
ossib
le
2017-
2015
Youhavebou
ghta
new
carand
itslow
fuelcon
sumptionwasanim
portant
factorinyou
rcho
ice
2017-
2015
Youhaveinstalledeq
uipm
entinyour
hometocon
troland
redu
ceyou
rene
rgy
consum
ption(e.g.smartm
eter)*
Youhavesw
itche
dtoanen
ergysu
pplier
whichoffe
rsagreatersh
areofene
rgyfrom
rene
wableso
urcesthanyourpreviou
sone
2017-
2015
Youhaveinstalledsolarp
anels
inyou
rhom
e**
Youhavebou
ghta
low-ene
rgyho
me
2017-
2015
Youhavebou
ghta
nelectriccar**
Other(SPO
NTA
NEO
US)
2017-
2015
Non
e(SPO
NTA
NEO
US)
2017-
2015
Don'tk
now
EU28 71 3 56 1 41 8 37 5 26 10 18 5 10 3 9 4 8 7 2 4 3 2 1 3 = 9 3 1
BE 73 5 59 3 42 8 46 11 30 13 29 8 9 4 12 8 9 17 1 11 6 4 4 2 1 1 1 0BG 25 12 37 11 44 9 36 3 17 6 25 2 4 2 3 2 1 0 1 3 1 2 0 3 1 20 10 3CZ 70 9 47 7 30 8 41 6 21 11 19 4 14 = 8 4 6 5 2 3 2 1 1 3 2 7 4 1DK 70 2 72 6 46 7 55 10 47 6 29 = 13 5 26 = 18 11 1 5 5 1 1 4 3 5 2 1DE 77 4 71 2 56 4 43 10 41 11 17 3 23 4 14 1 7 14 = 9 3 1 1 1 1 5 3 2EE 61 10 57 8 45 9 44 3 30 8 34 3 6 4 14 3 7 4 1 1 5 2 0 2 = 5 1 3IE 79 5 66 1 40 11 31 12 23 10 25 9 9 2 12 3 10 11 6 4 4 3 0 2 1 3 1 2EL 67 2 37 3 35 12 32 1 20 13 18 1 5 3 4 1 2 1 1 14 1 1 0 4 2 14 4 0ES 77 1 58 1 32 7 30 5 19 16 7 6 3 2 4 = 8 2 1 1 1 3 0 3 1 10 3 0FR 83 4 60 5 53 8 43 3 25 8 24 5 6 3 11 4 10 4 = 2 5 2 1 3 2 4 1 0HR 54 2 44 3 35 5 20 6 11 13 15 1 5 1 4 4 3 2 3 1 1 = 0 5 1 16 3 2IT 69 1 48 1 37 14 35 3 13 8 8 3 8 3 7 2 5 3 6 5 2 1 1 3 = 9 2 2CY 70 8 40 3 39 9 41 2 11 16 18 2 7 3 11 5 2 3 1 21 3 1 1 3 2 13 5 1LV 43 2 46 2 49 15 49 1 36 15 19 3 7 = 9 = 9 3 1 2 1 2 0 3 1 10 6 1LT 78 11 62 19 33 8 29 6 18 = 18 1 6 = 6 4 5 0 1 1 1 2 1 2 = 7 1 1LU 87 = 73 3 51 11 45 13 31 17 29 9 17 6 22 13 18 10 3 10 10 4 2 2 = 2 2 1HU 63 5 53 1 25 8 37 1 12 6 14 6 8 1 4 2 4 3 1 1 3 5 1 2 = 16 5 0MT 83 5 68 12 54 6 46 2 18 2 8 5 3 4 9 9 15 1 1 14 5 = 0 2 1 5 2 1NL 84 = 76 4 41 4 65 8 56 3 29 4 14 1 15 6 25 22 4 15 11 1 1 4 = 1 1 0AT 71 7 61 1 58 6 40 9 34 17 15 4 28 1 9 8 8 17 1 10 4 1 2 5 3 4 2 0PL 54 8 45 = 23 12 26 4 13 8 10 6 2 2 3 4 5 1 2 1 2 = 0 7 5 13 4 2PT 68 1 55 = 31 14 33 7 13 10 13 = 2 3 3 2 4 2 1 2 2 = 0 3 1 13 3 0RO 30 7 29 4 31 11 32 2 23 4 24 9 5 2 4 5 5 2 1 1 1 2 0 5 2 25 14 4SI 84 2 65 8 62 4 50 9 35 17 35 5 8 8 16 = 11 11 1 5 5 1 0 2 3 4 4 0SK 70 = 53 2 35 14 30 7 18 11 14 9 3 5 4 4 4 2 = 1 1 1 0 6 4 7 3 3FI 75 5 67 = 42 11 38 2 43 3 16 4 22 4 14 1 15 12 1 2 1 1 1 2 2 6 4 2SE 88 1 69 2 63 = 47 2 56 6 13 7 38 6 22 4 8 24 1 1 2 1 1 2 4 1 = 0UK 74 5 50 2 36 7 27 11 25 13 27 14 7 3 13 9 15 10 3 3 3 3 1 0 2 10 2 2
Whichofthefollowingactions,ifany,applytoyou?(MULTIPLEANSWERSPOSSIBLE)(%)

43
Climate Change March 2017
Report
Special Eurobarometer 459
The results by socio-demographic group for the four most-cited personal actions reveal a number of patterns20. Respondents who are most likely to say that they have taken each of these actions are:
§ Women: this is especially the case for buying locally produced and seasonal food (45% vs. 37% of men);
§ Those aged between 40 and 54 years: for instance, 46% take lower energy consumption into account when buying a new household appliance (vs. 18-39% of the other age groups);
§ People who have completed full-time education at the age of 20 or over, especially in comparison with those who left school aged 15 or under: this is particularly the case for taking energy consumption into account when buying a new household appliance (49% vs. 25%);
§ Managers or self-employed people: for instance, 52% of managers and 45% of self-employed people buy locally produced and seasonal food, compared with 33% of students;
§ Those who never or almost never have difficulties paying bills, particularly compared with those who do most of the time: for example, 75% of those never having difficulties try to reduce their waste and regularly separate it for recycling, compared with 57% of respondents with financial problems most of the time;
§ Those who think climate change is either the single biggest problem or among the most serious problems facing the world: this particularly applies to buying locally produced and seasonal food (50-52% vs. 34% of those who do not identify climate change as one of the most serious global issues).
20 The four most-cited actions are: "You try to reduce your waste and you regularly separate it for recycling"; "You try to cut down on your consumption of disposable items whenever possible, e.g. plastic bags from the supermarket, excessive packaging"; "You buy locally produced and seasonal food whenever possible"; and "When buying a new household appliance, e.g. washing machine, fridge or TV, you choose lower energy consumption is an important factor in your choice".
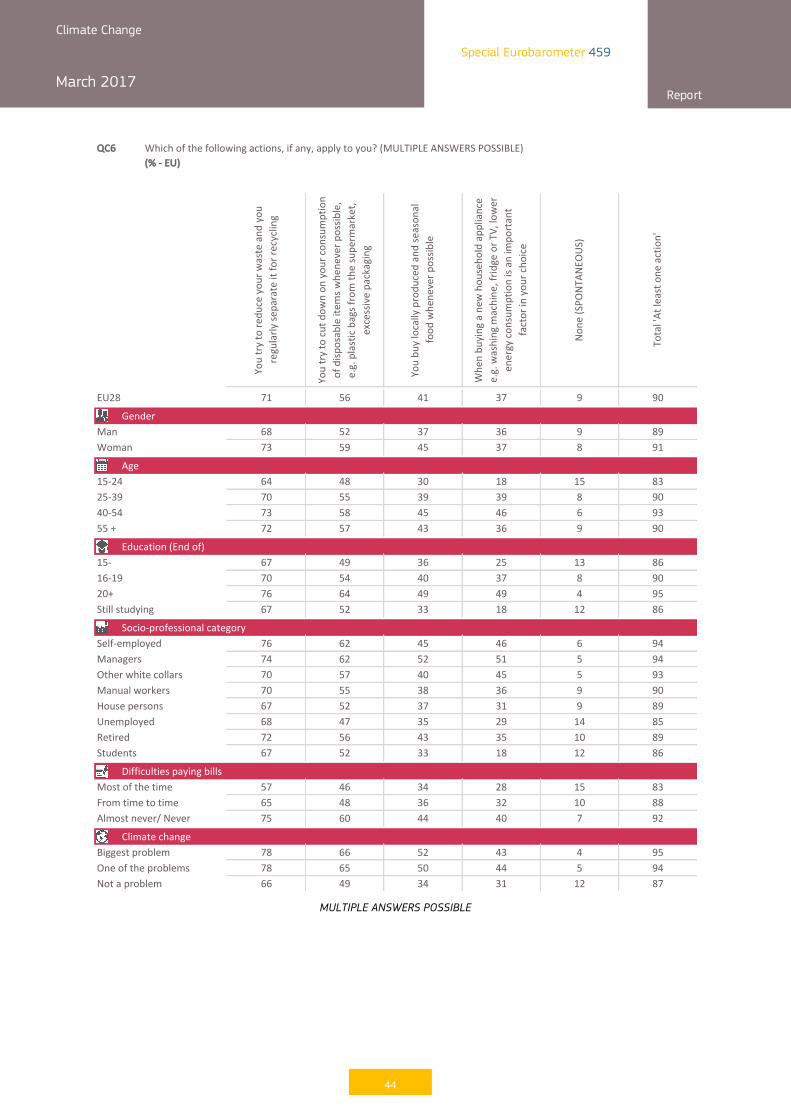
44
Climate Change March 2017
Report
Special Eurobarometer 459
MULTIPLE ANSWERS POSSIBLE
QC6
Youtrytore
duceyou
rwasteand
you
regularly
separateitfo
rrecycling
Youtrytocutdow
non
you
rcon
sumption
ofdisp
osableitem
swhe
neverp
ossib
le,
e.g.plasticbagsfromth
esupe
rmarket,
excessivepackaging
Youbu
ylocallyprodu
cedandseason
al
food
whe
neverp
ossib
le
Whe
nbu
yinganew
hou
seho
ldapp
liance
e.g.washingm
achine
,frid
georT
V,lower
energycon
sumptionisanim
portant
factorinyou
rcho
ice
Non
e(SPO
NTA
NEO
US)
Total'Atleasto
neaction'
EU28 71 56 41 37 9 90
GenderMan 68 52 37 36 9 89Woman 73 59 45 37 8 91
Age15-24 64 48 30 18 15 8325-39 70 55 39 39 8 9040-54 73 58 45 46 6 9355+ 72 57 43 36 9 90
Education(Endof)15- 67 49 36 25 13 8616-19 70 54 40 37 8 9020+ 76 64 49 49 4 95Stillstudying 67 52 33 18 12 86
Socio-professionalcategorySelf-employed 76 62 45 46 6 94Managers 74 62 52 51 5 94Otherwhitecollars 70 57 40 45 5 93Manualworkers 70 55 38 36 9 90Housepersons 67 52 37 31 9 89Unemployed 68 47 35 29 14 85Retired 72 56 43 35 10 89Students 67 52 33 18 12 86
DifficultiespayingbillsMostofthetime 57 46 34 28 15 83Fromtimetotime 65 48 36 32 10 88Almostnever/Never 75 60 44 40 7 92
ClimatechangeBiggestproblem 78 66 52 43 4 95Oneoftheproblems 78 65 50 44 5 94Notaproblem 66 49 34 31 12 87
Whichofthefollowingactions,ifany,applytoyou?(MULTIPLEANSWERSPOSSIBLE)(%-EU)

45
Climate Change March 2017
Report
Special Eurobarometer 459
III. ATTITUDES TOWARDS FIGHTING CLIMATE CHANGE AND TRANSITION TO CLEAN ENERGIES
Respondents were asked whether they agree or disagree with five statements relating to the fight against climate change, energy use, energy efficiency and the use of fossil fuel. The list of statements was modified from the 2015 survey, to read:
§ “Fighting climate change and using energy more efficiently can boost the economy and jobs in the EU”;
§ “Promoting EU expertise in new clean technologies to countries outside the EU can benefit the EU economically” (new);
§ “Reducing fossil fuel imports from outside the EU can benefit the EU economically”;
§ “Reducing fossil fuel imports from outside the EU can increase the security of EU energy supplies”;
§ “More public financial support should be given to the transition to clean energies even if it means subsidies to fossil fuels should be reduced” (new).
1 Attitudes towards fighting climate change
- Around eight in ten respondents think fighting climate change and using energy more efficiently can boost the economy and jobs in the EU -
Almost eight respondents in ten (79%, -2 percentage points from 2015) agree that fighting climate change and using energy more efficiently can boost the economy and jobs in the EU21. Just over a third (34%, -3 pp) totally agree with this statement and over four in ten respondents (45%, +1 pp) tend to agree. One in ten respondents (10% -1 pp) disagree and fewer than one in twenty (2%, no change) totally disagree.
Responses to this question have remained stable since 2011, with the proportion of respondents agreeing with the statement only one percentage point higher in 2017 than it was in 2011.
21 QC4.1: To what extent do you agree or disagree with each of the following statements? Fighting climate change and using energy more efficiently can boost the economy and jobs in the EU.

46
Climate Change March 2017
Report
Special Eurobarometer 459
- Majority in all Member States say fighting climate change can boost economic growth -
In all Member States, a strong majority of respondents agree that fighting climate change and using energy more efficiently can boost the economy and jobs in the EU. More than eight in ten respondents agree in Sweden and Ireland (both 88%) and Greece and Portugal (both 87%). At the other end of the scale, nearly six in ten respondents in Estonia (58%) and nearly two-thirds in Latvia and the Czech Republic (both 65%) agree – these are still relatively high shares.
Nearly six in ten people in Sweden (58%) and nearly half in Spain (48%) and Denmark (47%) totally agree that fighting climate change and using energy more efficiently can boost the economy and jobs in the EU. In contrast, only one in five respondents or less in Estonia (14%), the Czech Republic (19%) and Latvia (20%) totally agree with this statement.
QC4.1 Towhatextentdoyouagreeordisagreewitheachofthefollowingstatements?FightingclimatechangeandusingenergymoreefficientlycanboosttheeconomyandjobsintheEU(%-EU28)
34
45
8
2
11
37
44
9
2
8
31
49
11
3
6
29
49
10
3
9
TOTALLYAGREE
TENDTOAGREE
TENDTODISAGREE
TOTALLYDISAGREE
DON'TKNOW
Mar.2017 May-June2015 Nov.-Dec.2013 June2011

47
Climate Change March 2017
Report
Special Eurobarometer 459
At national level, the proportion of people who agree that fighting climate change and using energy more efficiently can boost the economy and jobs in the EU has risen in eight Member States, led by the Netherlands (82%, +9 percentage points) and Denmark (86%, +7 pp). In 15 Member States, especially in Slovakia (73%, -10 pp), Hungary (73%, -9 pp), the Czech Republic (65%, -9 pp), Slovenia (79%, -8 pp), Italy (76%, -8 pp) and Bulgaria (70%, -8 pp), respondents are less likely to agree with this statement now than they were in 2015.

48
Climate Change
March 2017 Report
Special Eurobarometer 459
QC4.1
Totallyagree
2017-
2015
Tend
toagree
2017-
2015
Tend
todisa
gree
2017-
2015
Totallydisa
gree
2017-
2015
Total'Ag
ree'
2017-
2015
Total'Disagree'
2017-
2015
Don'tk
now
EU28 34 3 45 1 8 1 2 = 79 2 10 1 11
NL 37 11 45 2 11 4 2 2 82 9 13 6 5DK 47 14 39 7 5 5 1 1 86 7 6 6 8AT 33 1 47 5 13 2 2 2 80 4 15 4 5HR 33 6 51 9 7 1 3 = 84 3 10 1 6FI 35 2 49 1 7 1 2 = 84 3 9 1 7BE 30 3 50 1 12 2 3 1 80 2 15 1 5IE 46 2 42 1 5 1 0 1 88 1 5 2 7LT 23 5 52 6 8 4 2 1 75 1 10 5 15DE 31 = 48 = 9 4 3 1 79 = 12 1 9FR 38 = 44 = 7 1 3 = 82 = 10 1 8CY 43 10 42 10 5 1 1 = 85 = 6 3 9LV 20 3 45 3 15 1 5 2 65 = 20 1 11PL 25 4 51 4 11 = 2 1 76 = 13 1 15EE 14 5 44 4 14 1 5 2 58 1 19 3 23EL 38 12 49 9 6 1 1 = 87 3 7 1 6ES 48 10 37 7 2 = 0 1 85 3 2 1 6LU 36 7 46 4 7 3 2 1 82 3 9 1 13RO 30 13 42 10 14 6 2 1 72 3 16 2 9SE 58 10 30 13 4 = 2 1 88 3 6 5 12MT 41 9 41 5 4 = 2 = 82 4 6 = 12PT 44 6 43 1 2 1 0 = 87 7 2 1 11UK 30 2 43 5 8 2 2 = 73 7 10 2 17BG 33 9 37 1 5 = 1 3 70 8 6 5 9IT 31 8 45 = 7 1 3 1 76 8 10 2 14SI 39 9 40 1 10 5 2 = 79 8 12 3 24CZ 19 11 46 2 17 = 3 = 65 9 20 5 9HU 28 9 45 = 14 4 4 1 73 9 18 = 15SK 25 8 48 2 9 = 1 = 73 10 10 = 17
Towhatextentdoyouagreeordisagreewitheachofthefollowingstatements?FightingclimatechangeandusingenergymoreefficientlycanboosttheeconomyandjobsintheEU(%)

49
Climate Change March 2017
Report
Special Eurobarometer 459
There are not many differences in opinion on these statements between socio-demographic groups. In each category, around seven in ten or more respondents agree that fighting climate change and using energy more efficiently can boost the economy and jobs in the EU. The main difference concerns the ‘don’t know’ answer, which ranks higher among older respondents and respondents who left school before the age of 15.
However, a pattern can be observed between responses to this question and respondents' views on the seriousness of climate change:
§ Respondents who see climate change as the single biggest or one of the most serious problems facing the world are more likely to agree with this statement than those who do not (87% vs. 72%);
§ Respondents who view climate change as a very serious problem are more likely to agree with this statement than respondents who do not think it is a serious problem (84% vs. 52%).
QC4.1To
tal'Ag
ree'
Total'Disagree'
Don
'tknow
EU28 79 10 11
GenderMan 80 12 8Woman 77 9 14
Age15-24 80 11 925-39 81 10 940-54 81 11 855+ 75 10 15
Education(Endof)15- 68 10 2216-19 78 12 1020+ 85 9 6Stillstudying 81 10 9
ClimatechangeBiggestproblem 87 7 6Oneoftheproblems 86 7 7Notaproblem 72 13 15
PerceptionofclimatechangeNotaseriousproblem 52 32 16Afairlyseriousproblem 72 14 14Averyseriousproblem 84 7 9
To what extent do you agree or disagree with each of thefollowingstatements?FightingclimatechangeandusingenergymoreefficientlycanboosttheeconomyandjobsintheEU(%-EU)

50
Climate Change March 2017
Report
Special Eurobarometer 459
2 Attitudes towards reducing fossil fuel imports
- Nearly two-thirds of respondents think reducing fossil fuel imports from outside the EU can benefit the EU economically -
There has been no change in the proportion of people who agree that reducing fossil fuel imports from outside the EU can benefit the EU economically: nearly two-thirds of respondents (65%, no change from 2015) agree that reducing fossil fuel imports from outside the EU can benefit the EU economically22. A quarter (25%, -1 percentage point) totally agree and four in ten (40%, +1 pp) tend to agree. Almost one in five individuals (17%, -1 pp) disagree with this statement, while less than one in twenty (3%, -1 pp) totally disagree.
Almost one in five respondents (18%, +1 pp) do not know if reducing fossil fuel imports from outside the EU can benefit the EU economically.
22 QC4.3: To what extent do you agree or disagree with each of the following statements? Reducing fossil fuel imports from outside the EU can benefit the EU economically.
QC4.3 Towhatextentdoyouagreeordisagreewitheachofthefollowingstatements?ReducingfossilfuelimportsfromoutsidetheEUcanbenefittheEUeconomically(%-EU28)
25
40
14
3
18
26
39
14
4
17
26
44
14
4
12
TOTALLYAGREE
TENDTOAGREE
TENDTODISAGREE
TOTALLYDISAGREE
DON'TKNOW
Mar.2017 May-June2015 Nov.-Dec.2013

51
Climate Change March 2017
Report
Special Eurobarometer 459
A majority of respondents in all Member States but one agree that reducing fossil fuel imports from outside the EU can benefit the EU economically. This proportion is the highest in Portugal and Ireland (both 79%) and Italy (75%). Individuals in Estonia (38%), Latvia (51%) and Luxembourg (52%) are the least likely to agree with this statement.
Nearly four in ten respondents in Portugal and Ireland (both 39%) and Malta (36%) totally agree that reducing fossil fuel imports from outside the EU can benefit the EU economically. At the opposite end of the scale, respondents in Estonia (9%) and Latvia, Belgium and Luxembourg (all 15%) are the least likely to do so.
Since 2015, there have been a number of changes in national trends. Respondents in 10 Member States, especially Sweden (64%, +13 percentage points), Finland (65%, +9 pp), Cyprus (69%, +6 pp) and Latvia (51%, +6 pp), are now more likely to agree that reducing fossil fuel imports from outside the EU can benefit the EU economically.
The share of respondents who agree with this statement has decreased in 15 Member States, notably the United Kingdom (58%, -9 pp) and Slovenia (59%, -7 pp), where nearly six in ten still agree.

52
Climate Change
March 2017 Report
Special Eurobarometer 459
QC4.3
Totallyagree
2017-
2015
Tend
toagree
2017-
2015
Tend
todisa
gree
2017-
2015
Totallydisa
gree
2017-
2015
Total'Ag
ree'
2017-
2015
Total'Disagree'
2017-
2015
Don'tk
now
EU28 25 1 40 1 14 = 3 1 65 = 17 1 18
SE 27 12 37 1 15 6 6 = 64 13 21 7 15FI 21 5 44 4 15 5 3 1 65 9 18 1 17CY 29 = 40 6 7 12 4 4 69 6 11 6 20LV 15 4 36 2 19 3 6 1 51 6 25 = 24IE 39 4 40 1 7 14 2 1 79 5 9 4 12PL 21 2 48 7 13 2 3 1 69 5 16 1 15DK 26 8 35 4 12 2 6 1 61 4 18 2 18HR 27 = 43 4 14 3 5 = 70 4 19 2 11LT 18 1 43 3 13 7 4 1 61 4 17 3 21MT 36 2 35 2 8 8 3 2 71 4 11 5 22NL 24 8 37 4 23 11 4 4 61 4 27 3 12EE 9 1 29 2 17 8 8 1 38 3 25 1 10FR 18 3 39 = 16 7 5 1 57 3 21 1 22AT 30 1 43 4 14 4 3 = 73 3 17 1 37DE 27 1 38 1 16 1 4 1 65 2 20 6 15BE 15 = 45 = 27 6 4 1 60 = 31 = 21BG 26 = 31 = 7 6 3 6 57 = 10 5 9ES 34 7 36 7 7 1 2 1 70 = 9 9 33IT 29 7 46 6 7 15 3 1 75 1 10 1 15SK 20 4 41 1 13 2 3 1 61 3 16 = 23EL 24 12 47 8 12 1 3 = 71 4 15 1 14CZ 16 3 38 2 19 16 5 1 54 5 24 1 17LU 15 4 37 1 19 11 7 2 52 5 26 9 16HU 21 6 38 1 15 1 7 1 59 5 22 3 19PT 39 2 40 3 3 11 1 1 79 5 4 1 22RO 24 11 39 6 17 2 4 = 63 5 21 = 22SI 26 6 33 1 21 1 6 1 59 7 27 4 14UK 21 1 37 8 15 3 3 2 58 9 18 1 24
Towhatextentdoyouagreeordisagreewitheachofthefollowingstatements?ReducingfossilfuelimportsfromoutsidetheEUcanbenefittheEUeconomically(%)

53
Climate Change March 2017
Report
Special Eurobarometer 459
There are few significant differences between socio-demographic groups concerning this statement. The main difference is the share of “don’t know” answers.
Once again, however, there is a strong correlation between the belief that climate change is a serious problem and agreement that reducing fossil fuel imports from outside the EU can benefit the EU economically:
• Respondents who see climate change as the biggest or one of the most serious problems facing the world are more likely to agree with this statement than those who do not (69-70% vs 61%);
• Respondents who view climate change as a very serious problem (69%) are more likely to agree than those who think it is a not serious problem (49%).
QC4.3
Total'Ag
ree'
Total'Disagree'
Don
'tknow
EU28 65 17 18
GenderMan 67 20 13Woman 62 15 23
Age15-24 66 19 1525-39 69 16 1540-54 68 17 1555+ 60 17 23
Education(Endof)15- 56 15 2916-19 65 18 1720+ 69 18 13Stillstudying 66 19 15
ClimatechangeBiggestproblem 70 17 13Oneoftheproblems 69 17 14Notaproblem 61 18 21
PerceptionofclimatechangeNotaseriousproblem 49 33 18Afairlyseriousproblem 58 21 21Averyseriousproblem 69 15 16
To what extent do you agree or disagree with each of the followingstatements?Reducing fossil fuel imports from outside the EU can benefit the EUeconomically(%-EU)

54
Climate Change March 2017
Report
Special Eurobarometer 459
- Around two-thirds of respondents agree that reducing fossil fuel imports from outside the EU can increase the security of EU energy supplies -
Nearly two-thirds of respondents (64%, -1 percentage point compared to 2015) agree that reducing fossil fuel imports from outside the EU can increase the security of EU energy supplies23. A quarter (25%, -1 pp) totally agree, while just under four in ten (39%, no change) tend to agree.
Almost one in five respondents (17%, +1 pp) disagree that reducing fossil fuel imports from outside the EU can increase the security of EU energy supplies, with just over one in ten (13%, -1 pp) tending to disagree and fewer than one in twenty (4%, no change) totally disagreeing.
Meanwhile, almost one in five (19%, +2 pp) expressed no opinion on this statement.
23 QA4.4: To what extent do you agree or disagree with each of the following statements? Reducing fossil fuel imports from outside the EU can increase the security of EU energy supplies.
QC4.4 Towhatextentdoyouagreeordisagreewitheachofthefollowingstatements?
Reducing fossil fuel imports from outside the EU can increase the security of EU energy
supplies(%-EU28)
(Mar.2017-May-June2015)
Totallyagree
25(-1)
Tendtoagree
39(=)
Tendtodisagree
13(-1)
Totallydisagree
4(=)
Don'tknow
19(+2)

55
Climate Change March 2017
Report
Special Eurobarometer 459
In 25 Member States, a majority of respondents agree that reducing fossil fuel imports from outside the EU can increase the security of EU energy supplies, led by Ireland (78%), Portugal (77%), Spain and Italy (both 72%). At the other end of the scale, around four in ten respondents in Estonia (39%) and nearly half in Luxembourg (47%) and the Netherlands (49%) also agree with this statement.
Nearly four in ten respondents in Ireland (39%), Portugal and Spain (both 37%) totally agree with this statement, while respondents are least likely to totally agree in Estonia (10%), Belgium (14%) and Latvia, the Czech Republic and Luxembourg (all 16%).
There have been increases in 14 Member States since 2015 in the proportion of respondents who agree that reducing fossil fuel imports from outside the EU can increase the security of EU energy supplies, especially Finland (60%, +10 percentage points), Lithuania (64%, +8 pp) and Latvia (56%, +8 pp).
The share of respondents agreeing with this statement has fallen in 13 Member States, notably Portugal (77%, -8 pp), Greece (67%, -8 pp) - though over two-thirds of respondents still agree - and Luxembourg (47%, -8 pp), where nearly half still agree.

56
Climate Change
March 2017 Report
Special Eurobarometer 459
QC4.4
Totallyagree
2017-
2015
Tend
toagree
2017-
2015
Tend
todisa
gree
2017-
2015
Totallydisa
gree
2017-
2015
Total'Ag
ree'
2017-
2015
Total'Disagree'
2017-
2015
Don'tk
now
EU28 25 1 39 = 13 1 4 = 64 1 17 1 19
FI 17 1 43 9 19 = 4 1 60 10 23 1 18LV 16 2 40 6 14 2 4 4 56 8 18 8 16LT 20 4 44 4 10 6 4 2 64 8 14 6 14DK 29 7 37 2 12 2 4 1 66 5 16 3 13FR 19 6 38 1 12 2 5 1 57 5 17 3 33SE 36 11 31 6 14 4 6 1 67 5 20 3 16IE 39 5 39 1 8 2 2 = 78 4 10 2 12MT 34 2 37 6 7 2 2 2 71 4 9 4 28HR 25 1 44 4 14 3 5 1 69 3 19 2 38BG 25 1 31 3 8 4 3 5 56 2 11 9 22EE 10 1 29 3 17 2 6 1 39 2 23 1 26DE 27 1 39 = 17 4 4 1 66 1 21 1 18ES 37 3 35 4 5 = 2 1 72 1 7 5 12NL 18 3 31 2 27 1 8 3 49 1 35 2 17PL 21 2 45 2 17 4 3 = 66 = 20 4 17AT 26 7 45 6 14 1 3 = 71 1 17 1 9CY 24 4 36 2 9 1 3 5 60 2 12 1 13SK 22 1 41 1 12 1 2 = 63 2 14 6 26BE 14 1 43 4 28 9 6 1 57 3 34 = 17IT 29 6 43 3 9 1 2 1 72 3 11 8 21HU 22 5 40 1 15 3 6 = 62 4 21 8 23RO 25 10 38 6 16 8 4 = 63 4 20 3 12CZ 16 4 38 2 20 4 5 1 54 6 25 5 26SI 28 4 34 2 20 7 6 2 62 6 26 3 21UK 22 1 38 6 11 2 3 = 60 7 14 2 23EL 24 11 43 3 14 3 3 1 67 8 17 1 20LU 16 2 31 6 23 1 7 3 47 8 30 4 12PT 37 6 40 2 4 1 1 = 77 8 5 4 17
Towhatextentdoyouagreeordisagreewitheachofthefollowingstatements?ReducingfossilfuelimportsfromoutsidetheEUcanincreasethesecurityofEUenergysupplies(%)

57
Climate Change March 2017
Report
Special Eurobarometer 459
Again, there are no major differences between socio-demographic categories. The main differences relate to the proportion of “don’t know” answers, which are higher among women, older respondents, and respondents with a lower level of education.
However, the more respondents believe climate change is a serious issue, the more likely they are to agree that reducing fossil fuel imports from outside the EU can increase the security of EU energy supplies.
QC4.4
Total'Agree'
Total'Disagree'
Don
'tkno
w
EU28 64 17 19
Gender
Man 67 20 13
Woman 62 14 24
Age
15-24 67 17 16
25-39 69 15 16
40-54 67 17 16
55+ 59 18 23
Education(Endof)
15- 57 13 30
16-19 65 17 18
20+ 68 19 13
Stillstudying 70 16 14
Perceptionofclimatechange
Notaseriousproblem 48 34 18
Afairlyseriousproblem 59 20 21
Averyseriousproblem 68 15 17
To what extent do you agree or disagree with each of the followingstatements?Reducing fossil fuel imports from outside the EU can increase thesecurityofEUenergysupplies(%-EU)

58
Climate Change March 2017
Report
Special Eurobarometer 459
3 Attitudes towards the economic benefits of promoting EU expertise in clean technologies outside the EU
- Over three-quarters of respondents agree that promoting EU expertise in new clean technologies to third countries can benefit the EU economically -
Over three-quarters of respondents (77%) agree that promoting EU expertise in new clean technologies to countries outside the EU can benefit the EU economically, with a third (33%) totally agreeing24.
Fewer than one in ten respondents (9%) disagree with this statement, including just 2% who totally disagree. Over one in ten (14%) expressed no opinion on the statement.
24 QC4.4: To what extent do you agree or disagree with each of the following statements? Promoting EU expertise in new clean technologies to countries outside the EU can benefit the EU economically.
QC4.2 Towhatextentdoyouagreeordisagreewitheachofthefollowingstatements?PromotingEUexpertiseinnewcleantechnologiestocountriesoutsidetheEUcanbenefittheEUeconomically(%-EU28)
Totallyagree33
Tendtoagree44
Tendtodisagree7
Totallydisagree2
Don'tknow14

59
Climate Change March 2017
Report
Special Eurobarometer 459
In all Member States, a majority of respondents agree that promoting EU expertise in new clean technologies to countries outside the EU can benefit the EU economically. Over nine in ten respondents in the Netherlands (91%) agree with this statement as do over eight in ten in Ireland (87%) Sweden and Finland (both 85%). At the lower end of the scale, around two-thirds of respondents in Estonia (65%), Romania (68%), Latvia, the Czech Republic and Italy (all 69%) share this opinion; yet, these are still significantly high shares.
Nearly half of respondents in Sweden (49%) and Denmark and the Netherlands (both 47%) totally agree that promoting EU expertise in new clean technologies to countries outside the EU can benefit the EU economically. At the other end of the scale, this statement is agreed to the least by respondents in Estonia (19%), the Czech Republic (21%) and Latvia (23%).
60
Climate Change March 2017
Report
Special Eurobarometer 459
Again, there is a relatively wide consensus across socio-demographic groups on this question. Over seven in ten respondents in almost every socio-demographic group agree that promoting EU expertise in new clean technologies to countries outside the EU can benefit the EU economically. As for the previous questions, the main differences concern the rate of “don’t know” responses.
For example, 85% of respondents who finished education at the age of 20 or above agree with the statement, while 62% of those who left school at age 15 or earlier agree. The longest-educated respondents are much less likely to answer “don’t know” those who left school earliest (8% vs. 28%). Therefore, there is only a small difference between disagreement levels in these two groups (7% vs. 10%).
QC4.2
Total'Ag
ree'
Total'Disagree'
Don
'tknow
EU28 77 9 14
GenderMan 80 10 10Woman 74 8 18
Age15-24 80 8 1225-39 79 9 1240-54 81 9 1055+ 72 9 19
Education(Endof)15- 62 10 2816-19 76 10 1420+ 85 7 8Stillstudying 83 7 10
To what extent do you agree or disagree with each of the followingstatements?Promoting EU expertise in new clean technologies to countriesoutsidetheEUcanbenefittheEUeconomically(%-EU)

61
Climate Change March 2017
Report
Special Eurobarometer 459
4 Attitudes towards public financial support to clean energies vis-à-vis subsidies to fossil fuels
- Nearly eight in ten respondents agree that more public financial support should go to the transition to clean energies even if it means reducing fossil fuel subsidies -
Nearly eight in ten respondents (79%) agree that more public financial support should be given to the transition to clean energies even if it means subsidies to fossil fuels are reduced25. Just under four in ten respondents (39%) totally agree and four in ten (40%) tend to agree. Less than one in ten respondents (9%) disagree with this idea, including just 2% who totally disagree.
Over one in ten respondents (12%) expressed no opinion on this statement.
25 QC4.5: To what extent do you agree or disagree with each of the following statements? More public financial support should be given to the transition to clean energies even if it means subsidies to fossil fuels should be reduced.
QC4.5 Towhatextentdoyouagreeordisagreewitheachofthefollowingstatements?More public financial support should be given to the transition to clean energies even if itmeanssubsidiestofossilfuelsshouldbereduced(%-EU28)
Totallyagree39
Tendtoagree40
Tendtodisagree7
Totallydisagree2
Don'tknow12

62
Climate Change March 2017
Report
Special Eurobarometer 459
In all Member States, a majority of respondents agree that more public financial support should be given to the transition to clean energies, even if it means subsidies to fossil fuels are reduced. Respondents are most likely to agree with this statement in Malta (90%), Greece (89%) and Ireland (88%) and least likely to agree in Bulgaria (65%), Estonia (68%) and Romania (70%).
Six in ten respondents in Sweden (60%) totally agree with this statement, as do at least half in Spain (53%), the Netherlands and Cyprus (both 50%). At the other end of the scale, just over a quarter of respondents in the Czech Republic, Slovakia and Estonia (all 27%) totally agree.

63
Climate Change March 2017
Report
Special Eurobarometer 459
Views on this statement again reveal few differences among socio-demographic groups. In almost all categories, at least seven in ten respondents agree that more public financial support should be given to the transition to clean energies even if it means reducing subsidies to fossil fuels.
However, the more respondents think climate change is a serious problem, the more they agree with this statement: 84% of respondents who say climate change is a very serious problem agree, compared with 60% of respondents who do not think it is a serious issue.
QC4.5
Total'Agree'
Total'Disagree'
Don
'tkno
w
EU28 79 9 12
Gender
Man 81 11 8
Woman 76 9 15
Age
15-24 79 10 11
25-39 82 9 9
40-54 82 9 9
55+ 76 9 15
Education(Endof)
15- 70 9 21
16-19 78 10 12
20+ 85 9 6
Stillstudying 82 10 8
Perceptionofclimatechange
Notaseriousproblem 60 25 15
Afairlyseriousproblem 71 15 14
Averyseriousproblem 84 7 9
To what extent do you agree or disagree with each of the followingstatements?More public financial support should be given to the transition toclean energies even if it means subsidies to fossil fuels should bereduced(%-EU)

64
Climate Change March 2017
Report
Special Eurobarometer 459
IV. LOOKING TO THE FUTURE
In the final question of the survey, respondents were asked for their views on the importance of government involvement in tackling climate change over the period up to 2030.
1 Targets for renewable energy
- Around nine in ten respondents say it is important for national government to set targets to increase renewable energy use by 2030 -
Respondents were asked how important they think it is for their national government to set targets to increase the amount of renewable energy used by 203026.
§ Almost nine in ten respondents (89%, -2 percentage points compared to 2015) think it is important; more than half of respondents (51%, -1 pp) believe it is very important.
§ Fewer than one in ten respondents (7%, +1 pp) say it is not important, including just one in twenty who say it is not very important (5%, no change) and one in fifty who say it is not important at all (2%, +1 pp).
Results for this question have remained stable since 2013.
26 QC7: How important do you think it is that the (NATIONALITY) government sets targets to increase the amount of renewable energy used, such as wind or solar power, by 2030?
QC7 Howimportantdoyouthinkitisthatthe(NATIONALITY)governmentsetstargetstoincreasetheamountofrenewableenergyused,suchaswindorsolarpower,by2030? (%-EU28)
51
38
5
2
4
52
39
5
1
3
49
41
6
2
2
VERYIMPORTANT
FAIRLYIMPORTANT
NOTVERY IMPORTANT
NOTATALLIMPORTANT
DON'TKNOW
Mar.2017 May-June2015 Nov.-Dec.2013

65
Climate Change March 2017
Report
Special Eurobarometer 459
In all Member States, a majority of respondents say that it is important for their national government to set targets to increase the amount of renewable energy used by 2030. Almost all respondents in Malta (99%) and Cyprus and the Netherlands (both 97%) agree. Even at the lower end of the scale, around eight in ten respondents in Bulgaria (77%) and Latvia, the Czech Republic and Romania (all 82%) agree with this statement.
More than eight in ten respondents in Cyprus (81%) and three-quarters in the Netherlands and Denmark (both 75%) also consider government targets very important. People in Slovakia and Poland (both 32%) and the Czech Republic (35%) are the least likely to share this opinion.
Since 2015, the proportion who say it is important for their national government to set renewable energy targets has somewhat risen in ten Member States, led by France (94%, +4 pp) and Lithuania (93%, +4 pp). The share has decreased in 14 Member States, notably Romania (82%, -9 pp), Italy (86%, -5 pp) and Croatia (89%, -4 pp), yet over eight in ten respondents in these Member States still agree with this statement.

66
Climate Change
March 2017 Report
Special Eurobarometer 459
QC7
Veryim
portant
2017-
2015
Fairlyim
portant
2017-
2015
Notveryim
portant
2017-
2015
Notata
llim
portant
2017-
2015
Total'Im
portant'
2017-
2015
Total'Not
impo
rtant'
2017-
2015
Don'tk
now
EU28 51 1 38 1 5 = 2 1 89 2 7 1 4
FR 52 8 42 4 3 3 1 1 94 4 4 4 2LT 48 5 45 1 3 3 1 = 93 4 4 3 3DK 75 12 21 10 2 2 0 1 96 2 2 2 1LV 45 8 37 6 10 1 5 = 82 2 15 3 2MT 73 11 26 13 0 2 0 = 99 2 0 1 1AT 53 3 40 1 4 3 1 = 93 2 5 3 2PL 32 2 53 = 8 2 1 = 85 2 9 2 6SI 68 11 26 9 4 1 1 = 94 2 5 1 3IE 63 3 33 2 1 2 0 = 96 1 1 2 3ES 58 = 36 1 2 1 0 = 94 1 2 1 4EE 40 7 45 7 7 2 2 = 85 = 9 = 0LU 57 = 37 = 3 = 2 1 94 = 5 1 1NL 75 6 22 6 2 1 1 1 97 = 3 = 3PT 48 3 46 3 2 1 1 1 94 = 3 2 6BG 39 2 38 3 4 2 2 3 77 1 6 = 2CY 81 2 16 1 1 = 0 = 97 1 1 1 1SE 74 8 18 9 4 1 3 2 92 1 7 5 17EL 64 4 30 2 4 1 1 1 94 2 5 2 1HU 56 1 37 1 3 = 2 1 93 2 5 1 2UK 61 1 28 1 4 1 1 1 89 2 5 2 6BE 52 2 37 5 10 3 1 = 89 3 11 3 1CZ 35 1 47 2 11 2 3 = 82 3 14 3 0DE 48 7 40 4 6 1 2 = 88 3 8 1 4SK 32 4 51 1 6 1 3 1 83 3 9 = 8FI 51 2 41 5 6 2 1 1 92 3 7 2 4HR 50 1 39 3 7 3 2 1 89 4 9 4 2IT 43 7 43 2 7 2 1 = 86 5 8 2 6RO 53 1 29 10 11 6 3 3 82 9 14 9 4
Howimportantdoyouthinkitisthatthe(NATIONALITY)governmentsetstargetstoincreasetheamountofrenewableenergyused,suchaswindorsolarpower,by2030?(%)

67
Climate Change March 2017
Report
Special Eurobarometer 459
Socio-demographic differences on this issue are not very marked. In all categories, around nine in ten respondents think that their national government should set targets to increase the amount of renewable energy used by 2030.
However, there are some differences between socio-demographic groups in terms of “very important” responses. Those who finished education at or after the age of 20 are much more likely to think that it is very important than those who left school at or before the age of 15 (59% vs. 43%). Meanwhile, six in ten respondents who are managers or self-employed (60%) think it is very important, compared to only 43% of house persons.
As in 2015, perceptions of the seriousness of climate change also have an impact on views on governments setting national targets to increase the amount of renewable energy used by 2030:
• Respondents who see climate change as the biggest problem facing the world are more likely to think that it is very important than those who do not believe climate change is among the most serious issues (67% vs. 42%);
• Respondents who view climate change as a very serious problem are more likely to think that it is very important than those who think it is not a serious problem (58% vs. 32%).
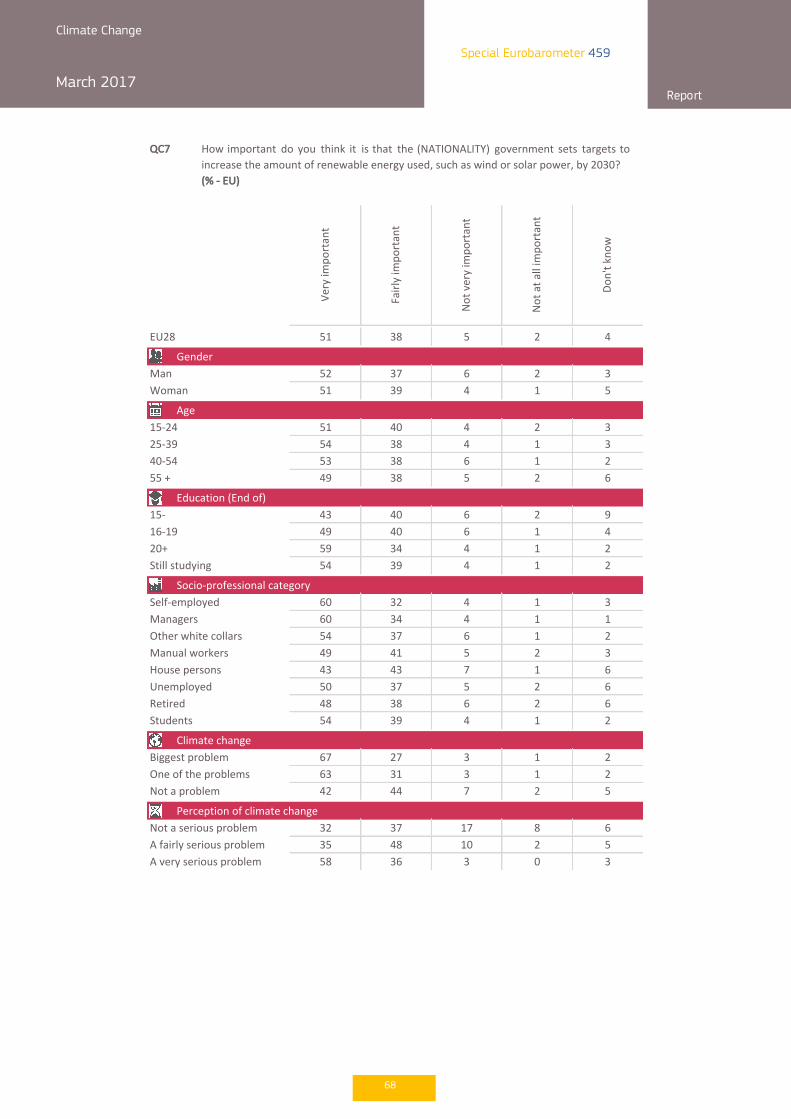
68
Climate Change March 2017
Report
Special Eurobarometer 459
QC7
Veryim
portant
Fairlyim
portant
Notveryim
portant
Notatallim
portant
Don'tknow
EU28 51 38 5 2 4
Man 52 37 6 2 3
Woman 51 39 4 1 5
15-24 51 40 4 2 3
25-39 54 38 4 1 3
40-54 53 38 6 1 2
55+ 49 38 5 2 6
15- 43 40 6 2 9
16-19 49 40 6 1 4
20+ 59 34 4 1 2
Stillstudying 54 39 4 1 2
Self-employed 60 32 4 1 3
Managers 60 34 4 1 1
Otherwhitecollars 54 37 6 1 2
Manualworkers 49 41 5 2 3
Housepersons 43 43 7 1 6
Unemployed 50 37 5 2 6
Retired 48 38 6 2 6
Students 54 39 4 1 2
Biggestproblem 67 27 3 1 2
Oneoftheproblems 63 31 3 1 2
Notaproblem 42 44 7 2 5
Notaseriousproblem 32 37 17 8 6
Afairlyseriousproblem 35 48 10 2 5
Averyseriousproblem 58 36 3 0 3
Perceptionofclimatechange
How important do you think it is that the (NATIONALITY) government sets targets to
increasetheamountofrenewableenergyused,suchaswindorsolarpower,by2030?
(%-EU)
Gender
Age
Education(Endof)
Socio-professionalcategory
Climatechange

69
Climate Change March 2017
Report
Special Eurobarometer 459
2 Energy efficiency targets
- Almost nine in ten respondents think it is important for their national government to support improved energy efficiency by 2030 -
Finally, respondents were asked how important they think it is for their national government to support energy efficiency measures27.
This question was modified slightly from 2015, when it read: "How important do you think it is that the [NATIONALITY] government provides support for energy efficiency (for example, by encouraging people to insulate their home or purchase low energy light bulbs) by 2030?". This time, it read: "How important do you think it is that the (NATIONALITY) government provides support for improving energy efficiency by 2030 (e.g. by encouraging people to insulate their home or buy electric cars)?"
§ An absolute majority of respondents (88%, -4 percentage points since 2015) think it is important; nearly half (48%) think this is very important and four in ten (40%) think it is fairly important.
§ Fewer than one in ten respondents (8%, +2 pp) think that it is not important, including 2% who think it is not important at all.
The proportion of respondents who think it is very important has decreased by 4 percentage points since 2015, while the share seeing it as fairly important has remained the same.
27 QC8: How important do you think it is that the (NATIONALITY) government provides support for improving energy efficiency by 2030 (e.g. by encouraging people to insulate their home or buy electric cars)?
QC8 How important do you think it is that the (NATIONALITY) government provides support
for improving energy efficiency by 2030 (e.g. by encouraging people to insulate their
homeorbuyelectriccars)?
(%-EU28)
48
40
6
2
4
52
40
5
1
2
51
41
5
1
2
VERYIMPORTANT
FAIRLYIMPORTANT
NOTVERY IMPORTANT
NOTATALLIMPORTANT
DON'TKNOW
Mar.2017 May-June2015 Nov.-Dec.2013

70
Climate Change March 2017
Report
Special Eurobarometer 459
In all Member States, an overwhelming majority of respondents think that it is important for their national government to provide support to improve energy efficiency by 2030. Nearly all respondents in Malta and Cyprus (both 97%) and Denmark (96%) agree and - at the lower end of the scale - more than eight in ten respondents in Bulgaria (81%) and the Czech Republic, Romania and Estonia (all 83%) do so.
At least three-quarters of respondents in Cyprus (77%) think it is very important for their national government to provide support for improving energy efficiency by 2030. At least two-thirds agree in Malta (70%) and the Netherlands (67%). At the lower end of the scale, respondents in Poland (30%), Slovakia (33%) and the Czech Republic (35%) are the least likely to say such support is very important.
Since 2015, the share of respondents who think it is important for their national government to provide support for improving energy efficiency by 2030 has increased by one or two percentage points in five Member States. Conversely, the proportion has fallen in 20 Member States, particularly Romania (83%, -10 pp), Bulgaria (81%, -7 pp), the Czech Republic (83%, -6 pp), Slovakia (84%, -6 pp) and Italy (86%, -6 pp), yet over eight in ten respondents in all of these Member States still agree with the statement.
It should be noted that this question was modified slightly from 2015, with the example of encouraging the purchase of low energy light bulbs replaced by the example of encouraging people to buy electric cars.

71
Climate Change
March 2017 Report
Special Eurobarometer 459
QC8
Veryim
portant
2017-
2015
Fairlyim
portant
2017-
2015
Notveryim
portant
2017-
2015
Notata
llim
portant
2017-
2015
Total'Im
portant'
2017-
2015
Total'Not
impo
rtant'
2017-
2015
Don'tk
now
EU28 48 4 40 = 6 1 2 1 88 4 8 2 4
LT 48 8 44 6 4 2 1 1 92 2 5 3 3DK 65 7 31 6 2 2 0 = 96 1 2 2 2FR 49 = 44 1 3 2 1 = 93 1 4 2 3AT 51 5 38 4 7 2 1 1 89 1 8 3 3PL 30 = 56 1 8 = 1 1 86 1 9 1 5BE 50 3 41 3 8 1 1 = 91 = 9 1 1ES 51 3 41 3 3 1 1 = 92 = 4 1 4NL 67 7 28 7 4 = 0 1 95 = 4 1 0IE 63 3 32 2 3 = 0 = 95 1 3 = 2MT 70 14 27 13 1 = 0 = 97 1 1 = 2PT 44 3 49 4 3 1 1 1 93 1 4 = 3FI 44 2 46 1 8 1 1 = 90 1 9 1 1SE 63 6 30 7 4 = 2 1 93 1 6 1 1HR 48 = 41 2 8 3 1 = 89 2 9 1 1CY 77 5 20 3 2 1 0 = 97 2 2 2 1LV 41 = 43 2 11 3 2 = 84 2 13 2 1LU 54 = 38 2 5 2 1 = 92 2 6 2 2HU 59 1 34 3 4 1 2 1 93 2 6 3 2SI 62 2 31 4 5 1 1 1 93 2 6 3 3UK 60 5 30 2 3 = 1 1 90 3 4 1 6DE 45 8 41 4 8 1 3 1 86 4 11 2 3EE 38 1 45 6 9 1 2 1 83 5 11 5 1EL 61 1 29 6 8 5 1 = 90 5 9 2 6CZ 35 8 48 2 10 3 3 1 83 6 13 3 5IT 40 11 46 5 7 2 2 1 86 6 9 2 7SK 33 7 51 1 6 = 3 2 84 6 9 4 4BG 46 3 35 4 3 1 2 = 81 7 5 1 14RO 53 3 30 7 11 7 3 3 83 10 14 10 3
Howimportantdoyouthinkitisthatthe(NATIONALITY)governmentprovidessupportforimprovingenergyefficiencyby2030(e.g.byencouragingpeopletoinsulatetheirhomeorbuyelectriccars)?(%)

72
Climate Change March 2017
Report
Special Eurobarometer 459
Again, there are few socio-demographic differences on this issue. In most groups, more than eight respondents in ten agree that it is important for their national government to provide support for improving energy efficiency by 2030.
As with previous questions, attitudes towards climate change have an influence on this issue:
§ Respondents who think climate change is either the biggest problem or among the most serious problems facing the world (93%) are more likely to think government support is important than those who do not consider climate change a serious global problem (86%). The difference is even more striking in the case of respondents answering “very important”: 61% of those who think climate change is one of the biggest global problems also say that government support is very important, compared with 41% of those who do not think climate change is among the most serious issues facing the world.
§ Those who think climate change is a very serious problem (93%) are more likely to think it is important than respondents who think climate change is not a serious problem (71%).
QC8
Veryim
portant
Fairlyim
portant
Notveryim
portant
Notata
llim
portant
Don
'tknow
EU28 48 40 6 2 4
Man 50 39 6 2 3Woman 48 41 5 1 5
15-24 50 41 5 1 325-39 50 41 5 1 340-54 51 39 6 1 355+ 46 40 6 2 6
15- 40 43 7 2 816-19 47 41 6 2 420+ 56 37 5 1 1Stillstudying 51 41 5 1 2
Biggestproblem 61 32 4 1 2Oneoftheproblems 59 34 4 1 2Notaproblem 41 45 7 2 5
Notaseriousproblem 32 39 17 8 4Afairlyseriousproblem 33 50 10 2 5Averyseriousproblem 55 38 4 1 2
How important do you think it is that the (NATIONALITY) government provides support for improvingenergyefficiencyby2030(e.g.byencouragingpeopletoinsulatetheirhomeorbuyelectriccars)?(%-EU)
Gender
Age
Education(Endof)
Climatechange
Perceptionofclimatechange

73
Climate Change March 2017
Report
Special Eurobarometer 459
CONCLUSION
This Eurobarometer survey comes a year after the United Nations Climate Change Conference (COP21) in Paris in December 2015, when 195 countries agreed on the first ever legally-binding global climate agreement. The results of this survey show that climate change is seen by EU citizens as one of the three most serious challenges facing the world as a whole.
Climate change is now seen as the third most serious global problem, after poverty, hunger and lack of drinking water and international terrorism. A notable change since the previous Eurobarometer on climate change in 2015 is the decline of the economic situation and the rise of international terrorism among EU citizens' top concerns, with climate change (third) now ranked above the economic situation (fifth).
An overwhelming majority of Europeans now see climate change as a serious problem. Nearly three-quarters (74%) consider it to be a very serious problem, up from 69% in 2015, and over nine in ten (92%) consider it a serious problem.
Some geographical trends are also noticeable. In general, climate change is seen as a serious global challenge by a majority of respondents in Nordic Member States, while respondents in Eastern and Southern Member States are less likely to consider climate change to be a serious problem.
As in 2015, Europeans think that national governments, the EU and business and industry are the main actors responsible for tackling climate change within the EU. It should be noted that all three actors are more likely to be cited as being responsible for tackling climate change than in 2015. Around one-fifth also believe they are personally responsible for taking action.
Although around half of respondents say they have taken personal action to fight climate change, this rises to nine in ten when they are asked about particular actions that they may have taken. However, this share has declined since 2015 and they are now less likely to undertake all of the actions tested in this study. However, around seven in ten try to reduce their waste and regularly separate it for recycling and more than half try to cut down their consumption of disposable items.
A consistent majority of EU citizens appear to have a positive attitude towards the transition to clean energies, and feel that fighting climate change and using energy more efficiently, reducing fossil fuel imports and promoting EU expertise in new clean technologies outside the EU can all benefit the EU economically. Nearly eight in ten believe this transition should also be supported by more public funds, even if this means a reduction of public subsidies for fossil fuels.
The importance attached to fighting climate change, its perceived seriousness and the fact that national governments are considered to be most responsible for tackling climate change are all reflected in EU citizens' views on actions to be taken in future. An overwhelming majority of them say it is important for national governments to set targets to increase the amount of renewable energy used (89%) and provide support for improving energy efficiency by 2030 (88%).

◊
TS1
Climate Change March 2017
Technical specifications
Special Eurobarometer 459
TECHNICAL SPECIFICATIONS
Between the 18th and the 27th of March 2017, TNS opinion & social, a consortium created between TNS political & social, TNS UK and TNS opinion, carried out the wave 87.1 of the EUROBAROMETER survey, at the request of the European Commission, Directorate-General for Communication, “Media monitoring and analysis” Unit.
The wave 87.1 includes the SPECIAL EUROBAROMETER 459 and covers the population of the respective nationalities of the European Union Member States, resident in each of the 28 Member States and aged 15 years and over.
N° POPULATION PROPORTIONINTERVIEWS 15+ EU28
BE Belgium TNS Dimarso 1,023 18/03/2017 27/03/2017 9,693,779 2.25%BG Bulgaria TNS BBSS 1,044 18/03/2017 27/03/2017 6,537,535 1.52%CZ Czech Rep. TNS Aisa 1,058 18/03/2017 27/03/2017 9,238,431 2.14%DK Denmark TNS Gallup DK 1,000 18/03/2017 27/03/2017 4,838,729 1.12%DE Germany TNS Infratest 1,537 18/03/2017 27/03/2017 70,160,634 16.26%EE Estonia TNS Emor 1,017 18/03/2017 27/03/2017 1,160,064 0.27%IE Ireland Behaviour & Attitudes 1,021 18/03/2017 27/03/2017 3,592,162 0.83%EL Greece TNS ICAP 1,010 18/03/2017 27/03/2017 9,937,810 2.30%ES Spain TNS Spain 1,024 18/03/2017 27/03/2017 39,445,245 9.14%FR France TNS Sofres 1,004 18/03/2017 27/03/2017 54,097,255 12.54%HR Croatia HENDAL 1,048 18/03/2017 26/03/2017 3,796,476 0.88%IT Italy TNS Italia 1,022 18/03/2017 25/03/2017 52,334,536 12.13%CY Rep. Of Cyprus CYMAR 501 18/03/2017 25/03/2017 741,308 0.17%LV Latvia TNS Latvia 1,004 18/03/2017 27/03/2017 1,707,082 0.40%LT Lithuania TNS LT 1,001 18/03/2017 27/03/2017 2,513,384 0.58%LU Luxembourg TNS ILReS 510 18/03/2017 25/03/2017 457,127 0.11%HU Hungary TNS Hoffmann 1,053 18/03/2017 27/03/2017 8,781,161 2.04%MT Malta MISCO 500 18/03/2017 27/03/2017 364,171 0.08%NL Netherlands TNS NIPO 1,015 18/03/2017 27/03/2017 13,979,215 3.24%AT Austria ipr Umfrageforschung 1,001 18/03/2017 27/03/2017 7,554,711 1.75%PL Poland TNS Polska 1,008 18/03/2017 27/03/2017 33,444,171 7.75%PT Portugal TNS Portugal 1,061 18/03/2017 26/03/2017 8,480,126 1.97%RO Romania TNS CSOP 1,033 18/03/2017 27/03/2017 16,852,701 3.91%SI Slovenia Mediana 1,027 18/03/2017 27/03/2017 1,760,032 0.41%SK Slovakia TNS Slovakia 1,014 18/03/2017 26/03/2017 4,586,024 1.06%FI Finland TNS Gallup Oy 1,012 18/03/2017 27/03/2017 4,747,810 1.10%SE Sweden TNS Sifo 1,007 18/03/2017 27/03/2017 7,998,763 1.85%UK United Kingdom TNS UK 1,346 18/03/2017 27/03/2017 52,651,777 12.20%
27,901 18/03/2017 27/03/2017 431,452,219 100%*
COUNTRIESDATES
FIELDWORKINSTITUTES
* It should be noted that the total percentage shown in this table may exceed 100% due to rounding
TOTAL EU28

◊
TS2
Climate Change March 2017
Technical specifications
Special Eurobarometer 459
The basic sample design applied in all states is a multi-stage, random (probability) one. In each country, a number of sampling points was drawn with probability proportional to population size (for a total coverage of the country) and to population density.
In order to do so, the sampling points were drawn systematically from each of the "administrative regional units", after stratification by individual unit and type of area. They thus represent the whole territory of the countries surveyed according to the EUROSTAT NUTS II1 (or equivalent) and according to the distribution of the resident population of the respective nationalities in terms of metropolitan, urban and rural areas.
In each of the selected sampling points, a starting address was drawn, at random. Further addresses (every Nth address) were selected by standard "random route" procedures, from the initial address. In each household, the respondent was drawn, at random (following the "closest birthday rule"). All interviews were conducted face-to-face in people's homes and in the appropriate national language. As far as the data capture is concerned, CAPI (Computer Assisted Personal Interview) was used in those countries where this technique was available.
For each country a comparison between the sample and the universe was carried out. The Universe description was derived from Eurostat population data or from national statistics offices. For all countries surveyed, a national weighting procedure, using marginal and intercellular weighting, was carried out based on this Universe description. In all countries, gender, age, region and size of locality were introduced in the iteration procedure. For international weighting (i.e. EU averages), TNS opinion & social applies the official population figures as provided by EUROSTAT or national statistic offices. The total population figures for input in this post-weighting procedure are listed here.
Readers are reminded that survey results are estimations, the accuracy of which, everything being equal, rests upon the sample size and upon the observed percentage. With samples of about 1,000 interviews, the real percentages vary within the following confidence limits:
1 Figures updated in August 2015
various sample sizes are in rows various observed results are in columns
5% 10% 15% 20% 25% 30% 35% 40% 45% 50%95% 90% 85% 80% 75% 70% 65% 60% 55% 50%
N=50 6.0 8.3 9.9 11.1 12.0 12.7 13.2 13.6 13.8 13.9 N=50N=500 1.9 2.6 3.1 3.5 3.8 4.0 4.2 4.3 4.4 4.4 N=500
N=1000 1.4 1.9 2.2 2.5 2.7 2.8 3.0 3.0 3.1 3.1 N=1000N=1500 1.1 1.5 1.8 2.0 2.2 2.3 2.4 2.5 2.5 2.5 N=1500N=2000 1.0 1.3 1.6 1.8 1.9 2.0 2.1 2.1 2.2 2.2 N=2000N=3000 0.8 1.1 1.3 1.4 1.5 1.6 1.7 1.8 1.8 1.8 N=3000N=4000 0.7 0.9 1.1 1.2 1.3 1.4 1.5 1.5 1.5 1.5 N=4000N=5000 0.6 0.8 1.0 1.1 1.2 1.3 1.3 1.4 1.4 1.4 N=5000N=6000 0.6 0.8 0.9 1.0 1.1 1.2 1.2 1.2 1.3 1.3 N=6000N=7000 0.5 0.7 0.8 0.9 1.0 1.1 1.1 1.1 1.2 1.2 N=7000N=7500 0.5 0.7 0.8 0.9 1.0 1.0 1.1 1.1 1.1 1.1 N=7500N=8000 0.5 0.7 0.8 0.9 0.9 1.0 1.0 1.1 1.1 1.1 N=8000N=9000 0.5 0.6 0.7 0.8 0.9 0.9 1.0 1.0 1.0 1.0 N=9000
N=10000 0.4 0.6 0.7 0.8 0.8 0.9 0.9 1.0 1.0 1.0 N=10000N=11000 0.4 0.6 0.7 0.7 0.8 0.9 0.9 0.9 0.9 0.9 N=11000N=12000 0.4 0.5 0.6 0.7 0.8 0.8 0.9 0.9 0.9 0.9 N=12000N=13000 0.4 0.5 0.6 0.7 0.7 0.8 0.8 0.8 0.9 0.9 N=13000N=14000 0.4 0.5 0.6 0.7 0.7 0.8 0.8 0.8 0.8 0.8 N=14000N=15000 0.3 0.5 0.6 0.6 0.7 0.7 0.8 0.8 0.8 0.8 N=15000
5% 10% 15% 20% 25% 30% 35% 40% 45% 50%95% 90% 85% 80% 75% 70% 65% 60% 55% 50%
Statistical Margins due to the sampling process(at the 95% level of confidence)

◊
Q1
Climate Change March 2017
Questionnaire
Special Eurobarometer 459
QUESTIONNAIRE
QC1a Which of the following do you consider to be the single most serious problem facing the world as a whole?
(SHOW SCREEN – READ OUT – ONE ANSWER ONLY)
Climate change 1
International terrorism 2
Poverty, hunger and lack of drinking water 3
Spread of infectious diseases 4
The economic situation 5
Proliferation of nuclear weapons 6
Armed conflicts 7
The increasing global population 8
Other (SPONTANEOUS) 9
None (SPONTANEOUS) 10
DK 11
EB83.4 QA1a
QC1b: DO NOT ASK QC1b IF CODE 10 OR 11 IN QC1a
QC1b: EXCLUDE ANSWER GIVEN IN QC1a FROM LIST OF ANSWERS FOR QC1b, EXCEPT FOR ANSWER 9
QC1b Which others do you consider to be serious problems? (SHOW SCREEN – READ OUT – MAX. 3 ANSWERS)
Climate change 1,
International terrorism 2,
Poverty, hunger and lack of drinking water 3,
Spread of infectious diseases 4,
The economic situation 5,
Proliferation of nuclear weapons 6,
Armed conflicts 7,
The increasing global population 8,
Other (SPONTANEOUS) 9,
None (SPONTANEOUS) 10,
DK 11,
EB83.4 QA1b

◊
Q2
Climate Change March 2017
Questionnaire
Special Eurobarometer 459
QC2 And how serious a problem do you think climate change is at this moment? Please use a scale from 1 to 10, with '1' meaning it is "not at all a serious problem" and '10' meaning it is "an extremely serious problem".
(SHOW SCREEN - ONE ANSWER ONLY)
1 Not at all a serious problem
10 An extremely
serious problem
1 2 3 4 5 6 7 8 9 10
DK 11
EB83.4 QA2
QC3 In your opinion, who within the EU is responsible for tackling climate
change? (SHOW SCREEN – READ OUT – MULTIPLE ANSWERS POSSIBLE)
National governments 1,
The European Union 2,
Regional and local authorities 3,
Business and industry 4,
You personally 5,
Environmental groups 6,
Other (SPONTANEOUS) 7,
All of them (SPONTANEOUS) 8,
None (SPONTANEOUS) 9,
DK 10,
EB83.4 QA3

◊
Q3
Climate Change March 2017
Questionnaire
Special Eurobarometer 459
QC4 To what extent do you agree or disagree with each of the following statements?
(SHOW SCREEN – READ OUT – ONE ANSWER PER LINE)
Tota
lly a
gree
Tend
to
agre
e
Tend
to
disa
gree
Tota
lly d
isag
ree
DK
1 Fighting climate change and using energy more efficiently can boost the economy and jobs in the EU
1 2 3 4 5
2 Promoting EU expertise in new clean technologies to countries outside the EU can benefit the EU economically (N)
1 2 3 4 5
3 Reducing fossil fuel imports from outside the EU can benefit the EU economically
1 2 3 4 5
4 Reducing fossil fuel imports from outside the EU can increase the security of EU energy supplies
1 2 3 4 5
5 More public financial support should be given to the transition to clean energies even if it means subsidies to fossil fuels should be reduced (N)
1 2 3 4 5
EB83.4 QA4 MODIFIED
QC5
Have you personally taken any action to fight climate change over the past six months?
(ONE ANSWER ONLY)
Yes 1
No 2
DK 3
EB83.4 QA5

◊
Q4
Climate Change March 2017
Questionnaire
Special Eurobarometer 459
QC6 Which of the following actions, if any, apply to you? (SHOW SCREEN – READ OUT – MULTIPLE ANSWERS POSSIBLE)
You have bought a new car and its low fuel consumption was an important factor in your choice
1,
You have bought an electric car (N) 2,
You regularly use environmentally-friendly alternatives to your private car such as walking, cycling, taking public transport or car-sharing (M)
3,
You have insulated your home better to reduce your energy consumption
4,
You have bought a low-energy home 5,
When buying a new household appliance e.g. washing machine, fridge or TV, lower energy consumption is an important factor in your choice (M)
6,
You have switched to an energy supplier which offers a greater share of energy from renewable sources than your previous one
7,
You have installed equipment in your home to control and reduce your energy consumption (e.g. smart meter) (M)
8,
You have installed solar panels in your home (N) 9,
You buy locally produced and seasonal food whenever possible
10,
You avoid taking short-haul flights whenever possible 11,
You try to reduce your waste and you regularly separate it for recycling
12,
You try to cut down on your consumption of disposable items whenever possible, e.g. plastic bags from the supermarket, excessive packaging
13,
Other (SPONTANEOUS) 14,
None (SPONTANEOUS) 15,
DK 16,
EB83.4 QA6 MODIFIED

◊
Q5
Climate Change March 2017
Questionnaire
Special Eurobarometer 459
READ OUT: Now let’s look ahead to the future. QC7 How important do you think it is that the (NATIONALITY) government
sets targets to increase the amount of renewable energy used, such as wind or solar power, by 2030?
(READ OUT – ONE ANSWER ONLY)
Very important 1
Fairly important 2
Not very important 3
Not at all important 4
DK 5
EB83.4 QA7
QC8 How important do you think it is that the (NATIONALITY) government
provides support for improving energy efficiency by 2030 (e.g. by encouraging people to insulate their home or buy electric cars)? (M)
(READ OUT – ONE ANSWER ONLY)
Very important 1
Fairly important 2
Not very important 3
Not at all important 4
DK 5
EB83.4 QA8

Climate Change March 2017
Tables
Special Eurobarometer 459
QC1a
EB87
.1
Diff
. EB8
7.1
- 83
.4
EB87
.1
Diff
. EB8
7.1
- 83
.4
EB87
.1
Diff
. EB8
7.1
- 83
.4
EB87
.1
Diff
. EB8
7.1
- 83
.4
EB87
.1
Diff
. EB8
7.1
- 83
.4
EB87
.1
Diff
. EB8
7.1
- 83
.4
EU28 12 -3 24 5 28 -2 3 0 9 -7 6 4
BE 17 2 23 -4 28 -1 2 1 8 -6 4 1
BG 7 -6 29 14 27 1 4 1 9 -16 7 4
CZ 6 -2 39 15 19 -3 4 -1 7 -10 9 5
DK 29 -1 20 2 21 -7 1 0 2 -2 4 3
DE 14 -12 21 1 32 4 2 1 2 -3 6 4
EE 9 3 32 14 17 -1 2 0 5 -12 4 2
IE 13 -2 23 8 34 -7 5 1 11 -3 4 2
EL 4 -5 11 6 35 -6 2 0 36 0 3 2
ES 13 5 14 6 40 -11 2 1 18 -8 3 2
FR 14 -4 24 0 37 1 3 1 4 -8 5 4
HR 8 -9 22 12 34 0 3 0 13 -14 5 3
IT 7 -2 32 8 17 0 5 0 21 -11 6 3
CY 8 -3 20 8 36 5 5 1 17 -17 5 3
LV 9 2 20 6 20 -3 7 3 9 -7 8 6
LT 8 -4 22 11 24 -2 5 1 12 -9 10 6
LU 12 -6 21 0 38 0 2 1 4 -2 7 4
HU 10 -4 20 11 35 1 9 2 6 -14 4 1
MT 13 -3 44 4 22 -1 6 1 2 -4 4 2
NL 27 11 17 -5 30 -1 1 0 1 -5 1 0
AT 16 -3 17 6 26 1 4 -2 11 -8 5 2
PL 6 -5 30 10 16 -2 4 0 4 -9 13 8
PT 4 -1 30 22 34 -13 3 0 12 -10 4 1
RO 9 -3 20 10 26 -10 9 2 14 -10 5 3
SI 11 -14 22 13 35 0 2 1 10 -8 5 3
SK 8 -5 23 7 31 3 4 0 8 -11 6 4
FI 20 -6 18 4 27 3 3 0 3 -3 8 3
SE 38 1 14 2 23 -5 1 -1 2 -1 4 3
UK 14 0 25 -3 26 -4 3 0 4 -2 6 5
Which of the following do you consider to be the single most serious problem facing the world as a whole?(%)
Clim
ate
chan
ge
Inte
rnat
iona
l ter
roris
m
Pove
rty,
hun
ger a
nd la
ck o
f dr
inki
ng w
ater
Spre
ad o
f inf
ectio
us d
isea
ses
The
econ
omic
situ
atio
n
Prol
ifera
tion
of
nucl
ear w
eapo
ns
T1

Climate Change March 2017
Tables
Special Eurobarometer 459
QC1a
Don
't kn
ow
EB87
.1
Diff
. EB8
7.1
- 83
.4
EB87
.1
Diff
. EB8
7.1
- 83
.4
EB87
.1
Diff
. EB8
7.1
- 83
.4
EB87
.1
Diff
. EB8
7.1
- 83
.4
EB87
.1
EU28 9 0 6 2 1 0 1 1 1
BE 7 1 9 5 2 1 0 0 0BG 11 0 3 1 1 1 0 0 2CZ 11 -3 5 -1 0 0 0 0 0DK 9 0 11 4 1 0 1 1 1DE 12 1 9 4 1 -1 0 0 1EE 18 -7 9 1 2 0 0 0 2IE 6 0 3 1 0 0 0 0 1EL 5 2 2 0 2 1 0 0 0ES 6 4 2 1 1 0 0 0 1FR 7 3 6 3 0 0 0 0 0HR 10 5 3 1 0 0 1 1 1IT 6 0 3 1 1 0 1 1 1CY 8 4 1 -1 0 0 0 0 0LV 19 -7 6 3 1 0 0 -1 1LT 15 -3 3 0 0 0 0 0 1LU 8 1 5 0 2 1 0 0 1HU 7 4 8 -1 0 -1 1 1 0MT 4 0 3 -1 2 2 0 0 0NL 8 -4 14 4 1 0 0 0 0AT 10 0 9 3 2 1 0 0 0PL 18 -6 3 1 1 0 1 1 4PT 7 -2 2 1 3 2 0 0 1RO 9 4 6 4 1 0 0 0 1SI 8 5 5 1 1 -1 1 1 0SK 13 0 4 0 1 1 0 0 2FI 11 -2 9 1 1 0 0 0 0SE 10 0 7 0 1 1 0 0 0UK 8 0 9 1 1 0 1 1 3
Non
e (S
PON
TAN
EOU
S)
Which of the following do you consider to be the single most serious problem facing the world as a whole?(%)
Arm
ed c
onfli
cts
The
incr
easi
ng
glob
al p
opul
atio
n
Oth
er (S
PON
TAN
EOU
S)
T2

Climate Change March 2017
Tables
Special Eurobarometer 459
QC1T
EB87
.1
Diff
. EB8
7.1
- 83
.4
EB87
.1
Diff
. EB8
7.1
- 83
.4
EB87
.1
Diff
. EB8
7.1
- 83
.4
EB87
.1
Diff
. EB8
7.1
- 83
.4
EB87
.1
Diff
. EB8
7.1
- 83
.4
EB87
.1
Diff
. EB8
7.1
- 83
.4
EU28 43 -4 62 6 70 -1 22 0 34 -13 27 11
BE 53 2 62 0 65 -2 16 1 31 -11 26 9
BG 30 -13 68 12 62 -4 32 6 37 -24 36 16
CZ 22 -7 76 11 58 -4 31 4 24 -23 42 14
DK 69 -4 61 7 73 -2 19 -3 20 -5 25 12
DE 53 -12 60 1 79 7 15 0 16 -11 32 17
EE 31 7 68 17 59 6 17 0 28 -20 20 9
IE 42 -8 56 4 72 -5 28 -2 32 -14 24 10
EL 34 -14 52 13 80 -7 29 -2 81 -1 29 9
ES 42 1 58 13 81 -8 13 -3 59 -8 17 5
FR 50 -2 65 2 78 1 17 1 31 -16 25 10
HR 35 -8 61 18 71 -5 23 5 47 -18 31 14
IT 33 -4 70 7 54 0 32 6 58 -14 27 12
CY 35 2 69 24 81 -3 24 -12 61 -12 24 9
LV 29 4 60 16 57 2 37 11 31 -17 27 11
LT 29 -9 64 22 64 5 35 5 38 -15 36 14
LU 52 -5 64 7 75 0 18 -3 23 -10 33 15
HU 42 -7 58 20 73 1 43 9 28 -28 27 9
MT 49 3 77 4 72 8 33 4 14 -18 30 13
NL 71 17 61 -3 80 1 17 0 15 -14 24 8
AT 50 -3 57 14 70 0 23 -2 36 -20 30 9
PL 27 0 62 10 52 0 24 0 23 -16 37 10
PT 27 0 71 25 79 -12 18 -16 49 -10 25 1
RO 35 -4 53 12 62 -8 39 6 42 -20 24 12
SI 46 -15 60 17 71 -5 20 -3 38 -27 25 13
SK 31 -10 59 7 68 1 30 5 26 -25 26 10
FI 60 -3 60 13 73 6 26 0 20 -9 36 13
SE 76 0 53 0 81 1 25 4 16 -9 26 12
UK 44 -2 61 0 66 -5 20 -8 21 -11 24 12
Which of the following do you consider to be the single most serious problem facing the world as a whole? Whichothers do you consider to be serious problems? (MAX. 4 ANSWERS)(%)
Clim
ate
chan
ge
Inte
rnat
iona
l ter
roris
m
Pove
rty,
hun
ger a
nd
lack
of d
rinki
ng w
ater
Spre
ad o
f inf
ectio
us d
isea
ses
The
econ
omic
situ
atio
n
Prol
ifera
tion
of
nucl
ear w
eapo
ns
T3

Climate Change March 2017
Tables
Special Eurobarometer 459
QC1T
Don
't kn
ow
EB87
.1
Diff
. EB8
7.1
- 83
.4
EB87
.1
Diff
. EB8
7.1
- 83
.4
EB87
.1
Diff
. EB8
7.1
- 83
.4
EB87
.1
Diff
. EB8
7.1
- 83
.4
EB87
.1
EU28 42 1 23 4 2 -1 1 0 1
BE 41 5 28 6 3 1 0 -1 0BG 48 -3 18 7 2 1 1 1 3CZ 56 -1 25 0 1 0 0 -1 0DK 44 3 39 4 2 -2 1 1 1DE 51 5 32 7 1 -2 1 0 1EE 58 -6 30 6 3 -2 1 -1 2IE 32 1 22 7 1 0 0 0 1EL 36 3 17 2 4 -1 0 0 0ES 39 8 10 2 5 1 1 0 1FR 35 6 21 4 1 0 1 0 0HR 44 15 14 7 1 -1 0 0 1IT 33 -2 17 4 2 -1 1 0 1CY 38 8 6 0 0 -2 0 0 0LV 52 -7 15 5 1 -1 2 0 1LT 59 0 10 -3 1 0 0 -1 1LU 40 7 26 7 2 -2 0 -1 1HU 34 7 30 1 0 -1 1 1 0MT 31 13 14 0 3 0 0 0 0NL 50 -5 38 8 2 -3 0 0 0AT 46 2 37 9 3 1 0 0 0PL 60 -2 14 6 1 0 1 -1 4PT 39 -4 10 4 3 0 0 0 1RO 32 0 20 10 2 0 1 1 1SI 35 15 19 2 3 -2 2 1 0SK 47 1 22 4 1 0 0 0 2FI 47 -3 32 -3 1 -2 0 0 0SE 56 4 26 0 2 -1 0 0 0UK 37 -4 28 -3 1 -1 3 1 3
Non
e (S
PON
TAN
EOU
S)
Which of the following do you consider to be the single most serious problem facing the world as a whole? Whichothers do you consider to be serious problems? (MAX. 4 ANSWERS)(%)
Arm
ed c
onfli
cts
The
incr
easi
ng
glob
al p
opul
atio
n
Oth
er (S
PON
TAN
EOU
S)
T4

Climate Change March 2017
Tables
Special Eurobarometer 459
QC2
EB87
.1
Diff
. EB8
7.1
- 83
.4
EB87
.1
Diff
. EB8
7.1
- 83
.4
EB87
.1
Diff
. EB8
7.1
- 83
.4
EB87
.1
Diff
. EB8
7.1
- 83
.4
EB87
.1
Diff
. EB8
7.1
- 83
.4
EB87
.1
Diff
. EB8
7.1
- 83
.4
EB87
.1
Diff
. EB8
7.1
- 83
.4
EU28 1 -1 1 0 2 0 2 -1 9 -2 9 -2 16 -3
BE 0 -1 1 0 3 1 2 -1 9 -3 14 1 19 -3
BG 1 0 0 -1 2 1 2 0 7 2 9 2 14 0
CZ 1 0 1 0 4 0 5 -1 17 3 13 2 17 -2
DK 0 -1 1 0 2 -1 3 -1 9 -5 8 -5 16 -5
DE 2 0 1 1 3 0 3 -1 9 0 7 -3 13 -4
EE 5 -1 3 0 5 -3 6 -2 19 -5 10 -2 17 3
IE 1 0 1 0 3 0 3 -1 12 -3 11 -3 19 -4
EL 1 0 0 -1 0 -1 1 0 5 1 7 1 13 -3
ES 1 1 0 0 1 0 1 -2 5 0 4 -6 17 -3
FR 1 0 0 -1 1 -1 1 -1 9 -4 8 -4 16 -5
HR 1 -1 1 0 4 1 5 2 8 -4 9 0 15 -4
IT 1 1 1 0 1 -1 1 -1 4 0 9 0 15 -1
CY 0 -1 1 0 1 -1 2 -1 13 3 5 -1 11 -4
LV 4 0 3 1 4 -3 4 -3 17 -7 13 -3 17 -1
LT 1 -2 1 -1 3 0 3 -1 13 -2 8 -1 12 -6
LU 2 0 1 1 1 -1 1 -3 10 -2 8 -1 14 -4
HU 0 0 1 0 1 -1 1 -2 7 -2 6 -5 17 0
MT 1 -1 0 0 2 1 1 -1 9 -1 7 -6 12 -7
NL 1 -1 0 -1 2 -1 2 -2 7 -5 9 -10 23 -6
AT 1 0 1 0 3 -1 5 2 9 -1 12 1 18 -2
PL 2 -1 1 -1 2 -1 5 1 16 0 10 -4 16 -2
PT 0 0 0 -1 0 -1 1 -1 8 1 6 -4 19 2
RO 1 0 0 0 2 1 4 2 10 -1 13 5 15 -1
SI 2 1 1 0 2 -1 2 -1 12 -3 8 -2 13 -2
SK 1 0 0 -1 1 -2 2 -1 12 2 14 2 16 -3
FI 2 1 1 0 3 0 2 -2 9 -2 8 -6 17 -4
SE 1 1 1 0 1 -2 1 -1 6 -5 8 -3 19 -6
UK 3 -1 1 -1 3 -1 3 -2 12 -6 10 -2 16 -3
And how serious a problem do you think climate change is at this moment? Please use a scale from 1 to 10, with '1'meaning it is "not at all a serious problem" and '10' meaning it is "an extremely serious problem".(%)
1 N
ot a
t all
a se
rious
pro
blem
2 3 4 5 6 7
T5

Climate Change March 2017
Tables
Special Eurobarometer 459
QC2
Don
't kn
ow
EB87
.1
Diff
. EB8
7.1
- 83
.4
EB87
.1
Diff
. EB8
7.1
- 83
.4
EB87
.1
Diff
. EB8
7.1
- 83
.4
EB87
.1
EB87
.1
Diff
. EB8
7.1
- 83
.4
EB87
.1
Diff
. EB8
7.1
- 83
.4
EB87
.1
Diff
. EB8
7.1
- 83
.4
EB87
.1
Diff
. EB8
7.1
- 83
.4
EU28 20 -1 11 2 27 7 2 6 -2 18 -4 74 5 7.7 0.4
BE 20 -1 10 2 21 5 1 6 -1 23 -2 70 3 7.5 0.3
BG 18 2 11 -1 29 -9 7 5 0 16 4 72 -8 7.9 -3,0
CZ 16 0 6 -2 19 0 1 11 -1 30 5 58 -4 6.9 -0.1
DK 21 -3 8 2 32 19 0 6 -3 17 -10 77 13 7.9 0.9
DE 21 0 10 1 30 5 1 9 0 16 -3 74 2 7.7 0.2
EE 14 4 4 0 13 7 4 19 -6 29 -7 48 14 6.3 0.6
IE 21 2 9 2 19 8 1 8 -1 23 -6 68 8 7.3 0.5
EL 25 4 21 2 27 -3 0 2 -2 12 2 86 0 8.2 0.0
ES 24 -3 15 4 30 8 2 3 -1 9 -6 86 6 8.2 0.4
FR 16 -4 9 2 38 17 1 3 -3 17 -8 79 10 8.1 0.8
HR 16 -2 8 -2 31 9 2 11 2 17 -4 70 1 7.5 0.2
IT 22 -5 14 -1 30 7 2 4 -1 13 0 81 0 8.1 0.2
CY 21 2 13 -2 31 4 2 4 -3 18 2 76 0 7.9 0.1
LV 15 7 5 1 16 9 2 15 -5 30 -10 53 16 6.6 0.8
LT 17 1 12 5 29 8 1 8 -4 21 -3 70 8 7.6 0.6
LU 19 -3 13 4 30 9 1 5 -3 18 -3 76 6 7.8 0.5
HU 22 3 13 3 31 3 1 3 -3 13 -7 83 9 8.1 0.4
MT 26 4 11 1 30 10 1 4 -1 16 -7 79 8 8.0 0.6
NL 26 6 12 7 17 13 1 5 -5 16 -15 78 20 7.6 1.0
AT 17 -3 10 2 23 2 1 10 1 21 0 68 -1 7.4 0.1
PL 19 3 8 0 15 1 6 10 -2 26 -4 58 2 7.0 0.2
PT 24 -4 14 3 26 4 2 1 -3 14 -3 83 5 8.0 0.2
RO 14 0 9 -1 30 -4 2 7 3 23 4 68 -6 7.6 -0.3
SI 18 1 10 0 30 6 2 7 -1 20 -5 71 5 7.6 0.2
SK 18 -4 12 3 21 2 3 4 -4 26 4 67 -2 7.5 0.2
FI 25 0 12 0 20 12 1 8 -1 17 -8 74 8 7.5 0.5
SE 21 -2 10 0 31 18 1 4 -2 14 -8 81 10 8.0 0.7
UK 20 3 8 2 20 9 4 10 -5 22 -8 64 11 7.2 0.7
10 A
n ex
trem
ely
serio
us p
robl
em
Tota
l 'N
ot a
ser
ious
pr
oble
m (1
-4)'
Tota
l 'A
fairl
y se
rious
pr
oble
m (5
-6)'
Tota
l 'A
very
ser
ious
pr
oble
m (7
-10)
'
Aver
age
And how serious a problem do you think climate change is at this moment? Please use a scale from 1 to 10, with '1'meaning it is "not at all a serious problem" and '10' meaning it is "an extremely serious problem".(%)
8 9
T6

Climate Change March 2017
Tables
Special Eurobarometer 459
QC3
EB87
.1
Diff
. EB8
7.1
- 83
.4
EB87
.1
Diff
. EB8
7.1
- 83
.4
EB87
.1
Diff
. EB8
7.1
- 83
.4
EB87
.1
Diff
. EB8
7.1
- 83
.4
EB87
.1
Diff
. EB8
7.1
- 83
.4
EU28 43 1 39 4 22 6 38 3 22 3
BE 47 7 56 13 29 13 50 14 40 12
BG 42 6 31 7 25 5 42 5 11 4
CZ 54 4 39 5 22 1 55 2 17 3
DK 53 1 52 5 28 15 47 6 39 5
DE 33 -6 35 -3 15 0 38 -9 23 -1
EE 34 0 23 0 15 5 34 4 15 1
IE 49 4 44 10 30 12 34 11 36 6
EL 54 -7 44 -1 25 -4 51 -4 17 -5
ES 47 5 47 16 25 11 43 12 21 1
FR 53 11 51 8 26 16 43 10 33 11
HR 36 0 37 1 20 1 34 2 15 -2
IT 42 2 31 -4 19 -2 29 -7 9 -3
CY 44 6 37 6 26 20 47 14 32 4
LV 35 2 23 5 15 2 40 6 17 6
LT 41 9 34 11 27 15 44 6 28 1
LU 44 9 49 7 25 14 52 16 44 12
HU 34 -2 28 1 18 2 49 0 13 -2
MT 56 6 53 10 32 23 33 17 29 9
NL 68 17 68 19 26 14 63 14 55 12
AT 45 11 45 11 33 12 49 3 31 3
PL 41 1 33 -2 23 2 28 7 12 5
PT 50 5 38 5 36 18 48 14 19 3
RO 38 -1 32 2 37 10 42 12 18 10
SI 35 3 34 0 20 1 48 0 16 -3
SK 46 -2 35 3 20 7 56 8 19 7
FI 50 -1 46 8 25 9 59 6 42 4
SE 69 11 67 20 41 19 52 22 59 17
UK 31 -11 23 2 12 4 19 2 14 -4
Nat
iona
l gov
ernm
ents
The
Euro
pean
Uni
on
Regi
onal
and
loca
l aut
horit
ies
Busi
ness
and
indu
stry
You
pers
onal
ly
In your opinion, who within the EU is responsible for tackling climate change? (MULTIPLE ANSWERS POSSIBLE)(%)
T7

Climate Change March 2017
Tables
Special Eurobarometer 459
QC3
Don
't kn
ow
EB87
.1
Diff
. EB8
7.1
- 83
.4
EB87
.1
Diff
. EB8
7.1
- 83
.4
EB87
.1
Diff
. EB8
7.1
- 83
.4
EB87
.1
Diff
. EB8
7.1
- 83
.4
EB87
.1
EU28 21 7 1 -1 20 4 1 0 5
BE 31 18 1 -1 6 -6 0 -1 1BG 21 6 1 0 24 3 1 -1 12CZ 24 8 2 0 7 -2 1 1 4DK 23 15 1 -2 17 5 0 0 2DE 13 2 1 0 37 9 1 0 3EE 21 -1 2 -1 20 7 2 -2 10IE 29 9 2 1 11 -1 0 0 3EL 19 0 1 -4 22 7 0 0 0ES 18 10 0 -3 21 -1 1 1 4FR 33 18 1 -2 4 -5 1 1 5HR 26 0 1 -2 13 6 0 0 4IT 17 1 3 0 19 12 2 1 8CY 25 11 2 0 16 -1 2 2 3LV 30 2 4 -1 8 4 3 1 3LT 39 11 3 0 17 8 2 1 2LU 31 19 1 -2 12 -10 1 1 3HU 16 1 1 -3 14 4 4 3 4MT 31 15 0 -2 21 6 1 0 3NL 21 13 1 -2 3 -4 0 -1 1AT 37 12 2 -2 17 -1 0 0 2PL 20 -2 2 0 17 9 2 1 8PT 24 5 1 -1 20 -3 0 -1 5RO 29 6 2 -2 7 1 2 1 6SI 24 6 2 -2 18 -1 1 0 2SK 17 3 2 -1 6 -1 0 -1 5FI 28 14 1 -1 13 1 0 0 2SE 28 23 2 0 7 -12 1 1 1UK 13 3 0 -2 37 14 2 1 10
In your opinion, who within the EU is responsible for tackling climate change? (MULTIPLE ANSWERS POSSIBLE)(%)
Envi
ronm
enta
l gro
ups
Oth
er (S
PON
TAN
EOU
S)
All o
f the
m (S
PON
TAN
EOU
S)
Non
e (S
PON
TAN
EOU
S)
T8

Climate Change March 2017
Tables
Special Eurobarometer 459
QC4.1
Don
't kn
ow
EB87
.1
Diff
. EB8
7.1
- 83
.4
EB87
.1
Diff
. EB8
7.1
- 83
.4
EB87
.1
Diff
. EB8
7.1
- 83
.4
EB87
.1
Diff
. EB8
7.1
- 83
.4
EB87
.1
EB87
.1
Diff
. EB8
7.1
- 83
.4
EB87
.1
Diff
. EB8
7.1
- 83
.4
EU28 34 -3 45 1 8 -1 2 0 11 79 -2 10 -1
BE 30 3 50 -1 12 -2 3 1 5 80 2 15 -1
BG 33 -9 37 1 5 0 1 -3 24 70 -8 6 -3
CZ 19 -11 46 2 17 0 3 0 15 65 -9 20 0
DK 47 14 39 -7 5 -5 1 -1 8 86 7 6 -6
DE 31 0 48 0 9 -4 3 1 9 79 0 12 -3
EE 14 -5 44 4 14 -1 5 -2 23 58 -1 19 -3
IE 46 2 42 -1 5 -1 0 -1 7 88 1 5 -2
EL 38 -12 49 9 6 1 1 0 6 87 -3 7 1
ES 48 -10 37 7 2 0 0 -1 13 85 -3 2 -1
FR 38 0 44 0 7 -1 3 0 8 82 0 10 -1
HR 33 -6 51 9 7 -1 3 0 6 84 3 10 -1
IT 31 -8 45 0 7 1 3 1 14 76 -8 10 2
CY 43 -10 42 10 5 -1 1 0 9 85 0 6 -1
LV 20 -3 45 3 15 1 5 -2 15 65 0 20 -1
LT 23 -5 52 6 8 -4 2 -1 15 75 1 10 -5
LU 36 -7 46 4 7 -3 2 1 9 82 -3 9 -2
HU 28 -9 45 0 14 4 4 1 9 73 -9 18 5
MT 41 -9 41 5 4 0 2 0 12 82 -4 6 0
NL 37 11 45 -2 11 -4 2 -2 5 82 9 13 -6
AT 33 -1 47 5 13 -2 2 -2 5 80 4 15 -4
PL 25 -4 51 4 11 0 2 -1 11 76 0 13 -1
PT 44 -6 43 -1 2 1 0 0 11 87 -7 2 1
RO 30 -13 42 10 14 6 2 -1 12 72 -3 16 5
SI 39 -9 40 1 10 5 2 0 9 79 -8 12 5
SK 25 -8 48 -2 9 0 1 0 17 73 -10 10 0
FI 35 2 49 1 7 -1 2 0 7 84 3 9 -1
SE 58 10 30 -13 4 0 2 1 6 88 -3 6 1
UK 30 -2 43 -5 8 -2 2 0 17 73 -7 10 -2
Tota
lly a
gree
Tend
to a
gree
Tend
to d
isag
ree
Tota
lly d
isag
ree
Tota
l 'Ag
ree'
Tota
l 'D
isag
ree'
To what extent do you agree or disagree with each of the following statements?Fighting climate change and using energy more efficiently can boost the economy and jobs in the EU(%)
T9

Climate Change March 2017
Tables
Special Eurobarometer 459
QC4.2
Tota
lly a
gree
Tend
to a
gree
Tend
to d
isag
ree
Tota
lly d
isag
ree
Don
't kn
ow
Tota
l 'Ag
ree'
Tota
l 'D
isag
ree'
EU28 33 44 7 2 14 77 9
BE 25 54 12 3 6 79 15BG 36 36 3 1 24 72 4CZ 21 48 11 3 17 69 14DK 47 35 5 1 12 82 6DE 38 45 6 2 9 83 8EE 19 46 7 2 26 65 9IE 43 44 4 1 8 87 5EL 26 51 7 2 14 77 9ES 44 37 3 0 16 81 3FR 30 41 9 4 16 71 13HR 32 50 9 2 7 82 11IT 28 41 6 2 23 69 8CY 35 41 5 1 18 76 6LV 23 46 10 3 18 69 13LT 29 48 5 1 17 77 6LU 28 44 10 2 16 72 12HU 27 48 11 3 11 75 14MT 42 40 2 0 16 82 2NL 47 44 4 1 4 91 5AT 31 50 9 2 8 81 11PL 27 53 8 2 10 80 10PT 43 41 2 0 14 84 2RO 28 40 15 4 13 68 19SI 38 40 10 2 10 78 12SK 25 46 8 2 19 71 10FI 35 50 4 1 10 85 5SE 49 36 5 1 9 85 6UK 33 43 4 2 18 76 6
To what extent do you agree or disagree with each of the following statements?Promoting EU expertise in new clean technologies to countries outside the EU can benefit the EU economically(%)
T10

Climate Change March 2017
Tables
Special Eurobarometer 459
QC4.3
Don
't kn
ow
EB87
.1
Diff
. EB8
7.1
- 83
.4
EB87
.1
Diff
. EB8
7.1
- 83
.4
EB87
.1
Diff
. EB8
7.1
- 83
.4
EB87
.1
Diff
. EB8
7.1
- 83
.4
EB87
.1
EB87
.1
Diff
. EB8
7.1
- 83
.4
EB87
.1
Diff
. EB8
7.1
- 83
.4
EU28 25 -1 40 1 14 0 3 -1 18 65 0 17 -1
BE 15 0 45 0 27 6 4 -1 9 60 0 31 5
BG 26 0 31 0 7 -3 3 -6 33 57 0 10 -9
CZ 16 -3 38 -2 19 0 5 -1 22 54 -5 24 -1
DK 26 8 35 -4 12 -4 6 1 21 61 4 18 -3
DE 27 1 38 1 16 -5 4 -1 15 65 2 20 -6
EE 9 1 29 2 17 2 8 -1 37 38 3 25 1
IE 39 4 40 1 7 -3 2 -1 12 79 5 9 -4
EL 24 -12 47 8 12 1 3 0 14 71 -4 15 1
ES 34 -7 36 7 7 1 2 -1 21 70 0 9 0
FR 18 3 39 0 16 0 5 -1 22 57 3 21 -1
HR 27 0 43 4 14 2 5 0 11 70 4 19 2
IT 29 -7 46 6 7 -2 3 1 15 75 -1 10 -1
CY 29 0 40 6 7 -2 4 -4 20 69 6 11 -6
LV 15 4 36 2 19 1 6 -1 24 51 6 25 0
LT 18 1 43 3 13 -4 4 -1 22 61 4 17 -5
LU 15 -4 37 -1 19 -2 7 2 22 52 -5 26 0
HU 21 -6 38 1 15 2 7 1 19 59 -5 22 3
MT 36 2 35 2 8 0 3 -2 18 71 4 11 -2
NL 24 8 37 -4 23 1 4 -4 12 61 4 27 -3
AT 30 -1 43 4 14 -1 3 0 10 73 3 17 -1
PL 21 -2 48 7 13 0 3 -1 15 69 5 16 -1
PT 39 -2 40 -3 3 0 1 -1 17 79 -5 4 -1
RO 24 -11 39 6 17 9 4 0 16 63 -5 21 9
SI 26 -6 33 -1 21 5 6 -1 14 59 -7 27 4
SK 20 -4 41 1 13 -1 3 1 23 61 -3 16 0
FI 21 5 44 4 15 0 3 -1 17 65 9 18 -1
SE 27 12 37 1 15 -7 6 0 15 64 13 21 -7
UK 21 -1 37 -8 15 3 3 -2 24 58 -9 18 1
Tota
lly a
gree
Tend
to a
gree
Tend
to d
isag
ree
Tota
lly d
isag
ree
Tota
l 'Ag
ree'
Tota
l 'D
isag
ree'
To what extent do you agree or disagree with each of the following statements?Reducing fossil fuel imports from outside the EU can benefit the EU economically (%)
T11

Climate Change March 2017
Tables
Special Eurobarometer 459
QC4.4
Don
't kn
ow
EB87
.1
Diff
. EB8
7.1
- 83
.4
EB87
.1
Diff
. EB8
7.1
- 83
.4
EB87
.1
Diff
. EB8
7.1
- 83
.4
EB87
.1
Diff
. EB8
7.1
- 83
.4
EB87
.1
EB87
.1
Diff
. EB8
7.1
- 83
.4
EB87
.1
Diff
. EB8
7.1
- 83
.4
EU28 25 -1 39 0 13 -1 4 0 19 64 -1 17 -1
BE 14 1 43 -4 28 9 6 -1 9 57 -3 34 8
BG 25 -1 31 3 8 -4 3 -5 33 56 2 11 -9
CZ 16 -4 38 -2 20 4 5 -1 21 54 -6 25 3
DK 29 7 37 -2 12 -2 4 -1 18 66 5 16 -3
DE 27 1 39 0 17 -4 4 -1 13 66 1 21 -5
EE 10 -1 29 3 17 2 6 -1 38 39 2 23 1
IE 39 5 39 -1 8 -2 2 0 12 78 4 10 -2
EL 24 -11 43 3 14 3 3 1 16 67 -8 17 4
ES 37 -3 35 4 5 0 2 -1 21 72 1 7 -1
FR 19 6 38 -1 12 -2 5 -1 26 57 5 17 -3
HR 25 -1 44 4 14 3 5 -1 12 69 3 19 2
IT 29 -6 43 3 9 1 2 -1 17 72 -3 11 0
CY 24 -4 36 2 9 -1 3 -5 28 60 -2 12 -6
LV 16 2 40 6 14 -2 4 -4 26 56 8 18 -6
LT 20 4 44 4 10 -6 4 -2 22 64 8 14 -8
LU 16 -2 31 -6 23 1 7 3 23 47 -8 30 4
HU 22 -5 40 1 15 3 6 0 17 62 -4 21 3
MT 34 -2 37 6 7 -2 2 -2 20 71 4 9 -4
NL 18 3 31 -2 27 1 8 -3 16 49 1 35 -2
AT 26 -7 45 6 14 -1 3 0 12 71 -1 17 -1
PL 21 -2 45 2 17 4 3 0 14 66 0 20 4
PT 37 -6 40 -2 4 1 1 0 18 77 -8 5 1
RO 25 -10 38 6 16 8 4 0 17 63 -4 20 8
SI 28 -4 34 -2 20 7 6 -2 12 62 -6 26 5
SK 22 -1 41 -1 12 -1 2 0 23 63 -2 14 -1
FI 17 1 43 9 19 0 4 -1 17 60 10 23 -1
SE 36 11 31 -6 14 -4 6 1 13 67 5 20 -3
UK 22 -1 38 -6 11 -2 3 0 26 60 -7 14 -2
Tota
lly a
gree
Tend
to a
gree
Tend
to d
isag
ree
Tota
lly d
isag
ree
Tota
l 'Ag
ree'
Tota
l 'D
isag
ree'
To what extent do you agree or disagree with each of the following statements?Reducing fossil fuel imports from outside the EU can increase the security of EU energy supplies (%)
T12

Climate Change March 2017
Tables
Special Eurobarometer 459
QC4.5
Tota
lly a
gree
Tend
to a
gree
Tend
to d
isag
ree
Tota
lly d
isag
ree
Don
't kn
ow
Tota
l 'Ag
ree'
Tota
l 'D
isag
ree'
EU28 39 40 7 2 12 79 9
BE 31 49 14 2 4 80 16BG 30 35 5 2 28 65 7CZ 27 44 12 4 13 71 16DK 47 33 7 2 11 80 9DE 40 41 8 3 8 81 11EE 27 41 6 4 22 68 10IE 47 41 5 1 6 88 6EL 40 49 3 1 7 89 4ES 53 32 2 1 12 85 3FR 36 40 8 3 13 76 11HR 36 44 9 2 9 80 11IT 35 42 6 2 15 77 8CY 50 36 2 0 12 86 2LV 29 42 9 3 17 71 12LT 35 44 5 1 15 79 6LU 31 43 9 2 15 74 11HU 43 38 9 2 8 81 11MT 48 42 1 0 9 90 1NL 50 36 7 2 5 86 9AT 38 47 9 2 4 85 11PL 30 47 10 3 10 77 13PT 45 37 3 1 14 82 4RO 33 37 14 3 13 70 17SI 46 36 8 2 8 82 10SK 27 44 7 2 20 71 9FI 41 44 5 2 8 85 7SE 60 26 5 2 7 86 7UK 37 40 7 2 14 77 9
To what extent do you agree or disagree with each of the following statements?More public financial support should be given to the transition to clean energies even if it means subsidies tofossil fuels should be reduced (%)
T13

Climate Change March 2017
Tables
Special Eurobarometer 459
QC5
Don
't kn
ow
EB87
.1
Diff
. EB8
7.1
- 83
.4
EB87
.1
Diff
. EB8
7.1
- 83
.4
EB87
.1
EU28 49 0 47 0 4
BE 47 -4 53 7 0BG 21 2 67 -6 12CZ 38 2 58 -1 4DK 60 7 36 -9 4DE 65 -1 25 0 10EE 34 6 58 -9 8IE 50 -2 49 2 1EL 50 10 50 -9 0ES 62 -4 37 4 1FR 58 1 41 0 1HR 38 0 60 3 2IT 34 0 64 2 2CY 54 6 45 -6 1LV 31 8 67 -7 2LT 48 10 50 -10 2LU 74 3 25 -3 1HU 48 -4 51 4 1MT 75 17 25 -16 0NL 59 12 41 -12 0AT 60 6 34 -6 6PL 30 0 63 0 7PT 60 4 38 -4 2RO 20 -5 77 6 3SI 66 -6 31 10 3SK 44 1 51 -1 5FI 65 -1 33 1 2SE 79 3 19 -4 2UK 40 -5 55 1 5
Yes
No
Have you personally taken any action to fight climate change over the past six months?(%)
T14

Climate Change March 2017
Tables
Special Eurobarometer 459
QC6
EB87
.1
Diff
. EB8
7.1
- 83
.4
EB87
.1
Diff
. EB8
7.1
- 83
.4
EB87
.1
Diff
. EB8
7.1
- 83
.4
EB87
.1
Diff
. EB8
7.1
- 83
.4
EB87
.1
Diff
. EB8
7.1
- 83
.4
EB87
.1
Diff
. EB8
7.1
- 83
.4
EB87
.1
Diff
. EB8
7.1
- 83
.4
EB87
.1
Diff
. EB8
7.1
- 83
.4
EU28 9 -4 1 1 26 -10 18 -5 3 -2 37 -5 7 -2 8 8
BE 12 -8 4 4 30 -13 29 -8 6 -4 46 -11 17 -1 9 9
BG 3 -2 0 0 17 -6 25 -2 1 -2 36 -3 0 -1 1 1
CZ 8 -4 1 1 21 -11 19 -4 2 -1 41 -6 5 -2 6 6
DK 26 0 1 1 47 -6 29 0 5 -1 55 -10 11 1 18 18
DE 14 -1 1 1 41 -11 17 -3 3 -1 43 -10 14 0 7 7
EE 14 -3 0 0 30 -8 34 -3 5 -2 44 -3 4 -1 7 7
IE 12 -3 0 0 23 -10 25 -9 4 -3 31 -12 11 -6 10 10
EL 4 -1 0 0 20 -13 18 -1 1 -1 32 1 1 -1 2 2
ES 4 0 0 0 19 -16 7 -6 1 -3 30 -5 2 -1 8 8
FR 11 -4 1 1 25 -8 24 -5 5 -2 43 -3 4 0 10 10
HR 4 -4 0 0 11 -13 15 -1 1 0 20 -6 2 -3 3 3
IT 7 -2 1 1 13 -8 8 -3 2 -1 35 -3 3 -6 5 5
CY 11 -5 1 1 11 -16 18 -2 3 -1 41 -2 3 -1 2 2
LV 9 0 0 0 36 -15 19 -3 1 -2 49 -1 3 1 9 9
LT 6 -4 1 1 18 0 18 -1 1 -2 29 -6 0 -1 5 5
LU 22 -13 2 2 31 -17 29 -9 10 -4 45 -13 10 -3 18 18
HU 4 -2 1 1 12 -6 14 -6 3 -5 37 -1 3 -1 4 4
MT 9 -9 0 0 18 -2 8 -5 5 0 46 -2 1 -1 15 15
NL 15 -6 1 1 56 -3 29 -4 11 -1 65 8 22 4 25 25
AT 9 -8 2 2 34 -17 15 -4 4 -1 40 -9 17 1 8 8
PL 3 -4 0 0 13 -8 10 -6 2 0 26 -4 1 -2 5 5
PT 3 -2 0 0 13 -10 13 0 2 0 33 7 2 -1 4 4
RO 4 -5 0 0 23 -4 24 -9 1 -2 32 -2 2 -1 5 5
SI 16 0 0 0 35 -17 35 5 5 1 50 9 11 1 11 11
SK 4 -4 0 0 18 -11 14 -9 1 -1 30 -7 2 0 4 4
FI 14 -1 1 1 43 -3 16 -4 1 -1 38 -2 12 -1 15 15
SE 22 -4 1 1 56 -6 13 -7 2 -1 47 -2 24 1 8 8
UK 13 -9 1 1 25 -13 27 -14 3 -3 27 -11 10 -3 15 15
Which of the following actions, if any, apply to you? (MULTIPLE ANSWERS POSSIBLE)(%)
You
have
bou
ght a
new
car
and
its
low
fuel
con
sum
ptio
n w
as a
n im
port
ant f
acto
r in
your
cho
ice
You
have
bou
ght a
n el
ectr
ic c
ar
You
regu
larly
use
env
ironm
enta
lly-f
riend
ly
alte
rnat
ives
to y
our p
rivat
e ca
r suc
h as
wal
king
, cy
clin
g, ta
king
pub
lic tr
ansp
ort o
r car
-sha
ring
You
have
insu
late
d yo
ur h
ome
bett
er
to re
duce
you
r ene
rgy
cons
umpt
ion
You
have
bou
ght a
low
-ene
rgy
hom
e
Whe
n bu
ying
a n
ew h
ouse
hold
app
lianc
e e.
g. w
ashi
ng m
achi
ne, f
ridge
or T
V, lo
wer
ene
rgy
cons
umpt
ion
is a
n im
port
ant f
acto
r in
your
cho
ice
You
have
sw
itche
d to
an
ener
gy s
uppl
ier
whi
ch o
ffers
a g
reat
er s
hare
of e
nerg
y fr
om
rene
wab
le s
ourc
es th
an y
our p
revi
ous
one
You
have
inst
alle
d eq
uipm
ent
in y
our h
ome
to c
ontr
ol a
nd re
duce
yo
ur e
nerg
y co
nsum
ptio
n (e
.g. s
mar
t met
er)
T15

Climate Change March 2017
Tables
Special Eurobarometer 459
QC6
Don
't kn
ow
EB87
.1
Diff
. EB8
7.1
- 83
.4
EB87
.1
Diff
. EB8
7.1
- 83
.4
EB87
.1
Diff
. EB8
7.1
- 83
.4
EB87
.1
Diff
. EB8
7.1
- 83
.4
EB87
.1
Diff
. EB8
7.1
- 83
.4
EB87
.1
Diff
. EB8
7.1
- 83
.4
EB87
.1
Diff
. EB8
7.1
- 83
.4
EB87
.1
EB87
.1
Diff
. EB8
7.1
- 83
.4
EU28 4 4 41 -8 10 -3 71 -3 56 -1 3 0 9 3 1 90 -4
BE 11 11 42 -8 9 -4 73 -5 59 -3 2 -1 1 -1 0 98 1
BG 3 3 44 -9 4 -2 25 -12 37 -11 3 1 20 10 3 77 -11
CZ 3 3 30 -8 14 0 70 -9 47 -7 3 2 7 4 1 92 -4
DK 5 5 46 -7 13 -5 70 -2 72 6 4 -3 5 2 1 95 -2
DE 9 9 56 -4 23 -4 77 -4 71 2 1 -1 5 3 2 93 -5
EE 1 1 45 -9 6 -4 61 -10 57 -8 2 0 5 1 3 92 -3
IE 4 4 40 -11 9 -2 79 -5 66 -1 2 1 3 1 2 95 -2
EL 14 14 35 -12 5 -3 67 -2 37 -3 4 -2 14 4 0 86 -3
ES 1 1 32 -7 3 -2 77 1 58 1 3 -1 10 3 0 89 -4
FR 2 2 53 -8 6 -3 83 -4 60 -5 3 2 4 1 0 96 0
HR 1 1 35 -5 5 -1 54 2 44 -3 5 1 16 3 2 82 -2
IT 5 5 37 -14 8 -3 69 1 48 -1 3 0 9 2 2 89 -3
CY 21 21 39 -9 7 3 70 -8 40 3 3 2 13 5 1 87 -5
LV 2 2 49 -15 7 0 43 -2 46 2 3 1 10 6 1 89 -6
LT 1 1 33 -8 6 0 78 11 62 19 2 0 7 1 1 92 1
LU 10 10 51 -11 17 -6 87 0 73 3 2 0 2 2 1 97 -2
HU 1 1 25 -8 8 -1 63 5 53 1 2 0 16 5 0 84 -4
MT 14 14 54 -6 3 -4 83 5 68 12 2 -1 5 2 1 94 -1
NL 15 15 41 -4 14 1 84 0 76 4 4 0 1 -1 0 99 1
AT 10 10 58 -6 28 -1 71 -7 61 1 5 3 4 2 0 95 -3
PL 1 1 23 -12 2 -2 54 -8 45 0 7 5 13 4 2 85 -1
PT 2 2 31 -14 2 -3 68 1 55 0 3 -1 13 3 0 87 -2
RO 1 1 31 -11 5 2 30 -7 29 -4 5 2 25 14 4 71 -16
SI 5 5 62 4 8 -8 84 -2 65 -8 2 -3 4 4 0 96 -4
SK 1 1 35 -14 3 -5 70 0 53 2 6 4 7 3 3 90 -5
FI 2 2 42 -11 22 -4 75 -5 67 0 2 -2 6 4 2 93 -4
SE 1 1 63 0 38 -6 88 1 69 2 2 -4 1 0 0 98 -1
UK 3 3 36 -7 7 -3 74 -5 50 -2 0 -2 10 2 2 88 -4
Tota
l 'At
leas
t one
act
ion'
You
buy
loca
lly p
rodu
ced
and
seas
onal
food
whe
neve
r pos
sibl
e
You
avoi
d ta
king
sho
rt-h
aul f
light
sw
hene
ver p
ossi
ble
You
try
to re
duce
you
r was
te a
nd
you
regu
larly
sep
arat
e it
for r
ecyc
ling
You
try
to c
ut d
own
on y
our c
onsu
mpt
ion
ofdi
spos
able
item
s w
hene
ver p
ossi
ble,
e.g
. pla
stic
bag
sfr
om th
e su
perm
arke
t, ex
cess
ive
pack
agin
g
Oth
er (S
PON
TAN
EOU
S)
Non
e (S
PON
TAN
EOU
S)
Which of the following actions, if any, apply to you? (MULTIPLE ANSWERS POSSIBLE)(%)
You
have
inst
alle
d so
lar p
anel
s in
you
r hom
e
T16

Climate Change March 2017
Tables
Special Eurobarometer 459
QC7
Don
't kn
ow
EB87
.1
Diff
. EB8
7.1
- 83
.4
EB87
.1
Diff
. EB8
7.1
- 83
.4
EB87
.1
Diff
. EB8
7.1
- 83
.4
EB87
.1
Diff
. EB8
7.1
- 83
.4
EB87
.1
EB87
.1
Diff
. EB8
7.1
- 83
.4
EB87
.1
Diff
. EB8
7.1
- 83
.4
EU28 51 -1 38 -1 5 0 2 1 4 89 -2 7 1
BE 52 2 37 -5 10 3 1 0 0 89 -3 11 3
BG 39 2 38 -3 4 -2 2 -3 17 77 -1 6 -5
CZ 35 -1 47 -2 11 2 3 0 4 82 -3 14 2
DK 75 12 21 -10 2 -2 0 -1 2 96 2 2 -3
DE 48 -7 40 4 6 1 2 0 4 88 -3 8 1
EE 40 7 45 -7 7 -2 2 0 6 85 0 9 -2
IE 63 3 33 -2 1 -2 0 0 3 96 1 1 -2
EL 64 -4 30 2 4 1 1 1 1 94 -2 5 2
ES 58 0 36 1 2 -1 0 0 4 94 1 2 -1
FR 52 8 42 -4 3 -3 1 -1 2 94 4 4 -4
HR 50 -1 39 -3 7 3 2 1 2 89 -4 9 4
IT 43 -7 43 2 7 2 1 0 6 86 -5 8 2
CY 81 -2 16 1 1 0 0 0 2 97 -1 1 0
LV 45 8 37 -6 10 -1 5 0 3 82 2 15 -1
LT 48 5 45 -1 3 -3 1 0 3 93 4 4 -3
LU 57 0 37 0 3 0 2 1 1 94 0 5 1
HU 56 -1 37 -1 3 0 2 1 2 93 -2 5 1
MT 73 -11 26 13 0 -2 0 0 1 99 2 0 -2
NL 75 6 22 -6 2 -1 1 1 0 97 0 3 0
AT 53 3 40 -1 4 -3 1 0 2 93 2 5 -3
PL 32 2 53 0 8 -2 1 0 6 85 2 9 -2
PT 48 3 46 -3 2 -1 1 1 3 94 0 3 0
RO 53 1 29 -10 11 6 3 3 4 82 -9 14 9
SI 68 11 26 -9 4 -1 1 0 1 94 2 5 -1
SK 32 -4 51 1 6 -1 3 1 8 83 -3 9 0
FI 51 2 41 -5 6 2 1 1 1 92 -3 7 3
SE 74 8 18 -9 4 -1 3 2 1 92 -1 7 1
UK 61 -1 28 -1 4 -1 1 -1 6 89 -2 5 -2
Very
impo
rtan
t
Fairl
y im
port
ant
Not
ver
y im
port
ant
Not
at a
ll im
port
ant
Tota
l 'Im
port
ant'
Tota
l 'N
ot im
port
ant'
How important do you think it is that the (NATIONALITY) government sets targets to increase the amount of renewableenergy used, such as wind or solar power, by 2030?(%)
T17
Climate Change March 2017
Tables
Special Eurobarometer 459
QC8
Don
't kn
ow
EB87
.1
Diff
. EB8
7.1
- 83
.4
EB87
.1
Diff
. EB8
7.1
- 83
.4
EB87
.1
Diff
. EB8
7.1
- 83
.4
EB87
.1
Diff
. EB8
7.1
- 83
.4
EB87
.1
EB87
.1
Diff
. EB8
7.1
- 83
.4
EB87
.1
Diff
. EB8
7.1
- 83
.4
EU28 48 -4 40 0 6 1 2 1 4 88 -4 8 2
BE 50 -3 41 3 8 1 1 0 0 91 0 9 1
BG 46 -3 35 -4 3 -1 2 0 14 81 -7 5 -1
CZ 35 -8 48 2 10 3 3 1 4 83 -6 13 4
DK 65 7 31 -6 2 -2 0 0 2 96 1 2 -2
DE 45 -8 41 4 8 1 3 1 3 86 -4 11 2
EE 38 1 45 -6 9 1 2 1 6 83 -5 11 2
IE 63 -3 32 2 3 0 0 0 2 95 -1 3 0
EL 61 1 29 -6 8 5 1 0 1 90 -5 9 5
ES 51 -3 41 3 3 -1 1 0 4 92 0 4 -1
FR 49 0 44 1 3 -2 1 0 3 93 1 4 -2
HR 48 0 41 -2 8 3 1 0 2 89 -2 9 3
IT 40 -11 46 5 7 2 2 1 5 86 -6 9 3
CY 77 -5 20 3 2 1 0 0 1 97 -2 2 1
LV 41 0 43 -2 11 3 2 0 3 84 -2 13 3
LT 48 8 44 -6 4 -2 1 -1 3 92 2 5 -3
LU 54 0 38 -2 5 2 1 0 2 92 -2 6 2
HU 59 1 34 -3 4 1 2 1 1 93 -2 6 2
MT 70 -14 27 13 1 0 0 0 2 97 -1 1 0
NL 67 7 28 -7 4 0 0 -1 1 95 0 4 -1
AT 51 5 38 -4 7 -2 1 -1 3 89 1 8 -3
PL 30 0 56 1 8 0 1 -1 5 86 1 9 -1
PT 44 3 49 -4 3 -1 1 1 3 93 -1 4 0
RO 53 -3 30 -7 11 7 3 3 3 83 -10 14 10
SI 62 2 31 -4 5 1 1 1 1 93 -2 6 2
SK 33 -7 51 1 6 0 3 2 7 84 -6 9 2
FI 44 -2 46 1 8 1 1 0 1 90 -1 9 1
SE 63 6 30 -7 4 0 2 1 1 93 -1 6 1
UK 60 -5 30 2 3 0 1 -1 6 90 -3 4 -1
Very
impo
rtan
t
Fairl
y im
port
ant
Not
ver
y im
port
ant
Not
at a
ll im
port
ant
Tota
l 'Im
port
ant'
Tota
l 'N
ot im
port
ant'
How important do you think it is that the (NATIONALITY) government provides support for improving energy efficiencyby 2030 (e.g. by encouraging people to insulate their home or buy electric cars)?(%)
T18