Embed Size (px)
Citation preview

Spectral Properties of Leaves & Plants

January 17Topics: Spectroscopy of Leaves and Plants
Reading: Chapters 11, 2 Optical Properties of leaves and canopies Plant functions (photosynthesis, respiration, transpiration) Bidirectional Reflectance Distribution Function
2

Pigment absorption is the dominant process in visible; Scattering is the dominant process in near-infrared; Water absorption is increasingly important with wavelength in the mid-infrared.
Leaf Functions
3

Leaf biochemical composition
• water (vacuole): 90-95% • dry matter (cell walls): 5-10%
- cellulose: 15-30% - hemicellulose: 10-30% - proteins: 10-20% - lignin: 5-15% - starch: 0.2-2.7% - sugar - etc.
A typical fresh-green leaf contains:
• wax (cuticle) • chlorophylls a and b (chloroplasts) • carotenoids (chloroplasts) • other pigments (cytoplasm)
- anthocyanins, flavons -”brown pigments” - etc.
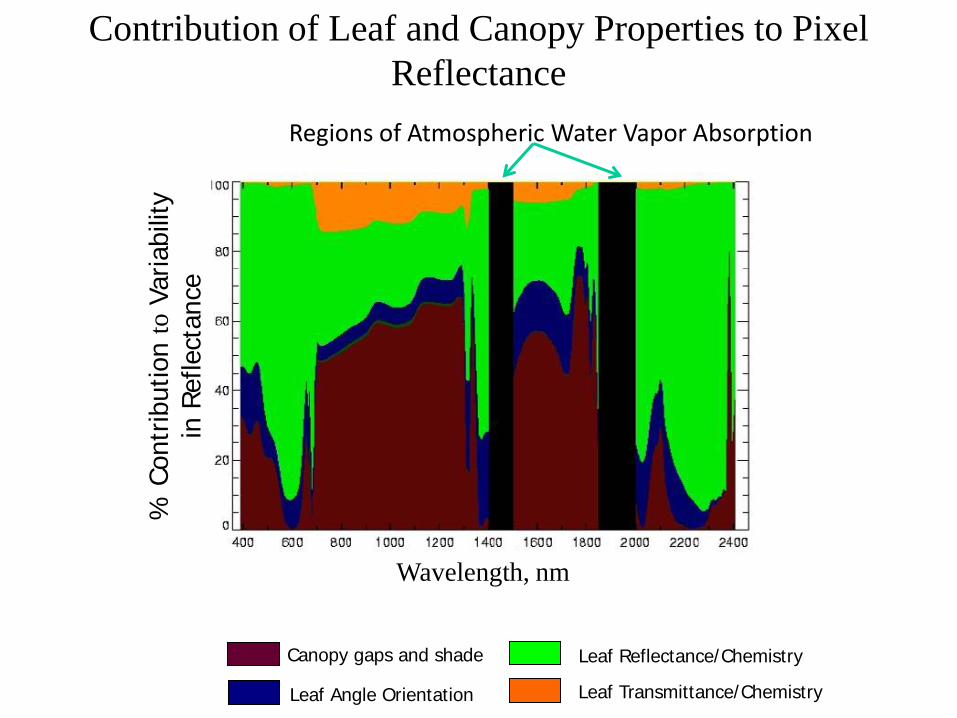
Canopy gaps and shade Leaf Reflectance/Chemistry
Leaf Transmittance/Chemistry Leaf Angle Orientation
Wavelength, nm
Contribution of Leaf and Canopy Properties to Pixel Reflectance
% C
ontr
ibut
ion
to V
aria
bilit
y in
Ref
lect
ance
Regions of Atmospheric Water Vapor Absorption

Components of Photosynthesis Revealed via Spectroscopy
Carotenoids

Anatomy of a Leaf
3-D model of a leaf Goverts et al., 1996
Leaf Functioning is closely tied to anatomy
7

Chloroplasts
Light harvesting occurs on thylakoid Membranes (stack = granna) in chloroplasts
6CO2+6H2O = C6H12O6 + 6O2
Photosynthesis:
Leaf Functions: Photosynthesis
8

Transfer of Photon Energy from Photosystem Antenna to Reaction Center
Reaction center (chlorophyll a)
e- donor (H2O)
e- acceptor (NADPH+)
light
Pigments: Chlorophylls: a, b (+algal pigments) Carotenoids: 2 classes Carotenes, xanthophylls
Leaf Functions
9
O2
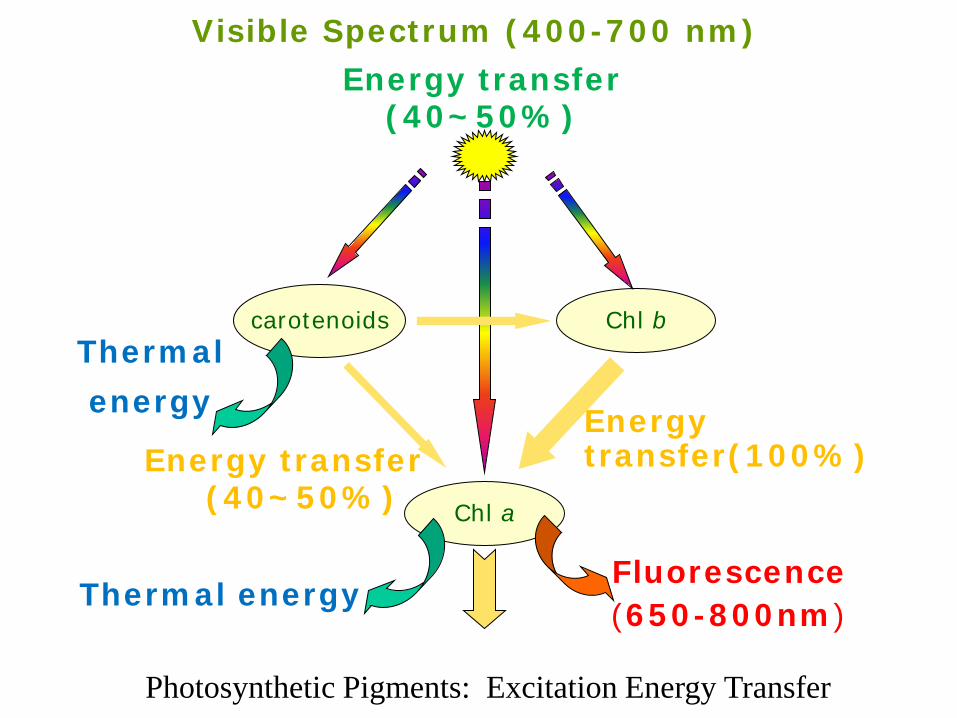
Chl b
Chl a
carotenoids Thermal energy
Photosynthesis = chemical energy
Energy transfer (40~50%)
Fluorescence (650-800nm)
Visible Spectrum (400-700 nm)
Energy transfer (40~50%)
Energy transfer(100%)
Thermal energy
Photosynthetic Pigments: Excitation Energy Transfer

Chlorophyll a and b
Chlorophyll b C H O
Leaf Functions
11
Porp
hyrin
ring

Chlorophyll Concentration
chlorophyll concentration
RedNIRρρ
RedNIRRedNIRρρρρ
+−
The Simple Ratio Vegetation Index (VI):
The Normalized Difference Vegetation Index (NDVI):
Vegetation Indexes
Amount of chlorophyll in canopy
Photosynthesis (Assimilation) Potential
0
0.05
0.1
0.15
0.2
0.25
0.3
0.35
400 600 800 1000 1200 1400
Wavelength (nm)
Refle
ctan
ce
Veget
IcePlant
= RNIR/RRed
RNIR - RRed
RNIR + RRed =
12
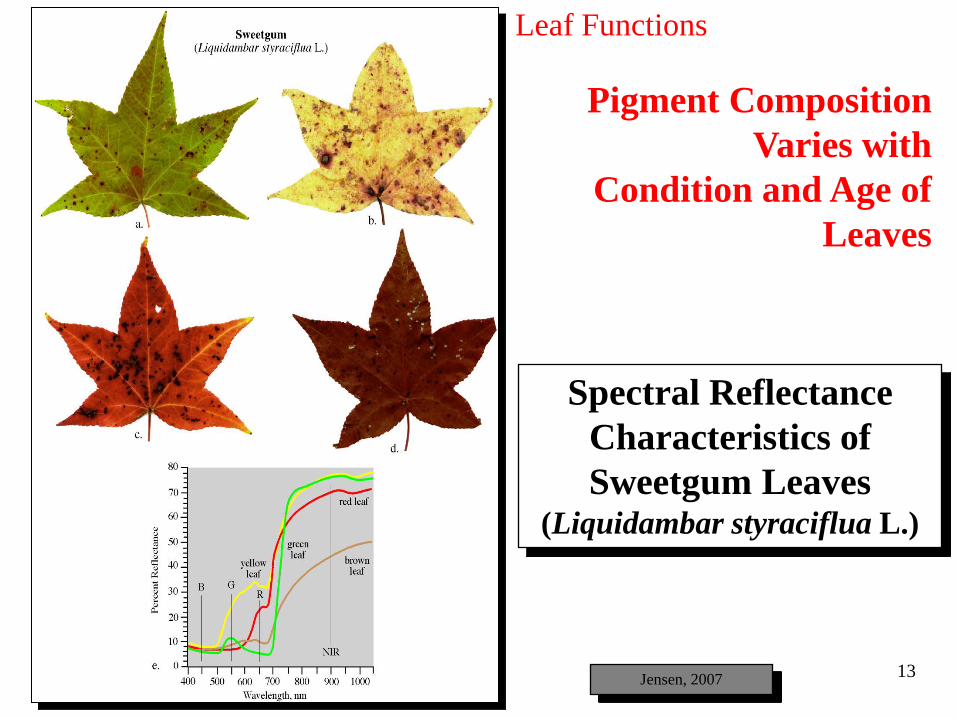
Spectral Reflectance Characteristics of Sweetgum Leaves
(Liquidambar styraciflua L.)
Pigment Composition Varies with
Condition and Age of Leaves
Leaf Functions
13 Jensen, 2007

1 2
a
3
4
0
5
10
15
20
25
30
35
Blue (0.45 - 0.52 µm)
Perc
ent R
efle
ctan
ce
Green leaf
Yellow
Red/orange
Brown 4
2
1
3
45
40
Green (0.52 - 0.60 µm)
Red (0.63 - 0.69 µm)
Near-Infrared (0.70 - 0.92 µm)
a.
b.
c.
d. Jensen, 2007
Spectral Reflectance Characteristics of Selected Areas of
Blackjack Oak Leaves
Pigment Composition Varies with:
Species, Condition, and Age of
Leaves
Leaf Functions
14
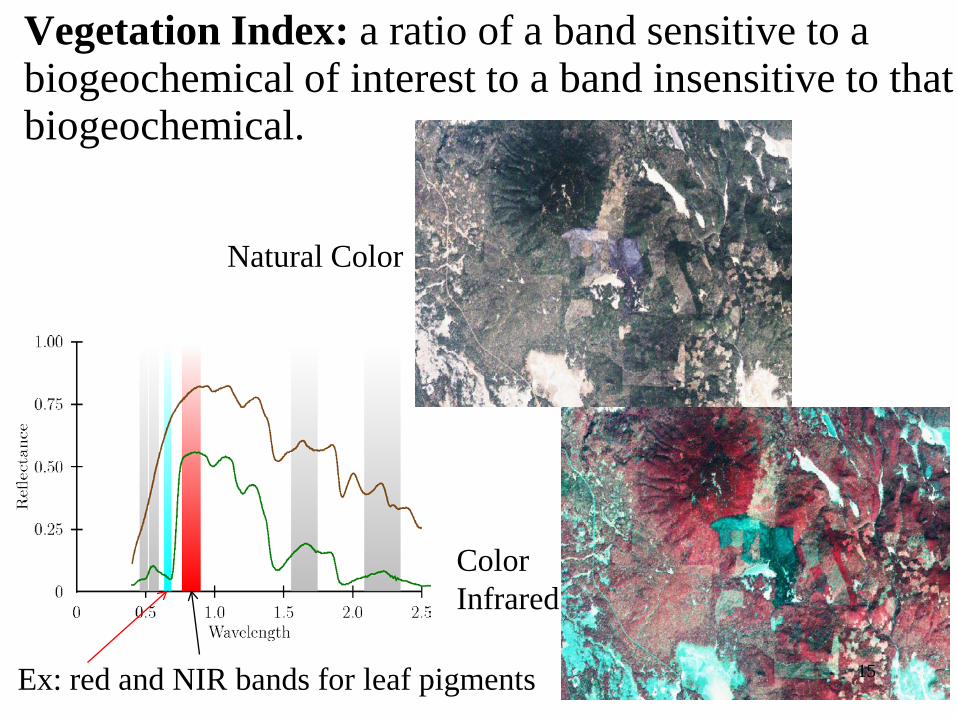
Vegetation Index: a ratio of a band sensitive to a biogeochemical of interest to a band insensitive to that biogeochemical.
15
Natural Color
Color Infrared
Ex: red and NIR bands for leaf pigments
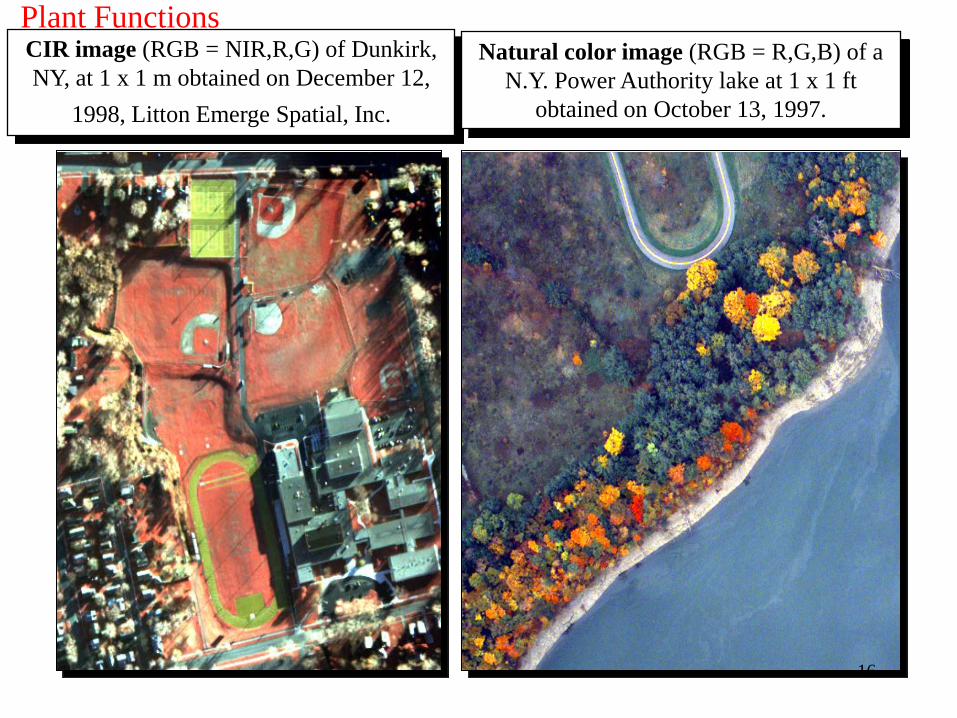
CIR image (RGB = NIR,R,G) of Dunkirk, NY, at 1 x 1 m obtained on December 12,
1998, Litton Emerge Spatial, Inc.
Natural color image (RGB = R,G,B) of a N.Y. Power Authority lake at 1 x 1 ft
obtained on October 13, 1997.
Plant Functions
16

Simple Ratio (SR) Vegetation Index
The near-infrared (NIR) to red Simple Ratio (SR) is the first true vegetation index: Takes advantage of the relationship between high absorption by chlorophyll of red radiant energy and high reflectance of near-infrared energy for healthy leaves and plant canopies.
SR = RNIR / RR
17
Optical Properties
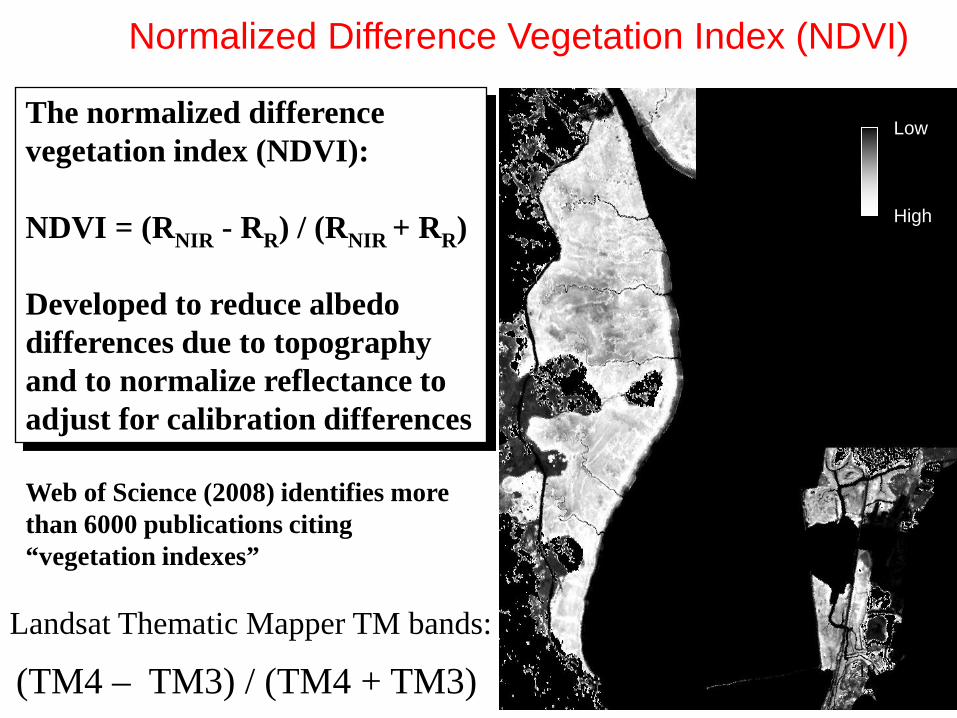
Normalized Difference Vegetation Index (NDVI)
The normalized difference vegetation index (NDVI): NDVI = (RNIR - RR) / (RNIR + RR) Developed to reduce albedo differences due to topography and to normalize reflectance to adjust for calibration differences
Web of Science (2008) identifies more than 6000 publications citing “vegetation indexes”
Low
High
(TM4 – TM3) / (TM4 + TM3) 18
Landsat Thematic Mapper TM bands:

Leaf Spectrum: Determined by Absorbing Molecules and Scattering Properties
Big Bluestem Grass: reflectance is displayed upwards from 0.0; transmittance is displayed downward from 1.0;
Rearranging the equation shows that [absorption] is the dark grey area between the two curves.
Conclusion: absorption dominates in visible; scattering dominates in the NIR.
In this figure
Reflectance +
absorption +
transmittance
= 1.0
Transmittance Absorption
Reflectance
Optical Properties
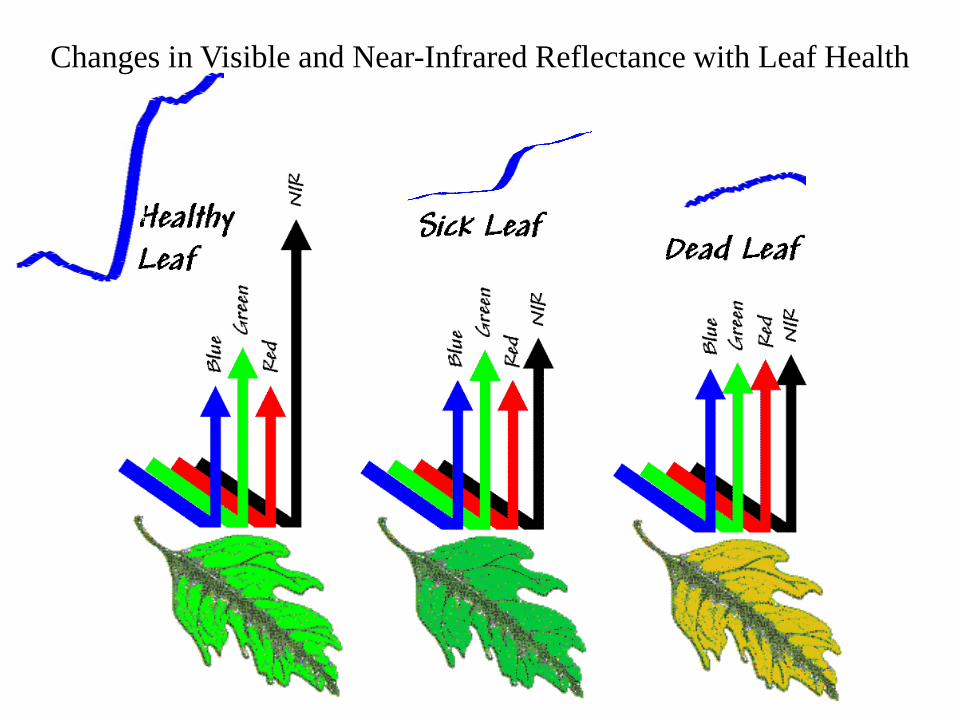
Changes in Visible and Near-Infrared Reflectance with Leaf Health
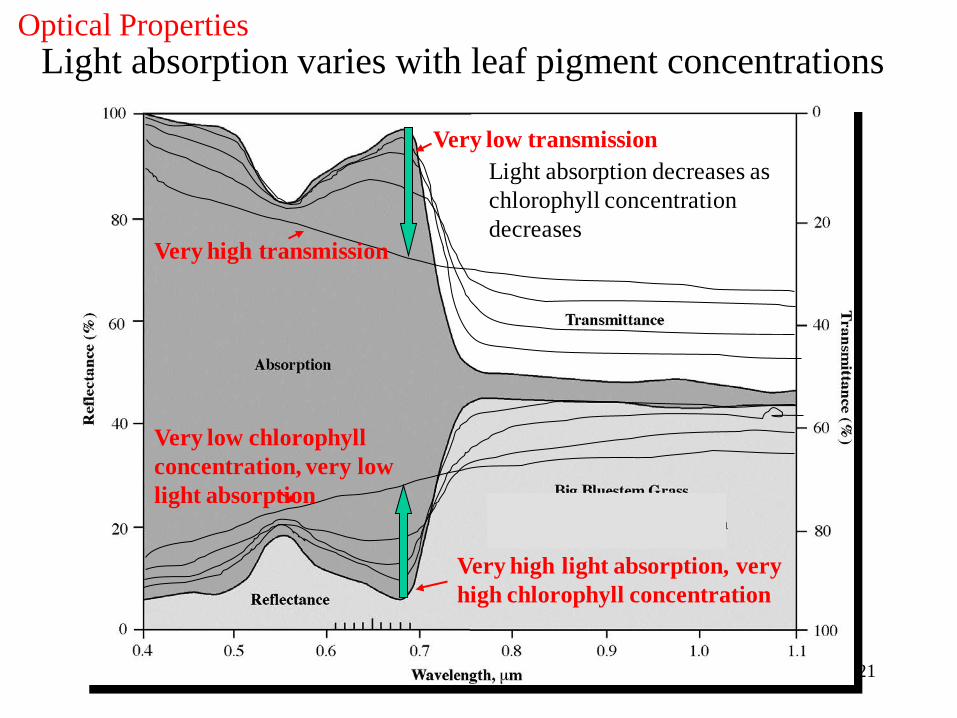
Light absorption varies with leaf pigment concentrations Optical Properties
21
Light absorption decreases as chlorophyll concentration decreases
Very high transmission
Very low chlorophyll concentration, very low light absorption
Very low transmission
Very high light absorption, very high chlorophyll concentration
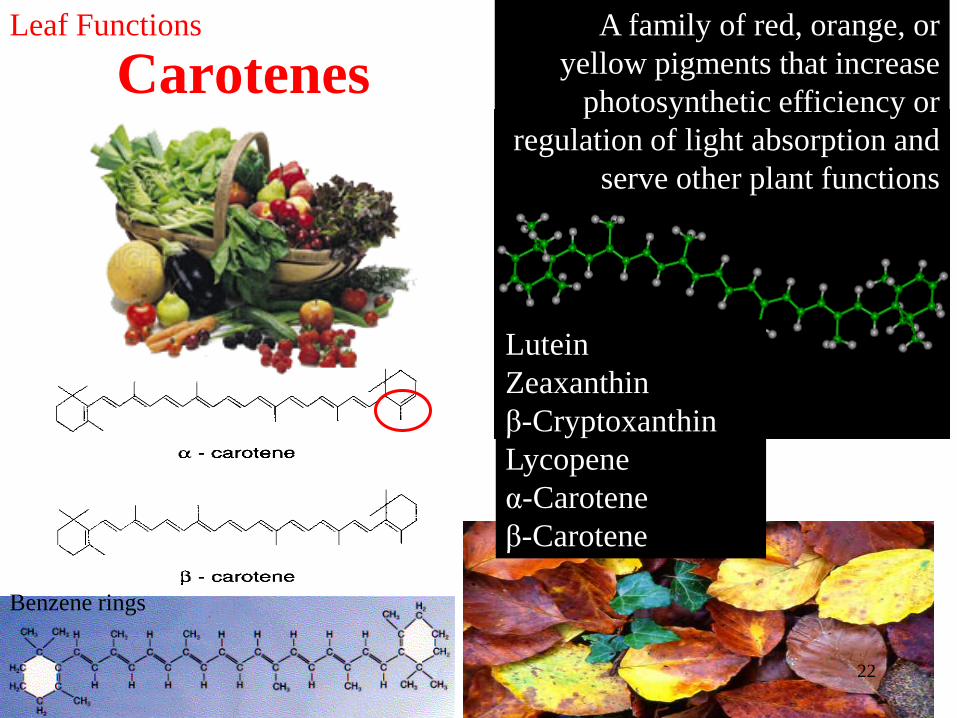
Carotenes A family of red, orange, or
yellow pigments that increase photosynthetic efficiency or
regulation of light absorption and serve other plant functions
Lutein Zeaxanthin β-Cryptoxanthin Lycopene α-Carotene β-Carotene
Leaf Functions
22
Benzene rings

Senescence sequence of a leaf
■ ■ ■
430
410
453
652 662
Leaf Functions
23
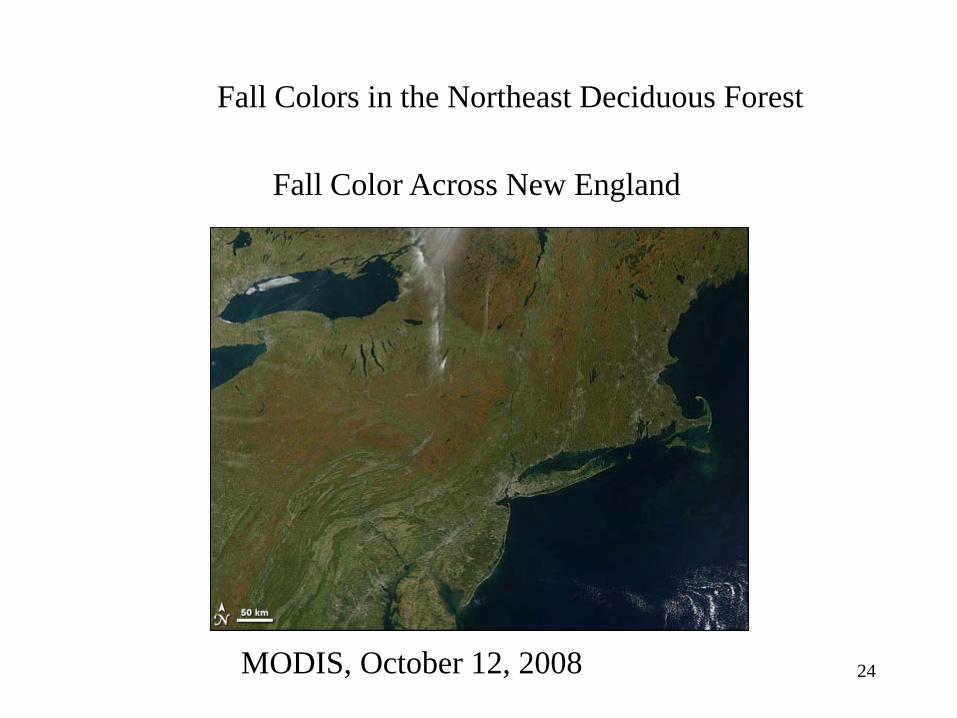
24 MODIS, October 12, 2008
Fall Colors in the Northeast Deciduous Forest
Fall Color Across New England

25
Fall Colors in the Allegheny Mountains
October 13, 2010
October 8, 2010
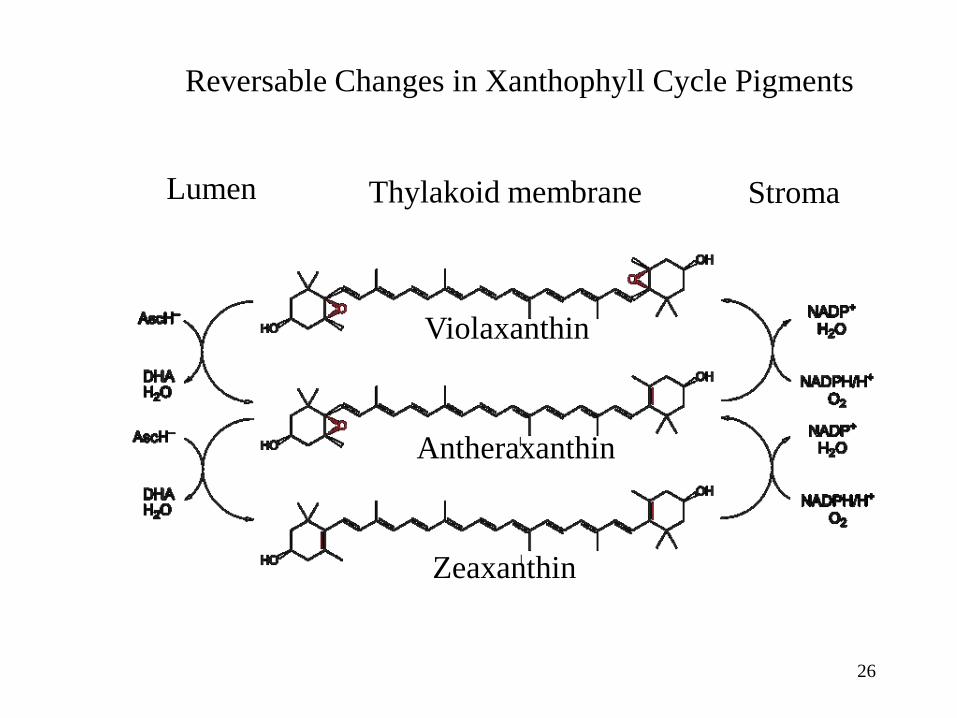
Lumen
26
Violaxanthin
Antheraxanthin
Zeaxanthin
Thylakoid membrane Stroma
Reversable Changes in Xanthophyll Cycle Pigments
400 600 800 1000 1200 1400 1600 1800 2000 2200 24000
0.1
0.2
0.3
0.4
0.5
0.6
0.7
0.8
0.9
1
Wavelength (nm)
Reflectance
Transmittance
Absorptance
(a)
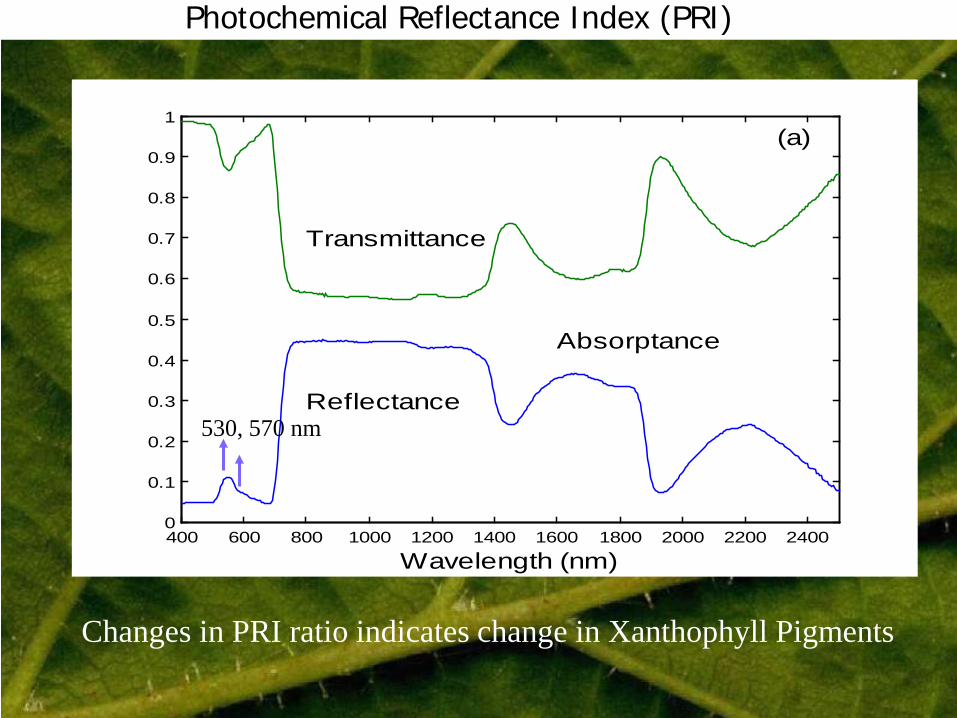
Photochemical Reflectance Index (PRI)
530, 570 nm
Changes in PRI ratio indicates change in Xanthophyll Pigments
28
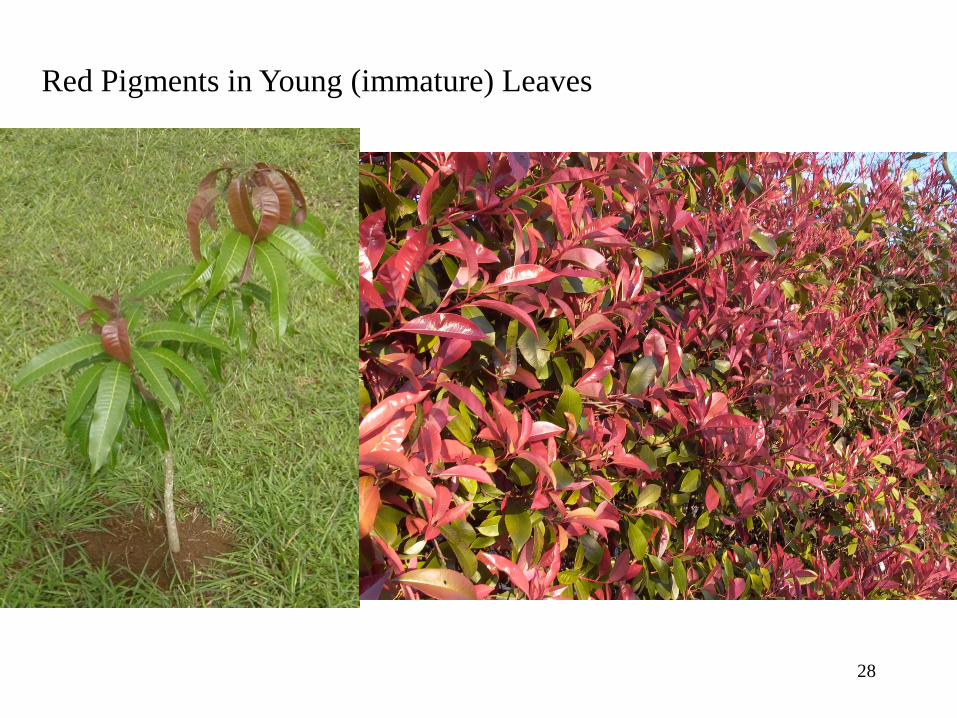
Red Pigments in Young (immature) Leaves

29
Anthocyanins are found in all plant parts: Many functions from reproduction to herbivore defense pollinators Seed dispursal Fruit dispursal
Pseudowintera colorata (horopito) Pigments always present (herbivore defense or nutrient deficiency)
30
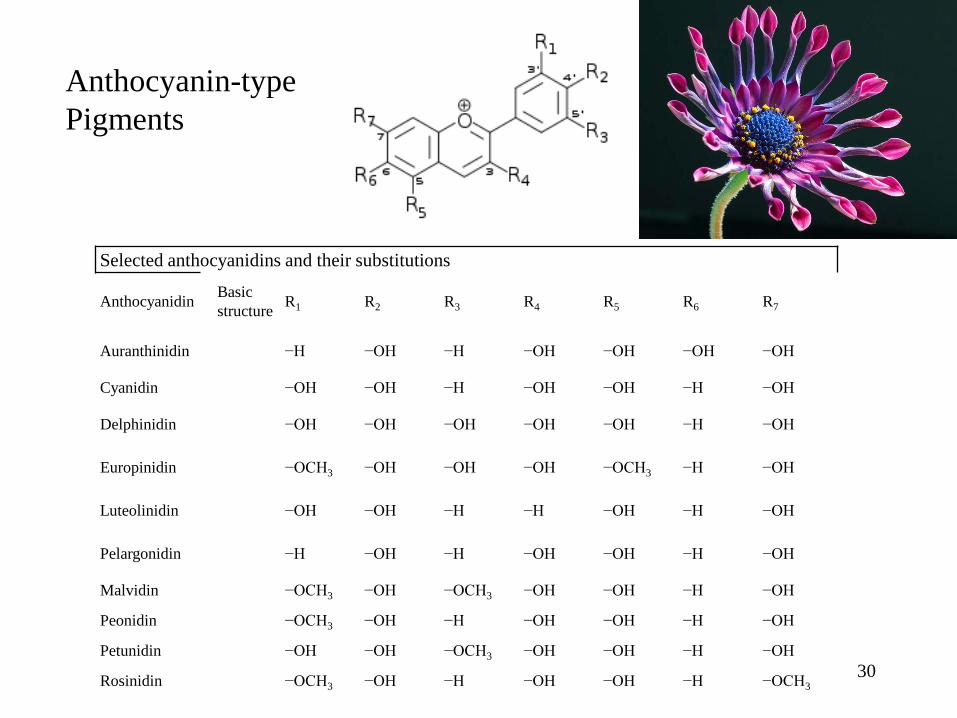
Selected anthocyanidins and their substitutions
Anthocyanidin Basic structure R1 R2 R3 R4 R5 R6 R7
Auranthinidin −H −OH −H −OH −OH −OH −OH
Cyanidin −OH −OH −H −OH −OH −H −OH
Delphinidin −OH −OH −OH −OH −OH −H −OH
Europinidin −OCH3 −OH −OH −OH −OCH3 −H −OH
Luteolinidin −OH −OH −H −H −OH −H −OH
Pelargonidin −H −OH −H −OH −OH −H −OH
Malvidin −OCH3 −OH −OCH3 −OH −OH −H −OH
Peonidin −OCH3 −OH −H −OH −OH −H −OH
Petunidin −OH −OH −OCH3 −OH −OH −H −OH
Rosinidin −OCH3 −OH −H −OH −OH −H −OCH3
Anthocyanin-type Pigments
400 nm 800 nm
λ2 λ1
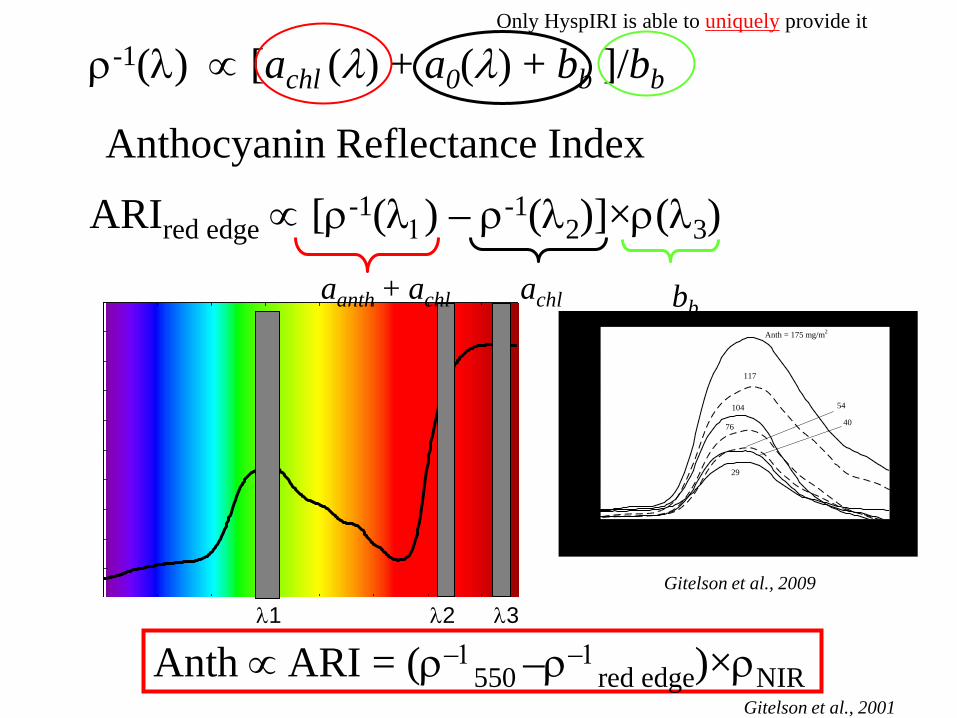
ρ-1(λ) ∝ [achl (λ) + a0(λ) + bb ]/bb
ARIred edge ∝ [ρ-1(λ1) – ρ-1(λ2)]×ρ(λ3)
λ3
aanth + achl achl bb
Anthocyanin Reflectance Index
Gitelson et al., 2009
0
10
20
30
40
50
60
450 500 550 600 650
Wavelength, nm
Ant
hocy
anin
abs
orpt
ion,
per
cen
t
29
40
104
Anth = 175 mg/m2
54
76
117
Anth ∝ ARI = (ρ−1550 –ρ−1red edge)×ρNIR Gitelson et al., 2001
Only HyspIRI is able to uniquely provide it

Reflectance Changes in a Magnolia Leaf (Magnolia grandiflora) as Water Content Declines
Jensen, 2007 Hydration of canopy varies with soil water availability
Optical Properties: Changes in Leaf Reflectance as it Dries
32

Infrared Water Index Information about vegetation water content has widespread application in agriculture, forestry, and hydrology. Hardisty et al. (1983) and Gao (1996) found that the Normalized Difference Moisture or Water Index (NDMI or MDWI) based on Landsat TM near-and middle-infrared bands was highly correlated with canopy water content and more closely tracked changes in plant biomass than did the NDVI.
Jensen, 2007
NDMI = (NIR TM4 – MIRTM5) / (NIR TM4+ MIRTM5)
NDWI = (NIRTM4 – MIRTM7) / (NIRTM4 + MIRTM7) 33
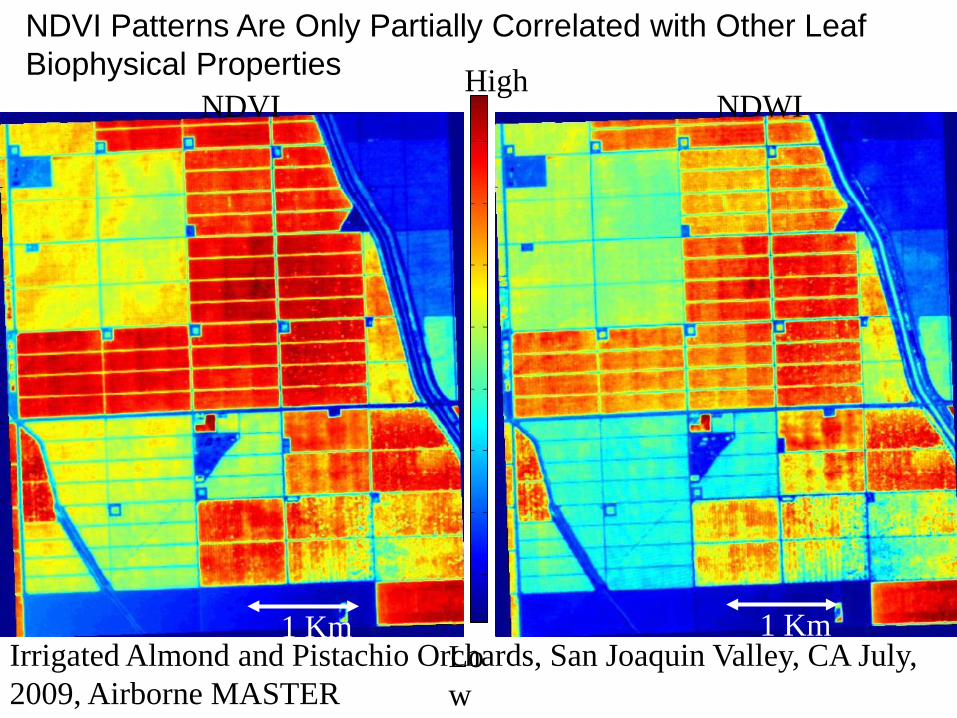
NDWI
1 Km
High
Low
1 Km 1 Km
NDVI
NDVI Patterns Are Only Partially Correlated with Other Leaf Biophysical Properties
Irrigated Almond and Pistachio Orchards, San Joaquin Valley, CA July, 2009, Airborne MASTER

Low
High
NDMI Low
High
NDWI
35
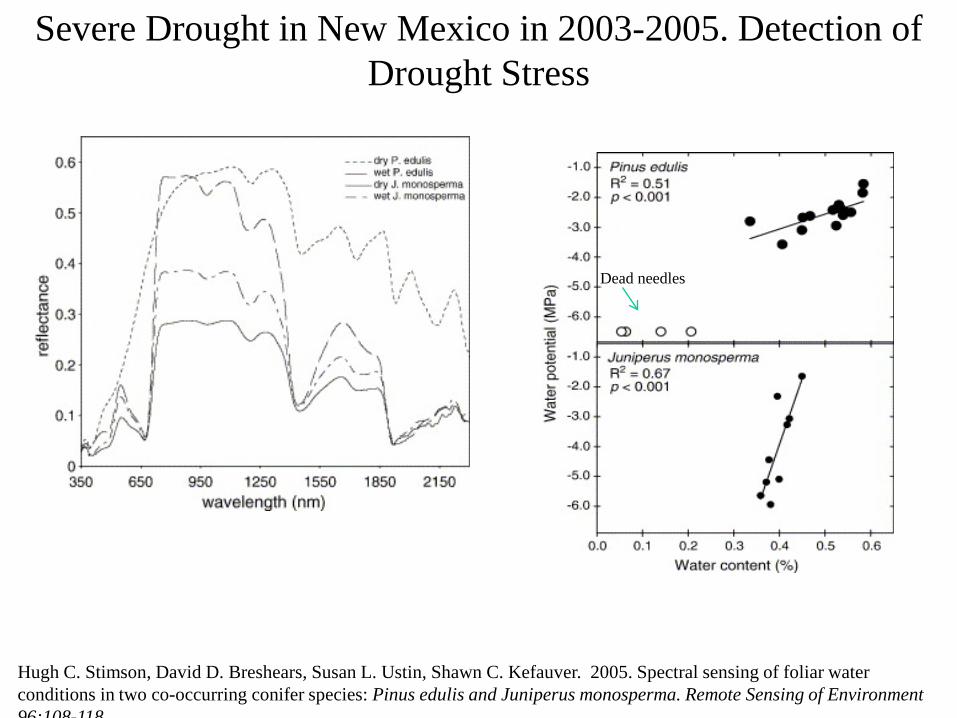
Hugh C. Stimson, David D. Breshears, Susan L. Ustin, Shawn C. Kefauver. 2005. Spectral sensing of foliar water conditions in two co-occurring conifer species: Pinus edulis and Juniperus monosperma. Remote Sensing of Environment 96:108-118
Severe Drought in New Mexico in 2003-2005. Detection of Drought Stress
Dead needles
37
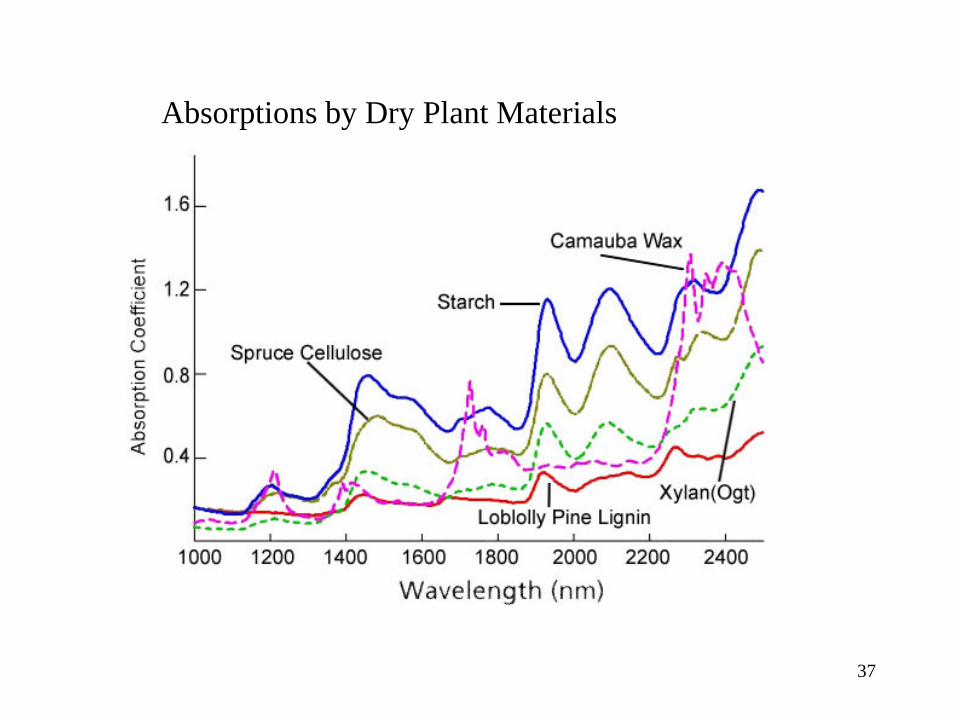
Absorptions by Dry Plant Materials

Craig S.T. Daughtry. 2001. Discriminating Crop Residues from Soil by Shortwave Infrared Reflectance. Agronomy Journal 93: 125-131
Dry and Wet Plant Canopy Material: (stems, leaves)

Absorption Spectra of Non-Pigment Plant Materials
39 CAI = 0.5 (R2000-R2200)/R2100

Bidirectional Reflectance Distribution Function (BRDF)
Forward scatter direction (specular direction)
Back scatter direction (hot spot direction)
sensor
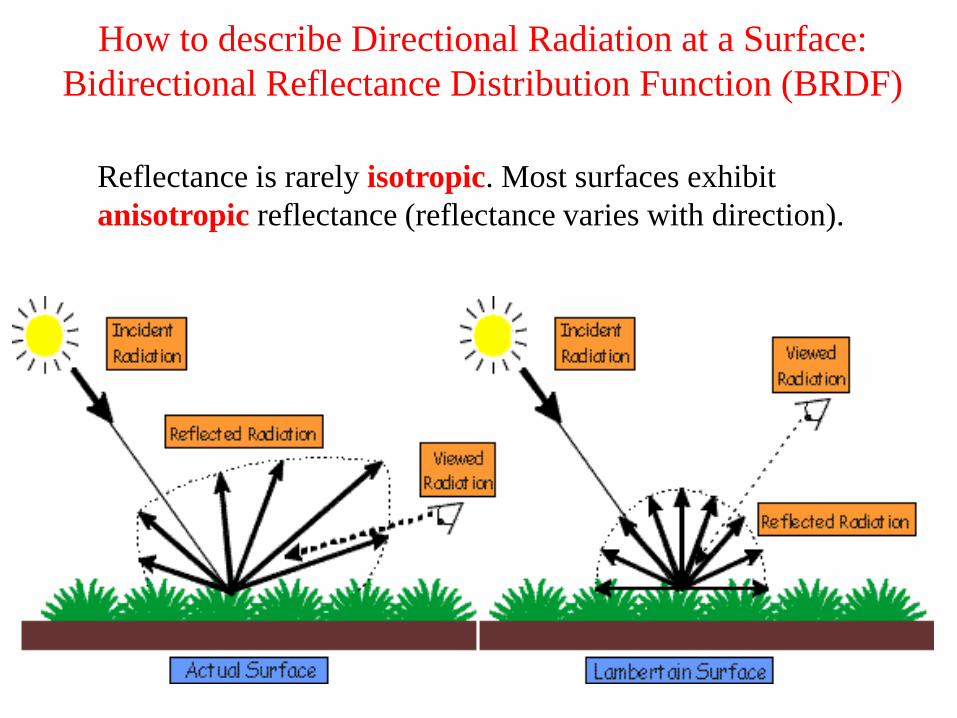
How to describe Directional Radiation at a Surface: Bidirectional Reflectance Distribution Function (BRDF)
Reflectance is rarely isotropic. Most surfaces exhibit anisotropic reflectance (reflectance varies with direction).

Canopy BRDF is not constant - Direction of illumination changes during day
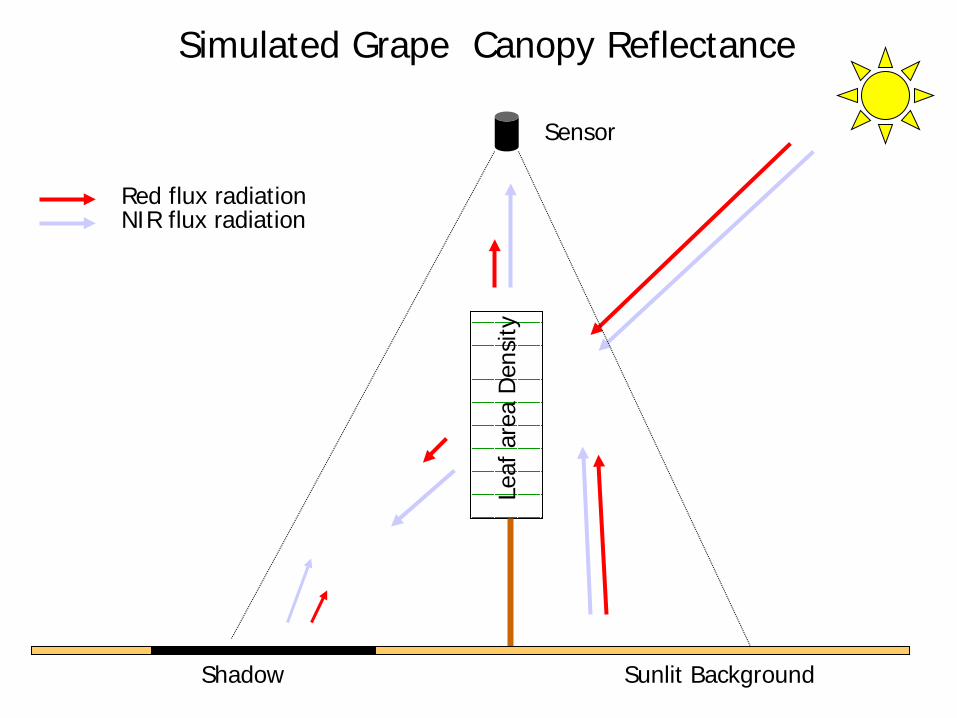
Sensor
Sunlit Background Shadow
Red flux radiation NIR flux radiation
Simulated Grape Canopy Reflectance
Leaf
are
a D
ensi
ty

BRDF
Backscatter direction Forward scatter direction
Hot Spot
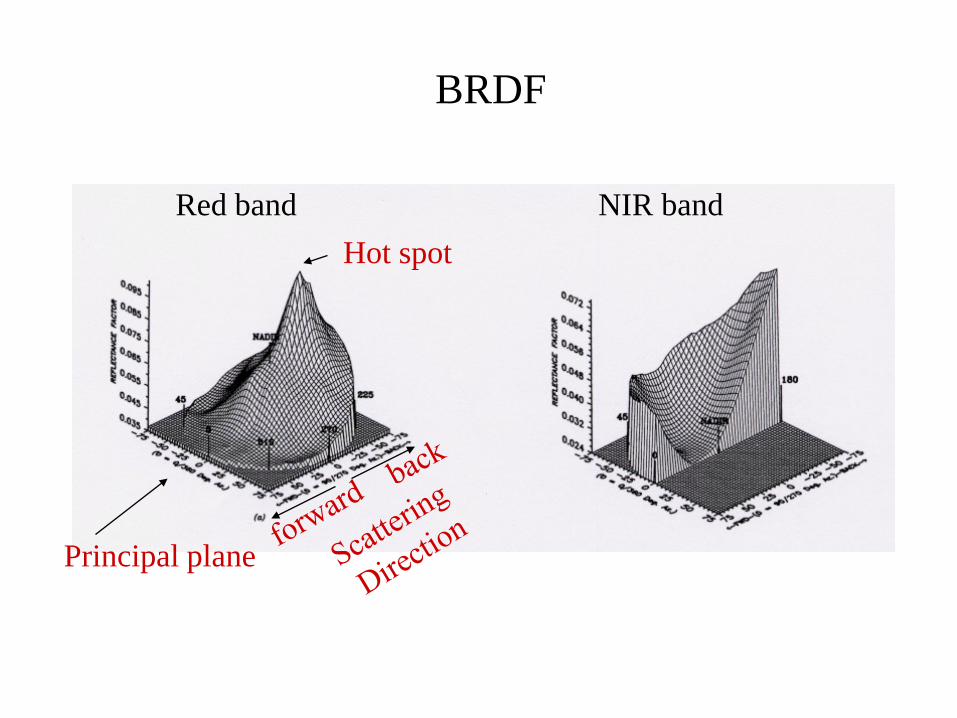
BRDF
Red band NIR band Hot spot
Principal plane

BRDF
Lr(θi,φi;θr,φr) Ei(θi,φi)
BRDF = Lr(θi,φi;θr,φr)/ Ei(θi,φi)

BRDF: a Goniometer

BRF-data can be acquired in the in the field under natural illumination conditions or in a controlled laboratory
environment.
Left: EGO, JRC, Ispra, Italy; Center: FIGOS, RSL, Zurich, Switzerland; Right: PARABOLA, Biospheric Sciences, NASA/GSFC, Greenbelt, MD, USA.

Global Composite Map of Nadir BRDF-Adjusted Reflectance (NBAR) April 7–22 2001
10 km resolution, Hammer-Aitoff projection, produced by MODIS BRDF/Albedo Team MODLAND/Strahler et al.
No data True Color, MODIS Bands 2, 4, 3
49

Lecture 2. What you should know: 1. Biochemical absorptions by leaves and canopies 2. Scattering processes of leaves and canopies 3. Physiological processes: photosynthesis. Leaf structure and
processes, chloroplast structure, pigments 4. Influence of pigments on leaf reflectance 5. Leaf absorptions by water and other biochemicals 6. Spectral indexes: bands sensitive to biochemical of interest 7. Bidirectional Reflectance Distribution Function
50