Embed Size (px)
Citation preview
Spectrum Analyzer
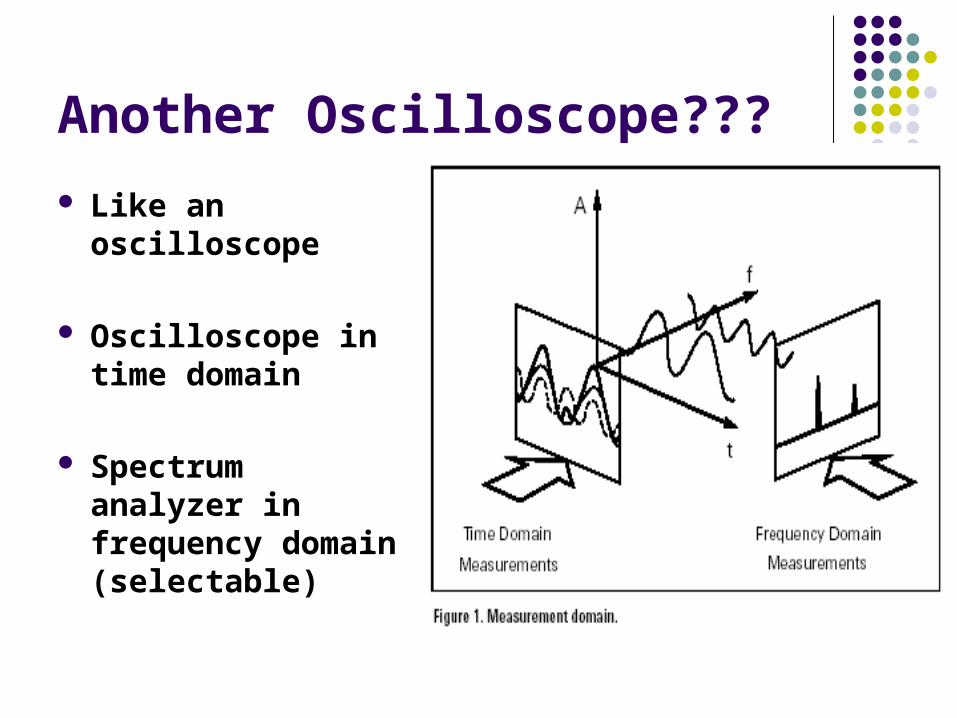
Another Oscilloscope???
Like an oscilloscope
Oscilloscope in time domain
Spectrum analyzer in frequency domain (selectable)
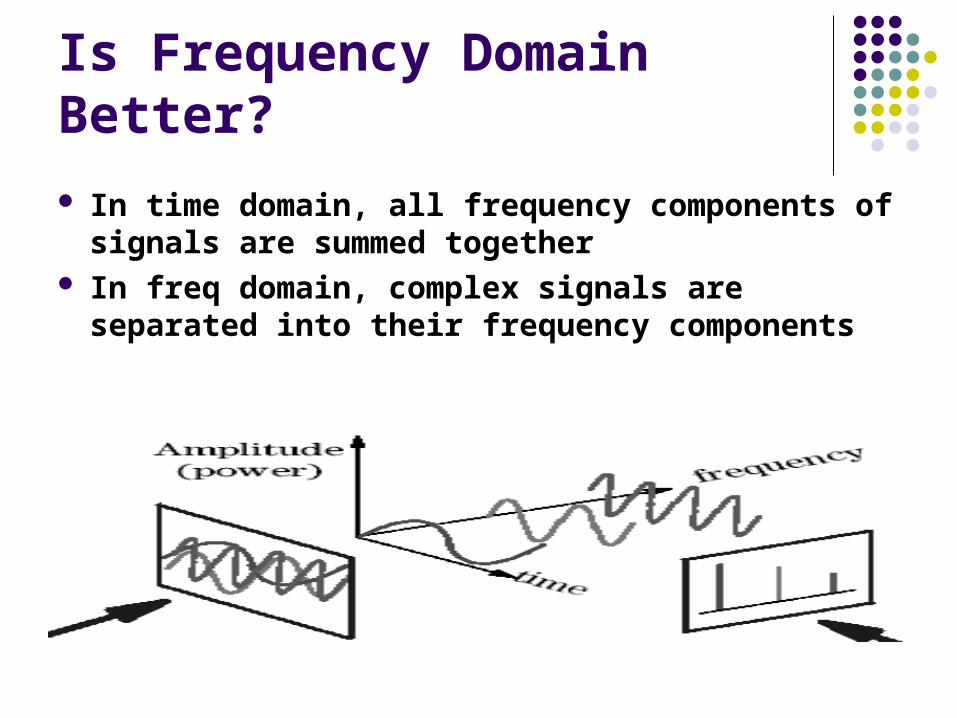
Is Frequency Domain Better?
In time domain, all frequency components of signals are summed together
In freq domain, complex signals are separated into their frequency components

What does SA do?
Processes the signal Displays the spectral content of the input
signal within a selected range of frequencies i.e., signal power(db) versus frequency Measures frequency, power, harmonic
content, modulation, spurs, and noise, etc…
Types of RF Spectrum Analyzer
Two common ways to measure RF signals Fourier Transform Swept-Tuned or Swept-Toned
Fourier Analyzer
Capture time domain signals information Digitizes time domain signal (digital
sampling) Perform Fourier transform Fast, but limits in frequency range, sensitivity

Swept Analyzer
“Sweep” across frequency range Display the frequency of interest Large frequency range Widely used
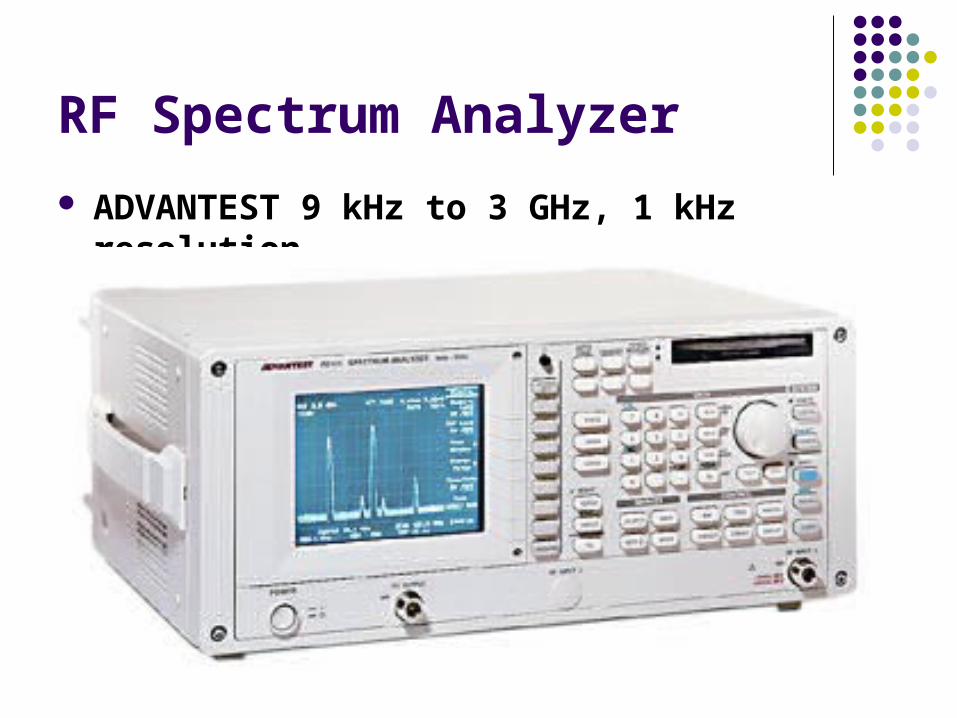
RF Spectrum Analyzer
ADVANTEST 9 kHz to 3 GHz, 1 kHz resolution
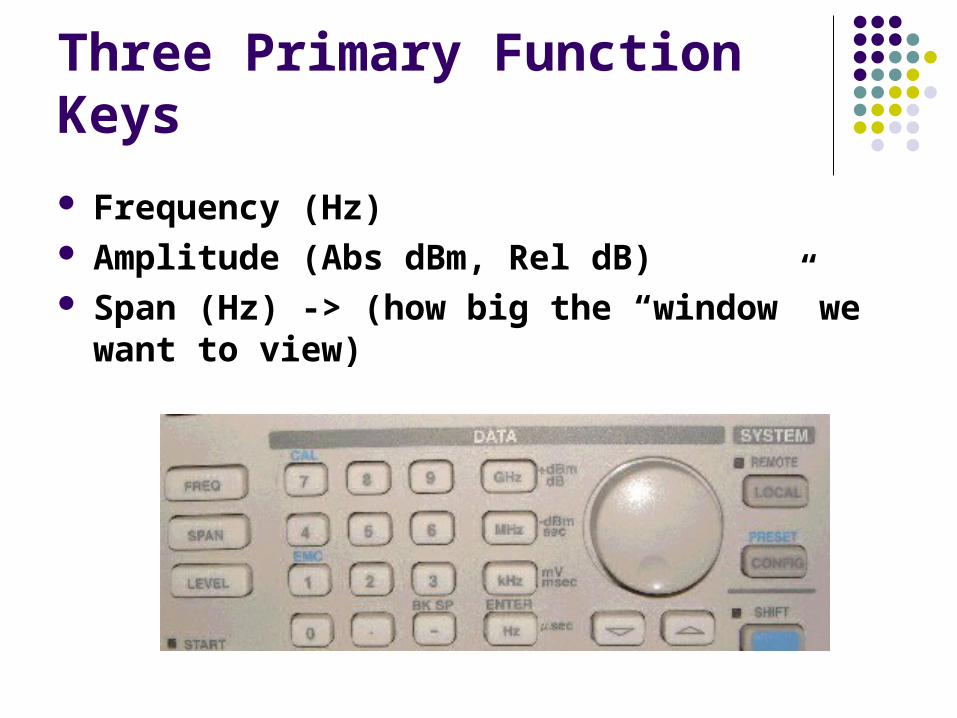
Three Primary Function Keys
Frequency (Hz) Amplitude (Abs dBm, Rel dB) Span (Hz) -> (how big the “window” we want to
view)
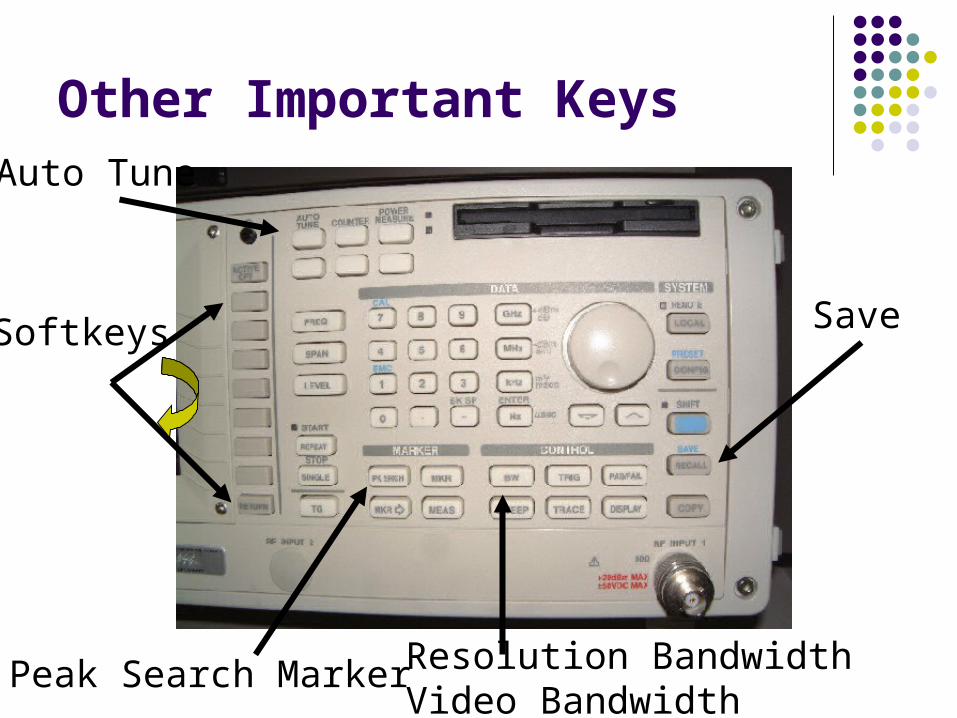
Other Important Keys
Resolution BandwidthVideo Bandwidth
Peak Search Marker
Save
Auto Tune
Softkeys

Typical Output Displayed

04/18/23
The TDS-220 Tektronix Oscilloscope and the
FFT module
Functions
An instrument for observing a waveform both in time and frequency domains
In time domain works as a digital oscilloscope
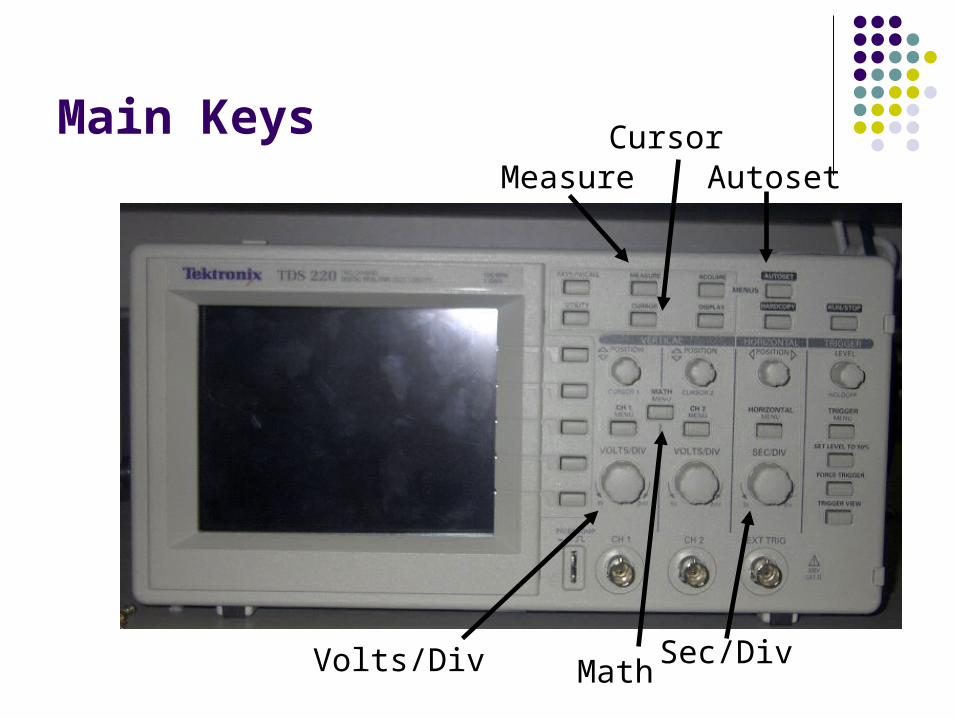
MeasureCursorMain Keys
Volts/Div Sec/DivMath
Autoset
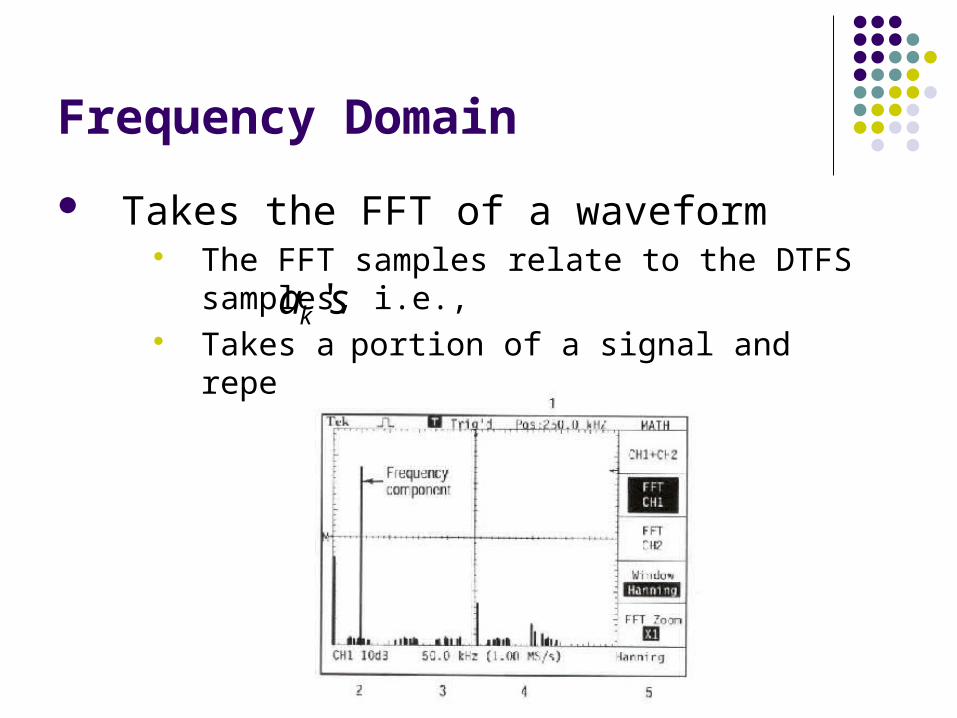
Frequency Domain
Takes the FFT of a waveform The FFT samples relate to the DTFS samples,
i.e., Takes a portion of a signal and repeats it
sak '
Taking FFT
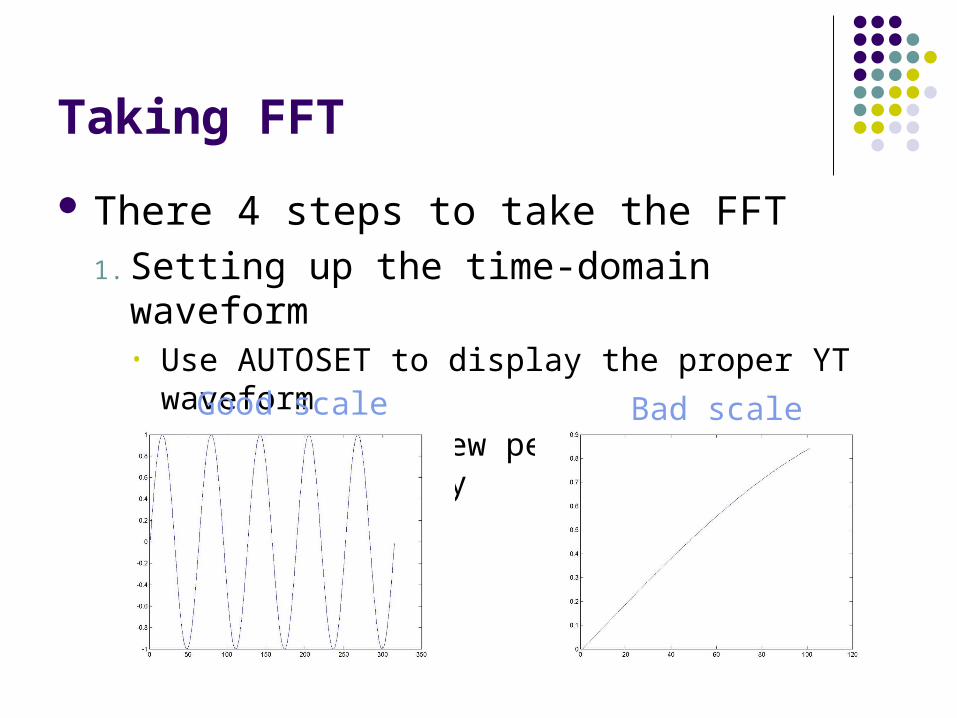
There 4 steps to take the FFT 1. Setting up the time-domain waveform
• Use AUTOSET to display the proper YT waveform• Need to see a few periods of the waveform clearly
Good scale Bad scale
Taking FFT
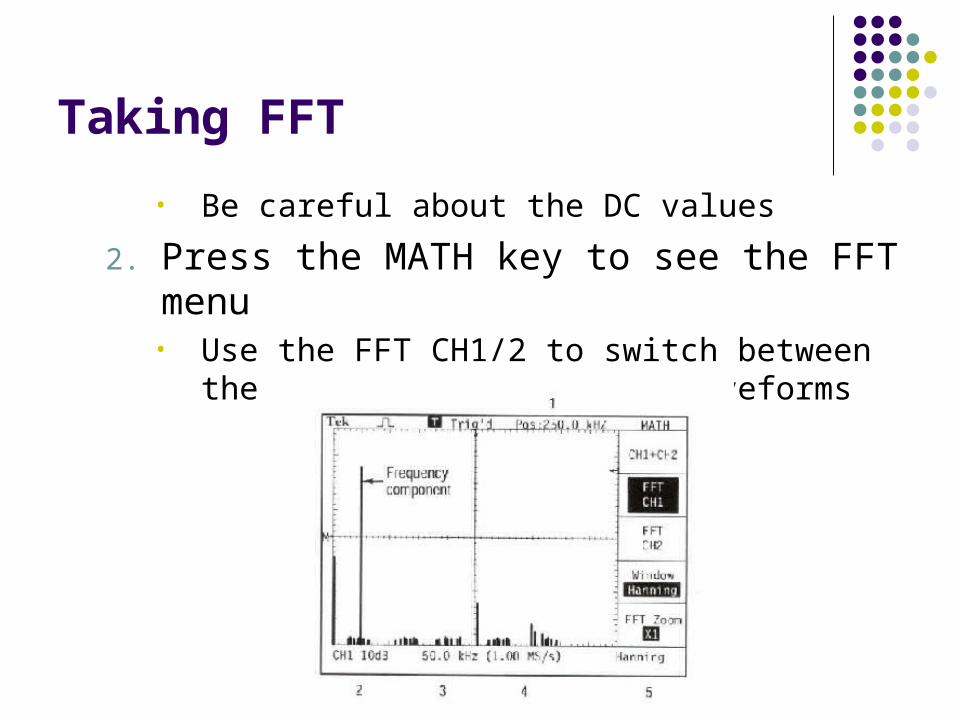
• Be careful about the DC values
2. Press the MATH key to see the FFT menu• Use the FFT CH1/2 to switch between the
channel ½ FFT and YT waveforms

Taking FFT
3. Choose the window type • Choose the HANNING window for measurements
Point by pointmultiplication X =
Taking FFT
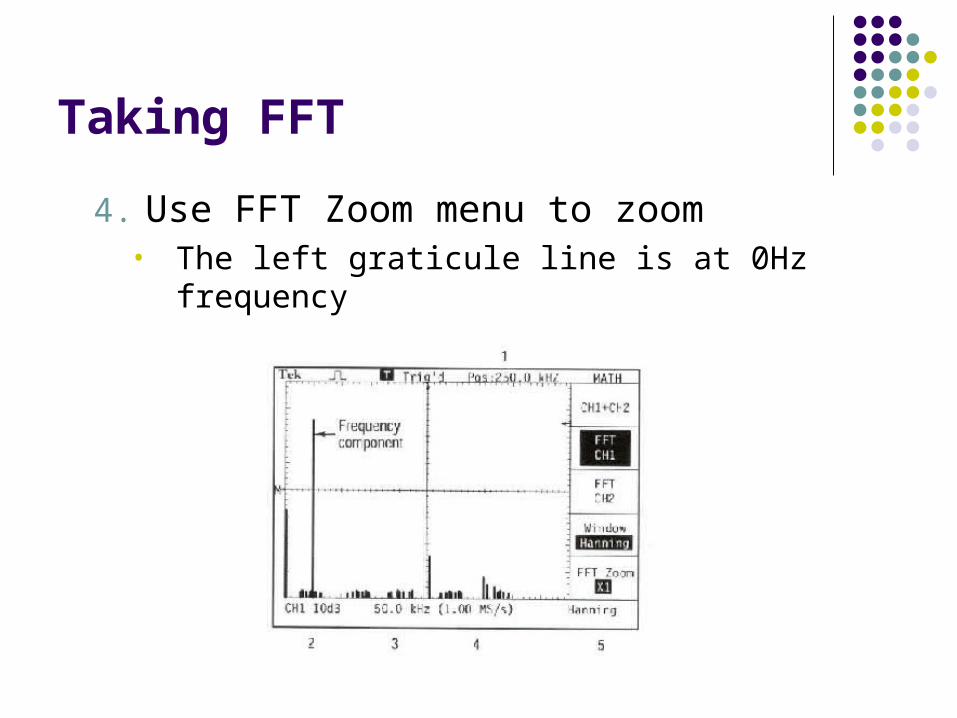
4. Use FFT Zoom menu to zoom • The left graticule line is at 0Hz frequency

Measurements Scales
Measurements on FFT waveforms• Frequency in Hz from 0Hz to half of the sampling
rate• Magnitude in dB where 0dB equals 1 V RMS
dB and dBm dB a relative value dBm an absolute value when the reference power is
1mW
References
Basic Spectrum Analyzer (HP) Knowing The Signal Classes Greatly
Simplifies Spectrum Analysis (TestMart) Signal Processing
http://www.ece.queensu.ca/hpages/courses/Elec421/why.html
TDS200 Series Digital Real-Time Oscilloscope, User Manual (Tektronix)
TDS200 Series Extension Modules, Instruction Manual (Tektronix)