Embed Size (px)
Citation preview
Speech enhancement using linear prediction residual
B. Yegnanarayana a,*, Carlos Avendano b, Hynek Hermansky b, P. SatyanarayanaMurthy c
a Department of Computer Science and Engineering, Indian Institute of Technology, Madras 600 036, Indiab Department of Electrical Engineering, Oregon Graduate Institute of Science and Technology, Portland, USA
c Department of Electrical Engineering, Indian Institute of Technology, Madras 600 036, India
Received 2 July 1997; received in revised form 12 May 1998
Abstract
In this paper we propose a method for enhancement of speech in the presence of additive noise. The objective is to
selectively enhance the high signal-to-noise ratio (SNR) regions in the noisy speech in the temporal and spectral do-
mains, without causing signi®cant distortion in the resulting enhanced speech. This is proposed to be done at three
di�erent levels. (a) At the gross level, by identifying the regions of speech and noise in the temporal domain. (b) At the
®ner level, by identifying the regions of high and low SNR portions in the noisy speech. (c) At the short-time spectrum
level, by enhancing the spectral peaks over spectral valleys. The basis for the proposed approach is to analyze linear
prediction (LP) residual signal in short (1±2 ms) segments to determine whether a segment belongs to a noise region or
speech region. In the speech regions the inverse spectral ¯atness factor is signi®cantly higher than in the noisy regions.
The LP residual signal enables us to deal with short segments of data due to uncorrelatedness of the samples. Processing
of noisy speech for enhancement involves mostly weighting the LP residual signal samples. The weighted residual signal
samples are used to excite the time-varying all-pole ®lter to produce enhanced speech. As the additive noise level in the
speech signal is increased, the quality of the resulting enhanced speech decreases progressively due to loss of speech
information in the low SNR, high noise regions. Thus the degradation in performance of enhancement is graceful as the
overall SNR of the noisy speech is decreased. Ó 1999 Elsevier Science B.V. All rights reserved.
Keywords: Speech enhancement; Linear prediction residual signal
1. Introduction
Speech signal collected under normal environ-mental conditions is usually degraded due to noiseand distortion. Performance of speech systemsdepends critically on the e�ect of these environ-mental conditions on the parameters and featuresextracted from the speech signal (Deller et al.,
1993; Rose et al., 1994; Junqua and Haton, 1996).The quality of the recorded speech is also a�ectedsigni®cantly due to noise and distortion. En-hancement of speech is normally required to re-duce annoyance due to noise. The focus of study inthis paper is speech enhancement in additive noise.
Several approaches were studied for speechenhancement in additive noise (Boll, 1979; Gibsonet al., 1991; Cheng and O'Shaughnessy, 1991;Ephraim, 1992; Ephraim and Van Trees, 1995; LeBouquin, 1996; Lee and Shirai, 1996). Many ofthese studies have focussed on enhancement based
www.elsevier.nl/locate/specom
Speech Communication 28 (1999) 25±42
* Corresponding author. Tel.: +91-44-2354591; fax: +91-44-
2350509; e-mail: [email protected]
0167-6393/99/$ ± see front matter Ó 1999 Elsevier Science B.V. All rights reserved.
PII: S 0 1 6 7 - 6 3 9 3 ( 9 8 ) 0 0 0 7 0 - 3
on attempts to suppress noise (Boll, 1979; Ephraimand Van Trees, 1995; Le Bouquin, 1996). In orderto suppress noise the characteristics of noise areestimated from the regions containing predomi-nantly noise. Therefore for suppressing noise it isnecessary to identify the noise regions. Subtractionof noise from noisy speech is usually performed inthe spectral domain. Methods based on spectralsubtraction disturb the spectral balance in speech,resulting in unpleasant distortion in the enhancedspeech. Speech enhancement has also been ac-complished by modifying the temporal contours ofthe parameters or features, like spectral band en-ergies (Hermansky and Morgan, 1994; AvendanÄoet al., 1996). The technique uses data-dependent®lters that reduce the random ¯uctuations in theparameter contours caused by noise, and thusenhances the characteristics of speech. The pa-rameters of speech are usually related to short-time spectra. Therefore modi®cation of the tem-poral variations of the spectral features maysometimes introduce unnatural spectral changeswhich are perceived as distortion in the enhancedspeech.
Methods for speech enhancement have alsobeen developed based on extraction of parametersfrom noisy speech, and synthesizing speech fromthese parameters (Yegnanarayana and Ra-machandran, 1992). All-pole modeling of degrad-ed speech is one such method (Lim andOppenheim, 1978). In the all-pole modeling, ifwrong peaks are extracted, then these peaks mayget enhanced. Temporal sequence of these peaksalso produces discontinuities in the contours of thespectral peaks when compared with the smoothcontours encountered in natural speech.
Methods of speech enhancement seem to de-pend generally on modi®cation of the short-timespectral envelope. If there are errors in extractingthe features of a spectral envelope, or if errors areintroduced in the spectral envelope due to modi-®cation of the temporal contours of the spectralfeatures, the resulting speech may produce un-natural audible distortion.
Methods for speech enhancement have alsobeen suggested based on the periodicity due topitch (Erell and Weintraub, 1994). Noise samplesin successive glottal cycles are uncorrelated. On the
other hand, the characteristics of the vocal tractsystem are highly correlated due to slow move-ment of the articulators. These methods for en-hancement of speech depend critically on theestimation of pitch from the noisy speech signal.Also, synthetic excitation signal is used for pro-ducing speech in these cases. Hence the quality ofspeech will be poor, even though the e�ects ofnoise are reduced.
Several suprasegmental parameters such aspitch contours and syllabic durations are robustfeatures. But these features are not useful for en-hancement, since for generating the enhancedspeech signal one needs both the spectral envelopeand excitation for each (short-time) analysisframe.
In many of the above mentioned methods, noattempt has been made to explore the character-istics of the source signal for enhancement. Theprimary reason for this is that, in the source signalsuch as the linear prediction (LP) residual signalthe samples are uncorrelated and hence the resid-ual samples are more like noise than like a signal.Thus the residual signal is not expected to haveany features useful for speech enhancement. Weshow in this paper that features of the residualerror signal can be exploited for enhancement ofspeech in the presence of additive noise.
In the next section we discuss the scope of studyin this paper. We also discuss the characteristics ofnoisy speech which form the basis for the proposedapproach for speech enhancement. In Section 3,we develop a method for speech enhancementbased on the characteristics of the LP residualsignal. We propose enhancement at three levels,each level providing improvement of some featureof speech in the noisy signal. In Section 4, wediscuss application of the proposed method fordi�erent types of additive noise. We also discussthe performance and limitations of the proposedapproach.
2. Basis for the proposed method of speech enhance-ment
Human beings perceive speech by capturingsome features from the high signal-to-noise ratio
26 B. Yegnanarayana et al. / Speech Communication 28 (1999) 25±42
(SNR) regions in the spectral and temporal do-mains, and then extrapolating the features in thelow SNR regions (Cooper, 1980). Thereforespeech enhancement should primarily aim athighlighting the high SNR regions relative to thelow SNR regions. Lowering the signal levels in thelow SNR regions relative to the signal levels in thehigh SNR regions may help in reducing the an-noyance due to noise without losing the informa-tion. The relative emphasis of the features in thehigh SNR regions over the features in the lowSNR regions should be accomplished withoutcausing distortion in speech. Otherwise the en-hancement may cause annoyance of a type di�er-ent from that due to additive noise. The objectivein this paper is to study the enhancement produceddue to modi®cation of the characteristics of thesource and system components of speech produc-tion in the signal.
2.1. E�ects of noise on the speech signal
Before we proceed to discuss our approach, letus brie¯y review some characteristics of noisyspeech. Speech signal has a large (30±60 dB) dy-namic range in the temporal and spectral domains.For example, in the temporal domain some soundshave low signal energy, especially during the re-lease of stop sounds and in the steady nasalsounds. Speech signal energy level is also low priorto the release of a stop sound and also in somefricative sounds. Even within a glottal cycle of avoiced speech signal the energy of the signal isusually higher only in the vicinity of the majorexcitation of the vocal tract system, which is theinstant of glottal closure in each glottal cycle(Ananthapadmanabha and Yegnanarayana,1979). This is due to damped sinusoidal nature ofthe impulse response of the vocal tract system.Even in the frequency domain the spectral levels oflarge amplitude formants are typically muchhigher (20±30 dB) than the low amplitude form-ants. The spectral envelope also decreases by 12±18 dB per octave due to glottal roll-o� (Fant,1993). For a given additive noise, the SNR variesas a function of frequency in the spectral domain.Thus the SNR is di�erent in di�erent segments ofspeech in both time and frequency domains.
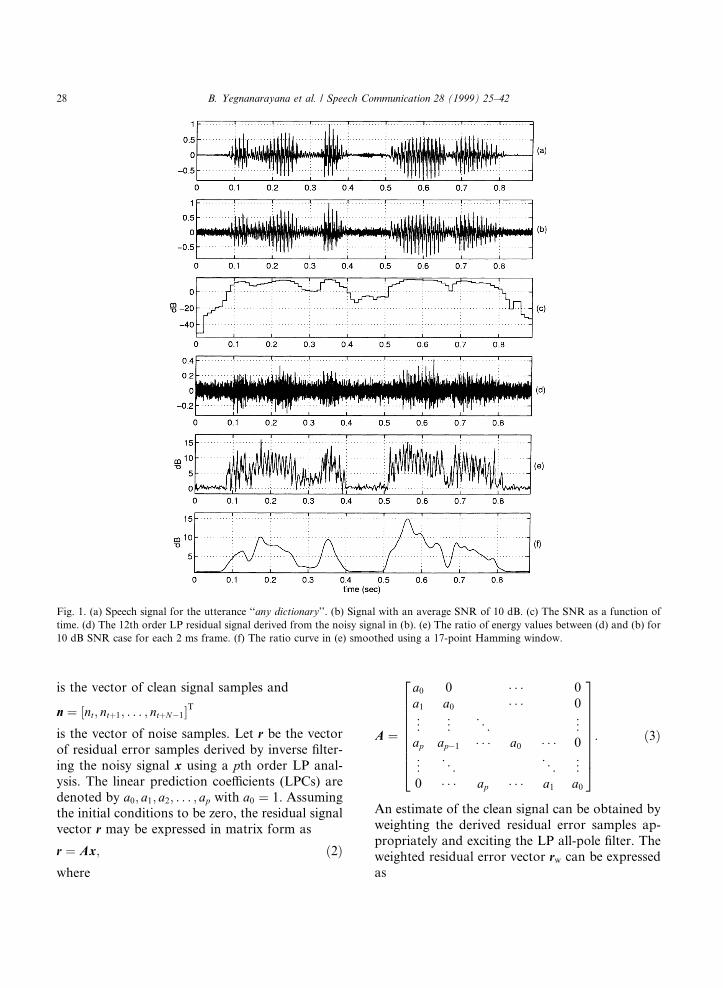
Fig. 1(c) shows the SNR of a speech utterance as afunction of time, where the overall SNR is 10 dB.The noisy speech signal (Fig. 1(b)) is generated byadding white Gaussian noise to the clean speechsignal shown in Fig. 1(a). The SNR is computedfor each frame of duration 20 ms with an overlapof 10 ms.
Typically, the correlation between noise sam-ples is low, and speech samples are correlated. Theenvelope of the speech spectrum will be less ¯atdue to formant structure and glottal roll-o� com-pared to the noise spectrum. Additive noise in-creases the spectral ¯atness of speech. The spectralenvelope becomes more ¯at in the low SNRportions of the spectrum. As the noise level in-creases, the weaker spectral features and the lowenergy signal features will be progressively sub-merged in the noise. The proposal in this paper isto identify the high SNR portions in the noisyspeech signal, and enhance those portions relativeto the low SNR portions, without causing signi®-cant distortion in the enhanced speech. Note that,from human perception point of view, somebackground noise is tolerable, but not the distor-tion caused by the artifacts of processing.
2.2. Approach for speech enhancement
In this section we present the proposed ap-proach for speech enhancement. We attempt toemphasize the residual signal in the regions aroundthe glottal closure in the voiced speech segmentsand reduce the energy levels of the residual signalin the silence regions. By exciting the time-varyingall-pole ®lter (derived from the noisy speech) withthe modi®ed residual signal, one can produce en-hanced speech without causing signi®cant distor-tion.
Let x � �xt; xt�1; . . . ; xt�Nÿ1�T be a frame of Nsamples of the signal corrupted by additive ran-dom noise. The characteristics of the signal areassumed to be stationary within the frame. We canwrite x as
x � s� n; �1�where
s � �st; st�1; . . . ; st�Nÿ1�T
B. Yegnanarayana et al. / Speech Communication 28 (1999) 25±42 27
is the vector of clean signal samples and
n � �nt; nt�1; . . . ; nt�Nÿ1�Tis the vector of noise samples. Let r be the vectorof residual error samples derived by inverse ®lter-ing the noisy signal x using a pth order LP anal-ysis. The linear prediction coe�cients (LPCs) aredenoted by a0; a1; a2; . . . ; ap with a0 � 1. Assumingthe initial conditions to be zero, the residual signalvector r may be expressed in matrix form as
r � Ax; �2�where
A �
a0 0 � � � 0a1 a0 � � � 0
..
. ... . .
. ...
ap apÿ1 � � � a0 � � � 0
..
. . .. . .
. ...
0 � � � ap � � � a1 a0
2666666664
3777777775: �3�
An estimate of the clean signal can be obtained byweighting the derived residual error samples ap-propriately and exciting the LP all-pole ®lter. Theweighted residual error vector rw can be expressedas
Fig. 1. (a) Speech signal for the utterance ``any dictionary''. (b) Signal with an average SNR of 10 dB. (c) The SNR as a function of
time. (d) The 12th order LP residual signal derived from the noisy signal in (b). (e) The ratio of energy values between (d) and (b) for
10 dB SNR case for each 2 ms frame. (f) The ratio curve in (e) smoothed using a 17-point Hamming window.
28 B. Yegnanarayana et al. / Speech Communication 28 (1999) 25±42
rw �Wr; �4�where W � diag �w�0�;w�1�; . . . ;w�N ÿ 1�� is thediagonal N � N matrix of optimal weights to beestimated. An estimate of the clean signal is givenby
s � Hrw; �5�where
H � Aÿ1 �6�is the matrix of coe�cients of truncated impulseresponse of the all-pole ®lter. The truncation ef-fects are assumed to be negligible. Using Eqs. (2)and (4),
s � HWAx � HWAs�HWAn: �7�The error in reconstruction is given by
e � sÿ s � �I ÿHWA�sÿHWAn:
Using Eq. (6) in the above equation we ®nd
e � H I� ÿW�AsÿHWAn: �8�The energy of the reconstruction error e can beminimized with respect to the weight matrix W .But this error criterion does not exploit themasking properties of the human ear (Mermel-stein, 1982; Jayant and Noll, 1984; Chen andGersho, 1995). Hence, a criterion which would bemore meaningful perceptually would be the energyof the ®ltered reconstruction error ep. The ®ltercan be the inverse ®lter A�z� � a0 � a1zÿ1 � � � � �apzÿp of the LP analysis. For an SNR greater than10 dB it is reasonable to assume that the inverse®lter A�z� exhibits valleys at approximately theformant frequencies, although its dynamic rangewould be low because of noise in the speech signal.Minimization of the energy of the ®ltered errorwith respect to W would allow more error in theformant regions and minimizes the error in thevalley regions, which is desirable from a perceptualviewpoint. From Eq. (8), the ®ltered error ep canbe written as
ep � Ae � AH�I ÿW�Asÿ AHWAn: �9�Using Eq. (6) in Eq. (9) we obtain
ep � �I ÿW�AsÿWAn: �10�Let rs � As be the signal obtained by ®ltering theclean signal s using the ®lter A�z� derived from the
noisy signal x, and let v � An be the ®ltered noisein the residual signal domain, then
ep � �I ÿW�rs ÿWv: �11�Assuming that the signal s and noise n are un-correlated, the cost function
/�W� � Efkepk2g �12�is minimized to obtain the optimum weights as
wopt�k� � Efr2s �k�g
Efr2s �k�g � Efv2�k�g ;
k � 0; 1; . . . ;N ÿ 1;
�13�
where rs�k� and v�k� are the kth components of rs
and v, respectively. If we de®ne the following ratioas an approximate measure of SNR in the residualsignal domain:
SNR�k� � Efr2s �k�g
Efv2�k�g ; �14�
then we have
wopt�k� � SNR�k�1� SNR�k� : �15�
The solution in Eq. (15) is clearly a time domainanalogue of the optimal Wiener ®lter frequencyresponse (Haykin, 1991). Note that in arriving atthe result in Eq. (15), no restriction is placed onthe noise samples in the vector n. The noise sam-ples are only assumed to be uncorrelated with thesignal samples in the vector s. Since it is di�cult toestimate SNR�k� in practice, wopt�k� can only beapproximated as discussed in Section 3. Note thatthe optimal weight wopt�k� in Eq. (15) approaches1 in the limit when SNR�k� � 1 and approachesSNR�k� itself, when SNR�k� � 1. But in ourmethod (presented in Section 3) the weight func-tion used is not exactly same as the optimal weight.Firstly, it is di�cult to estimate the SNR�k� inpractice. Secondly, allowing the weight to assumevery low values when the SNR�k� is poor producesdistortion in the processed speech. Hence, it isnecessary to restrict the minimum value of theweight. Assuming that the noise variance in theresidual signal domain is approximately constant,SNR�k� is proportional to the short-time energy ofthe residual signal. Hence, the short-time energy
B. Yegnanarayana et al. / Speech Communication 28 (1999) 25±42 29
values of the residual signal are used to derive theweight function at the ®ner (1±2 ms) level.
2.3. Nature of LP residual signal
An experiment was conducted to demonstratethe e�ect of processing the LP residual signal ofspeech and reconstructing the speech using only apart of the residual signal after the instant ofglottal closure. From the clean speech the voiced/unvoiced/silence segments and the instants of sig-ni®cant excitation were identi®ed (Smits andYegnanarayana, 1995; Yegnanarayana and Teu-nen, 1994). The LP residual signal of noisy speechwas modi®ed retaining only the 2 ms portions ofthe residual signal around the instants of excita-tion. The modi®ed residual signal was used to ex-cite the time-varying all-pole ®lter to regeneratethe speech signal. The resulting speech was sig-ni®cantly enhanced without causing serious dis-tortion. This is because the high SNR segments ofnoisy speech were retained in the reconstructedspeech. Note that the all-pole ®lter derived fromthe noisy speech may not represent the spectralfeatures of the clean speech accurately. The coef-®cients of the ®lter were used mainly to derive thenoisy residual signal by inverse ®ltering. Retainingthe waveform bells around the glottal closureproduces good quality speech as was demonstratedin PSOLA based Text-to-Speech system (TTS)(Hamon et al., 1989).
The LP residual signal (Fig. 1(d)) may be de-rived for the noisy speech using a frame of 20 msduration and a frame rate of about 100 frames persecond. Even in the LP residual signal of noisyspeech, the SNR is a function of time or frequency.Inverse ®ltering reduces the correlation betweensamples existing in the noisy speech signal. Sincethe residual signal samples are less correlated, theSNR as a function of time can be studied usingmuch smaller windows (1±2 ms) than the windows(10±30 ms) normally used in the short-time spec-tral analysis. The truncation e�ects of the analysiswindow are signi®cantly reduced in the residualsignal (Yegnanarayana et al., 1998a). For eachsmall window of the residual signal, the energyratio of the noisy speech signal and the corre-sponding portion of the residual signal gives an
indication of the amount of reduction in the cor-relation of the signal samples. This also gives anindication of how much the signal spectrum is¯attened in the residual signal. If the signal spec-trum is already ¯at, then the ratio of the energiesof the noisy signal and the residual signal in theshort (1±2 ms) window will be nearly unity. Oth-erwise, the ratio will be quite large. Note that fornoise-like segments this ratio of the energies will benearly unity. Thus the ratio of the energies gives anindication of the signal and noise regions of thesignal. The ratio of the energy values for a 10 dBSNR situation computed for each 2 ms frame isshown in Fig. 1(e). Note that even weak signalregions are discernible in the ratio plots. The ratiocan be interpreted as the inverse of spectral ¯atnessof the noisy signal, the minimum inverse ¯atnessbeing one, corresponding to the energy ratio of 0dB.
Since the correlation between the residual signalsamples is low, these samples can be manipulatedto some extent without producing signi®cant dis-tortion in the reconstructed speech (Yegnanar-ayana and Satyanarayana Murthy, 1996). It is thismanipulative capability of the residual signal wewould like to exploit for enhancement of speech.
3. Manipulation of LP residual signal
The basic principle of our approach for speechenhancement is to identify the low SNR regions inthe LP residual signal, and derive a weight func-tion for the residual signal which will reduce theenergy in the low SNR regions relative to the highSNR regions of the noisy signal. The residualsignal samples are multiplied with the weightfunction. The modi®ed residual signal is used toexcite the time-varying all-pole ®lter to generatethe enhanced speech. Speech enhancement is car-ried out at three levels: (a) at gross level, based onthe overall smoothed inverse spectral ¯atnesscharacteristics; (b) at ®ner level (1±2 ms), based onthe relative energies of the residual signal betweenadjacent frames; and (c) at spectral level, to en-hance the features in the spectrum that could notbe a�ected by the ®ne level operations.
30 B. Yegnanarayana et al. / Speech Communication 28 (1999) 25±42
3.1. Gross temporal level
At the gross level the regions corresponding tolow and high SNR regions are identi®ed from thecharacteristics of the LP residual signal. A weightfunction for the residual signal samples is derivedbased on the smoothed inverse spectral ¯atnesscharacteristics of the noisy speech signal. Thespectral ¯atness characteristics are derived bycomparing the energy in the residual signal withthe energy in the noisy speech signal in each shortinterval of about 2 ms.
Inverse ®ltering the noisy speech signal usingthe time-varying LP coe�cients will give the re-sidual signal. The ratio of the noisy speech signalenergy to the residual signal energy in dB for eachnonoverlapping frame of 2 ms gives an indicationof the inverse spectral ¯atness as a function oftime. The inverse spectral ¯atness plot is smoothedusing a 17-point Hamming window. The smoothedinverse ¯atness plot shown in Fig. 1(f) clearly in-dicates the low and high SNR regions. The lowSNR (noisy) regions have an inverse ¯atness closeto unity (0 dB), and the high SNR (signal) regionshave larger inverse ¯atness values. Note that for
noise-like segments the inverse ¯atness will beclose to unity. Unvoiced segments can be distin-guished from noisy segments by the higher residualsignal energy value for the unvoiced region com-pared to the energy value in the (noisy) silenceregion (see Fig. 1(c)). A weight function is derivedfrom the smoothed inverse ¯atness characteristicsin such a way that the residual signal samples inthe regions corresponding to low values of theinverse ¯atness are reduced relative to the residualsignal samples in the regions corresponding tohigh values of the inverse ¯atness.
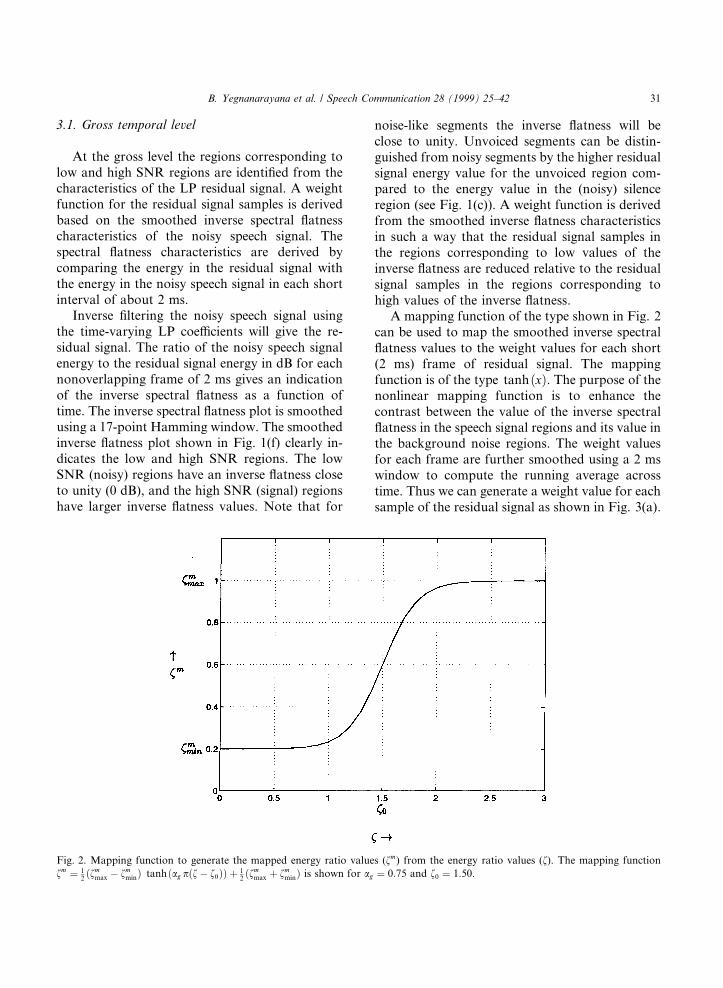
A mapping function of the type shown in Fig. 2can be used to map the smoothed inverse spectral¯atness values to the weight values for each short(2 ms) frame of residual signal. The mappingfunction is of the type tanh�x�. The purpose of thenonlinear mapping function is to enhance thecontrast between the value of the inverse spectral¯atness in the speech signal regions and its value inthe background noise regions. The weight valuesfor each frame are further smoothed using a 2 mswindow to compute the running average acrosstime. Thus we can generate a weight value for eachsample of the residual signal as shown in Fig. 3(a).
Fig. 2. Mapping function to generate the mapped energy ratio values (fm) from the energy ratio values (f). The mapping function
fm � 12�fm
max ÿ fmmin� tanh�ag p�fÿ f0�� � 1
2�fm
max � fmmin� is shown for ag � 0:75 and f0 � 1:50.
B. Yegnanarayana et al. / Speech Communication 28 (1999) 25±42 31
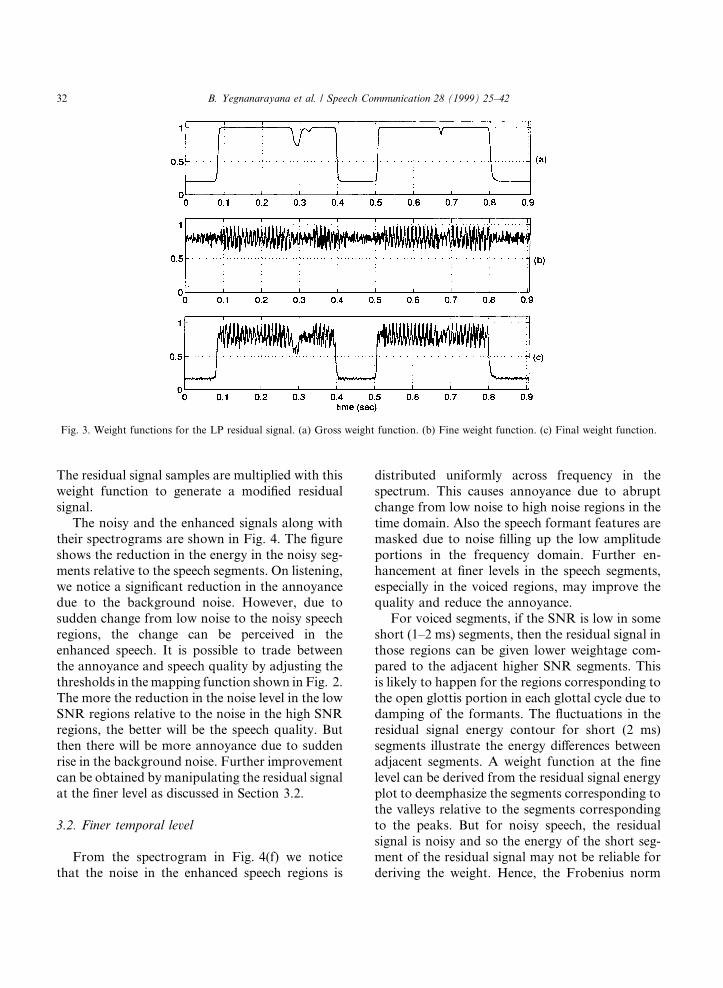
The residual signal samples are multiplied with thisweight function to generate a modi®ed residualsignal.
The noisy and the enhanced signals along withtheir spectrograms are shown in Fig. 4. The ®gureshows the reduction in the energy in the noisy seg-ments relative to the speech segments. On listening,we notice a signi®cant reduction in the annoyancedue to the background noise. However, due tosudden change from low noise to the noisy speechregions, the change can be perceived in theenhanced speech. It is possible to trade betweenthe annoyance and speech quality by adjusting thethresholds in the mapping function shown in Fig. 2.The more the reduction in the noise level in the lowSNR regions relative to the noise in the high SNRregions, the better will be the speech quality. Butthen there will be more annoyance due to suddenrise in the background noise. Further improvementcan be obtained by manipulating the residual signalat the ®ner level as discussed in Section 3.2.
3.2. Finer temporal level
From the spectrogram in Fig. 4(f) we noticethat the noise in the enhanced speech regions is
distributed uniformly across frequency in thespectrum. This causes annoyance due to abruptchange from low noise to high noise regions in thetime domain. Also the speech formant features aremasked due to noise ®lling up the low amplitudeportions in the frequency domain. Further en-hancement at ®ner levels in the speech segments,especially in the voiced regions, may improve thequality and reduce the annoyance.
For voiced segments, if the SNR is low in someshort (1±2 ms) segments, then the residual signal inthose regions can be given lower weightage com-pared to the adjacent higher SNR segments. Thisis likely to happen for the regions corresponding tothe open glottis portion in each glottal cycle due todamping of the formants. The ¯uctuations in theresidual signal energy contour for short (2 ms)segments illustrate the energy di�erences betweenadjacent segments. A weight function at the ®nelevel can be derived from the residual signal energyplot to deemphasize the segments corresponding tothe valleys relative to the segments correspondingto the peaks. But for noisy speech, the residualsignal is noisy and so the energy of the short seg-ment of the residual signal may not be reliable forderiving the weight. Hence, the Frobenius norm
Fig. 3. Weight functions for the LP residual signal. (a) Gross weight function. (b) Fine weight function. (c) Final weight function.
32 B. Yegnanarayana et al. / Speech Communication 28 (1999) 25±42
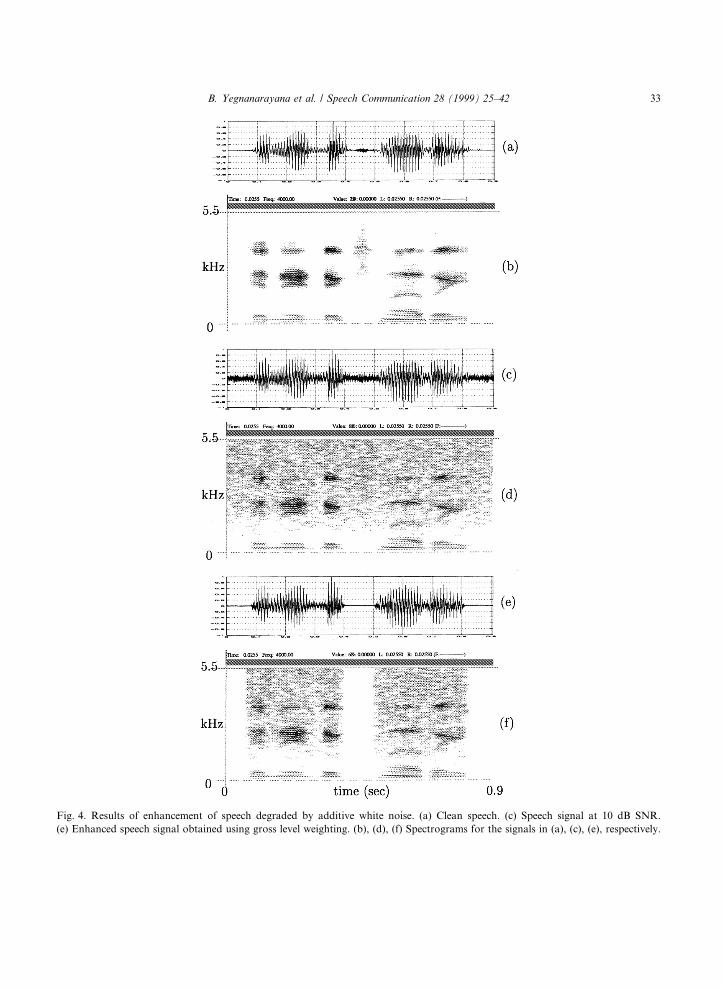
Fig. 4. Results of enhancement of speech degraded by additive white noise. (a) Clean speech. (c) Speech signal at 10 dB SNR.
(e) Enhanced speech signal obtained using gross level weighting. (b), (d), (f) Spectrograms for the signals in (a), (c), (e), respectively.
B. Yegnanarayana et al. / Speech Communication 28 (1999) 25±42 33
(Leon, 1990) of the Toeplitz prediction matrix (seeEq. (16)) constructed using the noisy speech sam-ples in a frame of 2 ms duration is used to repre-sent the short-time energy of the correspondingframe of LP residual signal (Satyanarayana Mur-thy and Yegnanarayana, 1998). This approach hasthe advantage of exploiting the envelope infor-mation in the noisy speech waveform. The Toep-litz prediction matrix X is given by
X �
xp�1 xp � � � x1
xp�2 xp�1 � � � x2
. .. ..
.
..
. ...
xp�1
..
.
xM xMÿ1 � � � xMÿp
26666666664
37777777775; �16�
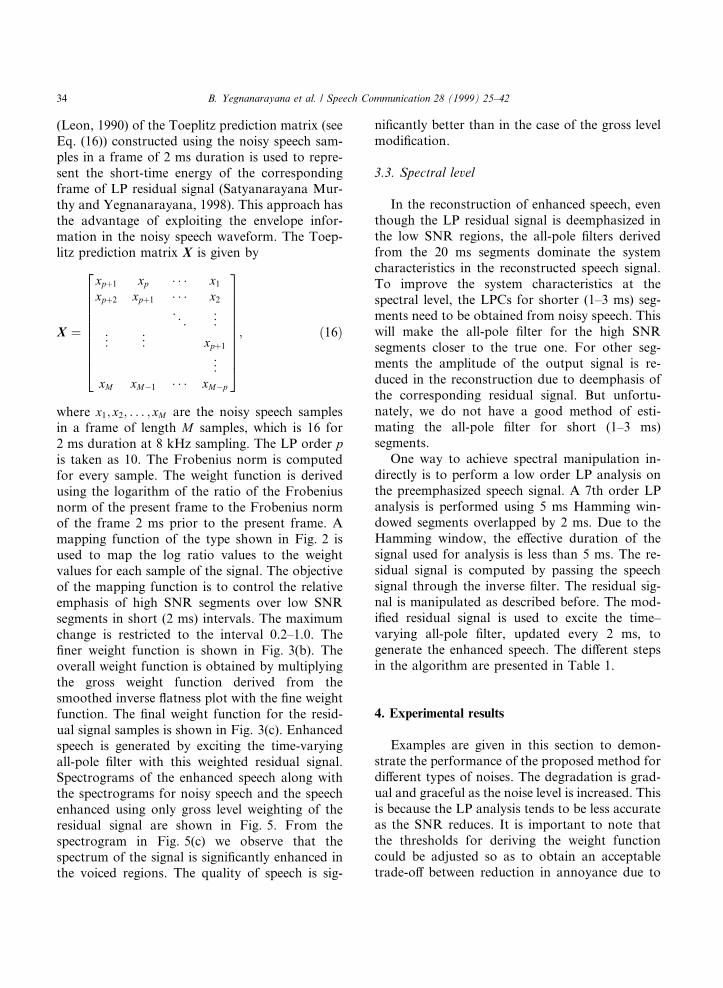
where x1; x2; . . . ; xM are the noisy speech samplesin a frame of length M samples, which is 16 for2 ms duration at 8 kHz sampling. The LP order pis taken as 10. The Frobenius norm is computedfor every sample. The weight function is derivedusing the logarithm of the ratio of the Frobeniusnorm of the present frame to the Frobenius normof the frame 2 ms prior to the present frame. Amapping function of the type shown in Fig. 2 isused to map the log ratio values to the weightvalues for each sample of the signal. The objectiveof the mapping function is to control the relativeemphasis of high SNR segments over low SNRsegments in short (2 ms) intervals. The maximumchange is restricted to the interval 0.2±1.0. The®ner weight function is shown in Fig. 3(b). Theoverall weight function is obtained by multiplyingthe gross weight function derived from thesmoothed inverse ¯atness plot with the ®ne weightfunction. The ®nal weight function for the resid-ual signal samples is shown in Fig. 3(c). Enhancedspeech is generated by exciting the time-varyingall-pole ®lter with this weighted residual signal.Spectrograms of the enhanced speech along withthe spectrograms for noisy speech and the speechenhanced using only gross level weighting of theresidual signal are shown in Fig. 5. From thespectrogram in Fig. 5(c) we observe that thespectrum of the signal is signi®cantly enhanced inthe voiced regions. The quality of speech is sig-
ni®cantly better than in the case of the gross levelmodi®cation.
3.3. Spectral level
In the reconstruction of enhanced speech, eventhough the LP residual signal is deemphasized inthe low SNR regions, the all-pole ®lters derivedfrom the 20 ms segments dominate the systemcharacteristics in the reconstructed speech signal.To improve the system characteristics at thespectral level, the LPCs for shorter (1±3 ms) seg-ments need to be obtained from noisy speech. Thiswill make the all-pole ®lter for the high SNRsegments closer to the true one. For other seg-ments the amplitude of the output signal is re-duced in the reconstruction due to deemphasis ofthe corresponding residual signal. But unfortu-nately, we do not have a good method of esti-mating the all-pole ®lter for short (1±3 ms)segments.
One way to achieve spectral manipulation in-directly is to perform a low order LP analysis onthe preemphasized speech signal. A 7th order LPanalysis is performed using 5 ms Hamming win-dowed segments overlapped by 2 ms. Due to theHamming window, the e�ective duration of thesignal used for analysis is less than 5 ms. The re-sidual signal is computed by passing the speechsignal through the inverse ®lter. The residual sig-nal is manipulated as described before. The mod-i®ed residual signal is used to excite the time±varying all-pole ®lter, updated every 2 ms, togenerate the enhanced speech. The di�erent stepsin the algorithm are presented in Table 1.
4. Experimental results
Examples are given in this section to demon-strate the performance of the proposed method fordi�erent types of noises. The degradation is grad-ual and graceful as the noise level is increased. Thisis because the LP analysis tends to be less accurateas the SNR reduces. It is important to note thatthe thresholds for deriving the weight functioncould be adjusted so as to obtain an acceptabletrade-o� between reduction in annoyance due to
34 B. Yegnanarayana et al. / Speech Communication 28 (1999) 25±42
noise and degradation in speech quality, based onperceptual impression of the enhanced speech.However, once the listener sets the thresholds tosuit his preference, they need not be adjustedagain.
4.1. Studies on di�erent types of noises
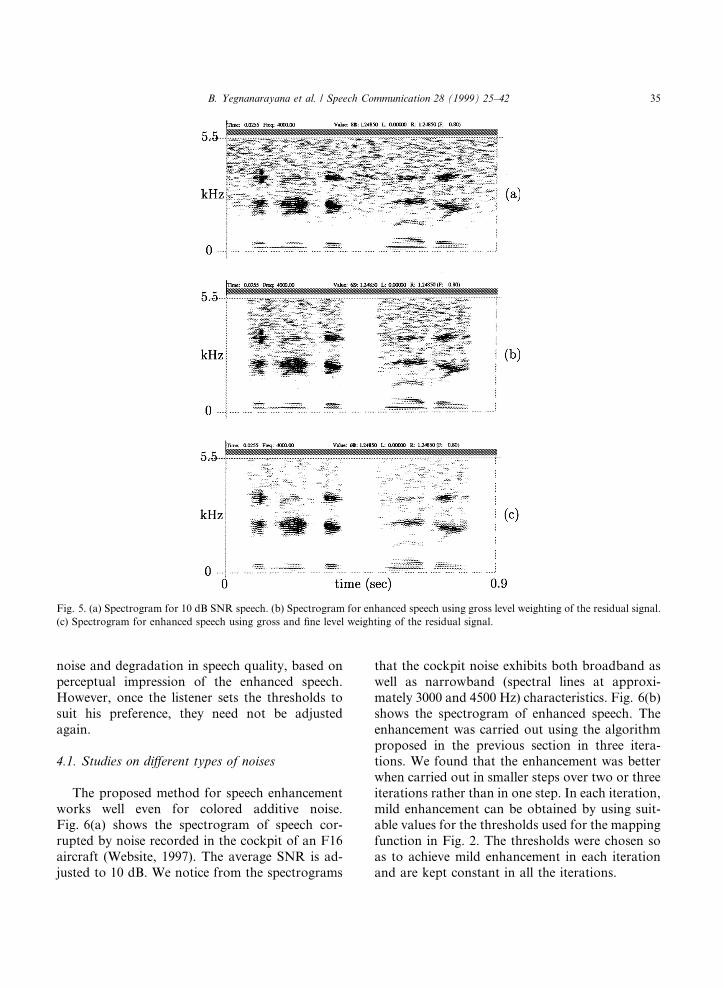
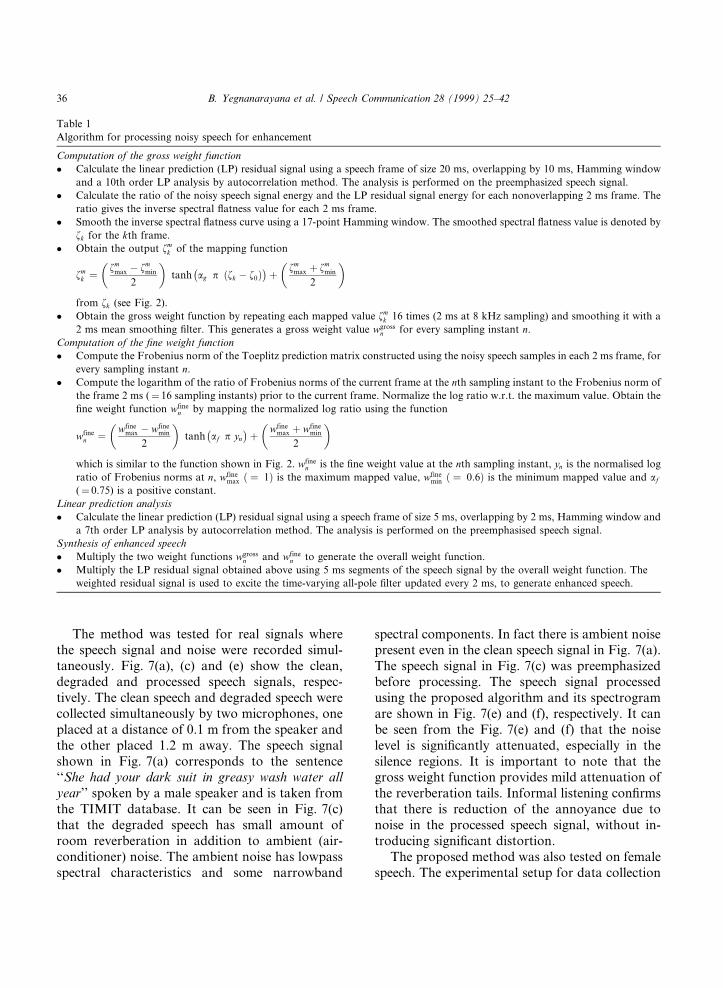
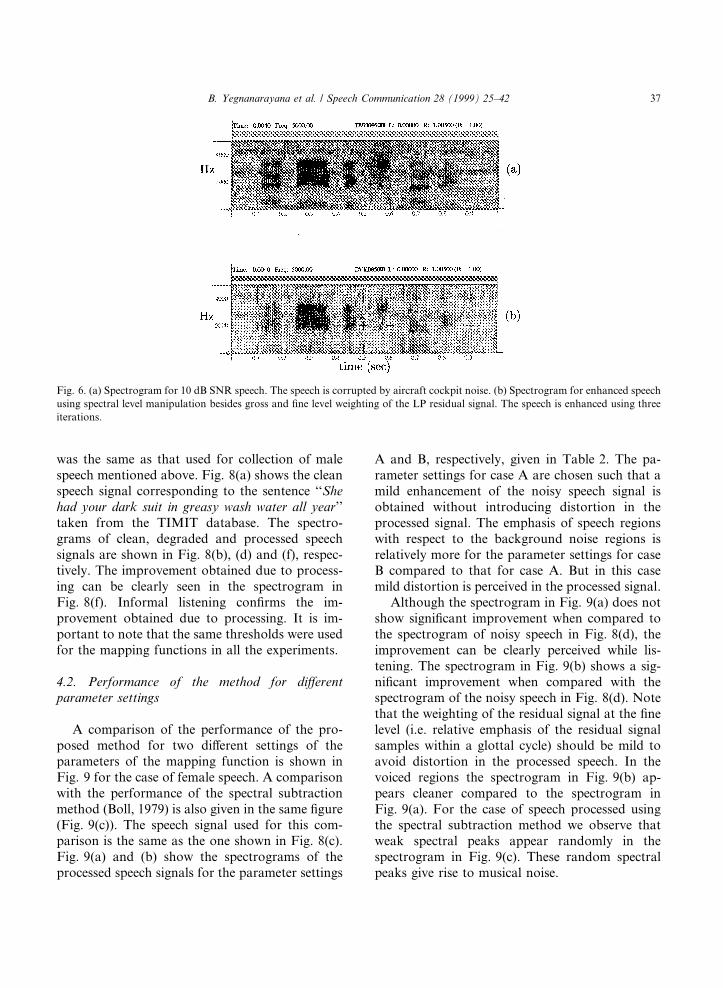
The proposed method for speech enhancementworks well even for colored additive noise.Fig. 6(a) shows the spectrogram of speech cor-rupted by noise recorded in the cockpit of an F16aircraft (Website, 1997). The average SNR is ad-justed to 10 dB. We notice from the spectrograms
that the cockpit noise exhibits both broadband aswell as narrowband (spectral lines at approxi-mately 3000 and 4500 Hz) characteristics. Fig. 6(b)shows the spectrogram of enhanced speech. Theenhancement was carried out using the algorithmproposed in the previous section in three itera-tions. We found that the enhancement was betterwhen carried out in smaller steps over two or threeiterations rather than in one step. In each iteration,mild enhancement can be obtained by using suit-able values for the thresholds used for the mappingfunction in Fig. 2. The thresholds were chosen soas to achieve mild enhancement in each iterationand are kept constant in all the iterations.
Fig. 5. (a) Spectrogram for 10 dB SNR speech. (b) Spectrogram for enhanced speech using gross level weighting of the residual signal.
(c) Spectrogram for enhanced speech using gross and ®ne level weighting of the residual signal.
B. Yegnanarayana et al. / Speech Communication 28 (1999) 25±42 35
The method was tested for real signals wherethe speech signal and noise were recorded simul-taneously. Fig. 7(a), (c) and (e) show the clean,degraded and processed speech signals, respec-tively. The clean speech and degraded speech werecollected simultaneously by two microphones, oneplaced at a distance of 0.1 m from the speaker andthe other placed 1.2 m away. The speech signalshown in Fig. 7(a) corresponds to the sentence``She had your dark suit in greasy wash water allyear'' spoken by a male speaker and is taken fromthe TIMIT database. It can be seen in Fig. 7(c)that the degraded speech has small amount ofroom reverberation in addition to ambient (air-conditioner) noise. The ambient noise has lowpassspectral characteristics and some narrowband
spectral components. In fact there is ambient noisepresent even in the clean speech signal in Fig. 7(a).The speech signal in Fig. 7(c) was preemphasizedbefore processing. The speech signal processedusing the proposed algorithm and its spectrogramare shown in Fig. 7(e) and (f), respectively. It canbe seen from the Fig. 7(e) and (f) that the noiselevel is signi®cantly attenuated, especially in thesilence regions. It is important to note that thegross weight function provides mild attenuation ofthe reverberation tails. Informal listening con®rmsthat there is reduction of the annoyance due tonoise in the processed speech signal, without in-troducing signi®cant distortion.
The proposed method was also tested on femalespeech. The experimental setup for data collection
Table 1
Algorithm for processing noisy speech for enhancement
Computation of the gross weight function
� Calculate the linear prediction (LP) residual signal using a speech frame of size 20 ms, overlapping by 10 ms, Hamming window
and a 10th order LP analysis by autocorrelation method. The analysis is performed on the preemphasized speech signal.
� Calculate the ratio of the noisy speech signal energy and the LP residual signal energy for each nonoverlapping 2 ms frame. The
ratio gives the inverse spectral ¯atness value for each 2 ms frame.
� Smooth the inverse spectral ¯atness curve using a 17-point Hamming window. The smoothed spectral ¯atness value is denoted by
fk for the kth frame.
� Obtain the output fmk of the mapping function
fmk �
fmmax ÿ fm
min
2
� �tanh ag p fk�
ÿ ÿ f0��� fm
max � fmmin
2
� �from fk (see Fig. 2).
� Obtain the gross weight function by repeating each mapped value fmk 16 times (2 ms at 8 kHz sampling) and smoothing it with a
2 ms mean smoothing ®lter. This generates a gross weight value wgrossn for every sampling instant n.
Computation of the ®ne weight function
� Compute the Frobenius norm of the Toeplitz prediction matrix constructed using the noisy speech samples in each 2 ms frame, for
every sampling instant n.
� Compute the logarithm of the ratio of Frobenius norms of the current frame at the nth sampling instant to the Frobenius norm of
the frame 2 ms (� 16 sampling instants) prior to the current frame. Normalize the log ratio w.r.t. the maximum value. Obtain the
®ne weight function wfinen by mapping the normalized log ratio using the function
wfinen � wfine
max ÿ wfinemin
2
� �tanh af p yn
ÿ �� wfinemax � wfine
min
2
� �which is similar to the function shown in Fig. 2. wfine
n is the ®ne weight value at the nth sampling instant, yn is the normalised log
ratio of Frobenius norms at n, wfinemax � � 1� is the maximum mapped value, wfine
min � � 0:6� is the minimum mapped value and af
(� 0.75) is a positive constant.
Linear prediction analysis
� Calculate the linear prediction (LP) residual signal using a speech frame of size 5 ms, overlapping by 2 ms, Hamming window and
a 7th order LP analysis by autocorrelation method. The analysis is performed on the preemphasised speech signal.
Synthesis of enhanced speech
� Multiply the two weight functions wgrossn and wfine
n to generate the overall weight function.
� Multiply the LP residual signal obtained above using 5 ms segments of the speech signal by the overall weight function. The
weighted residual signal is used to excite the time-varying all-pole ®lter updated every 2 ms, to generate enhanced speech.
36 B. Yegnanarayana et al. / Speech Communication 28 (1999) 25±42
was the same as that used for collection of malespeech mentioned above. Fig. 8(a) shows the cleanspeech signal corresponding to the sentence ``Shehad your dark suit in greasy wash water all year''taken from the TIMIT database. The spectro-grams of clean, degraded and processed speechsignals are shown in Fig. 8(b), (d) and (f), respec-tively. The improvement obtained due to process-ing can be clearly seen in the spectrogram inFig. 8(f). Informal listening con®rms the im-provement obtained due to processing. It is im-portant to note that the same thresholds were usedfor the mapping functions in all the experiments.
4.2. Performance of the method for di�erentparameter settings
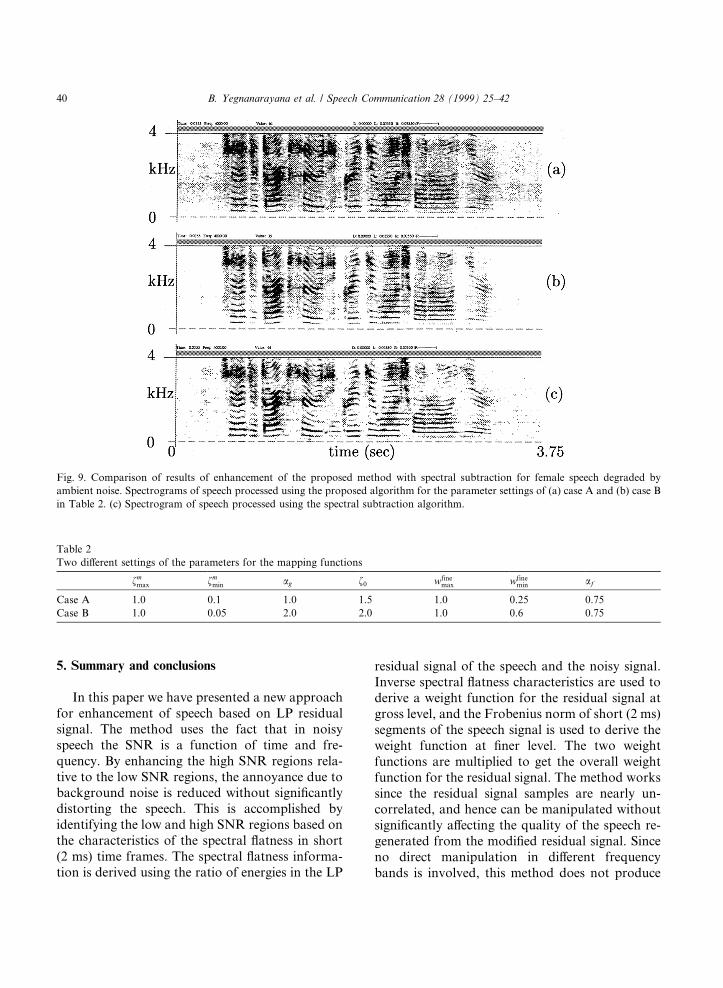
A comparison of the performance of the pro-posed method for two di�erent settings of theparameters of the mapping function is shown inFig. 9 for the case of female speech. A comparisonwith the performance of the spectral subtractionmethod (Boll, 1979) is also given in the same ®gure(Fig. 9(c)). The speech signal used for this com-parison is the same as the one shown in Fig. 8(c).Fig. 9(a) and (b) show the spectrograms of theprocessed speech signals for the parameter settings
A and B, respectively, given in Table 2. The pa-rameter settings for case A are chosen such that amild enhancement of the noisy speech signal isobtained without introducing distortion in theprocessed signal. The emphasis of speech regionswith respect to the background noise regions isrelatively more for the parameter settings for caseB compared to that for case A. But in this casemild distortion is perceived in the processed signal.
Although the spectrogram in Fig. 9(a) does notshow signi®cant improvement when compared tothe spectrogram of noisy speech in Fig. 8(d), theimprovement can be clearly perceived while lis-tening. The spectrogram in Fig. 9(b) shows a sig-ni®cant improvement when compared with thespectrogram of the noisy speech in Fig. 8(d). Notethat the weighting of the residual signal at the ®nelevel (i.e. relative emphasis of the residual signalsamples within a glottal cycle) should be mild toavoid distortion in the processed speech. In thevoiced regions the spectrogram in Fig. 9(b) ap-pears cleaner compared to the spectrogram inFig. 9(a). For the case of speech processed usingthe spectral subtraction method we observe thatweak spectral peaks appear randomly in thespectrogram in Fig. 9(c). These random spectralpeaks give rise to musical noise.
Fig. 6. (a) Spectrogram for 10 dB SNR speech. The speech is corrupted by aircraft cockpit noise. (b) Spectrogram for enhanced speech
using spectral level manipulation besides gross and ®ne level weighting of the LP residual signal. The speech is enhanced using three
iterations.
B. Yegnanarayana et al. / Speech Communication 28 (1999) 25±42 37
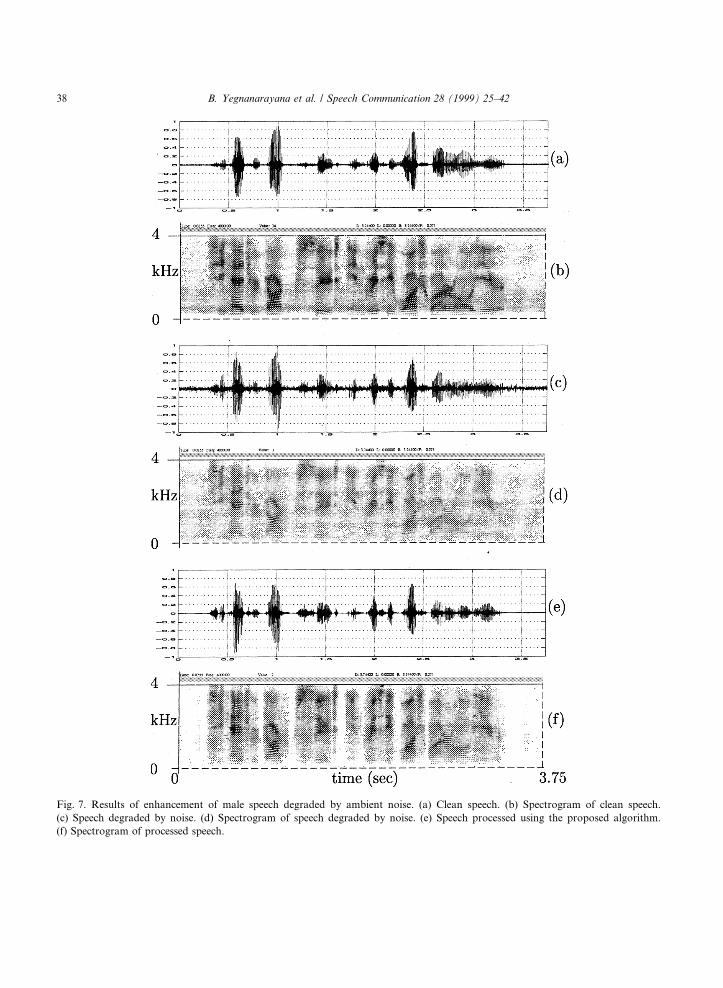
Fig. 7. Results of enhancement of male speech degraded by ambient noise. (a) Clean speech. (b) Spectrogram of clean speech.
(c) Speech degraded by noise. (d) Spectrogram of speech degraded by noise. (e) Speech processed using the proposed algorithm.
(f) Spectrogram of processed speech.
38 B. Yegnanarayana et al. / Speech Communication 28 (1999) 25±42
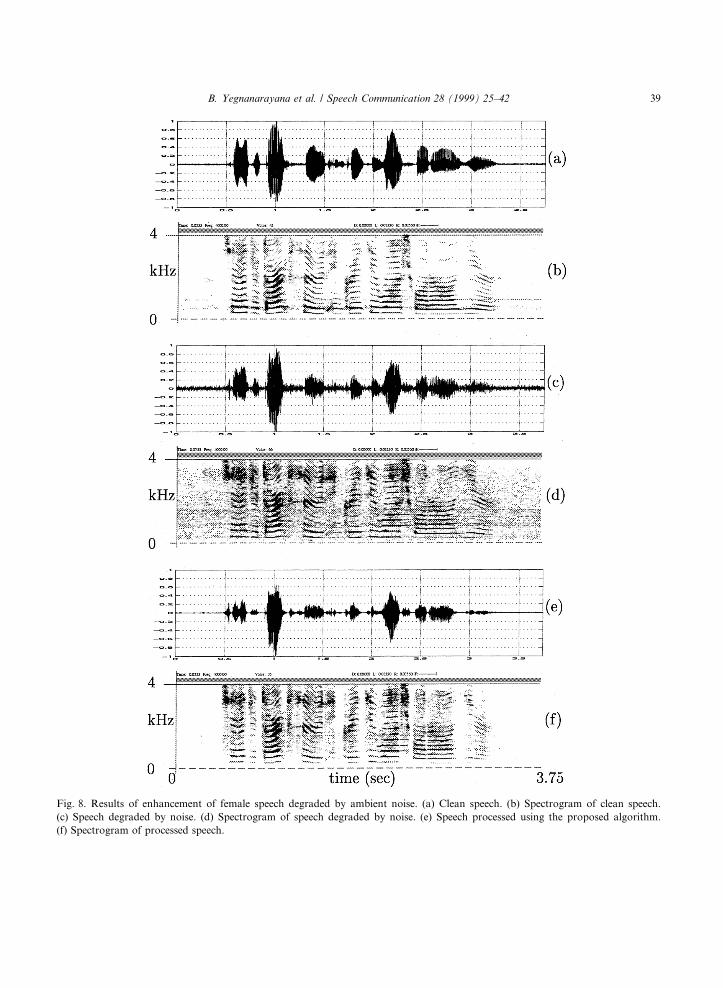
Fig. 8. Results of enhancement of female speech degraded by ambient noise. (a) Clean speech. (b) Spectrogram of clean speech.
(c) Speech degraded by noise. (d) Spectrogram of speech degraded by noise. (e) Speech processed using the proposed algorithm.
(f) Spectrogram of processed speech.
B. Yegnanarayana et al. / Speech Communication 28 (1999) 25±42 39
5. Summary and conclusions
In this paper we have presented a new approachfor enhancement of speech based on LP residualsignal. The method uses the fact that in noisyspeech the SNR is a function of time and fre-quency. By enhancing the high SNR regions rela-tive to the low SNR regions, the annoyance due tobackground noise is reduced without signi®cantlydistorting the speech. This is accomplished byidentifying the low and high SNR regions based onthe characteristics of the spectral ¯atness in short(2 ms) time frames. The spectral ¯atness informa-tion is derived using the ratio of energies in the LP
residual signal of the speech and the noisy signal.Inverse spectral ¯atness characteristics are used toderive a weight function for the residual signal atgross level, and the Frobenius norm of short (2 ms)segments of the speech signal is used to derive theweight function at ®ner level. The two weightfunctions are multiplied to get the overall weightfunction for the residual signal. The method workssince the residual signal samples are nearly un-correlated, and hence can be manipulated withoutsigni®cantly a�ecting the quality of the speech re-generated from the modi®ed residual signal. Sinceno direct manipulation in di�erent frequencybands is involved, this method does not produce
Fig. 9. Comparison of results of enhancement of the proposed method with spectral subtraction for female speech degraded by
ambient noise. Spectrograms of speech processed using the proposed algorithm for the parameter settings of (a) case A and (b) case B
in Table 2. (c) Spectrogram of speech processed using the spectral subtraction algorithm.
Table 2
Two di�erent settings of the parameters for the mapping functions
fmmax fm
min ag f0 wfinemax wfine
min af
Case A 1.0 0.1 1.0 1.5 1.0 0.25 0.75
Case B 1.0 0.05 2.0 2.0 1.0 0.6 0.75
40 B. Yegnanarayana et al. / Speech Communication 28 (1999) 25±42
the type of distortion which the spectral subtrac-tion and parameter smoothing methods produce.
The objective in this study is to enhance speechover background noise, and not noise suppressionor elimination. In fact even a small (3±6 dB) im-provement in SNR of noisy speech may give reliefto the listener. This study suggests that speechenhancement methods must aim to bring down theannoyance due to noise by mild enhancements.
The setting of various thresholds in the pro-cessing is primarily dictated by the listener's tol-erance to annoyance due to noise and preferenceto speech quality. The various parameter valuesused in the processing, such as LP order, analysisframe size, thresholds of the mapping functionetc., are not critical. The choice of the parametersdepends on listener's preference, as the e�ect ofthese parameters on the resulting quality of theenhanced speech is gradual and not abrupt. An-other important feature is that the method doesnot depend on the pitch of the voice. There is nodirect manipulation of the spectrum. However, abetter estimation of the vocal tract system char-acteristics is needed to improve the enhancementat the spectral level.
The proposed method reduces the annoyancedue to additive noise but is not very useful in re-ducing the annoyance due to reverberation. But anapproach based on emphasizing the high signal en-ergy regions relative to the low signal energy regionscan be developed for enhancement of reverberantspeech also (Yegnanarayana et al., 1998b).
In our opinion the proposed approach is dif-ferent from many of the methods available forprocessing degraded speech. There is scope forsigni®cant improvement by studying the e�ects ofvarious parameters on the perceptual quality ofthe enhanced speech. Moreover, this approachmay be combined with well known spectrum-basedmethods for speech enhancement to obtain a bet-ter quality of enhanced speech for various types ofdegradations.
References
Ananthapadmanabha, T.V., Yegnanarayana, B., 1979. Epoch
extraction from linear prediction residual for identi®cation
of closed glottis interval. IEEE Trans. Acoust. Speech
Signal Processing ASSP-27, 309±319.
Avenda~no, C., Hermansky, H., Vis, M., Bayya, A., 1996.
Adaptive speech enhancement using frequency-speci®c
SNR estimates. In: Proceeding of III IEEE Workshop on
Interactive Voice Technology for Telecommunications
Applications. Basking Ridge, New Jersey, pp. 65±68.
Boll, S.F., 1979. Suppression of acoustic noise in speech using
spectral subtraction. IEEE Trans. Acoust. Speech Signal
Processing ASSP-27, 113±120.
Chen, J.H., Gersho, A., 1995. Adaptive post®ltering for quality
enhancement of coded speech. IEEE Trans. Speech Audio
Processing 3, 59±71.
Cheng, Y.M., O'Shaughnessy, D., 1991. Speech enhancement
based conceptually on auditory evidence. IEEE Trans.
Signal Processing 39, 1943±1954.
Cooper, F.S., 1980. Acoustics in human communication:
Evolving ideas about the nature of speech. J. Acoust.
Soc. Amer. 68, 18±21.
Deller, J.R., Proakis, J.G., Hansen, J.H.L., 1993. Discrete-Time
Processsing of Speech Signals. Macmillan, New York.
Ephraim, Y., 1992. Statistical model based speech enhancement
systems. Proc. IEEE 80, 1526±1555.
Ephraim, Y., Van Trees, H.L., 1995. A signal subspace
approach for speech enhancement. IEEE Trans. Speech
Audio Processing 3, 251±266.
Erell, A., Weintraub, M., 1994. Estimation of noise-corrupted
speech DFT-spectrum using the pitch period. IEEE Trans.
Speech Audio Processing 2, 1±8.
Fant, G., 1993. Some problems in voice source analysis. Speech
Communication 13 (1±2), 7±22.
Gibson, J.D., Koo, B., Gray, S.D., 1991. Filtering of colored
noise for speech enhancement and coding. IEEE Trans.
Signal Processing 39, 1732±1742.
Hamon, C., Moulines, E., Charpentier, F.J., 1989. A diphone
synthesis system based on time domain prosodic modi®ca-
tions of speech. In: Proceedings of IEEE International
Conference Acoustic Speech and Signal Processing. Glas-
gow, Scotland, pp. 238±241.
Haykin, S., 1991. Adaptive Filter Theory. Prentice-Hall,
Englewood Cli�s, NJ.
Hermansky, H., Morgan, N., 1994. RASTA processing of
speech. IEEE Trans. Speech Audio Processing 2, 578±589.
Jayant, N.S., Noll, P., 1984. Digital Coding of Waveforms ±
Principles and Applications. Prentice Hall, Englewood
Cli�s, NJ.
Junqua, J.C., Haton, J.P., 1996. Robustness in Automatic
Speech Recognition: Fundamentals and Applications.
Kluwer Academic Publishers, Boston.
Le Bouquin, R., 1996. Enhancement of noisy speech signals:
Application to mobile radio communications. Speech
Communication 18 (1), 3±19.
Lee, K.Y., Shirai, K., 1996. E�cient recursive estimation for
speech enhancement in colored noise. IEEE Signal Pro-
cessing Lett. 3, 196±199.
Leon, S.J., 1990. Linear Algebra with Applications. Macmillan,
New York.
B. Yegnanarayana et al. / Speech Communication 28 (1999) 25±42 41
Lim, J.S., Oppenheim, A.V., 1978. All-pole modeling of
degraded speech. IEEE Trans. Acoust. Speech Signal
Processing ASSP-26, 197±210.
Mermelstein, P., 1982. Threshold of degradation for frequency-
distributed band-limited noise in continuous speech. IEEE
Trans. Acoust. Speech Signal Processing 72, 1368±1373.
Rose, R.C., Hofstetter, E.M., Reynolds, D.A., 1994. Integrated
models of signal and background with application to
speaker identi®cation in noise. IEEE Trans. Speech Audio
Processing 2, 245±257.
Satyanarayana Murthy, P., Yegnanarayana, B., 1998. Robust-
ness of group-delay-based method for extraction of signi-
®cant instants of excitation from speech signals. IEEE
Trans. Speech Audio Processing, in press.
Smits, R., Yegnanarayana, B., 1995. Determination of instants
of signi®cant excitation in speech using group delay
functions. IEEE Trans. Speech Audio Processing 3, 325±
333.
Website, 1997. http://spib.rice.edu/spib/select_noise.html, IEEE
Signal Processing Information Base.
Yegnanarayana, B., Ramachandran, V.R., 1992. Group delay
processing of speech signals. In: Proceeding of ESCA
Workshop on Comparing Speech Signal Representation.
She�eld, England, pp. 411±418.
Yegnanarayana, B., Satyanarayana Murthy, P., 1996. Source-
system windowing for speech analysis and synthesis. IEEE
Trans. Speech Audio Processing 4, 133±137.
Yegnanarayana, B., Teunen, R., 1994. Prosodic manipulation
of speech using knowledge of instants of signi®cant
excitation, Tech. Rep. 1029, Institute for Perception
Research, Eindhoven, The Netherlands.
Yegnanarayana, B., d'Allesandro, C., Darsinos, V., 1998a. An
iterative algorithm for decomposition of speech signals into
periodic and aperiodic components. IEEE Trans. Speech
Audio Processing 6, 1±11.
Yegnanarayana, B., Satyanarayana Murthy, P., Avenda~no, C.,
Hermansky, H., 1998b. Enhancement of reverberant
speech using LP residual. In: Proceedings of IEEE Inter-
national Conference Acoustic, Speech, and Signal Process-
ing, Vol. 1, Seattle, Washington, pp. 405±408.
42 B. Yegnanarayana et al. / Speech Communication 28 (1999) 25±42