Embed Size (px)
Citation preview
SPIR NetMonitor
Research on the Sociodemography ofInternet Users in the Czech Republic
Medium title:
ihned.cz
Month:
November 2014
Basic information
The size of Internet population in the Czech Republic 6 971 031Number of respondents
Medium N = 2 001Total (for all measured media) N = 14 380
RU(number) 750 495Reach(%) 10.77PV(number) (from Czech visitors) 10 304 207PV(number) (from all visitors) 11 632 049GRP (%) 147.81
Source: NetMonitor – SPIR – Gemius & MediaresearchNovember 2014
-1-
ihned.cz
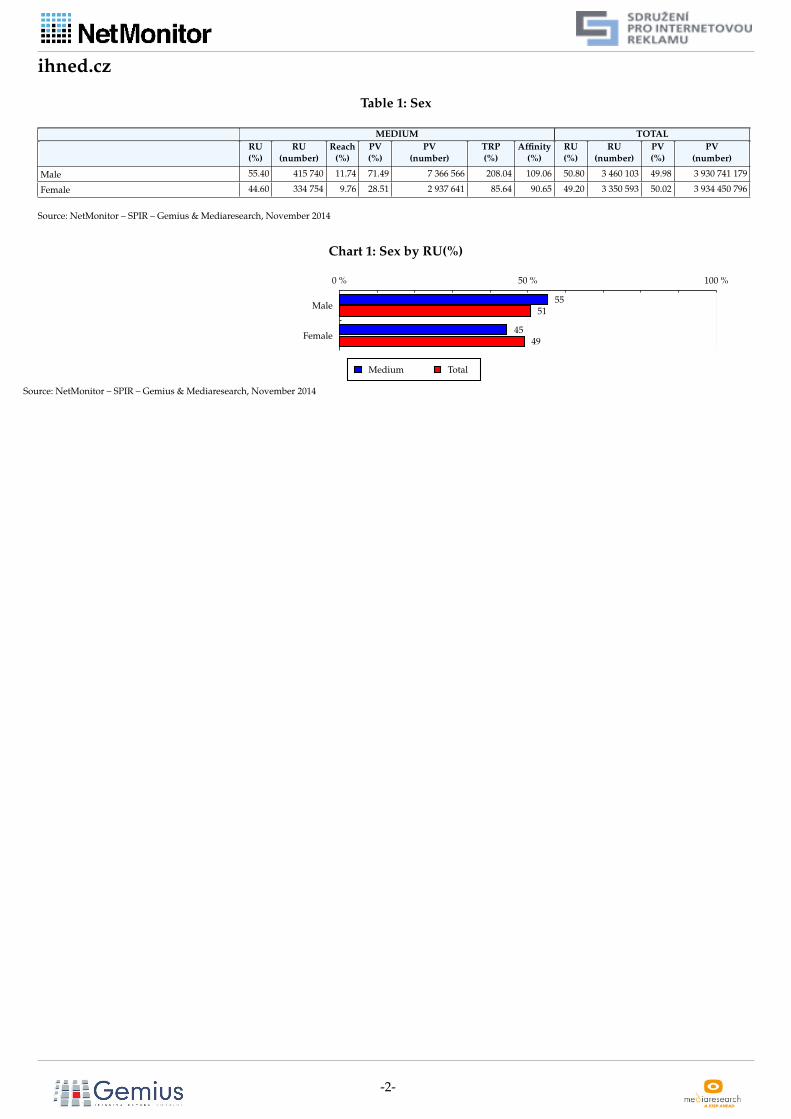
Table 1: Sex
MEDIUM TOTAL
RU
(%)
RU
(number)
Reach
(%)
PV
(%)
PV
(number)
TRP
(%)
Affinity
(%)
RU
(%)
RU
(number)
PV
(%)
PV
(number)
Male 55.40 415 740 11.74 71.49 7 366 566 208.04 109.06 50.80 3 460 103 49.98 3 930 741 179
Female 44.60 334 754 9.76 28.51 2 937 641 85.64 90.65 49.20 3 350 593 50.02 3 934 450 796
Source: NetMonitor – SPIR – Gemius & Mediaresearch, November 2014
Chart 1: Sex by RU(%)
0 % 50 % 100 %
Male55
51
Female45
49
Medium Total
Source: NetMonitor – SPIR – Gemius & Mediaresearch, November 2014
-2-

ihned.cz
Table 2: Age
MEDIUM TOTAL
RU
(%)
RU
(number)
Reach
(%)
PV
(%)
PV
(number)
TRP
(%)
Affinity
(%)
RU
(%)
RU
(number)
PV
(%)
PV
(number)
10-14 yrs 2.87 21 547 4.86 0.96 98 546 22.22 45.14 6.21 422 617 2.87 225 814 178
15-24 yrs 22.78 170 931 16.08 16.73 1 723 812 162.19 149.38 15.28 1 040 686 15.32 1 205 112 880
25-34 yrs 18.85 141 484 10.54 22.56 2 324 385 173.22 97.94 19.28 1 312 973 18.42 1 448 877 350
35-44 yrs 21.66 162 585 10.11 20.09 2 069 833 128.77 93.95 23.13 1 575 043 23.70 1 864 069 594
45-54 yrs 13.94 104 633 9.31 19.29 1 988 082 176.91 86.48 16.09 1 095 884 17.41 1 369 001 420
55-64 yrs 11.25 84 442 9.45 11.94 1 230 229 137.62 87.74 12.86 875 549 14.36 1 129 598 406
65+ yrs 8.64 64 871 13.04 8.44 869 320 174.68 121.08 7.16 487 942 7.92 622 718 146
Source: NetMonitor – SPIR – Gemius & Mediaresearch, November 2014
Chart 2: Age by RU(%)
0 % 50 % 100 %
10-14 yrs 36
15-24 yrs 2315
25-34 yrs 1919
35-44 yrs 2223
45-54 yrs 1416
55-64 yrs 1113
65+ yrs 97
Medium Total
Source: NetMonitor – SPIR – Gemius & Mediaresearch, November 2014
-3-
ihned.cz
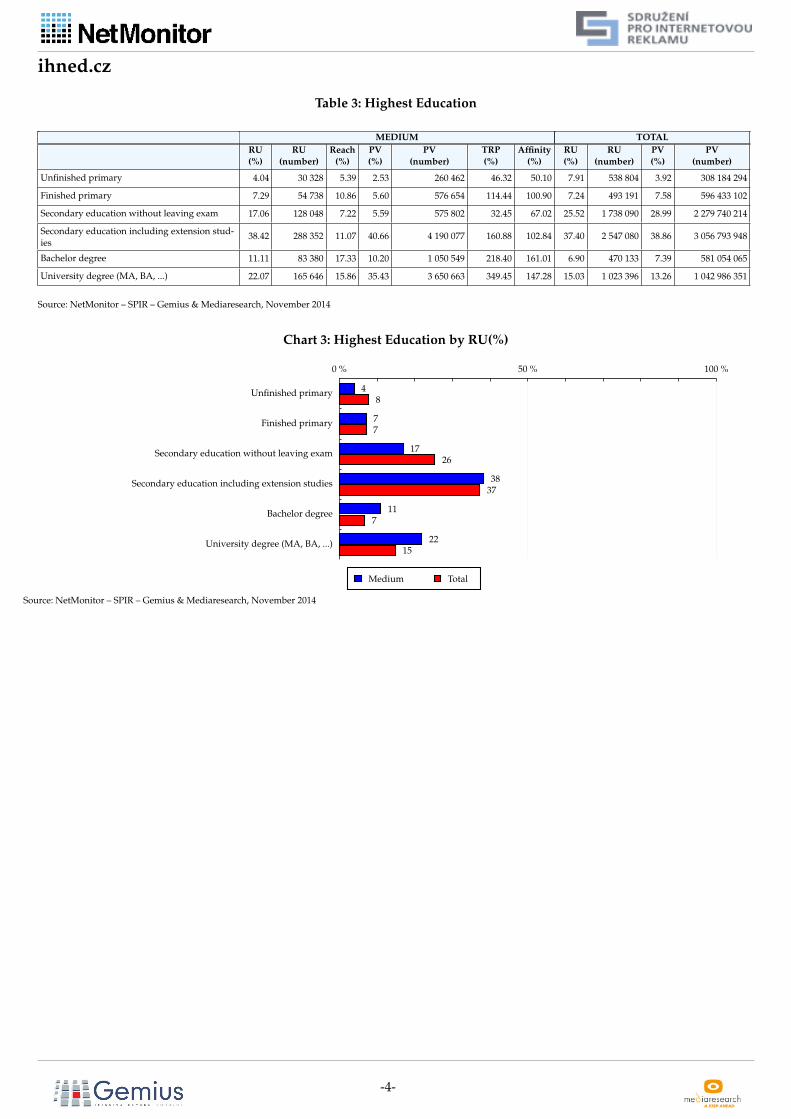
Table 3: Highest Education
MEDIUM TOTAL
RU
(%)
RU
(number)
Reach
(%)
PV
(%)
PV
(number)
TRP
(%)
Affinity
(%)
RU
(%)
RU
(number)
PV
(%)
PV
(number)
Unfinished primary 4.04 30 328 5.39 2.53 260 462 46.32 50.10 7.91 538 804 3.92 308 184 294
Finished primary 7.29 54 738 10.86 5.60 576 654 114.44 100.90 7.24 493 191 7.58 596 433 102
Secondary education without leaving exam 17.06 128 048 7.22 5.59 575 802 32.45 67.02 25.52 1 738 090 28.99 2 279 740 214
Secondary education including extension stud-ies
38.42 288 352 11.07 40.66 4 190 077 160.88 102.84 37.40 2 547 080 38.86 3 056 793 948
Bachelor degree 11.11 83 380 17.33 10.20 1 050 549 218.40 161.01 6.90 470 133 7.39 581 054 065
University degree (MA, BA, ...) 22.07 165 646 15.86 35.43 3 650 663 349.45 147.28 15.03 1 023 396 13.26 1 042 986 351
Source: NetMonitor – SPIR – Gemius & Mediaresearch, November 2014
Chart 3: Highest Education by RU(%)
0 % 50 % 100 %
Unfinished primary 48
Finished primary 77
Secondary education without leaving exam 1726
Secondary education including extension studies 3837
Bachelor degree 117
University degree (MA, BA, ...) 2215
Medium Total
Source: NetMonitor – SPIR – Gemius & Mediaresearch, November 2014
-4-
ihned.cz
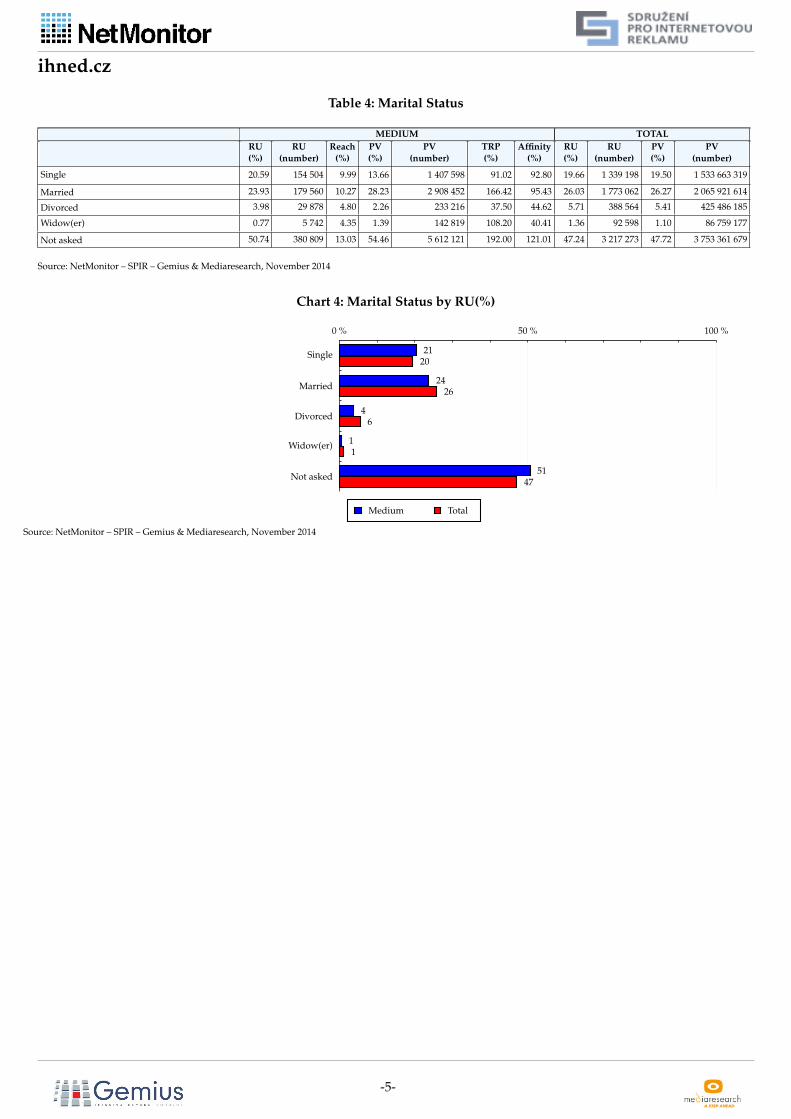
Table 4: Marital Status
MEDIUM TOTAL
RU
(%)
RU
(number)
Reach
(%)
PV
(%)
PV
(number)
TRP
(%)
Affinity
(%)
RU
(%)
RU
(number)
PV
(%)
PV
(number)
Single 20.59 154 504 9.99 13.66 1 407 598 91.02 92.80 19.66 1 339 198 19.50 1 533 663 319
Married 23.93 179 560 10.27 28.23 2 908 452 166.42 95.43 26.03 1 773 062 26.27 2 065 921 614
Divorced 3.98 29 878 4.80 2.26 233 216 37.50 44.62 5.71 388 564 5.41 425 486 185
Widow(er) 0.77 5 742 4.35 1.39 142 819 108.20 40.41 1.36 92 598 1.10 86 759 177
Not asked 50.74 380 809 13.03 54.46 5 612 121 192.00 121.01 47.24 3 217 273 47.72 3 753 361 679
Source: NetMonitor – SPIR – Gemius & Mediaresearch, November 2014
Chart 4: Marital Status by RU(%)
0 % 50 % 100 %
Single 2120
Married2426
Divorced46
Widow(er) 11
Not asked51
47
Medium Total
Source: NetMonitor – SPIR – Gemius & Mediaresearch, November 2014
-5-
ihned.cz
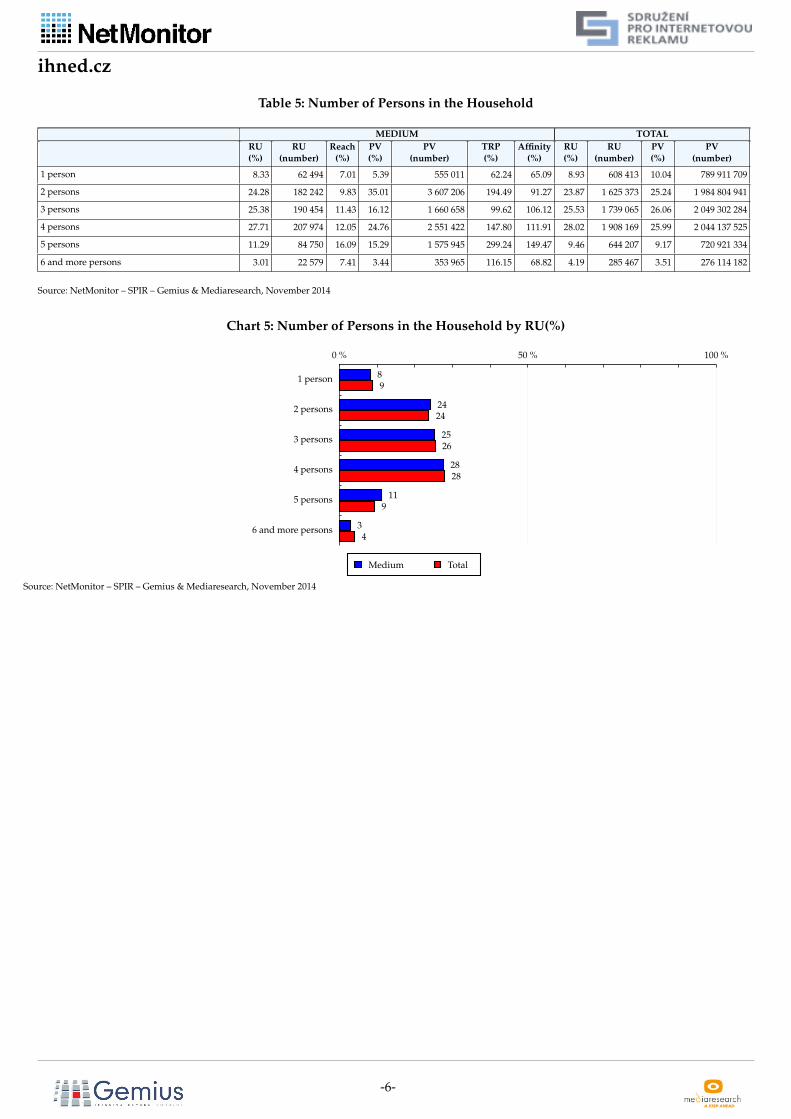
Table 5: Number of Persons in the Household
MEDIUM TOTAL
RU
(%)
RU
(number)
Reach
(%)
PV
(%)
PV
(number)
TRP
(%)
Affinity
(%)
RU
(%)
RU
(number)
PV
(%)
PV
(number)
1 person 8.33 62 494 7.01 5.39 555 011 62.24 65.09 8.93 608 413 10.04 789 911 709
2 persons 24.28 182 242 9.83 35.01 3 607 206 194.49 91.27 23.87 1 625 373 25.24 1 984 804 941
3 persons 25.38 190 454 11.43 16.12 1 660 658 99.62 106.12 25.53 1 739 065 26.06 2 049 302 284
4 persons 27.71 207 974 12.05 24.76 2 551 422 147.80 111.91 28.02 1 908 169 25.99 2 044 137 525
5 persons 11.29 84 750 16.09 15.29 1 575 945 299.24 149.47 9.46 644 207 9.17 720 921 334
6 and more persons 3.01 22 579 7.41 3.44 353 965 116.15 68.82 4.19 285 467 3.51 276 114 182
Source: NetMonitor – SPIR – Gemius & Mediaresearch, November 2014
Chart 5: Number of Persons in the Household by RU(%)
0 % 50 % 100 %
1 person 89
2 persons 2424
3 persons 2526
4 persons 2828
5 persons 119
6 and more persons 34
Medium Total
Source: NetMonitor – SPIR – Gemius & Mediaresearch, November 2014
-6-
ihned.cz
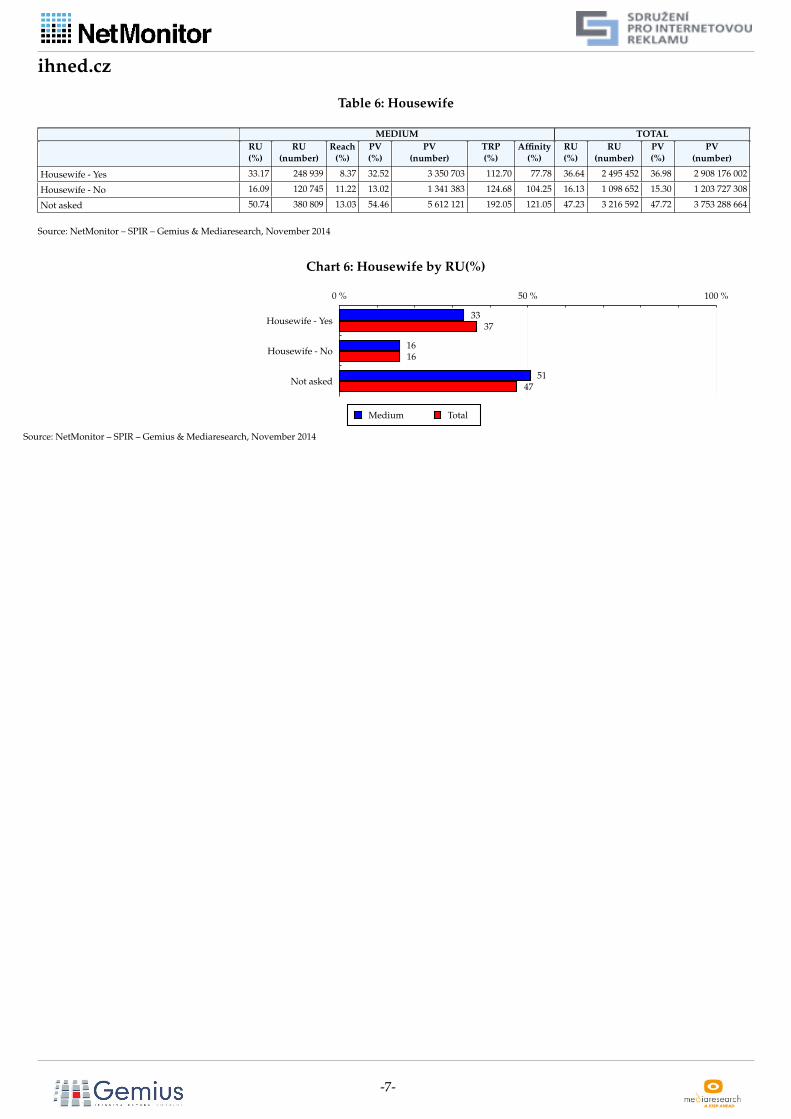
Table 6: Housewife
MEDIUM TOTAL
RU
(%)
RU
(number)
Reach
(%)
PV
(%)
PV
(number)
TRP
(%)
Affinity
(%)
RU
(%)
RU
(number)
PV
(%)
PV
(number)
Housewife - Yes 33.17 248 939 8.37 32.52 3 350 703 112.70 77.78 36.64 2 495 452 36.98 2 908 176 002
Housewife - No 16.09 120 745 11.22 13.02 1 341 383 124.68 104.25 16.13 1 098 652 15.30 1 203 727 308
Not asked 50.74 380 809 13.03 54.46 5 612 121 192.05 121.05 47.23 3 216 592 47.72 3 753 288 664
Source: NetMonitor – SPIR – Gemius & Mediaresearch, November 2014
Chart 6: Housewife by RU(%)
0 % 50 % 100 %
Housewife - Yes33
37
Housewife - No1616
Not asked51
47
Medium Total
Source: NetMonitor – SPIR – Gemius & Mediaresearch, November 2014
-7-
ihned.cz
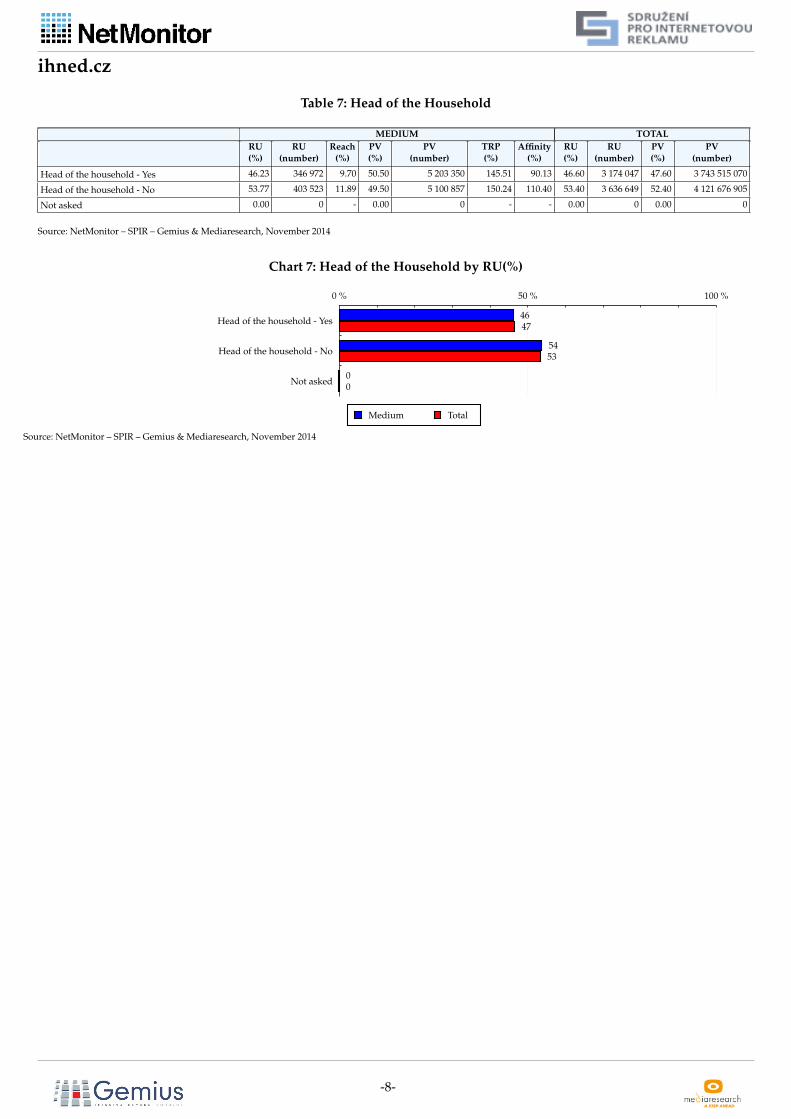
Table 7: Head of the Household
MEDIUM TOTAL
RU
(%)
RU
(number)
Reach
(%)
PV
(%)
PV
(number)
TRP
(%)
Affinity
(%)
RU
(%)
RU
(number)
PV
(%)
PV
(number)
Head of the household - Yes 46.23 346 972 9.70 50.50 5 203 350 145.51 90.13 46.60 3 174 047 47.60 3 743 515 070
Head of the household - No 53.77 403 523 11.89 49.50 5 100 857 150.24 110.40 53.40 3 636 649 52.40 4 121 676 905
Not asked 0.00 0 - 0.00 0 - - 0.00 0 0.00 0
Source: NetMonitor – SPIR – Gemius & Mediaresearch, November 2014
Chart 7: Head of the Household by RU(%)
0 % 50 % 100 %
Head of the household - Yes4647
Head of the household - No5453
Not asked00
Medium Total
Source: NetMonitor – SPIR – Gemius & Mediaresearch, November 2014
-8-
ihned.cz
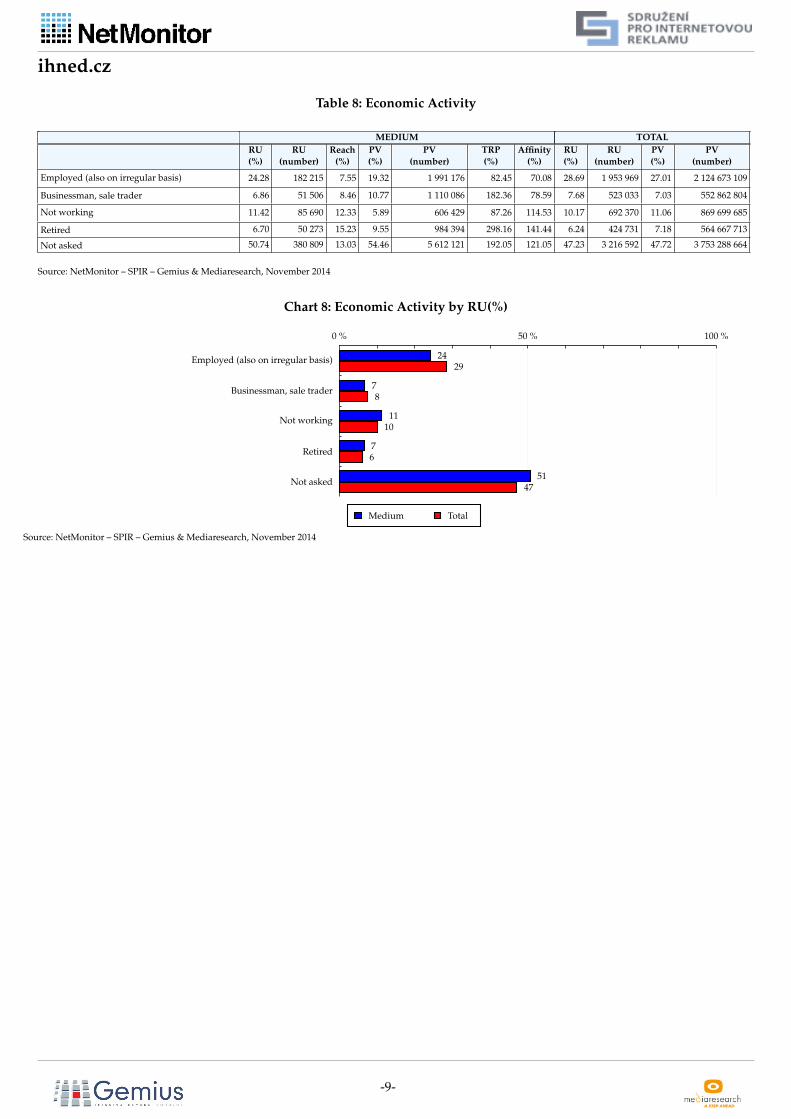
Table 8: Economic Activity
MEDIUM TOTAL
RU
(%)
RU
(number)
Reach
(%)
PV
(%)
PV
(number)
TRP
(%)
Affinity
(%)
RU
(%)
RU
(number)
PV
(%)
PV
(number)
Employed (also on irregular basis) 24.28 182 215 7.55 19.32 1 991 176 82.45 70.08 28.69 1 953 969 27.01 2 124 673 109
Businessman, sale trader 6.86 51 506 8.46 10.77 1 110 086 182.36 78.59 7.68 523 033 7.03 552 862 804
Not working 11.42 85 690 12.33 5.89 606 429 87.26 114.53 10.17 692 370 11.06 869 699 685
Retired 6.70 50 273 15.23 9.55 984 394 298.16 141.44 6.24 424 731 7.18 564 667 713
Not asked 50.74 380 809 13.03 54.46 5 612 121 192.05 121.05 47.23 3 216 592 47.72 3 753 288 664
Source: NetMonitor – SPIR – Gemius & Mediaresearch, November 2014
Chart 8: Economic Activity by RU(%)
0 % 50 % 100 %
Employed (also on irregular basis) 2429
Businessman, sale trader 78
Not working 1110
Retired76
Not asked51
47
Medium Total
Source: NetMonitor – SPIR – Gemius & Mediaresearch, November 2014
-9-
ihned.cz
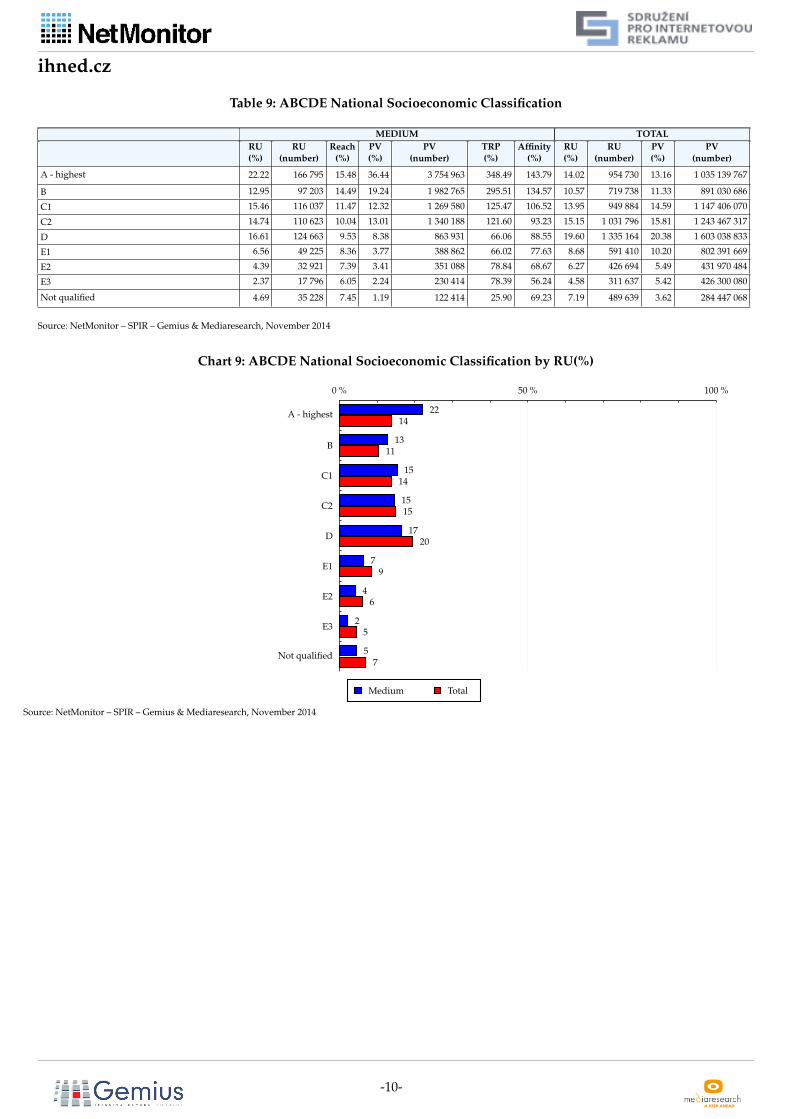
Table 9: ABCDE National Socioeconomic Classification
MEDIUM TOTAL
RU
(%)
RU
(number)
Reach
(%)
PV
(%)
PV
(number)
TRP
(%)
Affinity
(%)
RU
(%)
RU
(number)
PV
(%)
PV
(number)
A - highest 22.22 166 795 15.48 36.44 3 754 963 348.49 143.79 14.02 954 730 13.16 1 035 139 767
B 12.95 97 203 14.49 19.24 1 982 765 295.51 134.57 10.57 719 738 11.33 891 030 686
C1 15.46 116 037 11.47 12.32 1 269 580 125.47 106.52 13.95 949 884 14.59 1 147 406 070
C2 14.74 110 623 10.04 13.01 1 340 188 121.60 93.23 15.15 1 031 796 15.81 1 243 467 317
D 16.61 124 663 9.53 8.38 863 931 66.06 88.55 19.60 1 335 164 20.38 1 603 038 833
E1 6.56 49 225 8.36 3.77 388 862 66.02 77.63 8.68 591 410 10.20 802 391 669
E2 4.39 32 921 7.39 3.41 351 088 78.84 68.67 6.27 426 694 5.49 431 970 484
E3 2.37 17 796 6.05 2.24 230 414 78.39 56.24 4.58 311 637 5.42 426 300 080
Not qualified 4.69 35 228 7.45 1.19 122 414 25.90 69.23 7.19 489 639 3.62 284 447 068
Source: NetMonitor – SPIR – Gemius & Mediaresearch, November 2014
Chart 9: ABCDE National Socioeconomic Classification by RU(%)
0 % 50 % 100 %
A - highest 2214
B13
11
C115
14
C21515
D17
20
E179
E246
E325
Not qualified 57
Medium Total
Source: NetMonitor – SPIR – Gemius & Mediaresearch, November 2014
-10-
ihned.cz
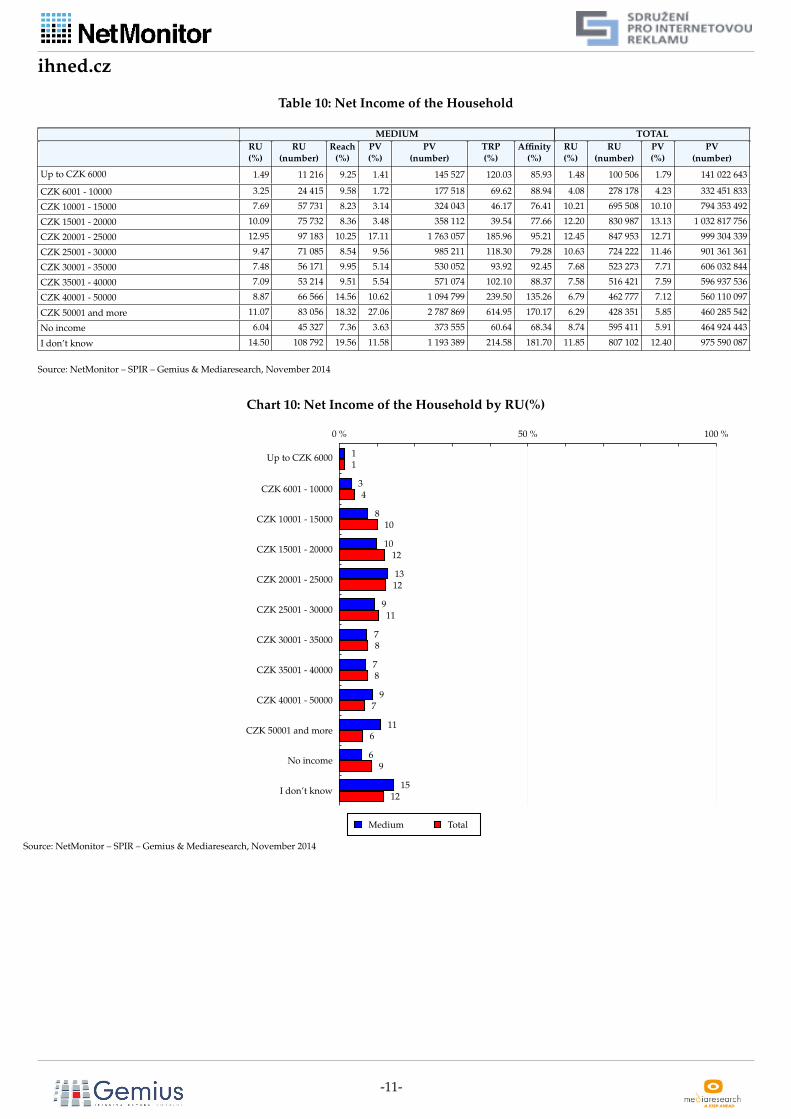
Table 10: Net Income of the Household
MEDIUM TOTAL
RU
(%)
RU
(number)
Reach
(%)
PV
(%)
PV
(number)
TRP
(%)
Affinity
(%)
RU
(%)
RU
(number)
PV
(%)
PV
(number)
Up to CZK 6000 1.49 11 216 9.25 1.41 145 527 120.03 85.93 1.48 100 506 1.79 141 022 643
CZK 6001 - 10000 3.25 24 415 9.58 1.72 177 518 69.62 88.94 4.08 278 178 4.23 332 451 833
CZK 10001 - 15000 7.69 57 731 8.23 3.14 324 043 46.17 76.41 10.21 695 508 10.10 794 353 492
CZK 15001 - 20000 10.09 75 732 8.36 3.48 358 112 39.54 77.66 12.20 830 987 13.13 1 032 817 756
CZK 20001 - 25000 12.95 97 183 10.25 17.11 1 763 057 185.96 95.21 12.45 847 953 12.71 999 304 339
CZK 25001 - 30000 9.47 71 085 8.54 9.56 985 211 118.30 79.28 10.63 724 222 11.46 901 361 361
CZK 30001 - 35000 7.48 56 171 9.95 5.14 530 052 93.92 92.45 7.68 523 273 7.71 606 032 844
CZK 35001 - 40000 7.09 53 214 9.51 5.54 571 074 102.10 88.37 7.58 516 421 7.59 596 937 536
CZK 40001 - 50000 8.87 66 566 14.56 10.62 1 094 799 239.50 135.26 6.79 462 777 7.12 560 110 097
CZK 50001 and more 11.07 83 056 18.32 27.06 2 787 869 614.95 170.17 6.29 428 351 5.85 460 285 542
No income 6.04 45 327 7.36 3.63 373 555 60.64 68.34 8.74 595 411 5.91 464 924 443
I don’t know 14.50 108 792 19.56 11.58 1 193 389 214.58 181.70 11.85 807 102 12.40 975 590 087
Source: NetMonitor – SPIR – Gemius & Mediaresearch, November 2014
Chart 10: Net Income of the Household by RU(%)
0 % 50 % 100 %
Up to CZK 6000 11
CZK 6001 - 1000034
CZK 10001 - 150008
10
CZK 15001 - 200001012
CZK 20001 - 250001312
CZK 25001 - 30000911
CZK 30001 - 3500078
CZK 35001 - 4000078
CZK 40001 - 500009
7
CZK 50001 and more11
6
No income6
9
I don’t know15
12
Medium Total
Source: NetMonitor – SPIR – Gemius & Mediaresearch, November 2014
-11-
ihned.cz
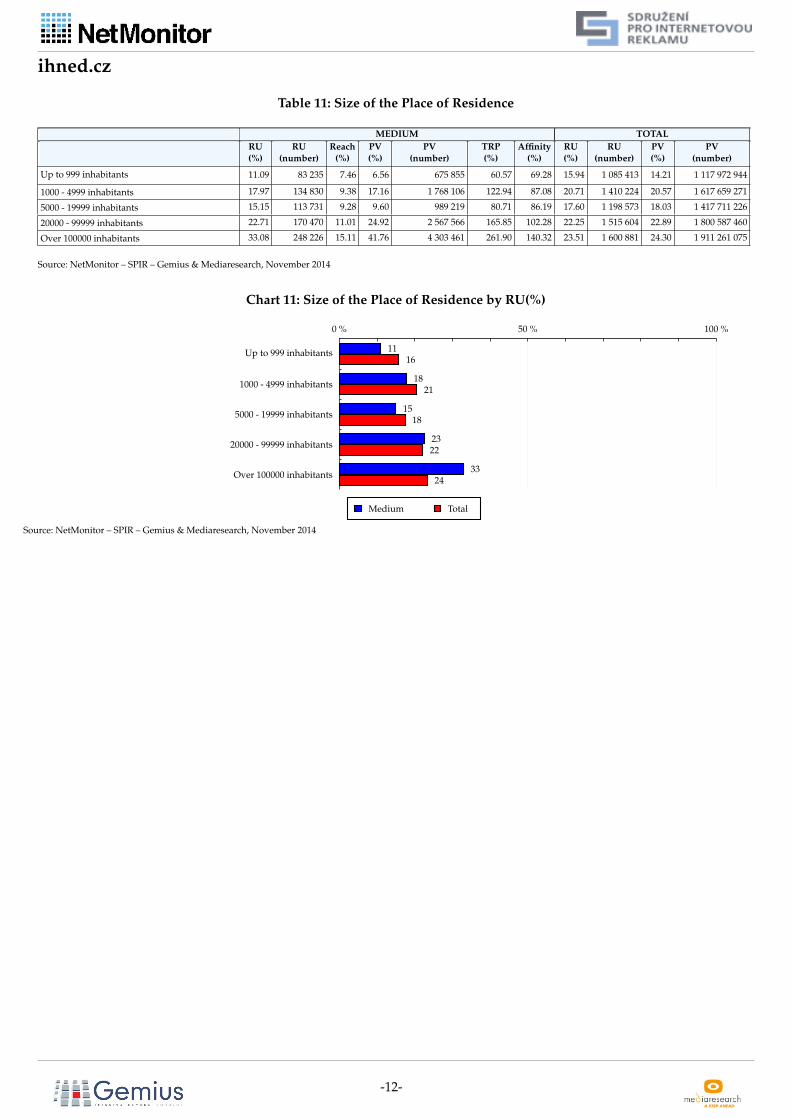
Table 11: Size of the Place of Residence
MEDIUM TOTAL
RU
(%)
RU
(number)
Reach
(%)
PV
(%)
PV
(number)
TRP
(%)
Affinity
(%)
RU
(%)
RU
(number)
PV
(%)
PV
(number)
Up to 999 inhabitants 11.09 83 235 7.46 6.56 675 855 60.57 69.28 15.94 1 085 413 14.21 1 117 972 944
1000 - 4999 inhabitants 17.97 134 830 9.38 17.16 1 768 106 122.94 87.08 20.71 1 410 224 20.57 1 617 659 271
5000 - 19999 inhabitants 15.15 113 731 9.28 9.60 989 219 80.71 86.19 17.60 1 198 573 18.03 1 417 711 226
20000 - 99999 inhabitants 22.71 170 470 11.01 24.92 2 567 566 165.85 102.28 22.25 1 515 604 22.89 1 800 587 460
Over 100000 inhabitants 33.08 248 226 15.11 41.76 4 303 461 261.90 140.32 23.51 1 600 881 24.30 1 911 261 075
Source: NetMonitor – SPIR – Gemius & Mediaresearch, November 2014
Chart 11: Size of the Place of Residence by RU(%)
0 % 50 % 100 %
Up to 999 inhabitants 1116
1000 - 4999 inhabitants18
21
5000 - 19999 inhabitants1518
20000 - 99999 inhabitants2322
Over 100000 inhabitants33
24
Medium Total
Source: NetMonitor – SPIR – Gemius & Mediaresearch, November 2014
-12-
ihned.cz
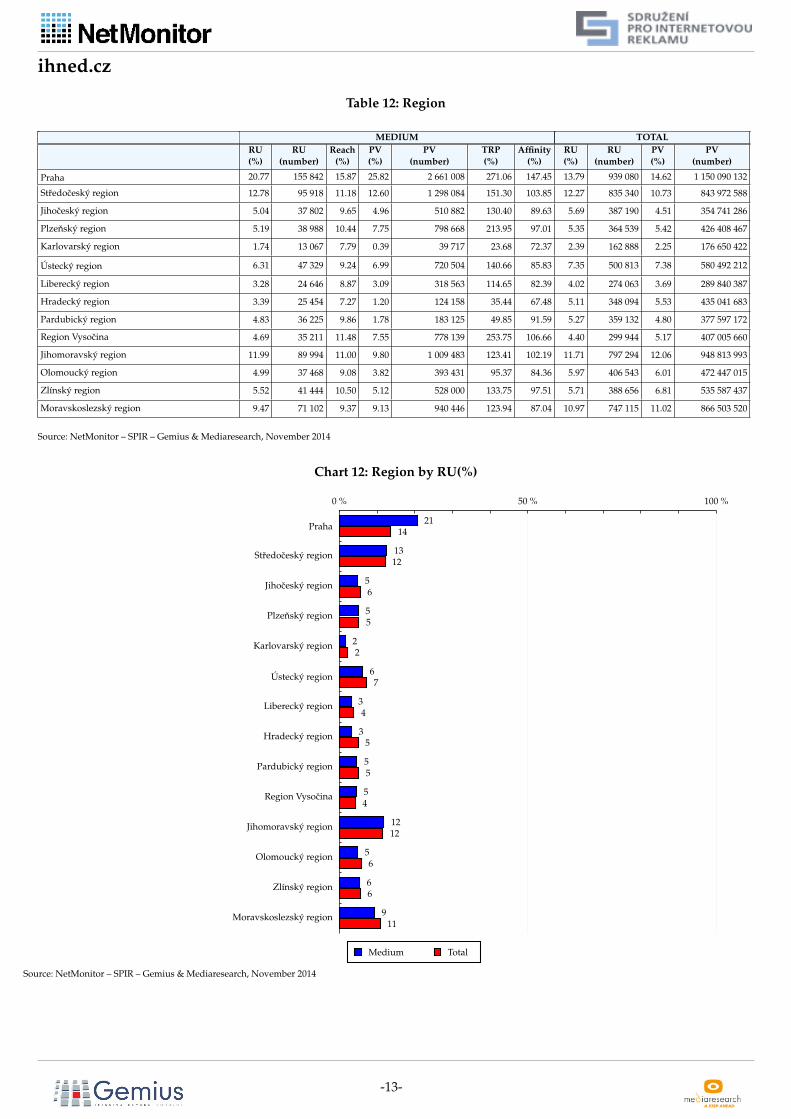
Table 12: Region
MEDIUM TOTAL
RU
(%)
RU
(number)
Reach
(%)
PV
(%)
PV
(number)
TRP
(%)
Affinity
(%)
RU
(%)
RU
(number)
PV
(%)
PV
(number)
Praha 20.77 155 842 15.87 25.82 2 661 008 271.06 147.45 13.79 939 080 14.62 1 150 090 132
Stredoceský region 12.78 95 918 11.18 12.60 1 298 084 151.30 103.85 12.27 835 340 10.73 843 972 588
Jihoceský region 5.04 37 802 9.65 4.96 510 882 130.40 89.63 5.69 387 190 4.51 354 741 286
Plzenský region 5.19 38 988 10.44 7.75 798 668 213.95 97.01 5.35 364 539 5.42 426 408 467
Karlovarský region 1.74 13 067 7.79 0.39 39 717 23.68 72.37 2.39 162 888 2.25 176 650 422
Ústecký region 6.31 47 329 9.24 6.99 720 504 140.66 85.83 7.35 500 813 7.38 580 492 212
Liberecký region 3.28 24 646 8.87 3.09 318 563 114.65 82.39 4.02 274 063 3.69 289 840 387
Hradecký region 3.39 25 454 7.27 1.20 124 158 35.44 67.48 5.11 348 094 5.53 435 041 683
Pardubický region 4.83 36 225 9.86 1.78 183 125 49.85 91.59 5.27 359 132 4.80 377 597 172
Region Vysocina 4.69 35 211 11.48 7.55 778 139 253.75 106.66 4.40 299 944 5.17 407 005 660
Jihomoravský region 11.99 89 994 11.00 9.80 1 009 483 123.41 102.19 11.71 797 294 12.06 948 813 993
Olomoucký region 4.99 37 468 9.08 3.82 393 431 95.37 84.36 5.97 406 543 6.01 472 447 015
Zlínský region 5.52 41 444 10.50 5.12 528 000 133.75 97.51 5.71 388 656 6.81 535 587 437
Moravskoslezský region 9.47 71 102 9.37 9.13 940 446 123.94 87.04 10.97 747 115 11.02 866 503 520
Source: NetMonitor – SPIR – Gemius & Mediaresearch, November 2014
Chart 12: Region by RU(%)
0 % 50 % 100 %
Praha21
14
Stredoceský region 1312
Jihoceský region 56
Plzenský region 55
Karlovarský region 22
Ústecký region 67
Liberecký region 34
Hradecký region 35
Pardubický region 55
Region Vysocina 54
Jihomoravský region 1212
Olomoucký region 56
Zlínský region 66
Moravskoslezský region 911
Medium Total
Source: NetMonitor – SPIR – Gemius & Mediaresearch, November 2014
-13-
ihned.cz
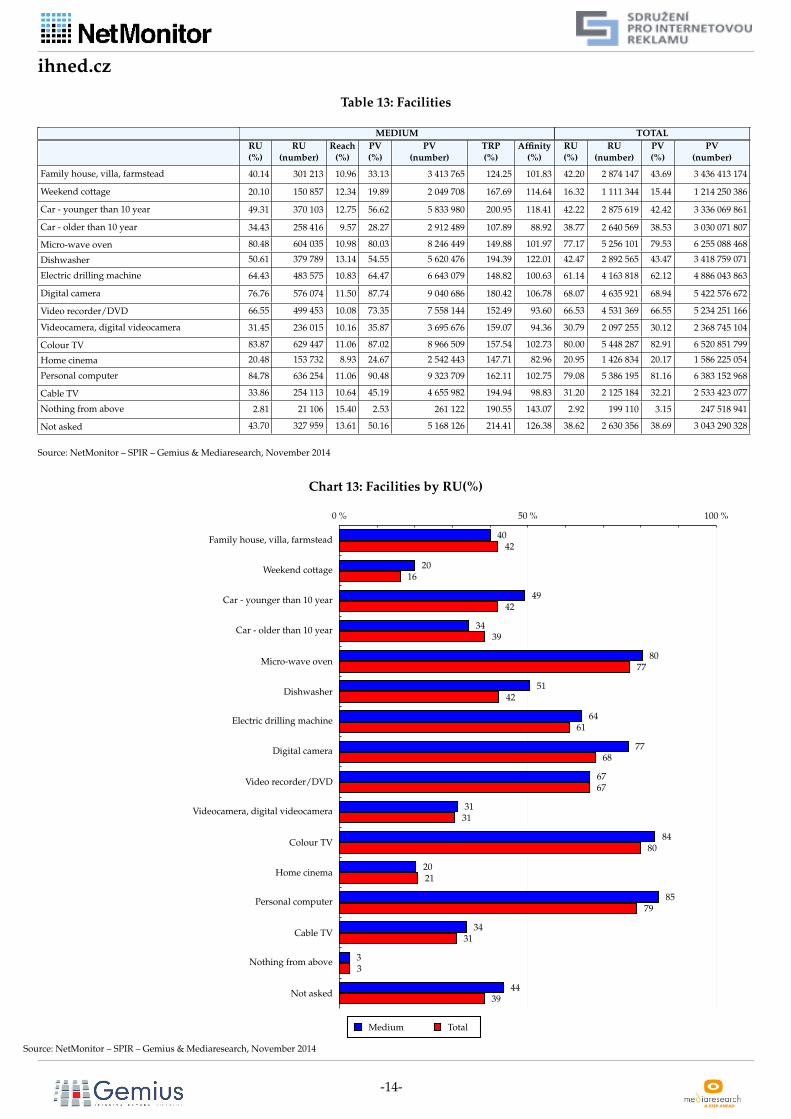
Table 13: Facilities
MEDIUM TOTAL
RU
(%)
RU
(number)
Reach
(%)
PV
(%)
PV
(number)
TRP
(%)
Affinity
(%)
RU
(%)
RU
(number)
PV
(%)
PV
(number)
Family house, villa, farmstead 40.14 301 213 10.96 33.13 3 413 765 124.25 101.83 42.20 2 874 147 43.69 3 436 413 174
Weekend cottage 20.10 150 857 12.34 19.89 2 049 708 167.69 114.64 16.32 1 111 344 15.44 1 214 250 386
Car - younger than 10 year 49.31 370 103 12.75 56.62 5 833 980 200.95 118.41 42.22 2 875 619 42.42 3 336 069 861
Car - older than 10 year 34.43 258 416 9.57 28.27 2 912 489 107.89 88.92 38.77 2 640 569 38.53 3 030 071 807
Micro-wave oven 80.48 604 035 10.98 80.03 8 246 449 149.88 101.97 77.17 5 256 101 79.53 6 255 088 468
Dishwasher 50.61 379 789 13.14 54.55 5 620 476 194.39 122.01 42.47 2 892 565 43.47 3 418 759 071
Electric drilling machine 64.43 483 575 10.83 64.47 6 643 079 148.82 100.63 61.14 4 163 818 62.12 4 886 043 863
Digital camera 76.76 576 074 11.50 87.74 9 040 686 180.42 106.78 68.07 4 635 921 68.94 5 422 576 672
Video recorder/DVD 66.55 499 453 10.08 73.35 7 558 144 152.49 93.60 66.53 4 531 369 66.55 5 234 251 166
Videocamera, digital videocamera 31.45 236 015 10.16 35.87 3 695 676 159.07 94.36 30.79 2 097 255 30.12 2 368 745 104
Colour TV 83.87 629 447 11.06 87.02 8 966 509 157.54 102.73 80.00 5 448 287 82.91 6 520 851 799
Home cinema 20.48 153 732 8.93 24.67 2 542 443 147.71 82.96 20.95 1 426 834 20.17 1 586 225 054
Personal computer 84.78 636 254 11.06 90.48 9 323 709 162.11 102.75 79.08 5 386 195 81.16 6 383 152 968
Cable TV 33.86 254 113 10.64 45.19 4 655 982 194.94 98.83 31.20 2 125 184 32.21 2 533 423 077
Nothing from above 2.81 21 106 15.40 2.53 261 122 190.55 143.07 2.92 199 110 3.15 247 518 941
Not asked 43.70 327 959 13.61 50.16 5 168 126 214.41 126.38 38.62 2 630 356 38.69 3 043 290 328
Source: NetMonitor – SPIR – Gemius & Mediaresearch, November 2014
Chart 13: Facilities by RU(%)
0 % 50 % 100 %
Family house, villa, farmstead 4042
Weekend cottage 2016
Car - younger than 10 year 4942
Car - older than 10 year 3439
Micro-wave oven80
77
Dishwasher51
42
Electric drilling machine 6461
Digital camera 7768
Video recorder/DVD 6767
Videocamera, digital videocamera 3131
Colour TV84
80
Home cinema2021
Personal computer 8579
Cable TV34
31
Nothing from above 33
Not asked44
39
Medium Total
Source: NetMonitor – SPIR – Gemius & Mediaresearch, November 2014
-14-
ihned.cz
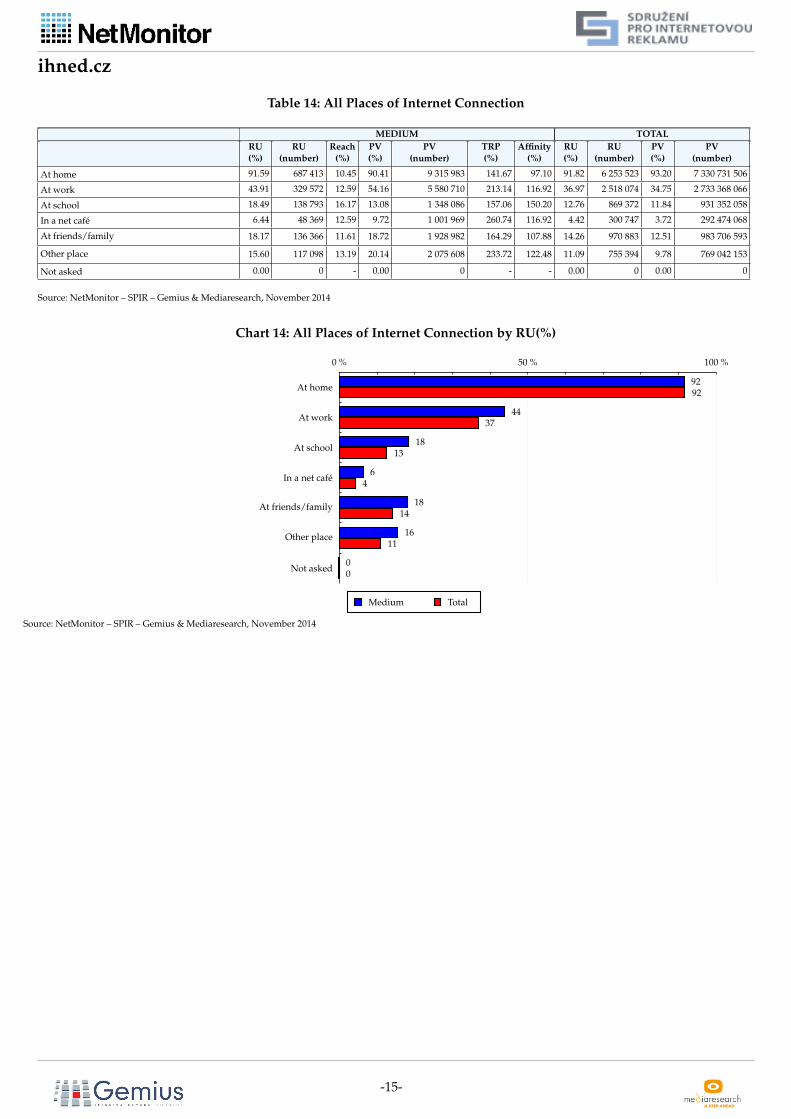
Table 14: All Places of Internet Connection
MEDIUM TOTAL
RU
(%)
RU
(number)
Reach
(%)
PV
(%)
PV
(number)
TRP
(%)
Affinity
(%)
RU
(%)
RU
(number)
PV
(%)
PV
(number)
At home 91.59 687 413 10.45 90.41 9 315 983 141.67 97.10 91.82 6 253 523 93.20 7 330 731 506
At work 43.91 329 572 12.59 54.16 5 580 710 213.14 116.92 36.97 2 518 074 34.75 2 733 368 066
At school 18.49 138 793 16.17 13.08 1 348 086 157.06 150.20 12.76 869 372 11.84 931 352 058
In a net café 6.44 48 369 12.59 9.72 1 001 969 260.74 116.92 4.42 300 747 3.72 292 474 068
At friends/family 18.17 136 366 11.61 18.72 1 928 982 164.29 107.88 14.26 970 883 12.51 983 706 593
Other place 15.60 117 098 13.19 20.14 2 075 608 233.72 122.48 11.09 755 394 9.78 769 042 153
Not asked 0.00 0 - 0.00 0 - - 0.00 0 0.00 0
Source: NetMonitor – SPIR – Gemius & Mediaresearch, November 2014
Chart 14: All Places of Internet Connection by RU(%)
0 % 50 % 100 %
At home9292
At work44
37
At school18
13
In a net café6
4
At friends/family 1814
Other place 1611
Not asked00
Medium Total
Source: NetMonitor – SPIR – Gemius & Mediaresearch, November 2014
-15-
ihned.cz
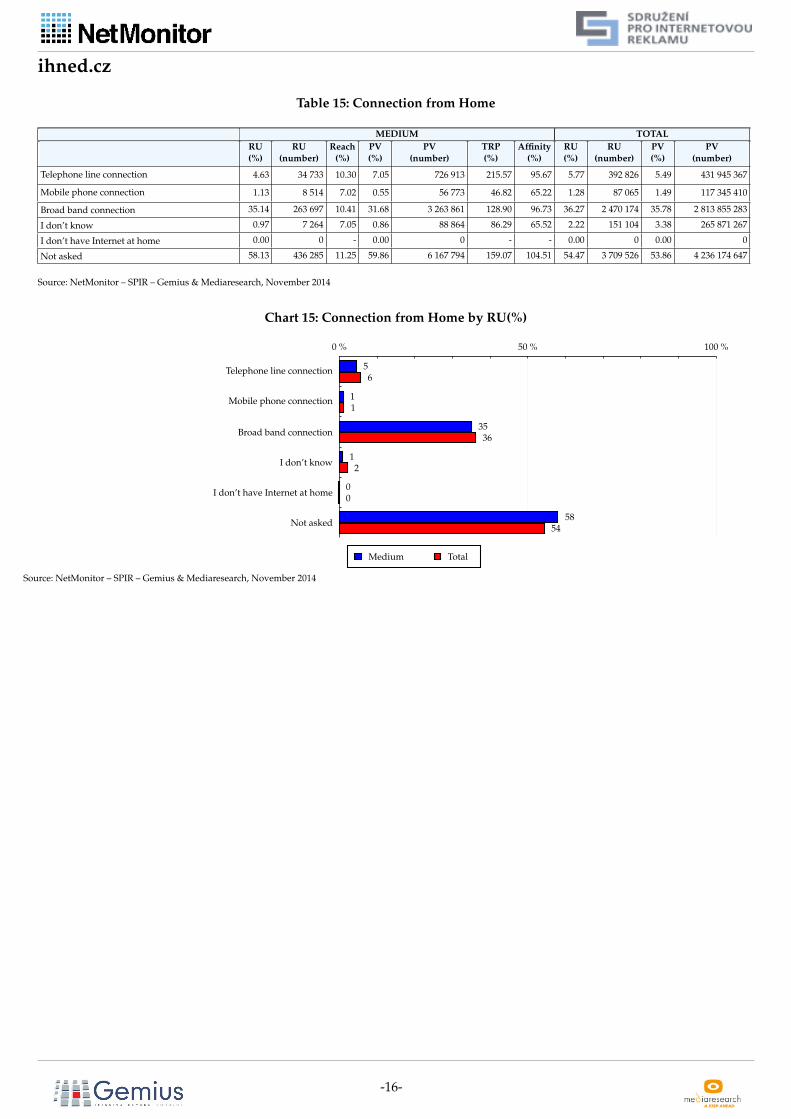
Table 15: Connection from Home
MEDIUM TOTAL
RU
(%)
RU
(number)
Reach
(%)
PV
(%)
PV
(number)
TRP
(%)
Affinity
(%)
RU
(%)
RU
(number)
PV
(%)
PV
(number)
Telephone line connection 4.63 34 733 10.30 7.05 726 913 215.57 95.67 5.77 392 826 5.49 431 945 367
Mobile phone connection 1.13 8 514 7.02 0.55 56 773 46.82 65.22 1.28 87 065 1.49 117 345 410
Broad band connection 35.14 263 697 10.41 31.68 3 263 861 128.90 96.73 36.27 2 470 174 35.78 2 813 855 283
I don’t know 0.97 7 264 7.05 0.86 88 864 86.29 65.52 2.22 151 104 3.38 265 871 267
I don’t have Internet at home 0.00 0 - 0.00 0 - - 0.00 0 0.00 0
Not asked 58.13 436 285 11.25 59.86 6 167 794 159.07 104.51 54.47 3 709 526 53.86 4 236 174 647
Source: NetMonitor – SPIR – Gemius & Mediaresearch, November 2014
Chart 15: Connection from Home by RU(%)
0 % 50 % 100 %
Telephone line connection 56
Mobile phone connection 11
Broad band connection3536
I don’t know12
I don’t have Internet at home00
Not asked58
54
Medium Total
Source: NetMonitor – SPIR – Gemius & Mediaresearch, November 2014
-16-
ihned.cz
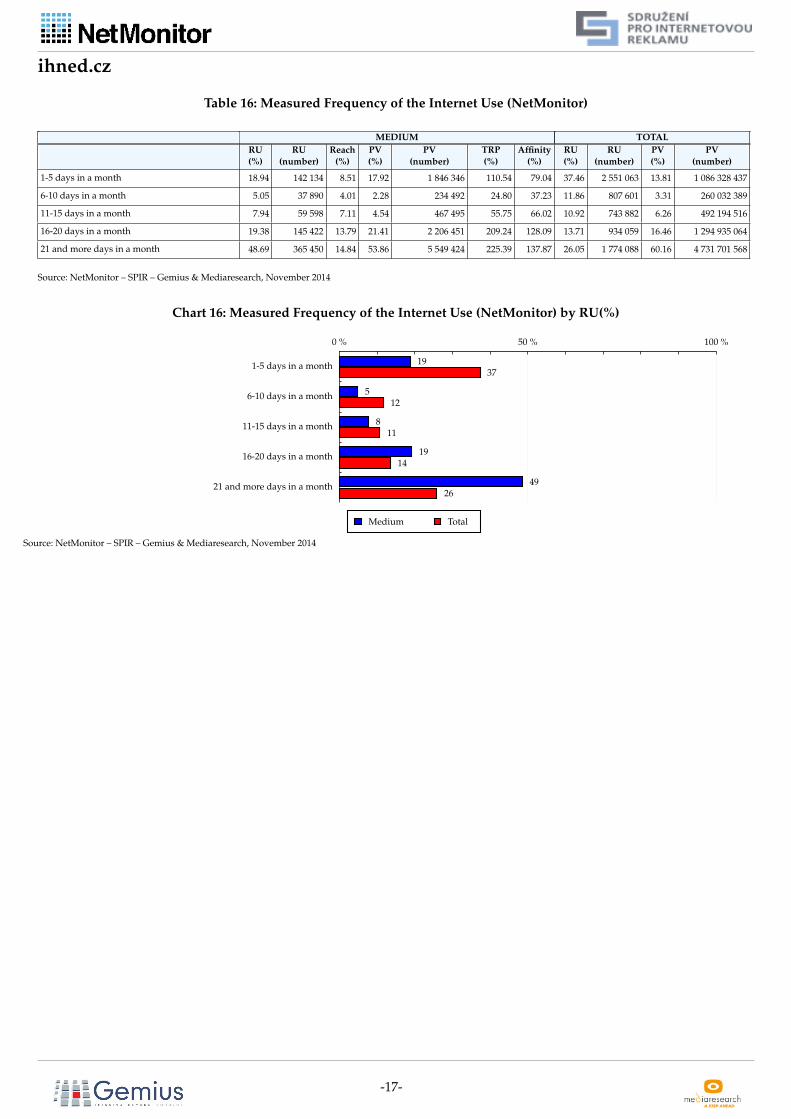
Table 16: Measured Frequency of the Internet Use (NetMonitor)
MEDIUM TOTAL
RU
(%)
RU
(number)
Reach
(%)
PV
(%)
PV
(number)
TRP
(%)
Affinity
(%)
RU
(%)
RU
(number)
PV
(%)
PV
(number)
1-5 days in a month 18.94 142 134 8.51 17.92 1 846 346 110.54 79.04 37.46 2 551 063 13.81 1 086 328 437
6-10 days in a month 5.05 37 890 4.01 2.28 234 492 24.80 37.23 11.86 807 601 3.31 260 032 389
11-15 days in a month 7.94 59 598 7.11 4.54 467 495 55.75 66.02 10.92 743 882 6.26 492 194 516
16-20 days in a month 19.38 145 422 13.79 21.41 2 206 451 209.24 128.09 13.71 934 059 16.46 1 294 935 064
21 and more days in a month 48.69 365 450 14.84 53.86 5 549 424 225.39 137.87 26.05 1 774 088 60.16 4 731 701 568
Source: NetMonitor – SPIR – Gemius & Mediaresearch, November 2014
Chart 16: Measured Frequency of the Internet Use (NetMonitor) by RU(%)
0 % 50 % 100 %
1-5 days in a month 1937
6-10 days in a month 512
11-15 days in a month 811
16-20 days in a month 1914
21 and more days in a month 4926
Medium Total
Source: NetMonitor – SPIR – Gemius & Mediaresearch, November 2014
-17-
ihned.cz
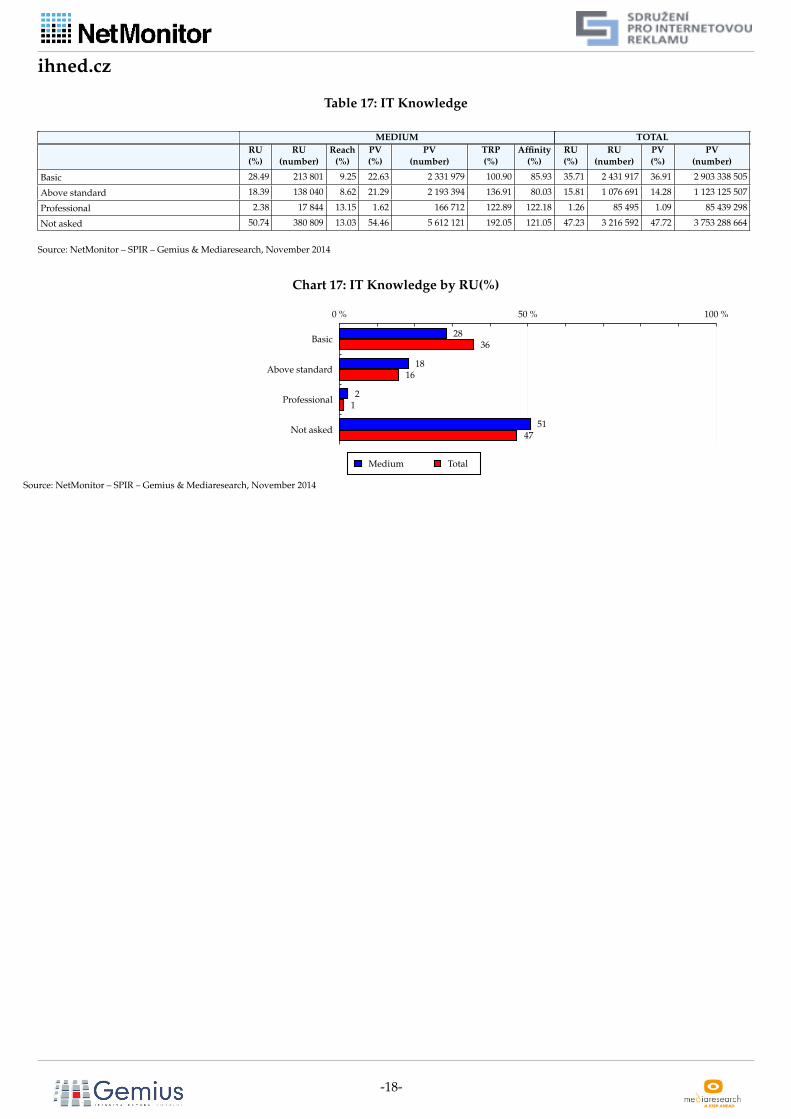
Table 17: IT Knowledge
MEDIUM TOTAL
RU
(%)
RU
(number)
Reach
(%)
PV
(%)
PV
(number)
TRP
(%)
Affinity
(%)
RU
(%)
RU
(number)
PV
(%)
PV
(number)
Basic 28.49 213 801 9.25 22.63 2 331 979 100.90 85.93 35.71 2 431 917 36.91 2 903 338 505
Above standard 18.39 138 040 8.62 21.29 2 193 394 136.91 80.03 15.81 1 076 691 14.28 1 123 125 507
Professional 2.38 17 844 13.15 1.62 166 712 122.89 122.18 1.26 85 495 1.09 85 439 298
Not asked 50.74 380 809 13.03 54.46 5 612 121 192.05 121.05 47.23 3 216 592 47.72 3 753 288 664
Source: NetMonitor – SPIR – Gemius & Mediaresearch, November 2014
Chart 17: IT Knowledge by RU(%)
0 % 50 % 100 %
Basic28
36
Above standard18
16
Professional21
Not asked51
47
Medium Total
Source: NetMonitor – SPIR – Gemius & Mediaresearch, November 2014
-18-
ihned.cz
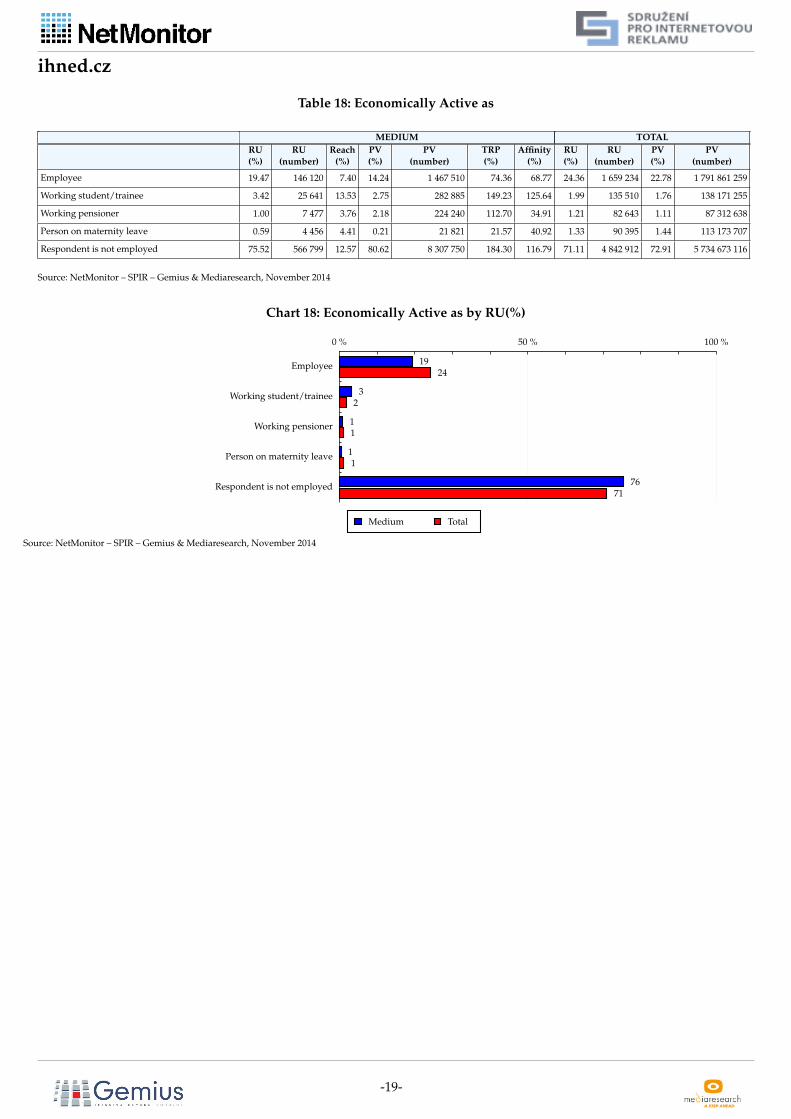
Table 18: Economically Active as
MEDIUM TOTAL
RU
(%)
RU
(number)
Reach
(%)
PV
(%)
PV
(number)
TRP
(%)
Affinity
(%)
RU
(%)
RU
(number)
PV
(%)
PV
(number)
Employee 19.47 146 120 7.40 14.24 1 467 510 74.36 68.77 24.36 1 659 234 22.78 1 791 861 259
Working student/trainee 3.42 25 641 13.53 2.75 282 885 149.23 125.64 1.99 135 510 1.76 138 171 255
Working pensioner 1.00 7 477 3.76 2.18 224 240 112.70 34.91 1.21 82 643 1.11 87 312 638
Person on maternity leave 0.59 4 456 4.41 0.21 21 821 21.57 40.92 1.33 90 395 1.44 113 173 707
Respondent is not employed 75.52 566 799 12.57 80.62 8 307 750 184.30 116.79 71.11 4 842 912 72.91 5 734 673 116
Source: NetMonitor – SPIR – Gemius & Mediaresearch, November 2014
Chart 18: Economically Active as by RU(%)
0 % 50 % 100 %
Employee 1924
Working student/trainee 32
Working pensioner 11
Person on maternity leave 11
Respondent is not employed 7671
Medium Total
Source: NetMonitor – SPIR – Gemius & Mediaresearch, November 2014
-19-
ihned.cz
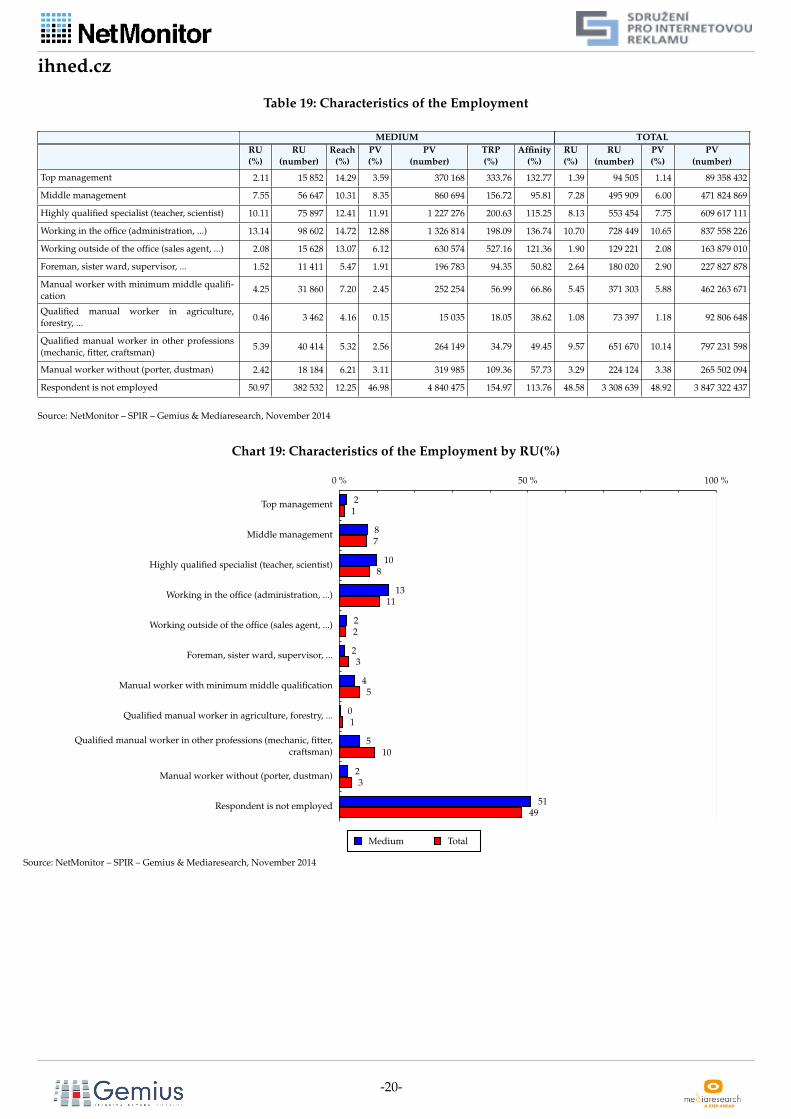
Table 19: Characteristics of the Employment
MEDIUM TOTAL
RU
(%)
RU
(number)
Reach
(%)
PV
(%)
PV
(number)
TRP
(%)
Affinity
(%)
RU
(%)
RU
(number)
PV
(%)
PV
(number)
Top management 2.11 15 852 14.29 3.59 370 168 333.76 132.77 1.39 94 505 1.14 89 358 432
Middle management 7.55 56 647 10.31 8.35 860 694 156.72 95.81 7.28 495 909 6.00 471 824 869
Highly qualified specialist (teacher, scientist) 10.11 75 897 12.41 11.91 1 227 276 200.63 115.25 8.13 553 454 7.75 609 617 111
Working in the office (administration, ...) 13.14 98 602 14.72 12.88 1 326 814 198.09 136.74 10.70 728 449 10.65 837 558 226
Working outside of the office (sales agent, ...) 2.08 15 628 13.07 6.12 630 574 527.16 121.36 1.90 129 221 2.08 163 879 010
Foreman, sister ward, supervisor, ... 1.52 11 411 5.47 1.91 196 783 94.35 50.82 2.64 180 020 2.90 227 827 878
Manual worker with minimum middle qualifi-cation
4.25 31 860 7.20 2.45 252 254 56.99 66.86 5.45 371 303 5.88 462 263 671
Qualified manual worker in agriculture,forestry, ...
0.46 3 462 4.16 0.15 15 035 18.05 38.62 1.08 73 397 1.18 92 806 648
Qualified manual worker in other professions(mechanic, fitter, craftsman)
5.39 40 414 5.32 2.56 264 149 34.79 49.45 9.57 651 670 10.14 797 231 598
Manual worker without (porter, dustman) 2.42 18 184 6.21 3.11 319 985 109.36 57.73 3.29 224 124 3.38 265 502 094
Respondent is not employed 50.97 382 532 12.25 46.98 4 840 475 154.97 113.76 48.58 3 308 639 48.92 3 847 322 437
Source: NetMonitor – SPIR – Gemius & Mediaresearch, November 2014
Chart 19: Characteristics of the Employment by RU(%)
0 % 50 % 100 %
Top management 21
Middle management 87
Highly qualified specialist (teacher, scientist) 108
Working in the office (administration, ...) 1311
Working outside of the office (sales agent, ...) 22
Foreman, sister ward, supervisor, ... 23
Manual worker with minimum middle qualification 45
Qualified manual worker in agriculture, forestry, ... 01
Qualified manual worker in other professions (mechanic, fitter,craftsman)
510
Manual worker without (porter, dustman) 23
Respondent is not employed 5149
Medium Total
Source: NetMonitor – SPIR – Gemius & Mediaresearch, November 2014
-20-
ihned.cz
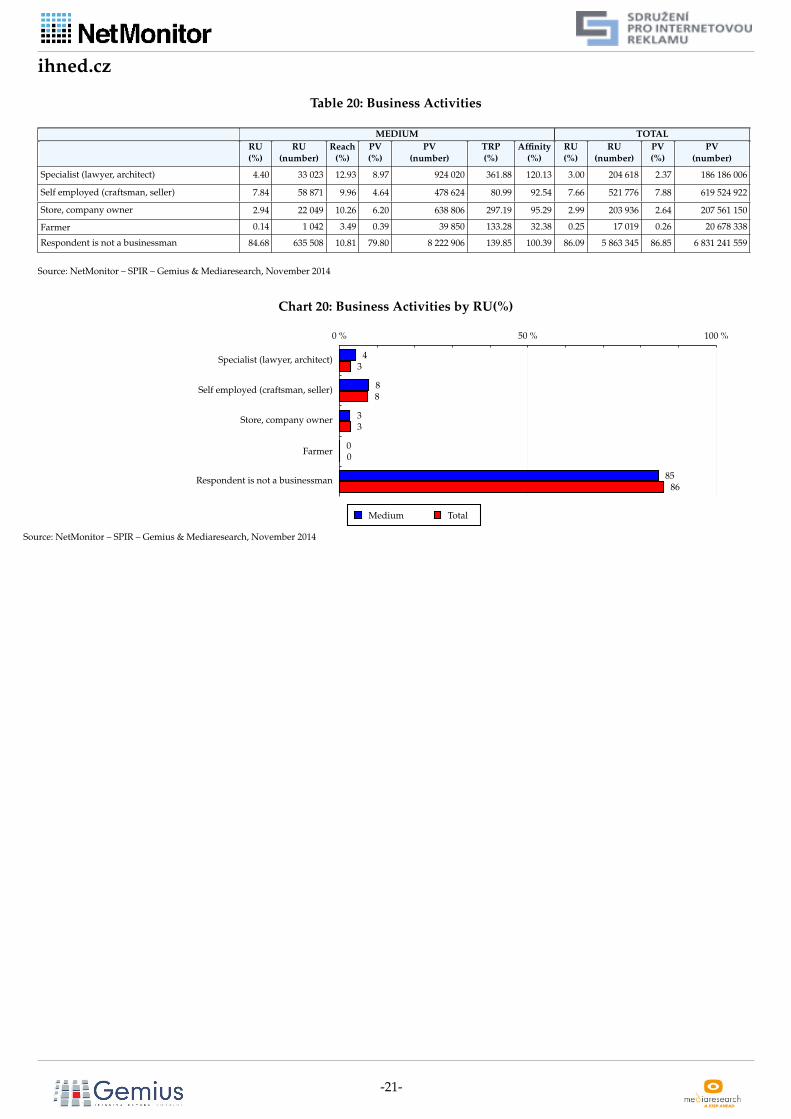
Table 20: Business Activities
MEDIUM TOTAL
RU
(%)
RU
(number)
Reach
(%)
PV
(%)
PV
(number)
TRP
(%)
Affinity
(%)
RU
(%)
RU
(number)
PV
(%)
PV
(number)
Specialist (lawyer, architect) 4.40 33 023 12.93 8.97 924 020 361.88 120.13 3.00 204 618 2.37 186 186 006
Self employed (craftsman, seller) 7.84 58 871 9.96 4.64 478 624 80.99 92.54 7.66 521 776 7.88 619 524 922
Store, company owner 2.94 22 049 10.26 6.20 638 806 297.19 95.29 2.99 203 936 2.64 207 561 150
Farmer 0.14 1 042 3.49 0.39 39 850 133.28 32.38 0.25 17 019 0.26 20 678 338
Respondent is not a businessman 84.68 635 508 10.81 79.80 8 222 906 139.85 100.39 86.09 5 863 345 86.85 6 831 241 559
Source: NetMonitor – SPIR – Gemius & Mediaresearch, November 2014
Chart 20: Business Activities by RU(%)
0 % 50 % 100 %
Specialist (lawyer, architect) 43
Self employed (craftsman, seller) 88
Store, company owner 33
Farmer00
Respondent is not a businessman 8586
Medium Total
Source: NetMonitor – SPIR – Gemius & Mediaresearch, November 2014
-21-
ihned.cz
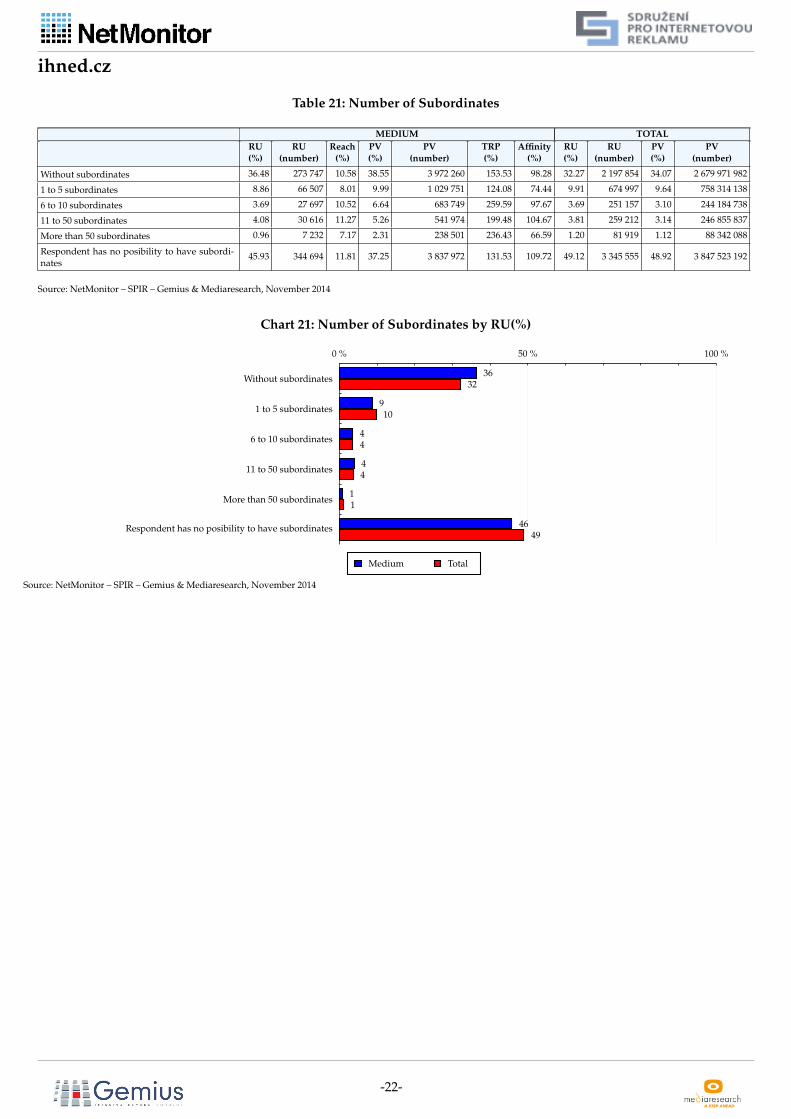
Table 21: Number of Subordinates
MEDIUM TOTAL
RU
(%)
RU
(number)
Reach
(%)
PV
(%)
PV
(number)
TRP
(%)
Affinity
(%)
RU
(%)
RU
(number)
PV
(%)
PV
(number)
Without subordinates 36.48 273 747 10.58 38.55 3 972 260 153.53 98.28 32.27 2 197 854 34.07 2 679 971 982
1 to 5 subordinates 8.86 66 507 8.01 9.99 1 029 751 124.08 74.44 9.91 674 997 9.64 758 314 138
6 to 10 subordinates 3.69 27 697 10.52 6.64 683 749 259.59 97.67 3.69 251 157 3.10 244 184 738
11 to 50 subordinates 4.08 30 616 11.27 5.26 541 974 199.48 104.67 3.81 259 212 3.14 246 855 837
More than 50 subordinates 0.96 7 232 7.17 2.31 238 501 236.43 66.59 1.20 81 919 1.12 88 342 088
Respondent has no posibility to have subordi-nates
45.93 344 694 11.81 37.25 3 837 972 131.53 109.72 49.12 3 345 555 48.92 3 847 523 192
Source: NetMonitor – SPIR – Gemius & Mediaresearch, November 2014
Chart 21: Number of Subordinates by RU(%)
0 % 50 % 100 %
Without subordinates36
32
1 to 5 subordinates910
6 to 10 subordinates44
11 to 50 subordinates44
More than 50 subordinates11
Respondent has no posibility to have subordinates 4649
Medium Total
Source: NetMonitor – SPIR – Gemius & Mediaresearch, November 2014
-22-
ihned.cz
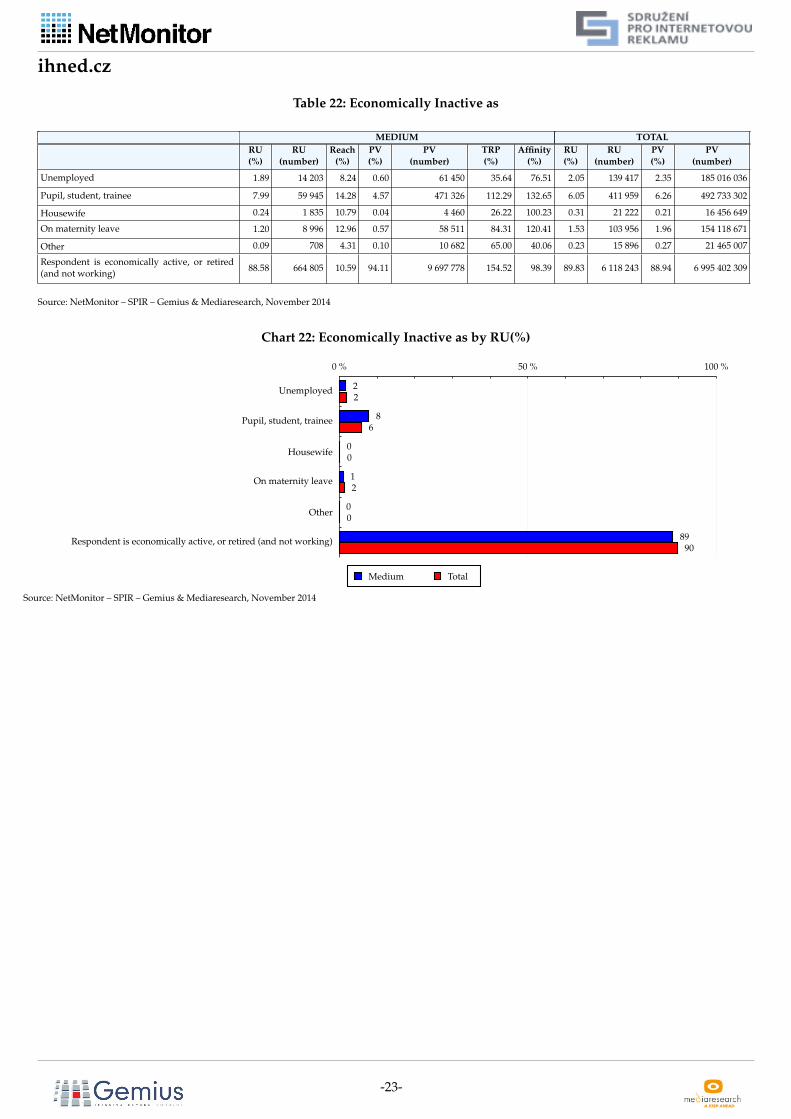
Table 22: Economically Inactive as
MEDIUM TOTAL
RU
(%)
RU
(number)
Reach
(%)
PV
(%)
PV
(number)
TRP
(%)
Affinity
(%)
RU
(%)
RU
(number)
PV
(%)
PV
(number)
Unemployed 1.89 14 203 8.24 0.60 61 450 35.64 76.51 2.05 139 417 2.35 185 016 036
Pupil, student, trainee 7.99 59 945 14.28 4.57 471 326 112.29 132.65 6.05 411 959 6.26 492 733 302
Housewife 0.24 1 835 10.79 0.04 4 460 26.22 100.23 0.31 21 222 0.21 16 456 649
On maternity leave 1.20 8 996 12.96 0.57 58 511 84.31 120.41 1.53 103 956 1.96 154 118 671
Other 0.09 708 4.31 0.10 10 682 65.00 40.06 0.23 15 896 0.27 21 465 007
Respondent is economically active, or retired(and not working)
88.58 664 805 10.59 94.11 9 697 778 154.52 98.39 89.83 6 118 243 88.94 6 995 402 309
Source: NetMonitor – SPIR – Gemius & Mediaresearch, November 2014
Chart 22: Economically Inactive as by RU(%)
0 % 50 % 100 %
Unemployed 22
Pupil, student, trainee 86
Housewife00
On maternity leave 12
Other00
Respondent is economically active, or retired (and not working) 8990
Medium Total
Source: NetMonitor – SPIR – Gemius & Mediaresearch, November 2014
-23-
ihned.cz
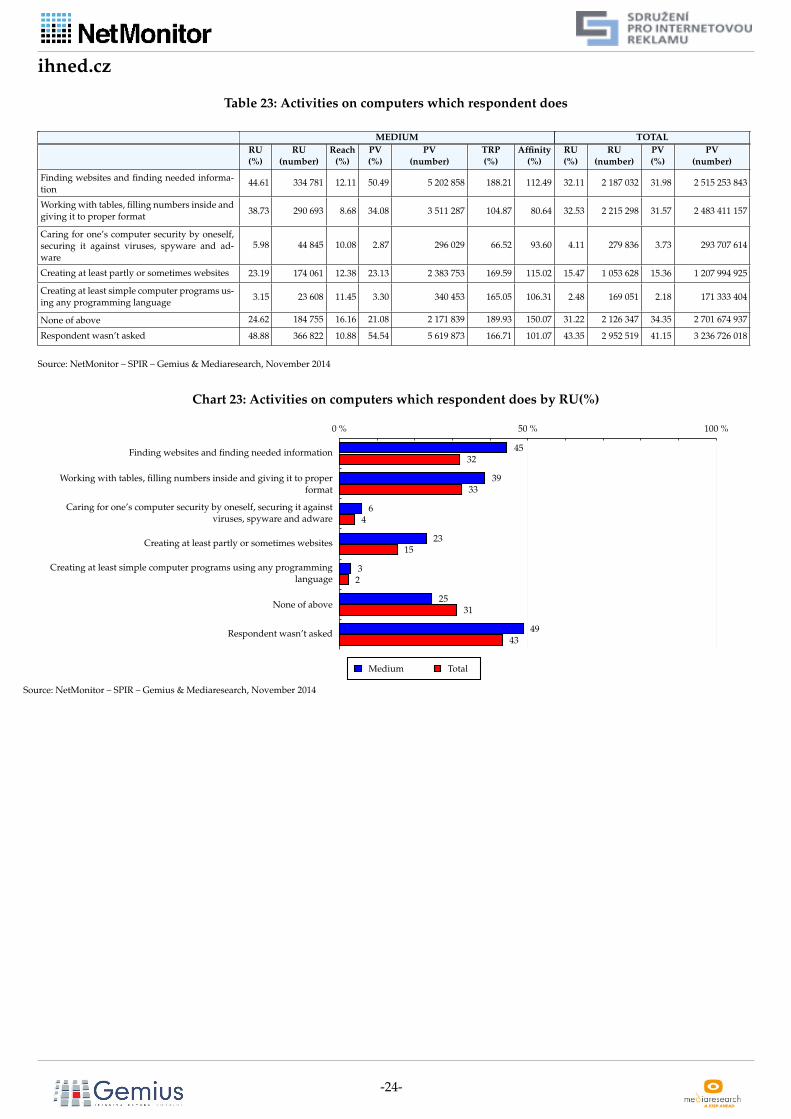
Table 23: Activities on computers which respondent does
MEDIUM TOTAL
RU
(%)
RU
(number)
Reach
(%)
PV
(%)
PV
(number)
TRP
(%)
Affinity
(%)
RU
(%)
RU
(number)
PV
(%)
PV
(number)
Finding websites and finding needed informa-tion
44.61 334 781 12.11 50.49 5 202 858 188.21 112.49 32.11 2 187 032 31.98 2 515 253 843
Working with tables, filling numbers inside andgiving it to proper format
38.73 290 693 8.68 34.08 3 511 287 104.87 80.64 32.53 2 215 298 31.57 2 483 411 157
Caring for one’s computer security by oneself,securing it against viruses, spyware and ad-ware
5.98 44 845 10.08 2.87 296 029 66.52 93.60 4.11 279 836 3.73 293 707 614
Creating at least partly or sometimes websites 23.19 174 061 12.38 23.13 2 383 753 169.59 115.02 15.47 1 053 628 15.36 1 207 994 925
Creating at least simple computer programs us-ing any programming language
3.15 23 608 11.45 3.30 340 453 165.05 106.31 2.48 169 051 2.18 171 333 404
None of above 24.62 184 755 16.16 21.08 2 171 839 189.93 150.07 31.22 2 126 347 34.35 2 701 674 937
Respondent wasn’t asked 48.88 366 822 10.88 54.54 5 619 873 166.71 101.07 43.35 2 952 519 41.15 3 236 726 018
Source: NetMonitor – SPIR – Gemius & Mediaresearch, November 2014
Chart 23: Activities on computers which respondent does by RU(%)
0 % 50 % 100 %
Finding websites and finding needed information 4532
Working with tables, filling numbers inside and giving it to properformat
3933
Caring for one’s computer security by oneself, securing it againstviruses, spyware and adware
64
Creating at least partly or sometimes websites 2315
Creating at least simple computer programs using any programminglanguage
32
None of above25
31
Respondent wasn’t asked 4943
Medium Total
Source: NetMonitor – SPIR – Gemius & Mediaresearch, November 2014
-24-
ihned.cz
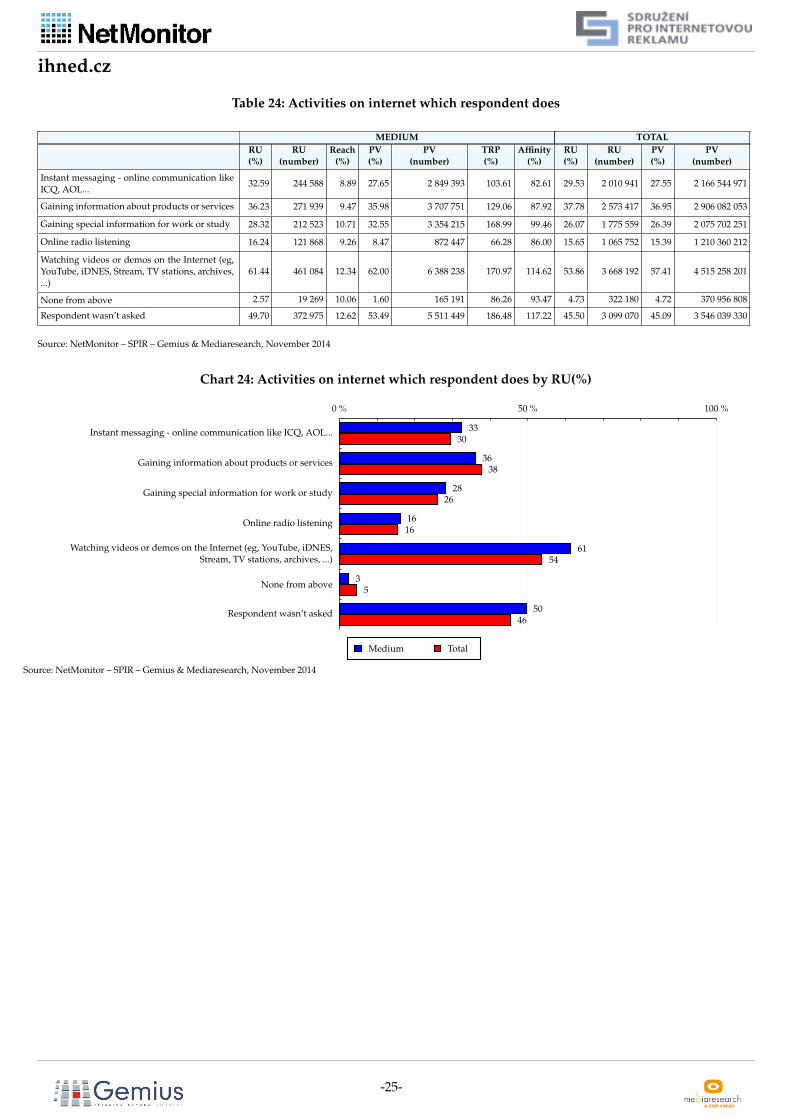
Table 24: Activities on internet which respondent does
MEDIUM TOTAL
RU
(%)
RU
(number)
Reach
(%)
PV
(%)
PV
(number)
TRP
(%)
Affinity
(%)
RU
(%)
RU
(number)
PV
(%)
PV
(number)
Instant messaging - online communication likeICQ, AOL...
32.59 244 588 8.89 27.65 2 849 393 103.61 82.61 29.53 2 010 941 27.55 2 166 544 971
Gaining information about products or services 36.23 271 939 9.47 35.98 3 707 751 129.06 87.92 37.78 2 573 417 36.95 2 906 082 053
Gaining special information for work or study 28.32 212 523 10.71 32.55 3 354 215 168.99 99.46 26.07 1 775 559 26.39 2 075 702 251
Online radio listening 16.24 121 868 9.26 8.47 872 447 66.28 86.00 15.65 1 065 752 15.39 1 210 360 212
Watching videos or demos on the Internet (eg,YouTube, iDNES, Stream, TV stations, archives,...)
61.44 461 084 12.34 62.00 6 388 238 170.97 114.62 53.86 3 668 192 57.41 4 515 258 201
None from above 2.57 19 269 10.06 1.60 165 191 86.26 93.47 4.73 322 180 4.72 370 956 808
Respondent wasn’t asked 49.70 372 975 12.62 53.49 5 511 449 186.48 117.22 45.50 3 099 070 45.09 3 546 039 330
Source: NetMonitor – SPIR – Gemius & Mediaresearch, November 2014
Chart 24: Activities on internet which respondent does by RU(%)
0 % 50 % 100 %
Instant messaging - online communication like ICQ, AOL... 3330
Gaining information about products or services 3638
Gaining special information for work or study 2826
Online radio listening 1616
Watching videos or demos on the Internet (eg, YouTube, iDNES,Stream, TV stations, archives, ...)
6154
None from above35
Respondent wasn’t asked 5046
Medium Total
Source: NetMonitor – SPIR – Gemius & Mediaresearch, November 2014
-25-
ihned.cz
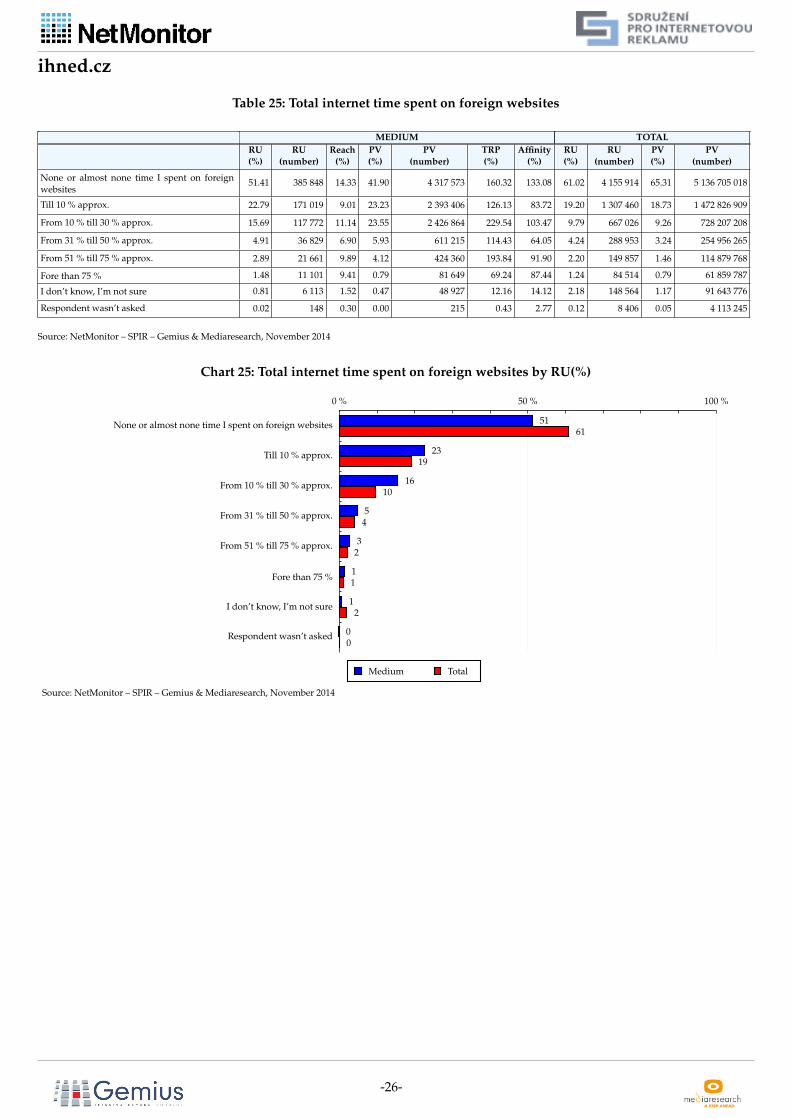
Table 25: Total internet time spent on foreign websites
MEDIUM TOTAL
RU
(%)
RU
(number)
Reach
(%)
PV
(%)
PV
(number)
TRP
(%)
Affinity
(%)
RU
(%)
RU
(number)
PV
(%)
PV
(number)
None or almost none time I spent on foreignwebsites
51.41 385 848 14.33 41.90 4 317 573 160.32 133.08 61.02 4 155 914 65.31 5 136 705 018
Till 10 % approx. 22.79 171 019 9.01 23.23 2 393 406 126.13 83.72 19.20 1 307 460 18.73 1 472 826 909
From 10 % till 30 % approx. 15.69 117 772 11.14 23.55 2 426 864 229.54 103.47 9.79 667 026 9.26 728 207 208
From 31 % till 50 % approx. 4.91 36 829 6.90 5.93 611 215 114.43 64.05 4.24 288 953 3.24 254 956 265
From 51 % till 75 % approx. 2.89 21 661 9.89 4.12 424 360 193.84 91.90 2.20 149 857 1.46 114 879 768
Fore than 75 % 1.48 11 101 9.41 0.79 81 649 69.24 87.44 1.24 84 514 0.79 61 859 787
I don’t know, I’m not sure 0.81 6 113 1.52 0.47 48 927 12.16 14.12 2.18 148 564 1.17 91 643 776
Respondent wasn’t asked 0.02 148 0.30 0.00 215 0.43 2.77 0.12 8 406 0.05 4 113 245
Source: NetMonitor – SPIR – Gemius & Mediaresearch, November 2014
Chart 25: Total internet time spent on foreign websites by RU(%)
0 % 50 % 100 %
None or almost none time I spent on foreign websites 5161
Till 10 % approx. 2319
From 10 % till 30 % approx. 1610
From 31 % till 50 % approx. 54
From 51 % till 75 % approx. 32
Fore than 75 %11
I don’t know, I’m not sure 12
Respondent wasn’t asked 00
Medium Total
Source: NetMonitor – SPIR – Gemius & Mediaresearch, November 2014
-26-
THE KEY
Below mentioned term "target group" (given target group, chosen target group, chosen TG) is being used here as a target group given ina table line (or column of graph) of a given sociodemographic indicator, i.e. target group "women", "Liberec region", "Retired", etc. Thetarget group "All" is defined as Persons in the age of 10+ that have visited Internet at least once in the last month.
MEDIUM:
RU(number) – a number of visitors (real users) from the respective target group of a chosen medium
RU(%) – structure of visitorsInformation on the visitors profile of a chosen medium – in the form of proportional spreading of Internet users (according to Reach)among individual target groupsRU(%) = RU(number)(medium)(chosen TG)/RU(number)(medium)(TG All)*100
Reach(%) – proportion of the number of the medium visitors from the respective target group to the size of this target groupReach(%)(CS) = RU(number)(medium)(TG)/size of TG(number)*100
PV(number) – number of page views generated in the medium by users from a respective target group
PV(%) – structure of page viewsInformation on the visitors profile of a chosen medium – in the form of proportional spreading of Internet users (according to page views)among individual target groupsPV(%) = PV(number)(medium) (chosen TG)/PV(number)(medium)(TG All)*100
TRP(%) – Target Rating PointsGross rating of a given target group on a chosen mediumTRP(%) = PV(number)(medium)/ size of TG(number)*100(similarly is defined indicator GRP(%) Gross Rating Points, the difference is that as target group all population is considered, target groupAll)
Affinity(%) – affinity of reachCoefficient expressing the relationship between the audience of a chosen medium and the audience of all measured mediumAffinity(%) = Reach(%)(medium)(chosen TG)/Reach(%)(medium)(TG All)
TOTAL:
Total RU(number) – a number of visitors (real users) from the respective target group of all measured medium
Total RU(%) – structure of visitors, i.e. information on the total Reach profile for all measured mediumInformation on the visitors profile of all measured medium – in the form of proportional spreading of Internet users (according to Reach)among individual target groupsRU(%) = RU(number)(all medium)(chosen TG) /RU(number)(all medium)(TG All)*100
Total PV(number) – number of page views generated on all measured medium by users from a respective target group
Total PV(%) – structure of visitors, i.e. information on the profile of page views in total for all measured mediumInformation on the visitors profile of all measured medium – in the form of proportional spreading of Internet users (according to pageviews) among individual target groups.PV(%) = PV(number)(all medium)(chosen TG) /PV(number)(all media)(TG All)*100
Question on IT knowledge
Basic – persons, which declare basic computer and Internet knowledge (e.g. writing basic text, saving files, electronic mail, surfingwebsites, etc
Above standard – persons, which declare above standard computer and Internet knowledge (e.g. using mathematical functions in a tablecalculator, creating graphical presentations, work with search engines, databases on the users level, etc.)
Professional – IT professionals (e.g. administrators or coders)
-27-
ABCDE classification
ABCDE classification enables evaluation of social and economical status of an individual in the society. Usually it is calculated for thehead of a household. Considering the particularity of Internet questioning a method of direct calculation for individual respondentshas been adopted. The methodological committee has been working on the ABCDE classification update with representatives of theresearch agencies, media agencies and public professionals resulting in the suggestion of the scale A,B,C1,C2,D,E1,E2,E3. This scalecorrespondswith the international standard accredited by ESOMAR and also the algorithm of the individual’s categorization correspondswith the international customs. ABCDE classification divides household individuals into social categories based on economical status(economically active x inactive individual). For economically active it then divides entrepreneur and employee. The place at work thenserves to further differentiation (including possible number of subordinates for managing positions). The education of the examinedperson has the influence on the final categorization for all aroused classes. Based on the ESOMAR standards for economically inactivepeople we do not proceed according to their last employment but the level of the economic strength measured through the householdfacilities. The education influence is present here as well. Owing to the fact that the international procedure corresponds to the Europeanlevels, the social structure of the Czech population comes out worse than it used to for the current ABCD classification. Nevertheless thisstructure enables us to conduct comparisons within Europe. Still the committee has decided that for using it within the Czech Republic,the scale will be adjusted to take into account the specifics of the Czech Republic. This adjusted scale results from the European standardby shifting one or two classes up or down based on the subsistence index of the examined person’s household.A – The group with the highest social status in the society given by a very prestigious employment and highest income at the same time.B – The group with outstanding income, usually higher management and the group of higher specialists with minimum secondaryeducation.C1, C2 – The group with average living standard and average income, e.g. small businessmen, self employees, technicians, officers andlower specialists.D – The group with average and slightly below-average living standard, e.g. qualified manual workers.E1, E2, E3 – The group characterised with below-average living standard predominantly with inactive individuals, i.e. unemployed,retired or not qualified workers.
Questions on the economic activity and employment:
These questions (18, 19, 20, 21 a 22) have been used (apart the others) mainly to set up the ABCDE classification. Based on the respondent’sanswer to question 8 (Economic activity), he/she is then questioned by a group of specific questions. Question 8 is hence used a filterto put further questions. Thus not each respondent is asked the above mentioned five questions. Therefore for the opportunity of targetgroups creation within the whole population the segmentation of single answers to this question is supplemented with the group ofrespondents that haven’t been asked this question. So for instance at question 20 "Business activities" this group is called "Respondent isnot a businessman".
-28-