Embed Size (px)
Citation preview

1
Sponsor Risk and the Performance of Asset-backed Securities
Oliver Faltin-Traeger Blackrock, Inc.
Kathleen W. Johnson
Board of Governors of the Federal Reserve System
Christopher Mayer Columbia Business School & NBER
Visiting Scholar, Federal Reserve Bank of New York
June 2011
The opinions, analysis and conclusions of this paper are those of the authors and do not necessarily reflect those of BlackRock, Inc. or its employees, the Board of Governors of the Federal Reserve System, the Federal Reserve Bank of NY or their Staffs. The authors wish to thank Robert Hodrick, Emi Nakamura, Doron Nissim, and seminar participants at Columbia Business School, the Federal Reserve Board, UCLA, and Washington University for helpful comments, and Meredith Richman for excellent research assistance.
2
ABSTRACT
Asset-backed securitization transforms assets into securities and in the process separates
the credit risk of a pool of assets from the credit risk of the securitization’s sponsor, which gives
securitization several important advantages over issuing corporate debt. Recent research,
however, suggests a link between the financial condition of the sponsor and the performance of
its ABS. If market participants do not fully understand the link between the sponsor’s financial
condition and the future performance of its ABS, rating agencies may improperly rate these
securities, investors may improperly price the risk of these securities, and regulators may require
inadequate capital against potential losses in these securities. The results presented in this paper
suggest a strong link between the financial condition of the sponsor and the subsequent
performance of the securitization. Securities sponsored by a higher-rated sponsor retain their
initial rating longer before being downgraded than securities sponsored by a lower-rated sponsor.
Securities sponsored by better capitalized, more diversified, or vertically integrated firms also
perform better. Finally, securities sponsored by banks tend to be downgraded later than ABS
sponsored by foreign banks or by nonbanks. Importantly, we find many of these relationships
existed in ABS issued well before the financial crisis.

3
I. INTRODUCTION
Asset-backed securitization transforms assets such as loans into securities and in the
process separates the credit risk of a pool of assets from the credit risk of the securitization’s
sponsor. Because securitization separates these risks, it has several important advantages over
issuing corporate debt. First, in the event of a sponsor bankruptcy, the sponsor’s creditors
generally cannot claim the pool of assets backing the asset-backed securities (ABS). Second,
ABS investors who have stopped receiving coupon payments can usually access the collateral
without going through the bankruptcy process. Third, the rating on the top ABS tranches can
exceed the corporate rating of the sponsor because investors in these tranches hold the first claim
on the cash flow generated by the assets. In our sample of more than 110,000 ABS issued in the
last two decades, only about 1.3 percent were sponsored by a firm rated AAA by Standard &
Poor’s (S&P), yet almost 60 percent of ABS representing 92 percent of the dollar value of the
ABS were rated AAA (Tables 2 and 4). Because of these advantages, many lenders raised funds
more cheaply through securitization than through issuing corporate debt.
Securitization reduced funding costs for a wide variety of lenders and increased
competition in sectors that had once been dominated by banks or credit unions. Non-bank
entities such as Ford Motor Credit, GMAC, Countrywide, or New Century Financial Corporation
sponsored many early securitizations. Between 1999 and 2008, non-banking entities such as
finance companies, investment banks, and insurance companies sponsored more than one-half of
all securitizations rated by S&P.1 In addition, securitization enabled foreign banks to enter the
large and fast-growing US lending markets without raising deposits locally, which is a slow
process that involves building local branches and introducing their own brand names to
consumers. For example, foreign banks such as HSBC, Nomura, and Credit Suisse quickly
became large players in the US residential and commercial mortgage markets. While foreign
lenders sponsored only five percent of securitizations in 1999, they sponsored about one-quarter
of securitizations by 2004 (Table 6). In addition, specialized regional banks such as Indy Mac
and Golden West used securitization to grow their mortgage lending businesses far faster than
1 The reliance on securitization later created problems for some sponsors of these specialized lenders. For example, GMAC was initially created to provide auto loans for purchasers of General Motors cars. However, the enhanced access to credit through securitization may have allowed GMAC to expand to commercial and subprime mortgages. When the subprime mortgage market collapsed, problems at GMAC made it much harder for buyers of GM cars to obtain credit relative to buyers from rivals Toyota, Chrysler, and Ford, whose specialized lenders did not significantly expand beyond their primary purpose of providing auto loans.
4
they could have using traditional deposits. Dodd (2007), Mason and Rosner (2007), and
Brunnermeier (2009) discuss this trend towards the “originate to distribute” model and its
implications for lending standards.
Because securitizations purportedly separated the credit risk of the pool of assets from
that of the sponsor, investors, regulators, and rating agencies focused on the quality of the pool
rather than the financial condition of the sponsor as the key determinant of a security’s
performance and treated these securities accordingly. Recent research, however, suggests a link
between the financial condition of the sponsor and the performance of its sponsored ABS. For
example, Moody’s Investor Service (2006) concluded that lower-rated sponsors are associated
with higher ABS spreads and weaker credit performance. Gorton and Souleles (2006) found that
credit card backed securities sponsored by riskier sponsors (as measured by the sponsor’s bond
rating) command higher yields, suggesting that the market recognizes sponsor risk as
determinant of security risk. Similarly, Adelino (2009) shows that all else equal higher-yielding
ABS are downgraded more quickly than lower-yielding ABS. In addition, Downing, Jaffee, and
Wallace (2009) find that some residential mortgage-backed securities trade in a market for
lemons in which originators use private information to determine which mortgage pools to
securitize, implying that originators are able to influence the future performance of securities
through their choice of pools to securitize.
If market participants do not fully understand the link between the financial condition of
the sponsor and the future performance of its sponsored ABS, rating agencies may improperly
rate these securities, which may lead some investors to purchase securities that they would not
have otherwise purchased. Investors may also improperly price the risk of these securities,
which may lead to lower returns than had been expected. Finally, regulators may require
inadequate capital against potential losses in these securities, which may lead to more financial
distress among regulated institutions than is desired.
In this paper, we examine the relationship between a broad array of characteristics of the
sponsor at the time of the securitization and the subsequent performance of their sponsored ABS.
To do this, we constructed a database of information on public, domestic, asset-backed
securitizations that closed between 1995 and 2008. We began with a dataset from ABSNet of
security characteristics, including underlying asset type, issuance date, initial rating and the date
of any subsequent upgrade or downgrade. We linked each security’s characteristics with its

5
sponsor’s characteristics by identifying the parent company of the listed sponsor through
individual internet and database searches and merging in the parent’s S&P issuer credit rating at
the time of deal closing. In addition to credit rating, we categorized sponsors by type of financial
institution using data from the National Information Center (NIC) and North American Industrial
Classification System (NAICS) classifications. Finally, we collected data on insider sales of the
sponsor’s stock from the Thomson Financial Insider Filings (TFIF) database.
Our results suggest a strong link between the financial condition of the sponsor and the
subsequent performance of the securitization. Securities sponsored by a higher-rated sponsor
retain their initial rating longer before being downgraded than securities sponsored by a lower-
rated sponsor. Securities sponsored by better capitalized, more diversified, or vertically
integrated firms also perform better. Finally, securities sponsored by banks tend to be
downgraded later than ABS sponsored by foreign banks or by nonbanks. Importantly, we find
that many of these relationships existed in ABS issued well before the financial crisis.
In a closely related paper, Titman and Tsyplakov (2010) examined the role of originators
in the future performance of commercial mortgages underlying CMBS and find that mortgages
originated by institutions with large negative stock returns prior to origination tend to have
higher credit spreads and default rates. These mortgages also tend to perform worse ex post and
are sold into CMBS more quickly. Titman and Tsyplakov’s results are most comparable to the
results in this paper in cases where the originator also sponsors the securitization. That said, our
paper finds that characteristics beyond stock performance matter and expands upon Titman and
Tsyplakov by finding an effect of sponsor characteristics in a broader array of asset types.
The next section describes how we constructed the dataset used for the analysis, while the
subsequent section describes the econometric model and presents our main results, as well as
some robustness tests. A brief discussion follows.
II. DATA
Lewtan Technologies’ ABSNet securitization database is the basis of our analysis dataset
and provides information on public, domestic, asset-backed securitizations that closed between
1995 and 2008.2 The ABSNet database records important characteristics of the securities such as
2 Some securitizations are treated as private, where information on the underlying securitization and their ratings are only available to a very restricted group of actual and potential investors. This private structure was particularly
6
the type of asset underlying the securities, the initial rating of the security, the date of the
security’s issuance, and the date of any subsequent upgrade or downgrade.
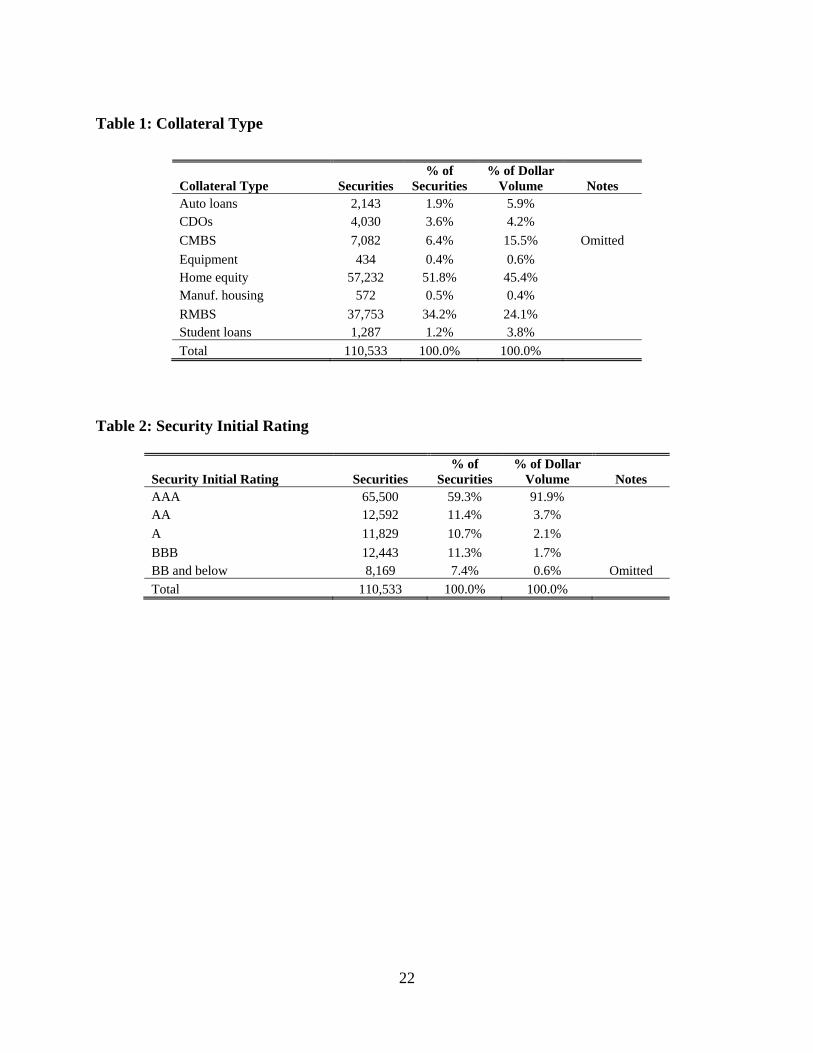
Securities backed by home equity loans make up half of the ABS in the dataset (Table 1).
These ABS include securities backed either by second liens on real estate or by subprime first
liens on real estate. Home equity ABS are smaller on average than securities in the other asset
classes, and so the dollar share of outstanding home equity ABS is a bit less than half.
Residential mortgage-backed security deals (RMBS) make up another third of the ABS in the
dataset and the remainder of the dataset is made up of commercial mortgage-backed securities
(CMBS), auto loan-backed securities, collateralized debt obligations (CDOs), and a few smaller
asset types.3 We excluded master trusts from the sample because the sponsors of securities with
this structure have an ongoing role in the securitization that sponsors of other types do not have.4
The distribution of deals across asset classes is somewhat similar to that widely reported by
Bloomberg; however, Bloomberg contains a much larger portion of CDO deals (23 percent),
which reflects the large fraction of private CDO deals that are not included in our sample.
Securities rated AAA by S&P at issuance make up the majority of the securities in our
dataset (59 percent), and lower ratings were evenly distributed among the remaining securities
(Table 2). Because of their large size relative to the other tranches, AAA-rated securities
represent an overwhelming share (92 percent) of the dollar value of the securities. In contrast,
non-investment grade securities (those rated BB or below) represent only 0.6 percent of the
dollar value of the securities in our dataset. The share of AAA-securities is large because
financial institutions with a below-AAA corporate rating benefit from sponsoring AAA
securities. These highly rated securities were in great demand for investors in part because many
institutional investors are restricted from buying securities below a certain rating, other investors
valued the capital treatment of highly rated securities, and finally, some investors focused mainly
on ratings when purchasing securities.
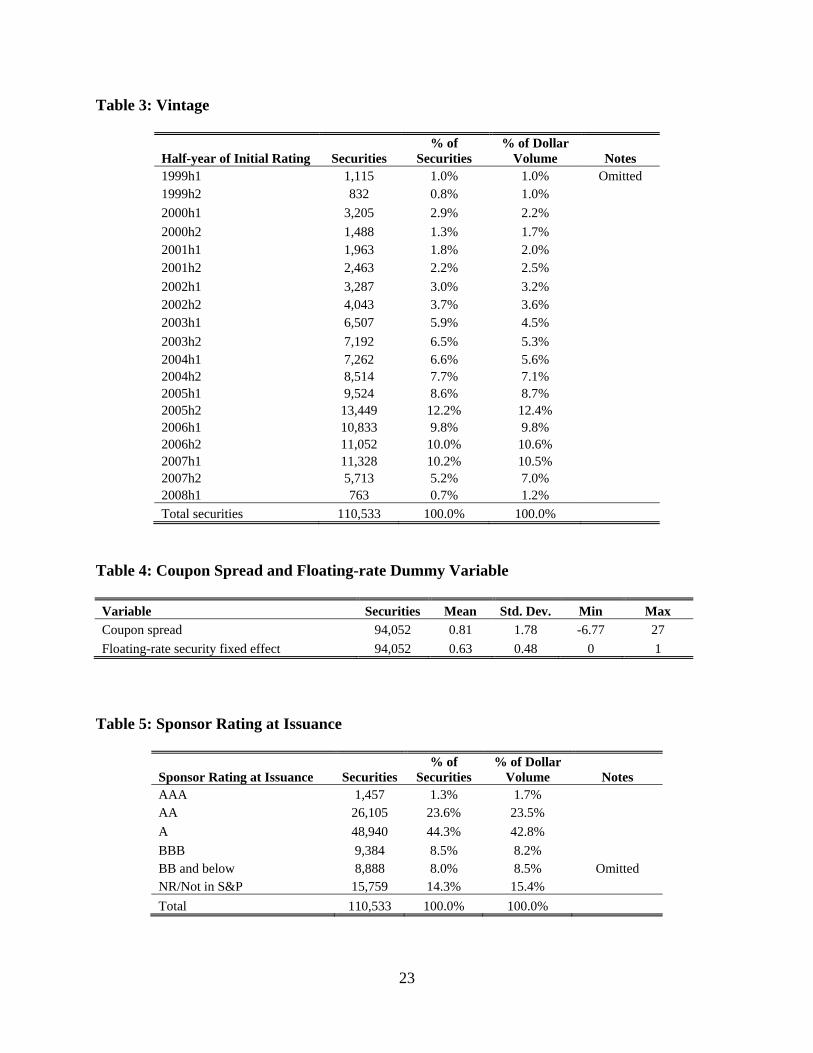
Relatively few deals in the dataset were initiated in 2008, but three-quarters were
originated in the five years prior (Table 3). Securitization volume expanded rapidly between
prevalent for CDOs, but is sometimes used for other asset types. Thus CDOs are likely substantially under-represented in our sample. 3 This category includes student loans, small business loans, manufactured housing, auto leases and auto dealer floorplans. 4 The exclusion of master trusts implies that we dropped all credit card ABS from the sample.

7
2003 and 2005 as the total number of securities issued grew by about 60 percent and the dollar
volume of securitizations nearly doubled.
To proxy for the yield spread for these securities at issuance, we used the coupon spread
because these securities are predominantly priced at par at issuance. The median issuance price
in the 37 percent of the sample for which an issuance price is provided by Bloomberg was par
and 95 percent of this subsample had an issuance price greater than 99.8 percent of the par value.
We constructed the coupon spread for fixed-rate securities using the coupon at issuance
and the expected maturity, the latter of which was only available for only about19 percent of the
fixed-rate securities in the sample. For securities with missing maturity data, the expected
maturity was proxied by the average expected maturity for securities in the same asset class and
with the same initial rating. Because the expected maturity was missing from the approximately
500 securities in the dataset backed by manufactured housing, we dropped these securities for
specifications in which the coupon spread appears. The coupon spread equals the initial coupon
less the comparable-maturity Treasury yield.
We also constructed the coupon spread for floating-rate securities using the coupon at
issuance and expected security, the latter of which was available for only about 22 percent of
floating-rate securities in the sample. For floating-rate securities, the coupon spread equals the
initial coupon less the appropriate benchmark yield. For those floating-rate securities without a
known index benchmark, the modal benchmark for securities in the same asset class proxied for
the benchmark yield. About 63 percent of the securities with a coupon spread are floating-rate
securities and the mean coupon spread is 0.81 percentage points (Table 4).
We linked these security characteristics with seven types of sponsor’s characteristics at
the time of issuance, which were obtained from various sources: credit rating, entity type,
whether it is a foreign or domestic entity, measures of financial condition other than credit rating,
number of securitization markets the sponsor participates in, whether it services the assets
underlying the securitization, and the level of insider sales of its stock. Consistent with SEC
Regulation AB, we defined the sponsor as the entity that “organizes and initiates an asset-backed
securities transaction by selling or transferring assets, either directly or indirectly, including
through an affiliate, to the issuing entity.”5 According to this definition, the sponsor may or may
not be the originator of the receivables.
5 17 C.F.R. § 229.1101.
8
ABSNet listed the sponsor of each security, and we identified this sponsor’s parent
company through individual internet and database searches.6 In the case of mergers or other
consolidations, we used the name and attributes of the parent at the time of the security
origination. We then merged in the parent’s Standard & Poor’s (S&P’s) issuer credit rating at
the time of deal closing from S&P’s RatingsXpress database. About 85 percent of securities in
the dataset were sponsored by an institution whose parent was rated by S&P and 90 of those
parents with ratings were rated investment-grade (Table 5).
In addition to credit rating categories, we also placed sponsors into financial institution
categories using data from the National Information Center (NIC) and North American Industrial
Classification System (NAICS) classifications. All sponsors in the dataset appeared in the NIC
database. We classified as a bank those entities that the NIC database classified as a US-based
financial holding company, a bank holding company, a federal savings bank, or a national bank.
We classified as a nonbank all other firms, including finance companies, securities brokers and
dealers, insurance companies, other financial and nonfinancial firms. NIC classified two firms in
the sample, Countrywide Financial Corporation and Capital One Financial Corporation as
nonbanks early in the sample but later acquired bank subsidiaries. However, due to their history
as finance companies and their limited retail banking operations, we classified them in our
dataset as nonbanks for the entire sample.
We further classified sponsors into foreign and domestic entities using data from NIC.
Domestic entities sponsored eighty percent of the securities in our dataset, with banks sponsoring
about one-third of securities sponsored by domestic entities and nonbanks sponsoring about two-
thirds, whereas foreign entities sponsored the remaining twenty percent of the securities, with the
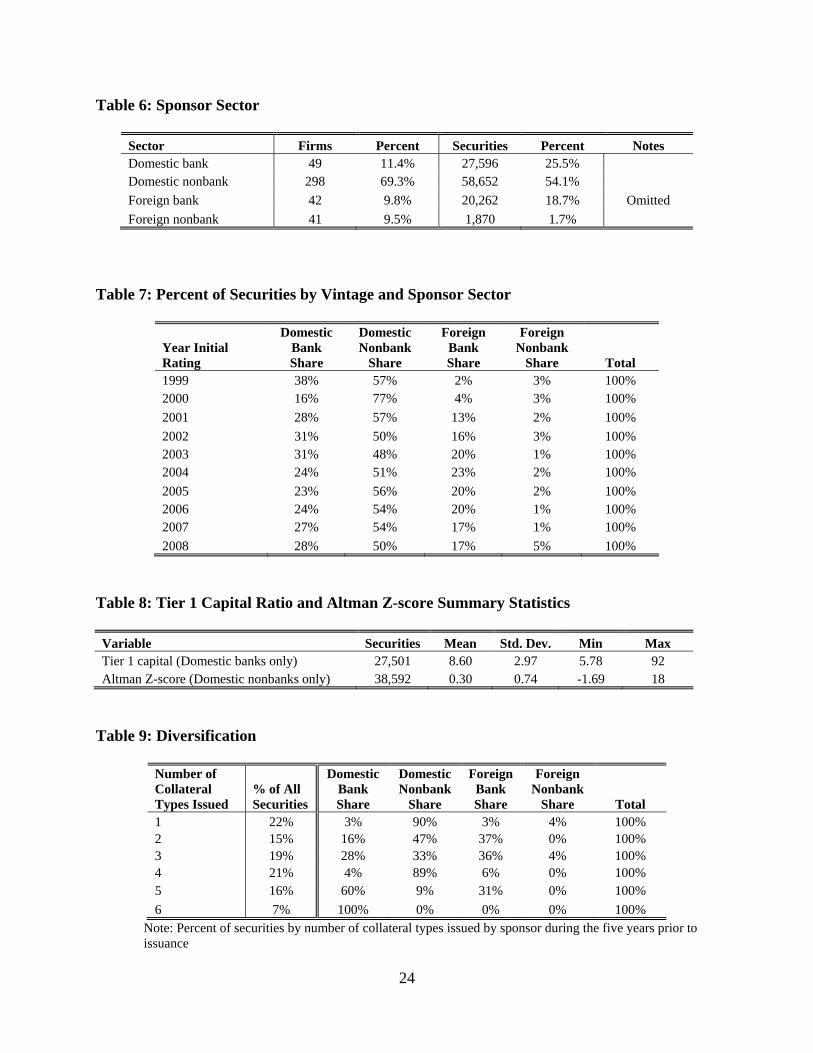
bulk of those securities sponsored by banks (Table 6). These shares have changed over time.
Prior to 2002, domestic institutions dominated the securitization market, with non-banks
sponsoring more than one-half of all securitizations (Table 7). However, foreign banks quickly
entered the US market, issuing between 20 and 23 percent of securitizations between 2003 and
2006.
For domestic entities, we incorporated two measures of financial condition other than
credit rating. For domestic banks, we identified the tier 1 capital ratio of the sponsor’s parent
6 In the less than 1 percent of deals where several sponsors were identified, the first listed sponsor was assumed to be the primary sponsor associated with the deal.

9
company, and for domestic nonbanks, we calculated Altman’s Z-score (Altman 1968). The
mean tier 1 capital ratio for domestic banks in the sample is 8.6 and the mean Z-score is 0.3
(Table 8). The low mean Z-score reflects low reported sales at finance companies, and in turn a
low capital-turnover component of the Z-score (sales divided by total assets).
We also calculated the number of securitization markets the sponsor participates in,
which may be a potential indicator of the financial stability of the parent. Firms that operate in
more markets are likely to be more diversified and less susceptible to financial shocks. It also
may serve as a proxy for the experience of the sponsor and its reputation in the market. Parents
who specialize in securities of a single collateral type sponsored about one-fifth of securities
(Table 9). On the other extreme, diversified parents who operate in more than four securitization
markets sponsored about one-quarter of securities. Most of the highly diversified parents are
domestic or foreign banks.
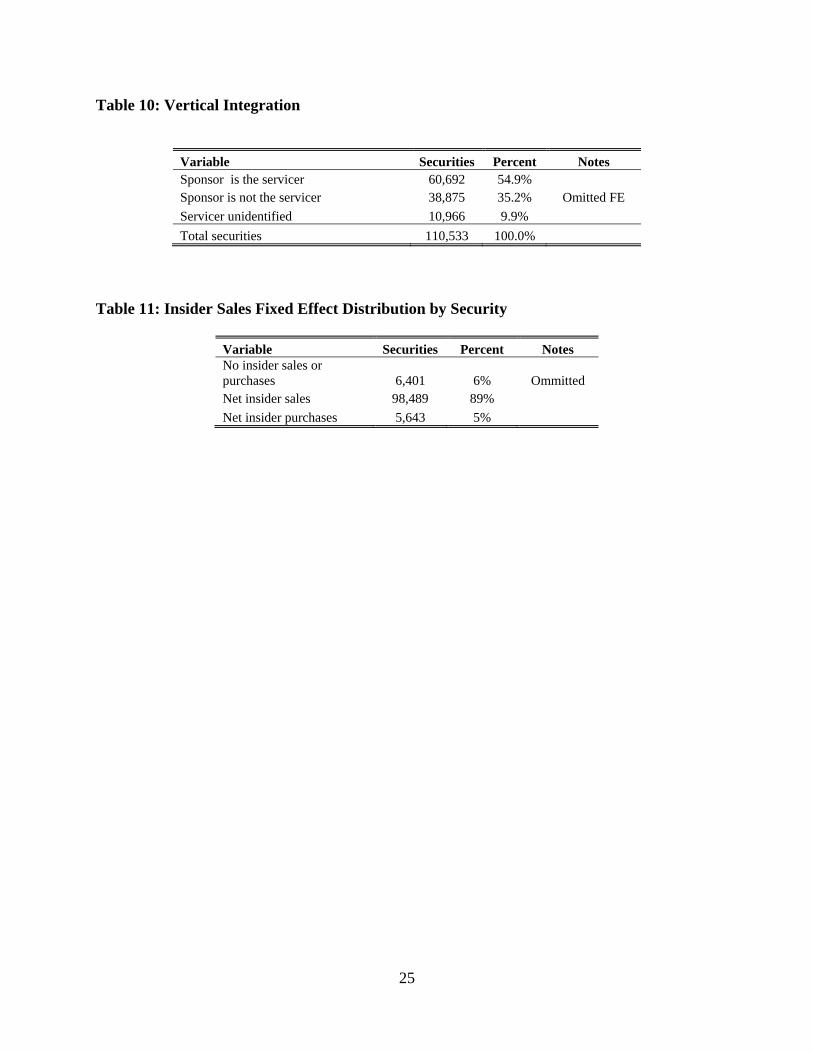
The ABSNet database identifies the name of the servicer for approximately 90 percent of
the securities. Among those with the servicer identified, the sponsor also services the loans for
about 55 percent of the securities, which we will refer to as vertical integration (Table 10).
Finally, we collected data on insider sales to examine the extent to which managers are
able to anticipate problems in their firms and securitizations. We used the Thomson Financial
Insider Filings (TFIF) database and cleaned the data as in Lakonishok and Lee (2001). We
included open market or private market sales or purchases and exclude amended records. For
each sponsor we calculated the monthly net volume of insider sales occurring in the previous
three months and transform this value into three dummy variables indicating whether insiders
were net sellers, buyers, or neither. Table 11 shows the distribution by security of insider sales
or purchases in the quarter prior to security issuance. For about 89 percent of securities,
managers were net sellers in the previous quarter. This high share is not surprising given that
managers who are compensated with stock are much more likely to sell stock than to purchase
stock in their own firms.
III. EMPIRICAL RESULTS
We begin our analysis by presenting our main model of deal performance using the
survival time of a security until a downgrade as our measure of performance. We constructed
10
the time to first downgrade using the Standard & Poor’s (S&P’s) rating history provided by
ABSNet for each security. Although most ABS have at least two ratings, we analyzed S&P
ratings only because S&P rated the highest share of ABS, and its ratings history was the most
complete. S&P downgraded thirty percent of the securities in the database during our sample
period, and we treated as right censored the remaining seventy percent of securities, which S&P
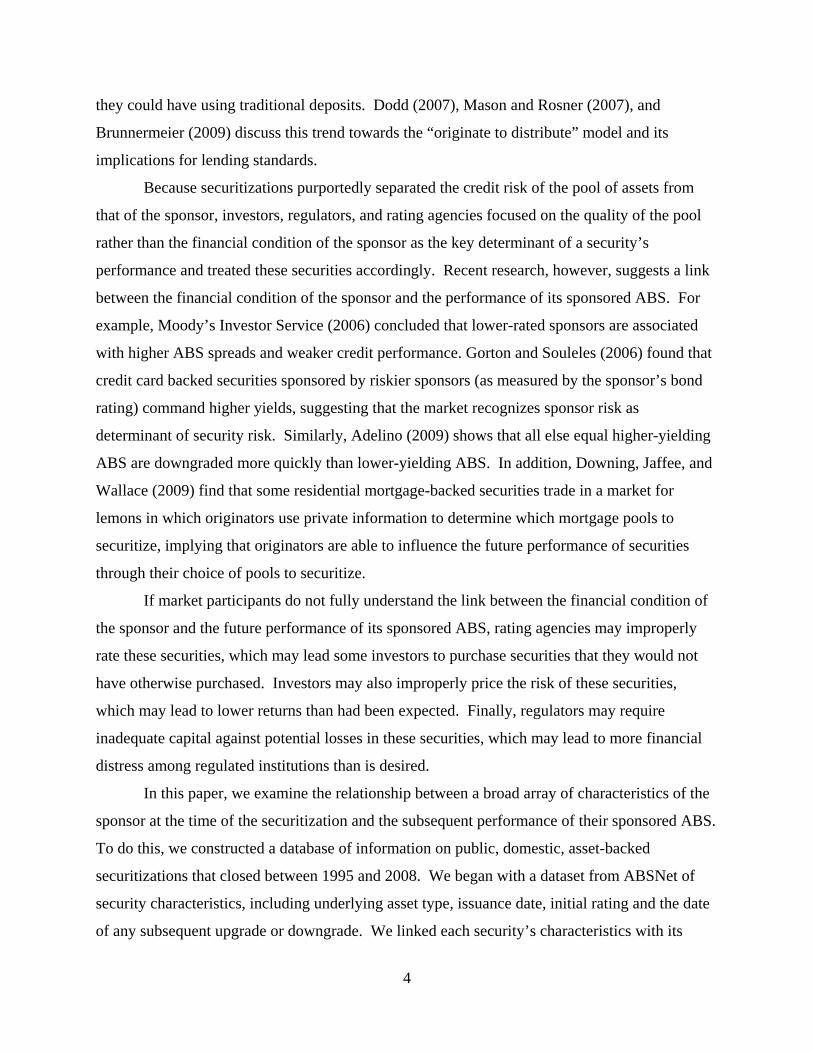
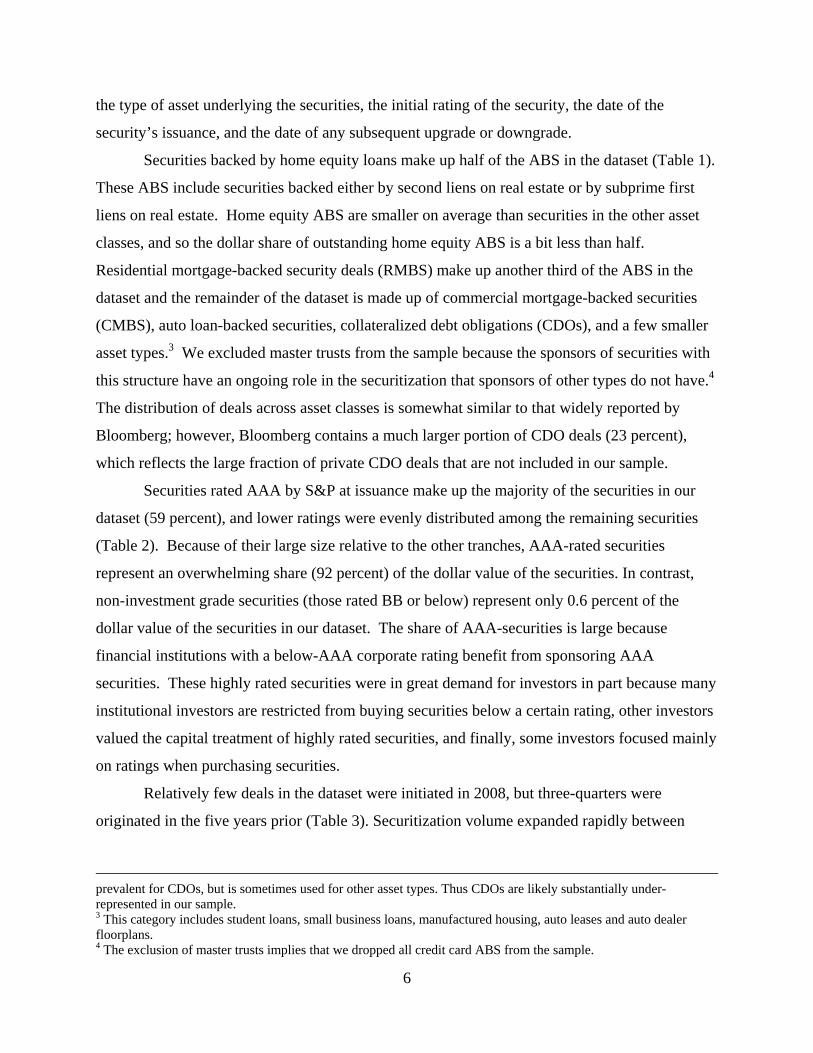
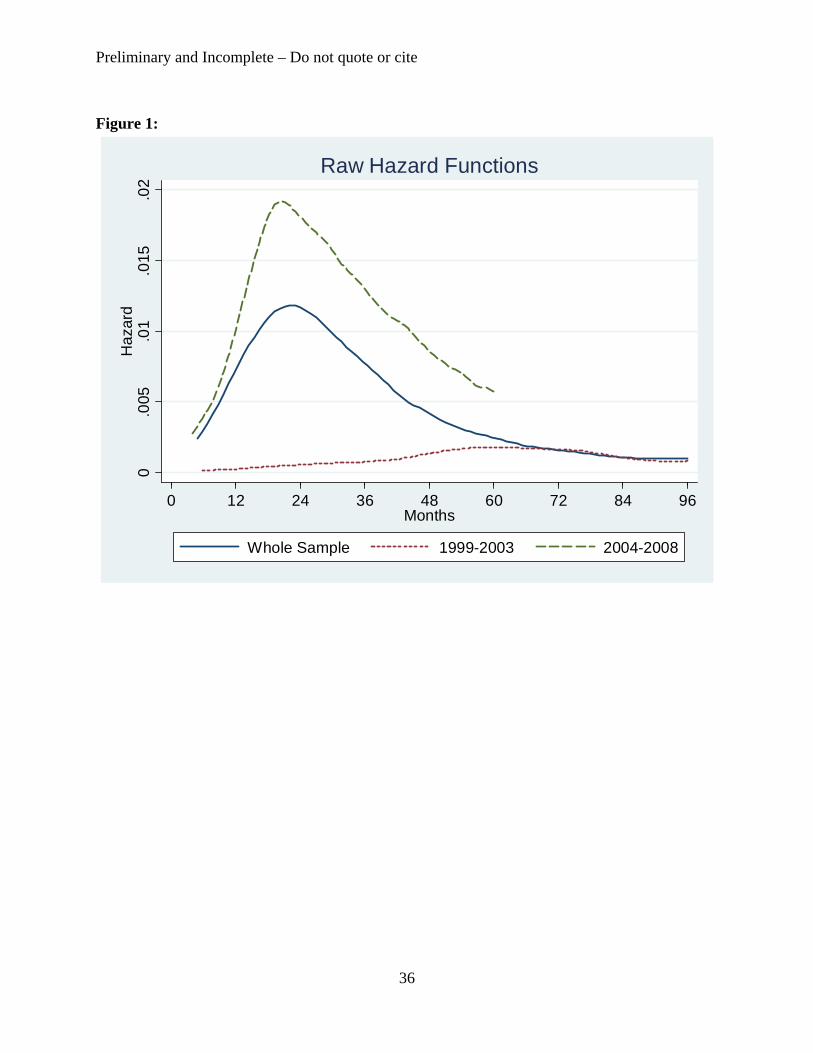
had not downgraded as of the fourth quarter of 2009. Among securities that were downgraded,
the average time to downgrade is 27 months from origination, and the probability of a
downgrade peaks two years after issuance at about 1.2 percent, as shown in Figure 1. Figure 1
also suggests that the underlying survival distribution is lognormal. The peak after two years
was driven by downgrades among securities sponsored in 2004 or later. The hazard rate for
these securities peaks at about 1.9 percent two years after their issuance, whereas the hazard rate
for securities sponsored in 1995 through 2003 peaks nearly five years after issuance. The
difference in the timing of the peaks between the two periods suggests that it is important to
control for the time period in our regressions.
The determinants of our main model of the survival time until downgrade are of two
kinds: those related to the security itself, such as the underlying asset class, and those related to
the sponsor of the security, such as issuer rating. In many cases, we will present both point
estimates of these determinants’ effect on time to downgrade, as well as survival curves
predicted by the model that illustrate these determinants’ effect. We then tested the robustness of
the main model’s findings by estimating the model on several subsamples of the data (by
vintage, collateral type, and initial rating), and by changing the measure of performance first to
severe downgrades and then to upgrades. Finally, we tested whether investors anticipated the
securities’ performance by adding coupon spread to the model and whether the sponsors
themselves anticipated the securities’ performance by adding a measure of insider sales.
A. Main Model of Survival Time to Downgrade
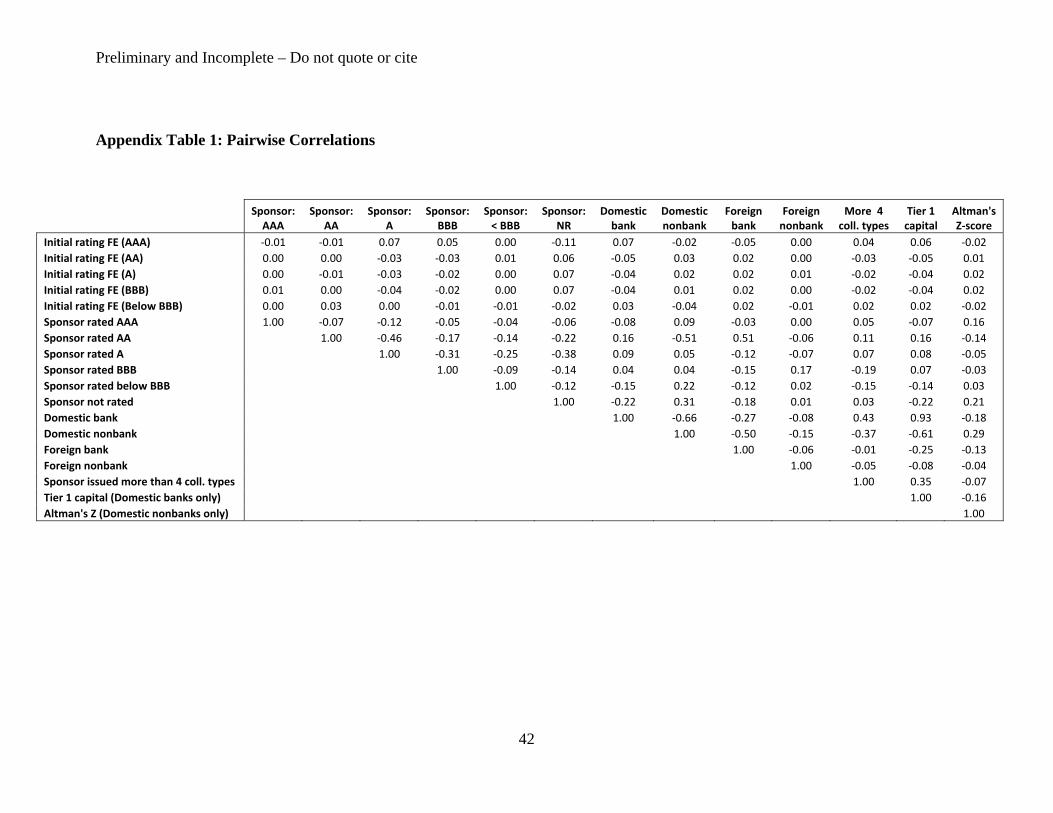
As a preliminary step, we determined whether the sponsor characteristics we observe at
the time of issuance played a role in the initial rating of the security. Rating agencies state that
they base their ratings on the collateral and deal structure, and consistent with these claims, we
find that the initial ratings of the securities are uncorrelated with the characteristics of the
sponsor, including parent rating, sector, diversification, and capital (see Appendix Table 1).
11
To discern whether the characteristics of the sponsor influence subsequent performance,
we estimated a lognormal survival time model of the length of time between the issuance of a
security and its first downgrade (if any). In this model, a security is at risk of a downgrade while
its rating is at or above its initial rating, and the security experiences a failure at time t if its
rating falls one or more intermediate ratings below its initial rating between period t-1 and period
t. Under this definition, a security downgraded from AA to AA- and a security downgraded from
AA to BBB experience the same failure.7 If S&P had not downgraded a security by the end of
the sample period, we considered the observation censored.
The determinants of a security downgrade are related either to the security or to the
sponsor.8 Those related to the security include the asset type underlying the security, the initial
rating of the security, and its date of issuance. Those related to the sponsor include the sponsor’s
issuer rating, the sponsor’s sector, its vertical integration and specialization, and measures of
financial condition.
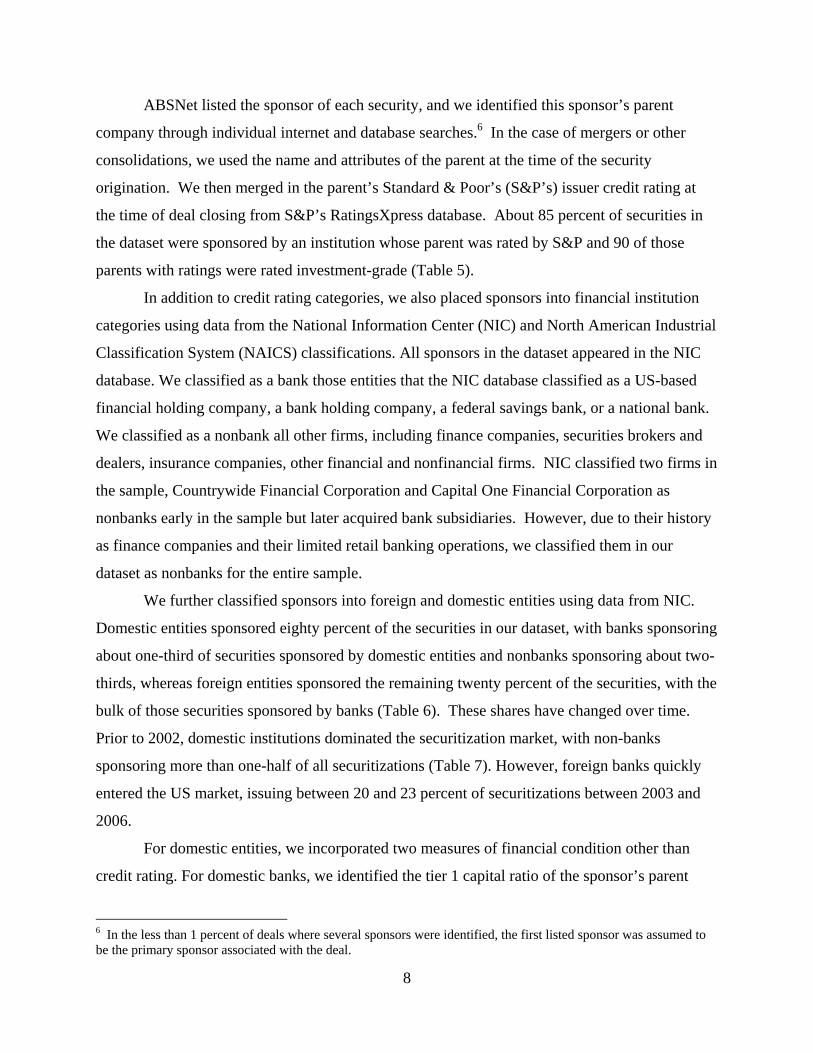
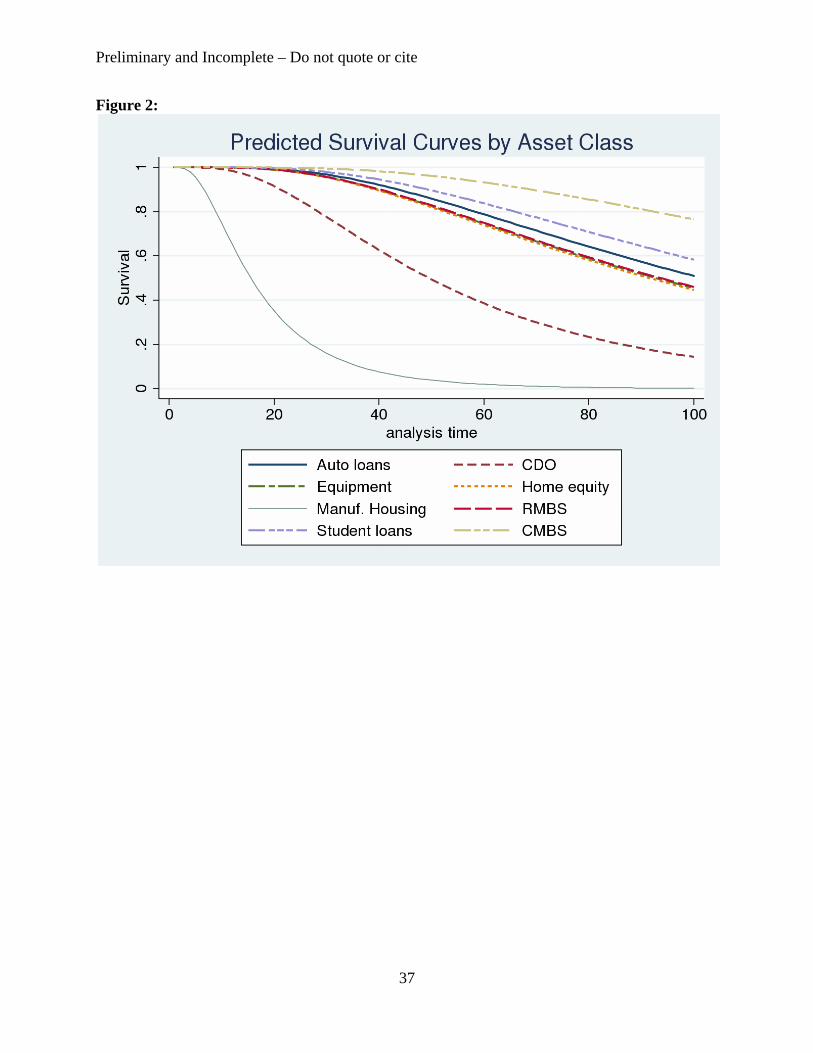
The first security characteristic is the type of asset underlying the security. The omitted
collateral type in the regression is CMBS, which accounts for about 6.4 percent of the securities
(see Table 1). The survival curves predicted by the model show a gap between the survival
curves of CMBS and those of the other asset classes and imply that holding all else constant
CMBS is downgraded later than other asset classes (Figure 2).9 Securities backed by
manufactured housing were clearly more likely to be downgraded sooner than other asset classes,
followed by CDOs, home equity, RMBS, equipment loans, auto loans and student loans. These
findings generally result from concentrated periods of stress for each of these asset classes: for
example, manufactured housing and subprime auto ABS in the mid-1990s, and CDOs, home
equity, and RMBS in 2006 - 2008.
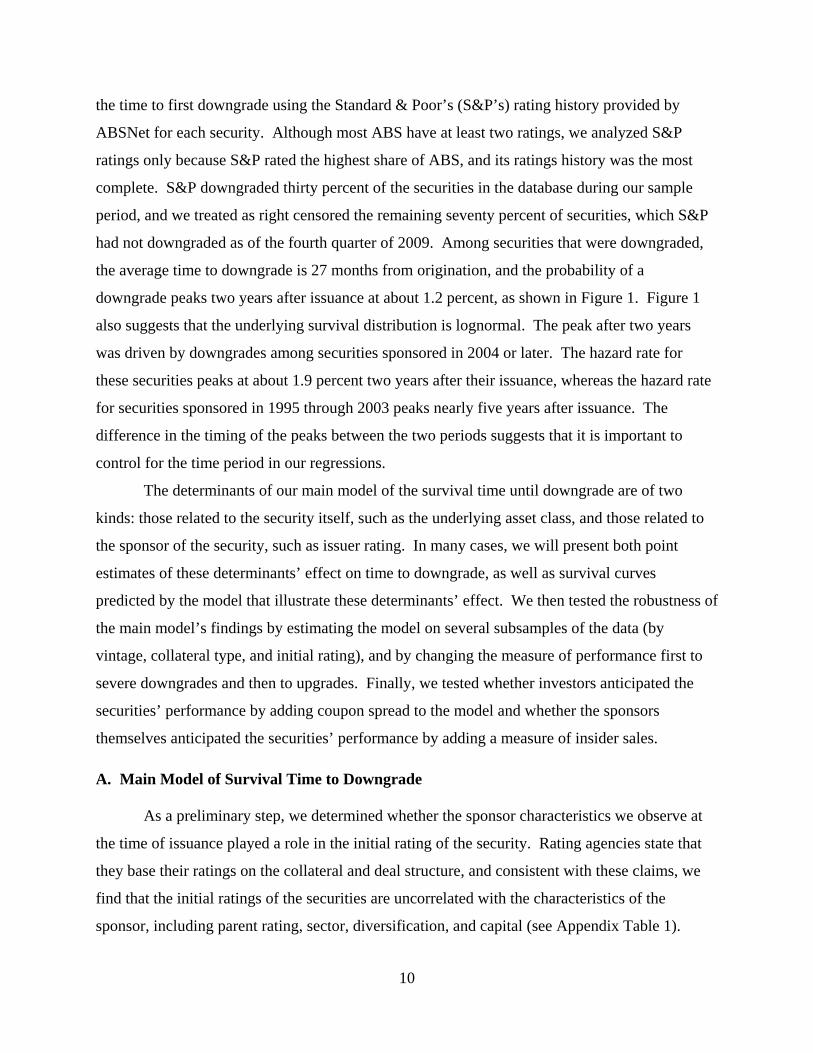
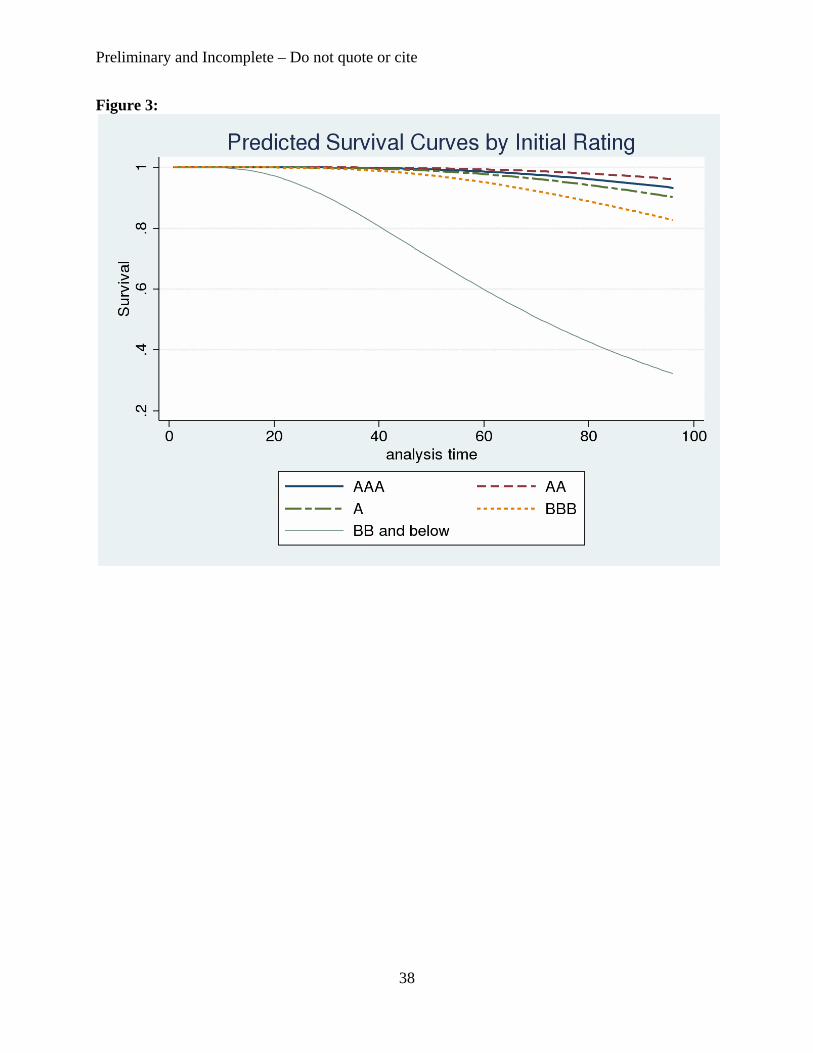
The second security characteristic is the security rating at the time of issuance, which we
controlled for using a set of dummy variables; the omitted initial rating in the regression is BB
and below, which accounts for about 8 percent of the securities. The effect of initial rating on
predicted time to downgrade is as one would expect. All else equal, securities rated BB or above
are downgraded significantly later than securities rated below BB and the predicted survival
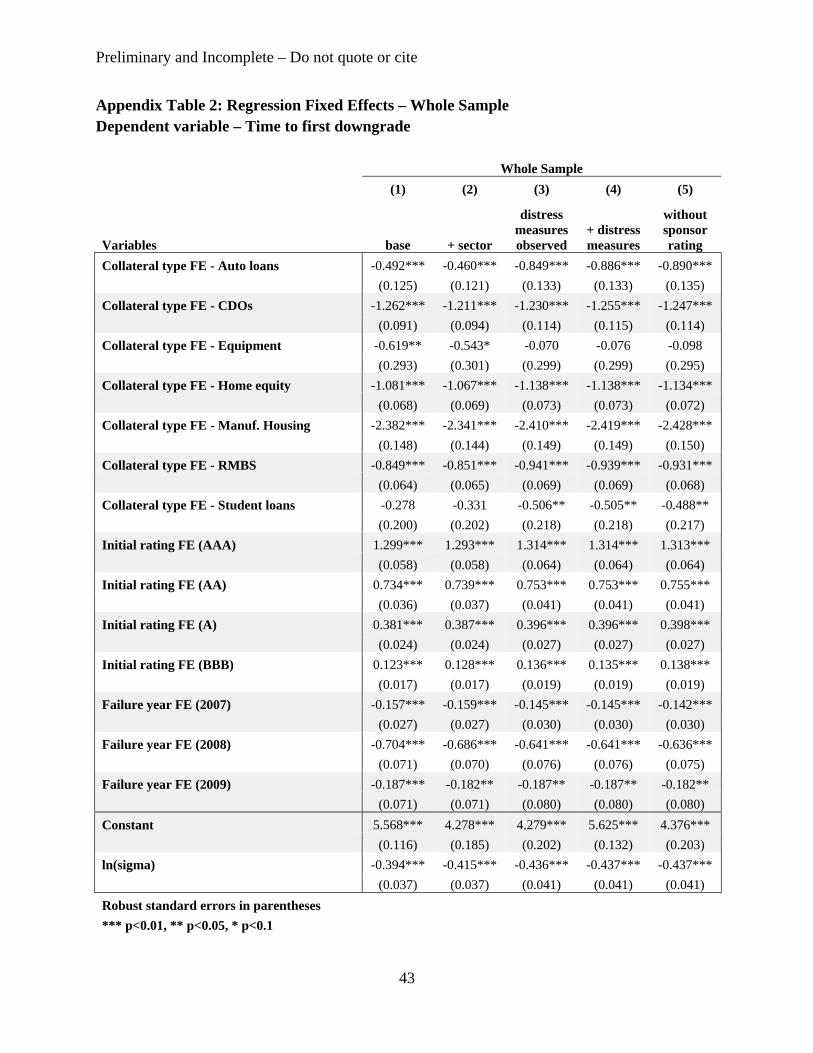
7 We will test the robustness of our results to this definition of downgrade in section IIIC. 8 Our base model also controls for the 6-month period the security was issued and year dummies for the 2005-2007 time period when ratings downgrades became quite common. Appendix Table 2 reports coefficients on these basic controls. 9 Our data do not extend to the S&P downgrades of CMBS in the third quarter of 2009.
12
curve are generally monotonic in which higher rated securities are less likely to be downgraded
(Figure 3).
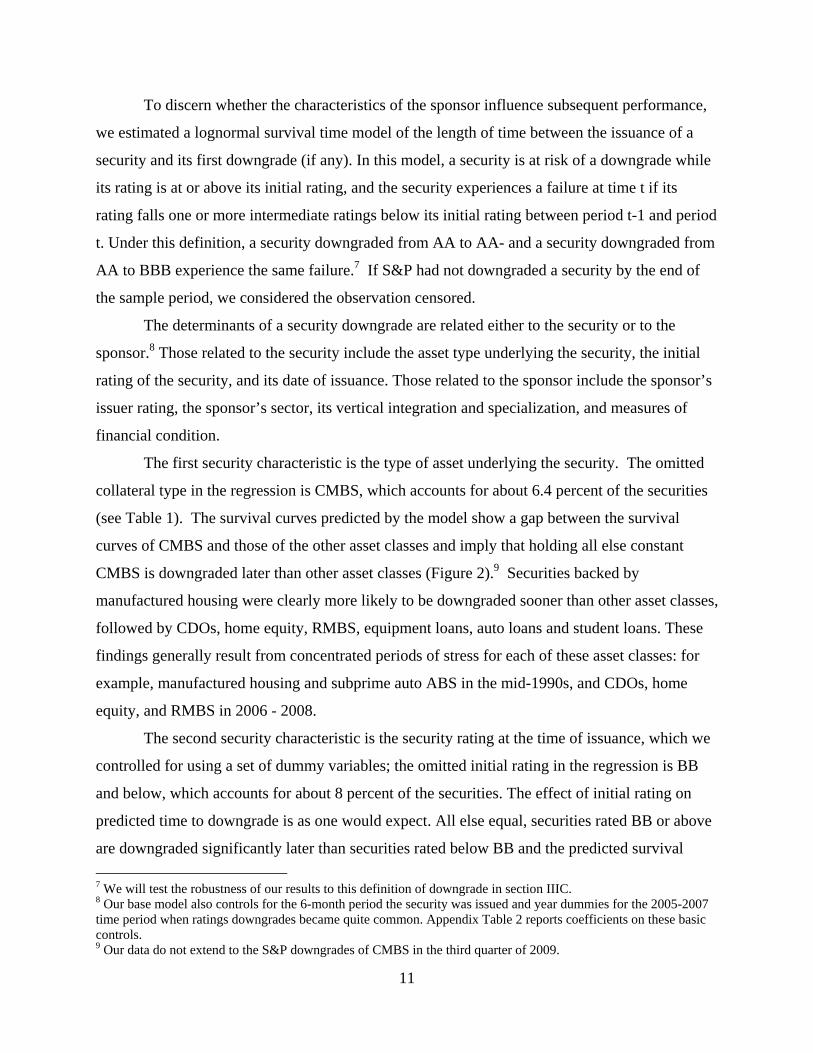
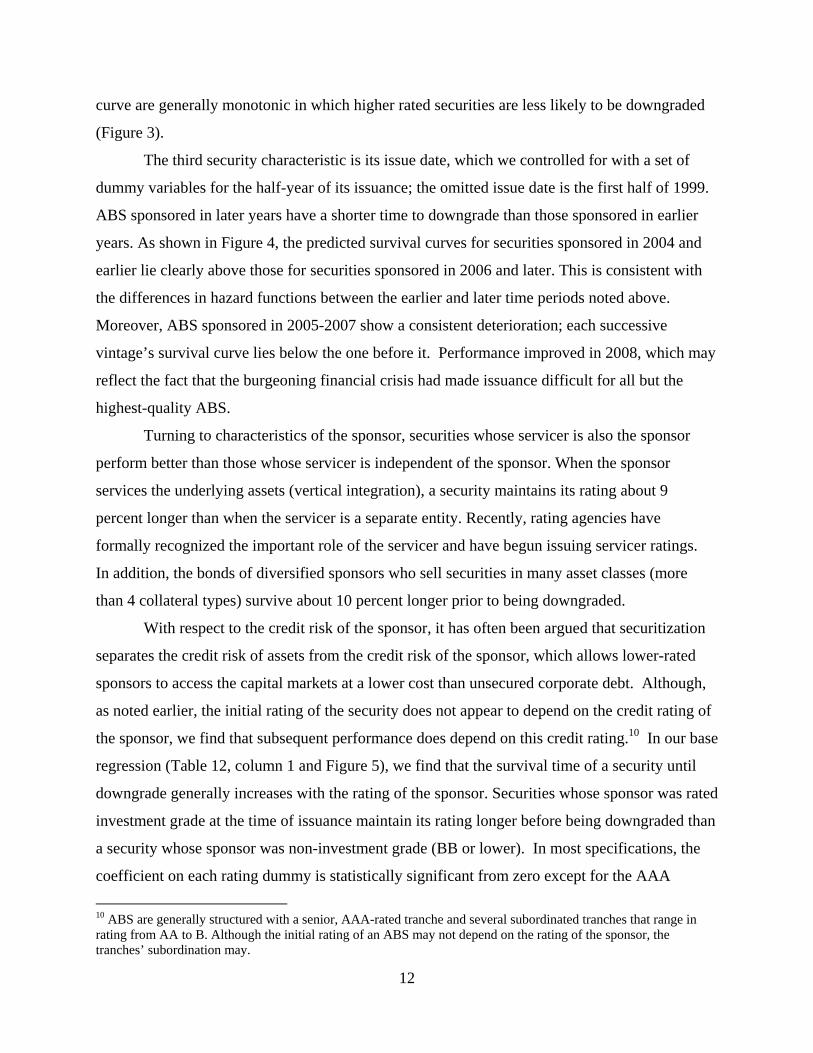
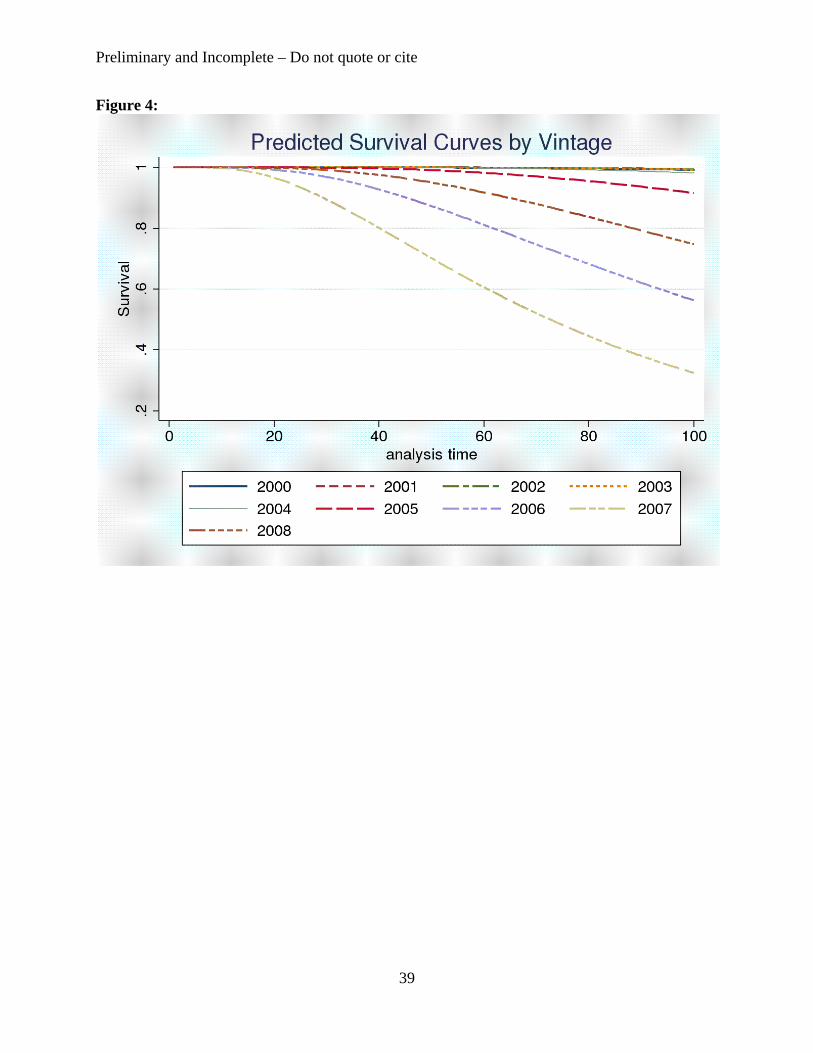
The third security characteristic is its issue date, which we controlled for with a set of
dummy variables for the half-year of its issuance; the omitted issue date is the first half of 1999.
ABS sponsored in later years have a shorter time to downgrade than those sponsored in earlier
years. As shown in Figure 4, the predicted survival curves for securities sponsored in 2004 and
earlier lie clearly above those for securities sponsored in 2006 and later. This is consistent with
the differences in hazard functions between the earlier and later time periods noted above.
Moreover, ABS sponsored in 2005-2007 show a consistent deterioration; each successive
vintage’s survival curve lies below the one before it. Performance improved in 2008, which may
reflect the fact that the burgeoning financial crisis had made issuance difficult for all but the
highest-quality ABS.
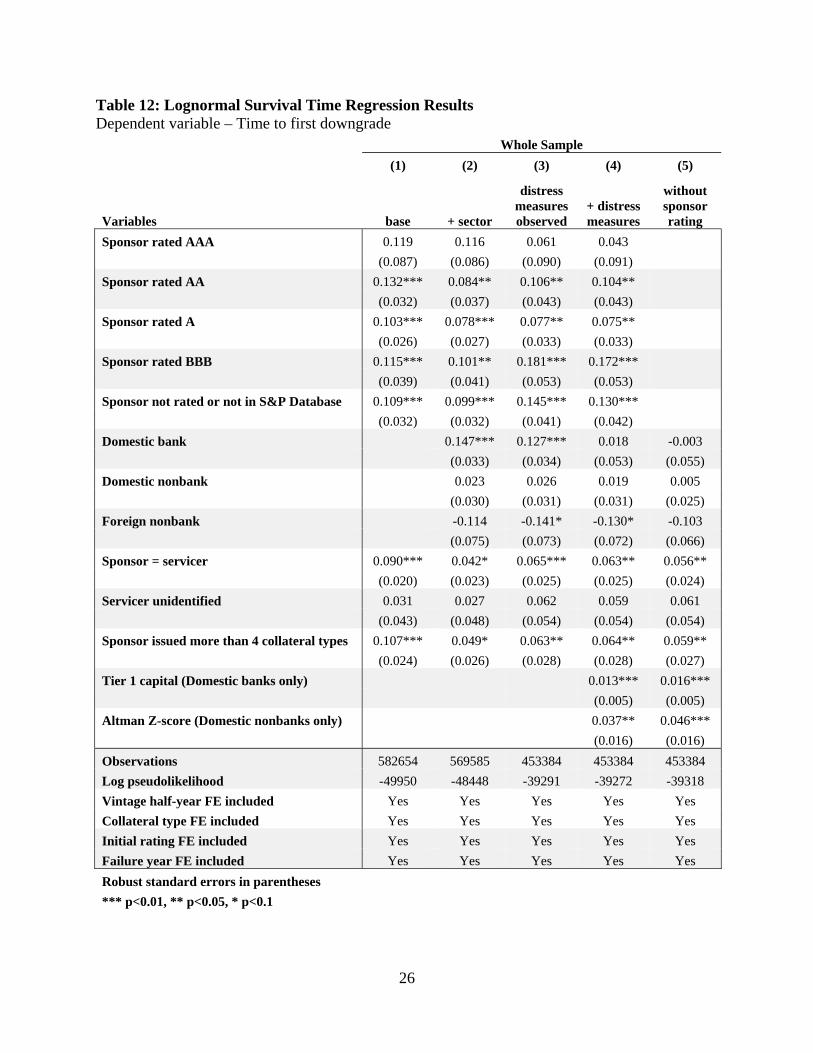
Turning to characteristics of the sponsor, securities whose servicer is also the sponsor
perform better than those whose servicer is independent of the sponsor. When the sponsor
services the underlying assets (vertical integration), a security maintains its rating about 9
percent longer than when the servicer is a separate entity. Recently, rating agencies have
formally recognized the important role of the servicer and have begun issuing servicer ratings.
In addition, the bonds of diversified sponsors who sell securities in many asset classes (more
than 4 collateral types) survive about 10 percent longer prior to being downgraded.
With respect to the credit risk of the sponsor, it has often been argued that securitization
separates the credit risk of assets from the credit risk of the sponsor, which allows lower-rated
sponsors to access the capital markets at a lower cost than unsecured corporate debt. Although,
as noted earlier, the initial rating of the security does not appear to depend on the credit rating of
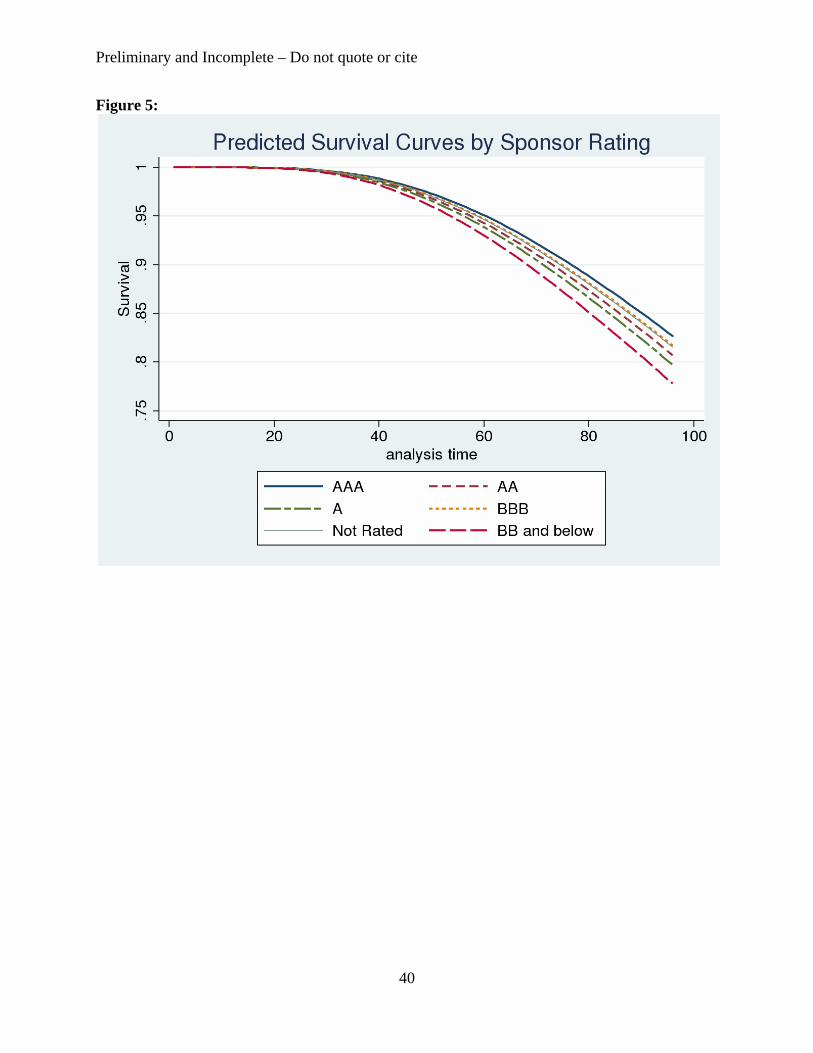
the sponsor, we find that subsequent performance does depend on this credit rating.10 In our base
regression (Table 12, column 1 and Figure 5), we find that the survival time of a security until
downgrade generally increases with the rating of the sponsor. Securities whose sponsor was rated
investment grade at the time of issuance maintain its rating longer before being downgraded than
a security whose sponsor was non-investment grade (BB or lower). In most specifications, the
coefficient on each rating dummy is statistically significant from zero except for the AAA
10 ABS are generally structured with a senior, AAA-rated tranche and several subordinated tranches that range in rating from AA to B. Although the initial rating of an ABS may not depend on the rating of the sponsor, the tranches’ subordination may.
13
dummy variable. This may be due to the relatively small number of AAA-rated parents in the
sample (only about one percent of the securities are sponsored by an institution rated AAA).
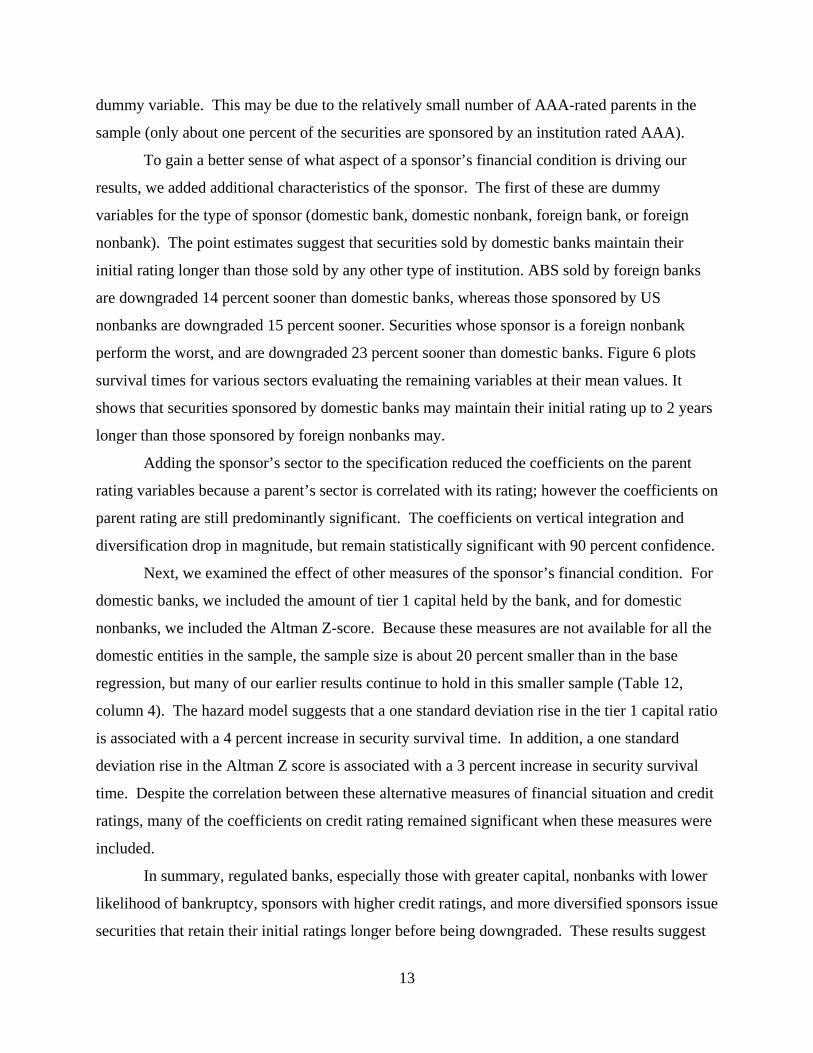
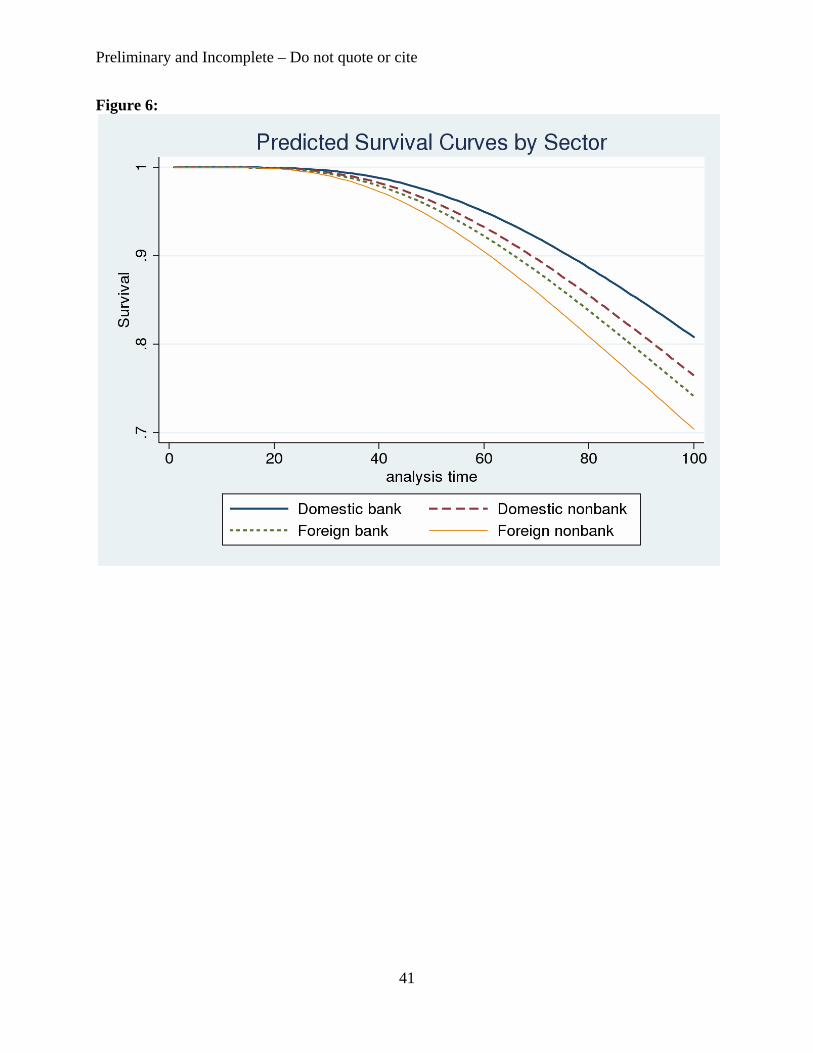
To gain a better sense of what aspect of a sponsor’s financial condition is driving our
results, we added additional characteristics of the sponsor. The first of these are dummy
variables for the type of sponsor (domestic bank, domestic nonbank, foreign bank, or foreign
nonbank). The point estimates suggest that securities sold by domestic banks maintain their
initial rating longer than those sold by any other type of institution. ABS sold by foreign banks
are downgraded 14 percent sooner than domestic banks, whereas those sponsored by US
nonbanks are downgraded 15 percent sooner. Securities whose sponsor is a foreign nonbank
perform the worst, and are downgraded 23 percent sooner than domestic banks. Figure 6 plots
survival times for various sectors evaluating the remaining variables at their mean values. It
shows that securities sponsored by domestic banks may maintain their initial rating up to 2 years
longer than those sponsored by foreign nonbanks may.
Adding the sponsor’s sector to the specification reduced the coefficients on the parent
rating variables because a parent’s sector is correlated with its rating; however the coefficients on
parent rating are still predominantly significant. The coefficients on vertical integration and
diversification drop in magnitude, but remain statistically significant with 90 percent confidence.
Next, we examined the effect of other measures of the sponsor’s financial condition. For
domestic banks, we included the amount of tier 1 capital held by the bank, and for domestic
nonbanks, we included the Altman Z-score. Because these measures are not available for all the
domestic entities in the sample, the sample size is about 20 percent smaller than in the base
regression, but many of our earlier results continue to hold in this smaller sample (Table 12,
column 4). The hazard model suggests that a one standard deviation rise in the tier 1 capital ratio
is associated with a 4 percent increase in security survival time. In addition, a one standard
deviation rise in the Altman Z score is associated with a 3 percent increase in security survival
time. Despite the correlation between these alternative measures of financial situation and credit
ratings, many of the coefficients on credit rating remained significant when these measures were
included.
In summary, regulated banks, especially those with greater capital, nonbanks with lower
likelihood of bankruptcy, sponsors with higher credit ratings, and more diversified sponsors issue
securities that retain their initial ratings longer before being downgraded. These results suggest
14
that rating agencies, investors, and regulators all may benefit from considering the financial
condition of the sponsor when rating, purchasing, or making policy regarding ABS.
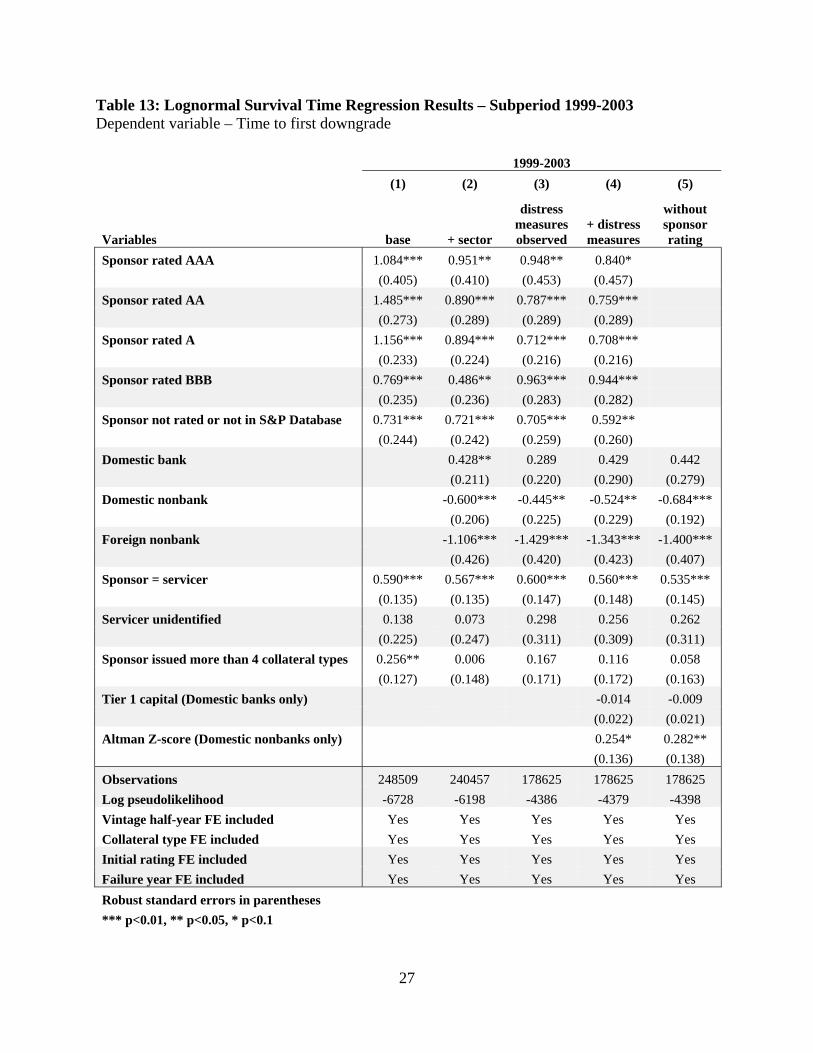
B. Subsample Results by Vintage, Initial Rating, and Collateral Type
Because the survival time to first downgrade of securities sponsored after 2004 is much
shorter than those sponsored prior to 2004, these results may be driven by this later period, which
was characterized by heightened rating agency competition and (according to some) particularly
inaccurate ratings (Bolton, et. al., 2009). However, we do not find this to be the case. In a
specification that includes only securities sponsored from 1999 to 2003, many of the same
conclusions can be drawn (Table 13).11 Securities sponsored by parents with a higher credit
rating and those whose servicer was the same entity as the sponsor perform much better than the
overall sample of ABS. While the amount of tier 1 capital is insignificant in this specification,
the Z-score coefficient becomes larger and retains its statistical significance. Therefore, the
evidence that sponsors matter for securitization has been present well before the current time
period.
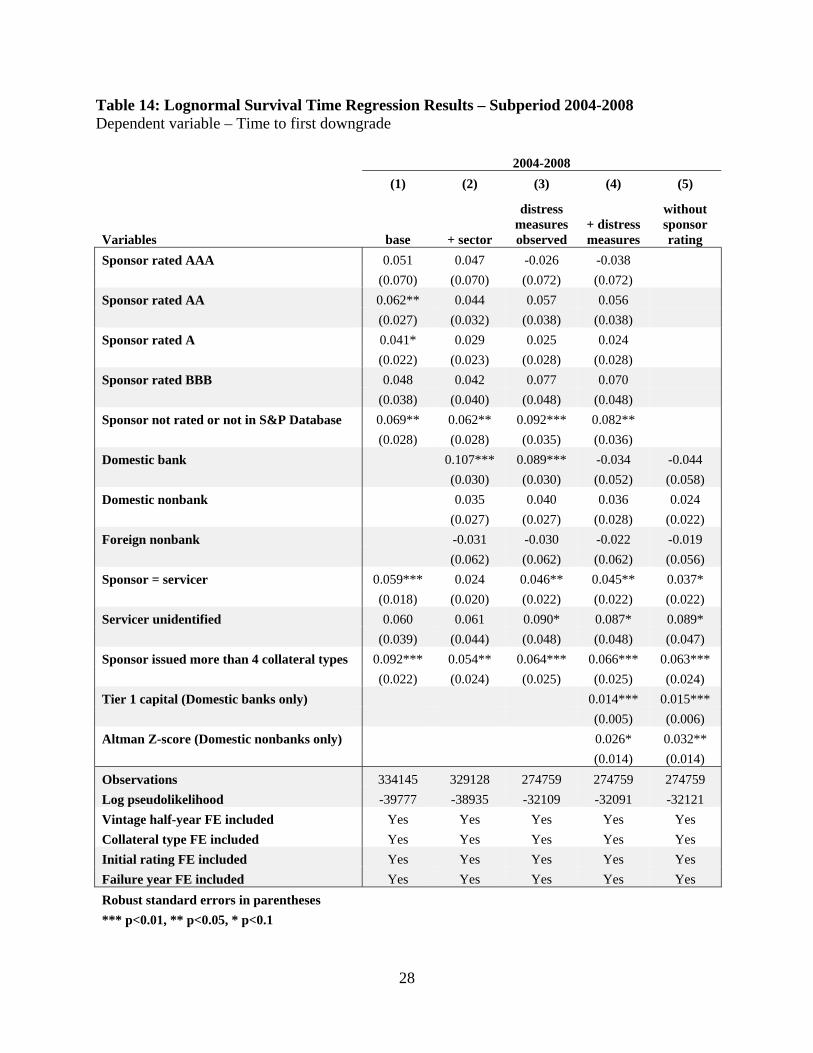
In a specification that includes only securities sponsored in the later 2004 to 2008 time
period, the coefficients on parent rating are no longer statistically significant, but securities
sponsored by banks still perform much better, as do securities sponsored by diversified firms and
those where the sponsor services the loans (Table 14). The coefficients on tier 1 capital and
Altman Z also remain positive and statistically significant in this time period.
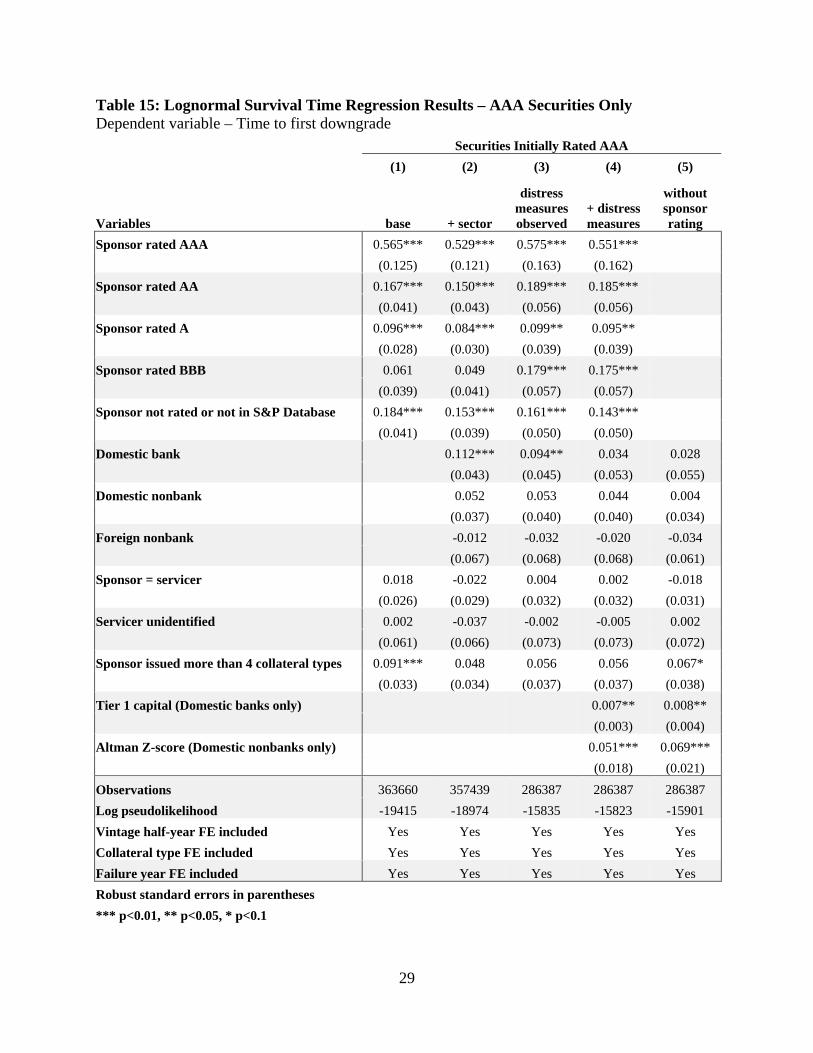
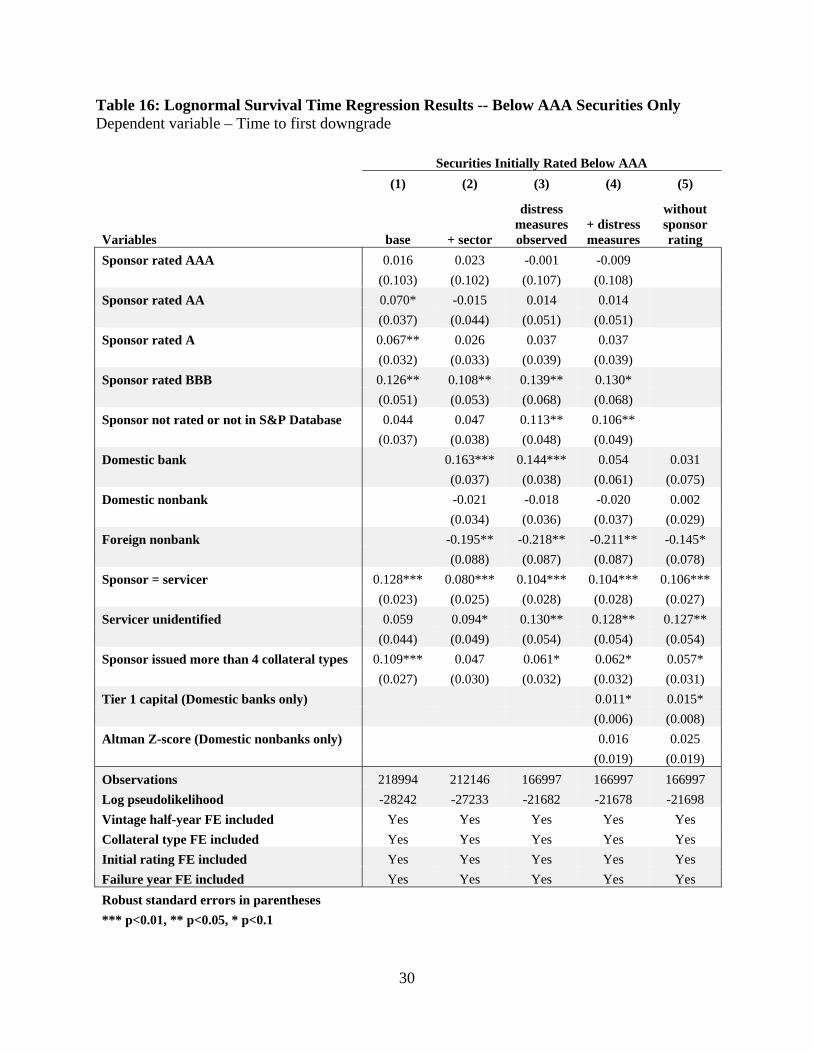
Turning to initial ratings, security and sponsor characteristics may play different roles in
security performance depending upon the seniority of the security. For example, effective
servicing can have a disproportionate impact on lower-rated securities because losses affect those
securities first. In addition, in a weak economic environment junior tranches will perform poorly
regardless of the quality of a deal’s collateral so an increase in overall deal quality will have a
disproportionate effect on the performance of more senior securities. To examine these
hypotheses, we estimate our survival time model first using only securities rated AAA at
issuance and then only using those securities rated below AAA at issuance. The dummy variable
indicating whether the sponsor is also the servicer is only significant for lower-rated securities,
11 During this time, overall survival times were much longer, so we would expect that coefficients in the lognormal survival function would be much larger in magnitude for an equivalent sized economic effect as in the specification in Table 10 that includes the later time period as well.

15
which is consistent with the importance of effective servicing for these securities (Table 15). In
addition, sponsor credit rating, tier 1 capital, and Z-score are larger and much more significant
for AAA securities (Table 16).
Finally, we focused on collateral type. Because RMBS and home equity together
constitute about 65 percent of the dollar volume of securities in our sample, we also investigate
to what extent the overall results hold for this subsample alone. When restricting estimation to
these collateral types, results are very similar (see Table 17).12 The parent rating, vertical
integration, and diversification variables are similar and significant. Sector dummy variables are
similar with the exception that nonbanks performed better in this subsample. The only notable
differences are the lack of significance and flip in sign of the coefficients on the financial distress
variables. The whole-sample coefficients on these variables seem to be driven by the other
collateral types.
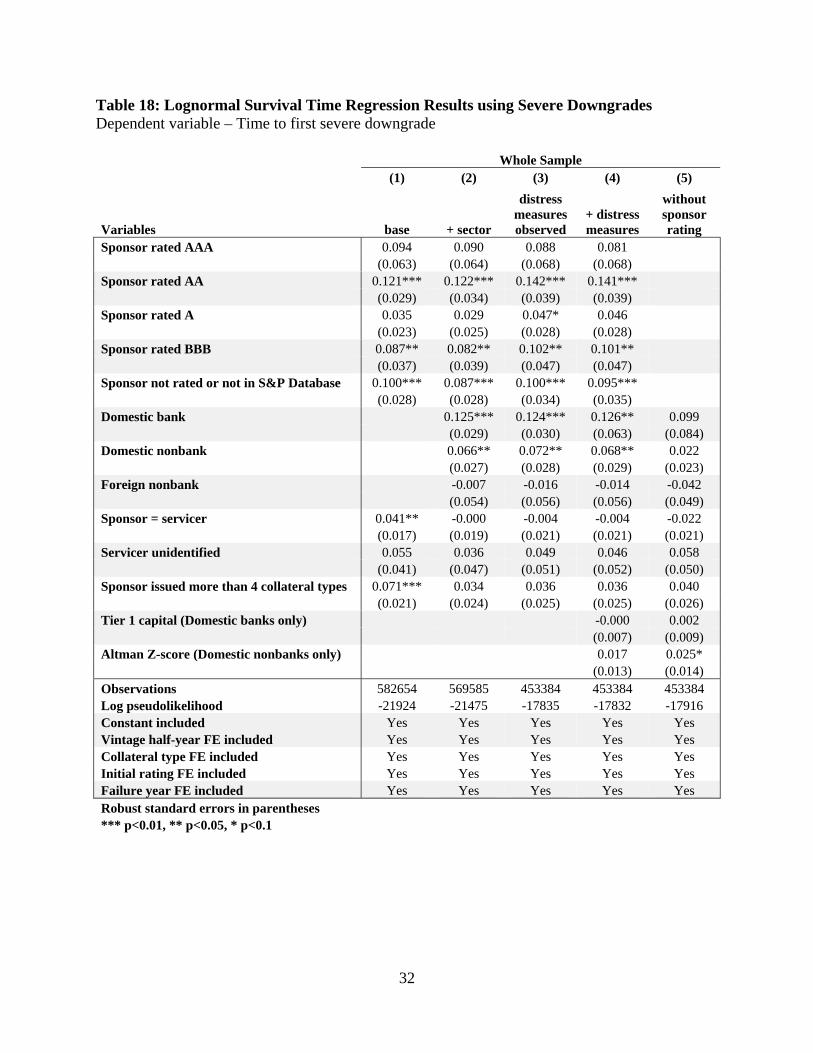
C. Severe Downgrades
Our baseline measure of security performance does not account for the severity of
downgrades. To test our results for robustness with respect to the definition of a downgrade, we
estimated a hazard model in which a security is at risk while its rating is at or above its initial
rating and the security experiences a failure at time t if its rating falls nine or more ratings below
its initial rating between period t-1 and period t. Unlike our baseline measure, a security
downgraded from AA to AA- does not experience a failure, but a security downgraded from AA
to BB experiences a failure. This reduces the number of failures available for estimation in half
(see Table 18). The parent rating, servicing, and diversification variables are again significant in
this specification. The sponsor type results also still hold. Securities sponsored by domestic
banks, and by domestic entities in particular, experience severe downgrades later than securities
sponsored by other entities. The Altman Z-score is modestly significant with a positive sign
when we exclude the parent rating; however, the financial distress variables are generally small
and insignificant in this specification. That said, overall it appears that sponsor characteristics
have similar effects on both modest and severe downgrades.
12 Note that we combined the AAA and AA sponsor rating categories because there are only three AAA sponsors in this subsample.
16
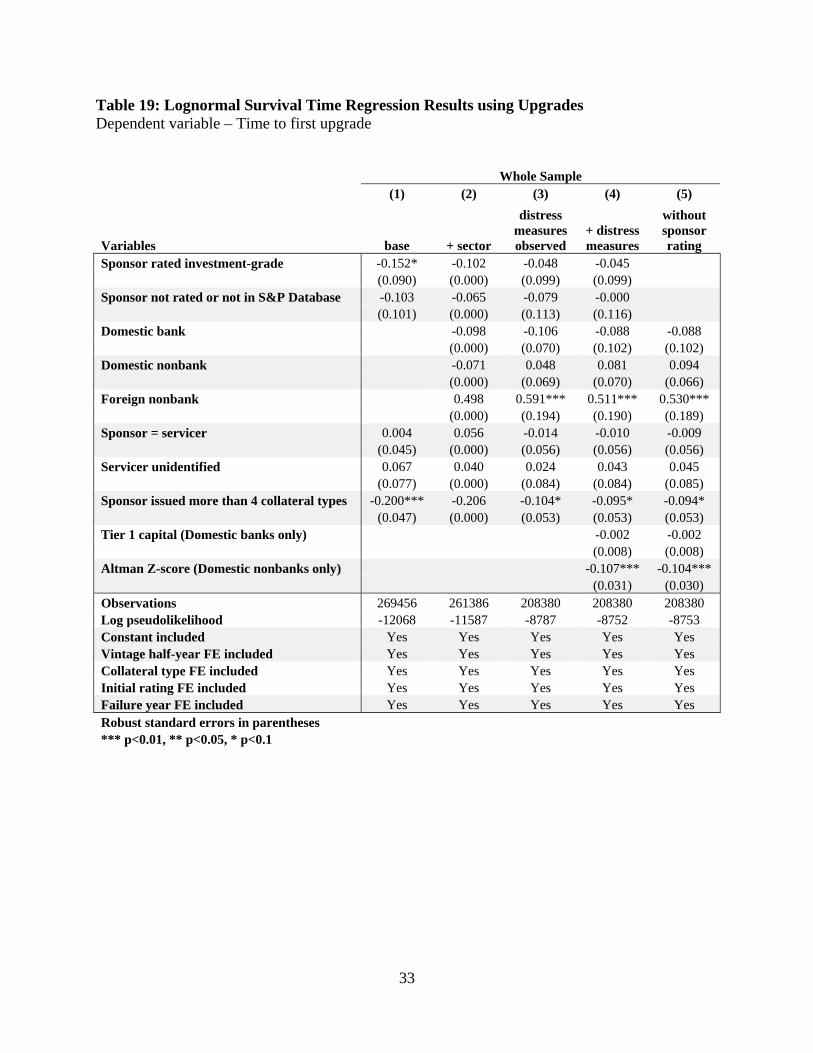
D. Upgrades
The baseline specification focused on time to downgrade, but presumably many of these
security and sponsor characteristics can also predict upgrades. We estimate a hazard model in
which a security is at risk for upgrade while its rating is at or below its initial rating and the
security is upgraded at time t if its rating rises above its initial rating between time t and time t+1.
The number of upgrades is only about one quarter of the number of downgrades in our sample so
we were unable to estimate the same number of coefficients. We collapsed the sponsor rating
dummy variables for all ratings between AAA and BBB into one investment-grade sponsor
dummy variable.
We find that many of the same sponsor characteristics that predict downgrades also
predict upgrades (see Table 19). In the base specification, a security issued by an investment-
grade sponsor will be upgraded about 15 percent sooner than a non-investment-grade sponsor
and securities issued by sponsors that participate in many markets are upgraded about 18 percent
sooner. The coefficient on sponsors who also service the ABS is small and insignificant, but this
is consistent with the fact that effective servicing cannot improve performance beyond the initial
quality of the loans, and the primary benefits of effective servicing involve mitigating losses
when loan quality deteriorates.
Sector results are weak for the most part but securities sponsored by foreign nonbanks
were upgraded about 50 percent later relative other sponsor types. While tier 1 capital is not
particularly informative, the Altman Z-score is highly significant with a one standard deviation
improvement in Z-score implying an 8 percent shorter time to upgrade.
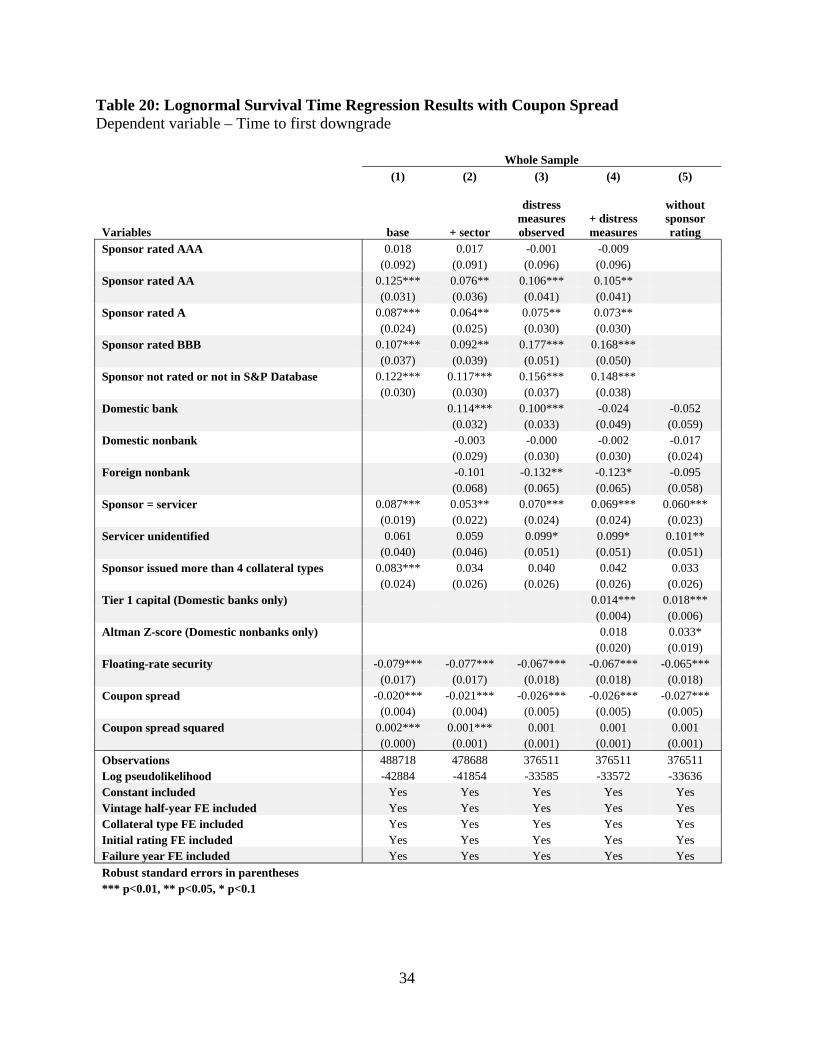
E. Coupon Spread at Issuance
To some extent, market participants likely had additional information about the quality of
the ABS. To determine how much ABS prices reflected this information, we included, where
available, the initial coupon spread and spread squared in the regression (Table 20). The
coefficient on the spread is negative and significant, which indicates that higher spreads at
issuance predict a shorter time-to-downgrade, and that the market priced in some downgrade risk
for the ABS in this sample. However, the coefficients on all of the other explanatory variables
change very little in magnitude and maintain their significance, which indicates that the price
does not reflect sponsor characteristics (see also Faltin-Traeger, Johnson and Mayer, 2010). This
17
result suggests that neither the rating agencies nor market participants fully appreciated the
sponsor’s influence on ABS performance.
Securities with a floating coupon rate also tended to be downgraded sooner than
securities with a fixed rate. We included a dummy variable that equals one if a security has a
floating-rate coupon; and the coefficient on this variable is negative and significant in every
specification. To the extent that floating-rate collateral backs floating-rate securities, this may
indicate floating-rate loans have significantly underperformed fixed-rate loans. Indeed, Standard
& Poor’s noted that in the case of CMBS, floating-rate securities performed poorly in 2009 in
part because “floating-rate loans are typically collateralized by ‘unstable’ properties and are
generally originated with the assumption that cash flows will increase to a stabilized level after
the property is complete and operational. However, achieving stabilization has been difficult for
many of these properties due to the weak economy and deteriorating property fundamentals.”13
In addition, Pence, Sherlund, and Mayer (2009) note that within subprime and alt-A
delinquencies during the recent housing crisis were “particularly pronounced for loans that
include an adjustable interest rate component.”14
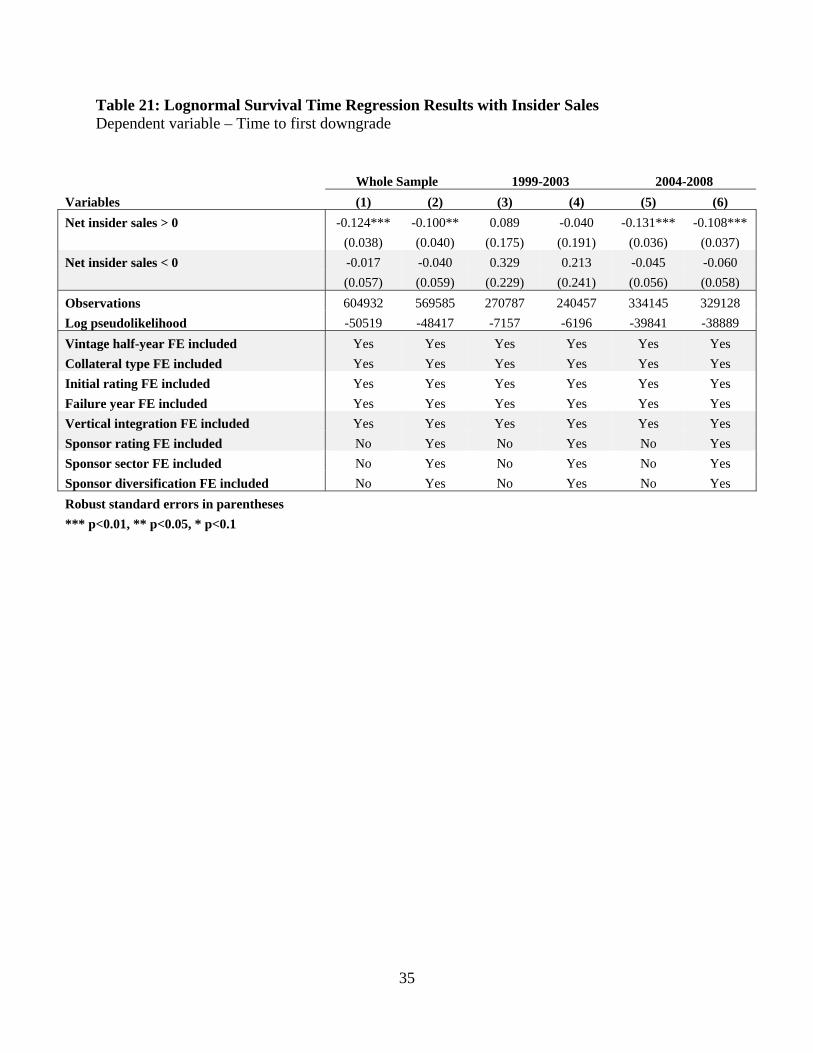
F. Insider Sales
Finally, we consider the possibility that managers might have also anticipated the success
or failure of the securities sponsored by their firm. Some have claimed that executives sell stock
in anticipation of the failure of their firms; we examine whether executives also sell stock in
anticipation of the failure of their ABS. The findings suggest that managers are at least to some
degree able to anticipate the success of their firm’s ABS. In particular, if executives of the
sponsoring firm sold stock in the sponsor, on net, in the 3 months prior to issuance of a security,
our results imply the security is downgraded about 10 percent more quickly than a security for
which there were no insider sales or purchases of sponsor stock prior to the ABS issuance (Table
21).15 This effect is significant for securities issued between 2004 and 2008, but not in the
13 Standard & Poor’s Press Release. “Lower Property Valuations Drove 2009 Floating-Rate CMBS Downgrades.” February 18, 2010. 14 Pg. 33 15 These regressions include all other variables in the full specification from Table 12 that do not include sponsor characteristics (columns 1, 3, and 5) and those in the specification with all sponsor variables besides Tier 1 Capital and Altman’s Z-score (columns 2, 4, and 6).
18
earlier subsample, which indicates that perhaps insider sales became more informative as
issuance volume began to peak.
IV. CONCLUSIONS
We find that the financial condition of an ABS sponsor is strongly related to the
performance of its securities, challenging the widely held view of securitization as a means of
separating the credit risk of assets from the credit risk of the sponsor. Securities sponsored by
investment-grade institutions are downgraded up to 20 percent later and upgraded up to 15
percent sooner than securities (with an identical rating) that are sponsored by a lender with a
non-investment grade credit rating. Securities sponsored by domestic nonbanks are downgraded
sooner than those sponsored by banks. Within domestic nonbanks, financial condition also
matters. Securities sponsored by a nonbank with a low likelihood of default – as measured by the
Altman’s Z-score – retain their initial rating longer than securities sponsored by a nonbank with
a higher likelihood of default. Within domestic banks, measures of capital also matter.
Securities sponsored by a domestic bank with relatively high tier 1 capital retain their initial
rating longer than securities sponsored by a domestic bank with a lower tier 1 capital.
Two explanations for these results are plausible. The first arises from the well-known
result that reputation is an imperfect mechanism to discipline corporate performance, especially
when firms face a risk of failure. Reputation may play an important role in the ABS market
because, sponsors know more about the assets underlying their own securitizations than rating
agencies or investors. Sponsors have the incentive to issue high-quality ABS because investors
may punish firms that issue poorly performing securities by raising spreads on future issuance.
However, as the financial condition of a sponsor deteriorates, the benefit of future business
opportunities falls relative to the expected cost of bankruptcy, and the force of the investors’
“threat” declines. Financially troubled sponsors might meet the short-term demands of staying in
business by lowering lending standards, increasing origination, and originating troubled
securities, even if issuing these securities comes with a significant reputational cost.
Another explanation for these results is that sponsors with low ratings may operate in
lines of business where assets are more likely to be impaired over time. Although our analysis
attempts to control for lines of business using asset-type controls, these lines of business may be
even more specialized (e.g. prime versus subprime auto loans) than the controls in our regression

19
can account for. Because our dataset does not include the performance of the underlying assets,
we were unable to control for this level of specialization. That said, to the extent that this
information may have been available to the rating agency and incorporated into their rating
methodology, this specialization would have been captured by our rating dummy variables.
Some might point to excessive competition to rate ABS that led the rating agencies to a “race to
the bottom” to issue inflated ratings.16 In this case, competition might have led agencies to
inadequately factor in sponsor quality in rating securities.
This analysis also suggests that securities perform better when sponsors service their own
securities, consistent with work by Ashcraft and Schuermann (2008) and Gan and Mayer (2006)
showing that agency conflicts can serve as an important barrier to security performance.
Finally, there is some indication that both investors and insiders acted upon additional
information related to the quality of these securities. Controlling for security rating, securities
with a higher coupon spread were downgraded sooner than securities with a lower coupon
spread, suggesting that ABS investors priced in the low quality of some of the securities.
However, its inclusion does not appreciably weaken the effects of the other variables, indicating
that investors may not have fully accounted for these sponsor-related performance risks. In
addition, securities in which the manager of the sponsoring firm sold stock in the firm also
perform worse, all else equal, suggesting that managers also appear to be able to anticipate
security performance. Insiders’ stock sales are predictive beyond the security’s rating and any
additional public information about the sponsoring firm, further highlighting the role of
asymmetric information in securitization markets. All of these results are robust to the inclusion
of controls for year of issuance, the type of collateral, and the initial credit rating of the security.
In summary, our work demonstrates that many characteristics of an entity are correlated
with the future performance of the ABS it sponsors, and we have suggested several plausible
reasons for these correlations. Whether one of these explanations, or yet another explanation, is
the dominant reason for the link between sponsors and their securitizations and measuring the
costs of overlooking this link remain topics for future research.
16 For example, see Bolton et al. (2008), Becker and Milbourn (2010), Faltin-Traeger (2009), and Sangiorgi et al. (2008).

20
REFERENCES Adelino, Manuel. 2009. “Do Investors Rely Only on Ratings? The Case of Mortgage-Backed Securities.” Working paper.
Altman, Edward. 1968. “Financial Ratios, Discriminant Analysis and the Prediction of Corporate Bankruptcy.” The Journal of Finance, 23(4): 589-609. Ashcraft, Adam B. and Til Schuermann. 2008. "Understanding the Securitization of Subprime Mortgage Credit." Foundations and Trends in Finance, 2(3): 191-309. Becker, Bo and Todd Milbourn. 2010. “How Did Increased Competition Affect Credit Ratings?" NBER Working Papers: 16404. Bolton, Patrick, Xavier Freixas, and Joel Shapiro. 2009. "The Credit Ratings Game." NBER Working Papers: 14712. Brunnermeier, M. 2009. “Deciphering the Liquidity and Credit Crunch 2007-2008.” Journal of Economic Perspectives, 23(1): 77–100. Dodd, Randall. 2007. “Subprime: Tentacles of a Crisis.” Finance & Development, 44(4): 15–20. Downing, Chris, Dwight Jaffee, and Nancy Wallace. 2009. "Is the Market for Mortgage Backed Securities a Market for Lemons?" Review of Financial Studies, 22(7): 2457-2494.
Diamond, Douglas W. 1991. “Monitoring and Reputation: The Choice between Bank Loans and Directly Placed Debt.” The Journal of Political Economy, 99(4): 689-721. Faltin-Traeger, Oliver. 2009. “Picking the Right Rating Agency: Sponsor Choice in the ABS Market,” Columbia Business School mimeo. Faltin-Traeger, Oliver, Kathleen W. Johnson, and Christopher Mayer. 2010. “Issuer Credit Quality and the Price of Asset-Backed Securities.” American Economic Review, 100(2): 501-505. Gan, Yingjin and Christopher Mayer. 2006. “Agency Conflicts, Asset Substitution, and Securitization.” NBER Working Papers: 12359. Gorton, Gary and Nicholas Souleles. 2006. “Special Purpose Vehicles and Securitization.” In The Risks of Financial Institutions. M. Carey and R. Stultz, eds., University of Chicago Press. Lakonishok, Josef, and Inmoo Lee. 2001. “Are Insider Trades Informative?” Review of Financial Studies, 14(1): 79–111.
21
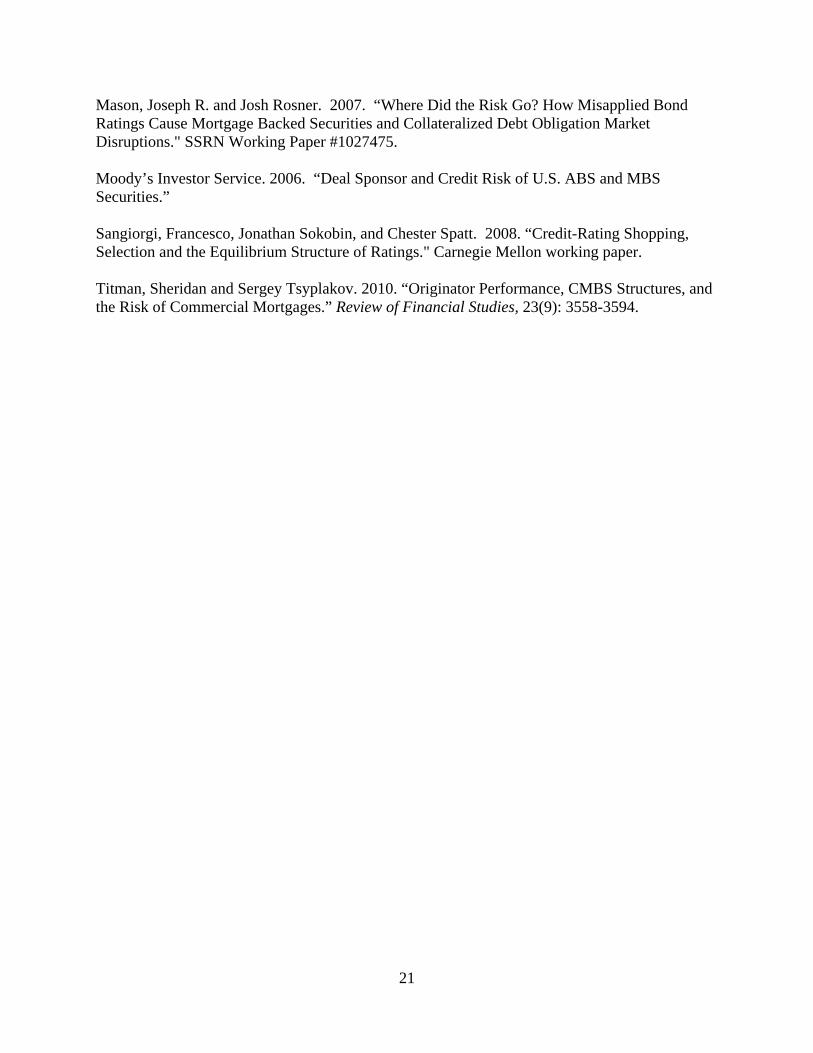
Mason, Joseph R. and Josh Rosner. 2007. “Where Did the Risk Go? How Misapplied Bond Ratings Cause Mortgage Backed Securities and Collateralized Debt Obligation Market Disruptions." SSRN Working Paper #1027475. Moody’s Investor Service. 2006. “Deal Sponsor and Credit Risk of U.S. ABS and MBS Securities.” Sangiorgi, Francesco, Jonathan Sokobin, and Chester Spatt. 2008. “Credit-Rating Shopping, Selection and the Equilibrium Structure of Ratings." Carnegie Mellon working paper. Titman, Sheridan and Sergey Tsyplakov. 2010. “Originator Performance, CMBS Structures, and the Risk of Commercial Mortgages.” Review of Financial Studies, 23(9): 3558-3594.
22
Table 1: Collateral Type
Collateral Type Securities % of
Securities % of Dollar
Volume Notes Auto loans 2,143 1.9% 5.9% CDOs 4,030 3.6% 4.2%
CMBS 7,082 6.4% 15.5% Omitted
Equipment 434 0.4% 0.6% Home equity 57,232 51.8% 45.4% Manuf. housing 572 0.5% 0.4%
RMBS 37,753 34.2% 24.1% Student loans 1,287 1.2% 3.8%
Total 110,533 100.0% 100.0%
Table 2: Security Initial Rating
Security Initial Rating Securities % of
Securities % of Dollar
Volume Notes AAA 65,500 59.3% 91.9% AA 12,592 11.4% 3.7%
A 11,829 10.7% 2.1%
BBB 12,443 11.3% 1.7% BB and below 8,169 7.4% 0.6% Omitted
Total 110,533 100.0% 100.0%
23
Table 3: Vintage
Half-year of Initial Rating Securities % of
Securities % of Dollar
Volume Notes 1999h1 1,115 1.0% 1.0% Omitted 1999h2 832 0.8% 1.0%
2000h1 3,205 2.9% 2.2%
2000h2 1,488 1.3% 1.7% 2001h1 1,963 1.8% 2.0% 2001h2 2,463 2.2% 2.5%
2002h1 3,287 3.0% 3.2% 2002h2 4,043 3.7% 3.6% 2003h1 6,507 5.9% 4.5%
2003h2 7,192 6.5% 5.3% 2004h1 7,262 6.6% 5.6% 2004h2 8,514 7.7% 7.1% 2005h1 9,524 8.6% 8.7% 2005h2 13,449 12.2% 12.4% 2006h1 10,833 9.8% 9.8% 2006h2 11,052 10.0% 10.6% 2007h1 11,328 10.2% 10.5% 2007h2 5,713 5.2% 7.0% 2008h1 763 0.7% 1.2%
Total securities 110,533 100.0% 100.0%
Table 4: Coupon Spread and Floating-rate Dummy Variable Variable Securities Mean Std. Dev. Min Max
Coupon spread 94,052 0.81 1.78 -6.77 27
Floating-rate security fixed effect 94,052 0.63 0.48 0 1
Table 5: Sponsor Rating at Issuance
Sponsor Rating at Issuance Securities % of
Securities % of Dollar
Volume Notes AAA 1,457 1.3% 1.7% AA 26,105 23.6% 23.5%
A 48,940 44.3% 42.8%
BBB 9,384 8.5% 8.2% BB and below 8,888 8.0% 8.5% Omitted NR/Not in S&P 15,759 14.3% 15.4%
Total 110,533 100.0% 100.0%
24
Table 6: Sponsor Sector
Sector Firms Percent Securities Percent Notes Domestic bank 49 11.4% 27,596 25.5% Domestic nonbank 298 69.3% 58,652 54.1%
Foreign bank 42 9.8% 20,262 18.7% Omitted
Foreign nonbank 41 9.5% 1,870 1.7%
Table 7: Percent of Securities by Vintage and Sponsor Sector
Year Initial Rating
Domestic Bank Share
Domestic Nonbank
Share
Foreign Bank Share
Foreign Nonbank
Share Total 1999 38% 57% 2% 3% 100% 2000 16% 77% 4% 3% 100%
2001 28% 57% 13% 2% 100%
2002 31% 50% 16% 3% 100% 2003 31% 48% 20% 1% 100% 2004 24% 51% 23% 2% 100%
2005 23% 56% 20% 2% 100% 2006 24% 54% 20% 1% 100% 2007 27% 54% 17% 1% 100%
2008 28% 50% 17% 5% 100%
Table 8: Tier 1 Capital Ratio and Altman Z-score Summary Statistics Variable Securities Mean Std. Dev. Min Max Tier 1 capital (Domestic banks only) 27,501 8.60 2.97 5.78 92 Altman Z-score (Domestic nonbanks only) 38,592 0.30 0.74 -1.69 18
Table 9: Diversification
Number of Collateral Types Issued
% of All Securities
Domestic Bank Share
Domestic Nonbank
Share
Foreign Bank Share
Foreign Nonbank
Share Total 1 22% 3% 90% 3% 4% 100% 2 15% 16% 47% 37% 0% 100% 3 19% 28% 33% 36% 4% 100% 4 21% 4% 89% 6% 0% 100% 5 16% 60% 9% 31% 0% 100%
6 7% 100% 0% 0% 0% 100% Note: Percent of securities by number of collateral types issued by sponsor during the five years prior to issuance
25
Table 10: Vertical Integration
Variable Securities Percent Notes Sponsor is the servicer 60,692 54.9% Sponsor is not the servicer 38,875 35.2% Omitted FE
Servicer unidentified 10,966 9.9%
Total securities 110,533 100.0%
Table 11: Insider Sales Fixed Effect Distribution by Security
Variable Securities Percent Notes No insider sales or purchases 6,401 6% Ommitted Net insider sales 98,489 89%
Net insider purchases 5,643 5%
26
Table 12: Lognormal Survival Time Regression Results Dependent variable – Time to first downgrade
Whole Sample
(1) (2) (3) (4) (5)
Variables base + sector
distress measures observed
+ distress measures
without sponsor rating
Sponsor rated AAA 0.119 0.116 0.061 0.043
(0.087) (0.086) (0.090) (0.091)
Sponsor rated AA 0.132*** 0.084** 0.106** 0.104**
(0.032) (0.037) (0.043) (0.043)
Sponsor rated A 0.103*** 0.078*** 0.077** 0.075**
(0.026) (0.027) (0.033) (0.033)
Sponsor rated BBB 0.115*** 0.101** 0.181*** 0.172***
(0.039) (0.041) (0.053) (0.053)
Sponsor not rated or not in S&P Database 0.109*** 0.099*** 0.145*** 0.130***
(0.032) (0.032) (0.041) (0.042)
Domestic bank 0.147*** 0.127*** 0.018 -0.003
(0.033) (0.034) (0.053) (0.055)
Domestic nonbank 0.023 0.026 0.019 0.005
(0.030) (0.031) (0.031) (0.025)
Foreign nonbank -0.114 -0.141* -0.130* -0.103
(0.075) (0.073) (0.072) (0.066)
Sponsor = servicer 0.090*** 0.042* 0.065*** 0.063** 0.056**
(0.020) (0.023) (0.025) (0.025) (0.024)
Servicer unidentified 0.031 0.027 0.062 0.059 0.061
(0.043) (0.048) (0.054) (0.054) (0.054)
Sponsor issued more than 4 collateral types 0.107*** 0.049* 0.063** 0.064** 0.059**
(0.024) (0.026) (0.028) (0.028) (0.027)
Tier 1 capital (Domestic banks only) 0.013*** 0.016***
(0.005) (0.005)
Altman Z-score (Domestic nonbanks only) 0.037** 0.046***
(0.016) (0.016)
Observations 582654 569585 453384 453384 453384
Log pseudolikelihood -49950 -48448 -39291 -39272 -39318
Vintage half-year FE included Yes Yes Yes Yes Yes
Collateral type FE included Yes Yes Yes Yes Yes
Initial rating FE included Yes Yes Yes Yes Yes
Failure year FE included Yes Yes Yes Yes Yes
Robust standard errors in parentheses
*** p<0.01, ** p<0.05, * p<0.1
27
Table 13: Lognormal Survival Time Regression Results – Subperiod 1999-2003 Dependent variable – Time to first downgrade
1999-2003
(1) (2) (3) (4) (5)
Variables base + sector
distress measures observed
+ distress measures
without sponsor rating
Sponsor rated AAA 1.084*** 0.951** 0.948** 0.840*
(0.405) (0.410) (0.453) (0.457)
Sponsor rated AA 1.485*** 0.890*** 0.787*** 0.759***
(0.273) (0.289) (0.289) (0.289)
Sponsor rated A 1.156*** 0.894*** 0.712*** 0.708***
(0.233) (0.224) (0.216) (0.216)
Sponsor rated BBB 0.769*** 0.486** 0.963*** 0.944***
(0.235) (0.236) (0.283) (0.282)
Sponsor not rated or not in S&P Database 0.731*** 0.721*** 0.705*** 0.592**
(0.244) (0.242) (0.259) (0.260)
Domestic bank 0.428** 0.289 0.429 0.442
(0.211) (0.220) (0.290) (0.279)
Domestic nonbank -0.600*** -0.445** -0.524** -0.684***
(0.206) (0.225) (0.229) (0.192)
Foreign nonbank -1.106*** -1.429*** -1.343*** -1.400***
(0.426) (0.420) (0.423) (0.407)
Sponsor = servicer 0.590*** 0.567*** 0.600*** 0.560*** 0.535***
(0.135) (0.135) (0.147) (0.148) (0.145)
Servicer unidentified 0.138 0.073 0.298 0.256 0.262
(0.225) (0.247) (0.311) (0.309) (0.311)
Sponsor issued more than 4 collateral types 0.256** 0.006 0.167 0.116 0.058
(0.127) (0.148) (0.171) (0.172) (0.163)
Tier 1 capital (Domestic banks only) -0.014 -0.009
(0.022) (0.021)
Altman Z-score (Domestic nonbanks only) 0.254* 0.282**
(0.136) (0.138)
Observations 248509 240457 178625 178625 178625
Log pseudolikelihood -6728 -6198 -4386 -4379 -4398
Vintage half-year FE included Yes Yes Yes Yes Yes
Collateral type FE included Yes Yes Yes Yes Yes
Initial rating FE included Yes Yes Yes Yes Yes
Failure year FE included Yes Yes Yes Yes Yes
Robust standard errors in parentheses
*** p<0.01, ** p<0.05, * p<0.1
28
Table 14: Lognormal Survival Time Regression Results – Subperiod 2004-2008 Dependent variable – Time to first downgrade
2004-2008
(1) (2) (3) (4) (5)
Variables base + sector
distress measures observed
+ distress measures
without sponsor rating
Sponsor rated AAA 0.051 0.047 -0.026 -0.038
(0.070) (0.070) (0.072) (0.072)
Sponsor rated AA 0.062** 0.044 0.057 0.056
(0.027) (0.032) (0.038) (0.038)
Sponsor rated A 0.041* 0.029 0.025 0.024
(0.022) (0.023) (0.028) (0.028)
Sponsor rated BBB 0.048 0.042 0.077 0.070
(0.038) (0.040) (0.048) (0.048)
Sponsor not rated or not in S&P Database 0.069** 0.062** 0.092*** 0.082**
(0.028) (0.028) (0.035) (0.036)
Domestic bank 0.107*** 0.089*** -0.034 -0.044
(0.030) (0.030) (0.052) (0.058)
Domestic nonbank 0.035 0.040 0.036 0.024
(0.027) (0.027) (0.028) (0.022)
Foreign nonbank -0.031 -0.030 -0.022 -0.019
(0.062) (0.062) (0.062) (0.056)
Sponsor = servicer 0.059*** 0.024 0.046** 0.045** 0.037*
(0.018) (0.020) (0.022) (0.022) (0.022)
Servicer unidentified 0.060 0.061 0.090* 0.087* 0.089*
(0.039) (0.044) (0.048) (0.048) (0.047)
Sponsor issued more than 4 collateral types 0.092*** 0.054** 0.064*** 0.066*** 0.063***
(0.022) (0.024) (0.025) (0.025) (0.024)
Tier 1 capital (Domestic banks only) 0.014*** 0.015***
(0.005) (0.006)
Altman Z-score (Domestic nonbanks only) 0.026* 0.032**
(0.014) (0.014)
Observations 334145 329128 274759 274759 274759
Log pseudolikelihood -39777 -38935 -32109 -32091 -32121
Vintage half-year FE included Yes Yes Yes Yes Yes
Collateral type FE included Yes Yes Yes Yes Yes
Initial rating FE included Yes Yes Yes Yes Yes
Failure year FE included Yes Yes Yes Yes Yes
Robust standard errors in parentheses
*** p<0.01, ** p<0.05, * p<0.1
29
Table 15: Lognormal Survival Time Regression Results – AAA Securities Only Dependent variable – Time to first downgrade
Securities Initially Rated AAA
(1) (2) (3) (4) (5)
Variables base + sector
distress measures observed
+ distress measures
without sponsor rating
Sponsor rated AAA 0.565*** 0.529*** 0.575*** 0.551***
(0.125) (0.121) (0.163) (0.162)
Sponsor rated AA 0.167*** 0.150*** 0.189*** 0.185***
(0.041) (0.043) (0.056) (0.056)
Sponsor rated A 0.096*** 0.084*** 0.099** 0.095**
(0.028) (0.030) (0.039) (0.039)
Sponsor rated BBB 0.061 0.049 0.179*** 0.175***
(0.039) (0.041) (0.057) (0.057)
Sponsor not rated or not in S&P Database 0.184*** 0.153*** 0.161*** 0.143***
(0.041) (0.039) (0.050) (0.050)
Domestic bank 0.112*** 0.094** 0.034 0.028
(0.043) (0.045) (0.053) (0.055)
Domestic nonbank 0.052 0.053 0.044 0.004
(0.037) (0.040) (0.040) (0.034)
Foreign nonbank -0.012 -0.032 -0.020 -0.034
(0.067) (0.068) (0.068) (0.061)
Sponsor = servicer 0.018 -0.022 0.004 0.002 -0.018
(0.026) (0.029) (0.032) (0.032) (0.031)
Servicer unidentified 0.002 -0.037 -0.002 -0.005 0.002
(0.061) (0.066) (0.073) (0.073) (0.072)
Sponsor issued more than 4 collateral types 0.091*** 0.048 0.056 0.056 0.067*
(0.033) (0.034) (0.037) (0.037) (0.038)
Tier 1 capital (Domestic banks only) 0.007** 0.008**
(0.003) (0.004)
Altman Z-score (Domestic nonbanks only) 0.051*** 0.069***
(0.018) (0.021)
Observations 363660 357439 286387 286387 286387
Log pseudolikelihood -19415 -18974 -15835 -15823 -15901
Vintage half-year FE included Yes Yes Yes Yes Yes
Collateral type FE included Yes Yes Yes Yes Yes
Failure year FE included Yes Yes Yes Yes Yes
Robust standard errors in parentheses
*** p<0.01, ** p<0.05, * p<0.1
30
Table 16: Lognormal Survival Time Regression Results -- Below AAA Securities Only Dependent variable – Time to first downgrade
Securities Initially Rated Below AAA
(1) (2) (3) (4) (5)
Variables base + sector
distress measures observed
+ distress measures
without sponsor rating
Sponsor rated AAA 0.016 0.023 -0.001 -0.009
(0.103) (0.102) (0.107) (0.108)
Sponsor rated AA 0.070* -0.015 0.014 0.014
(0.037) (0.044) (0.051) (0.051)
Sponsor rated A 0.067** 0.026 0.037 0.037
(0.032) (0.033) (0.039) (0.039)
Sponsor rated BBB 0.126** 0.108** 0.139** 0.130*
(0.051) (0.053) (0.068) (0.068)
Sponsor not rated or not in S&P Database 0.044 0.047 0.113** 0.106**
(0.037) (0.038) (0.048) (0.049)
Domestic bank 0.163*** 0.144*** 0.054 0.031
(0.037) (0.038) (0.061) (0.075)
Domestic nonbank -0.021 -0.018 -0.020 0.002
(0.034) (0.036) (0.037) (0.029)
Foreign nonbank -0.195** -0.218** -0.211** -0.145*
(0.088) (0.087) (0.087) (0.078)
Sponsor = servicer 0.128*** 0.080*** 0.104*** 0.104*** 0.106***
(0.023) (0.025) (0.028) (0.028) (0.027)
Servicer unidentified 0.059 0.094* 0.130** 0.128** 0.127**
(0.044) (0.049) (0.054) (0.054) (0.054)
Sponsor issued more than 4 collateral types 0.109*** 0.047 0.061* 0.062* 0.057*
(0.027) (0.030) (0.032) (0.032) (0.031)
Tier 1 capital (Domestic banks only) 0.011* 0.015*
(0.006) (0.008)
Altman Z-score (Domestic nonbanks only) 0.016 0.025
(0.019) (0.019)
Observations 218994 212146 166997 166997 166997
Log pseudolikelihood -28242 -27233 -21682 -21678 -21698
Vintage half-year FE included Yes Yes Yes Yes Yes
Collateral type FE included Yes Yes Yes Yes Yes
Initial rating FE included Yes Yes Yes Yes Yes
Failure year FE included Yes Yes Yes Yes Yes
Robust standard errors in parentheses
*** p<0.01, ** p<0.05, * p<0.1

31
Table 17: Lognormal Survival Time Regression Results – RMBS & Home Equity Only Dependent variable – Time to first downgrade
RMBS & Home Equity
(1) (2) (3) (4) (5)
Variables base + sector
distress measures observed
+ distress measures
without sponsor rating
Sponsor rated AAA/AA 0.076*** 0.026 0.033 0.038
(0.028) (0.032) (0.037) (0.037)
Sponsor rated A 0.047** 0.023 0.008 0.010
(0.022) (0.023) (0.028) (0.028)
Sponsor rated BBB 0.069** 0.053 0.112** 0.133***
(0.034) (0.036) (0.047) (0.051)
Sponsor not rated or not in S&P Database 0.082*** 0.077*** 0.074** 0.091**
(0.028) (0.028) (0.035) (0.037)
Domestic bank 0.125*** 0.107*** 0.410* 0.165
(0.030) (0.031) (0.230) (0.208)
Domestic nonbank -0.004 -0.002 0.008 0.005
(0.026) (0.027) (0.028) (0.023)
Foreign nonbank -0.103* -0.124** -0.134** -0.082
(0.061) (0.062) (0.063) (0.056)
Sponsor = servicer 0.071*** 0.036* 0.060*** 0.064*** 0.056**
(0.018) (0.020) (0.022) (0.022) (0.022)
Servicer unidentified 0.071* 0.069 0.084* 0.087* 0.090*
(0.041) (0.048) (0.051) (0.051) (0.051)
Sponsor issued more than 4 collateral types 0.104*** 0.044* 0.054** 0.053** 0.048**
(0.022) (0.024) (0.024) (0.024) (0.024)
Tier 1 capital (Domestic banks only) -0.036 -0.006
(0.027) (0.024)
Altman Z-score (Domestic nonbanks only) -0.057** -0.034
(0.028) (0.025)
Observations 491587 487094 393592 393592 393592
Log pseudolikelihood -40413 -39926 -33142 -33126 -33180
Vintage half-year FE included Yes Yes Yes Yes Yes
Collateral type FE included Yes Yes Yes Yes Yes
Initial rating FE included Yes Yes Yes Yes Yes
Failure year FE included Yes Yes Yes Yes Yes
Robust standard errors in parentheses
*** p<0.01, ** p<0.05, * p<0.1
32
Table 18: Lognormal Survival Time Regression Results using Severe Downgrades Dependent variable – Time to first severe downgrade
Whole Sample (1) (2) (3) (4) (5)
Variables base + sector
distress measures observed
+ distress measures
without sponsor rating
Sponsor rated AAA 0.094 0.090 0.088 0.081 (0.063) (0.064) (0.068) (0.068) Sponsor rated AA 0.121*** 0.122*** 0.142*** 0.141*** (0.029) (0.034) (0.039) (0.039) Sponsor rated A 0.035 0.029 0.047* 0.046 (0.023) (0.025) (0.028) (0.028) Sponsor rated BBB 0.087** 0.082** 0.102** 0.101** (0.037) (0.039) (0.047) (0.047) Sponsor not rated or not in S&P Database 0.100*** 0.087*** 0.100*** 0.095*** (0.028) (0.028) (0.034) (0.035) Domestic bank 0.125*** 0.124*** 0.126** 0.099 (0.029) (0.030) (0.063) (0.084) Domestic nonbank 0.066** 0.072** 0.068** 0.022 (0.027) (0.028) (0.029) (0.023) Foreign nonbank -0.007 -0.016 -0.014 -0.042 (0.054) (0.056) (0.056) (0.049) Sponsor = servicer 0.041** -0.000 -0.004 -0.004 -0.022 (0.017) (0.019) (0.021) (0.021) (0.021) Servicer unidentified 0.055 0.036 0.049 0.046 0.058 (0.041) (0.047) (0.051) (0.052) (0.050) Sponsor issued more than 4 collateral types 0.071*** 0.034 0.036 0.036 0.040 (0.021) (0.024) (0.025) (0.025) (0.026) Tier 1 capital (Domestic banks only) -0.000 0.002 (0.007) (0.009) Altman Z-score (Domestic nonbanks only) 0.017 0.025* (0.013) (0.014) Observations 582654 569585 453384 453384 453384 Log pseudolikelihood -21924 -21475 -17835 -17832 -17916 Constant included Yes Yes Yes Yes Yes Vintage half-year FE included Yes Yes Yes Yes Yes Collateral type FE included Yes Yes Yes Yes Yes Initial rating FE included Yes Yes Yes Yes Yes Failure year FE included Yes Yes Yes Yes Yes Robust standard errors in parentheses *** p<0.01, ** p<0.05, * p<0.1
33
Table 19: Lognormal Survival Time Regression Results using Upgrades Dependent variable – Time to first upgrade
Whole Sample (1) (2) (3) (4) (5)
Variables base + sector
distress measures observed
+ distress measures
without sponsor rating
Sponsor rated investment-grade -0.152* -0.102 -0.048 -0.045 (0.090) (0.000) (0.099) (0.099) Sponsor not rated or not in S&P Database -0.103 -0.065 -0.079 -0.000 (0.101) (0.000) (0.113) (0.116) Domestic bank -0.098 -0.106 -0.088 -0.088 (0.000) (0.070) (0.102) (0.102) Domestic nonbank -0.071 0.048 0.081 0.094 (0.000) (0.069) (0.070) (0.066) Foreign nonbank 0.498 0.591*** 0.511*** 0.530*** (0.000) (0.194) (0.190) (0.189) Sponsor = servicer 0.004 0.056 -0.014 -0.010 -0.009 (0.045) (0.000) (0.056) (0.056) (0.056) Servicer unidentified 0.067 0.040 0.024 0.043 0.045 (0.077) (0.000) (0.084) (0.084) (0.085) Sponsor issued more than 4 collateral types -0.200*** -0.206 -0.104* -0.095* -0.094* (0.047) (0.000) (0.053) (0.053) (0.053) Tier 1 capital (Domestic banks only) -0.002 -0.002 (0.008) (0.008) Altman Z-score (Domestic nonbanks only) -0.107*** -0.104*** (0.031) (0.030) Observations 269456 261386 208380 208380 208380 Log pseudolikelihood -12068 -11587 -8787 -8752 -8753 Constant included Yes Yes Yes Yes Yes Vintage half-year FE included Yes Yes Yes Yes Yes Collateral type FE included Yes Yes Yes Yes Yes Initial rating FE included Yes Yes Yes Yes Yes Failure year FE included Yes Yes Yes Yes Yes Robust standard errors in parentheses *** p<0.01, ** p<0.05, * p<0.1
34
Table 20: Lognormal Survival Time Regression Results with Coupon Spread Dependent variable – Time to first downgrade
Whole Sample
(1) (2) (3) (4) (5)
Variables base + sector
distress measures observed
+ distress measures
without sponsor rating
Sponsor rated AAA 0.018 0.017 -0.001 -0.009 (0.092) (0.091) (0.096) (0.096) Sponsor rated AA 0.125*** 0.076** 0.106*** 0.105** (0.031) (0.036) (0.041) (0.041) Sponsor rated A 0.087*** 0.064** 0.075** 0.073** (0.024) (0.025) (0.030) (0.030) Sponsor rated BBB 0.107*** 0.092** 0.177*** 0.168*** (0.037) (0.039) (0.051) (0.050) Sponsor not rated or not in S&P Database 0.122*** 0.117*** 0.156*** 0.148*** (0.030) (0.030) (0.037) (0.038) Domestic bank 0.114*** 0.100*** -0.024 -0.052 (0.032) (0.033) (0.049) (0.059) Domestic nonbank -0.003 -0.000 -0.002 -0.017 (0.029) (0.030) (0.030) (0.024) Foreign nonbank -0.101 -0.132** -0.123* -0.095 (0.068) (0.065) (0.065) (0.058) Sponsor = servicer 0.087*** 0.053** 0.070*** 0.069*** 0.060*** (0.019) (0.022) (0.024) (0.024) (0.023) Servicer unidentified 0.061 0.059 0.099* 0.099* 0.101** (0.040) (0.046) (0.051) (0.051) (0.051) Sponsor issued more than 4 collateral types 0.083*** 0.034 0.040 0.042 0.033 (0.024) (0.026) (0.026) (0.026) (0.026) Tier 1 capital (Domestic banks only) 0.014*** 0.018*** (0.004) (0.006) Altman Z-score (Domestic nonbanks only) 0.018 0.033* (0.020) (0.019) Floating-rate security -0.079*** -0.077*** -0.067*** -0.067*** -0.065*** (0.017) (0.017) (0.018) (0.018) (0.018) Coupon spread -0.020*** -0.021*** -0.026*** -0.026*** -0.027*** (0.004) (0.004) (0.005) (0.005) (0.005) Coupon spread squared 0.002*** 0.001*** 0.001 0.001 0.001 (0.000) (0.001) (0.001) (0.001) (0.001)
Observations 488718 478688 376511 376511 376511 Log pseudolikelihood -42884 -41854 -33585 -33572 -33636 Constant included Yes Yes Yes Yes Yes Vintage half-year FE included Yes Yes Yes Yes Yes Collateral type FE included Yes Yes Yes Yes Yes Initial rating FE included Yes Yes Yes Yes Yes Failure year FE included Yes Yes Yes Yes Yes
Robust standard errors in parentheses *** p<0.01, ** p<0.05, * p<0.1
35
Table 21: Lognormal Survival Time Regression Results with Insider Sales Dependent variable – Time to first downgrade
Whole Sample 1999-2003 2004-2008
Variables (1) (2) (3) (4) (5) (6)
Net insider sales > 0 -0.124*** -0.100** 0.089 -0.040 -0.131*** -0.108***
(0.038) (0.040) (0.175) (0.191) (0.036) (0.037)
Net insider sales < 0 -0.017 -0.040 0.329 0.213 -0.045 -0.060
(0.057) (0.059) (0.229) (0.241) (0.056) (0.058)
Observations 604932 569585 270787 240457 334145 329128
Log pseudolikelihood -50519 -48417 -7157 -6196 -39841 -38889
Vintage half-year FE included Yes Yes Yes Yes Yes Yes
Collateral type FE included Yes Yes Yes Yes Yes Yes
Initial rating FE included Yes Yes Yes Yes Yes Yes
Failure year FE included Yes Yes Yes Yes Yes Yes
Vertical integration FE included Yes Yes Yes Yes Yes Yes
Sponsor rating FE included No Yes No Yes No Yes
Sponsor sector FE included No Yes No Yes No Yes
Sponsor diversification FE included No Yes No Yes No Yes
Robust standard errors in parentheses
*** p<0.01, ** p<0.05, * p<0.1
Preliminary and Incomplete – Do not quote or cite
36
Figure 1:
0.0
05.0
1.0
15.0
2H
aza
rd
0 12 24 36 48 60 72 84 96Months
Whole Sample 1999-2003 2004-2008
Raw Hazard Functions
Preliminary and Incomplete – Do not quote or cite
37
Figure 2:
Preliminary and Incomplete – Do not quote or cite
38
Figure 3:
Preliminary and Incomplete – Do not quote or cite
39
Figure 4:
Preliminary and Incomplete – Do not quote or cite
40
Figure 5:
Preliminary and Incomplete – Do not quote or cite
41
Figure 6:
Preliminary and Incomplete – Do not quote or cite
42
Appendix Table 1: Pairwise Correlations
Sponsor: AAA
Sponsor: AA
Sponsor: A
Sponsor: BBB
Sponsor: < BBB
Sponsor: NR
Domestic bank
Domestic nonbank
Foreign bank
Foreign nonbank
More 4 coll. types
Tier 1 capital
Altman's Z‐score
Initial rating FE (AAA) ‐0.01 ‐0.01 0.07 0.05 0.00 ‐0.11 0.07 ‐0.02 ‐0.05 0.00 0.04 0.06 ‐0.02 Initial rating FE (AA) 0.00 0.00 ‐0.03 ‐0.03 0.01 0.06 ‐0.05 0.03 0.02 0.00 ‐0.03 ‐0.05 0.01 Initial rating FE (A) 0.00 ‐0.01 ‐0.03 ‐0.02 0.00 0.07 ‐0.04 0.02 0.02 0.01 ‐0.02 ‐0.04 0.02 Initial rating FE (BBB) 0.01 0.00 ‐0.04 ‐0.02 0.00 0.07 ‐0.04 0.01 0.02 0.00 ‐0.02 ‐0.04 0.02 Initial rating FE (Below BBB) 0.00 0.03 0.00 ‐0.01 ‐0.01 ‐0.02 0.03 ‐0.04 0.02 ‐0.01 0.02 0.02 ‐0.02 Sponsor rated AAA 1.00 ‐0.07 ‐0.12 ‐0.05 ‐0.04 ‐0.06 ‐0.08 0.09 ‐0.03 0.00 0.05 ‐0.07 0.16 Sponsor rated AA 1.00 ‐0.46 ‐0.17 ‐0.14 ‐0.22 0.16 ‐0.51 0.51 ‐0.06 0.11 0.16 ‐0.14 Sponsor rated A 1.00 ‐0.31 ‐0.25 ‐0.38 0.09 0.05 ‐0.12 ‐0.07 0.07 0.08 ‐0.05 Sponsor rated BBB 1.00 ‐0.09 ‐0.14 0.04 0.04 ‐0.15 0.17 ‐0.19 0.07 ‐0.03 Sponsor rated below BBB 1.00 ‐0.12 ‐0.15 0.22 ‐0.12 0.02 ‐0.15 ‐0.14 0.03 Sponsor not rated 1.00 ‐0.22 0.31 ‐0.18 0.01 0.03 ‐0.22 0.21 Domestic bank 1.00 ‐0.66 ‐0.27 ‐0.08 0.43 0.93 ‐0.18 Domestic nonbank 1.00 ‐0.50 ‐0.15 ‐0.37 ‐0.61 0.29 Foreign bank 1.00 ‐0.06 ‐0.01 ‐0.25 ‐0.13 Foreign nonbank 1.00 ‐0.05 ‐0.08 ‐0.04 Sponsor issued more than 4 coll. types 1.00 0.35 ‐0.07 Tier 1 capital (Domestic banks only) 1.00 ‐0.16 Altman's Z (Domestic nonbanks only) 1.00
Preliminary and Incomplete – Do not quote or cite
43
Appendix Table 2: Regression Fixed Effects – Whole Sample Dependent variable – Time to first downgrade
Whole Sample
(1) (2) (3) (4) (5)
Variables base + sector
distress measures observed
+ distress measures
without sponsor rating
Collateral type FE - Auto loans -0.492*** -0.460*** -0.849*** -0.886*** -0.890***
(0.125) (0.121) (0.133) (0.133) (0.135)
Collateral type FE - CDOs -1.262*** -1.211*** -1.230*** -1.255*** -1.247***
(0.091) (0.094) (0.114) (0.115) (0.114)
Collateral type FE - Equipment -0.619** -0.543* -0.070 -0.076 -0.098
(0.293) (0.301) (0.299) (0.299) (0.295)
Collateral type FE - Home equity -1.081*** -1.067*** -1.138*** -1.138*** -1.134***
(0.068) (0.069) (0.073) (0.073) (0.072)
Collateral type FE - Manuf. Housing -2.382*** -2.341*** -2.410*** -2.419*** -2.428***
(0.148) (0.144) (0.149) (0.149) (0.150)
Collateral type FE - RMBS -0.849*** -0.851*** -0.941*** -0.939*** -0.931***
(0.064) (0.065) (0.069) (0.069) (0.068)
Collateral type FE - Student loans -0.278 -0.331 -0.506** -0.505** -0.488**
(0.200) (0.202) (0.218) (0.218) (0.217)
Initial rating FE (AAA) 1.299*** 1.293*** 1.314*** 1.314*** 1.313***
(0.058) (0.058) (0.064) (0.064) (0.064)
Initial rating FE (AA) 0.734*** 0.739*** 0.753*** 0.753*** 0.755***
(0.036) (0.037) (0.041) (0.041) (0.041)
Initial rating FE (A) 0.381*** 0.387*** 0.396*** 0.396*** 0.398***
(0.024) (0.024) (0.027) (0.027) (0.027)
Initial rating FE (BBB) 0.123*** 0.128*** 0.136*** 0.135*** 0.138***
(0.017) (0.017) (0.019) (0.019) (0.019)
Failure year FE (2007) -0.157*** -0.159*** -0.145*** -0.145*** -0.142***
(0.027) (0.027) (0.030) (0.030) (0.030)
Failure year FE (2008) -0.704*** -0.686*** -0.641*** -0.641*** -0.636***
(0.071) (0.070) (0.076) (0.076) (0.075)
Failure year FE (2009) -0.187*** -0.182** -0.187** -0.187** -0.182**
(0.071) (0.071) (0.080) (0.080) (0.080)
Constant 5.568*** 4.278*** 4.279*** 5.625*** 4.376***
(0.116) (0.185) (0.202) (0.132) (0.203)
ln(sigma) -0.394*** -0.415*** -0.436*** -0.437*** -0.437***
(0.037) (0.037) (0.041) (0.041) (0.041)
Robust standard errors in parentheses
*** p<0.01, ** p<0.05, * p<0.1