Embed Size (px)
Citation preview
Spring 2013 MCAS Tests:Summary of State ResultsSeptember 2013
Massachusetts Department of Elementary and Secondary Education75 Pleasant Street, Malden, MA 02148-4906Phone 781-338-3000 TTY: N.E.T. Relay 800-439-2370www.doe.mass.edu
This document was prepared by the Massachusetts Department of Elementary and Secondary Education
Mitchell D. Chester, Ed.D.Commissioner
The Massachusetts Department of Elementary and Secondary Education, an affirmative action employer, is committed to ensuring that all of its programs and facilities are accessible to all members of the public.
We do not discriminate on the basis of age, color, disability, gender identity, national origin, race, religion, sex or sexual orientation.
Inquiries regarding the Department’s compliance with Title IX and other civil rights laws may be directed to the Human Resources Director, 75 Pleasant St., Malden, MA 02148 781-338-6105.
© 2013 Massachusetts Department of Elementary and Secondary EducationPermission is hereby granted to copy any or all parts of this document for non-commercial educational purposes. Please
credit the “Massachusetts Department of Elementary and Secondary Education.”
This document printed on recycled paper
Massachusetts Department of Elementary and Secondary Education75 Pleasant Street, Malden, MA 02148-4906
Phone 781-338-3000 TTY: N.E.T. Relay 800-439-2370http://www.doe.mass.edu/
Table of Contents
Executive Summary........................................................................................1I. 2013 MCAS at a Glance........................................................................6II. Summary of the 2013 Statewide MCAS Results.................................14III. 2013 Statewide MCAS Participation Results......................................25IV. 2013 Statewide MCAS Results Disaggregated by Subgroup..............26V. Statewide MCAS Trend Results..........................................................35VI. Statewide MCAS Trend Results Disaggregated by Subgroup............42
Executive Summary
The sixteenth administration of the Massachusetts Comprehensive Assessment System (MCAS) tests took place in spring 2013.
Participation
A total of 548,788 Massachusetts public school students in grades 3–10 participated in a total of 17 MCAS tests in English Language Arts (ELA), Mathematics, and Science and Technology/Engineering (STE).1 Participation rates remained very high, ranging from 98 to 100 percent across the grades and subjects tested.
In 2013, 9,235 students with disabilities participated in the MCAS Alternate Assessment (MCAS-Alt) by submitting portfolios documenting their academic achievement in one or more subjects in grades 3–12.
Overall Achievement
Student achievement statewide improved on 12 of the 17 MCAS tests administered in 2013. Between 2012 and 2013, the percentage of students scoring Proficient or higher2 improved in ELA at grades 5, 6, 7, and 10; in Mathematics at all grades; and in STE at grade 10. At the high school level, student achievement improved in all subjects.
Trends in Achievement
Because measures of student achievement often change incrementally over short periods of time, the Department is presenting a series of five-year views in this report in order to reveal achievement trends that have occurred over multiple years. Over the five-year period from 2009 to 2013, an increase of five or more percentage points indicates improvement that has been sustained. The grades and subject areas in which the percentage of students scoring Proficient or higher increased by five or more points over the last five years are shown in Figure E-1.
1 The four subject-specific high school Science and Technology/Engineering tests in Biology, Chemistry, Introductory Physics, and Technology/Engineering given in grades 9 and 10 are counted here as one operational test.2 In this report, Proficient or higher refers to the cumulative percentage of students scoring at the Proficient and Advanced levels.
Spring 2013 MCAS Tests: Summary of State Results 1
The five-year increases in student achievement shown above include:
In ELA: Grade 10 increased from 81 to 91 percent Proficient or higher.
In Mathematics: Grade 3 increased from 60 to 66 percent Proficient or higher. Grade 5 increased from 54 to 61 percent Proficient or higher. Grade 8 increased from 48 to 55 percent Proficient or higher. Grade 10 increased from 75 to 80 percent Proficient or higher.
In STE: Grade 10 increased from 61 to 71 percent Proficient or higher.
At the high school level, where high stakes have been attached to tests in ELA and Mathematics since 2001 (for the class of 2003), the percentage of students scoring Proficient or higher in ELA has increased from 38 percent in 1998 to 91 percent in 2013, and in Mathematics from 24 percent in 1998 to 80 percent in 2013. Beginning with the class of 2010, students must also earn a score of Needs Improvement or higher on one of the four high school MCAS STE tests to be eligible to receive a high school diploma. In STE, the percentage of students scoring Proficient or higher has increased from 57 percent in 2008 to 71 percent in 2013.
Figure E-2 shows the improvement in the percentage of students scoring Proficient or higher in grade 10 ELA and Mathematics over the duration of the MCAS program. Figure E-2 also shows the improvement in the percentage of students scoring Proficient or higher on the high school STE test since 2008.
Spring 2013 MCAS Tests: Summary of State Results 2
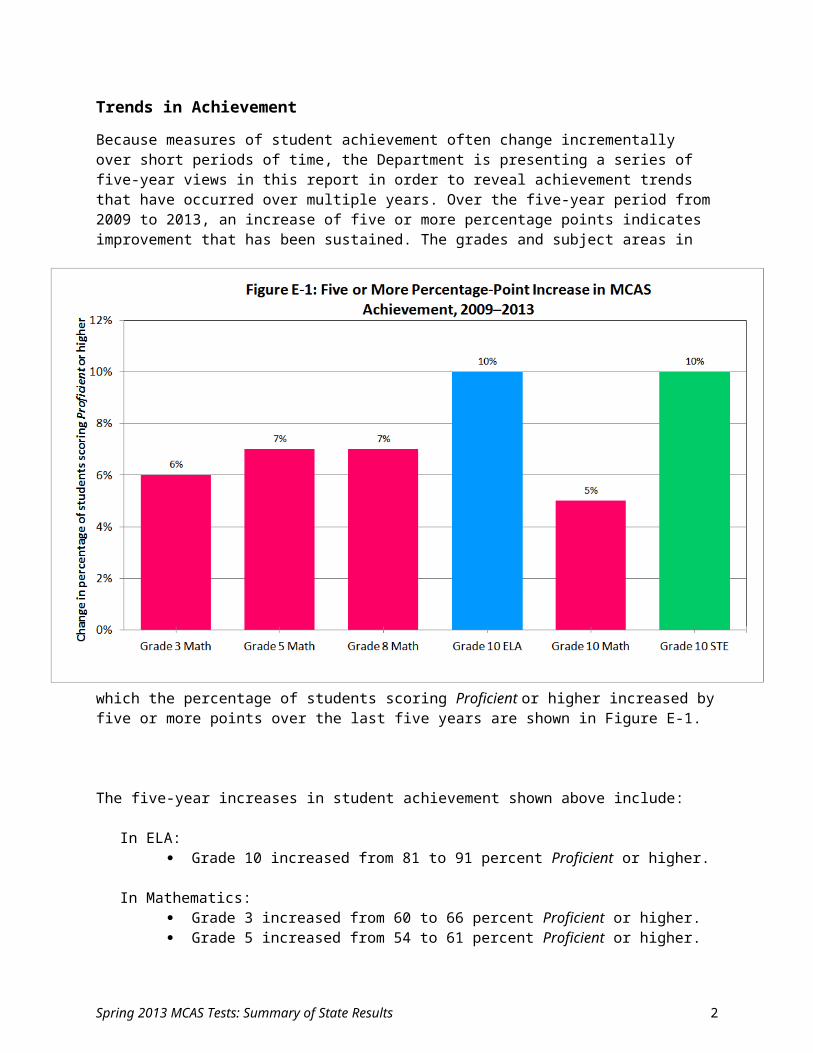
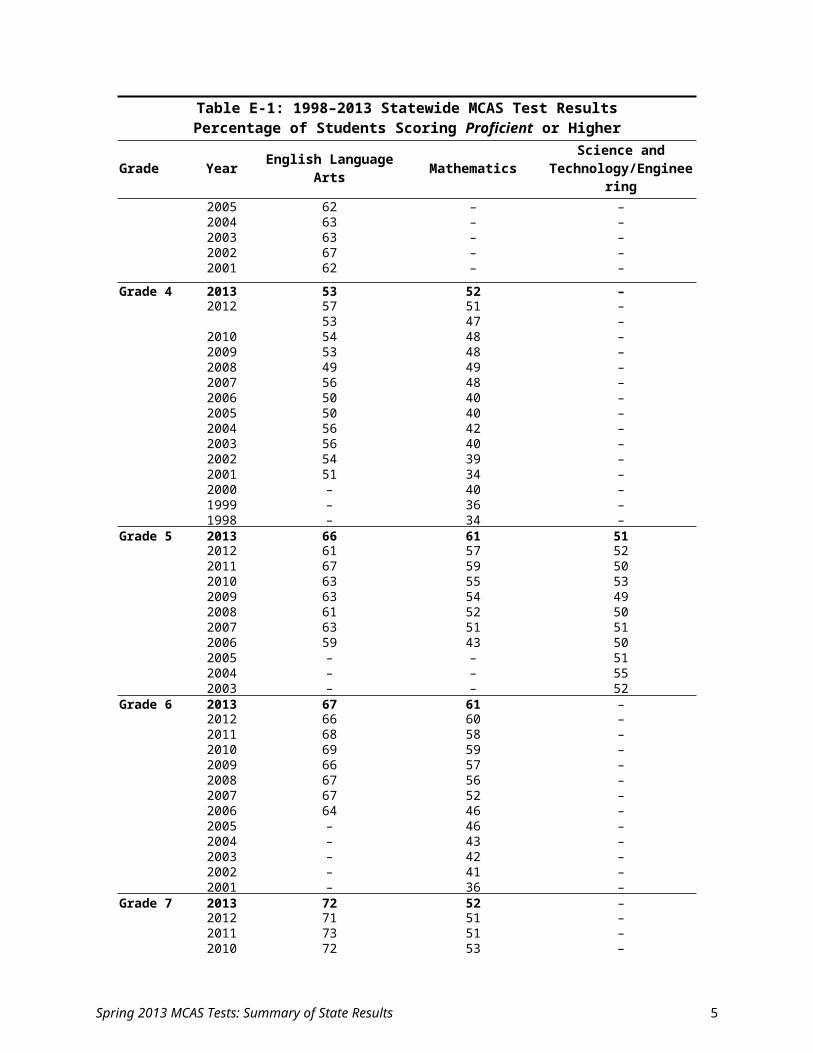
Table E-1 below shows ELA, Mathematics, and STE results at all grade levels for each test since its inception.
Table E-1: 1998–2013 Statewide MCAS Test ResultsPercentage of Students Scoring Proficient or Higher
Grade Year English Language Arts Mathematics Science and Technology/Engineering
Grade 3 2013 57 66 –2012 61 61 –2011 61 66 –2010 63 65 –2009 57 60 –2008 56 61 –2007 59 60 –
Grade 3 2006 58 52 –2005 62 – –2004 63 – –
Spring 2013 MCAS Tests: Summary of State Results 3
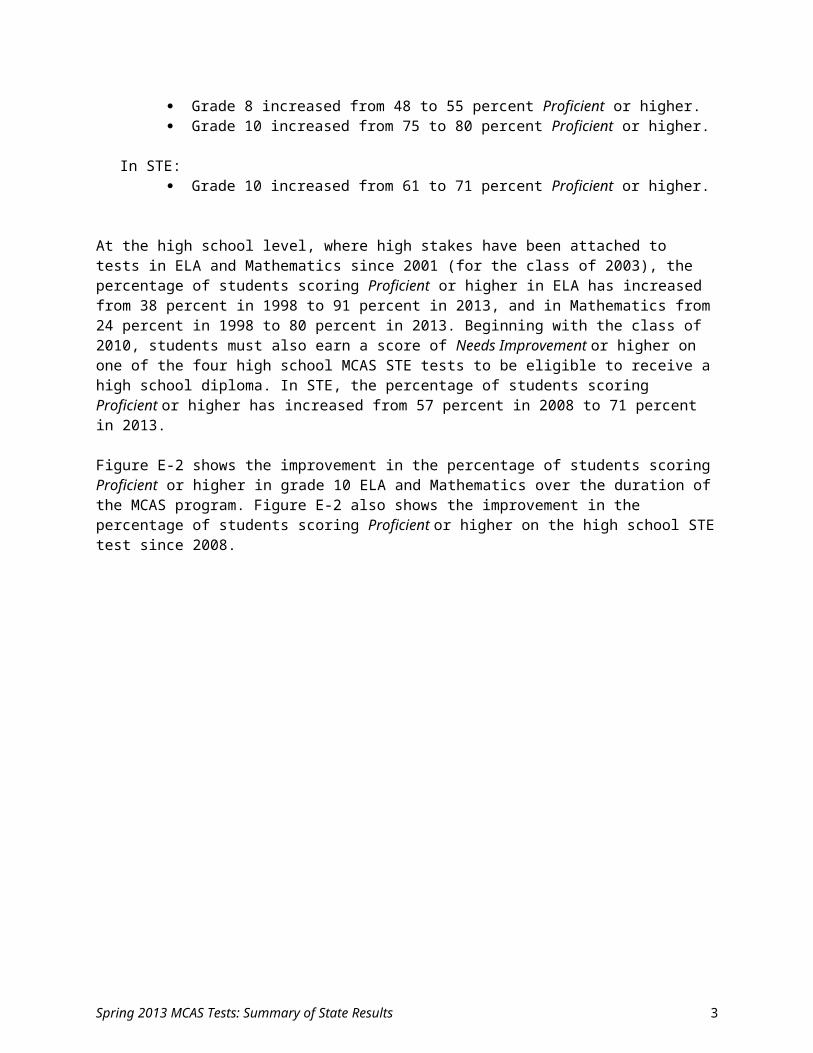
Table E-1: 1998–2013 Statewide MCAS Test ResultsPercentage of Students Scoring Proficient or Higher
Grade Year English Language Arts Mathematics Science and Technology/Engineering
2003 63 – –2002 67 – –2001 62 – –
Grade 4 2013 53 52 –2012 57 51 –
2011 53 47 –2010 54 48 –2009 53 48 –2008 49 49 –2007 56 48 –2006 50 40 –2005 50 40 –2004 56 42 –2003 56 40 –2002 54 39 –2001 51 34 –2000 – 40 –1999 – 36 –1998 – 34 –
Grade 5 2013 66 61 512012 61 57 522011 67 59 502010 63 55 532009 63 54 492008 61 52 502007 63 51 512006 59 43 502005 – – 512004 – – 552003 – – 52
Grade 6 2013 67 61 –2012 66 60 –2011 68 58 –2010 69 59 –2009 66 57 –2008 67 56 –2007 67 52 –2006 64 46 –2005 – 46 –2004 – 43 –2003 – 42 –2002 – 41 –2001 – 36 –
Grade 7 2013 72 52 –2012 71 51 –2011 73 51 –2010 72 53 –2009 70 49 –
Grade 7 2008 69 47 –2007 69 46 –2006 65 40 –
Spring 2013 MCAS Tests: Summary of State Results 4
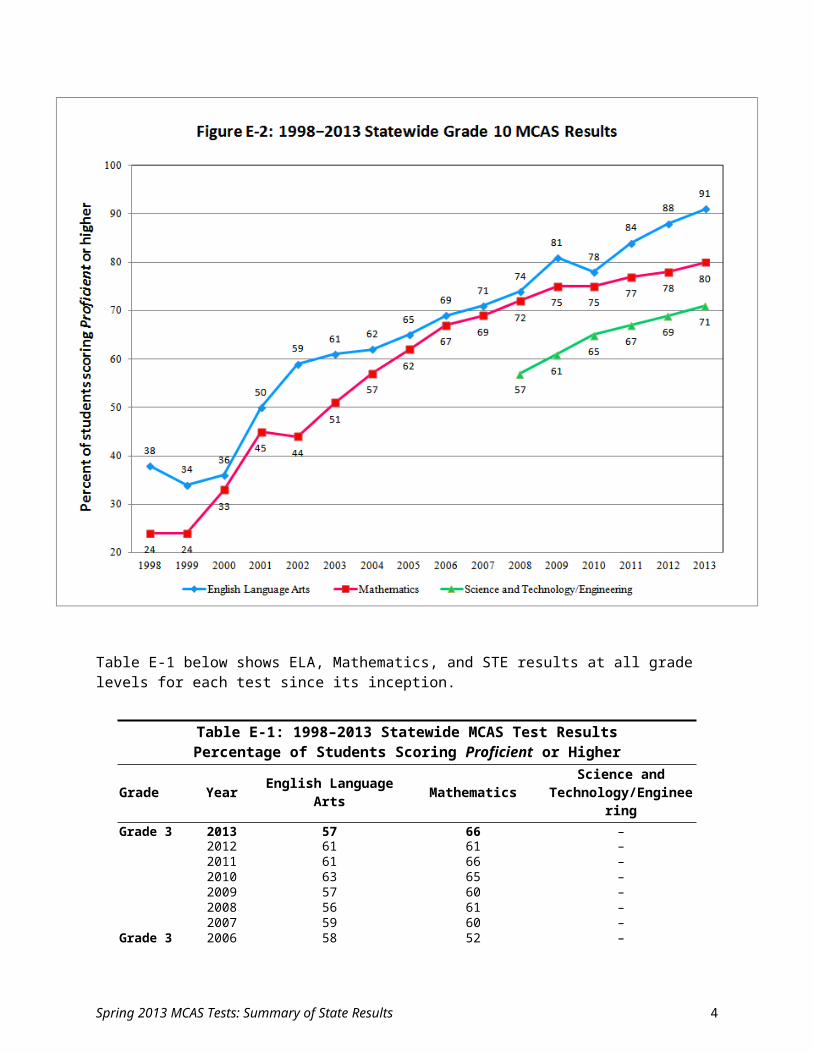
Table E-1: 1998–2013 Statewide MCAS Test ResultsPercentage of Students Scoring Proficient or Higher
Grade Year English Language Arts Mathematics Science and Technology/Engineering
2005 66 – –2004 68 – –2003 66 – –2002 64 – –2001 55 – –
Grade 8 2013 78 55 392012 81 52 432011 79 52 392010 78 51 402009 78 48 392008 75 49 392007 75 45 332006 74 40 322005 – 39 332004 – 39 332003 – 37 322002 – 34 –2001 – 34 –2000 – 34 –1999 – 28 –1998 – 31 –
Grade 10a 2013 91 80 712012 88 78 692011 84 77 672010 78 75 652009 81 75 612008 75 72 572007 71 68 –2006 70 67 –2005 64 61 –2004 62 57 –2003 61 51 –2002 59 44 –2001 51 45 –2000 36 33 –1999 34 24 –1998 38 24 –
a Grade 10 STE results are reported based on students’ best performance on any STE test taken in grade 9 or grade 10; only students continuously enrolled in Massachusetts public schools from fall of grade 9 through spring of grade 10 are included.
Spring 2013 MCAS Tests: Summary of State Results 5
I. 2013 MCAS at a Glance
What is MCAS?
The Massachusetts Comprehensive Assessment System (MCAS) is the Commonwealth’s standards-based student assessment program.
MCAS has three primary purposes: (1) to inform and improve curriculum and instruction; (2) to evaluate student, school, and district performance according to the Massachusetts curriculum framework content standards and MCAS performance standards; and (3) to determine whether a student has met the state requirements for the Competency Determination (i.e., whether a student is eligible for a high school diploma).
Who participates in MCAS?
All students who are enrolled in the tested grades and who are educated at public expense are required by state and federal law to participate in MCAS testing. Figure 3 and the table below show the number and percentage of students by race who took the 2013 MCAS tests in ELA in grades 3–8 and 10.
6%8%
16%
3%0%0%
67%
Figure 3: 2013 ELA Participation by Race, Grades 3−8, 10
AsianAfrican American/BlackHispanic or LatinoMulti-race, Non-Hispanic or LatinoAmer. Ind. or Alaska Nat.Nat. Haw. or Pacif. Isl.White
Spring 2013 MCAS Tests: Summary of State Results 6
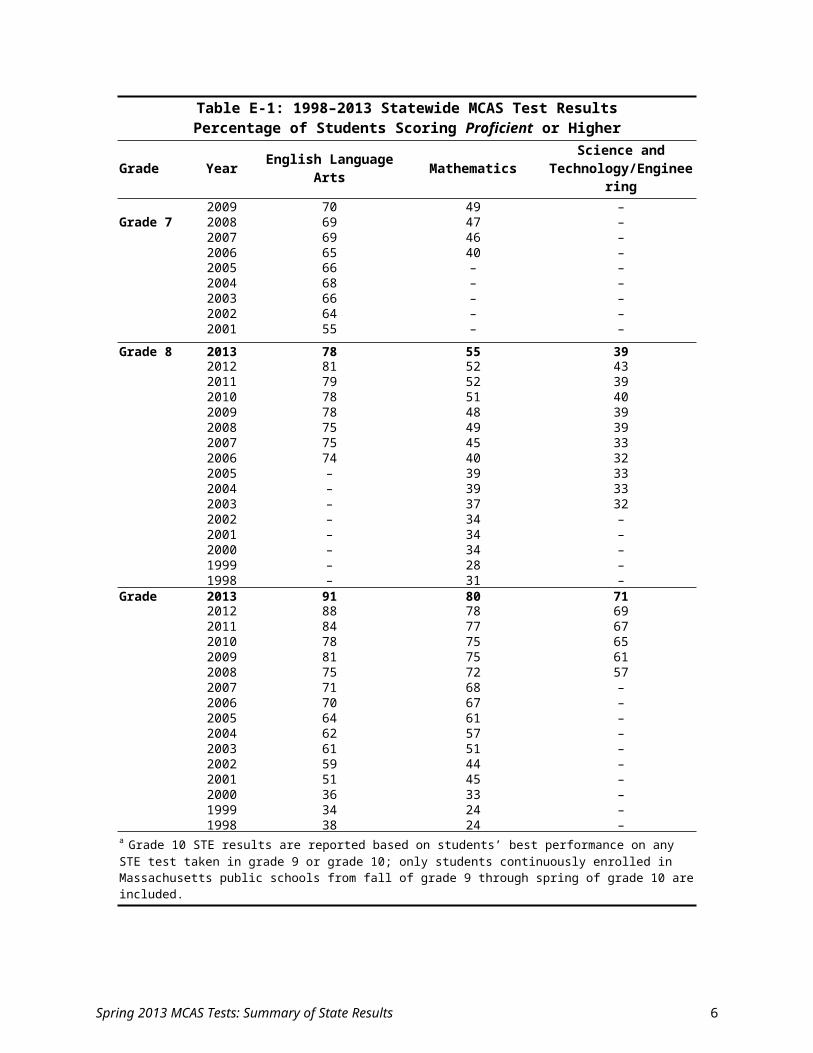
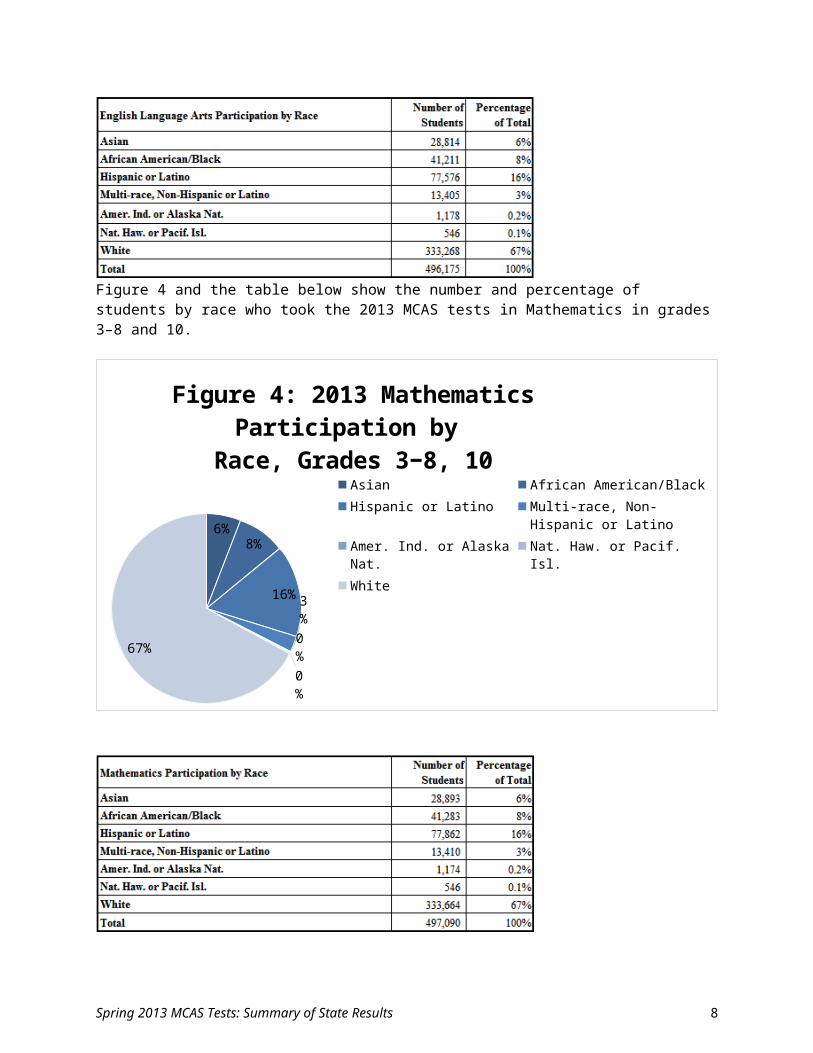
Figure 4 and the table below show the number and percentage of students by race who took the 2013 MCAS tests in Mathematics in grades 3–8 and 10.
6%
8%
16%
3%0%0%
67%
Figure 4: 2013 Mathematics Participation by Race, Grades 3−8, 10
AsianAfrican American/BlackHispanic or LatinoMulti-race, Non-Hispanic or LatinoAmer. Ind. or Alaska Nat.Nat. Haw. or Pacif. Isl.White
Spring 2013 MCAS Tests: Summary of State Results 7
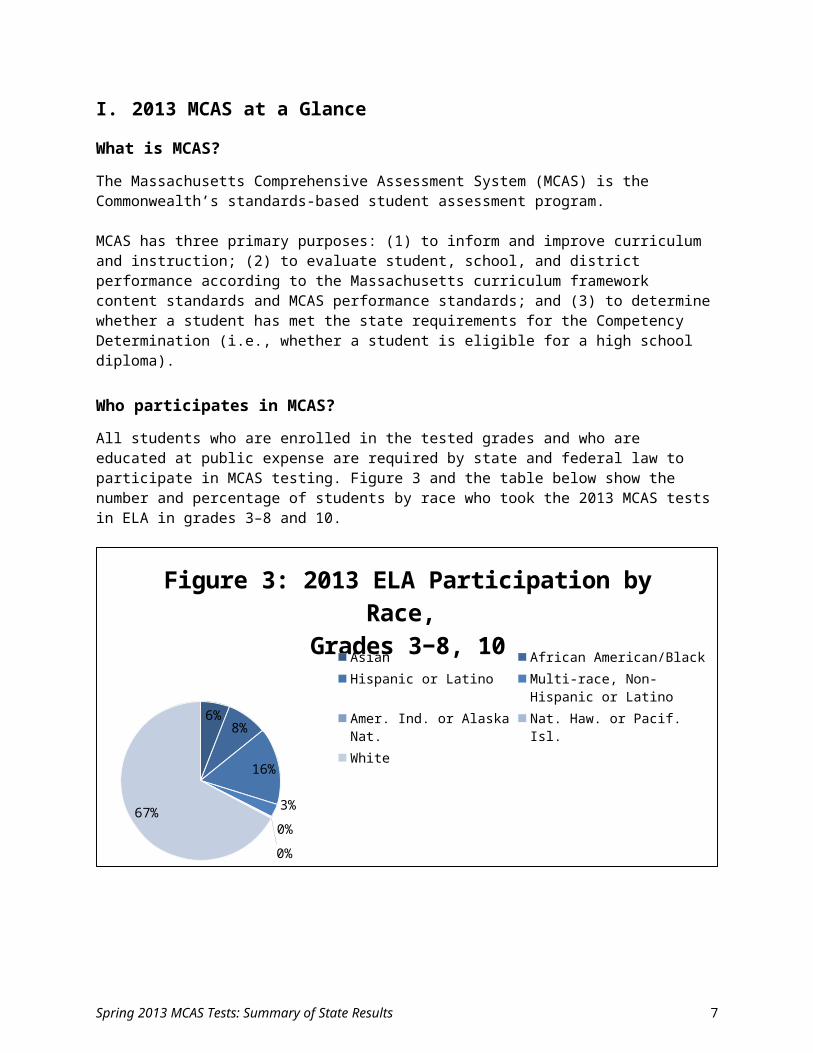
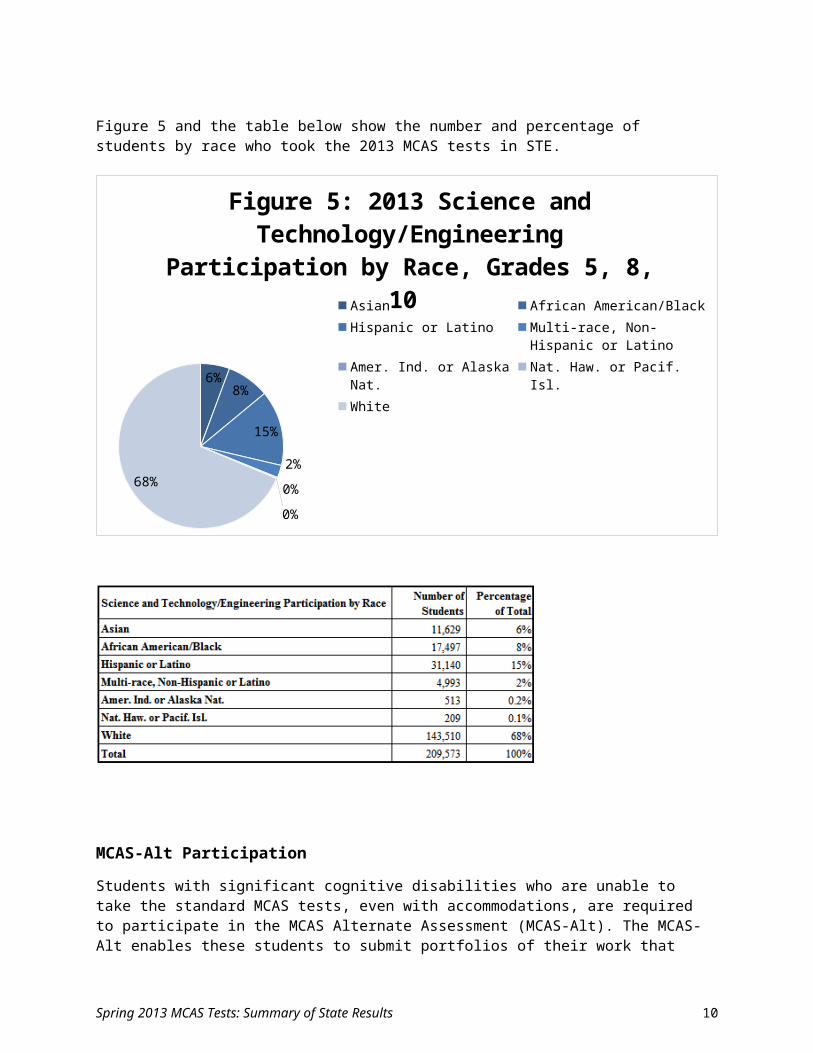
Figure 5 and the table below show the number and percentage of students by race who took the 2013 MCAS tests in STE.
6%
8%
15%
2%0%0%
68%
Figure 5: 2013 Science and Technology/Engineer-ing Participation by Race, Grades 5, 8, 10
AsianAfrican American/BlackHispanic or LatinoMulti-race, Non-Hispanic or LatinoAmer. Ind. or Alaska Nat.Nat. Haw. or Pacif. Isl.White
MCAS-Alt Participation
Students with significant cognitive disabilities who are unable to take the standard MCAS tests, even with accommodations, are required to participate in the MCAS Alternate Assessment (MCAS-Alt). The MCAS-Alt enables these students to submit portfolios of their work that demonstrate their performance on the curriculum framework learning standards. Figure 6 shows the number of students who took the MCAS-Alt.
Spring 2013 MCAS Tests: Summary of State Results 8
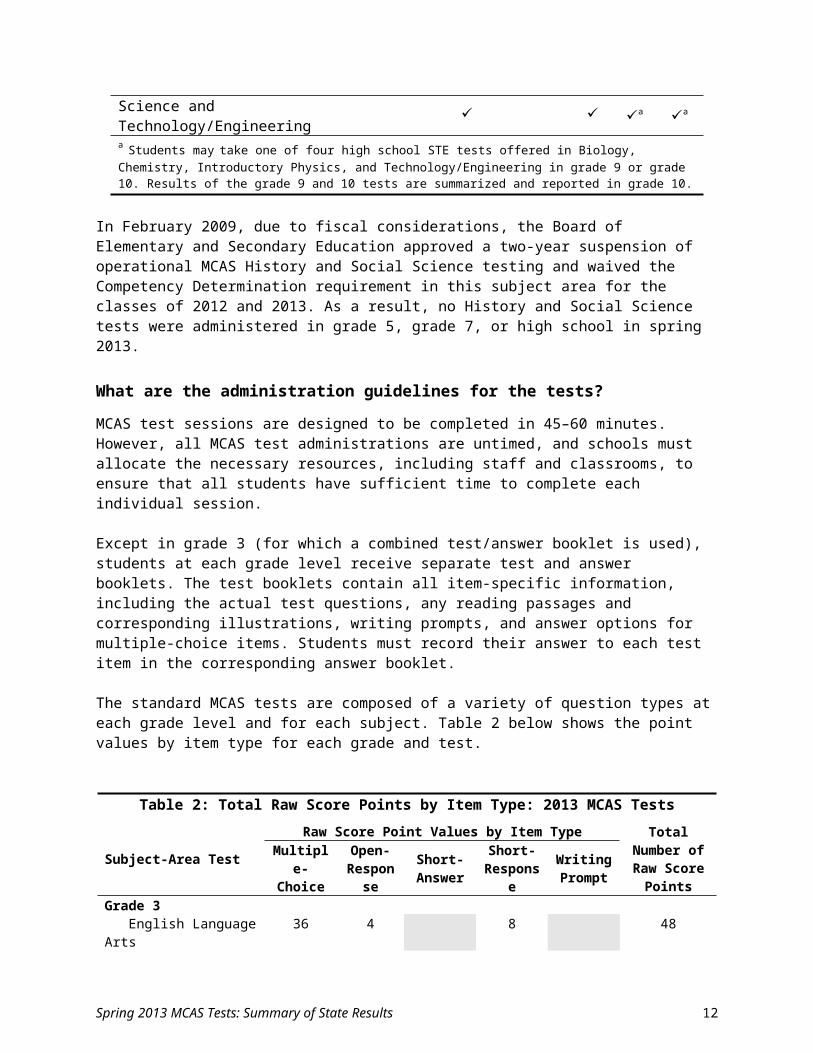
Which MCAS tests were administered in 2013?
In 2013, a total of 17 operational MCAS tests in English Language Arts, Mathematics, and Science and Technology/Engineering were administered to students across eight grade levels.
Table 1 below shows the MCAS tests administered at each grade level in 2013.
Table 1: 2013 MCAS Tests Administered by Grade Level
Content AreaGrade Level
3 4 5 6 7 8 9 10English Language Arts Mathematics Science and Technology/Engineering a a
a Students may take one of four high school STE tests offered in Biology, Chemistry, Introductory Physics, and Technology/Engineering in grade 9 or grade 10. Results of the grade 9 and 10 tests are summarized and reported in grade 10.
In February 2009, due to fiscal considerations, the Board of Elementary and Secondary Education approved a two-year suspension of operational MCAS History and Social Science testing and waived the Competency Determination requirement in this subject area for the classes of 2012 and 2013. As a result, no History and Social Science tests were administered in grade 5, grade 7, or high school in spring 2013.
Spring 2013 MCAS Tests: Summary of State Results 9

What are the administration guidelines for the tests?
MCAS test sessions are designed to be completed in 45–60 minutes. However, all MCAS test administrations are untimed, and schools must allocate the necessary resources, including staff and classrooms, to ensure that all students have sufficient time to complete each individual session.
Except in grade 3 (for which a combined test/answer booklet is used), students at each grade level receive separate test and answer booklets. The test booklets contain all item-specific information, including the actual test questions, any reading passages and corresponding illustrations, writing prompts, and answer options for multiple-choice items. Students must record their answer to each test item in the corresponding answer booklet.
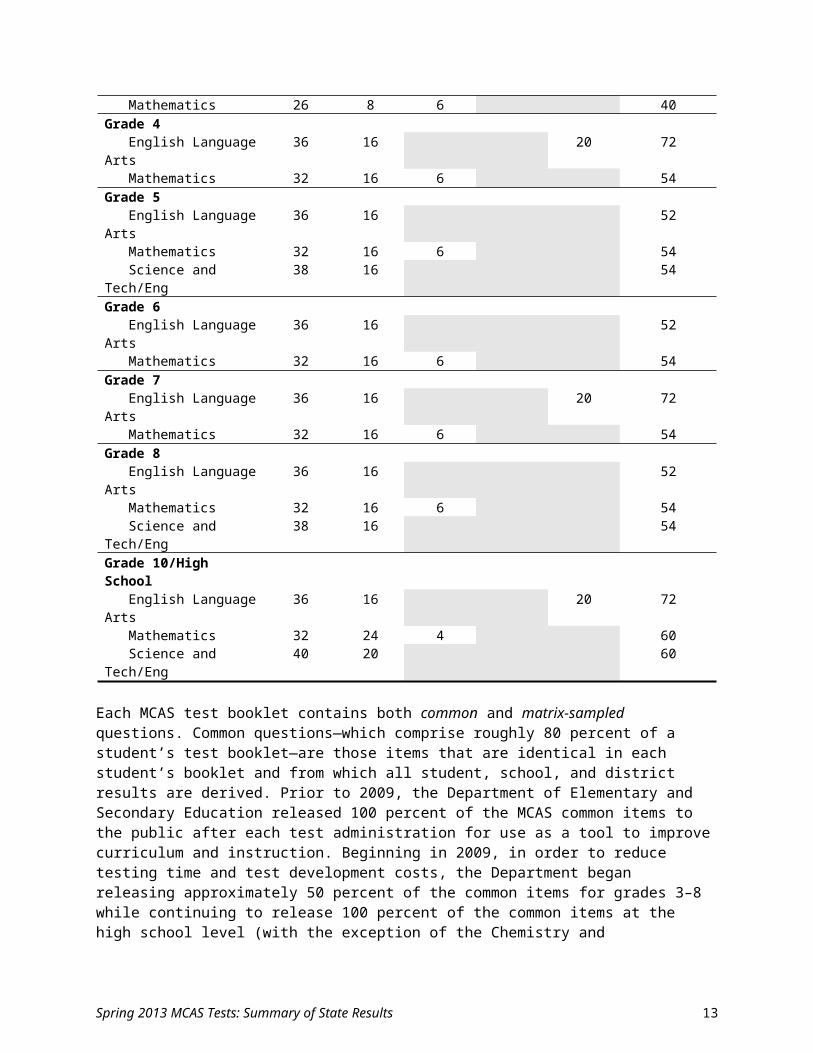
The standard MCAS tests are composed of a variety of question types at each grade level and for each subject. Table 2 below shows the point values by item type for each grade and test.
Table 2: Total Raw Score Points by Item Type: 2013 MCAS Tests
Subject-Area Test
Raw Score Point Values by Item Type Total Number of Raw Score
PointsMultiple-
Choice
Open-Respons
e
Short-Answer
Short-Response Writing
Prompt
Grade 3 English Language Arts 36 4 8 48 Mathematics 26 8 6 40Grade 4 English Language Arts 36 16 20 72 Mathematics 32 16 6 54Grade 5 English Language Arts 36 16 52 Mathematics 32 16 6 54 Science and Tech/Eng 38 16 54Grade 6 English Language Arts 36 16 52 Mathematics 32 16 6 54Grade 7 English Language Arts 36 16 20 72 Mathematics 32 16 6 54Grade 8 English Language Arts 36 16 52 Mathematics 32 16 6 54 Science and Tech/Eng 38 16 54Grade 10/High School English Language Arts 36 16 20 72 Mathematics 32 24 4 60 Science and Tech/Eng 40 20 60
Each MCAS test booklet contains both common and matrix-sampled questions. Common questions—which comprise roughly 80 percent of a student’s test booklet—are those items that are identical in each student’s booklet and from which all student, school, and district results are derived. Prior to 2009, the Department of Elementary and Secondary Education released 100 percent of the MCAS common items to
Spring 2013 MCAS Tests: Summary of State Results 10
the public after each test administration for use as a tool to improve curriculum and instruction. Beginning in 2009, in order to reduce testing time and test development costs, the Department began releasing approximately 50 percent of the common items for grades 3–8 while continuing to release 100 percent of the common items at the high school level (with the exception of the Chemistry and Technology/Engineering tests in 2009, for which no common items were released). Matrix-sampled questions are used to equate MCAS tests from year to year and to field test new items for future tests.
When are MCAS tests administered?
Each spring there are three MCAS test administration periods. In 2013, the first testing period was March 25–April 5 for tests in English Language Arts. The second testing period was May 6–May 21 for tests in Mathematics and May 7–May 21 for tests in grades 5 and 8 Science and Technology/Engineering. The third testing period was June 4–7 for the end-of-course high school STE tests.
How are results on MCAS tests reported?
Results on the MCAS tests are reported by achievement levels that describe a student’s knowledge and skills as they relate to the MCAS performance standards and the content standards contained in the Massachusetts curriculum frameworks. Students receive a separate score and attain a separate achievement level in each subject area. School and district results are reported according to the percentage of students attaining each achievement level in each grade-level subject area tested.
Table 3 below provides the general MCAS achievement level definitions.
Table 3: General MCAS Achievement Level Definitions
Achievement Level DefinitionAdvanced 3 Students at this level demonstrate a comprehensive and in-depth
understanding of rigorous subject matter and provide sophisticated solutions to complex problems.
Proficient Students at this level demonstrate a solid understanding of challenging subject matter and solve a wide variety of problems.
Needs Improvement Students at this level demonstrate a partial understanding of subject matter and solve some simple problems.
Warning / Failing 4 Students at this level demonstrate a minimal understanding of subject matter and do not solve simple problems.
Student-level MCAS results are reported as scaled scores, which range from 200 to 280 in each content area. Scaled scores provide more precise feedback to schools, parents, and students by quantifying a student’s achievement according to the continuum of scores within achievement levels. At grade 3, 2010 was the first year in which student results were reported as scaled scores; prior to 2010, only raw score points representing the total number of points a student earned were reported. Table 4 on the following page provides the scaled score point ranges and their corresponding achievement levels.
3 Prior to 2011, the highest achievement level at grade 3 was Above Proficient. This was changed to Advanced in 2011 to provide consistency in reporting.4 The Warning level is applicable to grades 3–8, and the Failing level is applicable to grades 9 and 10.
Spring 2013 MCAS Tests: Summary of State Results 11
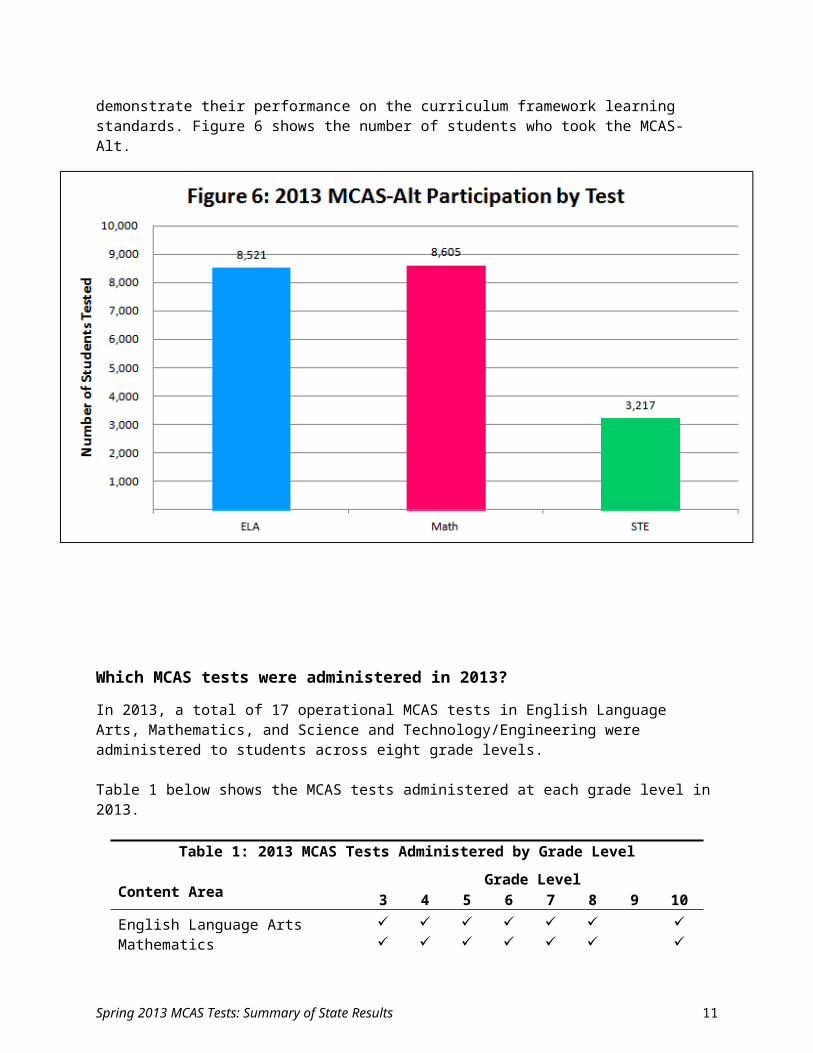
Table 4: MCAS Scaled Score Ranges
Scaled Score Range Achievement Level260–280 Advanced240–258 Proficient
220–238 Needs Improvement200–218 Warning / Failing
How does the Department collect and report race/ethnicity data?
Pursuant to Massachusetts General Laws, Chapter 69, Section 1I, the Department is authorized to collect race/ethnicity data but cannot make such information public. The Department reports these data only in the aggregate. Prior to the 2005–2006 school year, the Department collected data on students according to the following five race/ethnicity categories:
African American/Black American Indian or Alaskan Native Asian or Pacific Islander Hispanic White
Each student was identified by one and only one race/ethnicity category.
Beginning in 2006, the Department revised its data collection procedures to comply with the Office of Management and Budget (OMB) revisions to the standards for classification of federal data on race and ethnicity announced in the Federal Register Notice of October 30, 1997. The revised standards require that agencies offer individuals the opportunity to select one or more races when reporting information on race in federal data collections. In addition, race and Hispanic or Latino origin are considered two separate and distinct concepts.
In accordance with these changes, the Department now reports aggregate MCAS results according to the following seven race/ethnicity categories:
African American/Black Asian Hispanic or Latino American Indian or Alaskan Native White Native Hawaiian or Pacific Islander Multi-race, Non-Hispanic or Latino
MCAS results reported according to the former five race/ethnicity categories and the current seven race/ethnicity categories are not directly comparable. To better inform comparisons made between MCAS results by race/ethnicity across years, the Department published the 2005–2006 MCAS Race/Ethnicity Comparison Report, available at profiles.doe.mass.edu/mcas/racecomparison.aspx?linkid=29&orgcode=00000000&fycode=2006&orgtypecode=0&. This report provides a crosswalk between the current and former race/ethnicity categories, giving both total numbers of students tested and percentages of students at each achievement level. This information is also available at the school and district levels on the Department’s website through the school and district profiles.
Spring 2013 MCAS Tests: Summary of State Results 12
Where can I find more information about MCAS?
The Department’s website is a resource for educators, parents, and others who are seeking additional information about MCAS results, released items, curriculum frameworks, and other test-related topics. To access that information, visit www.doe.mass.edu/mcas/. If you have additional questions, you may contact the Department’s Student Assessment Services Unit at 781-338-3625.
Spring 2013 MCAS Tests: Summary of State Results 13
II. Summary of the 2013 Statewide MCAS Results
In spring 2013, 548,788 Massachusetts public school students in grades 3–10 participated in the sixteenth administration of the MCAS tests. A total of 17 MCAS tests in ELA, Mathematics, and STE were administered to students across eight grade levels. State-level results for these tests are provided in this report.
Achievement Level Results by Subject
English Language Arts
Table 5 summarizes the percentage changes in ELA achievement by students statewide between 2009 and 2013. Data for 2012 are included to illustrate the one-year trend.
Student achievement in ELA5 improved statewide between 2009 and 2013 in grades 5, 6, 7, and 10, and remained unchanged in grades 3, 4, and 8. The percentage of students statewide scoring Proficient or higher in 2013 ranged from a low of 53 percent at grade 4 to a high of 91 percent at grade 10. Achievement in ELA improved markedly in grade 10, as the percentage of students scoring Proficient or higher increased by ten percentage points.
Table 5: 2009–2013 Statewide MCAS English Language Arts Results
GradePercentage of Students Scoring
Proficient or HigherPercentage Point
Change, 2009 to 20132009 2012 2013
Grade 3 57 61 57 0Grade 4 53 57 53 0Grade 5 63 61 66 +3Grade 6 66 66 67 +1Grade 7 70 71 72 +2Grade 8 78 81 78 0Grade 10 81 88 91 +10
Mathematics
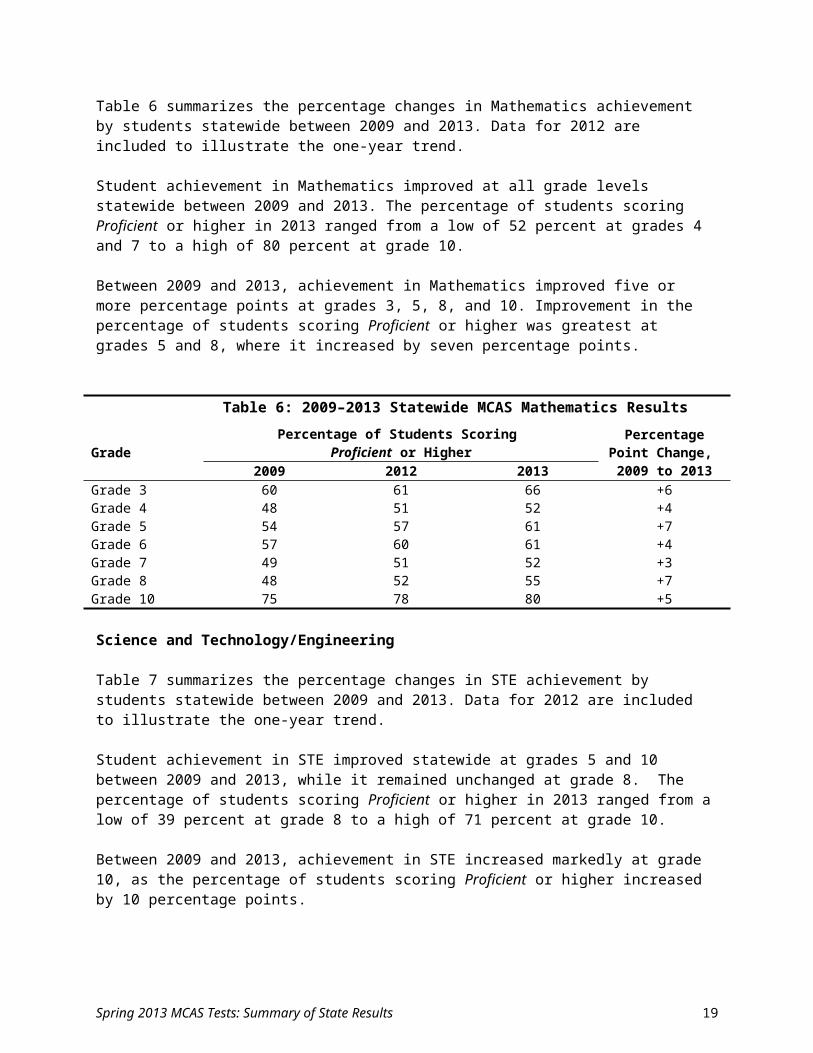
Table 6 summarizes the percentage changes in Mathematics achievement by students statewide between 2009 and 2013. Data for 2012 are included to illustrate the one-year trend.
Student achievement in Mathematics improved at all grade levels statewide between 2009 and 2013. The percentage of students scoring Proficient or higher in 2013 ranged from a low of 52 percent at grades 4 and 7 to a high of 80 percent at grade 10.
Between 2009 and 2013, achievement in Mathematics improved five or more percentage points at grades 3, 5, 8, and 10. Improvement in the percentage of students scoring Proficient or higher was greatest at grades 5 and 8, where it increased by seven percentage points.
5 The ELA tests at grades 3, 5, 6, and 8 assess reading comprehension, while the ELA tests at grades 4, 7, and 10 assess reading comprehension and writing.
Spring 2013 MCAS Tests: Summary of State Results 14

Table 6: 2009–2013 Statewide MCAS Mathematics Results
GradePercentage of Students Scoring
Proficient or HigherPercentage Point
Change, 2009 to 20132009 2012 2013
Grade 3 60 61 66 +6Grade 4 48 51 52 +4Grade 5 54 57 61 +7Grade 6 57 60 61 +4Grade 7 49 51 52 +3Grade 8 48 52 55 +7Grade 10 75 78 80 +5
Science and Technology/Engineering
Table 7 summarizes the percentage changes in STE achievement by students statewide between 2009 and 2013. Data for 2012 are included to illustrate the one-year trend.
Student achievement in STE improved statewide at grades 5 and 10 between 2009 and 2013, while it remained unchanged at grade 8. The percentage of students scoring Proficient or higher in 2013 ranged from a low of 39 percent at grade 8 to a high of 71 percent at grade 10.
Between 2009 and 2013, achievement in STE increased markedly at grade 10, as the percentage of students scoring Proficient or higher increased by 10 percentage points.
Table 7: 2009–2013 Statewide MCAS Science and Technology/Engineering Results
GradePercentage of Students Scoring
Proficient or HigherPercentage Point
Change, 2009 to 20132009 2012 2013
Grade 5 49 52 51 +2Grade 8 39 43 39 0Grade 10 61 69 71 +10
Between-Group Gap in the Percentage of Students Scoring Proficient or Higher: African American/Black and Hispanic or Latino Students
English Language Arts
Tables 8 and 9 summarize changes that occurred between 2009 and 2013 in the ELA proficiency gap between African American/Black students and white students, and between Hispanic or Latino students and white students. Data for 2012 are included to illustrate the one-year trend.
The between-group gap in the percentage of students scoring Proficient or higher for African American/Black students narrowed between 2009 and 2013 at grades 4, 5, 7, and 10, and widened marginally at grades 3, 6, and 8. The gap for Hispanic or Latino students narrowed at all grades except grade 3, where it remained unchanged, and grade 6, where it widened marginally. Between 2009 and 2013, the greatest narrowing of the gap was seen at grade 10: for African American/Black students, the
Spring 2013 MCAS Tests: Summary of State Results 15
gap decreased from 23 percent to 12 percent, and for Hispanic or Latino students, it decreased from 29 percent to 17 percent.
Table 8: 2009–2013 Statewide MCAS English Language Arts ResultsChange in Between-Group Gap in Percentage of Students Scoring Proficient or Higher
Grade African American/Black White Five-Year Between-Group GapPercentage of Students Scoring
Proficient or Higher 2009 2013Between-Group
Gap Change,2009 2012 2013 2009 2012 2013 2009–2013a
Grade 3 35 38 33 66 69 65 31 32 +1Grade 4 29 32 32 61 64 61 32 29 -3Grade 5 39 40 46 71 69 72 32 26 -6Grade 6 45 42 45 74 75 75 29 30 +1Grade 7 50 52 53 77 78 79 27 26 -1Grade 8 63 66 61 85 86 84 22 23 +1Grade 10 63 76 83 86 93 95 23 12 -11a Negative value represents narrowing of between-group gap; positive value represents widening of gap.
Table 9: 2009–2013 Statewide MCAS English Language Arts ResultsChange in Between-Group Gap in Percentage of Students Scoring Proficient or Higher
Grade Hispanic or Latino White Five-Year Between-Group GapPercentage of Students Scoring
Proficient or Higher 2009 2013Between-Group
Gap Change,2009 2012 2013 2009 2012 2013 2009–2013a
Grade 3 32 36 31 66 69 65 34 34 0Grade 4 28 33 30 61 64 61 33 31 -2Grade 5 35 36 43 71 69 72 36 29 -7Grade 6 40 39 40 74 75 75 34 35 +1Grade 7 43 48 48 77 78 79 34 31 -3Grade 8 56 59 56 85 86 84 29 28 -1Grade 10 57 71 78 86 93 95 29 17 -12a Negative value represents narrowing of between-group gap; positive value represents widening of gap.
Mathematics
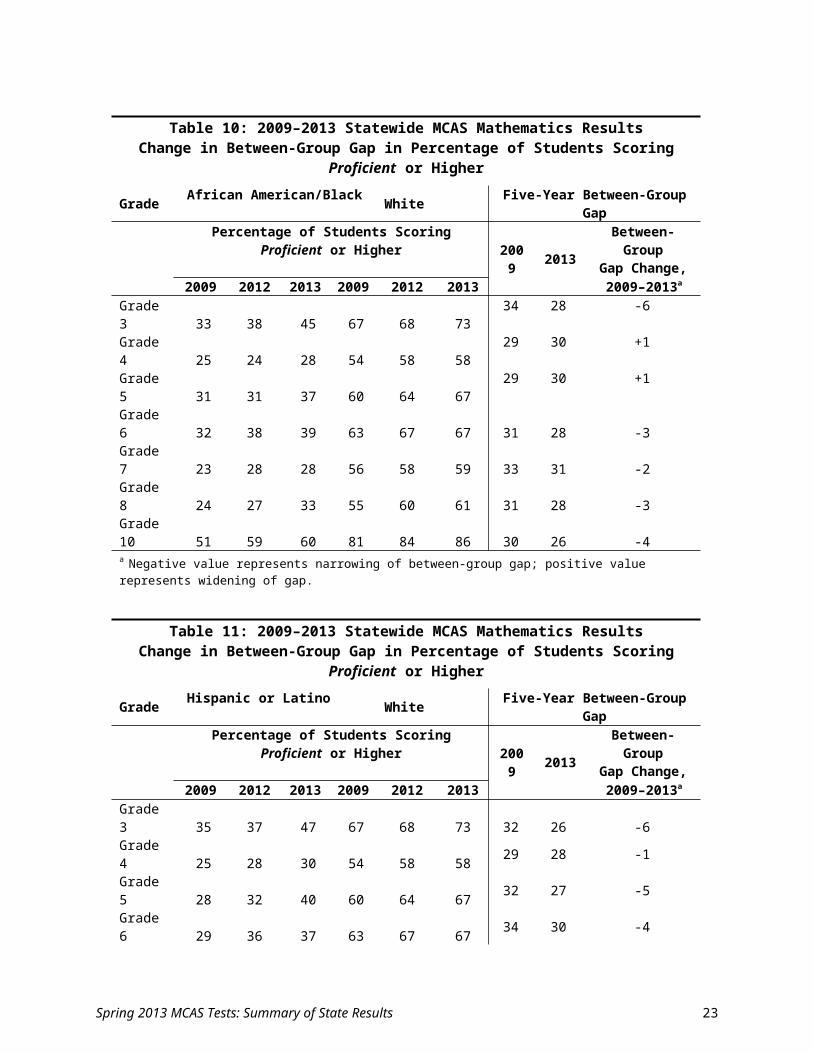
Tables 10 and 11 summarize changes that occurred between 2009 and 2013 in the Mathematics proficiency gap between African American/Black students and white students, and between Hispanic or Latino students and white students. Data for 2012 are included to illustrate the one-year trend.
Between 2009 and 2013, the between-group gap in the percentage of students scoring Proficient or higher for African American/Black students narrowed at grades 3, 6, 7, 8, and 10, while the gap widened marginally at grades 4 and 5. The gap for Hispanic or Latino students narrowed at all grades. Among both African American/Black and Hispanic or Latino students, the greatest change in the gap occurred at grade 3, where it narrowed by 6 percentage points.
Spring 2013 MCAS Tests: Summary of State Results 16
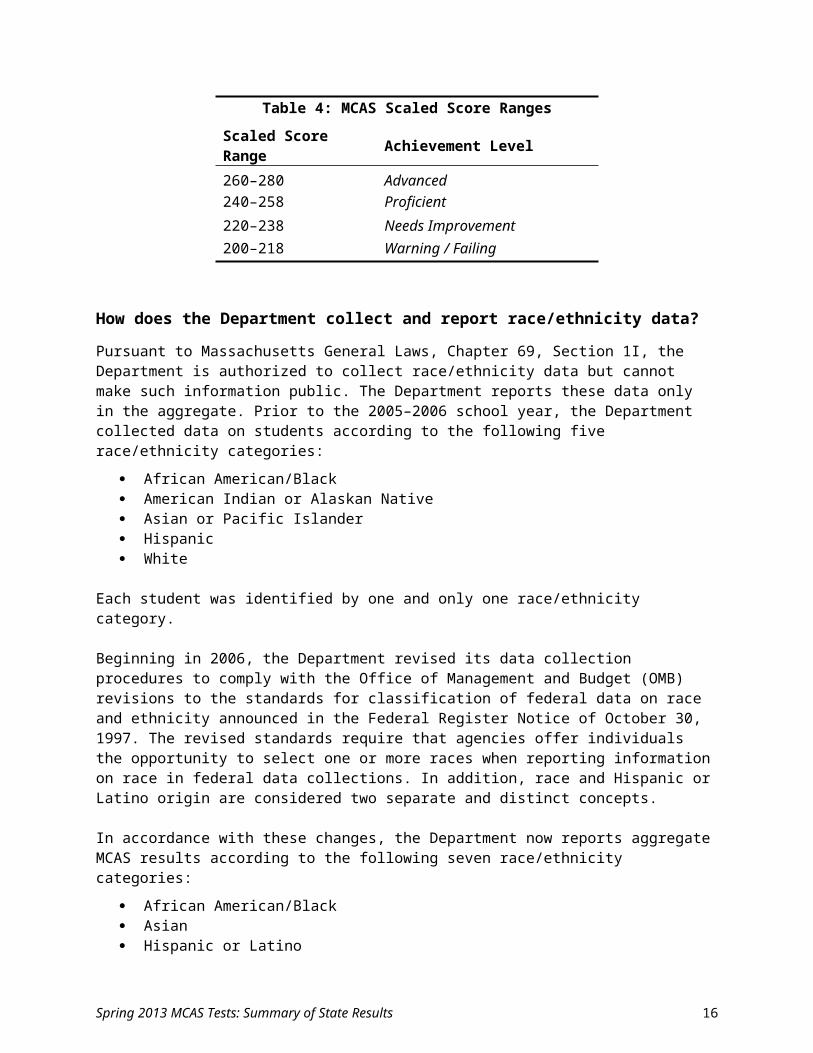
Table 10: 2009–2013 Statewide MCAS Mathematics ResultsChange in Between-Group Gap in Percentage of Students Scoring Proficient or Higher
Grade African American/Black White Five-Year Between-Group GapPercentage of Students Scoring
Proficient or Higher 2009 2013Between-Group
Gap Change,2009 2012 2013 2009 2012 2013 2009–2013a
Grade 3 33 38 45 67 68 73 34 28 -6Grade 4 25 24 28 54 58 58 29 30 +1Grade 5 31 31 37 60 64 67 29 30 +1Grade 6 32 38 39 63 67 67 31 28 -3Grade 7 23 28 28 56 58 59 33 31 -2Grade 8 24 27 33 55 60 61 31 28 -3Grade 10 51 59 60 81 84 86 30 26 -4a Negative value represents narrowing of between-group gap; positive value represents widening of gap.
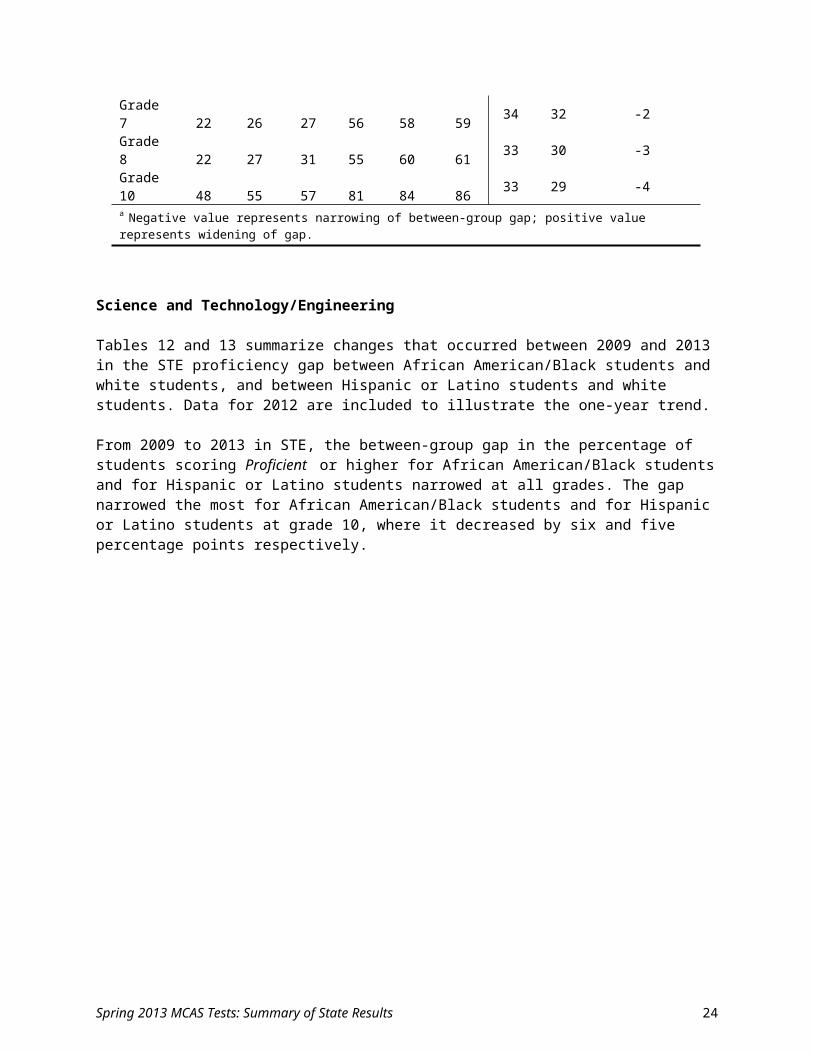
Table 11: 2009–2013 Statewide MCAS Mathematics ResultsChange in Between-Group Gap in Percentage of Students Scoring Proficient or Higher
Grade Hispanic or Latino White Five-Year Between-Group GapPercentage of Students Scoring
Proficient or Higher 2009 2013Between-Group
Gap Change,2009 2012 2013 2009 2012 2013 2009–2013a
Grade 3 35 37 47 67 68 73 32 26 -6Grade 4 25 28 30 54 58 58 29 28 -1Grade 5 28 32 40 60 64 67 32 27 -5Grade 6 29 36 37 63 67 67 34 30 -4Grade 7 22 26 27 56 58 59 34 32 -2Grade 8 22 27 31 55 60 61 33 30 -3Grade 10 48 55 57 81 84 86 33 29 -4a Negative value represents narrowing of between-group gap; positive value represents widening of gap.
Science and Technology/Engineering
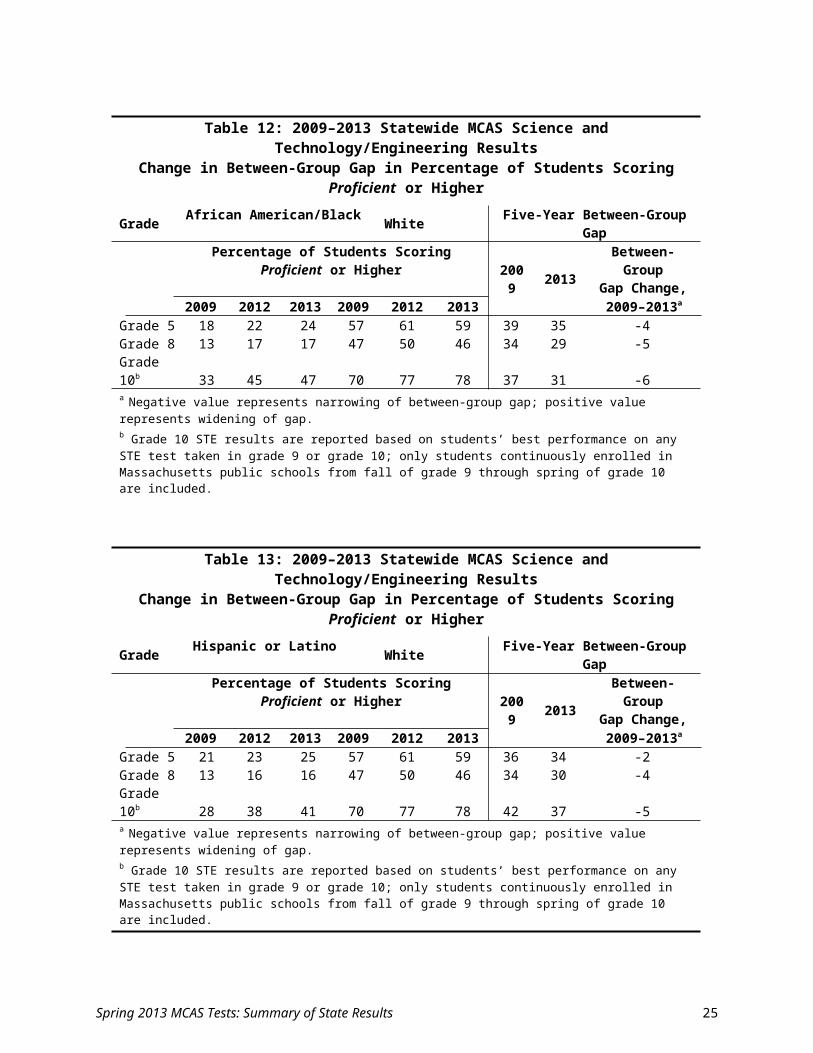
Tables 12 and 13 summarize changes that occurred between 2009 and 2013 in the STE proficiency gap between African American/Black students and white students, and between Hispanic or Latino students and white students. Data for 2012 are included to illustrate the one-year trend.
From 2009 to 2013 in STE, the between-group gap in the percentage of students scoring Proficient or higher for African American/Black students and for Hispanic or Latino students narrowed at all grades. The gap narrowed the most for African American/Black students and for Hispanic or Latino students at grade 10, where it decreased by six and five percentage points respectively.
Spring 2013 MCAS Tests: Summary of State Results 17
Table 12: 2009–2013 Statewide MCAS Science and Technology/Engineering ResultsChange in Between-Group Gap in Percentage of Students Scoring Proficient or Higher
Grade African American/Black White Five-Year Between-Group GapPercentage of Students Scoring
Proficient or Higher 2009 2013Between-Group
Gap Change,2009 2012 2013 2009 2012 2013 2009–2013a
Grade 5 18 22 24 57 61 59 39 35 -4Grade 8 13 17 17 47 50 46 34 29 -5Grade 10b 33 45 47 70 77 78 37 31 -6a Negative value represents narrowing of between-group gap; positive value represents widening of gap.b Grade 10 STE results are reported based on students’ best performance on any STE test taken in grade 9 or grade 10; only students continuously enrolled in Massachusetts public schools from fall of grade 9 through spring of grade 10 are included.
Table 13: 2009–2013 Statewide MCAS Science and Technology/Engineering ResultsChange in Between-Group Gap in Percentage of Students Scoring Proficient or Higher
Grade Hispanic or Latino White Five-Year Between-Group GapPercentage of Students Scoring
Proficient or Higher 2009 2013Between-Group
Gap Change,2009 2012 2013 2009 2012 2013 2009–2013a
Grade 5 21 23 25 57 61 59 36 34 -2Grade 8 13 16 16 47 50 46 34 30 -4Grade 10b 28 38 41 70 77 78 42 37 -5a Negative value represents narrowing of between-group gap; positive value represents widening of gap.b Grade 10 STE results are reported based on students’ best performance on any STE test taken in grade 9 or grade 10; only students continuously enrolled in Massachusetts public schools from fall of grade 9 through spring of grade 10 are included.
Between-Group Gap in the Percentage of Students Scoring Proficient or Higher: Students with Disabilities
Tables 14–16 summarize changes that occurred between 2009 and 2013 in the ELA, Mathematics, and STE proficiency gaps between students with disabilities and all students. Data for 2012 are included to illustrate the one-year trend.
From 2009 to 2013 in ELA, the between-group gap in the percentage of students scoring Proficient or higher for students with disabilities narrowed markedly at grade 10 and widened at all other grades. The greatest widening of the gap occurred at grade 3, where it increased by four percentage points.
In Mathematics, the between-group gap for students with disabilities widened at all grades, with gaps at grades 3 and 7 widening the most. In STE, the gap for students with disabilities widened at grades 5 and 10, and was unchanged at grade 8.
Spring 2013 MCAS Tests: Summary of State Results 18
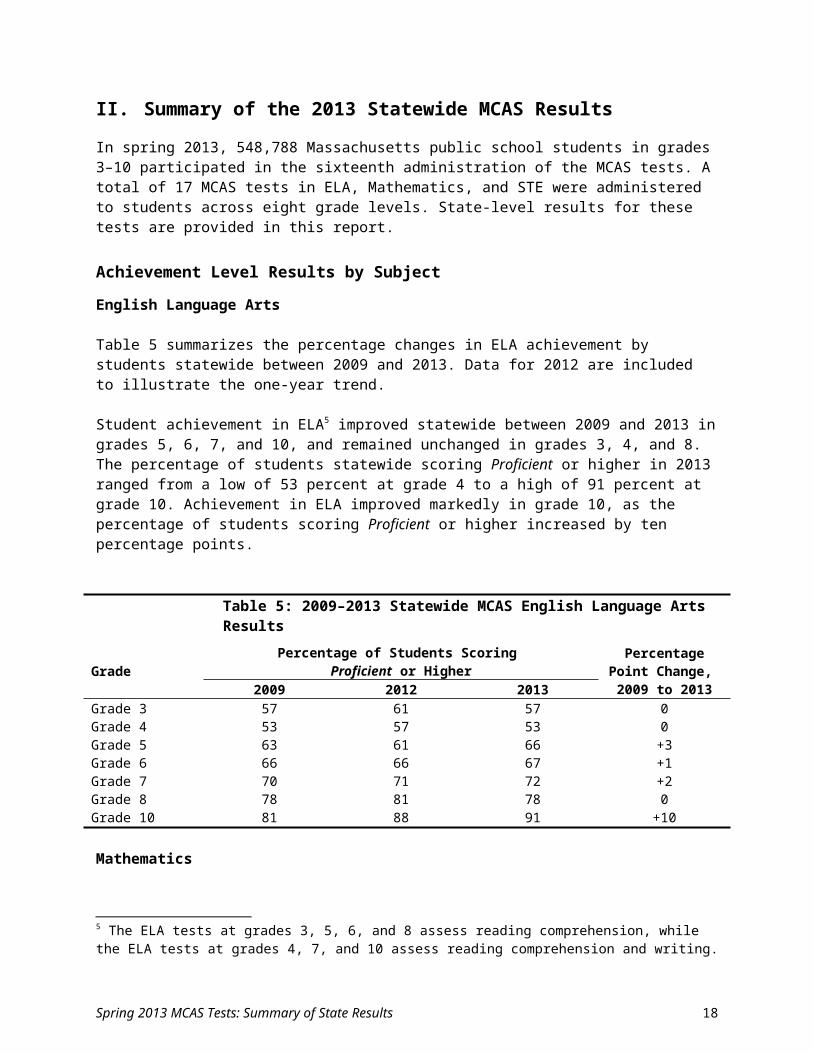
Table 14: 2009–2013 Statewide MCAS English Language Arts ResultsChange in Between-Group Gap in Percentage of Students Scoring Proficient or Higher
Grade Students with Disabilities All Students Five-Year Between-Group GapPercentage of Students Scoring
Proficient or Higher 2009 2013Between-Group
Gap Change,2009 2012 2013 2009 2012 2013 2009–2013a
Grade 3 23 24 19 57 61 57 34 38 +4Grade 4 16 18 14 54 57 53 38 39 +1Grade 5 24 21 24 63 61 66 39 42 +3Grade 6 26 26 25 66 66 67 40 43 +3Grade 7 28 29 29 70 71 72 42 43 +1Grade 8 40 42 38 78 81 78 38 40 +2Grade 10 43 60 66 79 88 91 36 25 -11a Negative value represents narrowing of between-group gap; positive value represents widening of gap.
Table 15: 2009–2013 Statewide MCAS Mathematics ResultsChange in Between-Group Gap in Percentage of Students Scoring Proficient or Higher
Grade Students with Disabilities All Students Five-Year Between-Group GapPercentage of Students Scoring
Proficient or Higher 2009 2013Between-Group
Gap Change,2009 2012 2013 2009 2012 2013 2009–2013a
Grade 3 28 26 30 60 61 67 32 37 +5Grade 4 16 18 18 48 51 52 32 34 +2Grade 5 18 20 22 54 57 61 36 39 +3Grade 6 19 21 20 57 60 61 38 41 +3Grade 7 13 14 14 46 51 52 33 38 +5Grade 8 12 14 15 48 52 55 36 40 +2Grade 10 37 41 40 75 78 80 38 40 +2a Negative value represents narrowing of between-group gap; positive value represents widening of gap.
Table 16: 2009–2013 Statewide MCAS Science and Technology/Engineering ResultsChange in Between-Group Gap in Percentage of Students Scoring Proficient or Higher
Grade Students with Disabilities All Students Five-Year Between-Group GapPercentage of Students Scoring
Proficient or Higher 2009 2013Between-Group
Gap Change, 2009 2012 2013 2009 2012 2013 2009–2013a
Grade 5 20 19 19 49 52 51 29 32 +3Grade 8 11 12 11 39 43 39 28 28 0Grade 10b 25 32 33 61 69 71 36 38 +2a Negative value represents narrowing of between-group gap; positive value represents widening of gap.b Grade 10 STE results are reported based on students’ best performance on any STE test taken in grade 9 or grade 10; only students continuously enrolled in Massachusetts public schools from fall of grade 9 through spring of grade 10 are included.
Spring 2013 MCAS Tests: Summary of State Results 19
Between-Group Gap in the Percentage of Students Scoring Proficient or Higher: English Language Learner (ELL) Students
Tables 17–19 summarize changes that occurred between 2009 and 2013 in the ELA, Mathematics, and STE proficiency gaps between ELL students and all students. Data for 2012 are included to illustrate the one-year trend.
From 2009 to 2013 in ELA, the between-group gap in the percentage of students scoring Proficient or higher for ELL students narrowed marginally at grades 5 and 7, and narrowed markedly at grade 10. The gap widened at grades 3, 6, and 8, and remained unchanged at grade 4.
In Mathematics, the gap for ELL students narrowed at grades 3 and 6; widened marginally at grades 5, 7, and 8; widened markedly at grade 10; and remained unchanged at grade 4. In STE, the gap for ELL students widened at all tested grades.
Table 17: 2009–2013 Statewide MCAS English Language Arts ResultsChange in Between-Group Gap in Percentage of Students Scoring Proficient or Higher
Grade ELL Students All Students Five-Year Between-Group GapPercentage of Students Scoring
Proficient or Higher 2009 2013Between-Group
Gap Change,2009 2012 2013 2009 2012 2013 2009–2013a
Grade 3 23 24 19 57 61 57 34 38 +4Grade 4 17 20 17 53 57 53 36 36 0Grade 5 17 19 23 63 61 66 46 43 -3Grade 6 18 19 17 66 66 67 48 50 +2Grade 7 15 20 19 70 71 72 55 53 -2Grade 8 24 27 23 78 81 78 54 55 +1Grade 10 20 35 43 81 88 91 61 48 -13a Negative value represents narrowing of between-group gap; positive value represents widening of gap.
Table 18: 2009–2013 Statewide MCAS Mathematics ResultsChange in Between-Group Gap in Percentage of Students Scoring Proficient or Higher
Grade ELL Students All Students Five-Year Between-Group GapPercentage of Students Scoring
Proficient or Higher 2009 2013Between-Group
Gap Change,2009 2012 2013 2009 2012 2013 2009–2013a
Grade 3 30 32 39 60 61 67 30 28 -2Grade 4 18 22 22 48 51 52 30 30 0Grade 5 21 24 27 54 57 61 33 34 +1Grade 6 19 24 24 57 60 61 38 37 -1Grade 7 11 14 12 49 51 52 38 40 +2Grade 8 12 14 16 48 52 55 36 39 +3Grade 10 32 32 27 75 78 80 43 53 +10a Negative value represents narrowing of between-group gap; positive value represents widening of gap.
Spring 2013 MCAS Tests: Summary of State Results 20
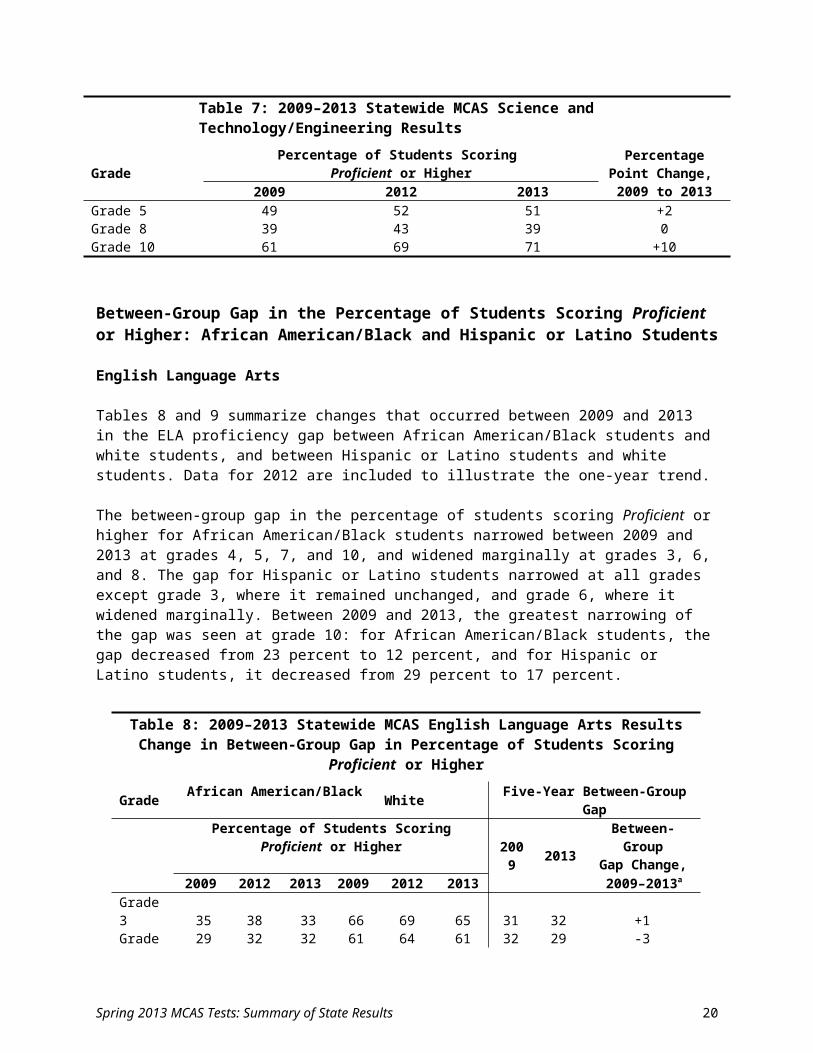
Table 19: 2009–2013 Statewide MCAS Science and Technology/Engineering ResultsChange in Between-Group Gap in Percentage of Students Scoring Proficient or Higher
Grade ELL Students All Students Five-Year Between-Group GapPercentage of Students Scoring
Proficient or Higher 2009 2013Between-Group
Gap Change,2009 2012 2013 2009 2012 2013 2009–2013a
Grade 5 11 10 11 49 52 51 38 40 +2Grade 8 4 4 3 39 43 39 35 36 +1Grade 10b 12 17 16 61 69 71 49 55 +6a Negative value represents narrowing of between-group gap; positive value represents widening of gap.b Grade 10 STE results are reported based on students’ best performance on any STE test taken in grade 9 or grade 10; only students continuously enrolled in Massachusetts public schools from fall of grade 9 through spring of grade 10 are included.
Between-Group Gap in the Percentage of Students Scoring Proficient or Higher: Low-Income Students
Tables 20–22 summarize changes that occurred between 2009 and 2013 in the ELA, Mathematics, and STE proficiency gaps between low-income students and all students. Data for 2012 are included to illustrate the one-year trend.
From 2009 to 2013 in ELA, the between-group gap in the percentage of students scoring Proficient or higher for low-income students narrowed at all grades except 3 and 8, where it increased marginally or remained unchanged. The gap in Mathematics for low-income students did not widen at any grade, and narrowed at all grades except grade 4, where it remained unchanged. In STE, the gap for low-income students narrowed at all tested grades.
Table 20: 2009–2013 Statewide MCAS English Language Arts ResultsChange in Between-Group Gap in Percentage of Students Scoring Proficient or Higher
Grade Low-Income Students All Students Five-Year Between-Group GapPercentage of Students Scoring
Proficient or Higher 2009 2013Between-Group
Gap Change,2009 2012 2013 2009 2012 2013 2009–2013a
Grade 3 35 40 34 57 61 57 22 23 +1Grade 4 29 35 32 53 57 53 24 21 -3Grade 5 40 40 46 63 61 66 23 20 -3Grade 6 44 45 46 66 66 67 22 21 -1Grade 7 48 53 52 70 71 72 22 20 -2Grade 8 61 64 61 78 81 78 17 17 0Grade 10 62 77 82 81 88 91 19 9 -10a Negative value represents narrowing of between-group gap; positive value represents widening of gap.
Spring 2013 MCAS Tests: Summary of State Results 21
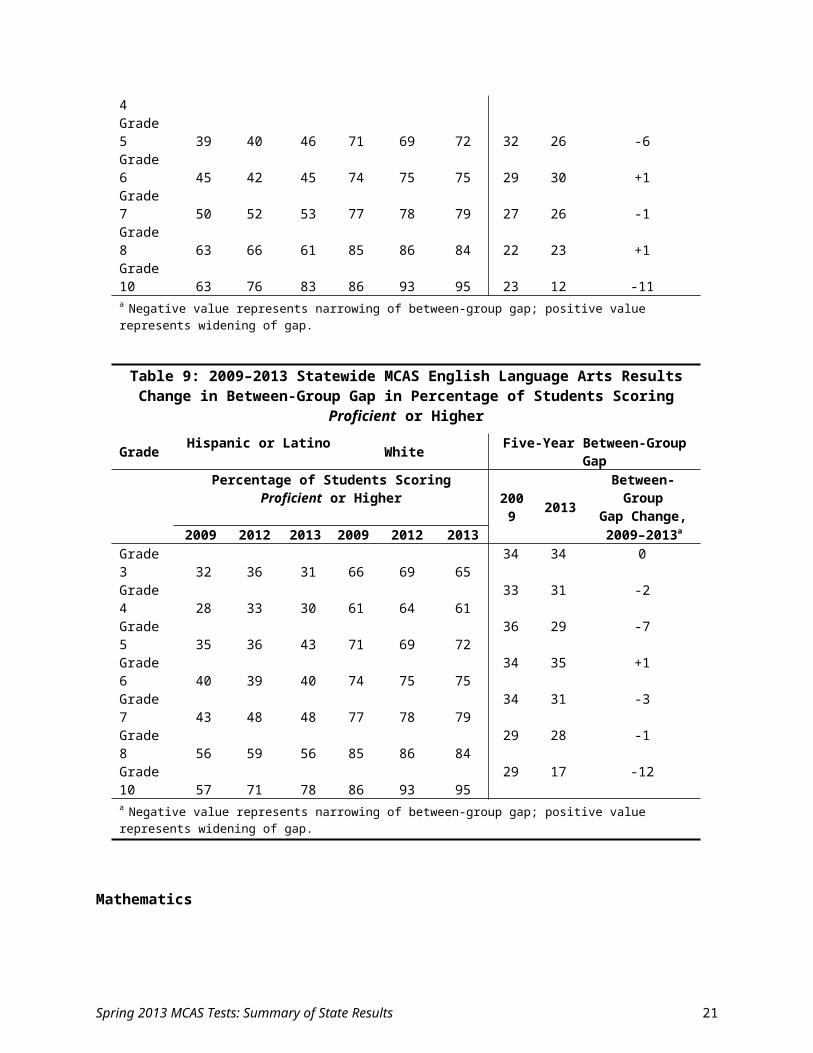
Table 21: 2009–2013 Statewide MCAS Mathematics ResultsChange in Between-Group Gap in Percentage of Students Scoring Proficient or Higher
Grade Low-Income Students All Students Five-Year Between-Group GapPercentage of Students Scoring
Proficient or Higher 2009 2013Between-Group
Gap Change,2009 2012 2013 2009 2012 2013 2009–2013a
Grade 3 38 41 49 60 61 67 22 18 -4Grade 4 28 31 32 48 51 52 20 20 0Grade 5 32 36 41 54 57 61 22 20 -2Grade 6 34 39 41 57 60 61 23 20 -3Grade 7 26 30 30 49 51 52 23 22 -1Grade 8 25 30 34 48 52 55 23 21 -2Grade 10 54 62 63 75 78 80 21 17 -4a Negative value represents narrowing of between-group gap; positive value represents widening of gap.
Table 22: 2009–2013 Statewide MCAS Science and Technology/Engineering ResultsChange in Between-Group Gap in Percentage of Students Scoring Proficient or Higher
Grade Low-Income Students All Students Five-Year Between-Group GapPercentage of Students Scoring
Proficient or Higher 2009 2013Between-Group
Gap Change,2009 2012 2013 2009 2012 2013 2009–2013a
Grade 5 24 28 30 49 52 51 25 21 -4Grade 8 16 20 19 39 43 39 23 20 -3Grade 10b 36 48 50 61 69 71 25 21 -4a Negative value represents narrowing of between-group gap; positive value represents widening of gap.b Grade 10 STE results are reported based on students’ best performance on any STE test taken in grade 9 or grade 10; only students continuously enrolled in Massachusetts public schools from fall of grade 9 through spring of grade 10 are included.
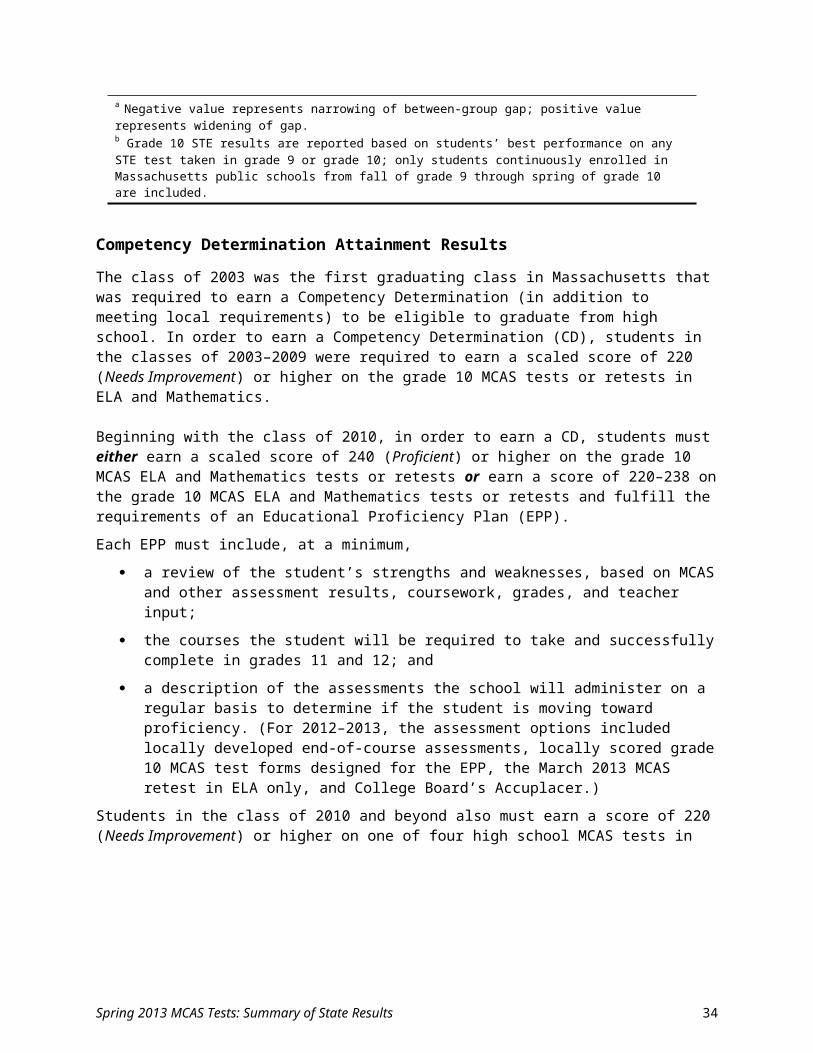
Competency Determination Attainment Results
The class of 2003 was the first graduating class in Massachusetts that was required to earn a Competency Determination (in addition to meeting local requirements) to be eligible to graduate from high school. In order to earn a Competency Determination (CD), students in the classes of 2003–2009 were required to earn a scaled score of 220 (Needs Improvement) or higher on the grade 10 MCAS tests or retests in ELA and Mathematics.
Beginning with the class of 2010, in order to earn a CD, students must either earn a scaled score of 240 (Proficient) or higher on the grade 10 MCAS ELA and Mathematics tests or retests or earn a score of 220–238 on the grade 10 MCAS ELA and Mathematics tests or retests and fulfill the requirements of an Educational Proficiency Plan (EPP).
Each EPP must include, at a minimum,
a review of the student’s strengths and weaknesses, based on MCAS and other assessment results, coursework, grades, and teacher input;
Spring 2013 MCAS Tests: Summary of State Results 22
the courses the student will be required to take and successfully complete in grades 11 and 12; and
a description of the assessments the school will administer on a regular basis to determine if the student is moving toward proficiency. (For 2012–2013, the assessment options included locally developed end-of-course assessments, locally scored grade 10 MCAS test forms designed for the EPP, the March 2013 MCAS retest in ELA only, and College Board’s Accuplacer.)
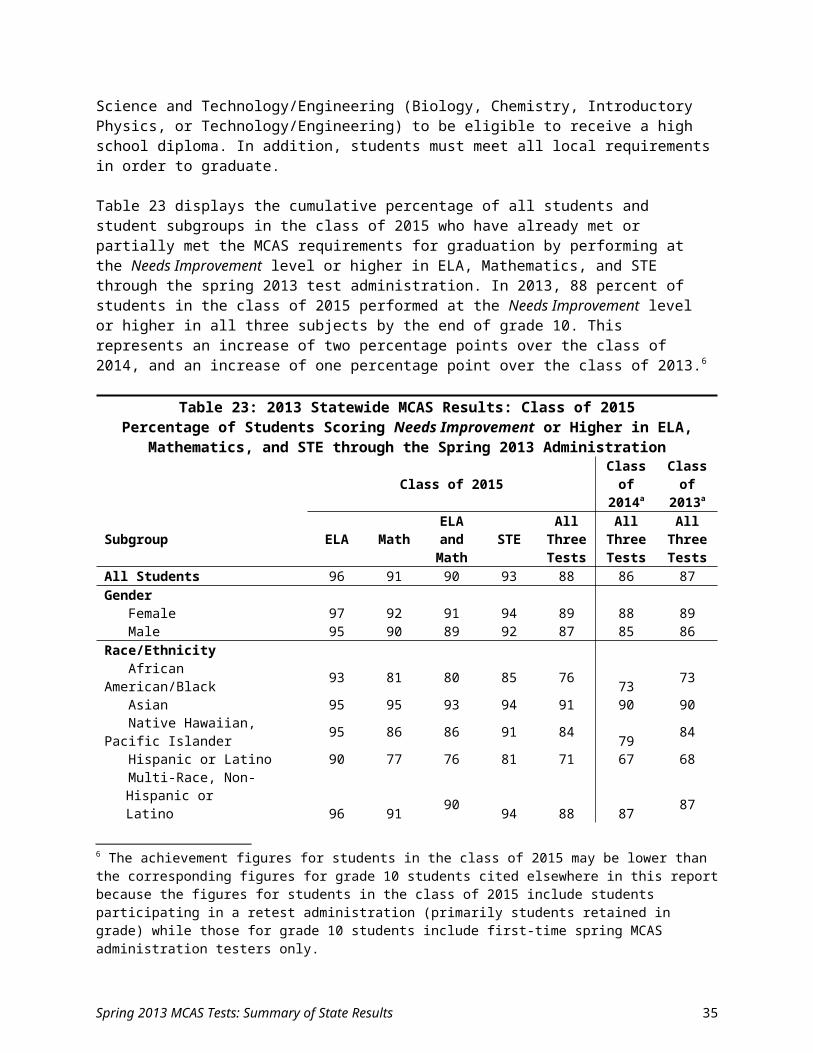
Students in the class of 2010 and beyond also must earn a score of 220 (Needs Improvement) or higher on one of four high school MCAS tests in Science and Technology/Engineering (Biology, Chemistry, Introductory Physics, or Technology/Engineering) to be eligible to receive a high school diploma. In addition, students must meet all local requirements in order to graduate.
Table 23 displays the cumulative percentage of all students and student subgroups in the class of 2015 who have already met or partially met the MCAS requirements for graduation by performing at the Needs Improvement level or higher in ELA, Mathematics, and STE through the spring 2013 test administration. In 2013, 88 percent of students in the class of 2015 performed at the Needs Improvement level or higher in all three subjects by the end of grade 10. This represents an increase of two percentage points over the class of 2014, and an increase of one percentage point over the class of 2013.6
Table 23: 2013 Statewide MCAS Results: Class of 2015Percentage of Students Scoring Needs Improvement or Higher in ELA, Mathematics, and STE
through the Spring 2013 AdministrationClass of 2015 Class of
2014aClass of
2013a
Subgroup ELA MathELA and
MathSTE
All Three Tests
All Three Tests
All Three Tests
All Students 96 91 90 93 88 86 87Gender Female 97 92 91 94 89 88 89 Male 95 90 89 92 87 85 86Race/Ethnicity African American/Black 93 81 80 85 76 73 73 Asian 95 95 93 94 91 90 90 Native Hawaiian, Pacific Islander 95 86 86 91 84 79 84 Hispanic or Latino 90 77 76 81 71 67 68 Multi-Race, Non-Hispanic or
Latino 96 91 90 94 88 87 87 Amer. Ind. or Alaska Nat. 94 89 88 93 87 77 81 White 97 94 94 96 92 92 92Student Status High Needs 91 81 79 85 76 73 74 Non-Disabled 98 95 95 96 93 92 93 Students with Disabilities 84 67 66 76 61 60 61 English Language Learner (ELL) 75 54 48 59 41 43 43 Former ELL 95 87 86 90 82 80 77 ELL and Former ELL 81 64 60 69 53 51 51
6 The achievement figures for students in the class of 2015 may be lower than the corresponding figures for grade 10 students cited elsewhere in this report because the figures for students in the class of 2015 include students participating in a retest administration (primarily students retained in grade) while those for grade 10 students include first-time spring MCAS administration testers only.
Spring 2013 MCAS Tests: Summary of State Results 23
Low Income 92 82 81 86 77 75 75a To provide comparable data, results for the classes of 2014 and 2013 are based on MCAS tests through the spring 2012 and spring 2011 administrations, respectively.
The percentage of students scoring Needs Improvement or higher in ELA, Mathematics, and STE varied widely by subgroup.
Of the major racial/ethnic subgroups in the state, the percentage of students scoring Needs Improvement or higher in all three subjects was highest for white students at 92 percent, followed by Asian students at 91 percent, African American/Black students at 76 percent, and Hispanic or Latino students at 71 percent. When results for the class of 2015 are compared to those for the class of 2014, Hispanic or Latino students showed the highest percentage increase at four percent, followed by African American/Black students at three percent, and Asian students at one percent. The percentage was unchanged for white students.
Seventy-seven percent of low-income students performed at the Needs Improvement level or higher in all three subjects, followed by 76 percent of high-needs students, 61 percent of students with disabilities, and 41 percent of ELL students. All subgroups except ELL students demonstrated an increase over the class of 2014 in the percentage scoring Needs Improvement or higher in all three subjects.
Table 24 shows the number and cumulative percentage of students in the class of 2015 who have already fully met the CD standard by performing at the Proficient level or higher in both ELA and Mathematics and by performing at the Needs Improvement level or higher in STE, through the spring 2013 test administration. Seventy-six percent of students in the class of 2015 have earned a CD by performing at the Proficient level or higher in both ELA and Mathematics and by performing at the Needs Improvement level or higher in STE. For the individual components of the CD requirement, 89 percent of students performed at the Proficient level or higher in ELA, 78 percent of students performed at the Proficient level or higher in Mathematics, and 93 percent of students performed at the Needs Improvement level or higher in STE.
Table 24: 2013 Statewide MCAS Results: Class of 2015Number and Percentage of Students Scoring Proficient or Higher in ELA and Mathematics and
Needs Improvement or Higher in STE through the Spring 2013 AdministrationCD Requirement Number PercentEarned CD 53,343 76ELA and Mathematics Proficient or Higher 53,667 76ELA Proficient or Higher 62,436 89Mathematics Proficient or Higher 54,842 78STE Needs Improvement or Higher 65,350 93
Spring 2013 MCAS Tests: Summary of State Results 24
III. 2013 Statewide MCAS Participation Results
Students Tested
Table 25 presents information on the number and percentage of enrolled students who participated in the spring 2013 MCAS tests. The figures include participation rates for all enrolled students educated with public funds, including regular education students, students with disabilities, and ELL students. As in previous years, participation rates were very high, ranging from 98 to 100 percent.
Table 25: Participation Ratesa
Number and Percentage of Enrolled Students Tested on the Spring 2013 MCAS Tests
GradeEnglish Language Arts Mathematics Science and
Technology/Engineeringb
Number Percent Number Percent Number PercentGrade 3 71,012 100 71,107 100Grade 4 71,107 100 71,422 100Grade 5 71,372 100 71,450 100 71,358 100Grade 6 72,070 100 72,154 100Grade 7 72,186 99 72,565 100Grade 8 72,681 99 72,744 99 72,581 99Grade 10 69,092 98 69,299 98 70,012 99a Includes regular education students, students with disabilities, and ELL students. b Grade 10 STE figures include students in the class of 2015 who participated in an STE test in grade 9 in 2012 or grade 10 in 2013; only students continuously enrolled in Massachusetts public schools from fall of grade 9 through spring of grade 10 are included.
How is participation calculated?
Participation rates indicate the number of students who participated in standard MCAS tests and the MCAS Alternate Assessment (MCAS-Alt) divided by the number of students enrolled on the date the tests were administered. ELL students enrolled in U.S. schools for the first time were not required to take ELA tests; however, they were reported in ELA school and district participation rates based on their participation in the ACCESS for ELLs (Assessing Comprehension and Communication in English State-to-State for English Language Learners) tests. The Department used ACCESS for ELLs testing for state and federal accountability purposes, which require that all ELL students, with the exception of students for whom an accommodation was not available, participate in the ELL assessment.
Students absent during testing, including those with medical excuses, were counted against school and district participation as non-participants. A student is neither a participant nor a non-participant (i.e., excluded from both the numerator and the denominator in participation rate calculations) if all of the following statements are true: (1) the student transferred during the testing window (between the first day of ELA testing and the last day of testing for Mathematics or STE), (2) the student missed at least one entire session of the test in question, and (3) the student was not medically excused or absent for the test in question.
How are absent students treated in MCAS performance results?
The federal Elementary and Secondary Education Act requires that absent students be counted as non-participants for school and district accountability calculations. Schools are placed in a lower accountability level if their participation rates fall below 95% or 90% in the aggregate or for a subgroup.
Spring 2013 MCAS Tests: Summary of State Results 25
IV. 2013 Statewide MCAS Results Disaggregated by Subgroup
Tables 26–42 provide summary statewide achievement level results disaggregated by student subgroup for the spring 2013 MCAS tests.
Table 26: 2013 Statewide MCAS Results: Grade 3 English Language ArtsPercentage of Students at Each Achievement Levela
Subgroup Proficient or Higher Advanced Proficient Needs
Improvement Warning
All Students 57 12 45 36 8Gender Female 61 15 46 33 6 Male 52 9 43 38 10Race/Ethnicity African American/Black 33 3 29 52 15 Asian 66 19 47 28 5 Native Hawaiian, Pacific Islander 41 10 32 48 11 Hispanic or Latino 31 3 27 52 17 Multi-Race, Non-Hispanic or Latino 56 12 45 36 7 Amer. Ind. or Alaska Nat. 38 9 29 53 9 White 65 14 51 30 5Student Status High Needsb 34 4 31 50 15 Non-Disabled 64 14 51 33 3 Students with Disabilities 19 1 17 50 31 English Language Learner (ELL) 19 2 18 57 24 Former ELL 51 8 43 42 7 ELL and Former ELL 29 3 25 52 19 Low Income 34 4 31 51 15a Percentages may not total 100 due to rounding. For the purpose of computing state results, students who were absent with or without a medically documented excuse from any subject area MCAS test are not included in performance results but are counted as non-participants for that subject area.b High Needs includes students with disabilities, English language learner students, former English language learner students, and low-income students.
Spring 2013 MCAS Tests: Summary of State Results 26
Table 27: 2013 Statewide MCAS Results: Grade 3 MathematicsPercentage of Students at Each Achievement Levela
Subgroup Proficient or Higher Advanced Proficient Needs
Improvement Warning
All Students 66 31 36 22 11Gender Female 68 31 37 22 10 Male 65 30 35 23 12Race/Ethnicity African American/Black 45 13 32 33 22 Asian 81 50 31 14 5 Native Hawaiian, Pacific Islander 59 19 40 22 19 Hispanic or Latino 47 15 32 31 22 Multi-Race, Non-Hispanic or Latino 64 31 33 23 13 Amer. Ind. or Alaska Nat. 56 13 43 32 13 White 73 35 38 20 7Student Status High Needsb 49 16 33 31 20 Non-Disabled 74 35 39 20 6 Students with Disabilities 30 8 22 32 37 English Language Learner (ELL) 39 11 29 35 26 Former ELL 68 30 38 23 10 ELL and Former ELL 48 16 31 31 21 Low Income 49 16 33 31 20a Percentages may not total 100 due to rounding. For the purpose of computing state results, students who were absent with or without a medically documented excuse from any subject area MCAS test are not included in performance results but are counted as non-participants for that subject area. b High Needs includes students with disabilities, English language learner students, former English language learner students, and low-income students.
Table 28: 2013 Statewide MCAS Results: Grade 4 English Language ArtsPercentage of Students at Each Achievement Levela
Subgroup Proficient or Higher Advanced Proficient Needs
Improvement Warning
All Students 53 10 43 33 13Gender Female 62 15 47 28 9 Male 45 6 39 38 17Race/Ethnicity African American/Black 32 3 29 42 26 Asian 67 20 47 25 8 Native Hawaiian, Pacific Islander 45 5 40 40 15 Hispanic or Latino 30 3 26 42 28 Multi-Race, Non-Hispanic or Latino 56 12 44 33 11 Amer. Ind. or Alaska Nat. 40 5 35 43 16 White 61 12 48 31 9Student Status High Needsb 31 3 28 44 25 Non-Disabled 62 13 50 32 6 Students with Disabilities 14 1 13 40 46 English Language Learner (ELL) 17 1 16 44 39 Former ELL 47 7 40 39 13 ELL and Former ELL 27 3 24 42 30 Low Income 32 3 29 43 24a Percentages may not total 100 due to rounding. For the purpose of computing state results, students who were absent with or without a medically documented excuse from any subject area MCAS test are not included in performance results but are counted as non-participants for that subject area. b High Needs includes students with disabilities, English language learner students, former English language learner students, and low-income students.
Spring 2013 MCAS Tests: Summary of State Results 27
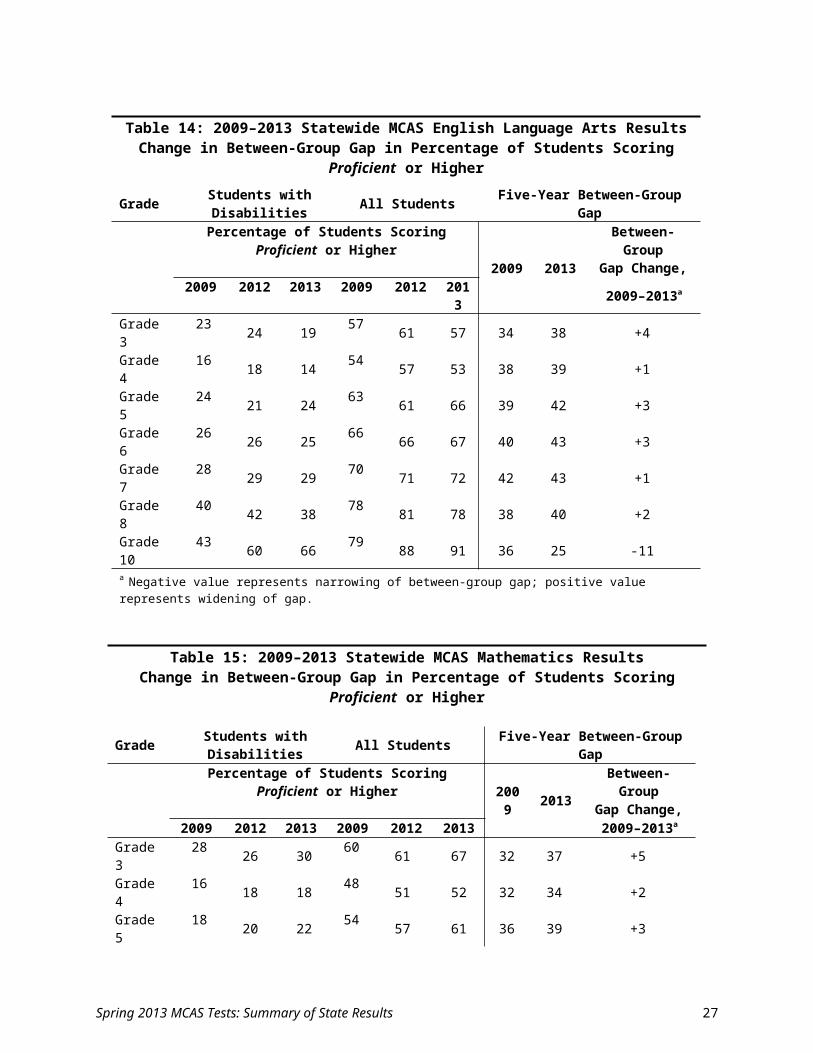
Table 29: 2013 Statewide MCAS Results: Grade 4 MathematicsPercentage of Students at Each Achievement Levela
Subgroup Proficient or Higher Advanced Proficient Needs
Improvement Warning
All Students 52 18 34 38 10Gender Female 53 18 35 39 9 Male 51 18 33 38 11Race/Ethnicity African American/Black 28 6 22 50 21 Asian 72 37 35 24 4 Native Hawaiian, Pacific Islander 44 9 35 40 17 Hispanic or Latino 30 6 23 50 20 Multi-Race, Non-Hispanic or Latino 52 21 32 38 10 Amer. Ind. or Alaska Nat. 38 10 27 47 15 White 58 21 38 35 7Student Status High Needsb 32 7 24 49 19 Non-Disabled 60 22 38 36 4 Students with Disabilities 18 4 14 47 35 English Language Learner (ELL) 22 4 18 53 26 Former ELL 49 14 35 41 10 ELL and Former ELL 31 7 23 49 20 Low Income 32 7 25 50 18a Percentages may not total 100 due to rounding. For the purpose of computing state results, students who were absent with or without a medically documented excuse from any subject area MCAS test are not included in performance results but are counted as non-participants for that subject area. b High Needs includes students with disabilities, English language learner students, former English language learner students, and low-income students.
Table 30: 2013 Statewide MCAS Results: Grade 5 English Language ArtsPercentage of Students at Each Achievement Levela
Subgroup Proficient or Higher Advanced Proficient Needs
Improvement Warning
All Students 66 18 47 24 10Gender Female 71 23 48 22 7 Male 61 14 47 27 12Race/Ethnicity African American/Black 46 7 39 35 19 Asian 77 33 44 15 7 Native Hawaiian, Pacific Islander 48 11 37 39 13 Hispanic or Latino 43 6 36 37 21 Multi-Race, Non-Hispanic or Latino 68 22 46 23 9 Amer. Ind. or Alaska Nat. 53 11 41 32 16 White 72 21 51 21 6Student Status High Needsb 44 6 38 36 19 Non-Disabled 75 22 53 21 4 Students with Disabilities 24 2 22 40 37 English Language Learner (ELL) 23 1 21 41 36 Former ELL 59 11 48 31 10 ELL and Former ELL 37 5 32 37 26 Low Income 46 7 40 36 18a Percentages may not total 100 due to rounding. For the purpose of computing state results, students who were absent with or without a medically documented excuse from any subject area MCAS test are not included in performance results but are counted as non-participants for that subject area. b High Needs includes students with disabilities, English language learner students, former English language learner students, and low-income students.
Spring 2013 MCAS Tests: Summary of State Results 28
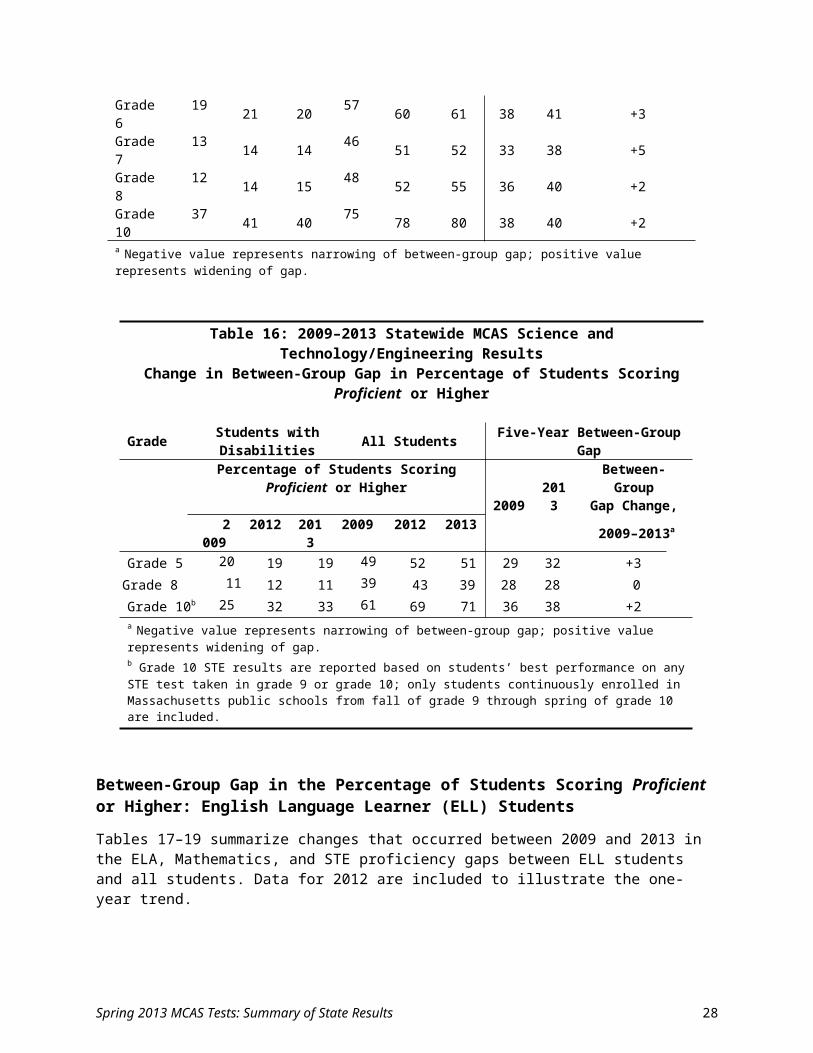
Table 31: 2013 Statewide MCAS Results: Grade 5 MathematicsPercentage of Students at Each Achievement Levela
Subgroup Proficient or Higher Advanced Proficient Needs
Improvement Warning
All Students 61 28 33 25 14Gender Female 63 30 33 25 12 Male 59 27 32 25 16Race/Ethnicity African American/Black 37 11 26 35 28 Asian 81 54 27 13 6 Native Hawaiian, Pacific Islander 46 17 30 34 20 Hispanic or Latino 40 12 28 33 27 Multi-Race, Non-Hispanic or Latino 61 30 31 24 14 Amer. Ind. or Alaska Nat. 43 21 22 37 20 White 67 32 35 23 10Student Status High Needsb 40 13 27 34 26 Non-Disabled 70 34 36 23 7 Students with Disabilities 22 5 17 32 46 English Language Learner (ELL) 27 6 20 35 38 Former ELL 56 25 32 29 15 ELL and Former ELL 38 13 25 33 29 Low Income 41 13 28 34 25a Percentages may not total 100 due to rounding. For the purpose of computing state results, students who were absent with or without a medically documented excuse from any subject area MCAS test are not included in performance results but are counted as non-participants for that subject area. b High Needs includes students with disabilities, English language learner students, former English language learner students, and low-income students.
Table 32: 2013 Statewide MCAS Results: Grade 5 Science and Technology/EngineeringPercentage of Students at Each Achievement Levela
Subgroup Proficient or Higher Advanced Proficient Needs
Improvement Warning
All Students 51 20 31 36 12Gender Female 51 19 31 38 12 Male 52 20 31 35 13Race/Ethnicity African American/Black 25 6 18 47 28 Asian 65 33 31 26 9 Native Hawaiian, Pacific Islander 36 14 21 43 21 Hispanic or Latino 26 7 19 47 27 Multi-Race, Non-Hispanic or Latino 53 22 30 37 11 Amer. Ind. or Alaska Nat. 39 9 31 43 18 White 59 23 36 33 7Student Status High Needsb 30 7 22 47 23 Non-Disabled 59 24 35 35 7 Students with Disabilities 19 4 15 44 37 English Language Learner (ELL) 11 2 10 43 46 Former ELL 38 12 26 47 15 ELL and Former ELL 22 6 16 45 34 Low Income 30 7 22 47 23a Percentages may not total 100 due to rounding. For the purpose of computing state results, students who were absent with or without a medically documented excuse from any subject area MCAS test are not included in performance results but are counted as non-participants for that subject area. b High Needs includes students with disabilities, English language learner students, former English language learner students, and low-income students.
Spring 2013 MCAS Tests: Summary of State Results 29
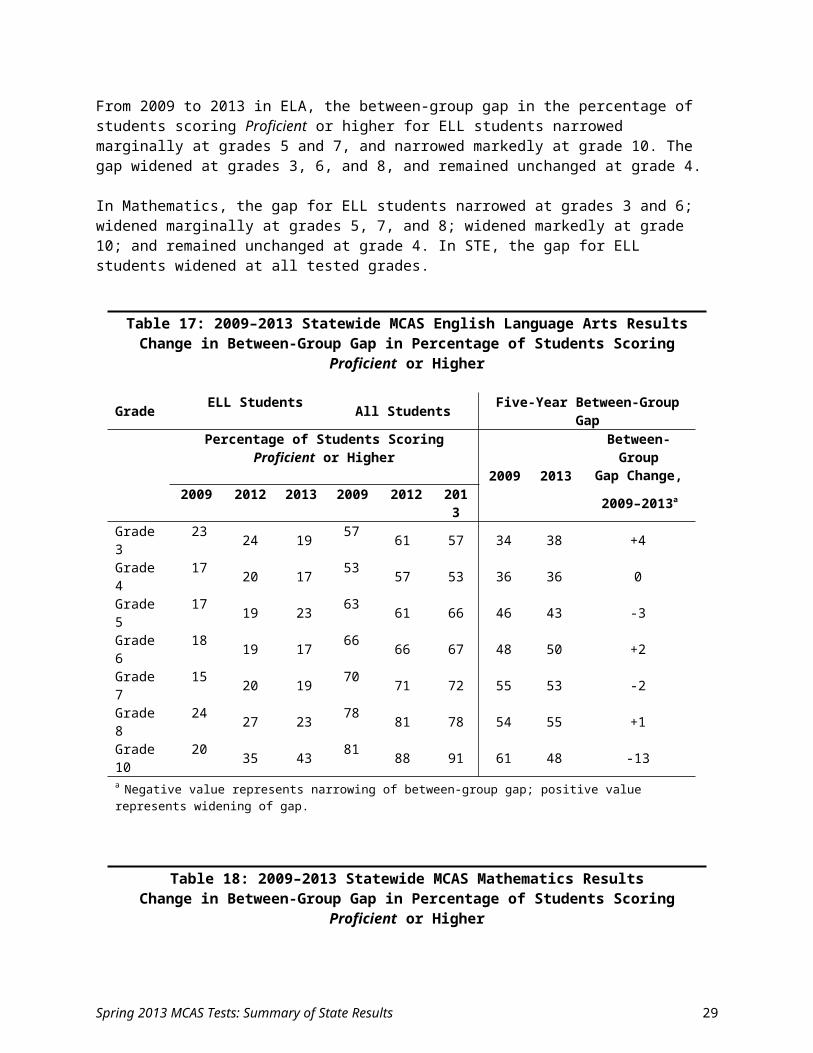
Table 33: 2013 Statewide MCAS Results: Grade 6 English Language ArtsPercentage of Students at Each Achievement Levela
Subgroup Proficient or Higher Advanced Proficient Needs
Improvement Warning
All Students 67 16 51 23 10Gender Female 73 21 51 20 7 Male 61 11 51 26 13Race/Ethnicity African American/Black 45 5 40 36 19 Asian 77 27 50 17 6 Native Hawaiian, Pacific Islander 69 16 52 21 10 Hispanic or Latino 40 5 36 37 23 Multi-Race, Non-Hispanic or Latino 67 17 51 25 8 Amer. Ind. or Alaska Nat. 58 7 51 31 11 White 75 19 56 19 6Student Status High Needsb 44 5 40 36 20 Non-Disabled 76 19 57 19 4 Students with Disabilities 25 1 23 39 36 English Language Learner (ELL) 17 0 17 42 41 Former ELL 54 6 48 35 12 ELL and Former ELL 32 3 29 39 29 Low Income 46 5 41 35 19a Percentages may not total 100 due to rounding. For the purpose of computing state results, students who were absent with or without a medically documented excuse from any subject area MCAS test are not included in performance results but are counted as non-participants for that subject area. b High Needs includes students with disabilities, English language learner students, former English language learner students, and low-income students.
Table 34: 2013 Statewide MCAS Results: Grade 6 MathematicsPercentage of Students at Each Achievement Levela
Subgroup Proficient or Higher Advanced Proficient Needs
Improvement Warning
All Students 61 25 35 24 15Gender Female 63 26 37 24 13 Male 59 25 34 23 18Race/Ethnicity African American/Black 39 10 29 32 29 Asian 81 52 29 13 6 Native Hawaiian, Pacific Islander 63 33 30 22 15 Hispanic or Latino 37 10 27 31 32 Multi-Race, Non-Hispanic or Latino 59 26 33 26 16 Amer. Ind. or Alaska Nat. 52 17 35 27 21 White 67 29 39 22 11Student Status High Needsb 39 11 28 32 29 Non-Disabled 70 30 40 22 8 Students with Disabilities 20 4 16 31 50 English Language Learner (ELL) 24 5 19 31 44 Former ELL 54 19 35 29 17 ELL and Former ELL 36 11 25 31 34 Low Income 41 11 29 32 27a Percentages may not total 100 due to rounding. For the purpose of computing state results, students who were absent with or without a medically documented excuse from any subject area MCAS test are not included in performance results but are counted as non-participants for that subject area. b High Needs includes students with disabilities, English language learner students, former English language learner students, and low-income students.
Spring 2013 MCAS Tests: Summary of State Results 30
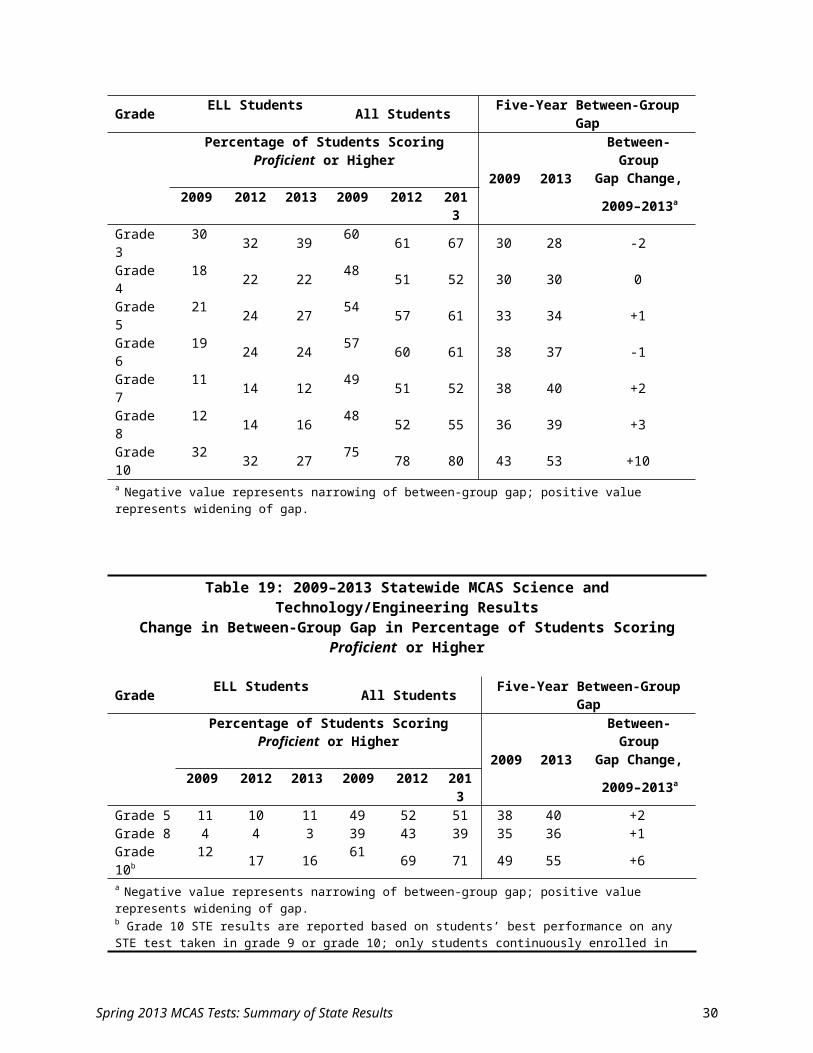
Table 35: 2013 Statewide MCAS Results: Grade 7 English Language ArtsPercentage of Students at Each Achievement Levela
Subgroup Proficient or Higher Advanced Proficient Needs
Improvement Warning
All Students 72 12 59 22 7Gender Female 79 17 62 17 4 Male 65 8 57 26 9Race/Ethnicity African American/Black 53 3 49 35 12 Asian 81 23 58 14 5 Native Hawaiian, Pacific Islander 68 12 57 23 9 Hispanic or Latino 48 3 45 36 16 Multi-Race, Non-Hispanic or Latino 70 13 57 23 7 Amer. Ind. or Alaska Nat. 56 5 50 32 12 White 79 14 64 17 4Student Status High Needsb 50 3 47 36 14 Non-Disabled 81 15 67 17 2 Students with Disabilities 29 1 28 44 28 English Language Learner (ELL) 19 0 18 48 33 Former ELL 60 2 58 33 6 ELL and Former ELL 36 1 35 42 22 Low Income 52 3 49 35 13a Percentages may not total 100 due to rounding. For the purpose of computing state results, students who were absent with or without a medically documented excuse from any subject area MCAS test are not included in performance results but are counted as non-participants for that subject area. b High Needs includes students with disabilities, English language learner students, former English language learner students, and low-income students.
Table 36: 2013 Statewide MCAS Results: Grade 7 MathematicsPercentage of Students at Each Achievement Levela
Subgroup Proficient or Higher Advanced Proficient Needs
Improvement Warning
All Students 52 19 33 27 21Gender Female 54 20 34 27 19 Male 50 19 31 26 23Race/Ethnicity African American/Black 28 6 22 33 40 Asian 75 43 32 16 10 Native Hawaiian, Pacific Islander 51 21 30 27 22 Hispanic or Latino 27 6 21 30 43 Multi-Race, Non-Hispanic or Latino 50 21 29 26 24 Amer. Ind. or Alaska Nat. 39 9 30 26 35 White 59 22 37 26 15Student Status High Needsb 29 7 22 32 39 Non-Disabled 60 23 37 27 13 Students with Disabilities 14 3 11 25 61 English Language Learner (ELL) 12 2 10 25 62 Former ELL 42 10 32 32 26 ELL and Former ELL 25 5 19 28 47 Low Income 30 7 24 32 38a Percentages may not total 100 due to rounding. For the purpose of computing state results, students who were absent with or without a medically documented excuse from any subject area MCAS test are not included in performance results but are counted as non-participants for that subject area. b High Needs includes students with disabilities, English language learner students, former English language learner students, and low-income students.
Spring 2013 MCAS Tests: Summary of State Results 31
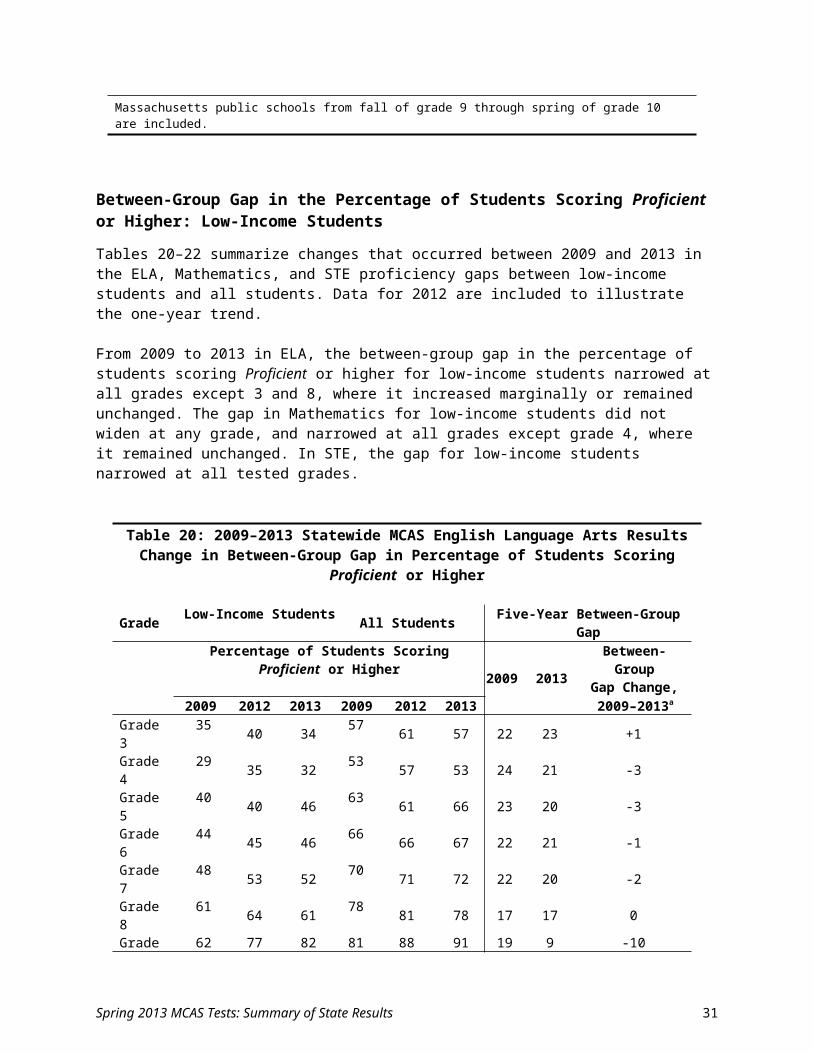
Table 37: 2013 Statewide MCAS Results: Grade 8 English Language ArtsPercentage of Students at Each Achievement Levela
Subgroup Proficient or Higher Advanced Proficient Needs
Improvement Warning
All Students 78 20 58 15 7Gender Female 84 26 58 11 5 Male 72 14 59 18 10Race/Ethnicity African American/Black 61 7 54 25 13 Asian 85 33 52 10 5 Native Hawaiian, Pacific Islander 73 13 60 19 7 Hispanic or Latino 56 6 51 25 18 Multi-Race, Non-Hispanic or Latino 76 20 56 15 8 Amer. Ind. or Alaska Nat. 71 12 60 23 6 White 84 24 61 11 4Student Status High Needsb 59 6 53 25 15 Non-Disabled 87 24 63 11 3 Students with Disabilities 38 2 36 32 30 English Language Learner (ELL) 23 0 22 36 42 Former ELL 65 6 59 25 10 ELL and Former ELL 39 2 36 32 29 Low Income 61 7 54 25 14a Percentages may not total 100 due to rounding. For the purpose of computing state results, students who were absent with or without a medically documented excuse from any subject area MCAS test are not included in performance results but are counted as non-participants for that subject area. b High Needs includes students with disabilities, English language learner students, former English language learner students, and low-income students.
Table 38: 2013 Statewide MCAS Results: Grade 8 MathematicsPercentage of Students at Each Achievement Levela
Subgroup Proficient or Higher Advanced Proficient Needs
Improvement Warning
All Students 55 22 32 25 20Gender Female 57 23 34 26 18 Male 53 22 31 25 22Race/Ethnicity African American/Black 33 9 24 30 37 Asian 76 48 29 14 9 Native Hawaiian, Pacific Islander 51 10 41 24 25 Hispanic or Latino 31 8 23 30 39 Multi-Race, Non-Hispanic or Latino 53 24 29 25 22 Amer. Ind. or Alaska Nat. 43 8 36 27 30 White 61 25 36 24 15Student Status High Needsb 32 8 24 30 38 Non-Disabled 63 27 37 25 12 Students with Disabilities 15 3 12 26 60 English Language Learner (ELL) 16 3 12 24 60 Former ELL 41 11 29 32 28 ELL and Former ELL 25 7 19 27 47 Low Income 34 9 25 31 35a Percentages may not total 100 due to rounding. For the purpose of computing state results, students who were absent with or without a medically documented excuse from any subject area MCAS test are not included in performance results but are counted as non-participants for that subject area. b High Needs includes students with disabilities, English language learner students, former English language learner students, and low-income students.
Spring 2013 MCAS Tests: Summary of State Results 32
Table 39: 2013 Statewide MCAS Results: Grade 8 Science and Technology/EngineeringPercentage of Students at Each Achievement Levela
Subgroup Proficient or Higher Advanced Proficient Needs
Improvement Warning
All Students 39 4 35 43 18Gender Female 37 3 34 45 18 Male 42 5 37 40 18Race/Ethnicity African American/Black 16 1 16 46 38 Asian 56 11 45 32 12 Native Hawaiian, Pacific Islander 26 0 26 53 21 Hispanic or Latino 15 1 14 44 41 Multi-Race, Non-Hispanic or Latino 40 5 35 40 19 Amer. Ind. or Alaska Nat. 26 2 23 51 23 White 46 4 42 43 11Student Status High Needsb 18 1 18 47 34 Non-Disabled 45 5 41 43 11 Students with Disabilities 11 1 10 40 50 English Language Learner (ELL) 3 0 3 25 71 Former ELL 17 1 16 50 33 ELL and Former ELL 9 0 8 35 57 Low Income 19 1 18 48 34a Percentages may not total 100 due to rounding. For the purpose of computing state results, students who were absent with or without a medically documented excuse from any subject area MCAS test are not included in performance results but are counted as non-participants for that subject area. b High Needs includes students with disabilities, English language learner students, former English language learner students, and low-income students.
Table 40: 2013 Statewide MCAS Results: Grade 10 English Language ArtsPercentage of Students at Each Achievement Levela
Subgroup Proficient or Higher Advanced Proficient Needs
Improvement Failing
All Students 91 45 46 7 2Gender Female 94 53 41 5 2 Male 89 37 52 8 3Race/Ethnicity African American/Black 83 25 58 13 4 Asian 92 57 35 6 2 Native Hawaiian, Pacific Islander 84 44 39 11 5 Hispanic or Latino 78 21 58 16 5 Multi-Race, Non-Hispanic or Latino 92 45 47 6 2 Amer. Ind. or Alaska Nat. 92 32 59 5 3 White 95 51 44 4 2Student Status High Needsb 81 22 59 14 5 Non-Disabled 96 52 44 3 1 Students with Disabilities 66 10 56 22 12 English Language Learner (ELL) 43 2 41 42 15 Former ELL 86 17 69 12 3 ELL and Former ELL 58 7 50 31 11 Low Income 82 24 58 13 4a Percentages may not total 100 due to rounding. For the purpose of computing state results, students who were absent with or without a medically documented excuse from any subject area MCAS test are not included in performance results but are counted as non-participants for that subject area. b High Needs includes students with disabilities, English language learner students, former English language learner students, and low-income students.
Spring 2013 MCAS Tests: Summary of State Results 33
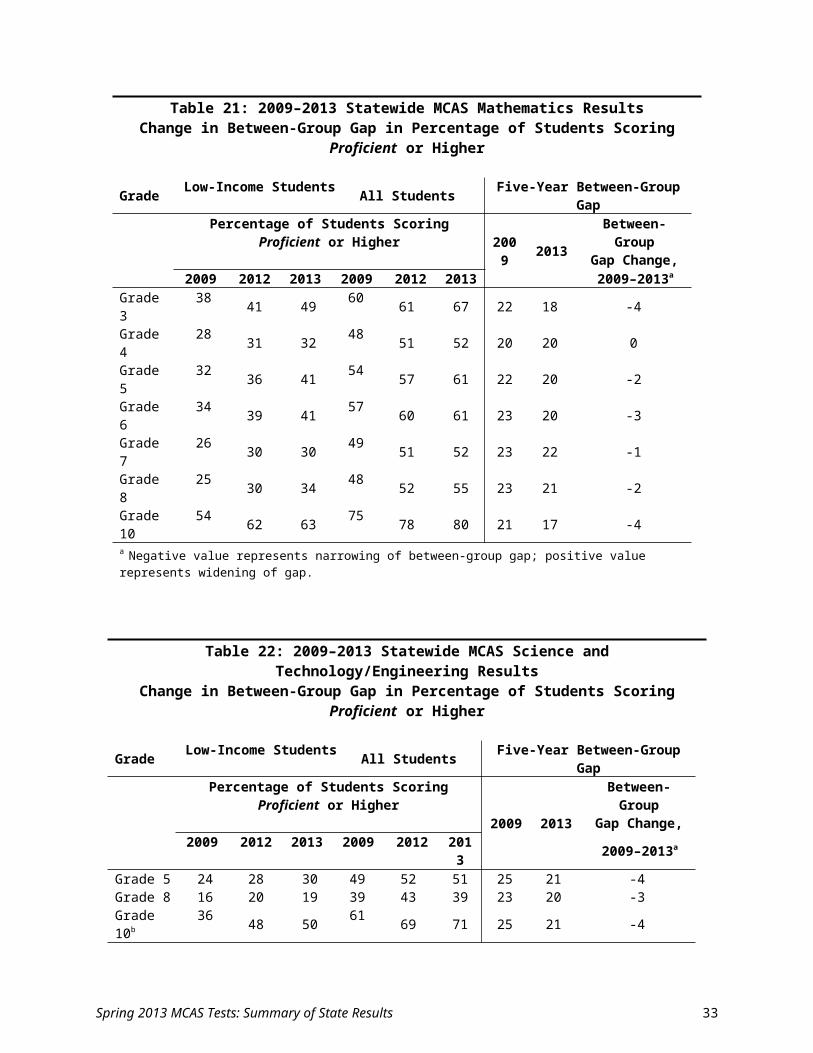
Table 41: 2013 Statewide MCAS Results: Grade 10 MathematicsPercentage of Students at Each Achievement Levela
Subgroup Proficient or Higher Advanced Proficient Needs
Improvement Failing
All Students 80 55 25 13 7Gender Female 81 55 26 13 7 Male 79 55 24 13 8Race/Ethnicity African American/Black 59 28 32 24 17 Asian 89 74 15 7 4 Native Hawaiian, Pacific Islander 71 53 18 16 13 Hispanic or Latino 57 27 30 24 19 Multi-Race, Non-Hispanic or Latino 79 54 25 13 7 Amer. Ind. or Alaska Nat. 78 46 32 13 9 White 86 62 24 10 4Student Status High Needsb 61 30 31 23 16 Non-Disabled 87 62 25 9 3 Students with Disabilities 40 14 26 30 30 English Language Learner (ELL) 27 10 17 30 43 Former ELL 61 30 32 27 12 ELL and Former ELL 39 17 22 29 32 Low Income 63 33 30 22 15a Percentages may not total 100 due to rounding. For the purpose of computing state results, students who were absent with or without a medically documented excuse from any subject area MCAS test are not included in performance results but are counted as non-participants for that subject area. b High Needs includes students with disabilities, English language learner students, former English language learner students, and low-income students.
Table 42: 2013 Statewide MCAS Results: Grade 10 Science and Technology/EngineeringPercentage of Students at Each Achievement Levela
Subgroup Proficient or Higher Advanced Proficient Needs
Improvement Failing
All Students 71 26 45 24 5Gender Female 71 25 46 24 4 Male 71 27 44 23 6Race/Ethnicity African American/Black 47 8 39 41 11 Asian 81 45 36 15 4 Native Hawaiian, Pacific Islander 75 24 51 17 8 Hispanic or Latino 41 8 33 45 14 Multi-Race, Non-Hispanic or Latino 70 26 44 25 5 Amer. Ind. or Alaska Nat. 64 14 50 30 6 White 78 30 49 19 3Student Status High Needsb 49 10 39 40 12 Non-Disabled 78 30 48 19 2 Students with Disabilities 33 4 29 46 21 English Language Learner (ELL) 16 1 15 49 35 Former ELL 45 8 37 47 8 ELL and Former ELL 27 4 24 48 24 Low Income 50 10 40 39 11a These results are reported based on students’ best performance on any STE test taken in grade 9 or grade 10; only students continuously enrolled in Massachusetts public schools from fall of grade 9 through spring of grade 10 are included. Percentages may not total 100 due to rounding. For the purpose of computing state results, students who were absent with or without a medically documented excuse from any subject area MCAS test are not included in performance results but are counted as non-participants for that subject area. b High Needs includes students with disabilities, English language learner students, former English language learner students, and low-income students.
Spring 2013 MCAS Tests: Summary of State Results 34
Spring 2013 MCAS Tests: Summary of State Results 35
V. Statewide MCAS Trend Results
Tables 43–49 provide statewide aggregate trend achievement level results for the 1998–2013 MCAS tests. Not all tests were administered in all years.
Table 43: 2001–2013 Statewide MCAS Results: Grade 3Percentage of Students at Each Achievement Levela
Subject / Year Proficient or Higher Advanced Proficient Needs
Improvement Warning
English Language Arts2013 57 12 45 36 82012 61 15 46 30 92011 61 11 50 30 92010 63 14 49 30 82009 57 12 45 33 102008 56 15 41 33 112007 59 14 45 32 92006 58 18 40 33 82005 62 – 62 31 72004 63 – 63 30 72003 63 – 63 31 62002 67 – 67 27 62001 62 – 62 31 7
Mathematics2013 66 31 36 22 112012 61 27 34 25 142011 66 14 52 25 102010 65 25 40 24 112009 60 20 40 25 152008 61 25 36 25 142007 60 19b 41 24 162006 52 4 48 32 16
a Percentages may not total 100 due to rounding. For the purpose of computing state results, students who were absent with or without a medically documented excuse from any subject area MCAS test are not included in performance results but are counted as non-participants for that subject area.b The Advanced (formerly Above Proficient) standard in grade 3 Mathematics was reset in 2007 to better measure student performance in the top reporting category. Therefore, comparisons should not be made between the percent Advanced in 2006 and 2007. However, comparisons may be drawn between the percent of students scoring Proficient or Higher in 2006 and 2007.
Spring 2013 MCAS Tests: Summary of State Results 36
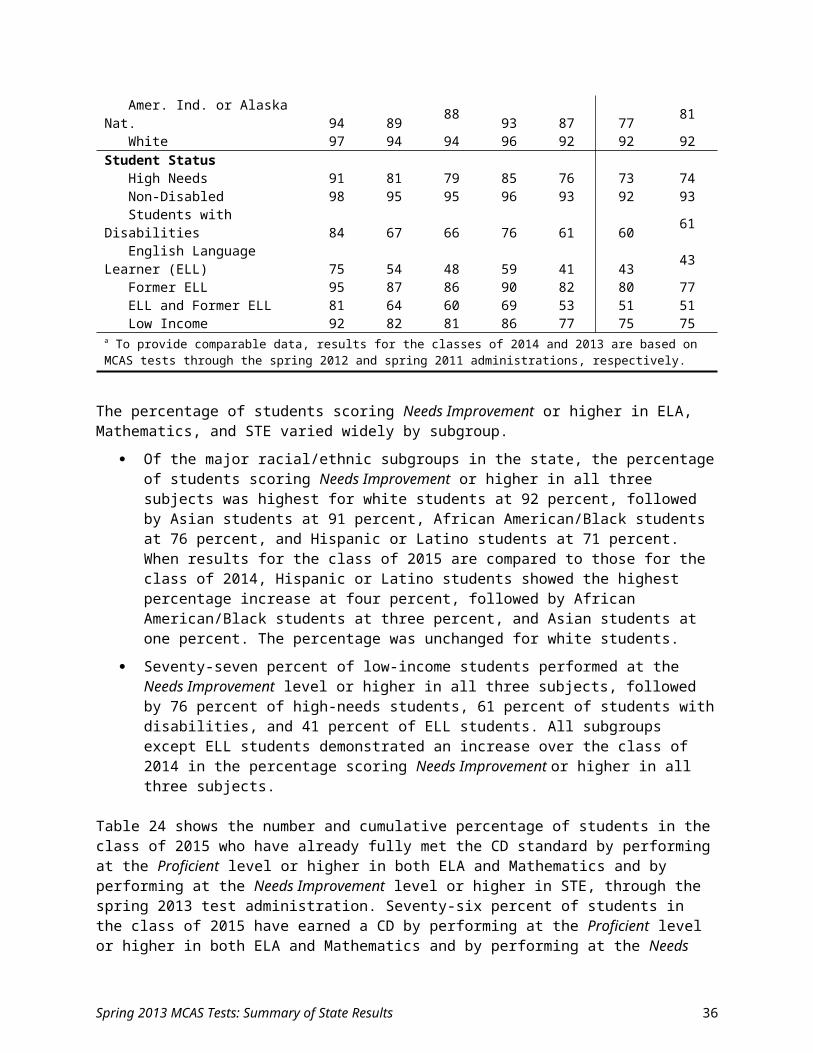
Table 44: 1998–2013 Statewide MCAS Results: Grade 4Percentage of Students at Each Achievement Levela
Subject / Year Proficient or Higher Advanced Proficient Needs
Improvement Warning
English Language Arts2013 53 10 43 33 132012 57 13 44 30 142011 53 10 43 35 122010 54 11 43 35 122009 54 12 42 35 112008 49 8 41 39 132007 56 10 46 34 102006 50 8 42 39 112005 50 10 40 40 112004 56 11 45 35 102003 56 10 46 34 92002 54 8 46 37 102001 51 7 44 38 11
Mathematics2013 52 18 34 38 102012 51 16 35 36 122011 47 15 32 42 112010 48 16 32 41 112009 48 16 32 41 112008 49 20 29 38 132007 48 19 29 39 132006 40 15 25 45 152005 40 14 26 44 152004 42 14 28 44 142003 40 12 28 44 162002 39 12 27 42 192001 34 10 24 46 192000 40 12 28 42 181999 36 12 24 44 191998 34 11 23 44 23
a Percentages may not total 100 due to rounding. For the purpose of computing state results, students who were absent with or without a medically documented excuse from any subject area MCAS test are not included in performance results but are counted as non-participants for that subject area.
Spring 2013 MCAS Tests: Summary of State Results 37
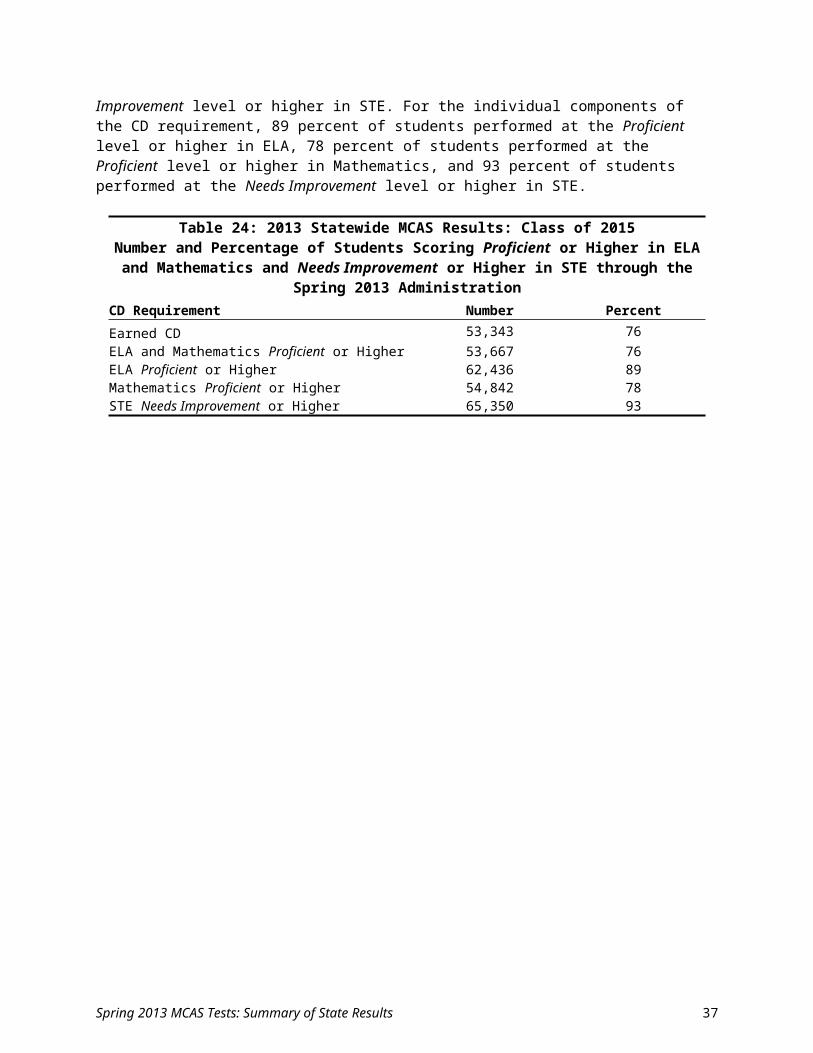
Table 45: 2003–2013 Statewide MCAS Results: Grade 5Percentage of Students at Each Achievement Levela
Subject / Year Proficient or Higher Advanced Proficient Needs
Improvement Warning
English Language Arts2013 66 18 47 24 102012 61 17 44 28 112011 67 17 50 24 92010 63 16 47 28 102009 63 15 48 29 82008 61 13 48 30 92007 63 15 48 28 92006 59 15 44 31 9
Mathematics2013 61 28 33 25 142012 57 25 32 26 172011 59 25 34 26 152010 55 25 30 28 172009 54 22 32 29 182008 52 22 30 30 172007 51 19 32 31 182006 43 17 26 34 23
Science and Technology/Engineering
2013 51 20 31 36 122012 52 22 30 34 142011 50 14 36 36 152010 53 15 38 36 112009 49 17 32 39 122008 50 17 33 38 122007 51 14 37 37 122006 50 17 33 39 112005 51 16 35 38 122004 55 20 35 33 132003 52 19 33 34 14
a Percentages may not total 100 due to rounding. For the purpose of computing state results, students who were absent with or without a medically documented excuse from any subject area MCAS test are not included in performance results but are counted as non-participants for that subject area.
Spring 2013 MCAS Tests: Summary of State Results 38
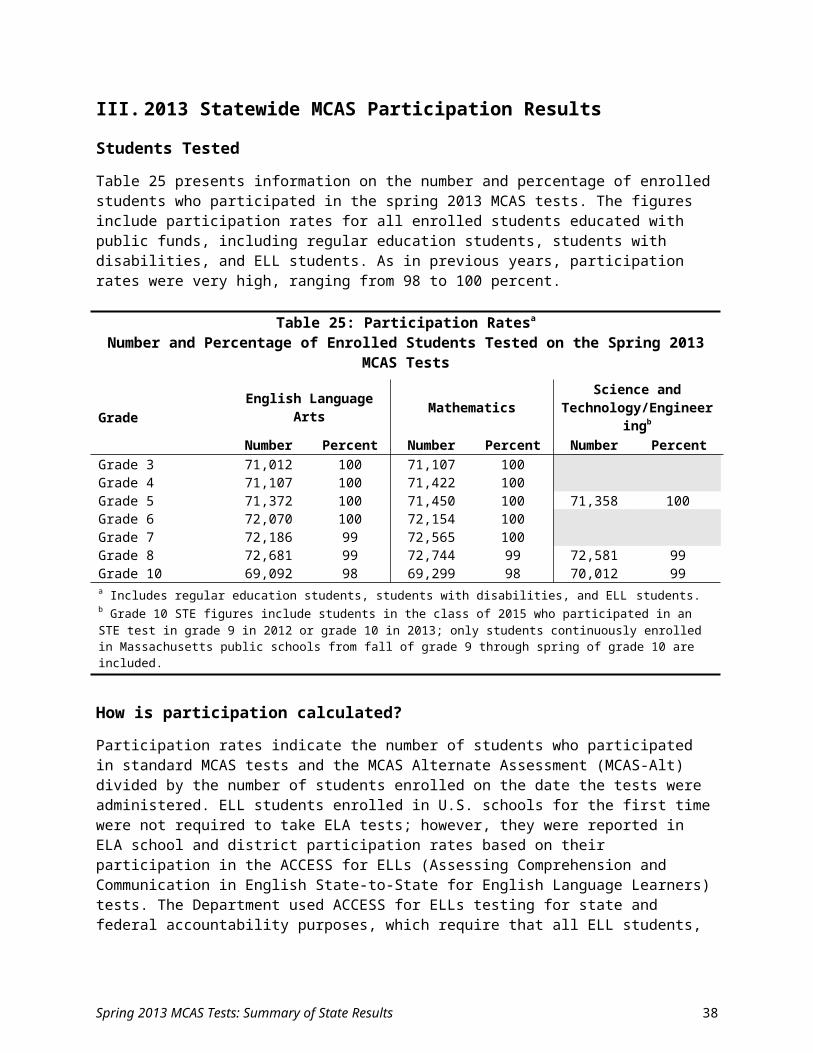
Table 46: 2001–2013 Statewide MCAS Results: Grade 6Percentage of Students at Each Achievement Levela
Subject / Year Proficient or Higher Advanced Proficient Needs
Improvement Warning
English Language Arts2013 67 16 51 23 102012 66 18 48 22 112011 68 17 51 23 92010 69 15 54 21 92009 66 16 50 24 92008 67 15 52 24 82007 67 9 58 26 72006 64 10 54 28 8
Mathematics2013 61 25 35 24 152012 60 27 33 24 162011 58 26 32 25 162010 59 27 32 25 162009 57 24 33 27 162008 56 23 33 26 182007 52 20 32 28 202006 46 17 29 29 252005 46 17 29 30 232004 43 17 26 32 252003 42 16 26 32 262002 41 13 28 29 302001 36 13 23 30 33
a Percentages may not total 100 due to rounding. For the purpose of computing state results, students who were absent with or without a medically documented excuse from any subject area MCAS test are not included in performance results but are counted as non-participants for that subject area.
Spring 2013 MCAS Tests: Summary of State Results 39
Table 47: 2001–2013 Statewide MCAS Results: Grade 7Percentage of Students at Each Achievement Levela
Subject / Year Proficient or Higher Advanced Proficient Needs
Improvement Warning
English Language Arts2013 72 12 59 22 72012 71 15 56 21 72011 73 14 59 21 62010 72 11 61 21 72009 70 14 56 23 72008 69 12 57 23 82007 69 9 60 23 82006 65 10 55 26 92005 66 10 56 27 82004 68 9 59 25 72003 66 8 58 28 72002 64 9 55 28 92001 55 6 49 32 12
Mathematics2013 52 19 33 27 212012 51 20 31 30 182011 51 19 32 27 222010 53 14 39 27 192009 49 16 33 30 212008 47 15 32 29 242007 46 15 31 30 242006 40 12 28 33 28
a Percentages may not total 100 due to rounding. For the purpose of computing state results, students who were absent with or without a medically documented excuse from any subject area MCAS test are not included in performance results but are counted as non-participants for that subject area.
Spring 2013 MCAS Tests: Summary of State Results 40
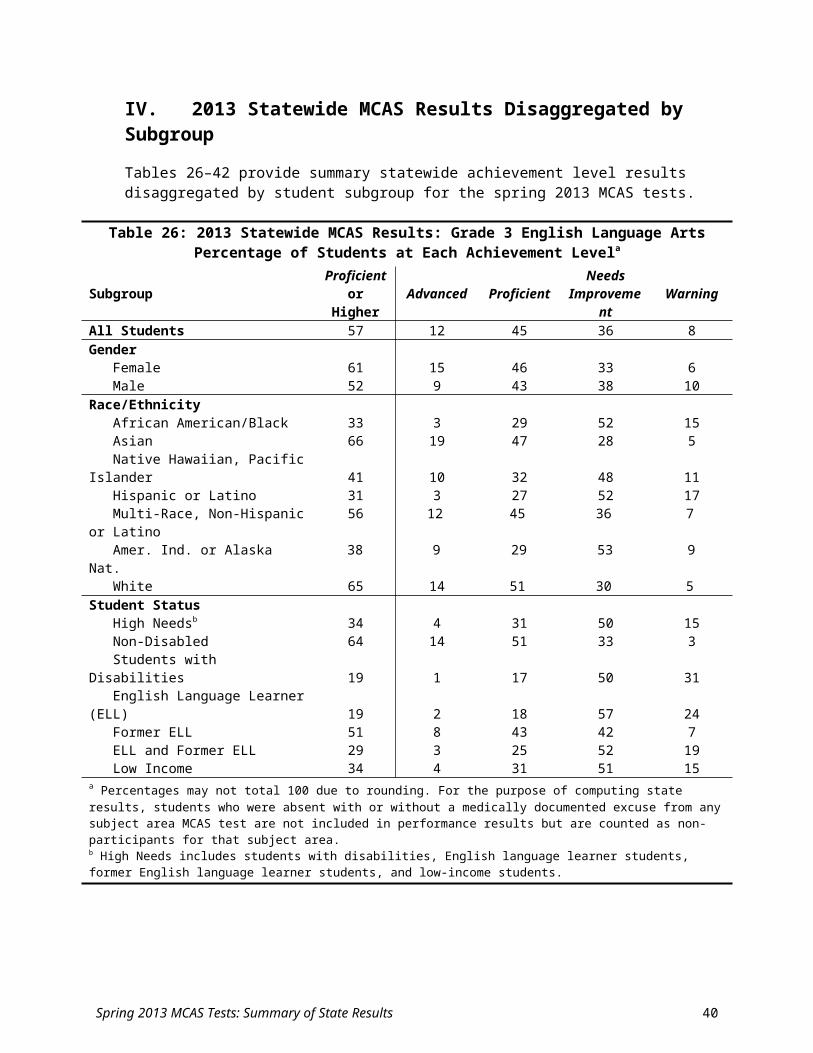
Table 48: 1998–2013 Statewide MCAS Results: Grade 8Percentage of Students at Each Achievement Levela
Subject / Year Proficient or Higher Advanced Proficient Needs
Improvement Warning
English Language Arts2013 78 20 58 15 72012 81 18 63 14 62011 79 20 59 15 62010 78 17 61 16 72009 78 15 63 15 62008 75 12 63 18 72007 75 12 63 18 62006 74 12 62 19 7
Mathematics2013 55 22 32 25 202012 52 22 30 28 192011 52 23 29 27 212010 51 22 29 28 212009 48 20 28 28 232008 49 19 30 27 242007 45 17 28 30 252006 40 12 28 31 292005 39 13 26 30 312004 39 13 26 32 292003 37 12 25 30 332002 34 11 23 33 332001 34 11 23 34 312000 34 10 24 27 391999 28 6 22 31 401998 31 8 23 26 42
Science and Technology/Engineering
2013 39 4 35 43 182012 43 5 38 38 202011 39 4 35 42 192010 40 4 36 41 192009 39 4 35 40 212008 39 3 36 39 222007 33 3 30 44 242006 32 4 28 43 252005 33 4 29 41 262004 33 5 28 35 312003 32 4 28 37 30
a Percentages may not total 100 due to rounding. For the purpose of computing state results, students who were absent with or without a medically documented excuse from any subject area MCAS test are not included in performance results but are counted as non-participants for that subject area.
Spring 2013 MCAS Tests: Summary of State Results 41
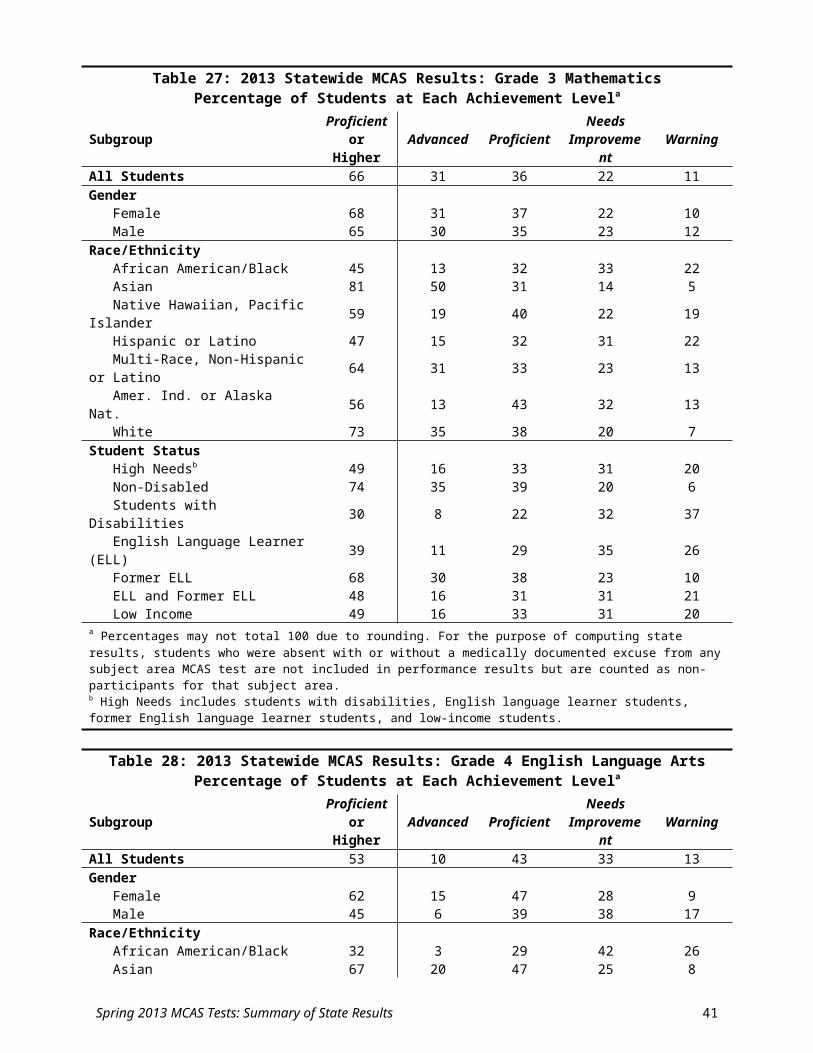
Table 49: 1998–2013 Statewide MCAS Results: Grade 10Percentage of Students at Each Achievement Levela
Subject / Year Proficient or Higher Advanced Proficient Needs
Improvement Failing
English Language Arts2013 91 45 46 7 22012 88 37 51 9 32011 84 33 51 13 32010 78 26 52 18 42009 79 28 51 17 42008 75 24 51 21 42007 71 22 49 24 62006 70 16 54 24 72005 64 22 42 25 112004 62 19 43 27 112003 61 20 41 28 112002 59 19 40 27 142001 51 15 36 31 182000 36 7 29 30 341999 34 4 30 34 321998 38 5 33 34 28
Mathematics2013 80 55 25 13 72012 78 50 28 15 72011 77 48 29 16 72010 75 50 25 17 72009 75 47 28 18 82008 72 43 29 19 92007 68 41 27 22 92006 67 40 27 21 122005 61 34 27 24 152004 57 29 28 28 152003 51 24 27 29 202002 44 20 24 31 252001 45 18 27 30 252000 33 15 18 22 451999 24 9 15 23 531998 24 7 17 24 52
Science and Technology/Engineeringb
2013 71 26 45 24 52012 69 24 45 25 62011 67 20 47 27 72010 65 18 47 28 82009 61 16 45 29 92008 57 14 43 31 12
a Percentages may not total 100 due to rounding. For the purpose of computing state results, students who were absent with or without a medically documented excuse from any MCAS test are not included in performance results but are counted as non-participants for that subject area.b Grade 10 STE results are reported based on students’ best performance on any STE test taken in grade 9 or grade 10; only students continuously enrolled in Massachusetts public schools from fall of grade 9 through spring of grade 10 are included.
Spring 2013 MCAS Tests: Summary of State Results 42
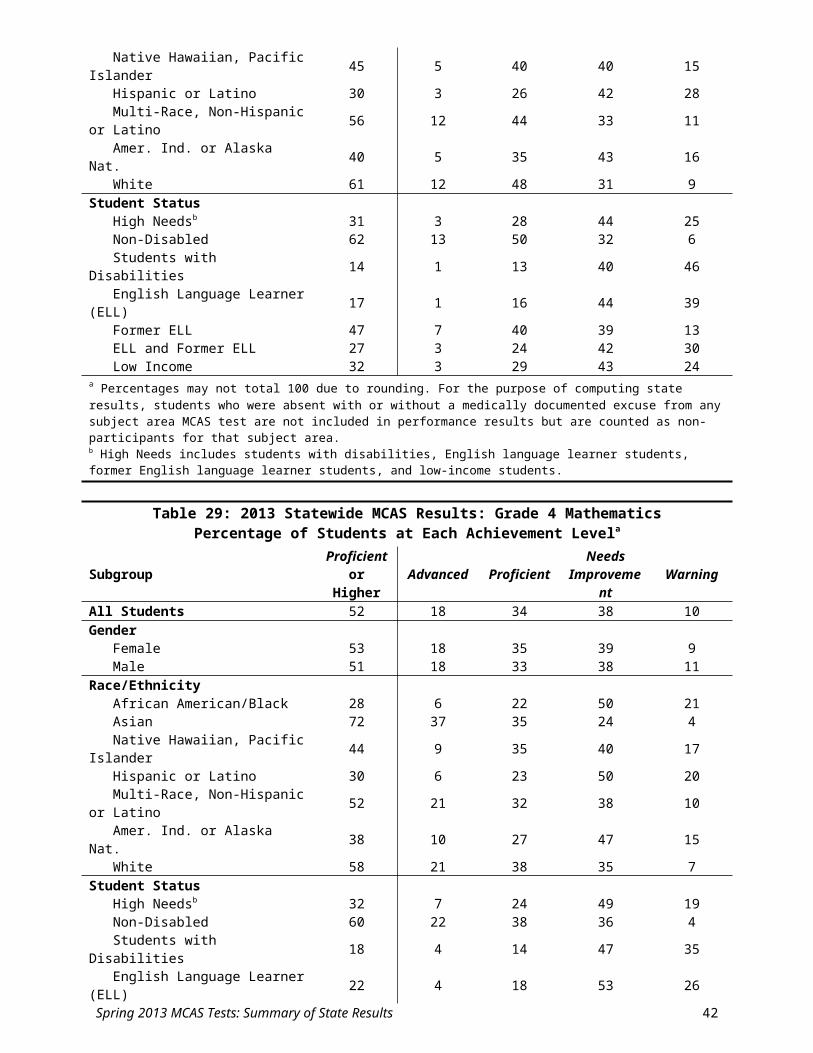
VI. Statewide MCAS Trend Results Disaggregated by Subgroup
This section provides detailed information regarding statewide student subgroup achievement and growth results for the 2009 through 2013 MCAS tests. Tables in this section provide the percentage of students at each achievement level for all tested grades and the median Student Growth Percentile (SGP) in ELA and Mathematics for grades 4−8 and 10. SGPs represent the middle student’s growth for that subgroup compared to students with the same or very similar MCAS scores in prior years. Because MCAS testing begins in grade 3, SGPs cannot be calculated in that grade. Tables 50–66 show results by student status (e.g., students with disabilities); Tables 67–73 give results by race/ethnicity; and Tables 74 and 75 show results by gender. The following list provides definitions of the student status groups that appear in this section:
High Needs: Students identified as high needs include students with disabilities, English language learner students, former English language learner students, and low-income students. Results are reported for this student subgroup for the first time in 2011; data for prior years are not provided.
Students with Disabilities: A student with a disability has an IEP provided under the Individuals with Disabilities Education Act.
English Language Learner: An English language learner (ELL)7 student is “a student whose first language is a language other than English and who is unable to perform ordinary classroom work in English.”
Former English Language Learner: A student who is a former English language learner8 has transitioned out of ELL status during the current school year or within the past two school years. The federal government requires that states continue to monitor the progress of former ELL students. The combined ELL and former ELL reporting category represents the federal and state accountability subgroup reporting category.
Low Income: Students identified as low income are those who are eligible to receive free or reduced-price school lunch according to federal guidelines.
7 English language learner (ELL) was previously referred to as limited English proficient (LEP).8 Former English language learner was previously referred to as formerly limited English proficient (FLEP).
Spring 2013 MCAS Tests: Summary of State Results 43
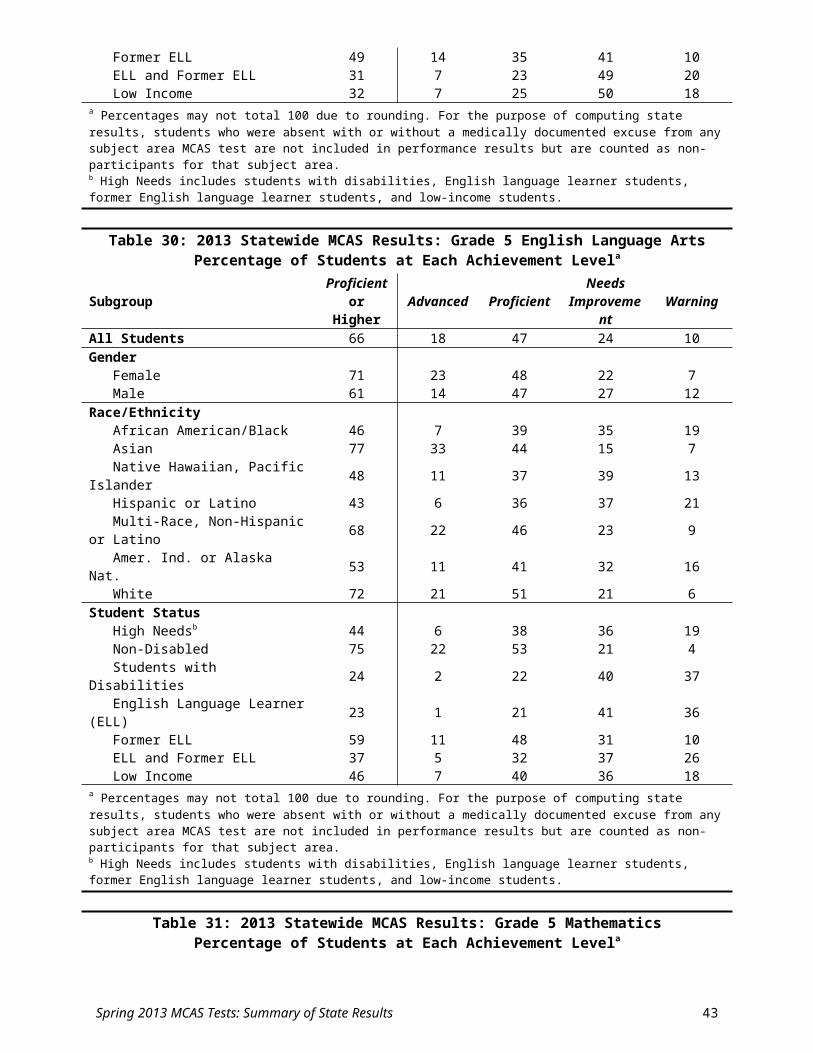
Table 50: 2009–2013 Statewide MCAS Results by Student Status: Grade 3 English Language ArtsPercentage of Students at Each Achievement Levela
Student Status Category / Year Advanced Proficient Needs Improvement Warning
High Needsb
2013 4 31 50 152012 6 34 43 172011 4 35 44 17
Students with Disabilities2013 1 17 50 312012 3 21 44 322011 2 22 45 322010 2 23 46 292009 2 21 44 33
English Language Learner (ELL)2013 2 18 57 242012 2 22 49 272011 1 23 49 262010 2 25 51 222009 2 21 48 29
ELL and Former ELL2013 3 25 52 192012 5 29 45 212011 3 30 46 222010 4 30 47 192009 3 26 46 25
Former ELL2013 8 43 42 72012 11 47 35 72011 8 48 36 82010 9 45 38 82009 8 41 39 13
Low Income2013 4 31 51 152012 5 35 43 172011 4 36 44 162010 6 37 43 142009 4 31 46 19
a Percentages may not total 100 due to rounding. For the purpose of computing state results, students who were absent with or without a medically documented excuse from any subject area MCAS test are not included in performance results but are counted as non-participants for that subject area. b High Needs includes students with disabilities, English language learner students, former English language learner students, and low-income students. Results are reported for this student subgroup for the first time in 2011; data for prior years are not provided.
Spring 2013 MCAS Tests: Summary of State Results 44
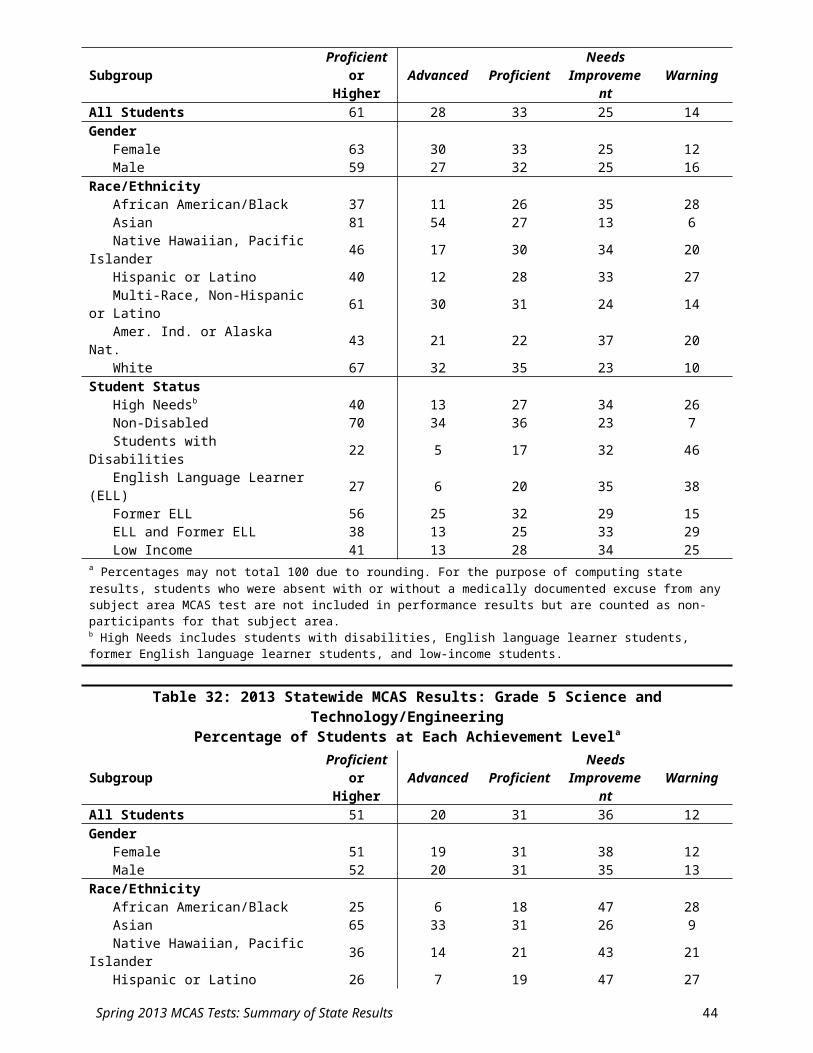
Table 51: 2009–2013 Statewide MCAS Results by Student Status: Grade 3 MathematicsPercentage of Students at Each Achievement Levela
Student Status Category / Year Advanced Proficient Needs Improvement Warning
High Needsb
2013 16 33 31 202012 13 28 32 262011 6 40 35 19
Students with Disabilities2013 8 22 32 372012 7 19 31 432011 3 28 36 332010 6 24 35 342009 5 23 31 42
English Language Learner (ELL)2013 11 29 35 262012 9 23 33 352011 4 33 38 252010 8 29 36 272009 5 25 33 37
ELL and Former ELL2013 16 31 31 212012 14 26 31 292011 7 37 35 212010 12 31 34 232009 8 28 31 33
Former ELL2013 30 38 23 102012 27 36 25 132011 13 50 27 92010 23 38 26 122009 17 38 27 19
Low Income2013 16 33 31 202012 13 28 33 262011 6 40 35 192010 11 34 34 202009 7 31 34 28
a Percentages may not total 100 due to rounding. For the purpose of computing state results, students who were absent with or without a medically documented excuse from any subject area MCAS test are not included in performance results but are counted as non-participants for that subject area. b High Needs includes students with disabilities, English language learner students, former English language learner students, and low-income students. Results are reported for this student subgroup for the first time in 2011; data for prior years are not provided.
Spring 2013 MCAS Tests: Summary of State Results 45

Table 52: 2009–2013 Statewide MCAS Results by Student Status: Grade 4 English Language ArtsPercentage of Students at Each Achievement Levela
Student Status Category / Year Advanced Proficient Needs Improvement Warning Median
SGPHigh Needsb
2013 3 28 44 25 42.02012 4 30 40 26 43.02011 3 28 47 23 42.0
Students with Disabilities2013 1 13 40 46 34.02012 1 17 38 44 37.02011 1 14 44 41 36.02010 1 15 44 40 36.02009 1 15 44 39 34.0
English Language Learner (ELL)2013 1 16 44 39 44.02012 1 19 41 38 46.02011 1 17 47 34 46.02010 1 18 48 33 45.02009 1 16 46 37 44.0
ELL and Former ELL2013 3 24 42 30 47.02012 3 26 39 32 47.02011 3 25 45 28 47.02010 3 23 46 28 46.02009 3 22 45 30 46.0
Former ELL2013 7 40 39 13 50.02012 8 42 36 14 49.02011 7 42 40 12 52.02010 7 37 41 15 49.02009 6 36 43 15 50.0
Low Income2013 3 29 43 24 43.02012 4 31 40 25 42.02011 3 29 46 22 42.02010 3 28 47 23 42.02009 3 26 47 23 41.0
a Percentages may not total 100 due to rounding. For the purpose of computing state results, students who were absent with or without a medically documented excuse from any subject area MCAS test are not included in performance results but are counted as non-participants for that subject area. b High Needs includes students with disabilities, English language learner students, former English language learner students, and low-income students. Results are reported for this student subgroup for the first time in 2011; data for prior years are not provided.
Spring 2013 MCAS Tests: Summary of State Results 46
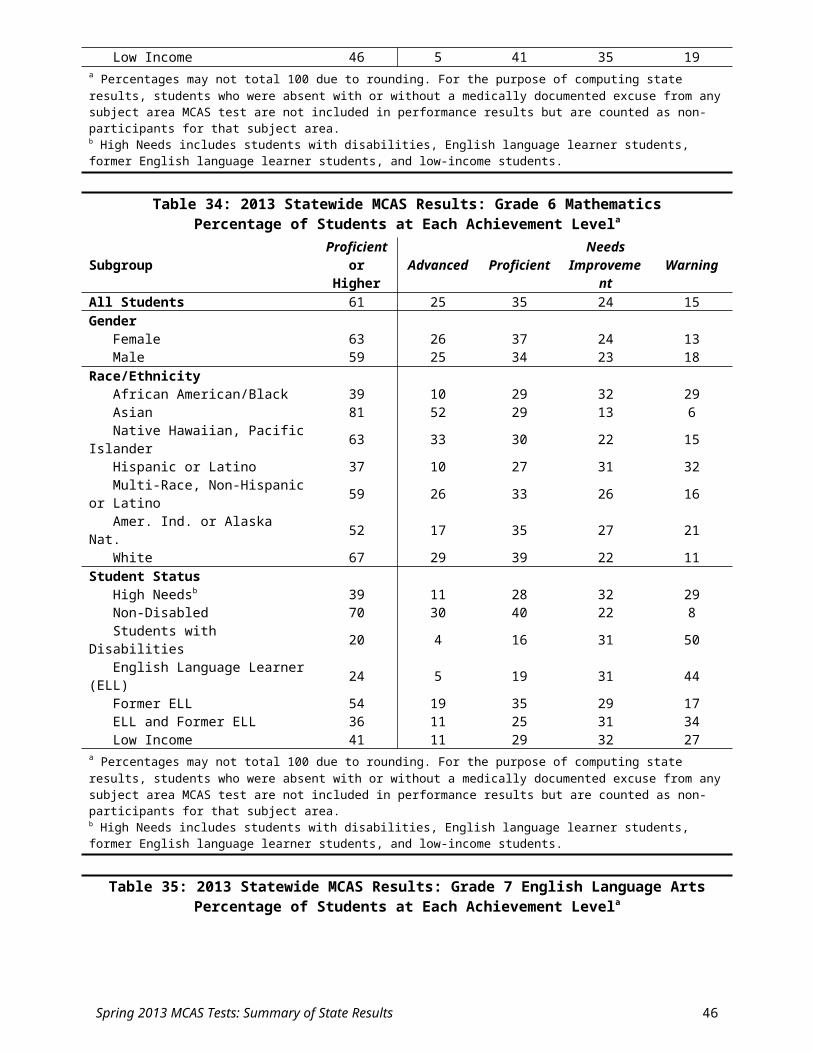
Table 53: 2009–2013 Statewide MCAS Results by Student Status: Grade 4 MathematicsPercentage of Students at Each Achievement Levela
Student Status Category / Year Advanced Proficient Needs
Improvement Warning MedianSGP
High Needsb
2013 7 24 49 19 49.02012 6 24 46 23 43.02011 6 22 51 21 45.0
Students with Disabilities2013 4 14 47 35 47.02012 3 15 43 39 40.02011 3 13 48 36 39.02010 3 13 48 36 39.02009 3 13 47 37 39.0
English Language Learner (ELL)2013 4 18 53 26 52.02012 3 19 47 31 45.02011 5 17 50 29 50.02010 5 18 50 28 51.02009 3 15 48 33 40.0
ELL and Former ELL2013 7 23 49 20 53.02012 6 23 44 26 46.02011 7 21 48 24 50.02010 7 21 48 24 52.02009 6 20 47 27 43.0
Former ELL2013 14 35 41 10 54.02012 13 34 39 13 48.02011 13 32 44 11 51.52010 14 29 43 14 54.02009 13 29 43 15 49.0
Low Income2013 7 25 50 18 49.02012 6 25 47 23 43.02011 6 22 52 20 45.02010 6 22 51 21 46.02009 6 22 51 22 42.0
a Percentages may not total 100 due to rounding. For the purpose of computing state results, students who were absent with or without a medically documented excuse from any subject area MCAS test are not included in performance results but are counted as non-participants for that subject area. b High Needs includes students with disabilities, English language learner students, former English language learner students, and low-income students. Results are reported for this student subgroup for the first time in 2011; data for prior years are not provided.
Spring 2013 MCAS Tests: Summary of State Results 47
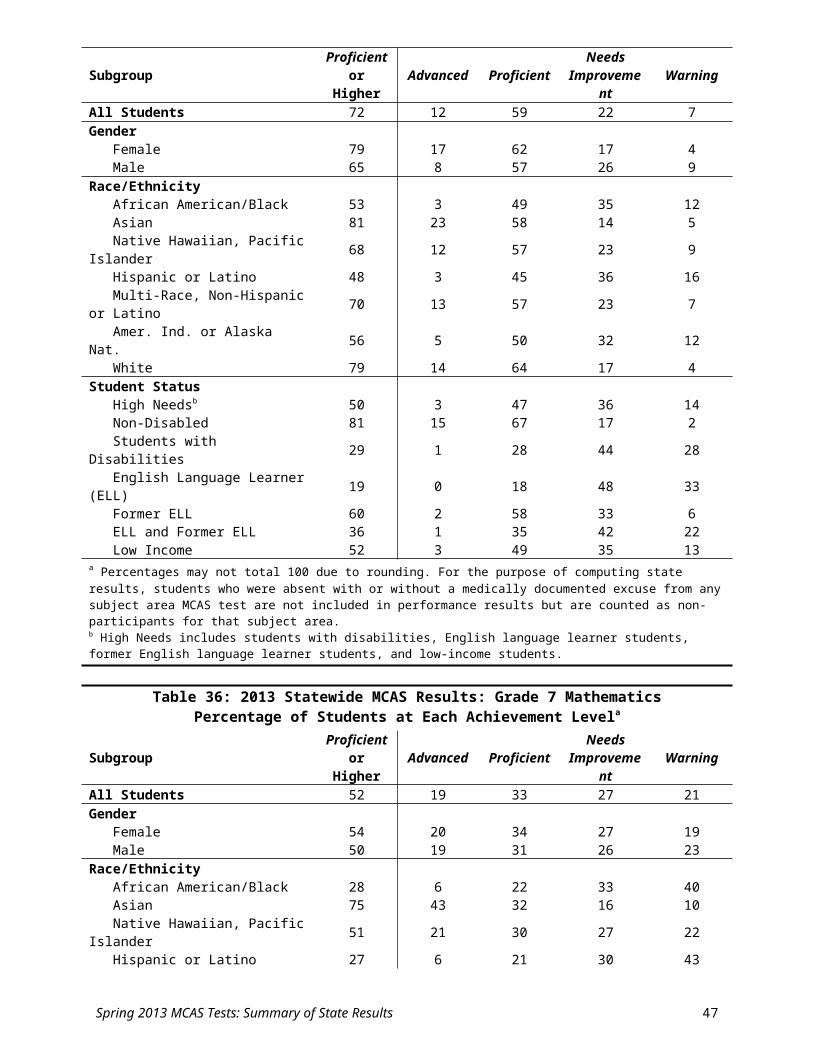
Table 54: 2009–2013 Statewide MCAS Results by Student Status: Grade 5 English Language ArtsPercentage of Students at Each Achievement Levela
Student Status Category / Year Advanced Proficient Needs Improvement Warning Median
SGPHigh Needsb
2013 6 38 36 19 50.02012 6 33 40 22 46.02011 5 39 38 18 46.0
Students with Disabilities2013 2 22 40 37 46.02012 2 19 41 39 43.02011 2 25 41 32 43.02010 2 21 43 35 42.02009 2 22 47 29 42.0
English Language Learner (ELL)2013 1 21 41 36 55.02012 2 17 45 37 46.02011 1 22 44 32 45.02010 2 20 44 35 47.02009 1 16 49 34 46.0
ELL and Former ELL2013 5 32 37 26 56.02012 5 25 42 29 49.02011 4 31 40 25 47.02010 4 27 42 28 49.02009 4 25 47 24 48.0
Former ELL2013 11 48 31 10 58.02012 11 42 36 12 54.02011 9 50 30 11 51.02010 9 41 37 13 52.02009 8 40 44 8 51.0
Low Income2013 7 40 36 18 50.02012 6 34 39 20 45.02011 5 40 38 17 45.02010 5 35 40 19 46.02009 5 35 45 16 44.0
a Percentages may not total 100 due to rounding. For the purpose of computing state results, students who were absent with or without a medically documented excuse from any subject area MCAS test are not included in performance results but are counted as non-participants for that subject area. b High Needs includes students with disabilities, English language learner students, former English language learner students, and low-income students. Results are reported for this student subgroup for the first time in 2011; data for prior years are not provided.
Spring 2013 MCAS Tests: Summary of State Results 48
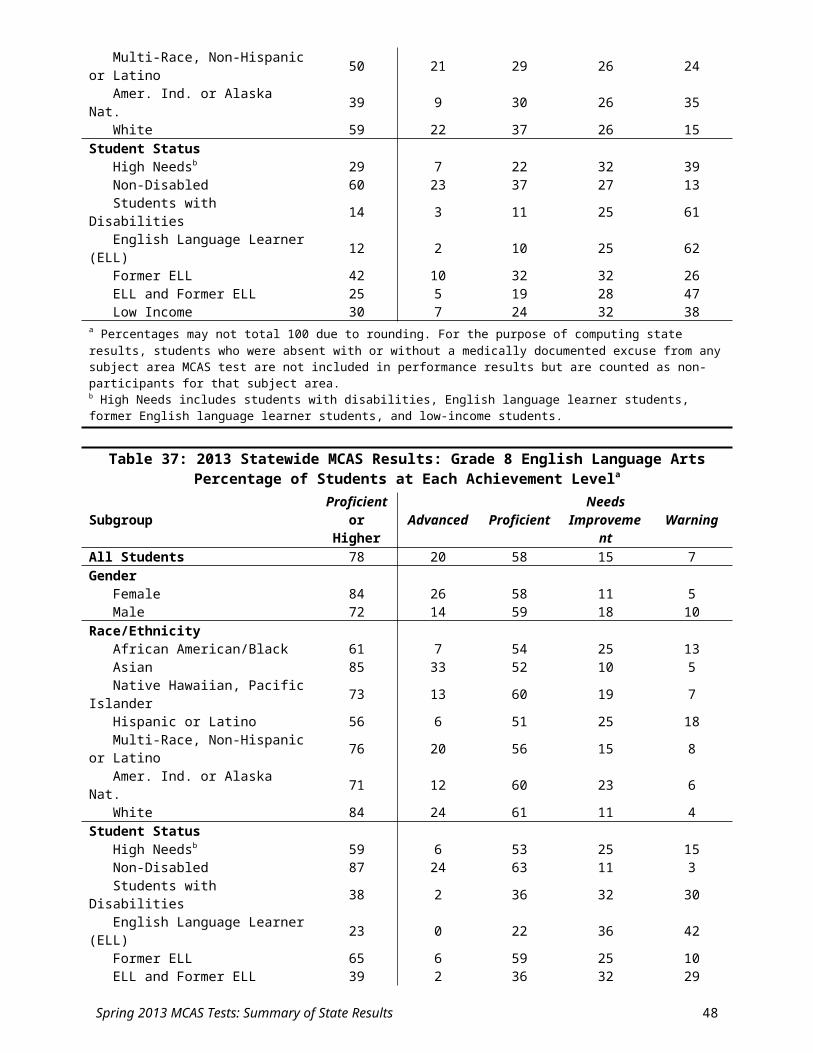
Table 55: 2009–2013 Statewide MCAS Results by Student Status: Grade 5 MathematicsPercentage of Students at Each Achievement Levela
Student Status Category / Year Advanced Proficient Needs Improvement Warning Median
SGPHigh Needsb
2013 13 27 34 26 49.02012 11 24 33 32 45.02011 10 27 34 29 44.0
Students with Disabilities2013 5 17 32 46 42.02012 5 15 30 51 40.02011 5 17 32 46 42.02010 4 14 32 50 41.02009 4 14 32 50 41.0
English Language Learner (ELL)2013 6 20 35 38 54.02012 6 18 33 43 51.02011 6 20 33 41 50.02010 5 17 33 45 51.02009 5 16 30 50 46.0
ELL and Former ELL2013 13 25 33 29 57.02012 11 22 32 35 51.02011 10 26 31 33 50.02010 10 20 33 37 50.02009 9 20 32 39 48.0
Former ELL2013 25 32 29 15 60.02012 22 29 30 19 52.02011 19 38 27 17 51.02010 18 26 32 23 49.02009 16 27 35 21 50.0
Low Income2013 13 28 34 25 50.02012 11 25 34 30 45.02011 9 28 34 28 43.02010 10 23 37 30 44.02009 8 24 35 33 44.0
a Percentages may not total 100 due to rounding. For the purpose of computing state results, students who were absent with or without a medically documented excuse from any subject area MCAS test are not included in performance results but are counted as non-participants for that subject area. b High Needs includes students with disabilities, English language learner students, former English language learner students, and low-income students. Results are reported for this student subgroup for the first time in 2011; data for prior years are not provided.
Spring 2013 MCAS Tests: Summary of State Results 49
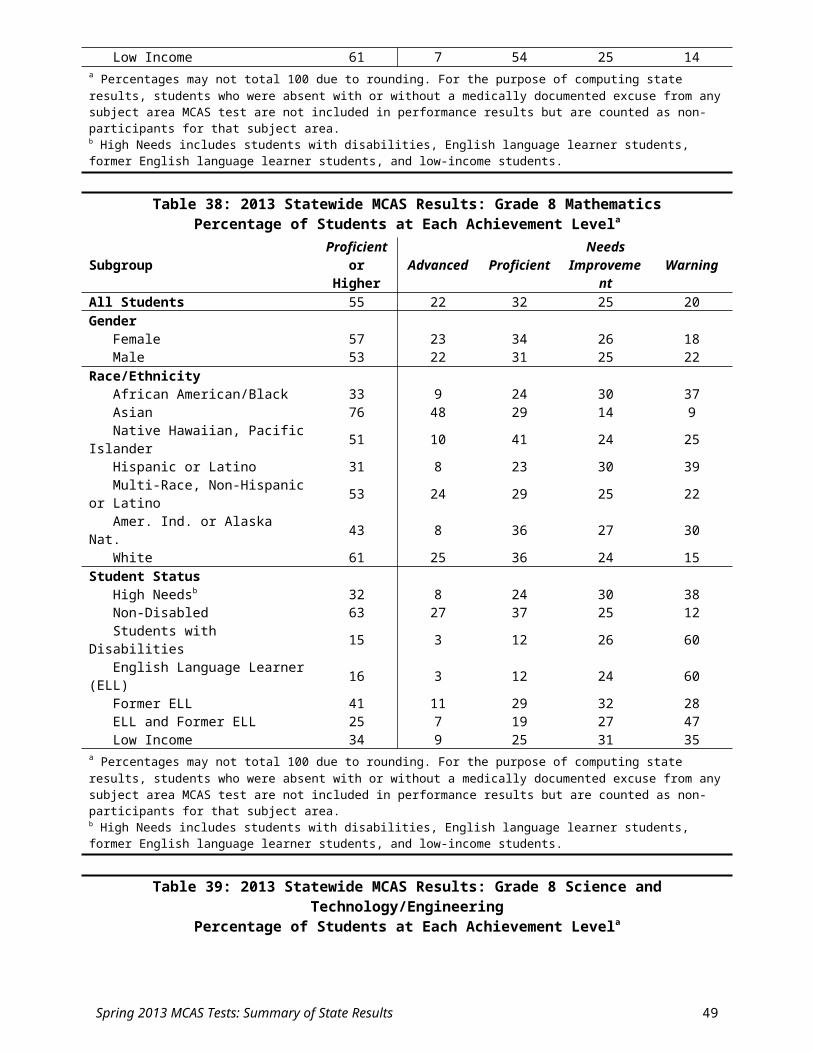
Table 56: 2009–2013 Statewide MCAS Results by Student Status: Grade 5 Science & Tech/EngPercentage of Students at Each Achievement Levela
Student Status Category / Year Advanced Proficient Needs Improvement Warning
High Needsb
2013 7 22 47 232012 8 21 44 272011 4 23 45 28
Students with Disabilities2013 4 15 44 372012 5 14 41 402011 4 17 41 392010 3 18 45 342009 4 16 45 34
English Language Learner (ELL)2013 2 10 43 462012 2 8 40 502011 1 9 38 522010 1 11 46 422009 2 9 43 46
ELL and Former ELL2013 6 16 45 342012 4 14 42 402011 2 14 42 422010 3 17 46 342009 4 14 46 36
Former ELL2013 12 26 47 152012 10 25 46 202011 6 25 49 202010 6 30 46 182009 8 22 51 19
Low Income2013 7 22 47 232012 7 21 44 282011 4 22 45 292010 4 25 48 232009 4 20 50 26
a Percentages may not total 100 due to rounding. For the purpose of computing state results, students who were absent with or without a medically documented excuse from any subject area MCAS test are not included in performance results but are counted as non-participants for that subject area. b High Needs includes students with disabilities, English language learner students, former English language learner students, and low-income students. Results are reported for this student subgroup for the first time in 2011; data for prior years are not provided.
Spring 2013 MCAS Tests: Summary of State Results 50
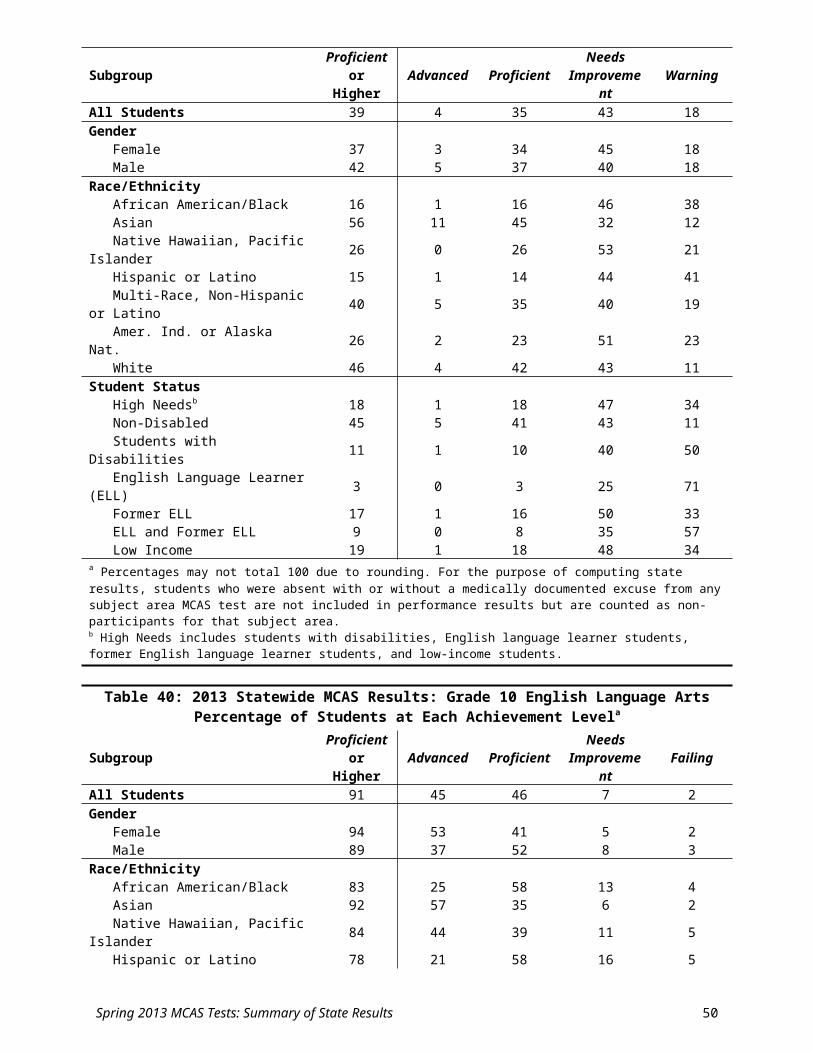
Table 57: 2009–2013 Statewide MCAS Results by Student Status: Grade 6 English Language ArtsPercentage of Students at Each Achievement Levela
Student Status Category / Year Advanced Proficient Needs Improvement Warning Median
SGPHigh Needsb
2013 5 40 36 20 47.02012 5 38 35 22 46.02011 5 41 36 18 46.0
Students with Disabilities2013 1 23 39 36 46.02012 2 24 37 38 44.02011 2 26 40 32 44.02010 1 27 38 33 42.02009 2 24 41 33 41.0
English Language Learner (ELL)2013 0 17 42 41 50.02012 1 18 39 42 49.02011 1 19 42 38 48.02010 1 23 40 36 54.02009 2 16 41 42 52.0
ELL and Former ELL2013 3 29 39 29 52.02012 3 30 37 31 51.02011 3 28 39 29 49.02010 3 33 37 27 55.02009 5 28 38 29 55.0
Former ELL2013 6 48 35 12 55.02012 7 49 33 11 52.02011 6 45 35 13 51.02010 7 50 30 12 58.02009 9 44 36 11 58.0
Low Income2013 5 41 35 19 47.02012 6 39 35 21 44.02011 5 42 36 17 45.02010 5 43 34 18 47.02009 6 38 38 18 47.0
a Percentages may not total 100 due to rounding. For the purpose of computing state results, students who were absent with or without a medically documented excuse from any subject area MCAS test are not included in performance results but are counted as non-participants for that subject area. b High Needs includes students with disabilities, English language learner students, former English language learner students, and low-income students. Results are reported for this student subgroup for the first time in 2011; data for prior years are not provided.
Spring 2013 MCAS Tests: Summary of State Results 51
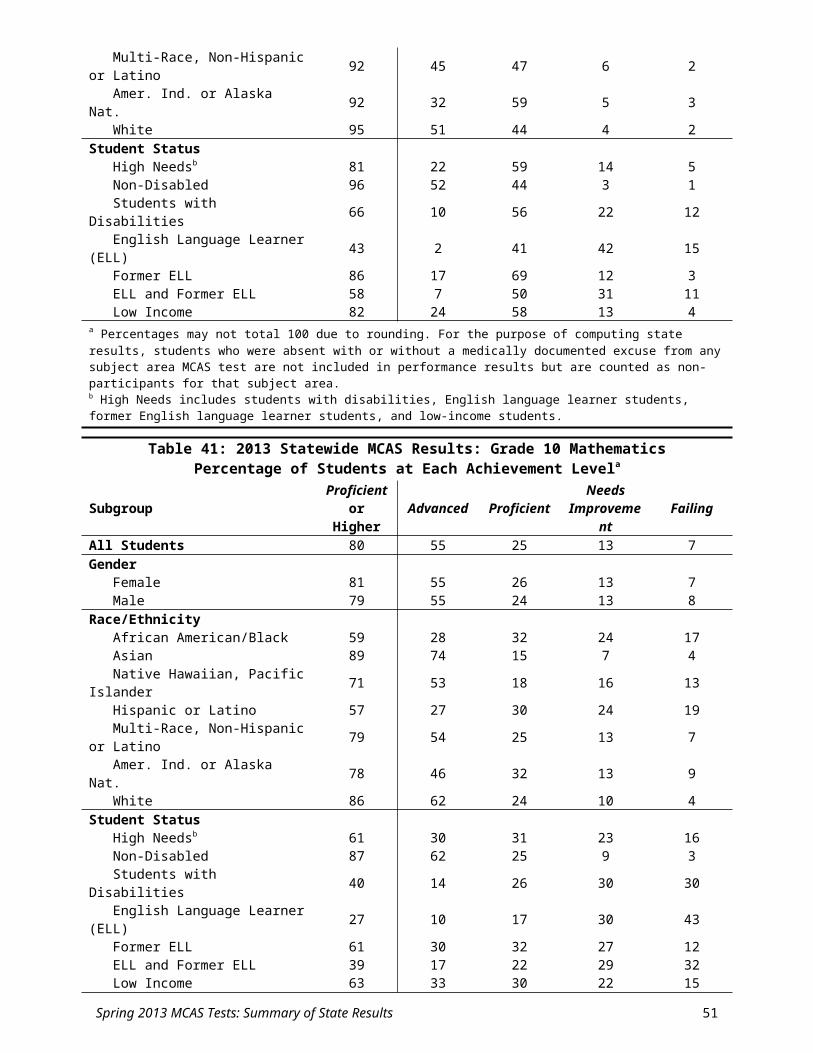
Table 58: 2009–2013 Statewide MCAS Results by Student Status: Grade 6 MathematicsPercentage of Students at Each Achievement Levela
Student Status Category / Year Advanced Proficient Needs Improvement Warning Median
SGPHigh Needsb
2013 11 28 32 29 46.02012 12 26 32 30 47.02011 11 25 33 31 46.0
Students with Disabilities2013 4 16 31 50 41.02012 5 16 30 50 41.02011 4 15 31 50 41.02010 4 15 31 49 42.02009 4 15 32 49 41.0
English Language Learner (ELL)2013 5 19 31 44 54.02012 6 18 31 45 55.02011 5 15 30 51 50.02010 6 17 30 47 55.02009 5 14 28 52 51.0
ELL and Former ELL2013 11 25 31 34 56.02012 12 24 30 34 55.02011 8 20 31 40 50.02010 10 22 30 38 56.02009 9 21 30 40 53.0
Former ELL2013 19 35 29 17 57.02012 22 34 29 16 56.02011 15 29 33 23 50.02010 17 30 30 22 56.02009 14 30 33 23 55.0
Low Income2013 11 29 32 27 47.02012 12 27 32 28 47.02011 11 26 33 30 46.02010 11 26 32 30 46.02009 9 25 35 31 45.0
a Percentages may not total 100 due to rounding. For the purpose of computing state results, students who were absent with or without a medically documented excuse from any subject area MCAS test are not included in performance results but are counted as non-participants for that subject area. b High Needs includes students with disabilities, English language learner students, former English language learner students, and low-income students. Results are reported for this student subgroup for the first time in 2011; data for prior years are not provided.
Spring 2013 MCAS Tests: Summary of State Results 52
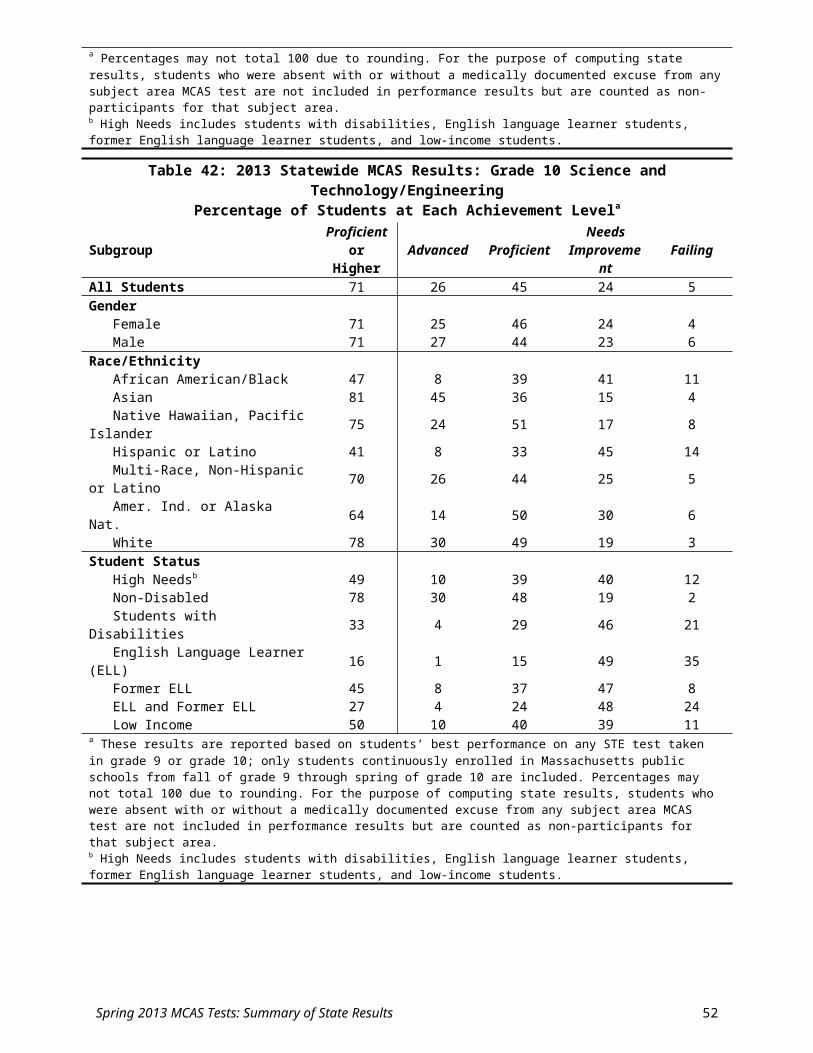
Table 59: 2009–2013 Statewide MCAS Results by Student Status: Grade 7 English Language ArtsPercentage of Students at Each Achievement Levela
Student Status Category / Year Advanced Proficient Needs Improvement Warning Median
SGPHigh Needsb
2013 3 47 36 14 47.02012 4 46 35 15 47.02011 4 48 35 13 47.0
Students with Disabilities2013 1 28 44 28 43.02012 1 28 41 29 41.02011 1 30 44 25 42.02010 1 29 42 28 42.02009 1 27 44 27 41.0
English Language Learner (ELL)2013 0 18 48 33 54.02012 1 19 42 38 53.02011 1 22 47 30 52.02010 1 20 41 39 51.02009 0 14 46 39 49.0
ELL and Former ELL2013 1 35 42 22 55.02012 2 33 38 27 56.02011 2 33 42 23 54.02010 2 32 38 28 52.02009 2 28 42 27 51.0
Former ELL2013 2 58 33 6 55.02012 4 56 31 10 58.02011 4 55 33 8 57.02010 4 53 33 10 55.02009 4 49 37 10 55.0
Low Income2013 3 49 35 13 47.02012 5 48 33 14 48.02011 4 49 34 12 47.02010 3 49 34 14 46.02009 4 44 38 14 45.0
a Percentages may not total 100 due to rounding. For the purpose of computing state results, students who were absent with or without a medically documented excuse from any subject area MCAS test are not included in performance results but are counted as non-participants for that subject area. b High Needs includes students with disabilities, English language learner students, former English language learner students, and low-income students. Results are reported for this student subgroup for the first time in 2011; data for prior years are not provided.
Spring 2013 MCAS Tests: Summary of State Results 53
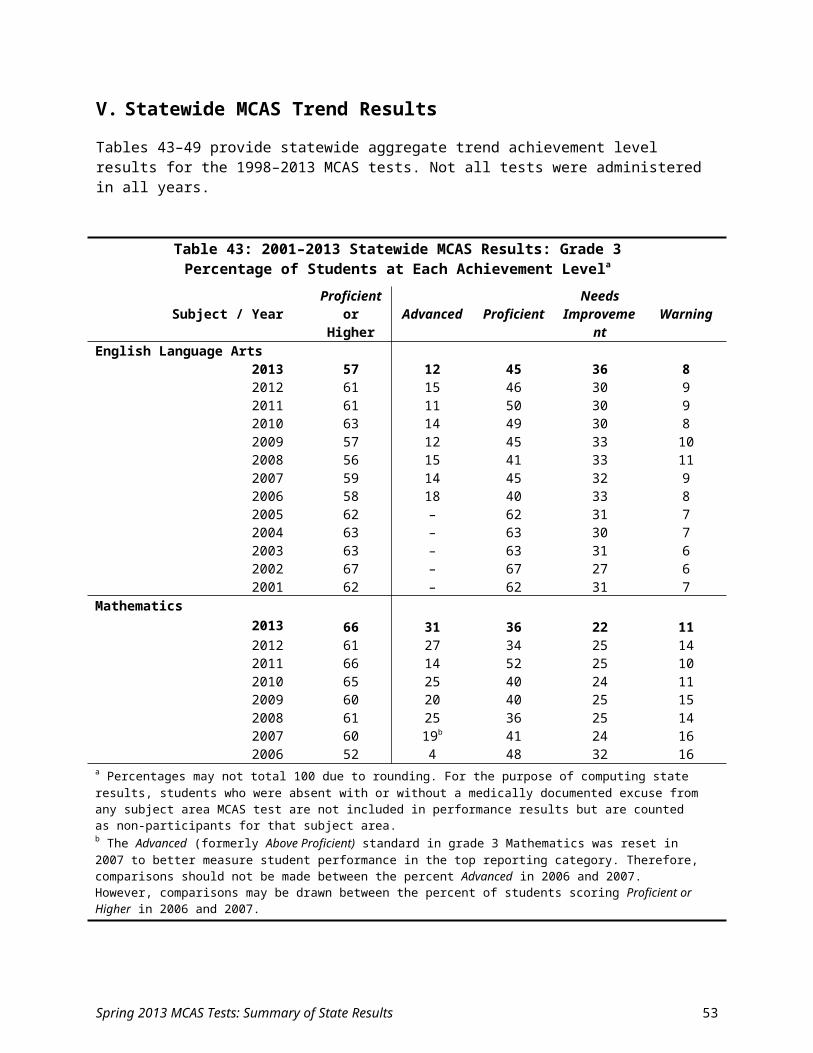
Table 60: 2009–2013 Statewide MCAS Results by Student Status: Grade 7 MathematicsPercentage of Students at Each Achievement Levela
Student Status Category / Year Advanced Proficient Needs Improvement Warning Median
SGPHigh Needsb
2013 7 22 32 39 41.02012 7 21 37 35 46.02011 6 21 33 40 47.0
Students with Disabilities2013 3 11 25 61 39.02012 3 11 32 55 44.02011 3 11 27 60 43.02010 1 14 29 56 45.02009 2 11 28 59 43.0
English Language Learner (ELL)2013 2 10 25 62 44.02012 3 11 30 57 56.02011 3 11 25 61 54.02010 2 13 25 60 53.02009 2 9 24 65 53.0
ELL and Former ELL2013 5 19 28 47 46.02012 6 16 33 45 55.02011 6 16 28 51 55.02010 4 20 28 47 55.02009 5 15 28 52 53.0
Former ELL2013 10 32 32 26 47.02012 10 26 38 25 54.02011 10 26 33 31 56.02010 8 34 32 26 59.02009 9 25 34 32 53.0
Low Income2013 7 24 32 38 40.02012 8 22 37 33 46.02011 7 22 33 39 46.02010 5 27 33 36 48.02009 5 21 35 39 45.0
a Percentages may not total 100 due to rounding. For the purpose of computing state results, students who were absent with or without a medically documented excuse from any subject area MCAS test are not included in performance results but are counted as non-participants for that subject area. b High Needs includes students with disabilities, English language learner students, former English language learner students, and low-income students. Results are reported for this student subgroup for the first time in 2011; data for prior years are not provided.
Spring 2013 MCAS Tests: Summary of State Results 54

Table 61: 2009–2013 Statewide MCAS Results by Student Status: Grade 8 English Language ArtsPercentage of Students at Each Achievement Levela
Student Status Category / Year Advanced Proficient Needs
Improvement Warning MedianSGP
High Needsb
2013 6 53 25 15 46.02012 6 57 26 12 48.02011 6 54 26 14 49.0
Students with Disabilities2013 2 36 32 30 41.02012 2 40 34 24 46.02011 2 39 34 25 45.02010 1 35 36 28 45.02009 2 38 36 25 43.0
English Language Learner (ELL)2013 0 22 36 42 50.02012 1 26 41 33 53.02011 1 24 40 35 53.02010 1 23 39 37 56.02009 1 22 38 39 57.0
ELL and Former ELL2013 2 36 32 29 51.02012 2 39 35 24 54.02011 2 34 35 28 55.02010 2 32 36 29 58.02009 2 34 35 29 58.0
Former ELL2013 6 59 25 10 53.02012 4 65 24 6 57.02011 7 59 23 10 58.02010 5 54 29 12 62.02009 4 57 30 10 59.0
Low Income2013 7 54 25 14 46.02012 6 58 25 11 48.02011 7 55 25 12 49.02010 5 54 27 14 48.02009 5 56 27 13 49.0
a Percentages may not total 100 due to rounding. For the purpose of computing state results, students who were absent with or without a medically documented excuse from any subject area MCAS test are not included in performance results but are counted as non-participants for that subject area. b High Needs includes students with disabilities, English language learner students, former English language learner students, and low-income students. Results are reported for this student subgroup for the first time in 2011; data for prior years are not provided.
Spring 2013 MCAS Tests: Summary of State Results 55
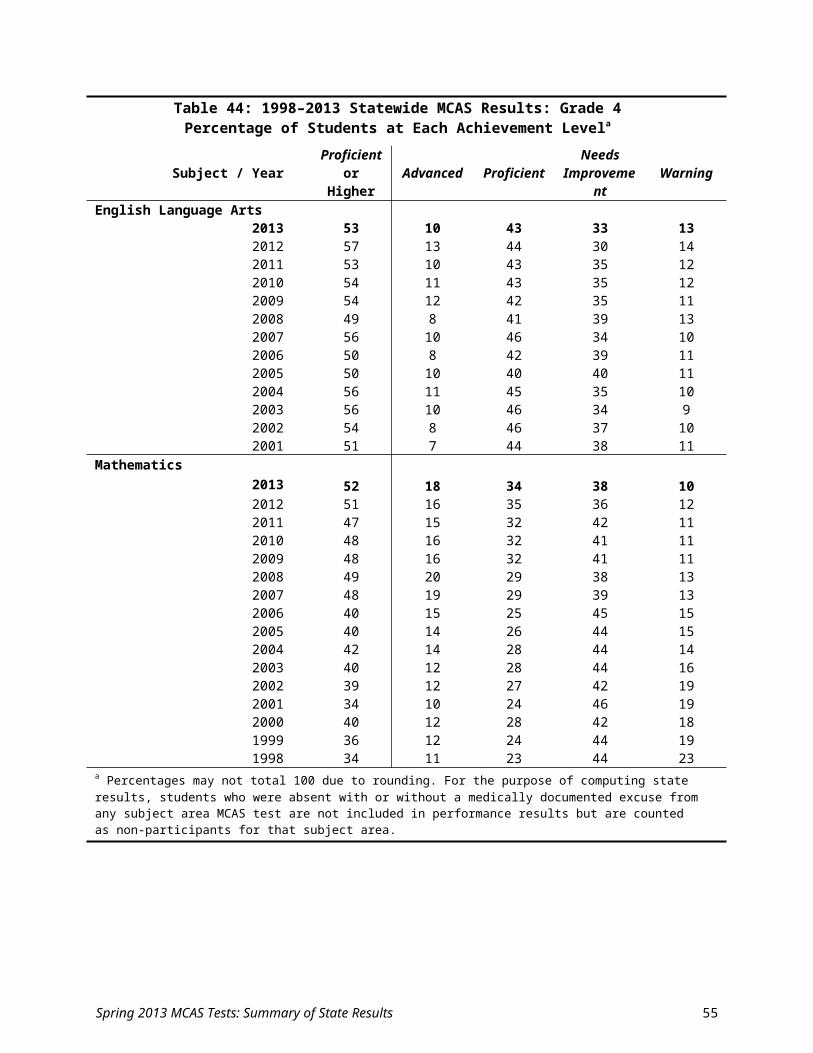
Table 62: 2009–2013 Statewide MCAS Results by Student Status: Grade 8 MathematicsPercentage of Students at Each Achievement Levela
Student Status Category / Year Advanced Proficient Needs Improvement Warning Median
SGPHigh Needsb
2013 8 24 30 38 47.02012 8 21 35 37 47.02011 8 20 31 40 48.0
Students with Disabilities2013 3 12 26 60 43.02012 3 11 29 57 47.02011 3 11 26 60 46.02010 3 10 26 61 45.02009 3 9 26 62 45.0
English Language Learner (ELL)2013 3 12 24 60 57.02012 4 10 25 61 52.02011 4 10 23 63 57.02010 4 10 24 63 59.02009 3 9 20 68 55.0
ELL and Former ELL2013 7 19 27 47 58.02012 5 14 30 51 53.02011 7 14 25 54 58.02010 6 14 26 54 59.02009 5 13 23 59 55.0
Former ELL2013 11 29 32 28 58.02012 9 24 38 29 54.02011 13 24 31 32 60.52010 13 23 31 33 58.02009 9 21 31 40 56.0
Low Income2013 9 25 31 35 48.02012 8 22 35 35 46.02011 9 21 32 38 48.02010 9 21 33 38 49.02009 7 18 31 44 47.0
a Percentages may not total 100 due to rounding. For the purpose of computing state results, students who were absent with or without a medically documented excuse from any subject area MCAS test are not included in performance results but are counted as non-participants for that subject area. b High Needs includes students with disabilities, English language learner students, former English language learner students, and low-income students. Results are reported for this student subgroup for the first time in 2011; data for prior years are not provided.
Spring 2013 MCAS Tests: Summary of State Results 56
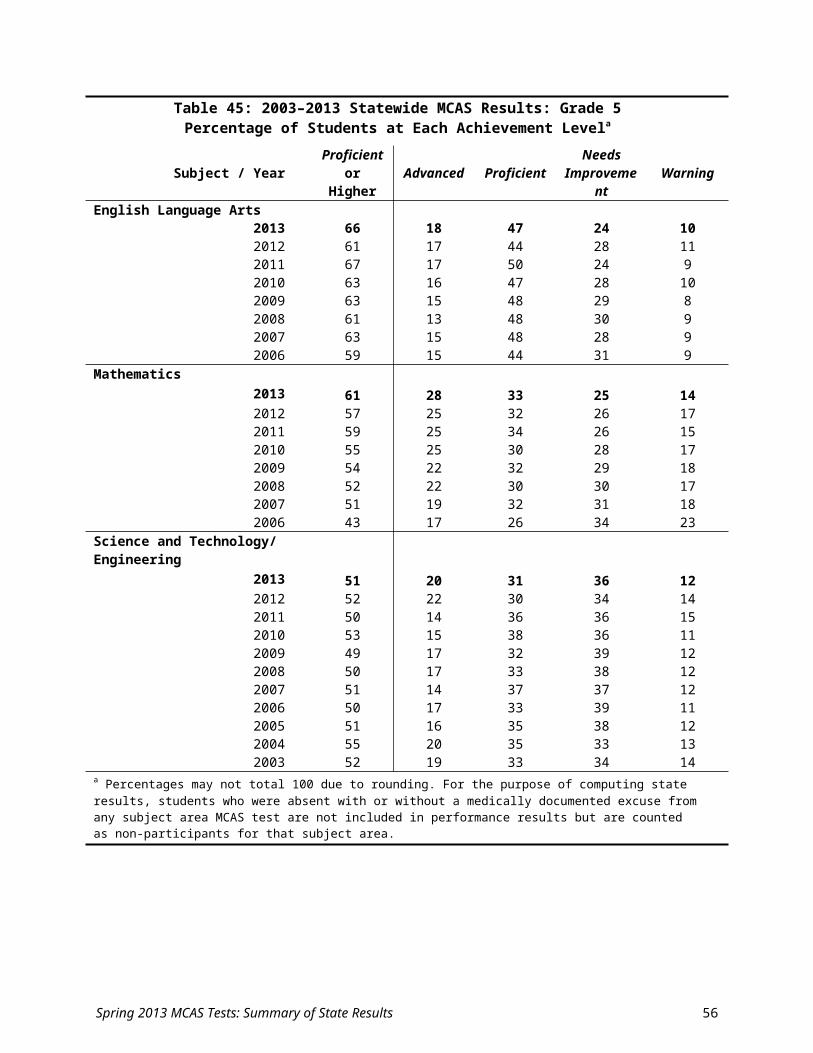
Table 63: 2009–2013 Statewide MCAS Results by Student Status: Grade 8 Science & Tech/EngPercentage of Students at Each Achievement Levela
Student Status Category / Year Advanced Proficient Needs Improvement Warning
High Needsb
2013 1 18 47 342012 1 18 42 382011 1 16 46 36
Students with Disabilities2013 1 10 40 502012 1 11 36 522011 1 11 41 482010 0 10 39 512009 1 10 36 53
English Language Learner (ELL)2013 0 3 25 712012 0 4 22 732011 0 3 25 722010 0 3 26 702009 0 4 23 73
ELL and Former ELL2013 0 8 35 572012 0 8 30 622011 0 7 31 622010 0 7 32 612009 0 7 30 62
Former ELL2013 1 16 50 332012 1 15 47 372011 1 16 44 402010 1 14 45 402009 1 15 43 41
Low Income2013 1 18 48 342012 1 19 42 382011 1 16 46 372010 1 17 45 372009 1 15 43 40
a Percentages may not total 100 due to rounding. For the purpose of computing state results, students who were absent with or without a medically documented excuse from any subject area MCAS test are not included in performance results but are counted as non-participants for that subject area. b High Needs includes students with disabilities, English language learner students, former English language learner students, and low-income students. Results are reported for this student subgroup for the first time in 2011; data for prior years are not provided.
Spring 2013 MCAS Tests: Summary of State Results 57
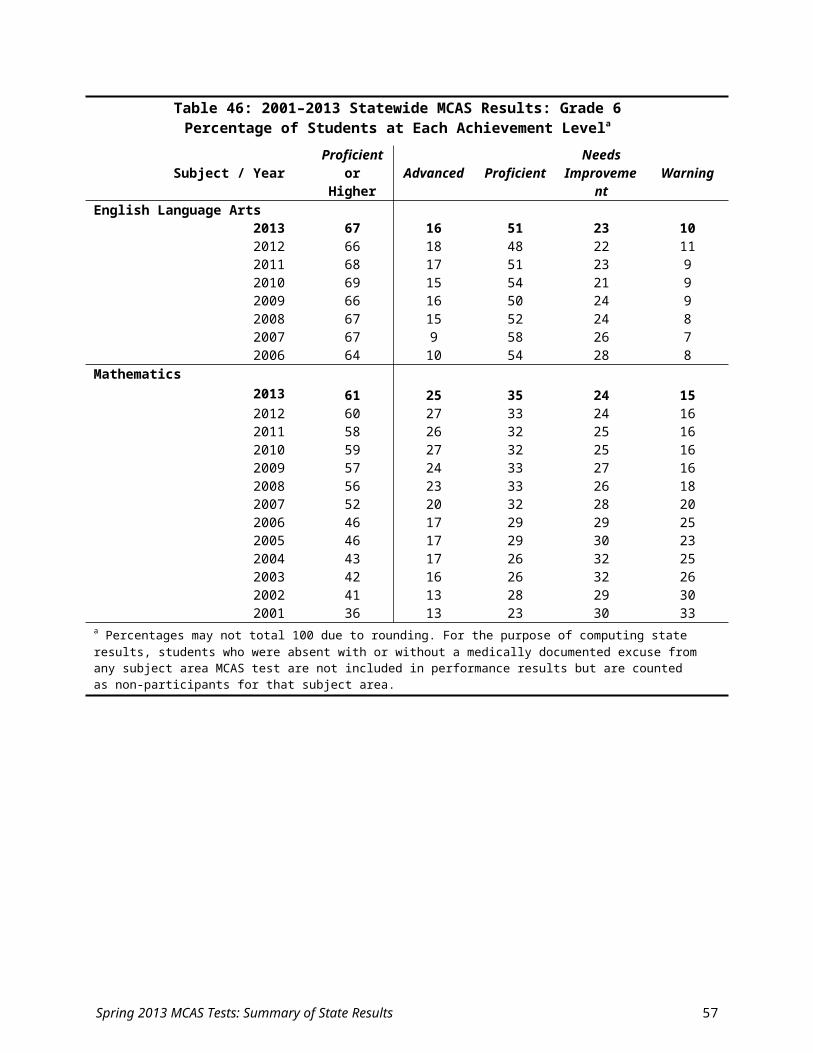
Table 64: 2009–2013 Statewide MCAS Results by Student Status: Grade 10 English Language ArtsPercentage of Students at Each Achievement Levela
Student Status Category / Year Advanced Proficient Needs Improvement Failing Median
SGPHigh Needsb
2013 22 59 14 5 54.02012 16 60 19 6 46.02011 12 54 25 8 46.0
Students with Disabilities2013 10 56 22 12 51.02012 8 52 28 12 45.02011 5 44 35 15 43.02010 2 36 44 17 39.02009 4 38 40 19 39.0
English Language Learner (ELL)2013 2 41 42 15 62.02012 1 34 49 16 54.02011 2 25 49 24 52.52010 1 18 53 27 53.02009 1 18 48 33 50.0
ELL and Former ELL2013 7 50 31 11 65.02012 4 43 40 13 59.02011 3 34 44 19 56.02010 2 26 51 22 55.02009 3 26 45 25 53.0
Former ELL2013 17 69 12 3 68.02012 13 68 17 3 64.02011 8 57 30 5 59.02010 4 42 45 9 58.02009 7 45 39 9 56.0
Low Income2013 24 58 13 4 54.02012 17 60 19 5 45.02011 14 55 25 7 46.02010 9 50 32 8 46.02009 11 50 30 9 45.0
a Percentages may not total 100 due to rounding. For the purpose of computing state results, students who were absent with or without a medically documented excuse from any subject area MCAS test are not included in performance results but are counted as non-participants for that subject area. b High Needs includes students with disabilities, English language learner students, former English language learner students, and low-income students. Results are reported for this student subgroup for the first time in 2011; data for prior years are not provided.
Spring 2013 MCAS Tests: Summary of State Results 58
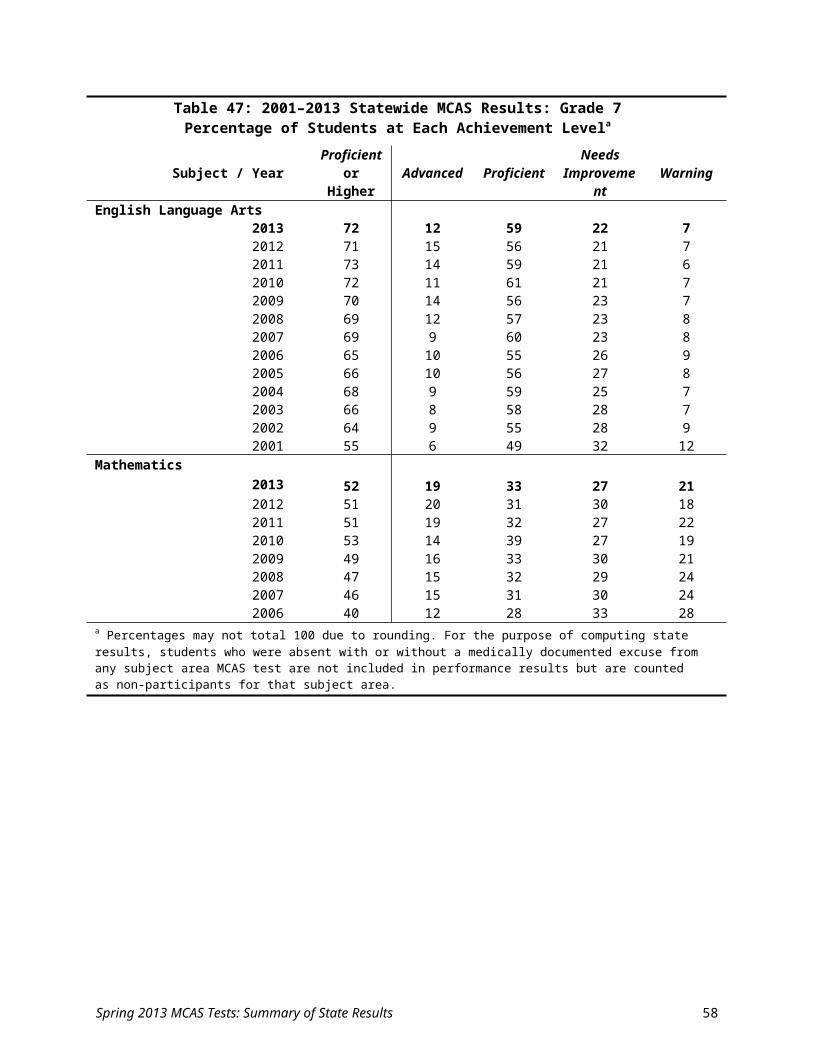
Table 65: 2009–2013 Statewide MCAS Results by Student Status: Grade 10 MathematicsPercentage of Students at Each Achievement Levela
Student Status Category / Year Advanced Proficient Needs Improvement Failing Median
SGPHigh Needsb
2013 30 31 23 16 45.02012 27 32 26 15 48.02011 25 31 28 15 48.0
Students with Disabilities2013 14 26 30 30 42.02012 13 28 32 27 47.02011 12 27 34 27 46.02010 12 24 36 27 47.02009 11 26 35 28 47.0
English Language Learner (ELL)2013 10 17 30 43 41.02012 13 19 33 35 56.02011 15 20 32 34 56.02010 13 17 35 35 56.02009 13 19 32 37 48.0
ELL and Former ELL2013 17 22 29 32 45.02012 19 23 30 29 59.02011 19 22 31 29 59.02010 16 20 34 30 55.02009 16 22 32 31 50.0
Former ELL2013 30 32 27 12 50.02012 35 33 21 12 64.02011 30 27 29 14 61.02010 23 28 32 17 55.02009 23 28 31 18 52.0
Low Income2013 33 30 22 15 45.02012 30 32 25 14 47.02011 27 31 27 14 48.02010 28 29 29 14 47.02009 24 30 30 16 46.0
a Percentages may not total 100 due to rounding. For the purpose of computing state results, students who were absent with or without a medically documented excuse from any subject area MCAS test are not included in performance results but are counted as non-participants for that subject area. b High Needs includes students with disabilities, English language learner students, former English language learner students, and low-income students. Results are reported for this student subgroup for the first time in 2011; data for prior years are not provided.
Spring 2013 MCAS Tests: Summary of State Results 59
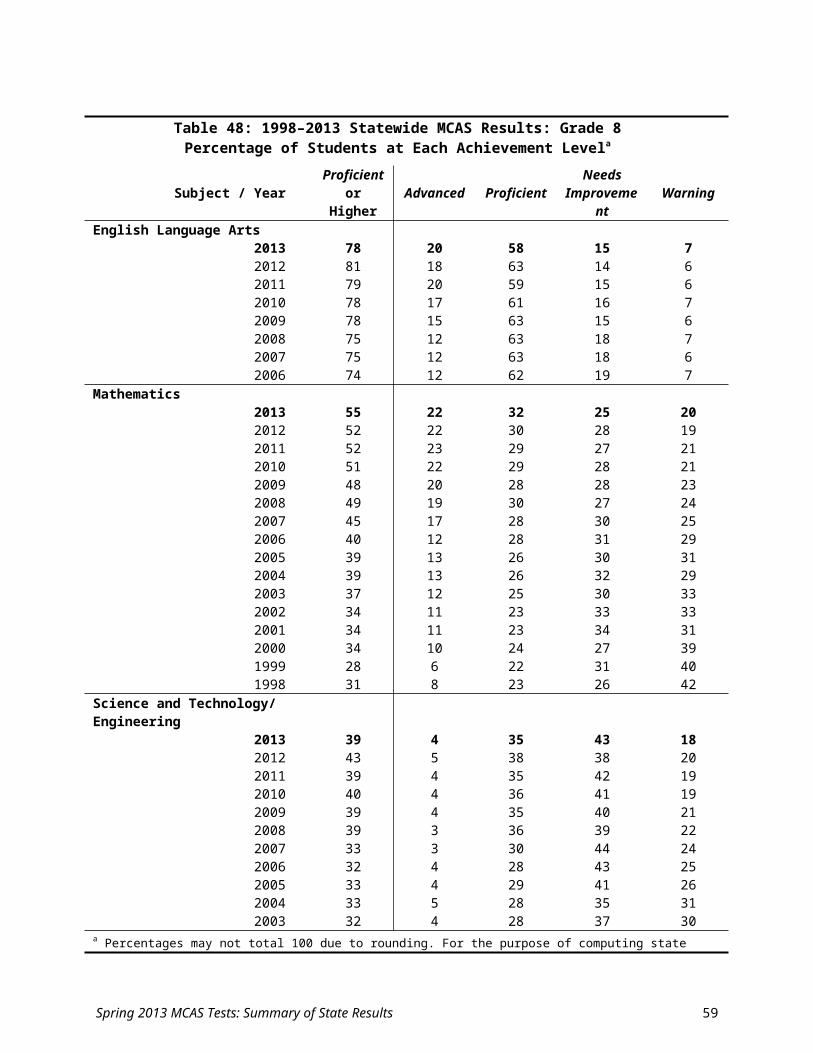
Table 66: 2009–2013 Statewide MCAS Results by Student Status: Grade 10 Science & Tech/EngPercentage of Students at Each Achievement Levela
Student Status Category / Year Advanced Proficient Needs Improvement Failing
High Needsb
2013 10 39 40 122012 8 38 42 122011 6 36 43 15
Students with Disabilities2013 4 29 46 212012 5 27 47 222011 3 27 46 242010 2 25 46 272009 2 22 46 30
English Language Learner (ELL)2013 1 15 49 352012 2 15 50 342011 2 14 47 372010 1 11 47 412009 1 11 40 48
ELL and Former ELL2013 4 24 48 242012 4 22 48 262011 3 20 47 302010 2 18 46 352009 2 16 42 39
Former ELL2013 8 37 47 82012 9 37 43 102011 6 34 46 152010 4 30 43 222009 4 26 46 25
Low Income2013 10 40 39 112012 9 39 41 112011 7 37 42 142010 5 35 43 162009 4 32 44 20
a These results are reported based on students’ best performance on any STE test taken in grade 9 or grade 10; only students continuously enrolled in Massachusetts public schools from fall of grade 9 through spring of grade 10 are included. Percentages may not total 100 due to rounding. For the purpose of computing state results, students who were absent with or without a medically documented excuse from any subject area MCAS test are not included in performance results but are counted as non-participants for that subject area. b High Needs includes students with disabilities, English language learner students, former English language learner students, and low-income students. Results are reported for this student subgroup for the first time in 2011; data for prior years are not provided.
Spring 2013 MCAS Tests: Summary of State Results 60
Tables 67–75 provide statewide summary results for the 2009 through 2013 MCAS tests disaggregated by seven race/ethnicity categories and by gender.
Table 67: 2009–2013 Statewide MCAS Test Results by Race/Ethnicity: African American/BlackPercentage of Students at Each Achievement Levela
Grade / Subject Year Advanced Proficient NeedsImprovement
Warning/Failing
MedianSGP
Grade 3English Language Arts 2013 3 29 52 15 N/A
2012 5 33 44 18 N/A2011 3 34 45 18 N/A2010 6 36 43 15 N/A2009 4 31 45 20 N/A
Mathematics 2013 13 32 33 22 N/A2012 12 26 32 31 N/A2011 4 35 38 23 N/A2010 9 31 37 24 N/A2009 6 27 36 31 N/A
Grade 4English Language Arts 2013 3 29 42 26 44.0
2012 4 28 40 28 41.02011 3 27 46 24 41.02010 3 26 47 23 41.02009 3 26 47 24 41.0
Mathematics 2013 6 22 50 21 48.02012 4 20 49 27 41.02011 5 18 53 25 42.02010 5 20 52 24 44.02009 5 20 51 25 40.0
Grade 5English Language Arts 2013 7 39 35 19 54.0
2012 7 33 40 21 47.02011 6 40 38 16 48.02010 6 34 40 19 47.02009 5 34 45 16 44.0
Mathematics 2013 11 26 35 28 55.02012 8 23 36 33 49.02011 8 27 35 30 46.02010 9 22 36 33 49.02009 8 23 36 33 48.0
Science and Technology/ 2013 6 18 47 28 N/AEngineering 2012 5 17 45 33 N/A
2011 2 17 45 35 N/A2010 3 20 50 27 N/A2009 3 15 52 30 N/A
Grade 6English Language Arts 2013 5 40 36 19 48.0
2012 6 36 36 22 43.02011 5 40 38 17 44.02010 5 43 34 18 47.02009 6 39 38 16 52.0
Mathematics 2013 10 29 32 29 53.02012 11 27 32 30 52.02011 10 24 32 34 45.02010 9 25 33 33 46.02009 8 24 36 32 46.0
(Table 67 continued on following page)
Spring 2013 MCAS Tests: Summary of State Results 61
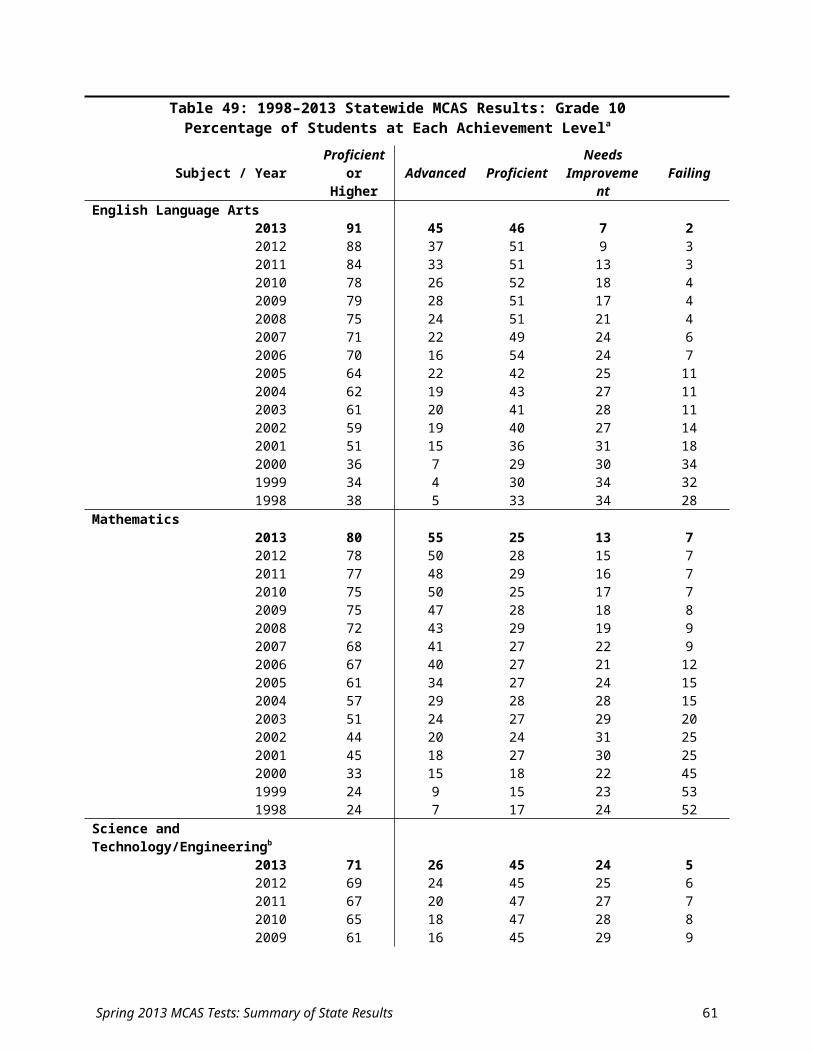
Table 67 (cont.): 2009–2013 Statewide MCAS Test Results by Race/Ethnicity: African American/Black
Percentage of Students at Each Achievement Levela
Grade / Subject Year Advanced Proficient NeedsImprovement
Warning/Failing
Median SGP
Grade 7English Language Arts 2013 3 49 35 12 52.0
2012 5 47 34 13 51.02011 5 51 33 11 52.02010 3 50 34 13 46.02009 4 46 37 13 47.0
Mathematics 2013 6 22 33 40 41.02012 7 21 36 36 49.02011 6 22 32 41 48.02010 4 26 34 37 49.02009 3 20 35 42 45.0
Grade 8English Language Arts 2013 7 54 25 13 47.0
2012 7 59 25 10 52.02011 7 58 25 11 50.02010 5 54 27 13 46.02009 6 57 25 11 53.0
Mathematics 2013 9 24 30 37 51.02012 6 21 36 37 47.02011 7 21 32 40 49.02010 6 22 33 38 53.02009 6 18 31 45 50.0
Science and Technology/ 2013 1 16 46 38 N/AEngineering 2012 1 16 41 42 N/A
2011 1 13 46 41 N/A2010 0 13 46 41 N/A2009 0 13 43 44 N/A
Grade 10English Language Arts 2013 25 58 13 4 57.0
2012 16 60 19 5 48.02011 14 55 24 6 50.02010 9 51 32 7 46.02009 12 50 30 8 51.0
Mathematics 2013 28 32 24 17 44.02012 28 31 26 14 52.02011 24 32 29 15 52.02010 25 28 31 16 48.02009 21 30 31 17 48.0
Science and Technology/ 2013 8 39 41 11 N/AEngineeringb 2012 7 38 43 13 N/A
2011 6 34 45 16 N/A2010 4 33 45 18 N/A2009 3 30 45 22 N/A
a Percentages may not total 100 due to rounding. For the purpose of computing state results, students who were absent with or without a medically documented excuse from any subject area MCAS test are not included in performance results but are counted as non-participants for that subject area. b Grade 10 STE results are reported based on students’ best performance on any STE test taken in grade 9 or grade 10; only students continuously enrolled in Massachusetts public schools from fall of grade 9 through spring of grade 10 are included.
Spring 2013 MCAS Tests: Summary of State Results 62
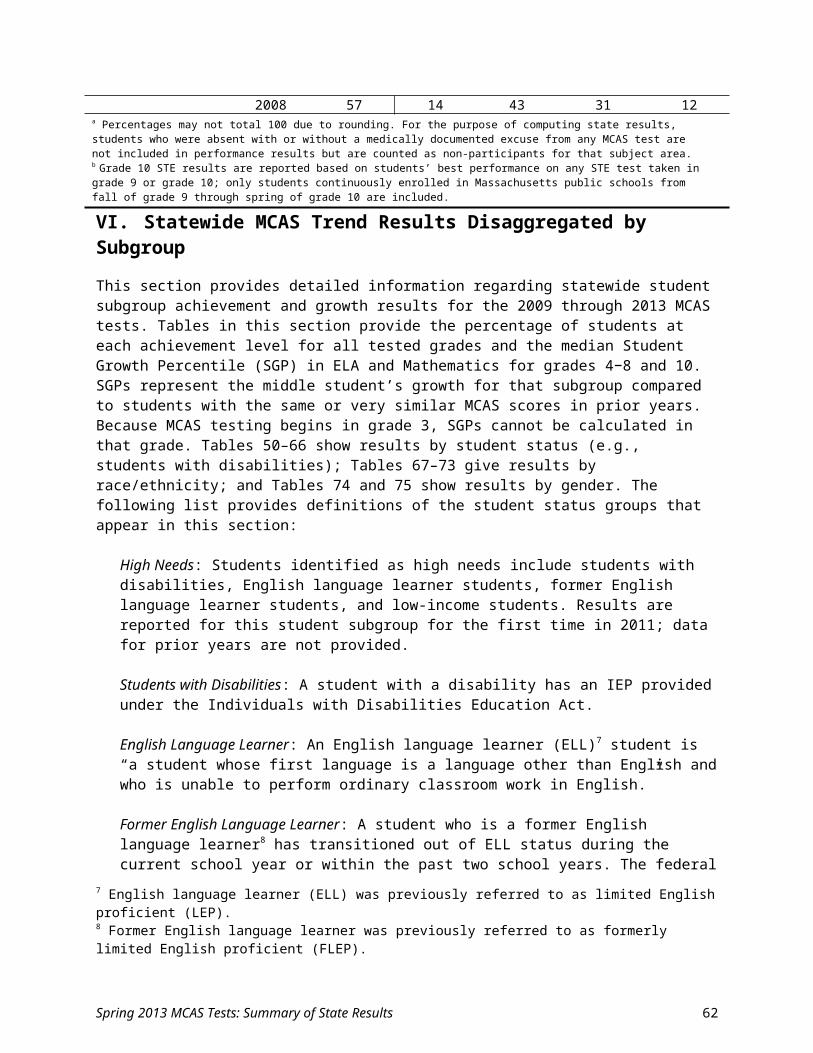
Table 68: 2009–2013 Statewide MCAS Test Results by Race/Ethnicity: AsianPercentage of Students at Each Achievement Levela
Grade / Subject Year Advanced Proficient NeedsImprovement
Warning/Failing
Median SGP
Grade 3English Language Arts 2013 19 47 28 5 N/A
2012 23 46 24 6 N/A2011 17 52 24 7 N/A2010 18 49 27 6 N/A2009 17 47 28 7 N/A
Mathematics 2013 50 31 14 5 N/A2012 47 32 15 6 N/A2011 26 53 15 5 N/A2010 40 38 17 6 N/A2009 34 38 19 9 N/A
Grade 4English Language Arts 2013 20 47 25 8 62.0
2012 22 47 23 9 62.02011 18 47 27 8 63.02010 19 45 29 8 60.02009 19 43 29 9 58.0
Mathematics 2013 37 35 24 4 65.02012 33 37 23 6 62.02011 32 36 27 6 66.02010 32 33 29 6 60.02009 29 36 29 6 61.0
Grade 5English Language Arts 2013 33 44 15 7 63.0
2012 27 43 22 8 57.02011 27 48 18 7 57.02010 26 45 21 7 59.02009 26 44 24 6 61.0
Mathematics 2013 54 27 13 6 67.02012 48 27 16 8 64.02011 47 30 15 8 64.02010 46 28 18 9 64.02009 44 29 18 9 62.0
Science and Technology/ 2013 33 31 26 9 N/AEngineering 2012 31 29 28 11 N/A
2011 22 36 29 13 N/A2010 23 39 29 9 N/A2009 28 31 31 10 N/A
Grade 6English Language Arts 2013 27 50 17 6 61.0
2012 31 46 16 7 59.02011 28 49 17 6 59.02010 30 49 14 6 64.02009 29 47 18 6 62.0
Mathematics 2013 52 29 13 6 66.02012 51 28 14 7 62.52011 49 27 16 8 64.02010 51 28 14 7 64.02009 45 31 15 8 62.0
(Table 68 continued on following page)
Spring 2013 MCAS Tests: Summary of State Results 63
Table 68 (continued): 2009–2013 Statewide MCAS Test Results by Race/Ethnicity: AsianPercentage of Students at Each Achievement Levela
Grade / Subject Year Advanced Proficient NeedsImprovement
Warning/Failing
MedianSGP
Grade 7English Language Arts 2013 23 58 14 5 55.0
2012 27 53 15 6 59.02011 28 54 15 4 60.02010 21 59 15 5 58.02009 26 53 17 4 58.5
Mathematics 2013 43 32 16 10 57.02012 43 30 18 9 61.02011 44 30 16 10 62.02010 33 41 16 10 61.02009 36 34 19 11 58.0
Grade 8English Language Arts 2013 33 52 10 5 58.0
2012 35 53 9 3 63.02011 34 51 11 4 60.02010 30 55 11 4 58.02009 28 57 11 4 62.0
Mathematics 2013 48 29 14 9 63.02012 47 27 17 8 57.02011 48 26 16 10 61.02010 47 27 16 10 62.02009 41 27 20 11 58.0
Science and Technology/ 2013 11 45 32 12 N/AEngineering 2012 12 46 29 13 N/A
2011 10 41 34 14 N/A2010 10 44 33 13 N/A2009 9 41 36 15 N/A
Grade 10English Language Arts 2013 57 35 6 2 66.0
2012 50 40 8 2 57.02011 45 42 11 3 57.02010 37 44 15 4 57.02009 38 44 15 4 59.0
Mathematics 2013 74 15 7 4 59.02012 74 16 7 3 65.02011 71 17 9 3 65.02010 70 17 9 4 61.52009 67 19 10 4 60.0
Science and Technology/ 2013 45 36 15 4 N/AEngineeringb 2012 43 37 16 4 N/A
2011 37 39 20 4 N/A2010 32 40 21 7 N/A2009 29 41 22 7 N/A
a Percentages may not total 100 due to rounding. For the purpose of computing state results, students who were absent with or without a medically documented excuse from any subject area MCAS test are not included in performance results but are counted as non-participants for that subject area. b Grade 10 STE results are reported based on students’ best performance on any STE test taken in grade 9 or grade 10; only students continuously enrolled in Massachusetts public schools from fall of grade 9 through spring of grade 10 are included.
Spring 2013 MCAS Tests: Summary of State Results 64
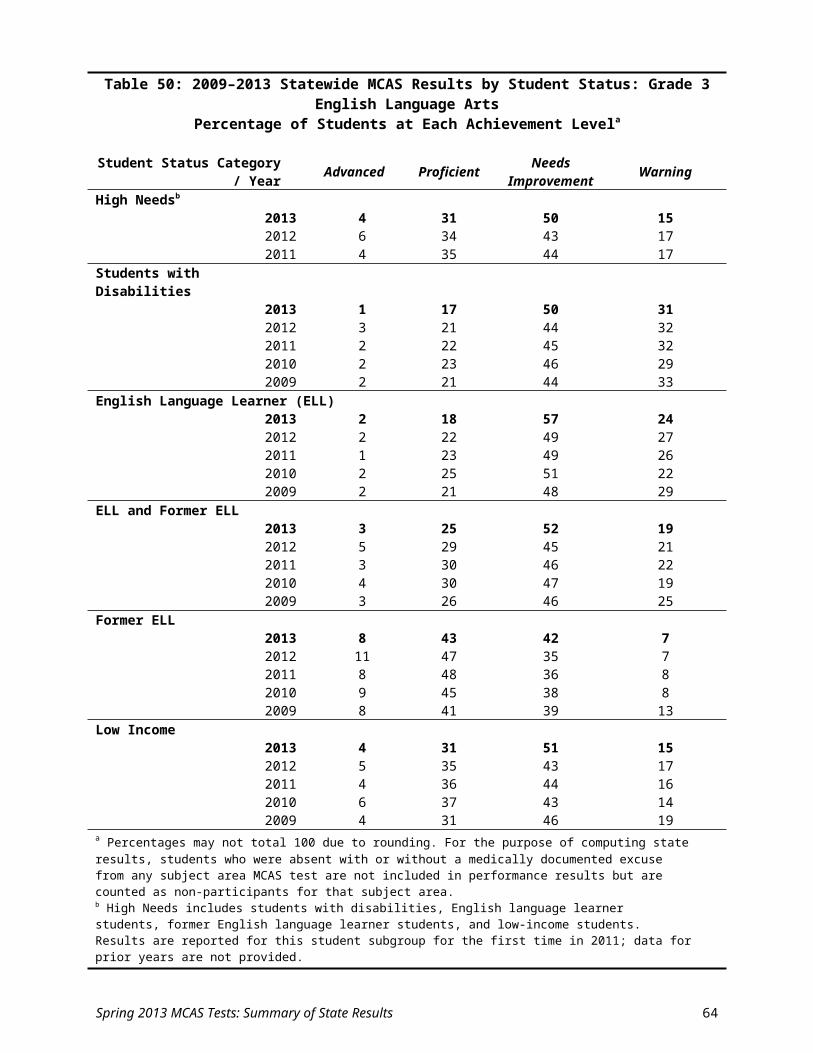
Table 69: 2009–2013 Statewide MCAS Test Results by Race/Ethnicity: Native Hawaiian, Pacific Islander: Percentage of Students at Each Achievement Levela
Grade / Subject Year Advanced Proficient NeedsImprovement
Warning/Failing
MedianSGP
Grade 3English Language Arts 2013 10 32 48 11 N/A
2012 9 39 34 18 N/A2011 7 49 36 8 N/A2010 11 47 32 10 N/A2009 13 49 27 11 N/A
Mathematics 2013 19 40 22 19 N/A2012 16 35 26 23 N/A2011 11 44 35 11 N/A2010 26 39 24 11 N/A2009 27 37 21 15 N/A
Grade 4English Language Arts 2013 5 40 40 15 61.5
2012 9 41 30 20 54.02011 13 43 29 16 56.02010 11 53 24 11 45.52009 4 49 30 16 51.0
Mathematics 2013 9 35 40 17 52.52012 17 23 48 13 49.52011 16 33 39 13 44.02010 22 34 35 8 56.02009 17 21 44 17 52.5
Grade 5English Language Arts 2013 11 37 39 13 53.0
2012 17 47 23 14 59.02011 17 53 20 10 50.02010 8 45 34 13 43.52009 13 46 37 4 52.0
Mathematics 2013 17 30 34 20 54.02012 31 27 25 17 49.52011 24 38 24 15 43.02010 16 24 35 24 43.02009 24 23 33 20 52.5
Science and Technology/ 2013 14 21 43 21 N/AEngineering 2012 25 25 35 16 N/A
2011 11 39 34 16 N/A2010 6 32 48 13 N/A2009 20 33 37 10 N/A
Grade 6English Language Arts 2013 16 52 21 10 55.0
2012 20 50 19 11 53.52011 11 40 37 11 52.52010 23 48 21 8 48.02009 24 35 30 11 55.0
Mathematics 2013 33 30 22 15 64.02012 32 36 20 12 57.02011 24 23 31 23 63.52010 25 28 26 21 52.02009 23 35 25 17 47.5
(Table 69 continued on following page)
Spring 2013 MCAS Tests: Summary of State Results 65

Table 69 (cont.): 2009–2013 Statewide MCAS Test Results by Race/Ethnicity: Hawaiian/Pacific Isl.Percentage of Students at Each Achievement Levela
Grade / Subject Year Advanced Proficient NeedsImprovement
Warning/Failing
Median SGP
Grade 7English Language Arts 2013 12 57 23 9 51.0
2012 12 45 35 8 44.02011 17 62 15 7 55.02010 11 56 22 11 61.02009 15 42 24 18 52.0
Mathematics 2013 21 30 27 22 44.02012 17 27 29 27 38.02011 20 41 18 21 63.02010 13 37 28 23 60.52009 15 21 27 37 52.5
Grade 8English Language Arts 2013 13 60 19 7 48.0
2012 17 69 5 9 51.02011 19 59 14 8 55.02010 15 56 16 13 53.02009 14 47 23 16 50.0
Mathematics 2013 10 41 24 25 60.02012 19 34 25 22 37.02011 19 28 28 26 57.02010 14 22 31 32 45.02009 7 30 30 33 48.0
Science and Technology/ 2013 0 26 53 21 N/AEngineering 2012 3 42 32 22 N/A
2011 1 36 46 16 N/A2010 2 25 46 26 N/A2009 1 32 31 36 N/A
Grade 10English Language Arts 2013 44 39 11 5 57.5
2012 30 49 16 4 49.02011 31 54 7 8 55.02010 24 44 25 7 42.02009 22 52 18 8 48.0
Mathematics 2013 53 18 16 13 48.02012 45 16 27 12 57.02011 49 27 18 6 60.02010 40 26 22 12 46.02009 32 32 22 15 46.0
Science and Technology/ 2013 24 51 17 8 N/AEngineeringb 2012 16 40 33 11 N/A
2011 19 47 24 10 N/A2010 23 30 36 11 N/A2009 15 30 41 14 N/A
a Percentages may not total 100 due to rounding. For the purpose of computing state results, students who were absent with or without a medically documented excuse from any subject area MCAS test are not included in performance results but are counted as non-participants for that subject area. b Grade 10 STE results are reported based on students’ best performance on any STE test taken in grade 9 or grade 10; only students continuously enrolled in Massachusetts public schools from fall of grade 9 through spring of grade 10 are included.
Spring 2013 MCAS Tests: Summary of State Results 66
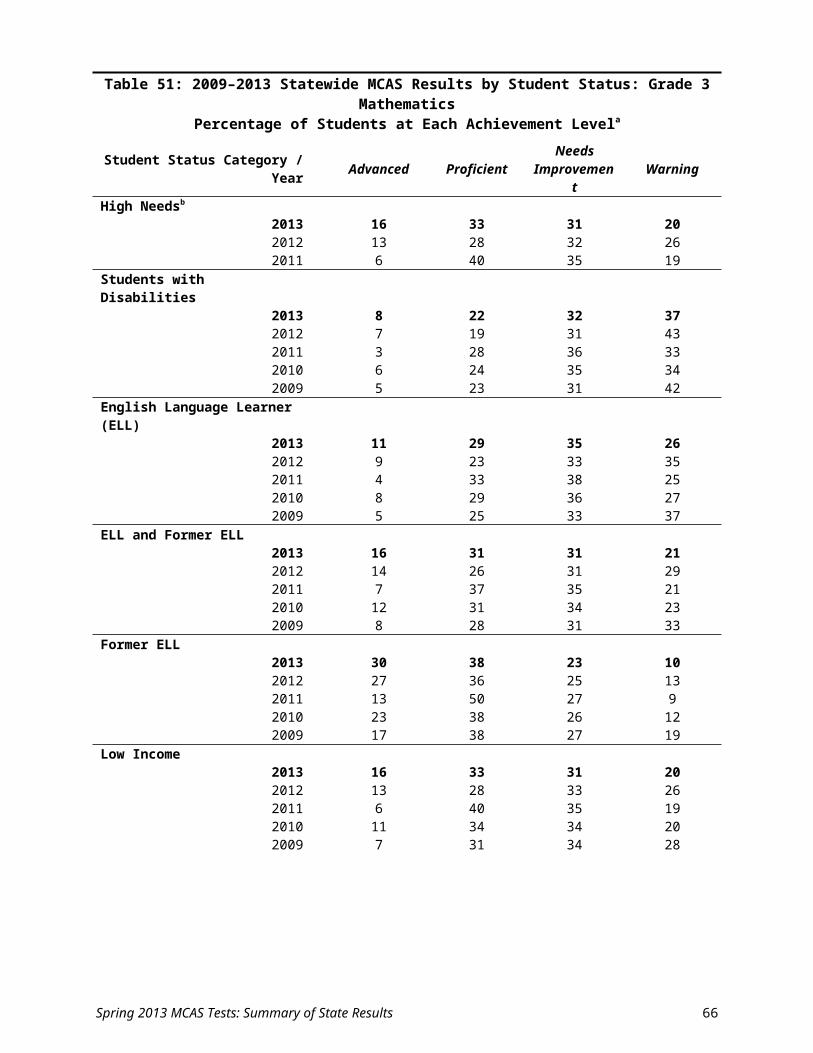
Table 70: 2009–2013 Statewide MCAS Test Results by Race/Ethnicity: Hispanic or LatinoPercentage of Students at Each Achievement Levela
Grade / Subject Year Advanced Proficient NeedsImprovement
Warning/Failing
MedianSGP
Grade 3English Language Arts 2013 3 27 52 17 N/A
2012 5 31 44 20 N/A2011 3 33 45 19 N/A2010 5 33 45 17 N/A2009 4 28 46 22 N/A
Mathematics 2013 15 32 31 22 N/A2012 11 26 34 29 N/A2011 5 38 37 20 N/A2010 10 32 34 24 N/A2009 7 28 33 32 N/A
Grade 4English Language Arts 2013 3 26 42 28 43.0
2012 4 29 40 28 43.02011 3 26 45 26 43.02010 3 25 46 26 42.02009 3 25 46 26 42.0
Mathematics 2013 6 23 50 20 50.52012 5 23 46 25 44.02011 5 20 51 23 46.02010 6 21 50 23 47.02009 5 20 50 25 41.0
Grade 5English Language Arts 2013 6 36 37 21 51.0
2012 6 30 40 24 45.02011 5 36 38 21 45.02010 5 32 41 22 46.02009 4 31 47 18 45.0
Mathematics 2013 12 28 33 27 51.02012 9 23 34 34 45.02011 8 27 33 32 43.02010 9 21 35 35 43.02009 7 21 35 37 43.0
Science and Technology/ 2013 7 19 47 27 N/AEngineering 2012 6 17 44 33 N/A
2011 3 18 44 34 N/A2010 3 21 48 28 N/A2009 4 17 50 29 N/A
Grade 6English Language Arts 2013 5 36 37 23 46.0
2012 5 34 35 25 44.02011 5 37 37 21 45.02010 5 40 35 20 49.02009 5 35 38 22 49.0
Mathematics 2013 10 27 31 32 46.02012 11 25 32 32 47.02011 9 24 33 34 45.02010 10 24 32 34 46.02009 7 22 34 36 46.0
(Table 70 continued on following page)
Spring 2013 MCAS Tests: Summary of State Results 67
Table 70 (cont.): 2009–2013 Statewide MCAS Test Results by Race/Ethnicity: Hispanic or LatinoPercentage of Students at Each Achievement Levela
Grade / Subject Year Advanced Proficient NeedsImprovement
Warning/Failing
MedianSGP
Grade 7English Language Arts 2013 3 45 36 16 48.0
2012 4 44 35 18 50.02011 4 46 36 14 48.02010 3 45 36 17 48.02009 4 39 40 17 46.0
Mathematics 2013 6 21 30 43 39.02012 7 19 36 38 46.02011 6 20 31 43 48.02010 4 23 33 40 48.02009 4 18 32 45 45.0
Grade 8English Language Arts 2013 6 51 25 18 46.0
2012 6 53 27 14 48.02011 6 52 27 15 50.02010 5 50 29 16 51.02009 4 52 28 16 51.0
Mathematics 2013 8 23 30 39 50.02012 7 20 33 40 46.02011 8 19 30 43 50.02010 7 18 31 43 50.02009 6 16 29 49 48.0
Science and Technology/ 2013 1 14 44 41 N/AEngineering 2012 1 15 39 45 N/A
2011 1 12 42 45 N/A2010 1 12 42 45 N/A2009 1 12 40 48 N/A
Grade 10English Language Arts 2013 21 58 16 5 54.0
2012 14 57 22 6 45.02011 11 52 28 9 45.02010 8 48 35 9 47.02009 9 47 33 12 45.0
Mathematics 2013 27 30 24 19 42.02012 25 30 26 18 47.02011 23 29 30 18 48.02010 23 26 32 19 46.02009 20 28 32 19 45.0
Science and Technology/ 2013 8 33 45 14 N/AEngineeringb 2012 6 32 46 16 N/A
2011 5 31 46 19 N/A2010 4 29 46 21 N/A2009 3 25 47 24 N/A
a Percentages may not total 100 due to rounding. For the purpose of computing state results, students who were absent with or without a medically documented excuse from any subject area MCAS test are not included in performance results but are counted as non-participants for that subject area. b Grade 10 STE results are reported based on students’ best performance on any STE test taken in grade 9 or grade 10; only students continuously enrolled in Massachusetts public schools from fall of grade 9 through spring of grade 10 are included.
Spring 2013 MCAS Tests: Summary of State Results 68
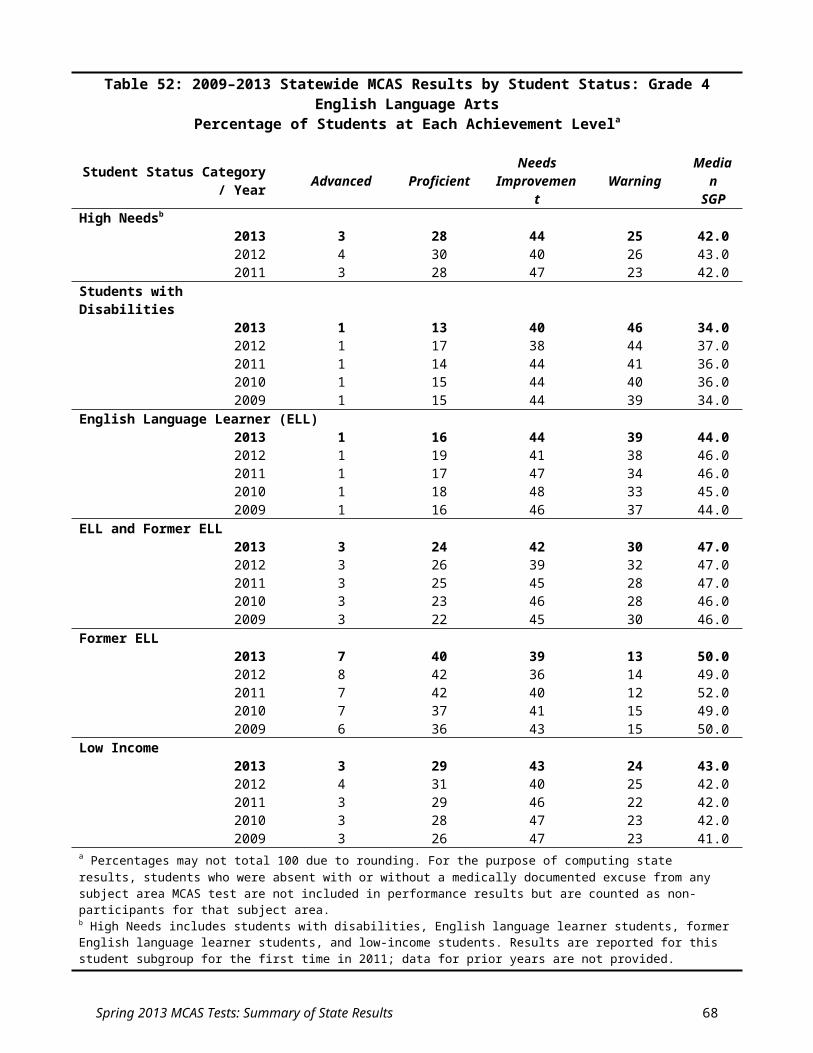
Table 71: 2009–2013 Statewide MCAS Test Results by Race/Ethnicity: Multi-Race, Non-Hispanic or Latino
Percentage of Students at Each Achievement Levela
Grade / Subject Year Advanced Proficient NeedsImprovement
Warning/Failing
MedianSGP
Grade 3English Language Arts 2013 12 45 36 7 N/A
2012 17 47 28 8 N/A2011 12 51 29 7 N/A2010 16 48 30 6 N/A2009 13 44 34 9 N/A
Mathematics 2013 31 33 23 13 N/A2012 30 32 24 14 N/A2011 15 50 26 9 N/A2010 26 36 27 11 N/A2009 20 40 25 15 N/A
Grade 4English Language Arts 2013 12 44 33 11 48.0
2012 14 44 29 13 50.02011 10 43 36 11 51.02010 12 40 36 12 49.02009 12 39 37 13 48.0
Mathematics 2013 21 32 38 10 54.02012 17 33 38 12 49.02011 16 30 43 11 50.02010 16 30 43 11 47.02009 17 30 40 14 51.5
Grade 5English Language Arts 2013 22 46 23 9 52.0
2012 17 44 28 11 52.02011 19 49 23 9 51.02010 16 46 29 9 50.02009 15 48 29 8 50.0
Mathematics 2013 30 31 24 14 52.02012 25 30 26 19 50.02011 27 31 27 15 50.02010 24 28 29 18 49.02009 23 28 31 18 49.0
Science and Technology/ 2013 22 30 37 11 N/AEngineering 2012 22 29 35 14 N/A
2011 15 35 37 13 N/A2010 16 36 37 10 N/A2009 17 31 40 12 N/A
Grade 6English Language Arts 2013 17 51 25 8 52.0
2012 19 46 24 10 48.02011 19 48 24 9 52.02010 17 52 21 10 50.02009 16 50 26 8 48.5
Mathematics 2013 26 33 26 16 50.02012 28 29 27 17 48.02011 27 30 25 18 53.02010 26 31 26 17 47.02009 24 31 28 17 48.0
(Table 71 continued on following page)
Spring 2013 MCAS Tests: Summary of State Results 69

Table 71 (continued): 2009–2013 Statewide MCAS Test Results by Race/Ethnicity: Multi-Race, Non-Hispanic or Latino
Percentage of Students at Each Achievement Levela
Grade / Subject Year Advanced Proficient NeedsImprovement
Warning/Failing
MedianSGP
Grade 7English Language Arts 2013 13 57 23 7 48.0
2012 16 54 22 8 49.02011 16 56 23 6 47.02010 12 60 22 7 49.02009 14 56 23 7 51.0
Mathematics 2013 21 29 26 24 46.52012 21 27 32 21 48.02011 19 29 27 25 48.02010 14 39 26 22 49.02009 16 32 30 23 49.0
Grade 8English Language Arts 2013 20 56 15 8 48.0
2012 19 61 14 6 50.02011 21 59 14 6 52.02010 18 61 15 6 50.02009 19 60 15 6 53.0
Mathematics 2013 24 29 25 22 48.02012 22 26 31 21 49.02011 24 28 26 22 50.02010 23 27 29 21 50.02009 22 25 28 25 49.0
Science and Technology/ 2013 5 35 40 19 N/AEngineering 2012 6 36 36 23 N/A
2011 4 35 42 18 N/A2010 5 35 42 18 N/A2009 5 35 42 19 N/A
Grade 10English Language Arts 2013 45 47 6 2 57.0
2012 38 51 9 2 48.02011 33 52 13 2 49.02010 25 53 19 4 49.02009 29 49 18 4 49.0
Mathematics 2013 54 25 13 7 49.02012 48 30 16 6 47.02011 47 30 18 6 47.02010 47 25 20 8 45.02009 44 27 20 8 46.0
Science and Technology/ 2013 26 44 25 5 N/AEngineeringb 2012 24 45 26 5 N/A
2011 21 45 28 6 N/A2010 19 44 29 8 N/A2009 19 43 30 9 N/A
a Percentages may not total 100 due to rounding. For the purpose of computing state results, students who were absent with or without a medically documented excuse from any subject area MCAS test are not included in performance results but are counted as non-participants for that subject area. b Grade 10 STE results are reported based on students’ best performance on any STE test taken in grade 9 or grade 10; only students continuously enrolled in Massachusetts public schools from fall of grade 9 through spring of grade 10 are included.
Spring 2013 MCAS Tests: Summary of State Results 70
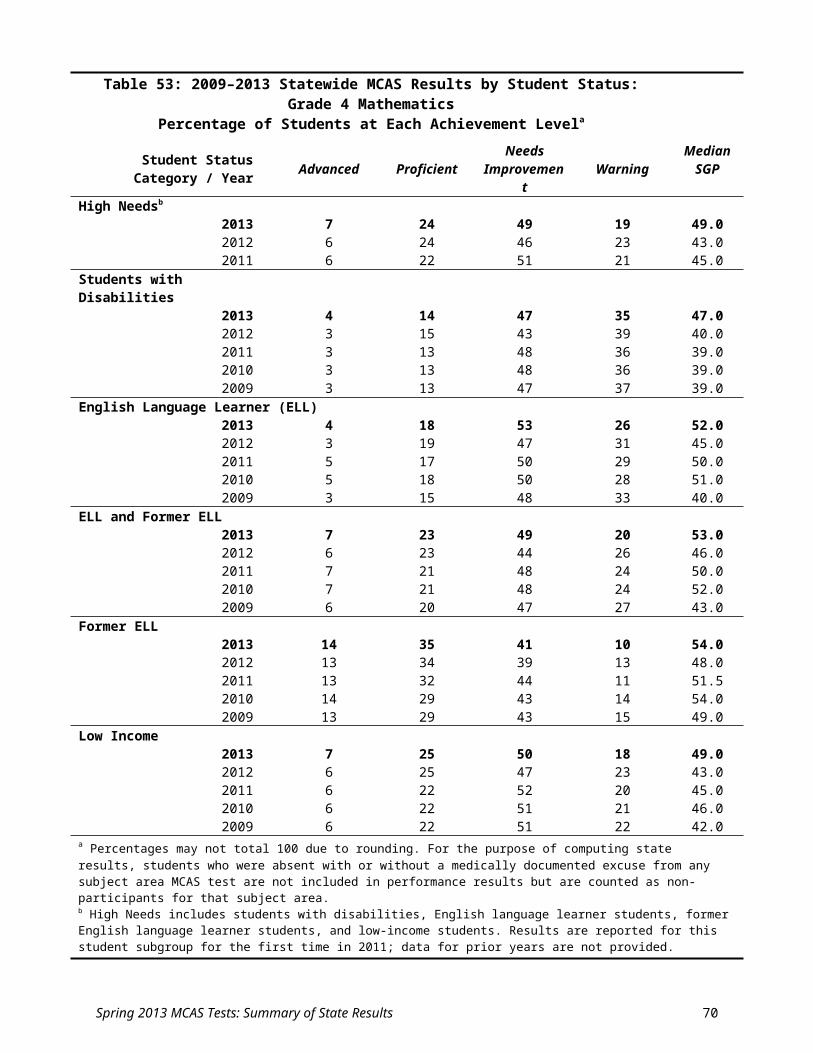
Table 72: 2009–2013 Statewide MCAS Test Results by Race/Ethnicity: American Indian or Alaskan Native
Percentage of Students at Each Achievement Levela
Grade / Subject Year Advanced Proficient NeedsImprovement
Warning/Failing
MedianSGP
Grade 3English Language Arts 2013 9 29 53 9 N/A
2012 10 42 35 13 N/A2011 8 39 40 13 N/A2010 10 40 39 11 N/A2009 8 42 41 10 N/A
Mathematics 2013 13 43 32 13 N/A2012 15 34 31 19 N/A2011 9 45 33 13 N/A2010 16 34 33 17 N/A2009 12 37 32 19 N/A
Grade 4English Language Arts 2013 5 35 43 16 48.0
2012 6 38 34 23 43.02011 5 30 48 16 43.02010 6 39 38 17 43.02009 5 37 43 15 46.0
Mathematics 2013 10 27 47 15 53.52012 9 33 44 15 40.02011 9 22 54 15 50.02010 10 31 46 13 47.02009 10 26 52 12 47.5
Grade 5English Language Arts 2013 11 41 32 16 51.0
2012 7 43 41 9 48.02011 13 43 34 10 49.02010 10 42 36 11 50.02009 8 41 40 10 49.0
Mathematics 2013 21 22 37 20 46.02012 21 27 31 21 48.02011 18 32 34 16 51.52010 19 22 43 17 51.02009 10 31 34 24 47.0
Science and Technology/ 2013 9 31 43 18 N/AEngineering 2012 16 22 46 16 N/A
2011 8 30 43 19 N/A2010 7 28 51 14 N/A2009 9 27 49 15 N/A
Grade 6English Language Arts 2013 7 51 31 11 49.0
2012 8 46 29 16 45.02011 10 50 30 10 50.02010 5 54 32 10 47.02009 10 49 29 13 48.0
Mathematics 2013 17 35 27 21 46.02012 18 29 29 24 54.02011 16 30 33 21 44.02010 11 36 31 23 43.52009 12 30 33 25 46.0
(Table 72 continued on following page)
Spring 2013 MCAS Tests: Summary of State Results 71

Table 72 (cont.): 2009–2013 Statewide MCAS Test Results by Race/Ethnicity: American Indian or Alaskan Native
Percentage of Students at Each Achievement Levela
Grade / Subject Year Advanced Proficient NeedsImprovement
Warning/Failing
MedianSGP
Grade 7English Language Arts 2013 5 50 32 12 46.0
2012 5 55 30 9 47.52011 5 58 31 6 48.02010 6 57 26 12 42.02009 8 53 29 11 49.5
Mathematics 2013 9 30 26 35 40.52012 10 28 38 24 44.02011 9 27 34 30 46.02010 7 31 33 29 48.02009 4 30 32 33 42.0
Grade 8English Language Arts 2013 12 60 23 6 44.5
2012 8 63 20 9 49.52011 13 60 19 9 48.02010 13 53 23 12 53.02009 8 55 27 9 46.0
Mathematics 2013 8 36 27 30 45.02012 9 27 40 25 51.02011 12 27 33 27 46.02010 12 26 31 31 39.02009 8 21 29 41 49.5
Science and Technology/ 2013 2 23 51 23 N/AEngineering 2012 1 23 45 30 N/A
2011 0 24 49 26 N/A2010 1 27 46 26 N/A2009 3 18 46 33 N/A
Grade 10English Language Arts 2013 32 59 5 3 54.0
2012 26 53 17 4 44.02011 15 55 26 4 45.02010 19 52 22 7 43.02009 19 57 21 4 46.0
Mathematics 2013 46 32 13 9 54.52012 37 28 21 14 44.02011 28 37 24 12 46.02010 43 22 24 10 45.52009 37 30 24 9 52.0
Science and Technology/ 2013 14 50 30 6 N/AEngineeringb 2012 14 44 34 8 N/A
2011 4 46 40 10 N/A2010 12 43 32 13 N/A2009 8 47 36 8 N/A
a Percentages may not total 100 due to rounding. For the purpose of computing state results, students who were absent with or without a medically documented excuse from any subject area MCAS test are not included in performance results but are counted as non-participants for that subject area.b Grade 10 STE results are reported based on students’ best performance on any STE test taken in grade 9 or grade 10; only students continuously enrolled in Massachusetts public schools from fall of grade 9 through spring of grade 10 are included.
Spring 2013 MCAS Tests: Summary of State Results 72
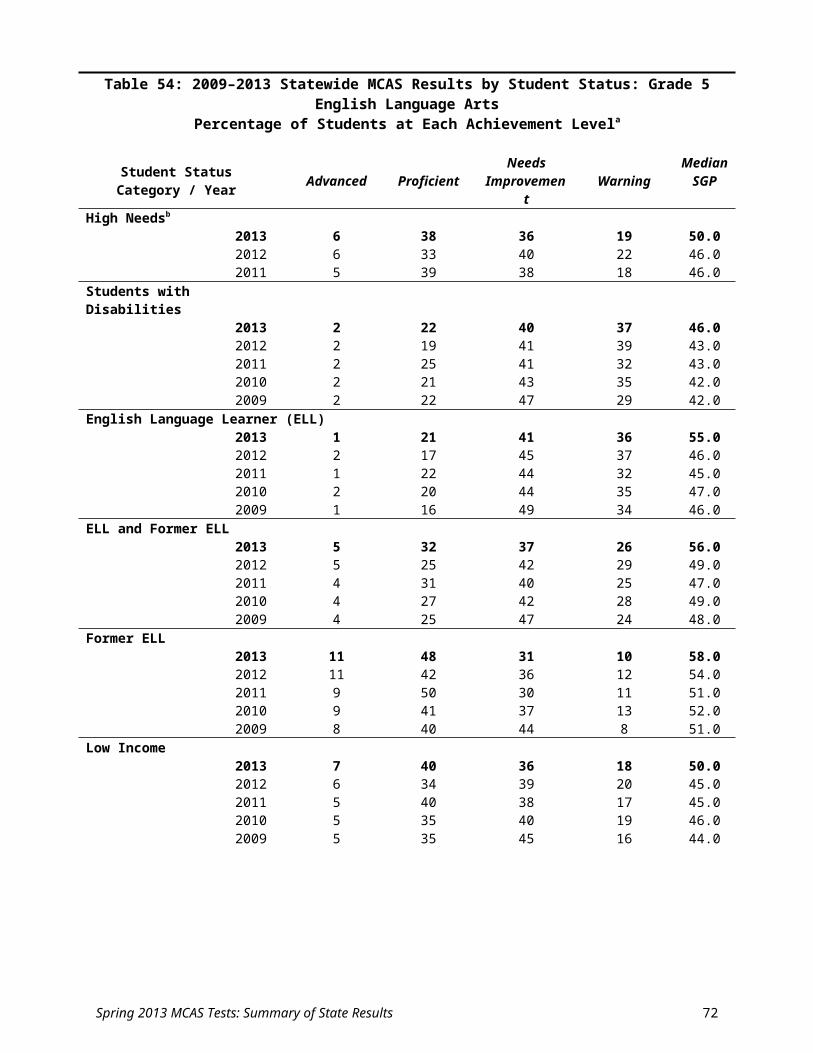
Table 73: 2009–2013 Statewide MCAS Test Results by Race/Ethnicity: WhitePercentage of Students at Each Achievement Levela
Grade / Subject Year Advanced Proficient NeedsImprovement
Warning/Failing
MedianSGP
Grade 3English Language Arts 2013 14 51 30 5 N/A
2012 18 51 25 5 N/A2011 13 56 26 6 N/A2010 17 53 25 5 N/A2009 15 51 29 6 N/A
Mathematics 2013 35 38 20 7 N/A2012 31 37 23 10 N/A2011 15 57 21 6 N/A2010 30 43 21 7 N/A2009 23 44 23 10 N/A
Grade 4English Language Arts 2013 12 48 31 9 50.0
2012 15 49 27 9 51.02011 11 48 32 8 51.02010 13 48 31 8 51.02009 14 47 32 7 52.0
Mathematics 2013 21 38 35 7 55.02012 18 40 33 8 51.02011 17 36 39 7 50.02010 18 36 39 7 49.02009 18 36 39 7 52.0
Grade 5English Language Arts 2013 21 51 21 6 51.0
2012 20 49 24 7 51.02011 20 54 20 5 51.02010 19 51 24 6 50.02009 18 53 25 5 51.0
Mathematics 2013 32 35 23 10 53.02012 29 35 24 12 50.02011 28 38 23 11 51.02010 29 33 27 12 51.02009 25 35 27 13 50.0
Science and Technology/ 2013 23 36 33 7 N/AEngineering 2012 26 35 31 8 N/A
2011 17 42 33 8 N/A2010 18 44 32 6 N/A2009 20 37 36 7 N/A
Grade 6English Language Arts 2013 19 56 19 6 53.0
2012 22 53 18 7 51.02011 21 56 18 5 51.02010 18 59 18 6 50.02009 19 55 21 6 49.0
Mathematics 2013 29 39 22 11 49.02012 31 36 22 11 50.02011 30 36 23 11 51.02010 31 35 23 11 50.02009 27 36 25 11 50.0
(Table 73 continued on following page)
Spring 2013 MCAS Tests: Summary of State Results 73
Table 73 (continued): 2009–2013 Statewide MCAS Test Results by Race/Ethnicity: WhitePercentage of Students at Each Achievement Levela
Grade / Subject Year Advanced Proficient NeedsImprovement
Warning/Failing
MedianSGP
Grade 7English Language Arts 2013 14 64 17 4 47.0
2012 18 60 17 5 49.02011 17 63 16 4 50.02010 13 66 16 5 50.02009 16 61 19 4 50.0
Mathematics 2013 22 37 26 15 47.02012 23 35 29 12 51.02011 22 35 27 16 50.02010 16 44 26 14 50.02009 18 38 29 15 51.0
Grade 8English Language Arts 2013 24 61 11 4 51.0
2012 20 66 10 4 49.02011 23 61 11 4 50.02010 20 64 12 4 50.02009 18 67 12 4 49.0
Mathematics 2013 25 36 24 15 49.02012 26 34 27 13 51.02011 27 32 26 16 50.02010 25 33 27 15 49.02009 24 32 27 17 50.0
Science and Technology/ 2013 4 42 43 11 N/AEngineering 2012 6 44 38 12 N/A
2011 5 41 43 11 N/A2010 4 43 41 12 N/A2009 5 42 40 13 N/A
Grade 10English Language Arts 2013 51 44 4 2 57.0
2012 43 50 5 2 51.02011 38 51 9 2 50.02010 30 54 13 2 50.02009 33 52 12 3 50.0
Mathematics 2013 62 24 10 4 52.02012 56 28 12 4 50.02011 54 29 13 4 50.02010 56 25 14 4 50.02009 53 28 15 5 50.0
Science and Technology/ 2013 30 49 19 3 N/AEngineeringb 2012 29 48 20 3 N/A
2011 23 51 22 4 N/A2010 21 52 23 4 N/A2009 19 51 25 5 N/A
a Percentages may not total 100 due to rounding. For the purpose of computing state results, students who were absent with or without a medically documented excuse from any subject area MCAS test are not included in performance results but are counted as non-participants for that subject area.b Grade 10 STE results are reported based on students’ best performance on any STE test taken in grade 9 or grade 10; only students continuously enrolled in Massachusetts public schools from fall of grade 9 through spring of grade 10 are included.
Spring 2013 MCAS Tests: Summary of State Results 74
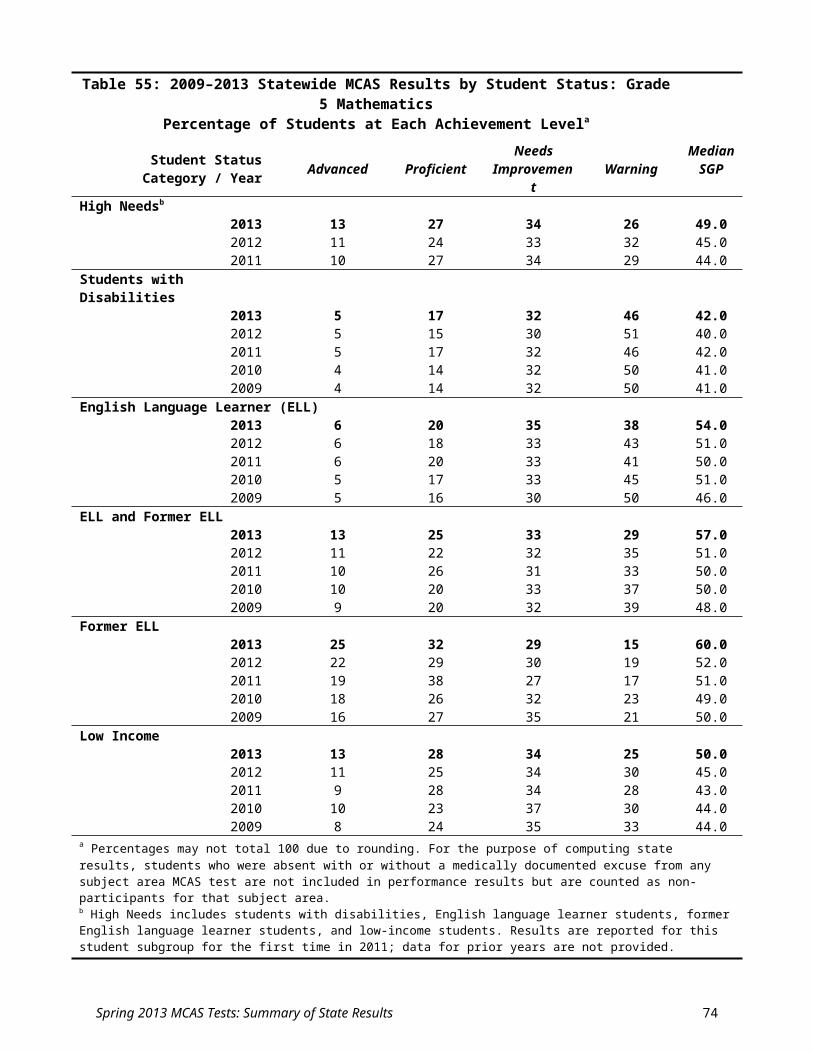
Table 74: 2009–2013 Statewide MCAS Test Results by Gender: FemalePercentage of Students at Each Achievement Levela
Grade / Subject Year Advanced Proficient NeedsImprovement
Warning/Failing
MedianSGP
Grade 3English Language Arts 2013 15 46 33 6 N/A
2012 19 47 27 7 N/A2011 14 51 28 7 N/A2010 17 50 27 6 N/A2009 14 47 31 8 N/A
Mathematics 2013 31 37 22 10 N/A2012 27 34 25 14 N/A2011 13 53 25 9 N/A2010 25 40 24 10 N/A2009 20 40 25 14 N/A
Grade 4English Language Arts 2013 15 47 28 9 57.0
2012 17 46 26 10 55.02011 13 47 31 9 57.02010 15 45 32 9 57.02009 16 44 31 9 55.0
Mathematics 2013 18 35 39 9 55.02012 17 36 36 11 51.02011 15 33 42 10 50.02010 16 33 42 10 49.02009 16 33 41 10 49.0
Grade 5English Language Arts 2013 23 48 22 7 52.0
2012 21 45 25 8 51.02011 22 50 22 7 52.02010 21 47 25 7 51.02009 20 49 26 6 53.0
Mathematics 2013 30 33 25 12 56.02012 25 32 27 15 52.02011 24 36 26 14 50.02010 24 30 30 16 49.02009 21 33 29 17 49.0
Science and Technology/ 2013 19 31 38 12 N/AEngineering 2012 21 31 34 13 N/A
2011 12 35 38 15 N/A2010 14 38 37 11 N/A2009 15 31 42 13 N/A
Grade 6English Language Arts 2013 21 51 20 7 54.0
2012 23 49 20 8 52.02011 22 51 20 7 51.02010 20 55 18 6 53.02009 22 51 21 6 55.0
Mathematics 2013 26 37 24 13 53.02012 28 34 25 14 52.02011 26 33 25 15 51.02010 27 33 25 15 51.02009 23 34 28 15 51.0
(Table 74 continued on following page)
Spring 2013 MCAS Tests: Summary of State Results 75

Table 74 (continued): 2009–2013 Statewide MCAS Test Results by Gender: FemalePercentage of Students at Each Achievement Levela
Grade / Subject Year Advanced Proficient NeedsImprovement
Warning/Failing
MedianSGP
Grade 7English Language Arts 2013 17 62 17 4 54.0
2012 20 58 17 5 56.02011 20 61 15 4 57.02010 15 63 17 5 54.02009 19 57 19 5 54.0
Mathematics 2013 20 34 27 19 47.02012 22 32 30 16 53.02011 20 33 27 20 53.02010 14 40 28 18 53.02009 16 34 31 20 52.0
Grade 8English Language Arts 2013 26 58 11 5 54.0
2012 23 62 11 4 50.02011 27 58 11 4 55.02010 22 60 13 5 50.02009 20 63 13 4 49.0
Mathematics 2013 23 34 26 18 52.02012 22 31 29 18 48.02011 23 29 27 20 50.02010 22 30 29 20 50.02009 20 30 28 22 52.0
Science and Technology/ 2013 3 34 45 18 N/AEngineering 2012 4 36 40 20 N/A
2011 4 33 44 19 N/A2010 3 34 43 20 N/A2009 4 34 42 20 N/A
Grade 10English Language Arts 2013 53 41 5 2 58.0
2012 43 48 7 2 49.02011 39 48 11 2 49.02010 32 51 15 3 51.02009 34 49 13 3 50.0
Mathematics 2013 55 26 13 7 49.02012 52 29 14 6 52.02011 49 30 16 6 49.02010 49 27 18 6 48.02009 46 28 19 7 49.0
Science and Technology/ 2013 25 46 24 4 N/AEngineeringb 2012 24 45 26 5 N/A
2011 19 48 27 6 N/A2010 17 47 28 7 N/A2009 15 46 30 9 N/A
a Percentages may not total 100 due to rounding. For the purpose of computing state results, students who were absent with or without a medically documented excuse from any subject area MCAS test are not included in performance results but are counted as non-participants for that subject area.b Grade 10 STE results are reported based on students’ best performance on any STE test taken in grade 9 or grade 10; only students continuously enrolled in Massachusetts public schools from fall of grade 9 through spring of grade 10 are included.
Spring 2013 MCAS Tests: Summary of State Results 76
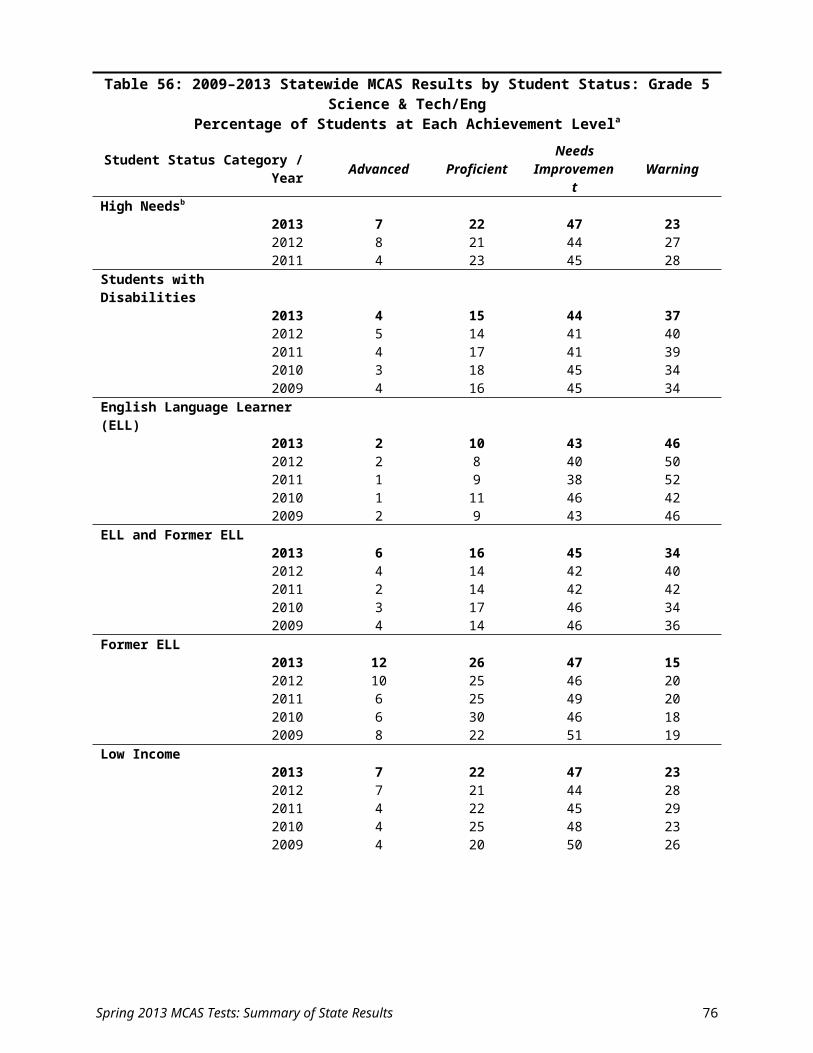
Table 75: 2009–2013 Statewide MCAS Test Results by Gender: MalePercentage of Students at Each Achievement Levela
Grade / Subject Year Advanced Proficient NeedsImprovement
Warning/Failing
Median SGP
Grade 3English Language Arts 2013 9 43 38 10 N/A
2012 12 45 32 11 N/A2011 8 49 32 11 N/A2010 12 47 32 9 N/A2009 11 44 34 12 N/A
Mathematics 2013 30 35 23 12 N/A2012 27 33 24 15 N/A2011 14 51 24 11 N/A2010 26 39 24 11 N/A2009 20 39 26 15 N/A
Grade 4English Language Arts 2013 6 39 38 17 42.0
2012 8 42 33 17 44.02011 6 39 40 15 43.02010 7 40 38 15 44.02009 8 40 39 14 44.0
Mathematics 2013 18 33 38 11 54.02012 15 35 36 14 49.02011 15 32 41 12 50.02010 16 31 41 12 48.02009 16 32 40 12 51.0
Grade 5English Language Arts 2013 14 47 27 12 52.0
2012 12 43 31 14 49.02011 13 50 27 11 47.02010 12 46 30 12 48.02009 11 47 32 10 47.0
Mathematics 2013 27 32 25 16 52.02012 25 31 25 19 48.02011 25 33 25 17 50.02010 25 30 27 18 51.02009 23 31 28 19 51.0
Science and Technology/ 2013 20 31 35 13 N/AEngineering 2012 22 30 33 15 N/A
2011 15 36 33 15 N/A2010 16 39 34 12 N/A2009 19 33 37 12 N/A
Grade 6English Language Arts 2013 11 51 26 13 50.0
2012 14 48 25 14 48.02011 13 51 25 11 49.02010 11 53 24 12 47.02009 11 50 28 11 45.0
Mathematics 2013 25 34 23 18 47.02012 27 32 24 17 49.02011 26 31 25 18 49.02010 27 32 24 17 49.02009 24 32 26 18 49.0
(Table 75 continued on following page)
Spring 2013 MCAS Tests: Summary of State Results 77

Table 75 (continued): 2009–2013 Statewide MCAS Test Results by Gender: MalePercentage of Students at Each Achievement Levela
Grade / Subject Year Advanced Proficient NeedsImprovement
Warning/Failing
MedianSGP
Grade 7English Language Arts 2013 8 57 26 9 42.0
2012 10 55 25 10 44.02011 9 57 26 8 43.02010 7 60 24 9 46.02009 9 55 27 9 46.0
Mathematics 2013 19 31 26 23 45.02012 19 30 30 20 47.02011 19 30 27 24 47.02010 14 38 27 21 48.02009 16 33 28 23 49.0
Grade 8English Language Arts 2013 14 59 18 10 46.0
2012 13 63 16 8 51.02011 14 60 18 8 46.02010 12 61 18 9 50.02009 11 64 18 8 51.0
Mathematics 2013 22 31 25 22 49.02012 23 30 28 20 53.02011 23 28 26 22 51.02010 23 28 27 22 51.02009 21 27 27 25 49.0
Science and Technology/ 2013 5 37 40 18 N/AEngineering 2012 6 39 36 20 N/A
2011 5 36 41 18 N/A2010 4 38 40 18 N/A2009 5 36 39 21 N/A
Grade 10English Language Arts 2013 37 52 8 3 56.0
2012 32 54 11 3 52.02011 27 54 15 4 51.02010 20 54 21 5 48.02009 22 53 19 6 49.0
Mathematics 2013 55 24 13 8 53.02012 49 28 15 8 48.02011 48 28 16 8 52.02010 51 24 17 8 52.02009 47 27 18 9 51.0
Science and Technology/ 2013 27 44 23 6 N/AEngineeringb 2012 25 44 25 6 N/A
2011 21 46 26 7 N/A2010 18 47 27 8 N/A2009 18 45 28 9 N/A
a Percentages may not total 100 due to rounding. For the purpose of computing state results, students who were absent with or without a medically documented excuse from any subject area MCAS test are not included in performance results but are counted as non-participants for that subject area.b Grade 10 STE results are reported based on students’ best performance on any STE test taken in grade 9 or grade 10; only students continuously enrolled in Massachusetts public schools from fall of grade 9 through spring of grade 10 are included.
Spring 2013 MCAS Tests: Summary of State Results 78


![Vihiga Members of County Assembly [Vihiga MCAs, 2013-18]](https://img.pdfslide.net/doc/110x75/5872e2fe1a28abfa548b5535/vihiga-members-of-county-assembly-vihiga-mcas-2013-18.jpg)


