Embed Size (px)
Citation preview

Faculty of Science and Technology
MASTER’S THESIS
Study program/ Specialization:
Offshore Technology / Industrial Asset Management
Spring semester, 2015
Restricted access
Writer:
Maximilian Wollbraaten
…………………………………………
(Writer’s signature)
Faculty supervisor: Knut Erik Bang
External supervisor(s): Kenneth Skogen
Thesis title: Optimization of Dolphin Drillings Spare Part Management
Credits (ECTS): 30
Key words:
Spare parts, Spare part management, Decision framework, reduce spare part inventory, offshore drilling
Pages: 112
+ enclosure: 22 pages
+ USB flash drive
Stavanger, 15.06.2015

Master Thesis
Optimization of Dolphin Drillings Spare Part Management
By
Maximilian Wollbraaten
University of Stavanger
June 15, 2015
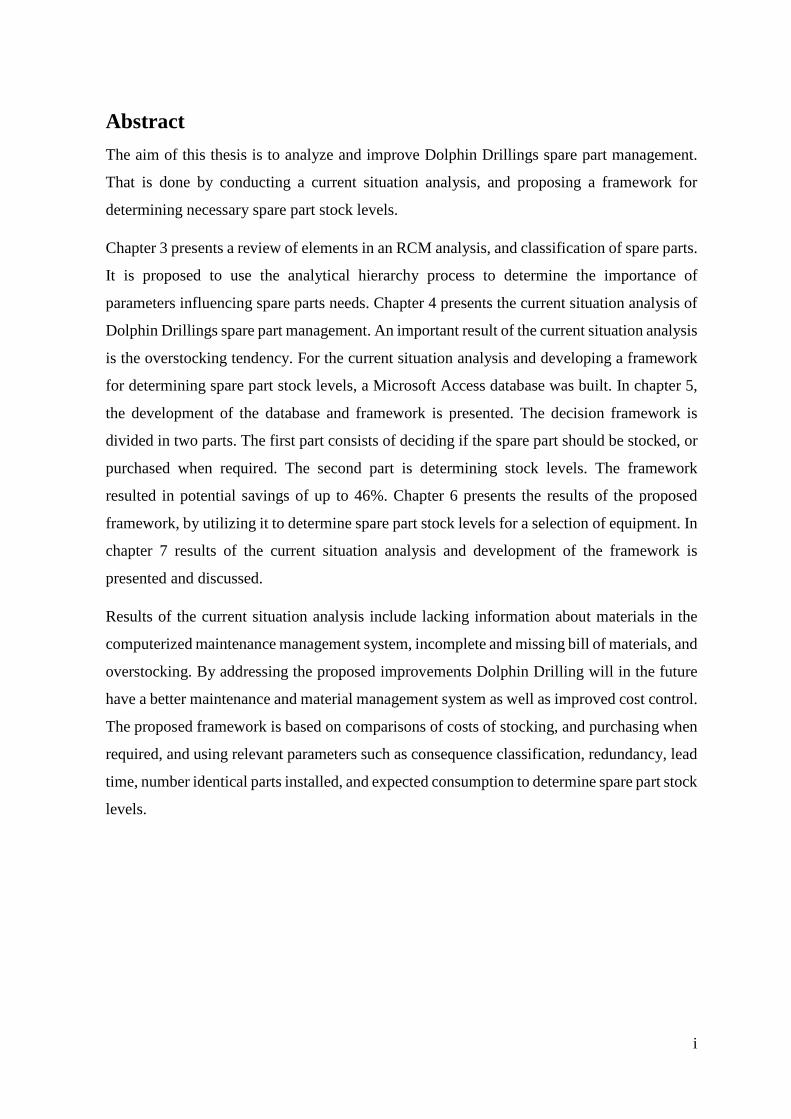
Abstract The aim of this thesis is to analyze and improve Dolphin Drillings spare part management.
That is done by conducting a current situation analysis, and proposing a framework for
determining necessary spare part stock levels.
Chapter 3 presents a review of elements in an RCM analysis, and classification of spare parts.
It is proposed to use the analytical hierarchy process to determine the importance of
parameters influencing spare parts needs. Chapter 4 presents the current situation analysis of
Dolphin Drillings spare part management. An important result of the current situation analysis
is the overstocking tendency. For the current situation analysis and developing a framework
for determining spare part stock levels, a Microsoft Access database was built. In chapter 5,
the development of the database and framework is presented. The decision framework is
divided in two parts. The first part consists of deciding if the spare part should be stocked, or
purchased when required. The second part is determining stock levels. The framework
resulted in potential savings of up to 46%. Chapter 6 presents the results of the proposed
framework, by utilizing it to determine spare part stock levels for a selection of equipment. In
chapter 7 results of the current situation analysis and development of the framework is
presented and discussed.
Results of the current situation analysis include lacking information about materials in the
computerized maintenance management system, incomplete and missing bill of materials, and
overstocking. By addressing the proposed improvements Dolphin Drilling will in the future
have a better maintenance and material management system as well as improved cost control.
The proposed framework is based on comparisons of costs of stocking, and purchasing when
required, and using relevant parameters such as consequence classification, redundancy, lead
time, number identical parts installed, and expected consumption to determine spare part stock
levels.
i

Acknowledgements I have worked on my thesis with enthusiasm, curiosity and dedication, with supportive
advisors from January to June during 2015. It has been hard work, long hours, frustration and
happiness. I would like to thank Dolphin Drilling giving me an opportunity to write my thesis
for them, and providing an intriguing topic as well as guidance.
I would like to thank everyone who have contributed in this journey of writing my master’s
thesis. Especially my advisor Kenneth Skogen and everyone at Dolphin Drilling, who have
contributed with knowledge, constructive discussions, and guidance during this period.
Further I would like to thank my advisor from the University of Stavanger, Knut Erik Bang,
for his time and contribution to this thesis.
Last but not least, I would like to thank my family and friends who have made my time at the
University of Stavanger filled with knowledge, enthusiasm and good memories.
ii
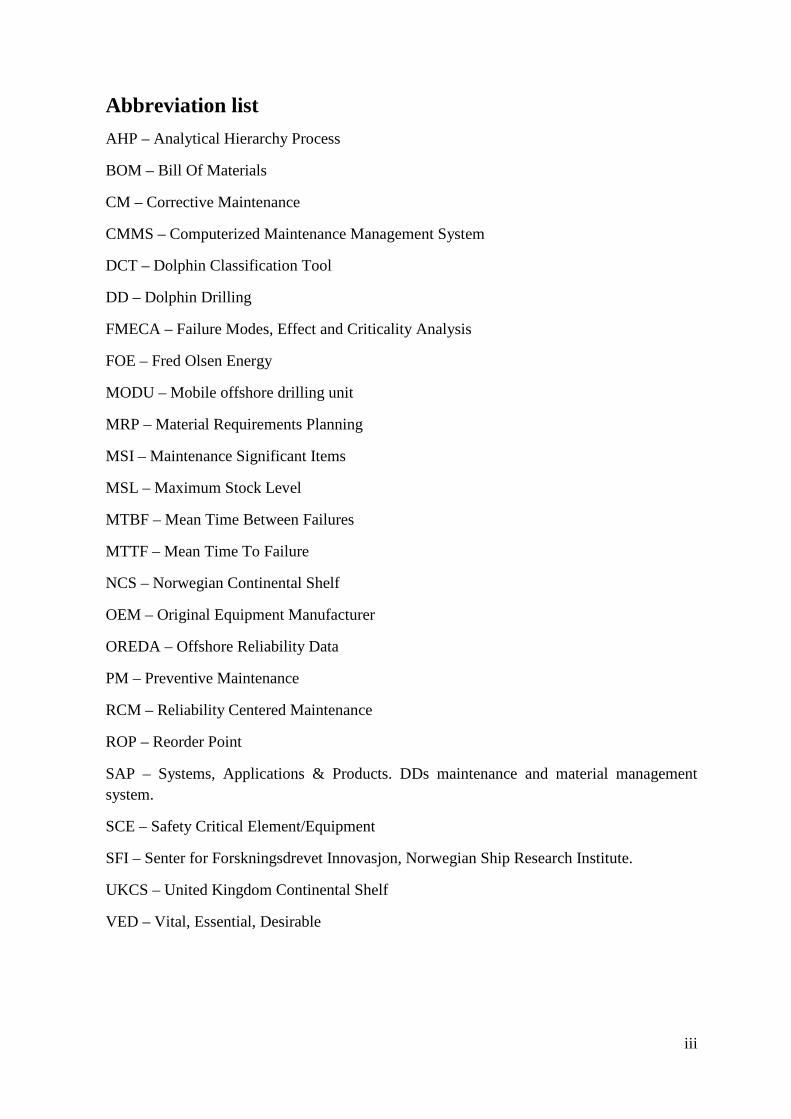
Abbreviation list AHP – Analytical Hierarchy Process
BOM – Bill Of Materials
CM – Corrective Maintenance
CMMS – Computerized Maintenance Management System
DCT – Dolphin Classification Tool
DD – Dolphin Drilling
FMECA – Failure Modes, Effect and Criticality Analysis
FOE – Fred Olsen Energy
MODU – Mobile offshore drilling unit
MRP – Material Requirements Planning
MSI – Maintenance Significant Items
MSL – Maximum Stock Level
MTBF – Mean Time Between Failures
MTTF – Mean Time To Failure
NCS – Norwegian Continental Shelf
OEM – Original Equipment Manufacturer
OREDA – Offshore Reliability Data
PM – Preventive Maintenance
RCM – Reliability Centered Maintenance
ROP – Reorder Point
SAP – Systems, Applications & Products. DDs maintenance and material management system.
SCE – Safety Critical Element/Equipment
SFI – Senter for Forskningsdrevet Innovasjon, Norwegian Ship Research Institute.
UKCS – United Kingdom Continental Shelf
VED – Vital, Essential, Desirable
iii
Definitions To stock: This phrase means that a material should be purchased to storage.
Stock at failure: This phrase means that the material should be purchased when required.
BOMHeader: A BOMHeader material is the topmost material connected to a functional
location or equipment. The BOM is connected to the BOMHeader.
BOMDetail: A BOMDetail material means that the material is part of a BOM.
Material: The word material is used as general term for spare parts, consumables, tools and
construction materials.
Functional location: A functional location is the functional address of an asset, this is where
the maintenance is performed and failures reported.
Framework: The framework is in this thesis referred to as the forms utilized in Microsoft
Access for making decisions regarding stocking spare parts or not, determining spare part
stock levels and finding overstock materials.
Access database: This is the Access database, containing all tables, queries and forms used to
design the framework.
iv
Table of contents Abstract .................................................................................................................................... i
Acknowledgements ................................................................................................................. ii
Abbreviation list ..................................................................................................................... iii
Definitions .............................................................................................................................. iv
Table of contents ..................................................................................................................... v
List of figures ......................................................................................................................... ix
List of tables ........................................................................................................................... xi
1 Introduction ..................................................................................................................... 1
1.1 Background ............................................................................................................... 1
1.2 Objectives ................................................................................................................. 2
1.3 Limitations ................................................................................................................ 3
1.4 Methodology ............................................................................................................. 4
2 About Dolphin Drilling ................................................................................................... 5
2.1 Fleet .......................................................................................................................... 6
2.2 Bolette Dolphin ......................................................................................................... 6
2.3 SAP ........................................................................................................................... 6
Technical hierarchy ........................................................................................... 7
Consequence classification ................................................................................ 9
3 Maintenance and spare parts theory .............................................................................. 12
3.1 Reliability centered maintenance ............................................................................ 13
3.2 Spare parts .............................................................................................................. 20
Criticality classification of spare parts ............................................................ 22
Rules and regulations regarding spare parts .................................................... 23
4 Current Situation Analysis ............................................................................................ 25
4.1 Distribution of materials ......................................................................................... 26
4.2 Distribution of inventory value ............................................................................... 27
v
4.3 Overstocking ........................................................................................................... 30
4.4 Duplicate materials ................................................................................................. 30
5 Development of spare part optimization methodology ................................................. 31
5.1 Framework introduction ......................................................................................... 31
5.2 First decision: Stock or stock at failure .................................................................. 32
Costs of stocking at failure .............................................................................. 33
Costs of stocking to storage ............................................................................. 34
5.2.2.1 Holding costs ............................................................................................ 34
5.2.2.2 Procurement costs per purchase order...................................................... 35
5.2.2.3 Logistics costs .......................................................................................... 35
5.3 Second decision: Deciding quantity to stock .......................................................... 36
Why are these parameters important? ............................................................. 36
Recommended stock level ............................................................................... 37
5.4 Repair process ......................................................................................................... 40
5.5 Failure process ........................................................................................................ 40
Failure rate ....................................................................................................... 41
Failure during lead time .................................................................................. 43
5.6 Data acquirement .................................................................................................... 43
Explanation of attributes ................................................................................. 44
Data not imported ............................................................................................ 47
Data export ...................................................................................................... 49
5.7 Microsoft Access - Building the database .............................................................. 52
Tables in Access .............................................................................................. 52
Queries in Access ............................................................................................ 55
5.7.2.1 qry_AppendShoppingCart........................................................................ 58
5.7.2.2 qry_AppendShoppingCartManual ........................................................... 58
vi
5.7.2.3 qry_AppendOverstock_qtysort, qry_AppendOverstock_Valuesort,
qry_AppendOverstock_All ....................................................................................... 58
5.7.2.4 qry_EmptyOverstockList ......................................................................... 59
5.7.2.5 qry_FL_DecisionAid ............................................................................... 59
5.7.2.6 qry_NoInstDetailMaterial and qry_NoInstHeaderMaterial ..................... 60
5.7.2.7 qry_Overstock_FLsorted.......................................................................... 60
5.7.2.8 qry_OverstockValue ................................................................................ 61
5.7.2.9 qry_OverstockValueTotal ........................................................................ 61
5.7.2.10 qry_ShowBOM ........................................................................................ 61
5.7.2.11 qry_ValueofBOM .................................................................................... 61
5.7.2.12 qry_UpdateQtyShoppingCart ................................................................... 62
5.7.2.13 qry_ShoppingCart_vs_ActualStock ......................................................... 62
Forms in Access .............................................................................................. 62
5.7.3.1 Frm_DecisionAid ..................................................................................... 63
5.7.3.2 Frm_DecideSpareQuantity ....................................................................... 68
5.7.3.3 Frm_DecideSpareQuantityManual .......................................................... 70
5.7.3.4 Frm_Overstock and frm_Overstocksubform ........................................... 71
Macros in Access ............................................................................................. 72
5.8 Results of the framework ........................................................................................ 73
6 Examples showing framework results ........................................................................... 75
6.1 Choke and kill manifold, valve 1. ........................................................................... 76
6.2 Air compressor ........................................................................................................ 78
6.3 Smoke and gas detectors ......................................................................................... 80
6.4 Overstock ................................................................................................................ 80
6.5 Mud pump ............................................................................................................... 82
6.6 Summary of examples ............................................................................................ 86
7 Results and discussion ................................................................................................... 87
vii
7.1 Framework .............................................................................................................. 87
7.2 Results from the current situation analysis ............................................................. 89
Incomplete material information ..................................................................... 89
Number of repairs are not tracked ................................................................... 90
Overstocking ................................................................................................... 90
Spare parts not in technical hierarchy ............................................................. 91
7.3 Consequences of not having spare available .......................................................... 92
7.4 Equations/parameters .............................................................................................. 92
7.5 How to implement the framework .......................................................................... 94
7.6 Data quality ............................................................................................................. 94
Data format ...................................................................................................... 96
7.7 Further work with framework ................................................................................. 96
8 Conclusion ..................................................................................................................... 98
9 References ..................................................................................................................... 99
10 Appendices .................................................................................................................. 101
Appendix A – SFI groups .................................................................................................... 101
Appendix B – Walkthrough of frm_DecisionAid ............................................................... 103
Appendix C – Walkthrough of frm_DecideSpareQuantity ................................................. 107
Appendix D – Design of all queries .................................................................................... 109
Appendix E - Database with framework ............................................................................. 122
viii
List of figures Figure 2-1: Current fleet contract status. ................................................................................. 6
Figure 2-2 SFI coding system. ................................................................................................ 8
Figure 2-3: Technical hierarchy of Bolette Dolphin ............................................................... 8
Figure 2-4: Draw works & machinery hierarchy .................................................................... 9
Figure 2-5: Hierarchy down to material and description. ....................................................... 9
Figure 2-6 Consequence classification as shown in SAP ...................................................... 10
Figure 2-7: Consequence classification matrix from DCT.................................................... 11
Figure 2-8: ABC indicator, as used in SAP. .......................................................................... 11
Figure 3-1 Maintenance in a time perspective ...................................................................... 12
Figure 4-1: Value of spare part inventory in percent. ........................................................... 26
Figure 4-2 This figure shows the value of spare parts connected to each SFI ...................... 28
Figure 4-3 Example of overstocked materials from Microsoft access database ................... 30
Figure 5-1 Balance between inventory cost and total cost. ................................................... 31
Figure 5-2 Analytical hierarchy process................................................................................ 38
Figure 5-3 Pairwise comparison , .......................................................................................... 38
Figure 5-4 Bath-tub curve. .................................................................................................... 40
Figure 5-5 Failure and reliability probability distribution. .................................................... 42
Figure 5-6: ABC indicator, as used in SAP. .......................................................................... 47
Figure 5-7 Area code, screenshot from SAP ......................................................................... 47
Figure 5-8 SE16N frontpage ................................................................................................. 50
Figure 5-9 Results of SE16N transaction .............................................................................. 50
Figure 5-10 Design of the “tbl_Material” table ..................................................................... 53
Figure 5-11 Datasheet view of “tbl_material” table .............................................................. 53
Figure 5-12 Relationships between tables in database. ......................................................... 54
Figure 5-13 Design view of "qry_ShowBOM" query ........................................................... 56
Figure 5-14 Result of "qry_ShowBOM" query ..................................................................... 57
Figure 5-15 Design view of "qry_FL_DecisionAid" ............................................................ 59
Figure 5-16 Design view of “qry_NoInstDetailMaterial” ..................................................... 60
Figure 5-17 Datasheet view of "qry_overstock_FLsorted" query. ........................................ 60
Figure 5-18 Design view of qry_overstockValue ................................................................. 61
Figure 5-19 Datasheet view of query “qry_ShowBOM”. ..................................................... 61
Figure 5-20 Datasheet view of query “qry_ValueofBOM” ................................................. 62
ix
Figure 5-21 Datasheetview of "qry_ShoppingCart_vs_ActualStock" .................................. 62
Figure 5-22 Form view of "frm_DecisionAid" ..................................................................... 64
Figure 5-23 Complete DecisionAid form .............................................................................. 68
Figure 5-24 Layout view of frm_DecideSpareQuantity ........................................................ 69
Figure 5-25 Filled out form ................................................................................................... 70
Figure 5-26 Form view of "frm_Overstock" ......................................................................... 72
Figure 5-27 Macros ............................................................................................................... 73
Figure 5-28 Macro from "frm_decideSpareQuantity" .......................................................... 73
Figure 7-1 CS15 SAP transaction ......................................................................................... 91
Figure B-1 Form view of “frm_DecisionAid” .................................................................... 103
Figure B-2 Filtered results ................................................................................................... 103
Figure B-3 Automatic retrieved data after selecting functional location. ........................... 104
Figure B-4 Drop-down list of associated spare parts .......................................................... 104
Figure B-5 Filled out form .................................................................................................. 105
Figure C-1 Blank “frm_DecideSpareQuantity” form ......................................................... 107
Figure C-2 Choosing material from dropdown list. ............................................................ 107
Figure C-3 Almost complete “frm_DecideSpareQuantity” form. ....................................... 108
Figure D-1 Design view of query qry_AppendOverstock_All ........................................... 109
Figure D-2 Design view of query “qry_AppendOverstock_qtysort” .................................. 110
Figure D-3 Design view of query “qry_AppendOverstock_valuesort” .............................. 111
Figure D-4 Design view of query “qry_AppendShoppingCartt” ........................................ 111
Figure D-5 Design view of query “qry_AppendShoppingCartManual” ............................. 112
Figure D-6 Design view of query “qry_EmptyOverstockList” ........................................... 112
Figure D-7 Design view of query "qry_FL_DecisionAid" ................................................. 113
Figure D-8 Design view of query “qry_No_InstDetailMaterial” ........................................ 114
Figure D-9 Design view of query “qry_No_InstHeaderMaterial” ...................................... 115
Figure D-10 Design view of query “qry_OverstockFLsorted" ........................................... 116
Figure D-11 Design view of query “qry_OverstockValue" ................................................ 117
Figure D-12 Design view of query “qry_OverstockValueTotal" ........................................ 118
Figure D-13 Design view of query “qry_ShoppingCart_vs_actualstock" .......................... 118
Figure D-14 Design view of query “qry_ValueofBOM" .................................................... 119
Figure D-15 Design view of query “qry_ShowBOM" ........................................................ 120
Figure D-16 Design view of query “qry_UpdateQtyShoppingCart" .................................. 121
x
List of tables Table 3-1 Rausands (1996) proposed FFA sheet .................................................................. 14
Table 3-2 FMECA worksheet proposed by Rausand (1996) ................................................ 15
Table 3-3: Dolphin Drilling's categorization of materials. .................................................... 21
Table 4-1: Value of inventory ............................................................................................... 25
Table 4-2: Distribution of materials with price>0. ................................................................ 26
Table 4-3 All materials .......................................................................................................... 26
Table 4-4 Inventory value sorted by material types .............................................................. 27
Table 4-5 Inventory value sorted by MRP type .................................................................... 27
Table 4-6 ZSPR materials sorted by MRP type .................................................................... 27
Table 5-1 Weightage of spare part classification parameters. ............................................... 39
Table 5-2 Data required to build database in Microsoft Access ........................................... 44
Table 6-1 A selection of equipment used to show the results of the framework. ................. 75
Table 6-2 Recommended spare parts for the kill and choke valve........................................ 77
Table 6-3 Recommended spare parts for the air compressor ................................................ 79
Table 6-4 Smoke and gas detectors ....................................................................................... 80
Table 6-5 Recommended spare part stock levels, for materials currently overstocked ........ 81
Table 6-6 Recommended spare parts for mud pump ............................................................ 85
xi
Chapter 1 Introduction
1 Introduction In this thesis Dolphin Drillings (DD) spare part management is analyzed. In connection with
the analysis a framework for deciding which spare parts that should be stocked, as well as
spare part stock levels is presented. In the framework a set of parameters that influence the
need for spare parts are discussed, as well as comparing costs of having the spare part on hand
and purchasing spare parts when required/at failure. This framework was created to reduce
costs of spare part inventories, while minimizing the risk of HSE incidents or operational
downtime. The framework is easy to implement for the mobile offshore drilling units
(MODUs) in DDs fleet which use SAP as their maintenance and spare part management
system. In the thesis a Microsoft Access database is presented. The database includes all
functional locations, equipment and materials used for Bolette Dolphin, one of DD MODUs.
The database is based on exported data from SAP, which is DDs computerized maintenance
management system (CMMS) for Bolette Dolphin. The database makes it possible to compare
the frameworks recommended spare part stock levels, with the current stock levels. The
current situation analysis and framework resulted in several improvement potentials for spare
part management, as well as showing how to reduce the value of spare part inventory.
The disadvantage of operating MODUs compared to fixed installations is that the supply
chain may vary from year to year based on the MODUs position. This means that onshore
storage locations has to be developed to best serve the MODUs and account for potential
location changes. Today DD operates MODUs around the world, but mainly on the NCS and
UKCS from main offices in Aberdeen and Stavanger. As the supply/logistics conditions are
quite good on the NCS and UKCS compared to remote areas such as Colombia or East Africa,
the framework are valid for MODUs operating in this area, but can easily be modified to
match conditions in other areas by changing the planning perspective, and weightage of
parameters.
1.1 Background The background for the thesis is improving the spare part management in DD. All
organizations benefit of having a procedure for continuous improvement. This is also the case
for DD.
By improving spare part strategy, costs attached to maintenance and operation can be reduced
as spare part stock levels can be reduced. It is important not to reduce the stock levels to a
1
Chapter 1 Introduction
point where rules and regulations are not fulfilled, or HSE incidents or operational downtime
is risked. The total value of the spare part inventory is around $18 million, excluding the value
of capital spares. By reducing the spare part inventory value, funds become available for other
uses. When determining the spare part inventory there are several considerations to make.
Mainly three departments are involved when deciding the budget for maintenance and spare
parts, the financial, operational, and maintenance department. With the current market
conditions it is important to turn every stone in order to reduce costs, therefore it is necessary
to have a framework for deciding the optimal spare part inventory. With a clear framework it
is possible to justify and document the necessity of the spare part inventory.
With cost efficient and productive operation and maintenance, DD will be able to provide the
best tender when trying to win contracts.
1.2 Objectives The objective of this thesis is to create a framework for determining which spare parts to stock
and not stock for MODUs in Dolphin Drillings fleet. In maintenance and spare part
management there are high costs. It is also potential for making cost reductions. By finding
the optimal balance between which parts to stock, and which parts to purchase when needed,
DD has the possibility to reduce their capital tied up in spare parts. A typical spare part
inventory consists of approximately 25 000 – 30 000 unique items, stored either at a coast
base, a supplier warehouse or on the MODU.
By creating a framework for spare part stocking, the framework may in the future be
implemented as a part of the overall spare part strategy in DD. The framework will be based
on recent research within inventory optimization, maintenance research and a set of criteria
for the spare parts. Included in these criteria are the main equipment criticality classification,
material cost, availability, consumption and more.
After the framework is outlined it will be used to determine the necessary spare parts for a
selection of equipment. The results of the framework will then be compared to the current
inventory, and an estimation of potential savings by using the framework will be presented.
2
Chapter 1 Introduction
1.3 Limitations When working with the thesis some limitations were made in order to restrict the extent of
the thesis.
As a requirement for analysis, the technical hierarchy of functional locations and materials
has to correspond to the technical hierarchy described in section 2.3.1
Only materials from SAPs material management module is included in the database.
Compared to the number of materials in SAP, there are very few items that are procured or
used without having a material number in SAP.
Failure rates are assumed to be exponentially distributed, which is further explained in section
5.5, describing the failure process.
Repair time are assumed to be instantaneous which results in MTTF=MTBF. This influences
the analysis of probability of available spare, and second failure when waiting for stock
replenishment. The reason for this assumption, is that the lead time is often much longer than
the actual repair time. The inclusion of repair times will not improve the framework
noteworthy, as the lead time for materials is generally much larger than actual repair times.
To demonstrate the difference; lead times is often measured in days or weeks, while repair
time is measured in hours.
Supply and logistics conditions are assumed to be similar or equal to the conditions for
supplying MODUs in the North Sea. This influences the weightage of parameters in the
framework. The weightage of parameters should be reevaluated for the framework to be valid
for MODUs operating in other areas than the North Sea. Due to the nature of MODU
contracts, and logistics conditions in the North Sea a planning period of one year is assumed
to be sufficient. This means that the recommended stock levels as a minimum should cover
one year of operation and expected usage of spare parts.
Spare part management comprises many aspects, such as supply chain, storage, procurement
and which spare parts to stock and stock levels. This thesis mainly focuses on the part
regarding the procurement criteria and stock levels. In order to decide on where to store parts,
NORSOK Z-008, annex C may be used. There a risk matrix for where to store spare parts is
proposed. In this thesis it is assumed that DD has already adequate routines for storing spare
parts.
3
Chapter 1 Introduction
1.4 Methodology The literature studied for this thesis is based on scientific articles and publications written in
the field of maintenance and spare part management. Research directly applicable to offshore
drilling operations is scarce, therefore only elements of the studied literature are suitable for
an organization performing offshore drilling operations.
Parameters influencing spare part needs have been discussed with maintenance management
and material management personnel at Dolphin Drilling, by doing this the most important
parameters have been included in the thesis.
Data regarding failure processes as well as failure rates have been collected from OREDA,
which is a comprehensive reliability data handbook developed by a group of oil and gas
companies, in cooperation with SINTEF.
In this thesis all data regarding material inventories, technical hierarchy is based on Bolette
Dolphin. Information about DDs current situation, is based on discussions with onshore
maintenance management and material management personnel, and exported data from DDs
CMMS. The exported data have been used for designing an Access database, which enables
manipulation of data to find key figures regarding the current situation analysis.
The development of the framework for determining spare part stock levels, have been done
in Microsoft Access. In Access queries have been designed to retrieve selected data in a
understandable format. This data is then displayed in forms. The development of each query
is described in chapter 5. The development of the database was a more comprehensive task
than assumed. It is consists of tables, queries and forms which has to be designed individually
and connected by criteria, and relationships between tables. These relationships gives the
database the same structure as the technical hierarchy as the drillship Bolette Dolphin.
As a practical example of determining spare part stock levels, the proposed framework has
been utilized in order to compare results of the framework with the current situation analysis.
4
Chapter 2 About Dolphin Drilling
2 About Dolphin Drilling The Dolphin Drilling companies form the drilling contracting business activities of Fred.
Olsen Energy ASA. Dolphin Drilling owns and operates MODUs, and their fleet consists of
both drilling rigs and drilling ships, as well as one accommodation rig. Their vision is “to be
the preferred drilling contractor for the operation of mobile drilling units” (dolphindrilling.no,
2015).
Their offices in Aberdeen, Scotland; Stavanger, Norway and Pemba, Mozambique control the
offshore operations around the world. Management and administrative support including
employment of international offshore personnel are provided by the office in Singapore.
Dolphin Drilling is one of the longest established independent drilling contracting companies
in the offshore arena tracing its roots back to the earliest offshore exploration activity in the
North Sea in the mid nineteen sixties. The Fred Olsen family’s interest pre-dates this with a
history in shipping activity stretching over 160 years.
In 1997 Dolphin Drilling were listed on the Oslo stock exchange under Fred Olsen Energy
ASA, by doing this the offshore activities were brought together into a single entity. Since the
listing Dolphin Drilling has expanded and increasingly focused on international arenas and
moved into deep water activity.
Dolphin Drilling is a well-established name in offshore drilling. The company has operated
in all the major offshore oil and gas provinces in the world. In recent years, they have operated
in most of the major areas of offshore activity, including the North Sea, West and East Africa,
Mediterranean, India, Brazil and Gulf of Mexico.
Dolphin Drilling’s core business values combine long-term thinking with the advantages of
being an independent contractor with a streamlined management structure. This ensures that
they are well positioned to respond rapidly and flexibly to customer needs whilst at the same
time maintaining safe and efficient operations within their key business parameters.
(dolphindrilling.no, 2015).
5
Chapter 2 About Dolphin Drilling
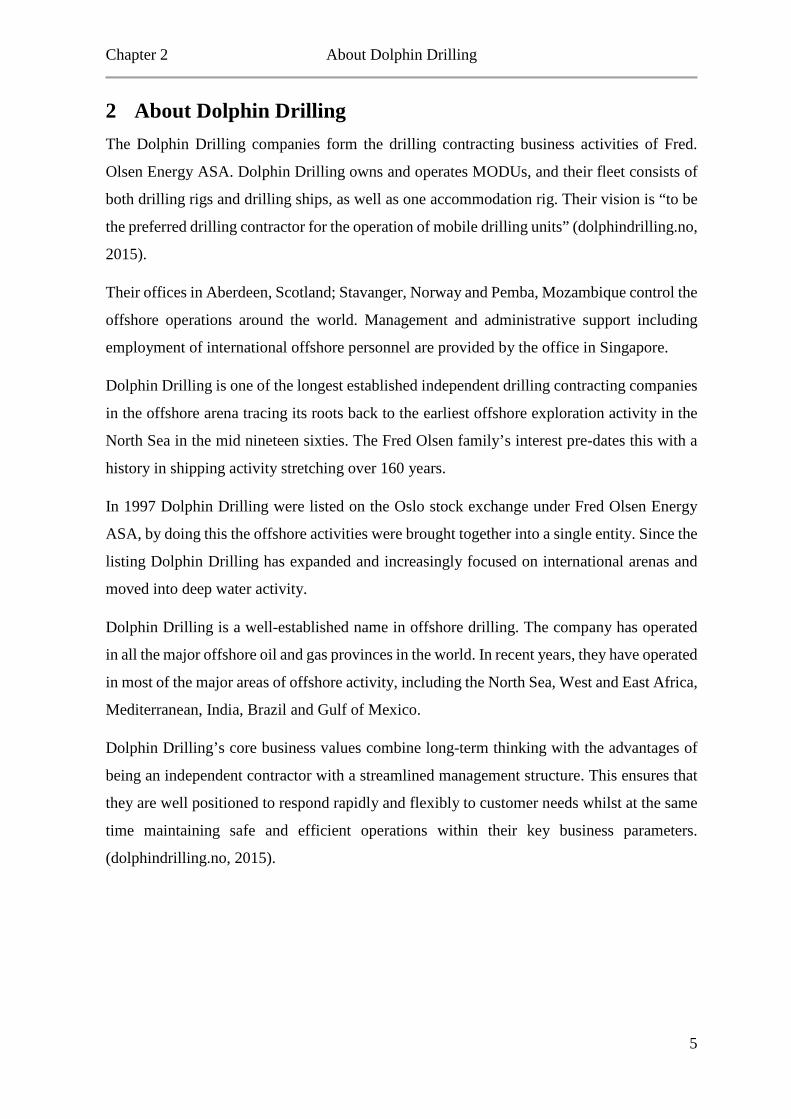
2.1 Fleet The market has been rough the last year and
many companies has had to lay off staff, and
contracts are either terminated or not renewed as
well as old rigs are being scrapped due to fewer
contracts and the reduction of day rates globally.
Dolphin Drilling’s fleet status is shown in figure
2-1. At the end of 2015, three MODUs are
without contracts. This is due to the difficult
market conditions at the moment.
2.2 Bolette Dolphin To be able to use as reliable data as possible, data used in the thesis is found in SAP, connected
to Bolette Dolphin. This is the newest drillship and have been in operation for approximately
1 year. In addition this is the only MODU so far that uses SAP as its CMMS. Four of Dolphin
Drilling’s MODUs are in the process of implementing SAP so far. In the future, the rest of
the fleet will maybe implement SAP. It is therefore important that the basis of the spare part
framework builds on data available in SAP or available from other CMMSs.
2.3 SAP SAP is the maintenance and material management system DD has implemented for Bolette
Dolphin. In SAP all maintenance orders, both corrective and preventive, are planned.
Preventive maintenance orders are generated automatically for all functional locations with a
generic maintenance concept. Corrective maintenance orders are created after a notification
(failure report) is raised, reviewed and approved. Then a corrective maintenance order will be
created and prioritized based on several factors, including consequence classification and
failure type, whether or not it is an SCE, material availability, etc.
As a material management system SAP is used for purchasing materials, stock control,
shipping information. When all materials are in SAP it is easy for the offshore crew to see
where it is stored, if the material is in transit and when it is delivered, etc. There are several
advantages of using SAP for both material and maintenance management:
Figure 2-1: Current fleet contract status. FOE (2015)
6
Chapter 2 About Dolphin Drilling
• Linking work orders with materials
• More efficient planning of maintenance
• Trending failures, leading to the possibility of using the MODUs failure rates when
stocking spare parts
o Continuously improving maintenance and spare part management by trending
usage of spare parts for preventive and corrective maintenance
• Resource planning, both of crew and materials needed for operation and maintenance
• Tracing costs, as both materials and work hours are logged and linked to the work
orders
In the two next sections the technical hierarchy of SAP and consequence classification will
be explained.
Technical hierarchy
The technical hierarchy is the foundation of maintenance management. It describes the
technical structure of the MODU by uniquely identifying functional locations, often referred
to as tag numbers. It shows how main equipment are connected technically and shows the
physical relationship between main equipment, and underlying equipment, spare parts, as well
as other equipment. According to NORSOK Z-008 (2011), the purpose of the technical
hierarchy is:
• Showing technical interdependencies of the installation
• Retrieval of tags, equipment and spare parts
• Retrieval of documents and drawings
• Retrieval of historical maintenance data from CMMS
• Planning of operations
• Cost allocation and retrieval
• Planning and organization of the maintenance program
• Planning of corrective work
Functional locations is the identification of where equipment is located on the rig. DD use the
SFI coding standard for identification of functional locations. SFI coding is an acknowledged
system for creating a technical hierarchy of MODUs and vessels. The SFI standard is used
for building the system in a logical manner in the CMMS. This way all functional locations
7
Chapter 2 About Dolphin Drilling
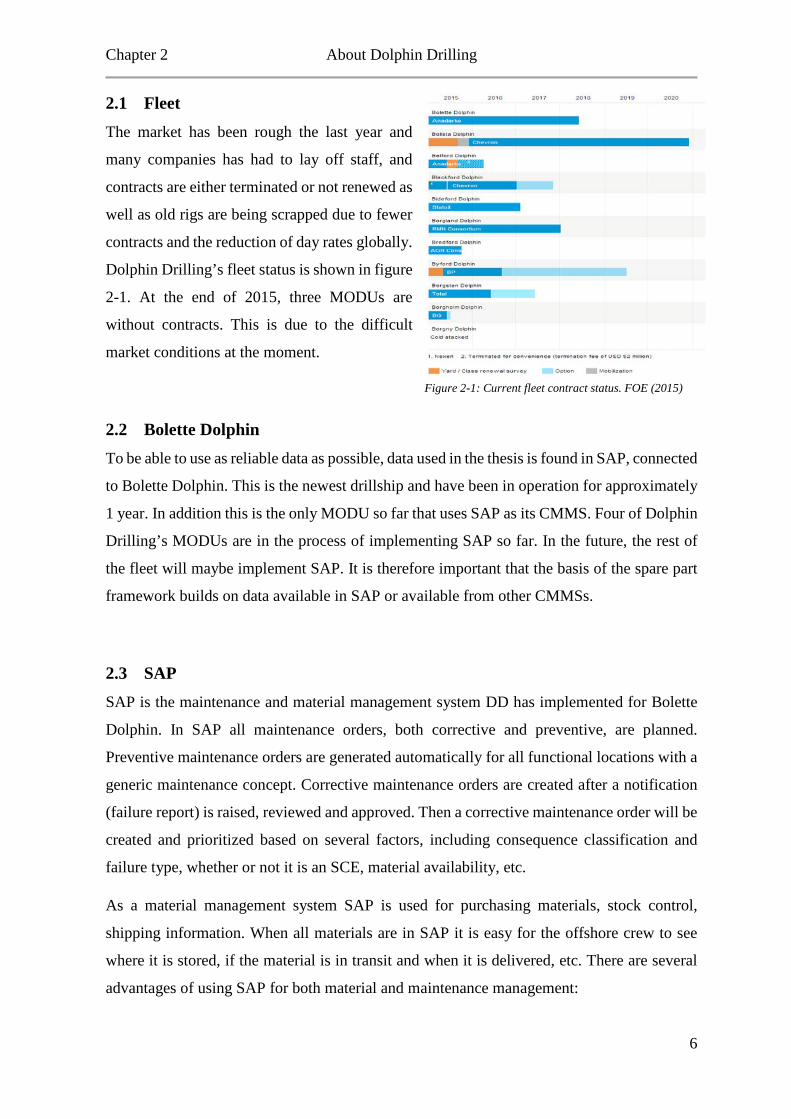
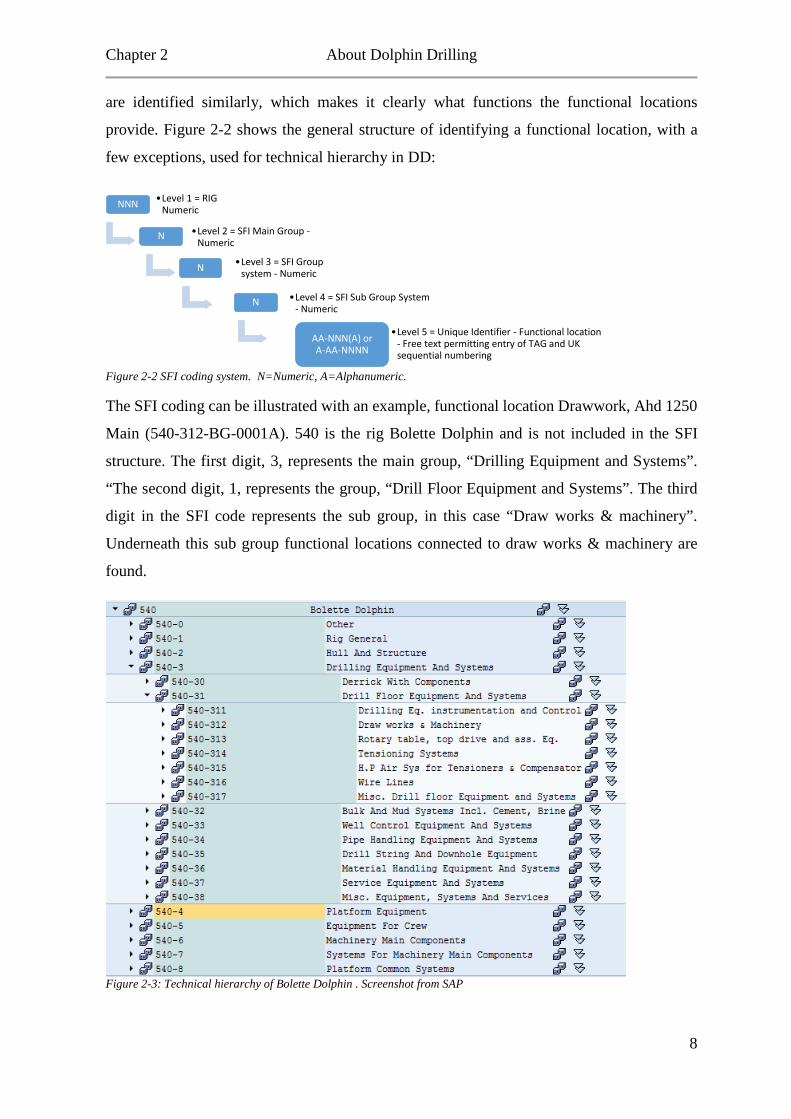
are identified similarly, which makes it clearly what functions the functional locations
provide. Figure 2-2 shows the general structure of identifying a functional location, with a
few exceptions, used for technical hierarchy in DD:
Figure 2-2 SFI coding system. N=Numeric, A=Alphanumeric.
The SFI coding can be illustrated with an example, functional location Drawwork, Ahd 1250
Main (540-312-BG-0001A). 540 is the rig Bolette Dolphin and is not included in the SFI
structure. The first digit, 3, represents the main group, “Drilling Equipment and Systems”.
“The second digit, 1, represents the group, “Drill Floor Equipment and Systems”. The third
digit in the SFI code represents the sub group, in this case “Draw works & machinery”.
Underneath this sub group functional locations connected to draw works & machinery are
found.
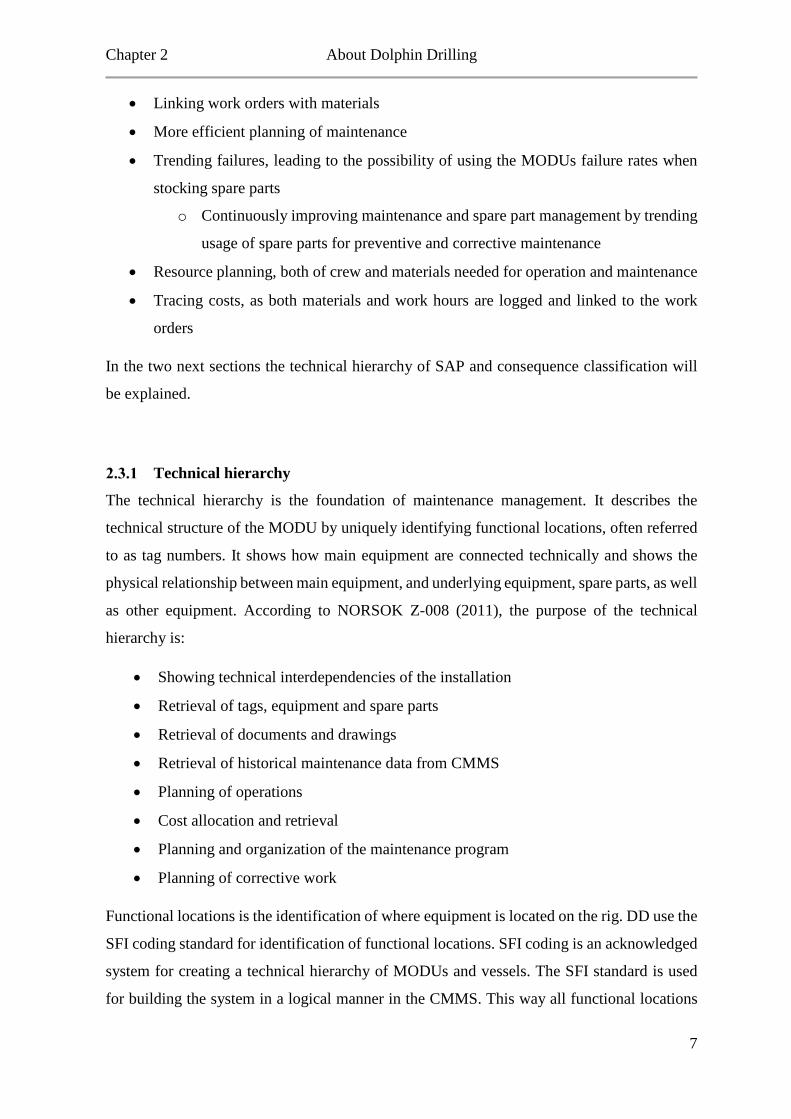
Figure 2-3: Technical hierarchy of Bolette Dolphin . Screenshot from SAP
NNN •Level 1 = RIG Numeric
N •Level 2 = SFI Main Group -Numeric
N •Level 3 = SFI Group system - Numeric
N •Level 4 = SFI Sub Group System - Numeric
AA-NNN(A) orA-AA-NNNN
•Level 5 = Unique Identifier - Functional location - Free text permitting entry of TAG and UK sequential numbering
8
Chapter 2 About Dolphin Drilling
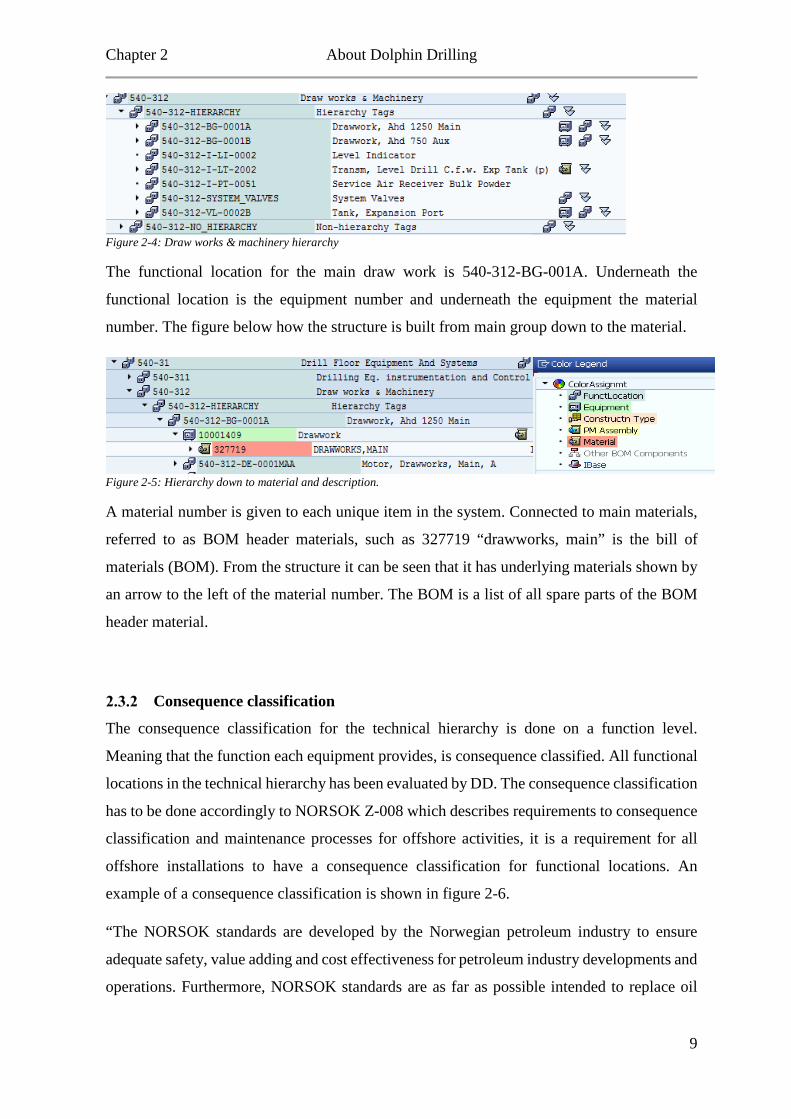
Figure 2-4: Draw works & machinery hierarchy
The functional location for the main draw work is 540-312-BG-001A. Underneath the
functional location is the equipment number and underneath the equipment the material
number. The figure below how the structure is built from main group down to the material.
Figure 2-5: Hierarchy down to material and description.
A material number is given to each unique item in the system. Connected to main materials,
referred to as BOM header materials, such as 327719 “drawworks, main” is the bill of
materials (BOM). From the structure it can be seen that it has underlying materials shown by
an arrow to the left of the material number. The BOM is a list of all spare parts of the BOM
header material.
Consequence classification
The consequence classification for the technical hierarchy is done on a function level.
Meaning that the function each equipment provides, is consequence classified. All functional
locations in the technical hierarchy has been evaluated by DD. The consequence classification
has to be done accordingly to NORSOK Z-008 which describes requirements to consequence
classification and maintenance processes for offshore activities, it is a requirement for all
offshore installations to have a consequence classification for functional locations. An
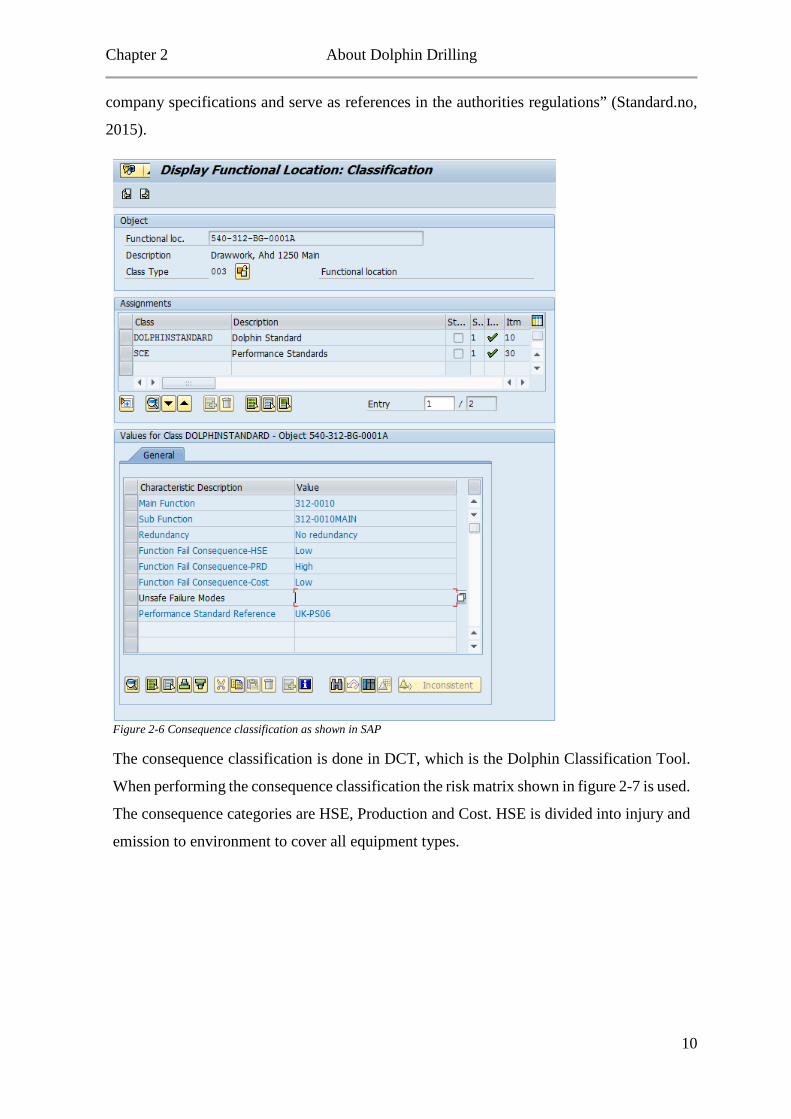
example of a consequence classification is shown in figure 2-6.
“The NORSOK standards are developed by the Norwegian petroleum industry to ensure
adequate safety, value adding and cost effectiveness for petroleum industry developments and
operations. Furthermore, NORSOK standards are as far as possible intended to replace oil
9
Chapter 2 About Dolphin Drilling
company specifications and serve as references in the authorities regulations” (Standard.no,
2015).
Figure 2-6 Consequence classification as shown in SAP
The consequence classification is done in DCT, which is the Dolphin Classification Tool.
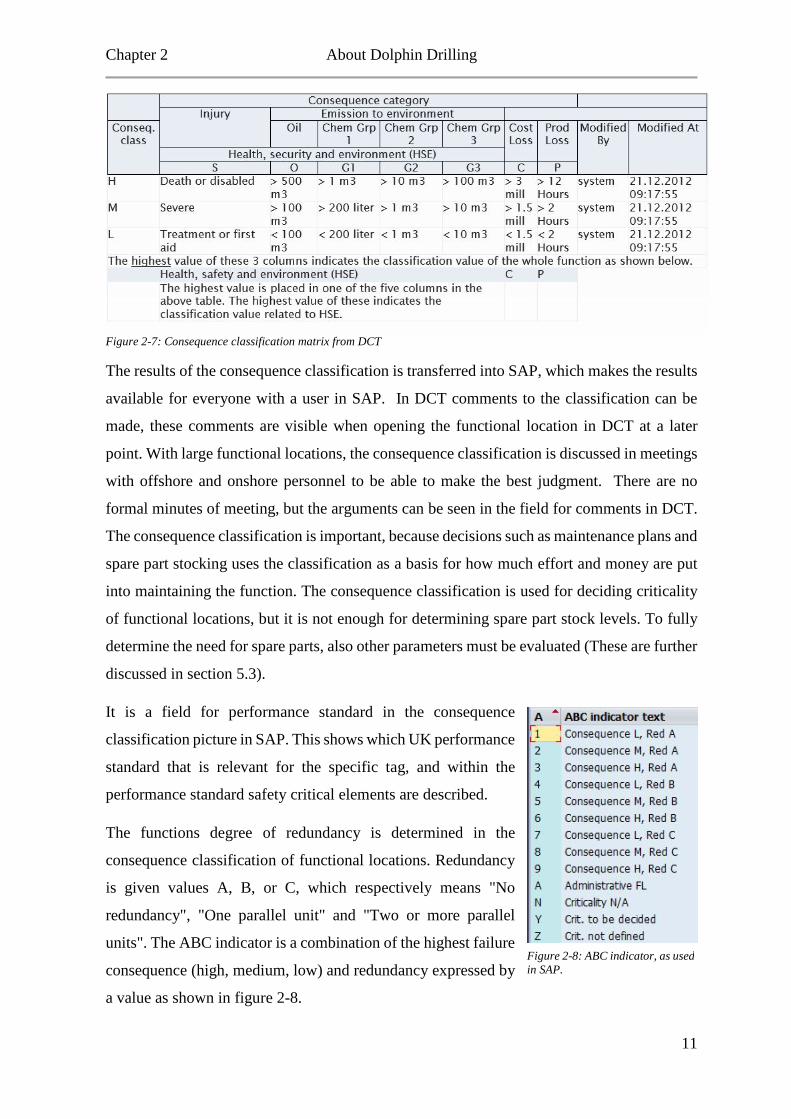
When performing the consequence classification the risk matrix shown in figure 2-7 is used.
The consequence categories are HSE, Production and Cost. HSE is divided into injury and
emission to environment to cover all equipment types.
10
Chapter 2 About Dolphin Drilling
Figure 2-7: Consequence classification matrix from DCT
The results of the consequence classification is transferred into SAP, which makes the results
available for everyone with a user in SAP. In DCT comments to the classification can be
made, these comments are visible when opening the functional location in DCT at a later
point. With large functional locations, the consequence classification is discussed in meetings
with offshore and onshore personnel to be able to make the best judgment. There are no
formal minutes of meeting, but the arguments can be seen in the field for comments in DCT.
The consequence classification is important, because decisions such as maintenance plans and
spare part stocking uses the classification as a basis for how much effort and money are put
into maintaining the function. The consequence classification is used for deciding criticality
of functional locations, but it is not enough for determining spare part stock levels. To fully
determine the need for spare parts, also other parameters must be evaluated (These are further
discussed in section 5.3).
It is a field for performance standard in the consequence
classification picture in SAP. This shows which UK performance
standard that is relevant for the specific tag, and within the
performance standard safety critical elements are described.
The functions degree of redundancy is determined in the
consequence classification of functional locations. Redundancy
is given values A, B, or C, which respectively means "No
redundancy", "One parallel unit" and "Two or more parallel
units". The ABC indicator is a combination of the highest failure
consequence (high, medium, low) and redundancy expressed by
a value as shown in figure 2-8.
Figure 2-8: ABC indicator, as used in SAP.
11
Chapter 3 Maintenance and spare parts theory
3 Maintenance and spare parts theory In the oil and gas industry different maintenance strategies are applied. In this chapter
maintenance is presented from a historical viewpoint, and main features of RCM is described.
DD has based their maintenance strategy on RCM and equipment manufacturers’
recommendations.
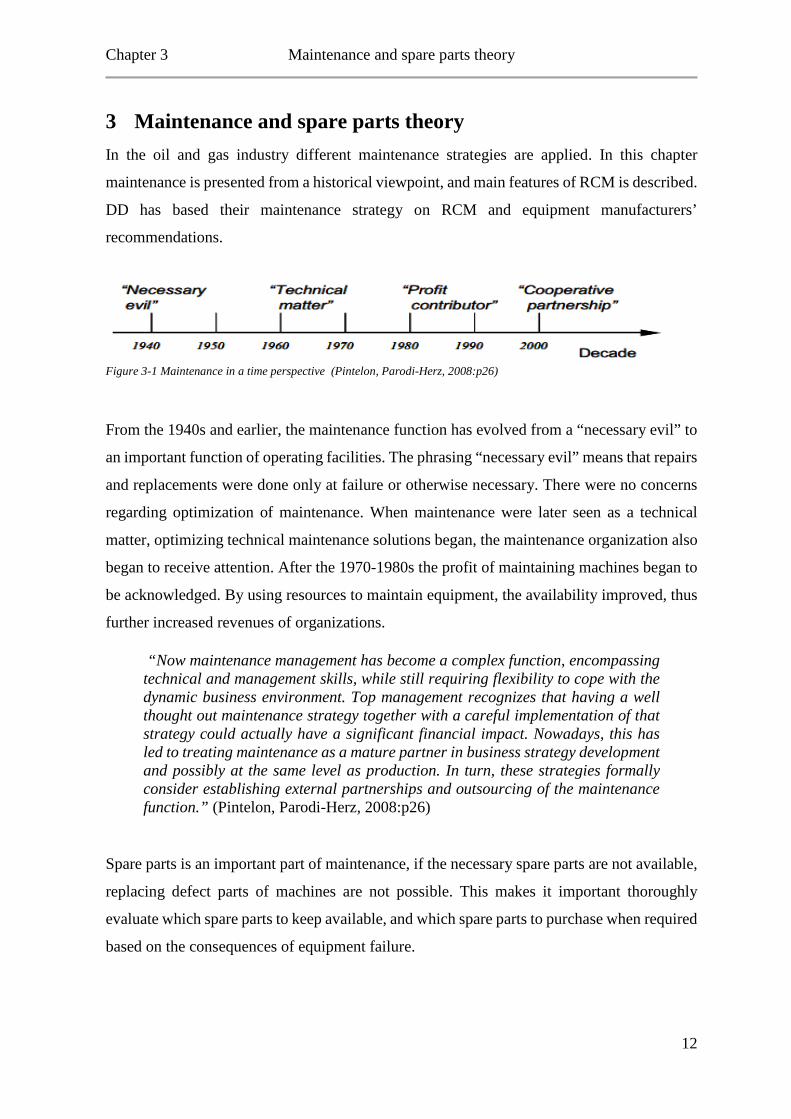
Figure 3-1 Maintenance in a time perspective (Pintelon, Parodi-Herz, 2008:p26)
From the 1940s and earlier, the maintenance function has evolved from a “necessary evil” to
an important function of operating facilities. The phrasing “necessary evil” means that repairs
and replacements were done only at failure or otherwise necessary. There were no concerns
regarding optimization of maintenance. When maintenance were later seen as a technical
matter, optimizing technical maintenance solutions began, the maintenance organization also
began to receive attention. After the 1970-1980s the profit of maintaining machines began to
be acknowledged. By using resources to maintain equipment, the availability improved, thus
further increased revenues of organizations.
“Now maintenance management has become a complex function, encompassing technical and management skills, while still requiring flexibility to cope with the dynamic business environment. Top management recognizes that having a well thought out maintenance strategy together with a careful implementation of that strategy could actually have a significant financial impact. Nowadays, this has led to treating maintenance as a mature partner in business strategy development and possibly at the same level as production. In turn, these strategies formally consider establishing external partnerships and outsourcing of the maintenance function.” (Pintelon, Parodi-Herz, 2008:p26)
Spare parts is an important part of maintenance, if the necessary spare parts are not available,
replacing defect parts of machines are not possible. This makes it important thoroughly
evaluate which spare parts to keep available, and which spare parts to purchase when required
based on the consequences of equipment failure.
12
Chapter 3 Maintenance and spare parts theory
3.1 Reliability centered maintenance According to the Electric Power Research Institute (EPRI, 1991) RCM is a systematic
consideration of system functions, the way functions can fail, and a priority-based
consideration of safety and economics that identifies applicable and effective PM tasks. “The
main objective of RMC is to reduce the maintenance cost, by focusing on the most important
functions of the system, and avoiding or removing maintenance actions that are not strictly
necessary” (Rausand, 1998). All maintenance tasks considered in RCM are related to failures
and functional degradation, and ensures the designed reliability of the equipment is realized.
The only way of improving a systems reliability is in the design phase, therefore it follows
that RCM does not improve the systems reliability, but it designed to ensure that the systems
reliability is maintained throughout its expected lifetime. It is also designed to balance costs
and benefits to obtain a cost efficient maintenance strategy. A common mistake is to believe
that a machines performance and reliability increases with amount of maintenance. This is a
mistake because often maintenance-induced failures occur, for instance oil contamination.
Each maintenance task in an RCM strategy address a failure mechanism and provide a
reduced expected loss related to function failure, personnel injuries, environmental damage,
production loss and material damage.
There are a variety of different ways to perform an RCM analysis, but the essence of the
analysis is always the same. Vatn (1996) has proposed a series of 12 steps to perform the
analysis.
1. Study preparation
2. System selection and definition
3. Functional failure analysis (FFA)
4. Critical item selection
5. Data collection and analysis
6. FMECA
7. Selection of maintenance actions
8. Determination of maintenance intervals
9. Preventive maintenance comparison analysis
10. Treatment of non-critical items
11. Implementation
12. In-Service data collection and updating
13
Chapter 3 Maintenance and spare parts theory
Step 1 and 2. Study preparation consists of establishing a project group and clarifying the
objectives and scope of the analysis. Documentation of the system chosen to analyze should
be made available. This include drawings, operation and maintenance manuals, piping and
instrumentation drawings, etc. System selection should be based on which systems that will
benefit of an analysis, and should be conducted on the highest practical level. In DD case this
is at sub-group or functional location level. The analysis is performed for all sub-groups of
the plant Bolette Dolphin, the sub-group or functional location will further be referred to as
systems. The reason for the highest possible level is that it makes the function definition easier
and more covering.
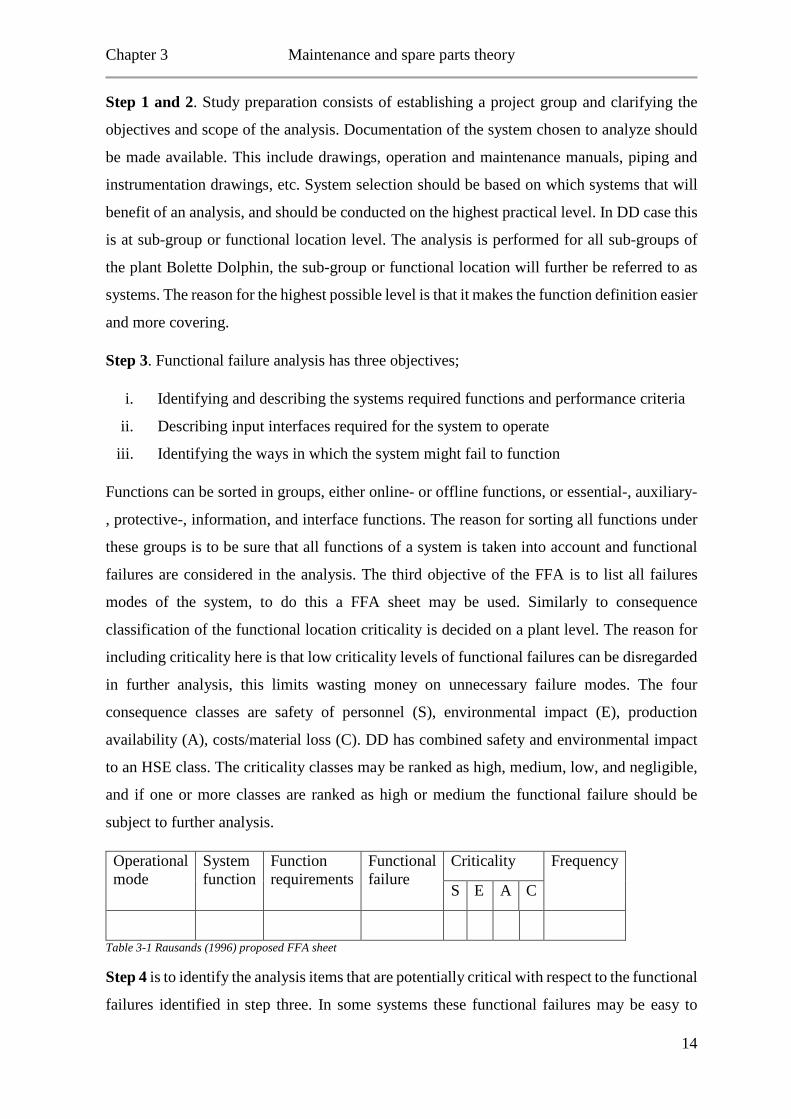
Step 3. Functional failure analysis has three objectives;
i. Identifying and describing the systems required functions and performance criteria
ii. Describing input interfaces required for the system to operate
iii. Identifying the ways in which the system might fail to function
Functions can be sorted in groups, either online- or offline functions, or essential-, auxiliary-
, protective-, information, and interface functions. The reason for sorting all functions under
these groups is to be sure that all functions of a system is taken into account and functional
failures are considered in the analysis. The third objective of the FFA is to list all failures
modes of the system, to do this a FFA sheet may be used. Similarly to consequence
classification of the functional location criticality is decided on a plant level. The reason for
including criticality here is that low criticality levels of functional failures can be disregarded
in further analysis, this limits wasting money on unnecessary failure modes. The four
consequence classes are safety of personnel (S), environmental impact (E), production
availability (A), costs/material loss (C). DD has combined safety and environmental impact
to an HSE class. The criticality classes may be ranked as high, medium, low, and negligible,
and if one or more classes are ranked as high or medium the functional failure should be
subject to further analysis.
Operational mode
System function
Function requirements
Functional failure
Criticality Frequency
S E A C
Table 3-1 Rausands (1996) proposed FFA sheet
Step 4 is to identify the analysis items that are potentially critical with respect to the functional
failures identified in step three. In some systems these functional failures may be easy to
14
Chapter 3 Maintenance and spare parts theory
identify, but for more complex systems these items demand more effort to find. They can
either be found by discussion or analyzing programs. These critical items are referred to as
functional significant items, or FSIs. It is also recommended to identify items with high failure
rate, high repair cost, low maintainability, long lead time for spare parts, or items requiring
external maintenance personnel, these items are referred to as maintenance significant items
(MSI). MSIs are analyzed to identify potential failure modes and effects in the FMECA in
step 6.
Step 5. Data collection and analysis is an important step, but often it is difficult to get reliable
data. Typical data needed to perform an FMECA is design data (capacity, equipment type),
operational and failure data (operating hours, failure times), and reliability data (MTTF,
aging). These data are either collected from operating experience, or data handbooks such as
OREDA. Although much external data are available it is important to be critical to such data
due to the course level and uncertainty associated with this data.
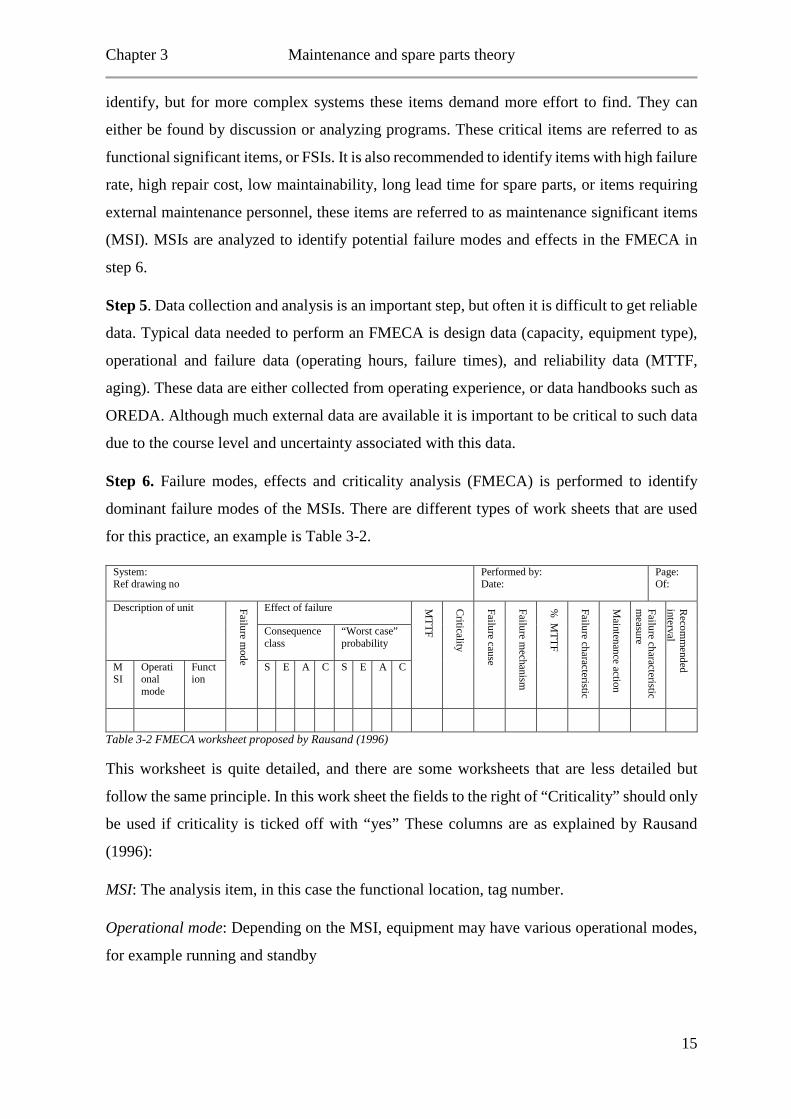
Step 6. Failure modes, effects and criticality analysis (FMECA) is performed to identify
dominant failure modes of the MSIs. There are different types of work sheets that are used
for this practice, an example is Table 3-2.
System: Ref drawing no
Performed by: Date:
Page: Of:
Description of unit Failure mode
Effect of failure MTTF
Criticality
Failure cause
Failure mechanism
% M
TTF
Failure characteristic
Maintenance action
Failure characteristic m
easure
Recom
mended
interval
Consequence class
“Worst case” probability
MSI
Operational mode
Function
S E A C S E A C
Table 3-2 FMECA worksheet proposed by Rausand (1996)
This worksheet is quite detailed, and there are some worksheets that are less detailed but
follow the same principle. In this work sheet the fields to the right of “Criticality” should only
be used if criticality is ticked off with “yes” These columns are as explained by Rausand
(1996):
MSI: The analysis item, in this case the functional location, tag number.
Operational mode: Depending on the MSI, equipment may have various operational modes,
for example running and standby
15
Chapter 3 Maintenance and spare parts theory
Function: Depending on the operational mode the equipment may have multiple functions,
such as close on demand for a valve.
Failure mode: The failure mode is the way a failure is observed, and defined as non-
fulfillment of a function.
Effect of failure: The effect of a failure is described in terms of the worst possible outcome
for S, E, A, C categories explained in step 3.
Worst case probability: The probability of an equipment failure giving the worst case
outcome. At this stage of the analysis, a descriptive measure of the probability may be used.
MTTF: Mean time to failure for each failure mode. The measure of MTTF may vary from
equipment to equipment depending on what is appropriate for the equipment in question. An
example may be hours of operation.
Criticality: This field is a yes/no field, and is determined by taking probability, MTTF and
failure effect into account. If they are ticked off as critical, the failure mode is dominant and
will be taken through the next steps.
Failure cause: There may be several failure causes for each failure mode. This is typically
component failures, or supporting equipment failure.
Failure mechanism: Examples of failure mechanisms are fatigue, wear, and corrosion.
% MTTF: A percentage of MTTF for each failure mechanism. This will only be an
approximation due to the interdependence of various failure mechanisms.
Failure characteristic: How the failure propagates. This can be divided in three classes. The
propagation may be measured by indicators (condition monitoring), as seen in gradual
failures. Age-dependent failures, typically seen when there is a predictable wear out limit. Or
complete randomness, referred to as sudden failures. The failure cannot be predicted by
indicators or age.
Maintenance action: For each failure mechanism there is an appropriate maintenance action,
this is found in step 7.
Failure characteristic measure: For gradual failures condition monitoring indicators may be
listed. Aging failures may be described by an aging parameter.
16
Chapter 3 Maintenance and spare parts theory
Recommended maintenance interval: The interval between consecutive maintenance tasks.
This length is determined in step 8.
Step 7. Selection of maintenance actions is where all dominant failure modes are analyzed to
find effective PM tasks, the ones marked with yes in the criticality column. It will be
determined if there are applicable and effective PM tasks, or if it is more economical to let
the item run to failure and carry out corrective maintenance. In general there are three reasons
for performing preventive maintenance; prevent failures, detect the propagation of failures,
or discovering hidden failures. Five different types of maintenance tasks are considered, with
different criteria to be applicable:
1. Scheduled on-condition task
2. Scheduled overhaul
3. Scheduled replacement
4. Scheduled function test and first line maintenance
5. Run to failure
Scheduled on condition tasks is tasks to determine the condition of an item, for example by
condition monitoring such as vibration measurements. This is only applicable if it is possible;
to detect reduced failure resistance for failure modes, to define a potential failure condition
that can be detected by an explicit task. And if there is a reasonable consistent age interval
between the detection of reduced failure resistance and time of failure.
Scheduled overhaul of equipment is performed before a specified age limit. This is seen
frequently in the offshore industry by requirements in the NORSOK standards for different
equipment, for example 5 year recertification of BOPs. This is applicable if there is an
identifiable age where there is a rapid increase in failure rate, a large proportion of the units
must survive to that age, and it is possible to restore the original failure resistance by repair.
Scheduled replacement of an item or parts of an item before a specified age limit is applicable
if the item is subject to a critical failure. Test data show that failures are not expected until a
specified age. The item is subject to failures causing major economic consequences. There is
an identifiable increase in the failure rate at a certain age. A large proportion of units must
survive to that age.
Scheduled function test and or first line maintenance such visual checks is scheduled
condition assessment tasks or inspections to identify failures. These kinds of tasks are
17
Chapter 3 Maintenance and spare parts theory
applicable if the item is subject to failures that is not evident under normal operation and no
other types of tasks is applicable and effective.
Run to failure will only be an option when no other tasks is possible or economically favorable
compared to failure consequences. Typically when the functional location failure
consequence is low. For example for small equipment which has low cost, are easy to replace,
and/or have redundancy.
These tasks and criteria are only meant as guidelines, and will not cover all situations.
Sometimes combinations of maintenance tasks are more suitable than only one type of task.
It must also be emphasized that preventive maintenance does not prevent all failures. Many
may be prevented or found before they have consequences, this is why maintenance is
important, but there will always be circumstances leading to failure beyond what is expected.
This may be a result of design error, misuse of the equipment or equipment standing still for
a period. When the maintenance tasks are decided it should be an easier exercise to choose
what spare parts that will frequently be needed. This can be seen from the functional failures
and failure modes identified by the FFA and FMECA, and one can compare these lists with
the recommended spare part lists provided by the equipment manufacturer.
Step 8. Most of the PM tasks are done at a regular basis. That means that the interval for the
PM tasks must be set, which is step 8 in Vatns (1996) 12 step process. Deciding the PM
interval is a difficult task, and has to be based on knowledge about the failure rate function,
consequences and cost of failure that the PM task is designed to prevent, as well as balancing
the interval with the cost of performing the PM task. Because the knowledge of failure rate
functions are often inaccessible, general guidelines regarding maintenance intervals from the
original equipment manufacturer is used as a starting point. After a while this interval is
evaluated, and the frequency is adjusted up or down. This is also how DD has established
their PM task intervals.
Step 9 is a preventive maintenance comparison analysis. There are two criteria for choosing
maintenance tasks in RCM analysis, and both need to be met. The two criteria is applicability
and cost effectiveness. A PM task is applicable if it can eliminate or reduce the probability of
a failure, or it can reduce the impact of a failure. The cost effectiveness criteria is met if the
maintenance task cost less than not performing the task. Or that the task is cheaper than the
failure the task is to prevent. Costs of PM tasks include both indirect and direct costs.
Examples of costs are:
18
Chapter 3 Maintenance and spare parts theory
• Costs related to maintenance induced failures
• Use and cost of physical resources, eg. spare parts
• Production unavailability during maintenance
• The risk that maintenance personnel are exposed to during PM tasks
Examples of failure costs are:
• Production unavailability (downtime)
• Emergency repair costs
Step 10. Treatment of non-MSIs. For non-MSIs a brief cost evaluation of the established may
be performed, and if it is found insignificant it is reasonable to continue this program. If not
it should be reduced for example by introducing longer intervals between PM tasks.
Step 11. Implementation. After the RCM analysis is finished and PM tasks and intervals are
decided, it is important to have dedicated personnel to implement the PM tasks in the CMMS,
in DD’ case SAP. This personnel should also train the performing maintenance personnel on
how the PM program is shown in the CMMS so it will be easy for the maintenance personnel
to find out which tasks they shall perform when.
Step 12. In-service data collection and updating. A major advantage with the RCM analysis
is that the basis of PM tasks are systematically analyzed and documented. It is therefore easy
to update the experience and information decisions are made from, this is an advantage
because the experience and information about failure rates before the analysis is often scarce.
When updating the information after failures, it may become evident that PM tasks should be
done differently or more frequent and thus the PM program will become better with years.
Spare parts are not the main focus of RCM analysis, but in the analysis and especially in the
FMECA step potential failures becomes clear. Based on that step it becomes evident which
spare parts that may be useful to have on site, or stocked onshore at a main warehouse. When
classifying failures as critical, one may also see a clearer picture of which spares that are
absolutely necessary to have in case of failure and full stop of the equipment. Some failures
cause downtime, in those cases it is important to have the necessary spare parts available, or
at least in the main warehouse.
19
Chapter 3 Maintenance and spare parts theory
3.2 Spare parts There are four main categories of spare parts, capital/insurance spare parts, operational spare
parts, consumables, and obsolete spare parts. Capital spares are only stocked in the cases when
failure of an equipment will cause long operational down time due to long repair times and
long lead times. An example is keeping an extra BOP in case of failure. If the subsea BOP
fails, it will typically take two days to raise the BOP from the seafloor then x hours to repair
it and then two days to put it back on the seafloor in addition to the time needed to provide
spare parts, or a complete BOP. If there is a major failure which takes long to repair, lost
income due to down time quickly is saved by having a backup BOP. Operational spares are
spare parts used for maintenance activities and forecasted breakdowns/failures, these spares
may be repairable. Consumables are spares that are used once and scrapped at failure.
Obsolete parts can be seen as dead inventory, or parts that belong to equipment that is
removed, and has been left in the inventory and induce an extra cost.
Recent maintenance research classifies spare parts differently, using different measures of
criticality and parameters. To further complicate spare part classification, different
researchers rely on different factors in order to classify types of spare parts as well as different
classes to put spare parts in. Important factors for spare part classification are; criticality
classification of the functional location, consequence of non-availability of part, lead-time,
and cost. This list is not exhaustive, as other factors may influence spare parts depending on
the facility, and organization/company preferences.
NORSOK Z-008 (2011) gives an example of classification of spare parts. This is as follows.
• Capital Spare Part o Vital to the function of the plant, but unlikely to suffer a fault
during the lifetime of the equipment; o Delivered with unacceptably long lead time from the
supplier and usually very expensive; o Often these spare parts are characterised by a substantially
lower cost if they are included with the initial order of the system package;
20
Chapter 3 Maintenance and spare parts theory
• Operational Spare Parts o Spare parts required to maintain the operational and safety
capabilities of the equipment during its normal operational lifetime;
• Consumables; o Item or material that is not item specific and intended for use
only once (non-repairable).
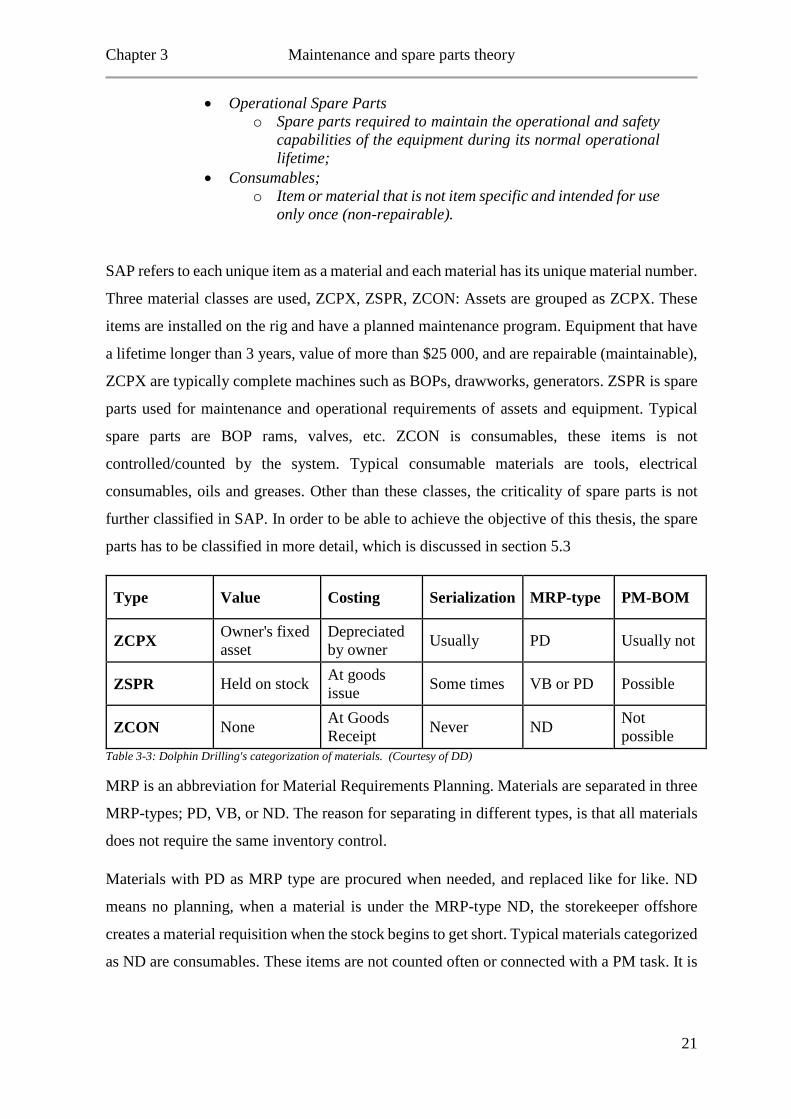
SAP refers to each unique item as a material and each material has its unique material number.
Three material classes are used, ZCPX, ZSPR, ZCON: Assets are grouped as ZCPX. These
items are installed on the rig and have a planned maintenance program. Equipment that have
a lifetime longer than 3 years, value of more than $25 000, and are repairable (maintainable),
ZCPX are typically complete machines such as BOPs, drawworks, generators. ZSPR is spare
parts used for maintenance and operational requirements of assets and equipment. Typical
spare parts are BOP rams, valves, etc. ZCON is consumables, these items is not
controlled/counted by the system. Typical consumable materials are tools, electrical
consumables, oils and greases. Other than these classes, the criticality of spare parts is not
further classified in SAP. In order to be able to achieve the objective of this thesis, the spare
parts has to be classified in more detail, which is discussed in section 5.3
Type Value Costing Serialization MRP-type PM-BOM
ZCPX Owner's fixed asset
Depreciated by owner Usually PD Usually not
ZSPR Held on stock At goods issue Some times VB or PD Possible
ZCON None At Goods Receipt Never ND Not
possible Table 3-3: Dolphin Drilling's categorization of materials. (Courtesy of DD)
MRP is an abbreviation for Material Requirements Planning. Materials are separated in three
MRP-types; PD, VB, or ND. The reason for separating in different types, is that all materials
does not require the same inventory control.
Materials with PD as MRP type are procured when needed, and replaced like for like. ND
means no planning, when a material is under the MRP-type ND, the storekeeper offshore
creates a material requisition when the stock begins to get short. Typical materials categorized
as ND are consumables. These items are not counted often or connected with a PM task. It is
21
Chapter 3 Maintenance and spare parts theory
not set a reorder point or a maximum stock level. It is only important that the items are
available.
VB MRP-type is manual reorder point planning. All materials with MRP-type VB has a
reorder point and maximum stock level in SAP. The reorder point and maximum stock level
are set based on the needs flagged by different disciplines, and are in many cases too high.
For VB items, the storekeeper create material requisitions based on counting lists and
consumption. When the stock level is at or close to the reorder point he/she will create a
purchase requisition for the material.
PM-BOM means that a bill of materials can be attached to the preventive maintenance task.
When a purchase requisition has been made by the storekeeper offshore, saying “we need
these materials”, this goes to the procurement department onshore which handles the purchase
requisition further. The onshore purchaser finds the best suited vendor and makes sure DD
gets the best price and delivery terms.
Criticality classification of spare parts
Materials has now been classified as capital spares, spare parts, and consumables. This does
not say much about how important it is, or how many that should be stocked. To determine
importance of each spare part, a more detailed classification must be done. There are many
different methods of classifying spare parts, and analyses such as ABC and VED (Vital,
Essential, Desirable) are commonly used for inventory control. Much of the research
regarding spare part classification and optimization is directed towards production systems
and supply chain management, and take advantage of predictable behavior when optimizing
inventories.
ABC analysis classifies spare parts within classes A, B and C depending on value of the spare
parts (Niebel, 1994, pp 112-113). Class A represents approximately 10-15% of the total items,
but the monetary value is between 70-85% of the total inventory. Class B represents
approximately 20-30% of the items, but approximately 25% of the total inventory value. Class
C represents 60-70% of the items, but only approximately 10% of the inventory value. Class
A require most inventory control. Class B require less control, and class C the least amount
of inventory control. This is due to the large differences in inventory value of the different
classes. The differences of value makes class A most profitable to reduce by improving spare
part strategy.
22
Chapter 3 Maintenance and spare parts theory
VED analysis aims to classify spare parts according to their criticality for the facility. The
degree of criticality of production is determined by stating a spare part is vital for the
production process, essential for the production process, or desirable for the production
process. For DDs case, this criticality can be based on the consequence classification of the
functional location the spare part belongs to.
To solve the objective of this thesis, these classification methods are insufficient, as there are
several other parameters that has to be taken into consideration for an organization operating
MODUs. Gajpal et al. (1994) suggests using the analytical hierarchy process (AHP) for
determining criticality of spare parts as vital, desirable and desirable. This process
quantitatively determines a spare parts importance and in the end classifying it as vital,
essential or desirable. In the thesis this process was used to weigh parameters of the functional
location and material against each other, in order to find the most influential parameter (this
process is explained in section 5.3). In the thesis this technique had to be used because some
characteristics are more important than other when deciding stock levels of spare parts. In the
thesis a separate spare part classification has been implemented, instead of classifying spare
parts corresponding to the consequence classification of the functional location, as material
attributes such as number installed and lead time are important when deciding stock levels.
Rules and regulations regarding spare parts
The Petroleum Safety Authority Norway (PSA) has in the activities regulations has defined a
set of rules and regulations all actors has to follow, in order to be allowed to operate on the
NCS. Among this set of regulations chapter IX covers maintenance activities. Section 46,
classification states that:
Facilities' systems and equipment shall be classified as regards the health, safety and environment consequences of potential functional failures. For functional failures that can lead to serious consequences, the responsible party shall identify the various fault modes with associated failure causes and failure mechanisms, and predict the likelihood of failure for the individual fault mode. The classification shall be used as a basis in choosing maintenance activities and maintenance frequencies, in prioritising between different maintenance activities and in evaluating the need for spare parts. (PSA, 2015):
This regulation is covered by the consequence classification and RCM analysis. As the
framework incorporates the classification when deciding spare parts it is operating within the
23
Chapter 3 Maintenance and spare parts theory
regulation of PSA. In addition to rules and regulations enforced by PSA, there are
recommended practices from the American Petroleum Institute (API) which most drilling
actors follow. Within the API standards they recommend minimum stock levels for different
equipment, for example well barrier equipment such as the kill and choke manifold.
From API recommended practice 53 (1997) concerning blowout prevention equipment
systems for drilling wells:
An adequate supply of spare parts is important for components subject to wear or damage or whose failure seriously reduces the effectiveness of the manifold. Standardization of components is recommended to minimize the inventory required. Although the inventory will vary from rig to rig, a generalized recommended minimum spare part list includes:
a) One complete valve for each size installed. b) Two repair kits for each valve size utilized. c) Parts for manually adjustable chokes, such as flow tips, inserts, packing,
gaskets, O-rings, disc assemblies, and wear sleeves … API, (1997, p19)
The API recommended practices are updated from time to time and it is important to have the
latest edition. As an example API recommended practice 53, was revised in 2012 and
incorporated as a standard, not only recommended practice. As the framework is created in
order to lower the spare part inventory, it is difficult to include all such recommended
standards, and regulations, and it is encouraged that the user has knowledge concerning the
use of such standards. Whenever a standard is applicable for spare part inventory of
equipment, it is suggested to use that as a minimum requirement, and if the framework decides
higher number of spare parts then the framework sshould be used.
24
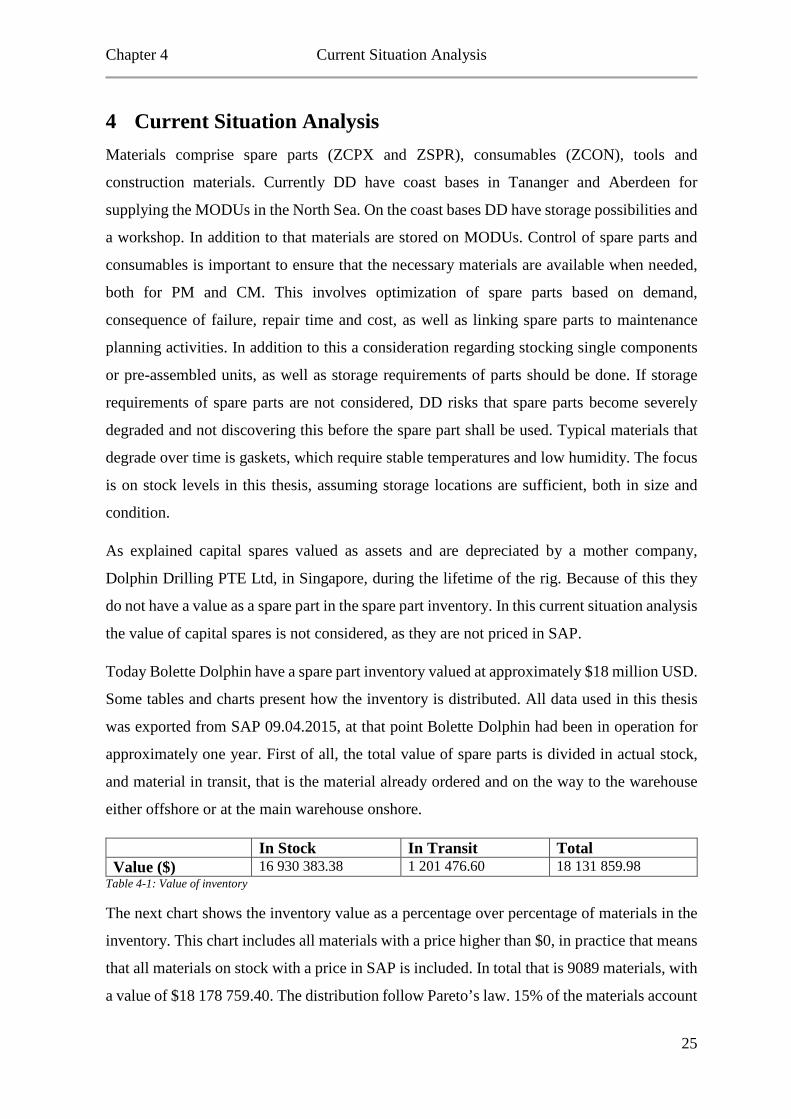
Chapter 4 Current Situation Analysis
4 Current Situation Analysis Materials comprise spare parts (ZCPX and ZSPR), consumables (ZCON), tools and
construction materials. Currently DD have coast bases in Tananger and Aberdeen for
supplying the MODUs in the North Sea. On the coast bases DD have storage possibilities and
a workshop. In addition to that materials are stored on MODUs. Control of spare parts and
consumables is important to ensure that the necessary materials are available when needed,
both for PM and CM. This involves optimization of spare parts based on demand,
consequence of failure, repair time and cost, as well as linking spare parts to maintenance
planning activities. In addition to this a consideration regarding stocking single components
or pre-assembled units, as well as storage requirements of parts should be done. If storage
requirements of spare parts are not considered, DD risks that spare parts become severely
degraded and not discovering this before the spare part shall be used. Typical materials that
degrade over time is gaskets, which require stable temperatures and low humidity. The focus
is on stock levels in this thesis, assuming storage locations are sufficient, both in size and
condition.
As explained capital spares valued as assets and are depreciated by a mother company,
Dolphin Drilling PTE Ltd, in Singapore, during the lifetime of the rig. Because of this they
do not have a value as a spare part in the spare part inventory. In this current situation analysis
the value of capital spares is not considered, as they are not priced in SAP.
Today Bolette Dolphin have a spare part inventory valued at approximately $18 million USD.
Some tables and charts present how the inventory is distributed. All data used in this thesis
was exported from SAP 09.04.2015, at that point Bolette Dolphin had been in operation for
approximately one year. First of all, the total value of spare parts is divided in actual stock,
and material in transit, that is the material already ordered and on the way to the warehouse
either offshore or at the main warehouse onshore.
In Stock In Transit Total Value ($) 16 930 383.38 1 201 476.60 18 131 859.98
Table 4-1: Value of inventory
The next chart shows the inventory value as a percentage over percentage of materials in the
inventory. This chart includes all materials with a price higher than $0, in practice that means
that all materials on stock with a price in SAP is included. In total that is 9089 materials, with
a value of $18 178 759.40. The distribution follow Pareto’s law. 15% of the materials account
25
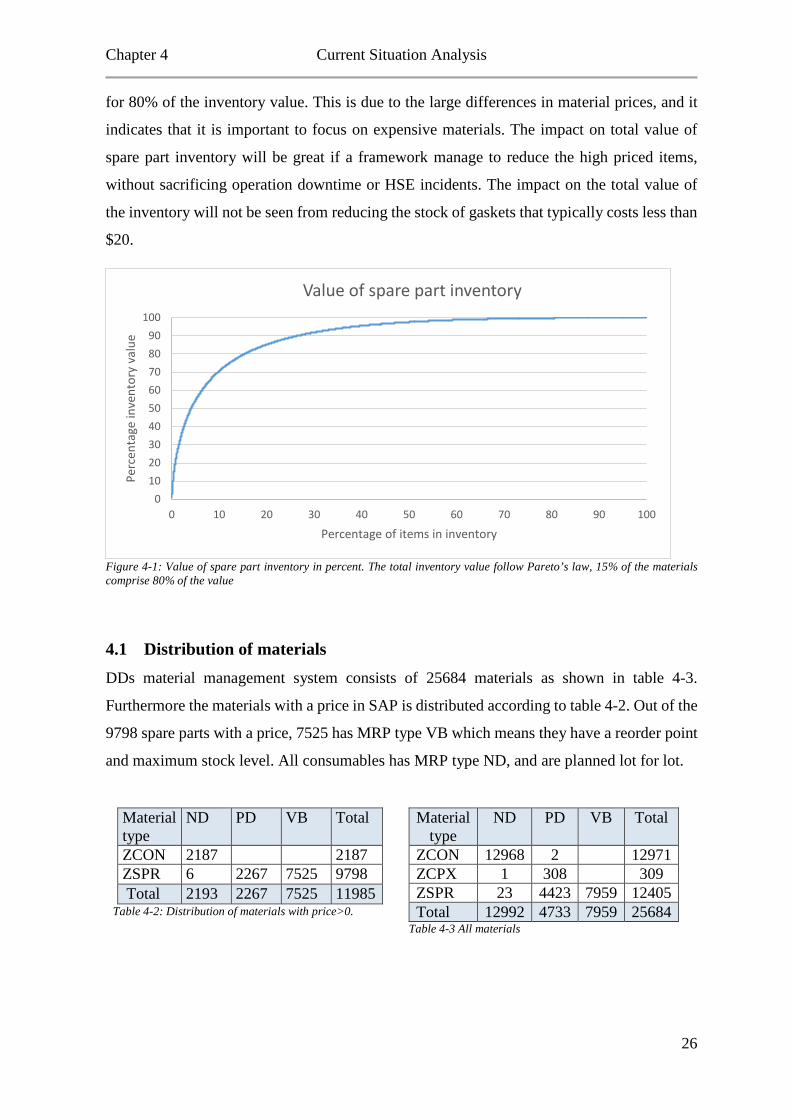
Chapter 4 Current Situation Analysis
for 80% of the inventory value. This is due to the large differences in material prices, and it
indicates that it is important to focus on expensive materials. The impact on total value of
spare part inventory will be great if a framework manage to reduce the high priced items,
without sacrificing operation downtime or HSE incidents. The impact on the total value of
the inventory will not be seen from reducing the stock of gaskets that typically costs less than
$20.
Figure 4-1: Value of spare part inventory in percent. The total inventory value follow Pareto’s law, 15% of the materials comprise 80% of the value
4.1 Distribution of materials DDs material management system consists of 25684 materials as shown in table 4-3.
Furthermore the materials with a price in SAP is distributed according to table 4-2. Out of the
9798 spare parts with a price, 7525 has MRP type VB which means they have a reorder point
and maximum stock level. All consumables has MRP type ND, and are planned lot for lot.
Material type
ND PD VB Total
ZCON 2187 2187 ZSPR 6 2267 7525 9798 Total 2193 2267 7525 11985
Table 4-2: Distribution of materials with price>0.
Material type
ND PD VB Total
ZCON 12968 2 12971 ZCPX 1 308 309 ZSPR 23 4423 7959 12405 Total 12992 4733 7959 25684
Table 4-3 All materials
0102030405060708090
100
0 10 20 30 40 50 60 70 80 90 100
Perc
enta
ge in
vent
ory
valu
e
Percentage of items in inventory
Value of spare part inventory
26
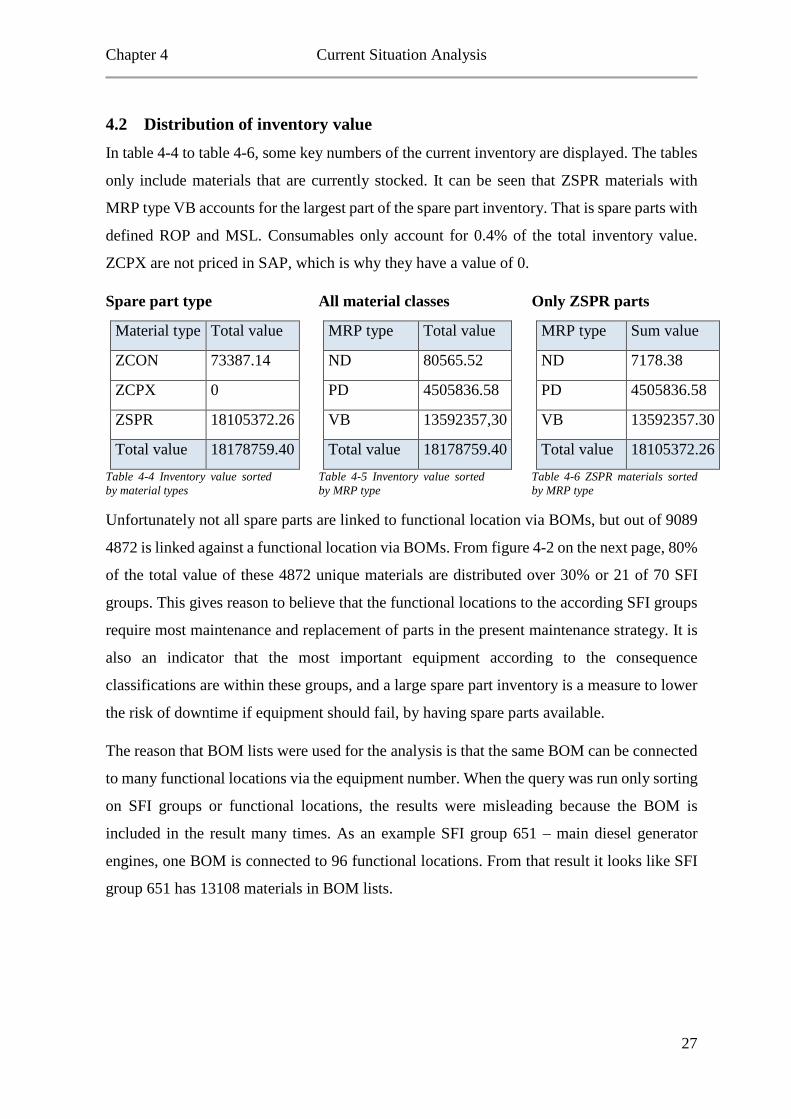
Chapter 4 Current Situation Analysis
4.2 Distribution of inventory value In table 4-4 to table 4-6, some key numbers of the current inventory are displayed. The tables
only include materials that are currently stocked. It can be seen that ZSPR materials with
MRP type VB accounts for the largest part of the spare part inventory. That is spare parts with
defined ROP and MSL. Consumables only account for 0.4% of the total inventory value.
ZCPX are not priced in SAP, which is why they have a value of 0.
Spare part type
Material type Total value
ZCON 73387.14
ZCPX 0
ZSPR 18105372.26
Total value 18178759.40 Table 4-4 Inventory value sorted by material types
All material classes
MRP type Total value
ND 80565.52
PD 4505836.58
VB 13592357,30
Total value 18178759.40 Table 4-5 Inventory value sorted by MRP type
Only ZSPR parts
MRP type Sum value
ND 7178.38
PD 4505836.58
VB 13592357.30
Total value 18105372.26 Table 4-6 ZSPR materials sorted by MRP type
Unfortunately not all spare parts are linked to functional location via BOMs, but out of 9089
4872 is linked against a functional location via BOMs. From figure 4-2 on the next page, 80%
of the total value of these 4872 unique materials are distributed over 30% or 21 of 70 SFI
groups. This gives reason to believe that the functional locations to the according SFI groups
require most maintenance and replacement of parts in the present maintenance strategy. It is
also an indicator that the most important equipment according to the consequence
classifications are within these groups, and a large spare part inventory is a measure to lower
the risk of downtime if equipment should fail, by having spare parts available.
The reason that BOM lists were used for the analysis is that the same BOM can be connected
to many functional locations via the equipment number. When the query was run only sorting
on SFI groups or functional locations, the results were misleading because the BOM is
included in the result many times. As an example SFI group 651 – main diesel generator
engines, one BOM is connected to 96 functional locations. From that result it looks like SFI
group 651 has 13108 materials in BOM lists.
27
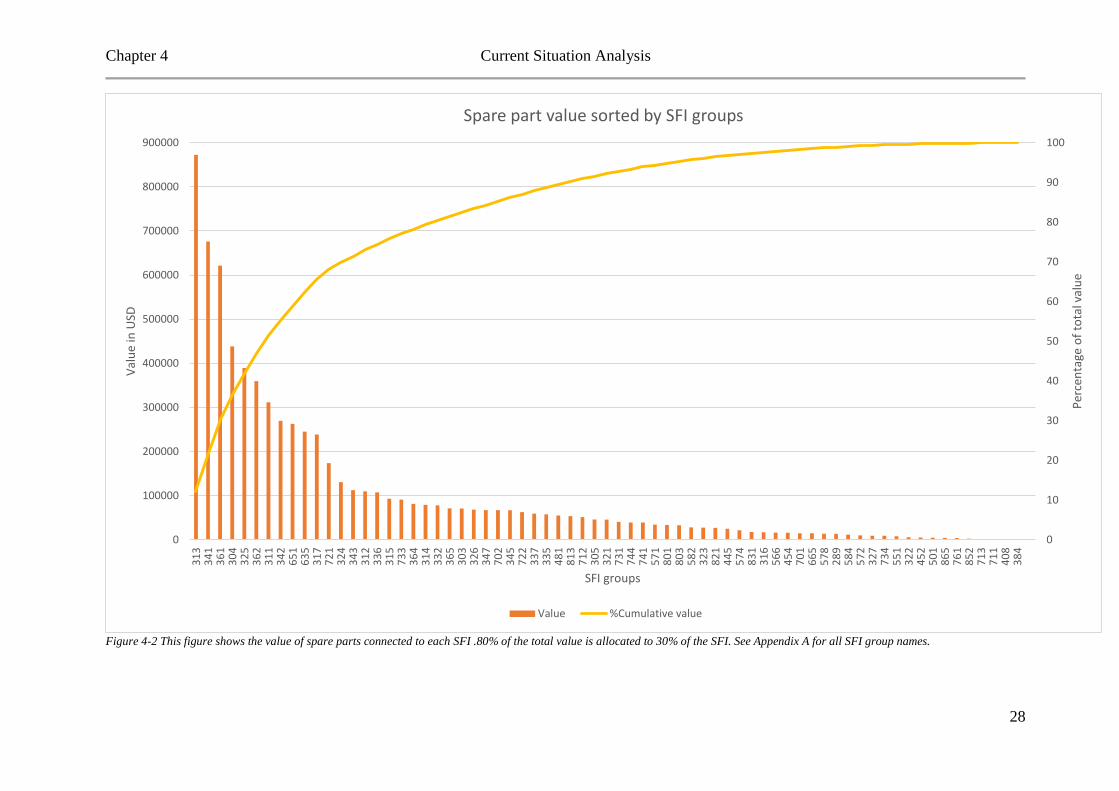
Chapter 4 Current Situation Analysis
Figure 4-2 This figure shows the value of spare parts connected to each SFI .80% of the total value is allocated to 30% of the SFI. See Appendix A for all SFI group names.
0
10
20
30
40
50
60
70
80
90
100
0
100000
200000
300000
400000
500000
600000
700000
800000
900000
313
341
361
304
325
362
311
342
651
635
317
721
324
343
312
336
315
733
364
314
332
365
303
326
347
702
345
722
337
335
481
813
712
305
321
731
744
741
571
801
803
582
323
821
445
574
831
316
566
454
701
665
578
289
584
572
327
734
551
322
452
501
865
761
852
713
711
408
384
Perc
enta
ge o
f tot
al v
alue
Valu
e in
USD
SFI groups
Spare part value sorted by SFI groups
Value %Cumulative value
28
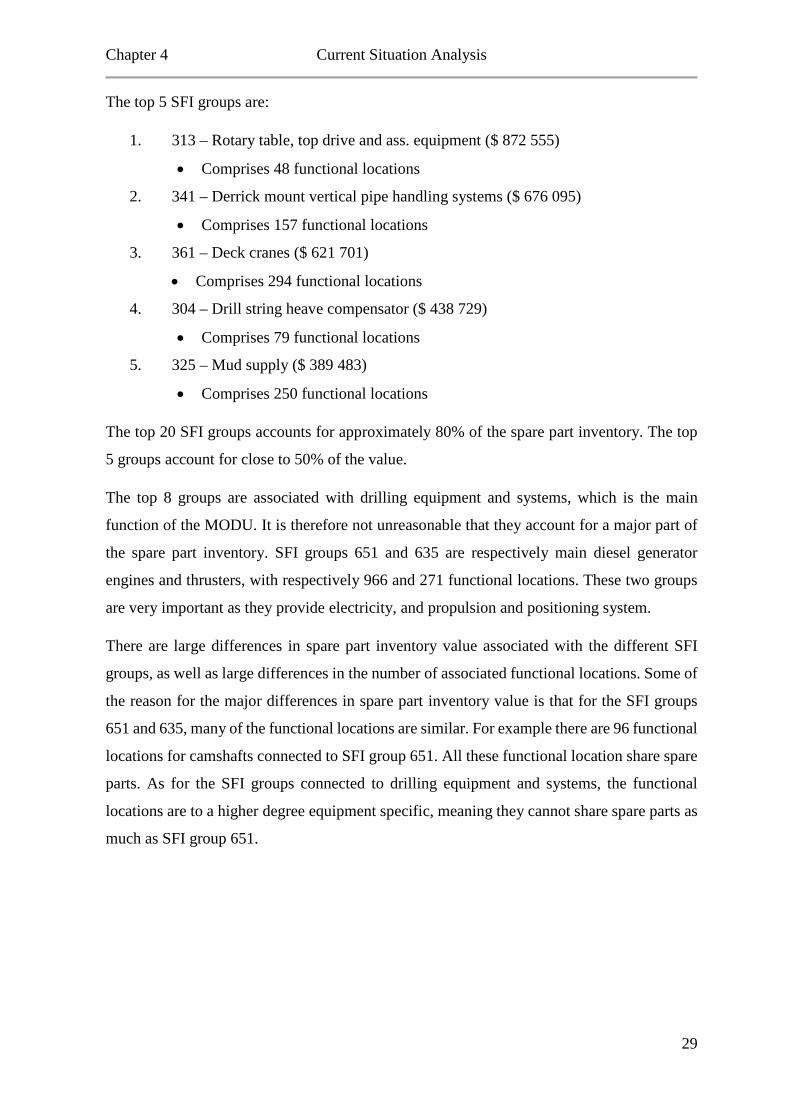
Chapter 4 Current Situation Analysis
The top 5 SFI groups are:
1. 313 – Rotary table, top drive and ass. equipment ($ 872 555)
• Comprises 48 functional locations
2. 341 – Derrick mount vertical pipe handling systems ($ 676 095)
• Comprises 157 functional locations
3. 361 – Deck cranes ($ 621 701)
• Comprises 294 functional locations
4. 304 – Drill string heave compensator ($ 438 729)
• Comprises 79 functional locations
5. 325 – Mud supply ($ 389 483)
• Comprises 250 functional locations
The top 20 SFI groups accounts for approximately 80% of the spare part inventory. The top
5 groups account for close to 50% of the value.
The top 8 groups are associated with drilling equipment and systems, which is the main
function of the MODU. It is therefore not unreasonable that they account for a major part of
the spare part inventory. SFI groups 651 and 635 are respectively main diesel generator
engines and thrusters, with respectively 966 and 271 functional locations. These two groups
are very important as they provide electricity, and propulsion and positioning system.
There are large differences in spare part inventory value associated with the different SFI
groups, as well as large differences in the number of associated functional locations. Some of
the reason for the major differences in spare part inventory value is that for the SFI groups
651 and 635, many of the functional locations are similar. For example there are 96 functional
locations for camshafts connected to SFI group 651. All these functional location share spare
parts. As for the SFI groups connected to drilling equipment and systems, the functional
locations are to a higher degree equipment specific, meaning they cannot share spare parts as
much as SFI group 651.
29
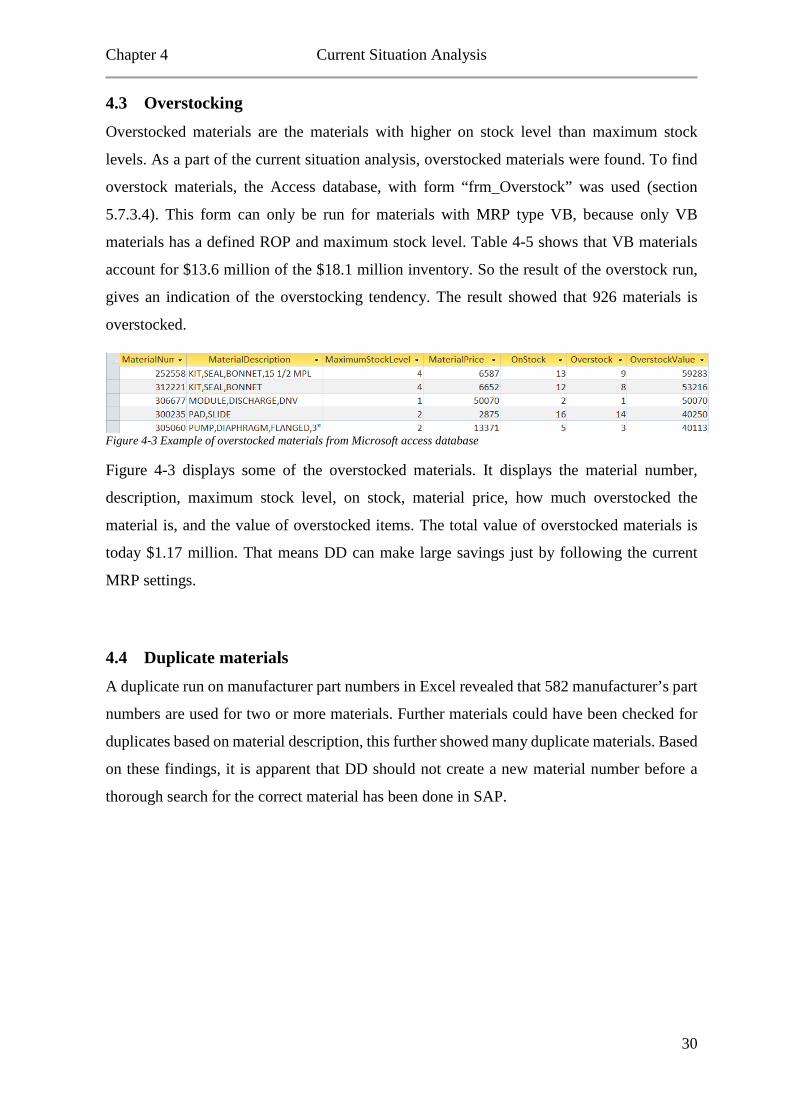
Chapter 4 Current Situation Analysis
4.3 Overstocking Overstocked materials are the materials with higher on stock level than maximum stock
levels. As a part of the current situation analysis, overstocked materials were found. To find
overstock materials, the Access database, with form “frm_Overstock” was used (section
5.7.3.4). This form can only be run for materials with MRP type VB, because only VB
materials has a defined ROP and maximum stock level. Table 4-5 shows that VB materials
account for $13.6 million of the $18.1 million inventory. So the result of the overstock run,
gives an indication of the overstocking tendency. The result showed that 926 materials is
overstocked.
Figure 4-3 Example of overstocked materials from Microsoft access database
Figure 4-3 displays some of the overstocked materials. It displays the material number,
description, maximum stock level, on stock, material price, how much overstocked the
material is, and the value of overstocked items. The total value of overstocked materials is
today $1.17 million. That means DD can make large savings just by following the current
MRP settings.
4.4 Duplicate materials A duplicate run on manufacturer part numbers in Excel revealed that 582 manufacturer’s part
numbers are used for two or more materials. Further materials could have been checked for
duplicates based on material description, this further showed many duplicate materials. Based
on these findings, it is apparent that DD should not create a new material number before a
thorough search for the correct material has been done in SAP.
30
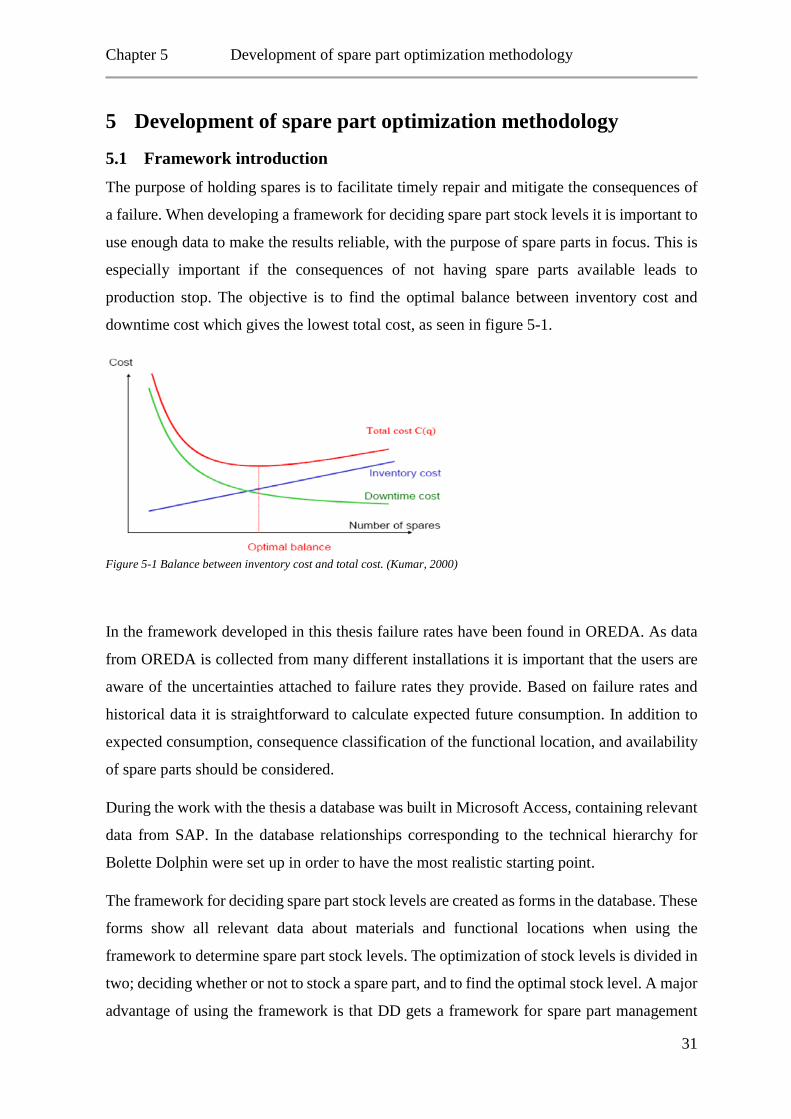
Chapter 5 Development of spare part optimization methodology
5 Development of spare part optimization methodology
5.1 Framework introduction The purpose of holding spares is to facilitate timely repair and mitigate the consequences of
a failure. When developing a framework for deciding spare part stock levels it is important to
use enough data to make the results reliable, with the purpose of spare parts in focus. This is
especially important if the consequences of not having spare parts available leads to
production stop. The objective is to find the optimal balance between inventory cost and
downtime cost which gives the lowest total cost, as seen in figure 5-1.
Figure 5-1 Balance between inventory cost and total cost. (Kumar, 2000)
In the framework developed in this thesis failure rates have been found in OREDA. As data
from OREDA is collected from many different installations it is important that the users are
aware of the uncertainties attached to failure rates they provide. Based on failure rates and
historical data it is straightforward to calculate expected future consumption. In addition to
expected consumption, consequence classification of the functional location, and availability
of spare parts should be considered.
During the work with the thesis a database was built in Microsoft Access, containing relevant
data from SAP. In the database relationships corresponding to the technical hierarchy for
Bolette Dolphin were set up in order to have the most realistic starting point.
The framework for deciding spare part stock levels are created as forms in the database. These
forms show all relevant data about materials and functional locations when using the
framework to determine spare part stock levels. The optimization of stock levels is divided in
two; deciding whether or not to stock a spare part, and to find the optimal stock level. A major
advantage of using the framework is that DD gets a framework for spare part management
31
Chapter 5 Development of spare part optimization methodology
which easily can be implemented across the organization and used to justify the spare part
inventory. The three main functions of the framework are;
• Deciding if a spare part should be stocked or stocked when required
• Recommending a stock level for spare parts
• Showing overstock materials, in order to increase focus on high stock levels.
5.2 First decision: Stock or stock at failure When managing the spare part inventory, two questions needs to be answered: “Do we need
to stock this item?” If yes, then the following question is: “How many do we need to stock?”
Many considerations have to be made when deciding whether to stock spare parts or not. The
OEM has their recommendations, the operational importance of the equipment, the
availability of parts in the market, operational personnel’s opinions, as well as the company’s
financial strength. Because all these considerations are made continuously there are often no
specific procedure to follow when deciding to stock spare parts or not. This thesis combines
some of these considerations in order to create a framework that gives a clear and reproducible
answer to the question about the necessity of the spare part.
During the work with the thesis a decision criteria for stocking materials or not was defined:
If the costs of stocking the spare part is lower than the costs of stocking at failure, the spare
part should be stocked. In addition the probability of failure should be considered. If the
probability is high, the material should be stocked, as it probably is necessary after some time
of operation. This judgement is the basis of the first decision criteria; to stock a material or
buy it when required. The costs of stocking at failure is to a high degree related to operational
downtime and potential chain reactions causing further damage to the equipment after the
initial failure. Possible costs of not having certain materials at hand may be that repair or
improvement work is delayed causing further damage to the equipment or structure that
should have been repaired. Thus the scope of the repair becomes bigger than it would have
been if it is done shortly after the failure/discovery. This in turn causes the costs of the repair
to increase. This is referred to as probable costs of not having material available.
32
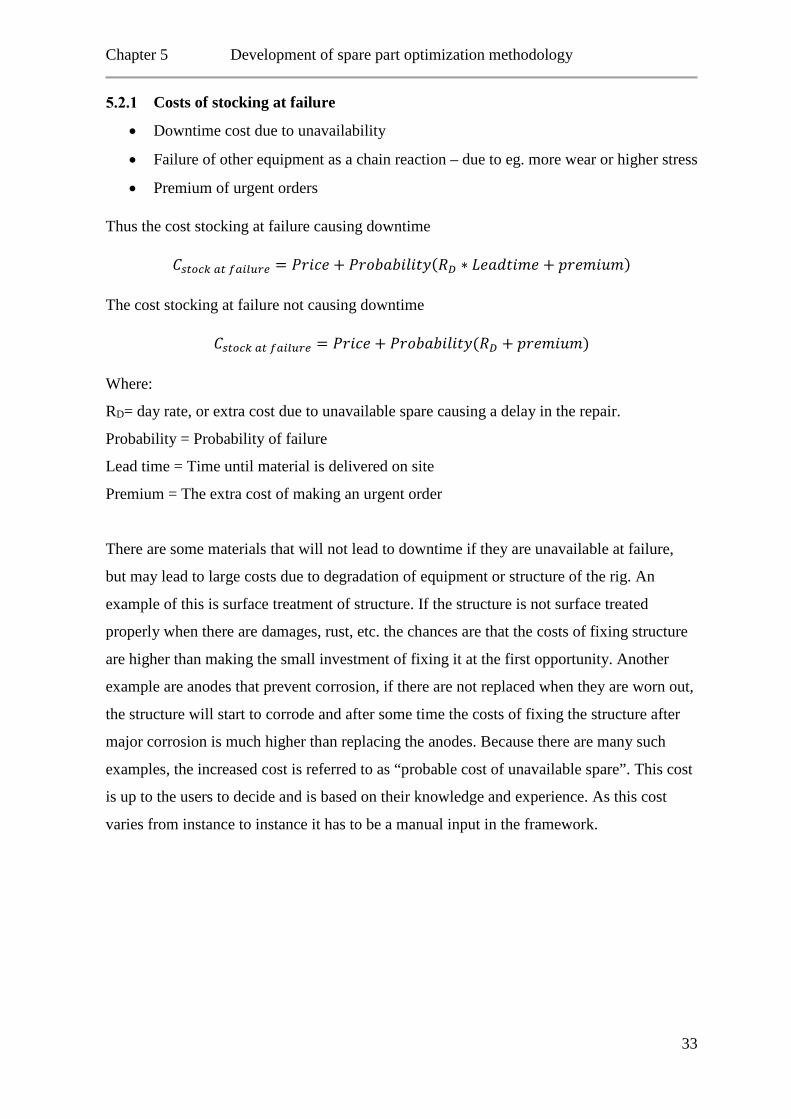
Chapter 5 Development of spare part optimization methodology
Costs of stocking at failure
• Downtime cost due to unavailability
• Failure of other equipment as a chain reaction – due to eg. more wear or higher stress
• Premium of urgent orders
Thus the cost stocking at failure causing downtime
𝐶𝐶𝑠𝑠𝑠𝑠𝑠𝑠𝑠𝑠𝑠𝑠 𝑎𝑎𝑠𝑠 𝑓𝑓𝑎𝑎𝑓𝑓𝑓𝑓𝑓𝑓𝑓𝑓𝑓𝑓 = 𝑃𝑃𝑃𝑃𝑃𝑃𝑃𝑃𝑃𝑃 + 𝑃𝑃𝑃𝑃𝑃𝑃𝑃𝑃𝑃𝑃𝑃𝑃𝑃𝑃𝑃𝑃𝑃𝑃𝑃𝑃𝑃𝑃(𝑅𝑅𝐷𝐷 ∗ 𝐿𝐿𝑃𝑃𝑃𝑃𝐿𝐿𝑃𝑃𝑃𝑃𝐿𝐿𝑃𝑃 + 𝑝𝑝𝑃𝑃𝑃𝑃𝐿𝐿𝑃𝑃𝑝𝑝𝐿𝐿)
The cost stocking at failure not causing downtime
𝐶𝐶𝑠𝑠𝑠𝑠𝑠𝑠𝑠𝑠𝑠𝑠 𝑎𝑎𝑠𝑠 𝑓𝑓𝑎𝑎𝑓𝑓𝑓𝑓𝑓𝑓𝑓𝑓𝑓𝑓 = 𝑃𝑃𝑃𝑃𝑃𝑃𝑃𝑃𝑃𝑃 + 𝑃𝑃𝑃𝑃𝑃𝑃𝑃𝑃𝑃𝑃𝑃𝑃𝑃𝑃𝑃𝑃𝑃𝑃𝑃𝑃𝑃𝑃(𝑅𝑅𝐷𝐷 + 𝑝𝑝𝑃𝑃𝑃𝑃𝐿𝐿𝑃𝑃𝑝𝑝𝐿𝐿)
Where:
RD= day rate, or extra cost due to unavailable spare causing a delay in the repair.
Probability = Probability of failure
Lead time = Time until material is delivered on site
Premium = The extra cost of making an urgent order
There are some materials that will not lead to downtime if they are unavailable at failure,
but may lead to large costs due to degradation of equipment or structure of the rig. An
example of this is surface treatment of structure. If the structure is not surface treated
properly when there are damages, rust, etc. the chances are that the costs of fixing structure
are higher than making the small investment of fixing it at the first opportunity. Another
example are anodes that prevent corrosion, if there are not replaced when they are worn out,
the structure will start to corrode and after some time the costs of fixing the structure after
major corrosion is much higher than replacing the anodes. Because there are many such
examples, the increased cost is referred to as “probable cost of unavailable spare”. This cost
is up to the users to decide and is based on their knowledge and experience. As this cost
varies from instance to instance it has to be a manual input in the framework.
33
Chapter 5 Development of spare part optimization methodology
Costs of stocking to storage
• Holding costs (hc)
o Storage costs
o Tied capital cost
• Procurement costs (pc)
o Material cost
o Order cost
• Logistics costs (lc)
o Onshore transportation
o Offshore transportation
Total cost of stocking a material is:
𝐶𝐶𝑠𝑠,𝑓𝑓 = ℎ𝑃𝑃 + 𝑝𝑝𝑃𝑃 + 𝑃𝑃𝑃𝑃
5.2.2.1 Holding costs
Holding costs are separated in storage and tied capital costs. Storage costs are calculated a
percentage of the material price. In the framework three sizes with associated storage costs is
defined, these are given in the list below with storage costs as a percentage of the material
price in the parenthesis.
• Small, anything that goes in a small box and can be transported by helicopter (1%)
• Medium, anything that needs its own pallet, cannot be transported by helicopter (3%)
• Large, anything that needs its own container or basket (5%)
Tied capital costs are the alternative cost of spending money on spare parts. In the thesis it is
assumed that the alternative cost is getting interest on the money, in some research this interest
is defined as the company’s required return on investment or the interest that banks offer. This
cost is calculated as
𝑇𝑇𝐶𝐶𝐶𝐶 = 𝑃𝑃𝑃𝑃𝑃𝑃𝑃𝑃𝑃𝑃 ∗ 𝐼𝐼𝐼𝐼𝑃𝑃𝑃𝑃𝑃𝑃𝑃𝑃𝐼𝐼𝑃𝑃 ∗ 𝐿𝐿𝑃𝑃𝐿𝐿𝑃𝑃𝑃𝑃𝑃𝑃𝐿𝐿𝑃𝑃 𝑃𝑃𝐿𝐿 𝑃𝑃𝑃𝑃𝑟𝑟
The interest may vary from year to year, but in the thesis the interest assumed to be 5%, but
the user can easily change the interest rate.
34
Chapter 5 Development of spare part optimization methodology
5.2.2.2 Procurement costs per purchase order
Procurement costs includes all costs of purchasing the material. In the thesis procurement
costs can to be entered manually, but is set to $22 by default, this is due to changing conditions
in the company. The cost of procurement involves all processes for purchasing materials.
Including time to create purchase requisition and order, reviewing, authorizing, and approving
purchase orders, etc. In this thesis the salary of a procurer (approx. $67000) has been used as
basis, and divided that by the average number of purchase orders made yearly which is around
3000. That leads to a sum of approximately $22 per purchase order. For simplification
purposes the sum is fixed regardless of number of items on the purchase order. The actual
cost of procurement is hard to measure precisely, which is why it is a manual input. The
procurement cost can easily be changed by editing the default value in the form
“frm_DecisionAid”.
5.2.2.3 Logistics costs
There are costs associated with transporting materials onshore and offshore, this is based on
the size of the material, and needs to be entered manually due to lacking information about
size and weight in SAP. Logistics costs are based on the same sizes as holding costs. The
logistics costs for the sizes are
• Small = 1%
• Medium = 2%
• Large = 5%
Now that all costs are explained and included in the framework the first decision can be made
based on the cost picture. The first decision is made in the form “frm_DecisionAid”. When
using the framework data is gathered in order to decide on one of the two alternatives; Stock,
or stock at failure. If the cost of stocking is less than stocking at failure, the spare part should
be stocked. For explanation of how the framework was developed, see section 5.7.
35
Chapter 5 Development of spare part optimization methodology
5.3 Second decision: Deciding quantity to stock If the result of the first decision is to stock the material, then the second decision that has to
be made is how many to stock. This decision can be made by using the form
“frm_decidesparequantity” (section 5.7.3.2). How many spares of each material to keep in
stock depends on a variety of parameters. The main parameters the stock level depend on is
listed below.
• Functional location consequence classification
• Redundancy
• Number installed
• Lead time
• Expected consumption
Why are these parameters important?
The functional location failure consequence classification says something about the
consequences of failure of the functional location. As mentioned the consequence
classification is divided in three; production, HSE, and cost. With regards to the spare part
stock, the framework only use production and HSE failure consequence classification. The
cost of failure cannot be reduced by keeping extra spare parts, this is connected to the value
of the equipment and spares. If the production or HSE consequence classification is high it
means that consequences of failure are severe. Then it is important to have available spare
parts if the equipment should break down. In some cases function failure of equipment with
high production or HSE failure consequences results in operational downtime, which DD
want to avoid. This is why these two parameters are included when deciding the stock level.
Some equipment are redundant, other are not. Redundancy influences the stock level to be
higher if there are no redundancy, if there is redundancy the importance of available spare
parts are reduced.
Some materials are unique on the rig, while other materials are installed many places. If a
material is installed many places this increases the need for spare parts because the likelihood
of failure increases, as seen from the equation Total MTTF = MTTF/number installed. It is
also more economically understandable to have more spare parts to materials installed many
places compared to unique materials, assuming all else equal.
36
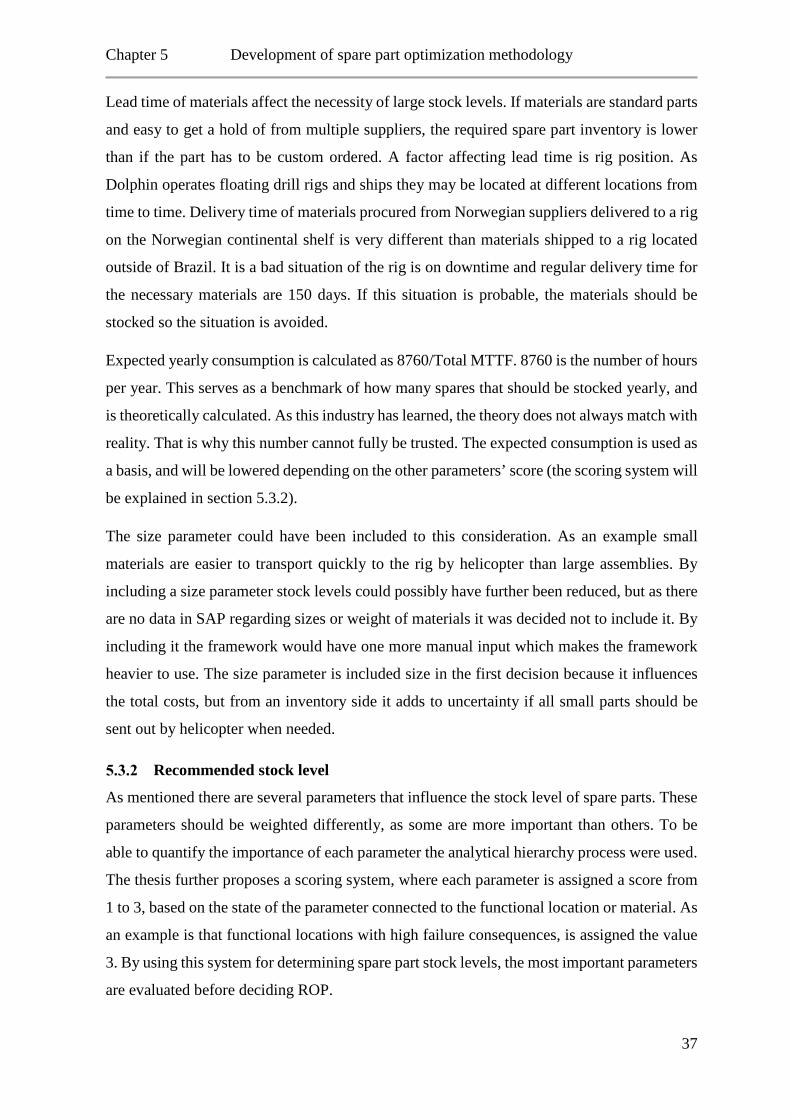
Chapter 5 Development of spare part optimization methodology
Lead time of materials affect the necessity of large stock levels. If materials are standard parts
and easy to get a hold of from multiple suppliers, the required spare part inventory is lower
than if the part has to be custom ordered. A factor affecting lead time is rig position. As
Dolphin operates floating drill rigs and ships they may be located at different locations from
time to time. Delivery time of materials procured from Norwegian suppliers delivered to a rig
on the Norwegian continental shelf is very different than materials shipped to a rig located
outside of Brazil. It is a bad situation of the rig is on downtime and regular delivery time for
the necessary materials are 150 days. If this situation is probable, the materials should be
stocked so the situation is avoided.
Expected yearly consumption is calculated as 8760/Total MTTF. 8760 is the number of hours
per year. This serves as a benchmark of how many spares that should be stocked yearly, and
is theoretically calculated. As this industry has learned, the theory does not always match with
reality. That is why this number cannot fully be trusted. The expected consumption is used as
a basis, and will be lowered depending on the other parameters’ score (the scoring system will
be explained in section 5.3.2).
The size parameter could have been included to this consideration. As an example small
materials are easier to transport quickly to the rig by helicopter than large assemblies. By
including a size parameter stock levels could possibly have further been reduced, but as there
are no data in SAP regarding sizes or weight of materials it was decided not to include it. By
including it the framework would have one more manual input which makes the framework
heavier to use. The size parameter is included size in the first decision because it influences
the total costs, but from an inventory side it adds to uncertainty if all small parts should be
sent out by helicopter when needed.
Recommended stock level
As mentioned there are several parameters that influence the stock level of spare parts. These
parameters should be weighted differently, as some are more important than others. To be
able to quantify the importance of each parameter the analytical hierarchy process were used.
The thesis further proposes a scoring system, where each parameter is assigned a score from
1 to 3, based on the state of the parameter connected to the functional location or material. As
an example is that functional locations with high failure consequences, is assigned the value
3. By using this system for determining spare part stock levels, the most important parameters
are evaluated before deciding ROP.
37
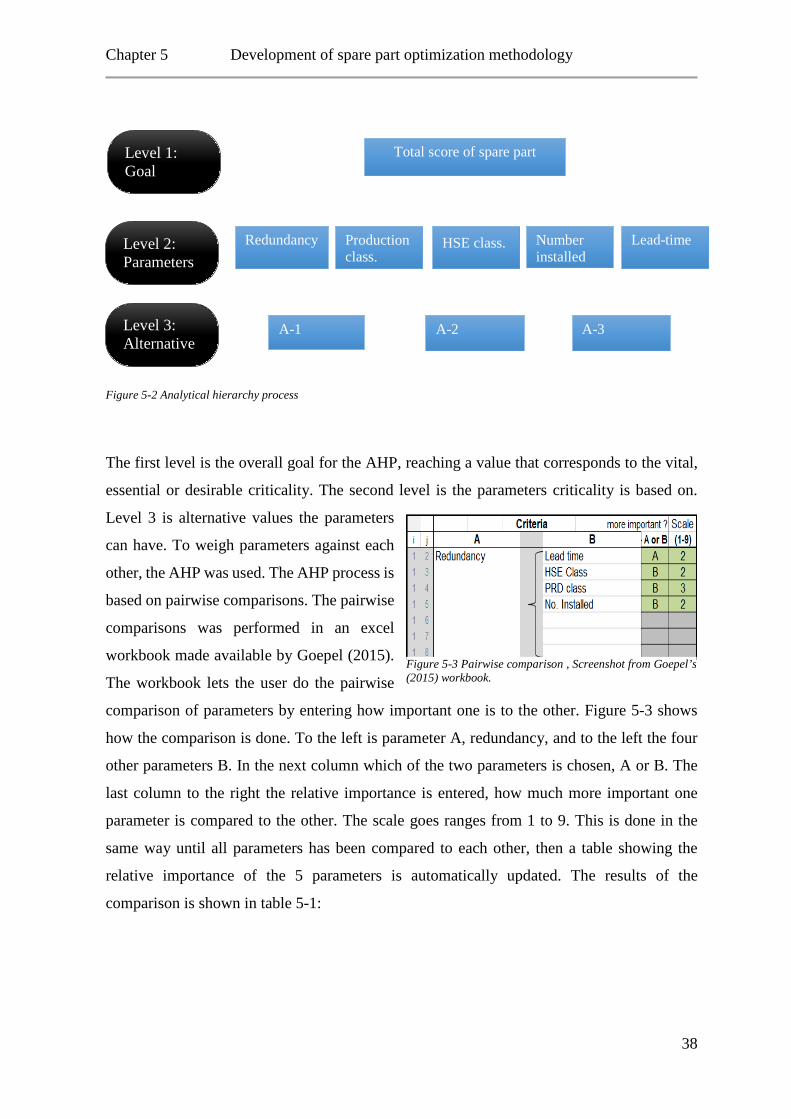
Chapter 5 Development of spare part optimization methodology
Figure 5-2 Analytical hierarchy process
The first level is the overall goal for the AHP, reaching a value that corresponds to the vital,
essential or desirable criticality. The second level is the parameters criticality is based on.
Level 3 is alternative values the parameters
can have. To weigh parameters against each
other, the AHP was used. The AHP process is
based on pairwise comparisons. The pairwise
comparisons was performed in an excel
workbook made available by Goepel (2015).
The workbook lets the user do the pairwise
comparison of parameters by entering how important one is to the other. Figure 5-3 shows
how the comparison is done. To the left is parameter A, redundancy, and to the left the four
other parameters B. In the next column which of the two parameters is chosen, A or B. The
last column to the right the relative importance is entered, how much more important one
parameter is compared to the other. The scale goes ranges from 1 to 9. This is done in the
same way until all parameters has been compared to each other, then a table showing the
relative importance of the 5 parameters is automatically updated. The results of the
comparison is shown in table 5-1:
Total score of spare part
A-2 A-1 A-3
Redundancy Lead-time HSE class.
Level 1: Goal
Level 2: Parameters
Level 3: Alternative
Production class.
Number installed
Figure 5-3 Pairwise comparison , Screenshot from Goepel’s (2015) workbook.
38
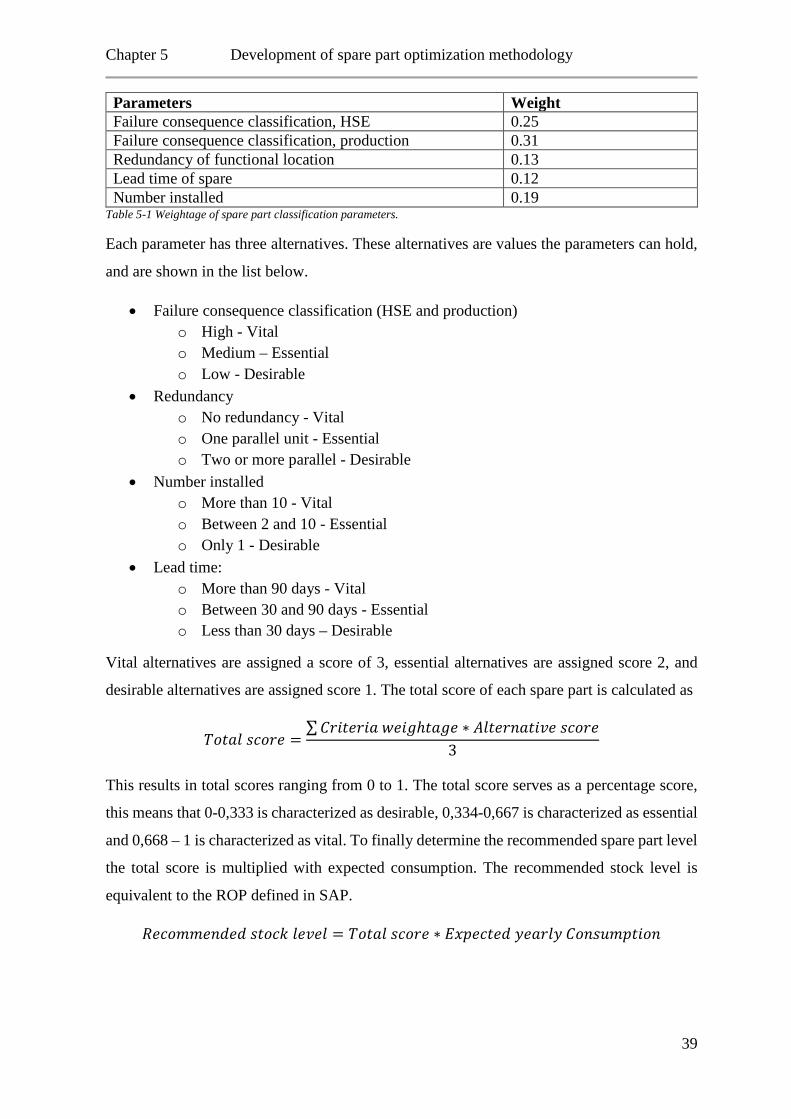
Chapter 5 Development of spare part optimization methodology
Parameters Weight Failure consequence classification, HSE 0.25 Failure consequence classification, production 0.31 Redundancy of functional location 0.13 Lead time of spare 0.12 Number installed 0.19
Table 5-1 Weightage of spare part classification parameters.
Each parameter has three alternatives. These alternatives are values the parameters can hold,
and are shown in the list below.
• Failure consequence classification (HSE and production) o High - Vital o Medium – Essential o Low - Desirable
• Redundancy o No redundancy - Vital o One parallel unit - Essential o Two or more parallel - Desirable
• Number installed o More than 10 - Vital o Between 2 and 10 - Essential o Only 1 - Desirable
• Lead time: o More than 90 days - Vital o Between 30 and 90 days - Essential o Less than 30 days – Desirable
Vital alternatives are assigned a score of 3, essential alternatives are assigned score 2, and
desirable alternatives are assigned score 1. The total score of each spare part is calculated as
𝑇𝑇𝑃𝑃𝑃𝑃𝑃𝑃𝑃𝑃 𝐼𝐼𝑃𝑃𝑃𝑃𝑃𝑃𝑃𝑃 =∑𝐶𝐶𝑃𝑃𝑃𝑃𝑃𝑃𝑃𝑃𝑃𝑃𝑃𝑃𝑃𝑃 𝑤𝑤𝑃𝑃𝑃𝑃𝑟𝑟ℎ𝑃𝑃𝑃𝑃𝑟𝑟𝑃𝑃 ∗ 𝐴𝐴𝑃𝑃𝑃𝑃𝑃𝑃𝑃𝑃𝐼𝐼𝑃𝑃𝑃𝑃𝑃𝑃𝐴𝐴𝑃𝑃 𝐼𝐼𝑃𝑃𝑃𝑃𝑃𝑃𝑃𝑃
3
This results in total scores ranging from 0 to 1. The total score serves as a percentage score,
this means that 0-0,333 is characterized as desirable, 0,334-0,667 is characterized as essential
and 0,668 – 1 is characterized as vital. To finally determine the recommended spare part level
the total score is multiplied with expected consumption. The recommended stock level is
equivalent to the ROP defined in SAP.
𝑅𝑅𝑃𝑃𝑃𝑃𝑃𝑃𝐿𝐿𝐿𝐿𝑃𝑃𝐼𝐼𝐿𝐿𝑃𝑃𝐿𝐿 𝐼𝐼𝑃𝑃𝑃𝑃𝑃𝑃𝑠𝑠 𝑃𝑃𝑃𝑃𝐴𝐴𝑃𝑃𝑃𝑃 = 𝑇𝑇𝑃𝑃𝑃𝑃𝑃𝑃𝑃𝑃 𝐼𝐼𝑃𝑃𝑃𝑃𝑃𝑃𝑃𝑃 ∗ 𝐸𝐸𝐸𝐸𝑝𝑝𝑃𝑃𝑃𝑃𝑃𝑃𝑃𝑃𝐿𝐿 𝑃𝑃𝑃𝑃𝑃𝑃𝑃𝑃𝑃𝑃𝑃𝑃 𝐶𝐶𝑃𝑃𝐼𝐼𝐼𝐼𝑝𝑝𝐿𝐿𝑝𝑝𝑃𝑃𝑃𝑃𝑃𝑃𝐼𝐼
39
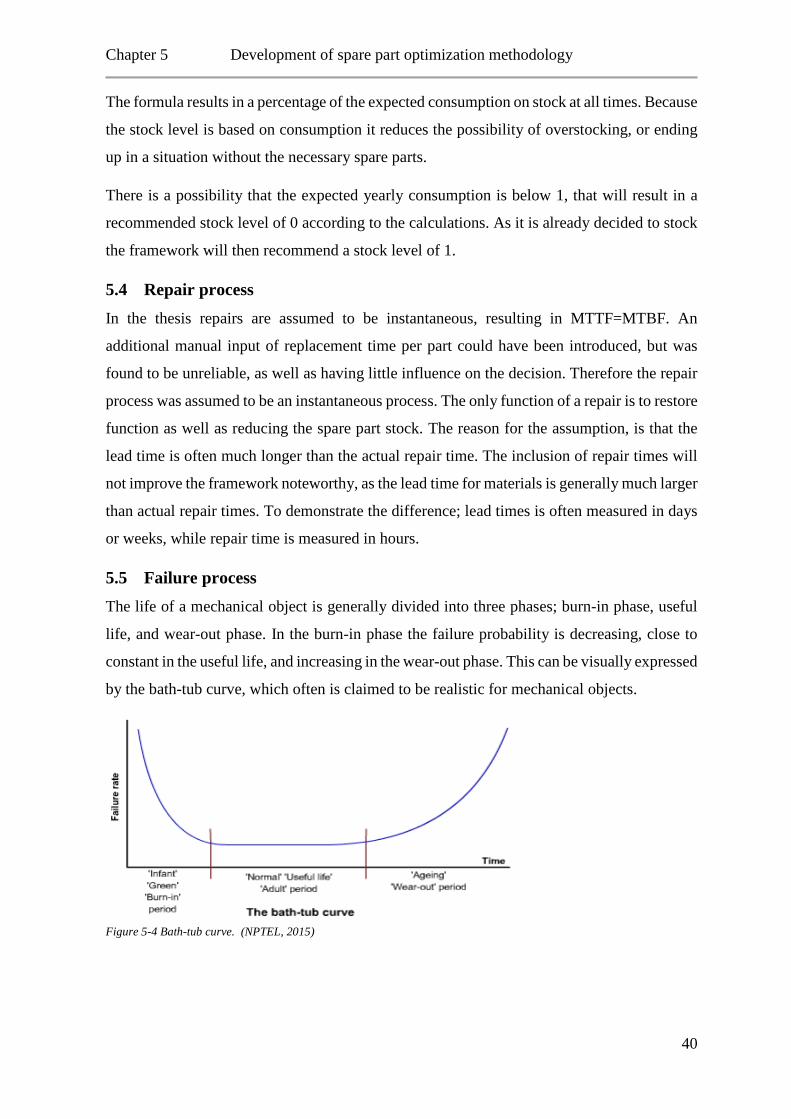
Chapter 5 Development of spare part optimization methodology
The formula results in a percentage of the expected consumption on stock at all times. Because
the stock level is based on consumption it reduces the possibility of overstocking, or ending
up in a situation without the necessary spare parts.
There is a possibility that the expected yearly consumption is below 1, that will result in a
recommended stock level of 0 according to the calculations. As it is already decided to stock
the framework will then recommend a stock level of 1.
5.4 Repair process In the thesis repairs are assumed to be instantaneous, resulting in MTTF=MTBF. An
additional manual input of replacement time per part could have been introduced, but was
found to be unreliable, as well as having little influence on the decision. Therefore the repair
process was assumed to be an instantaneous process. The only function of a repair is to restore
function as well as reducing the spare part stock. The reason for the assumption, is that the
lead time is often much longer than the actual repair time. The inclusion of repair times will
not improve the framework noteworthy, as the lead time for materials is generally much larger
than actual repair times. To demonstrate the difference; lead times is often measured in days
or weeks, while repair time is measured in hours.
5.5 Failure process The life of a mechanical object is generally divided into three phases; burn-in phase, useful
life, and wear-out phase. In the burn-in phase the failure probability is decreasing, close to
constant in the useful life, and increasing in the wear-out phase. This can be visually expressed
by the bath-tub curve, which often is claimed to be realistic for mechanical objects.
Figure 5-4 Bath-tub curve. (NPTEL, 2015)
40
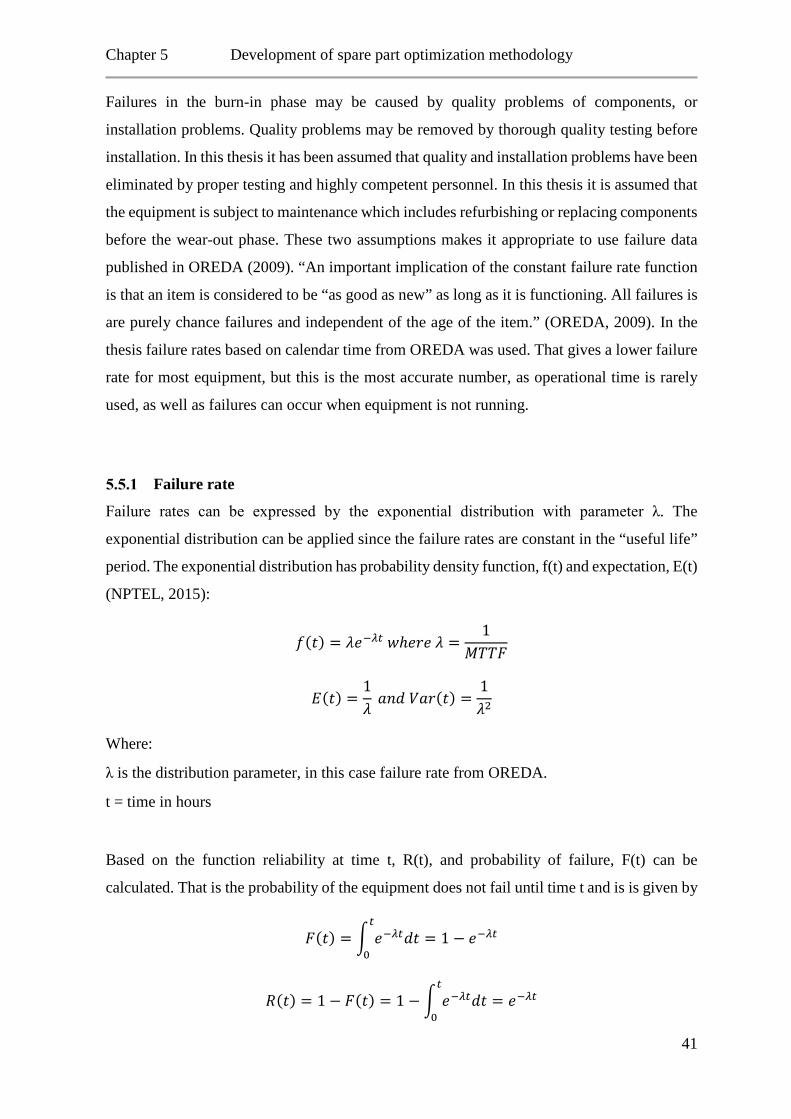
Chapter 5 Development of spare part optimization methodology
Failures in the burn-in phase may be caused by quality problems of components, or
installation problems. Quality problems may be removed by thorough quality testing before
installation. In this thesis it has been assumed that quality and installation problems have been
eliminated by proper testing and highly competent personnel. In this thesis it is assumed that
the equipment is subject to maintenance which includes refurbishing or replacing components
before the wear-out phase. These two assumptions makes it appropriate to use failure data
published in OREDA (2009). “An important implication of the constant failure rate function
is that an item is considered to be “as good as new” as long as it is functioning. All failures is
are purely chance failures and independent of the age of the item.” (OREDA, 2009). In the
thesis failure rates based on calendar time from OREDA was used. That gives a lower failure
rate for most equipment, but this is the most accurate number, as operational time is rarely
used, as well as failures can occur when equipment is not running.
Failure rate
Failure rates can be expressed by the exponential distribution with parameter λ. The
exponential distribution can be applied since the failure rates are constant in the “useful life”
period. The exponential distribution has probability density function, f(t) and expectation, E(t)
(NPTEL, 2015):
𝐿𝐿(𝑃𝑃) = 𝜆𝜆𝑃𝑃−𝜆𝜆𝑠𝑠 𝑤𝑤ℎ𝑃𝑃𝑃𝑃𝑃𝑃 𝜆𝜆 =1
𝑀𝑀𝑇𝑇𝑇𝑇𝑀𝑀
𝐸𝐸(𝑃𝑃) =1𝜆𝜆
𝑃𝑃𝐼𝐼𝐿𝐿 𝑉𝑉𝑃𝑃𝑃𝑃(𝑃𝑃) =1𝜆𝜆2
Where:
λ is the distribution parameter, in this case failure rate from OREDA.
t = time in hours
Based on the function reliability at time t, R(t), and probability of failure, F(t) can be
calculated. That is the probability of the equipment does not fail until time t and is is given by
𝑀𝑀(𝑃𝑃) = � 𝑃𝑃−𝜆𝜆𝑠𝑠𝐿𝐿𝑃𝑃 = 1 − 𝑃𝑃−𝜆𝜆𝑠𝑠𝑠𝑠
0
𝑅𝑅(𝑃𝑃) = 1 − 𝑀𝑀(𝑃𝑃) = 1 −� 𝑃𝑃−𝜆𝜆𝑠𝑠𝐿𝐿𝑃𝑃 = 𝑃𝑃−𝜆𝜆𝑠𝑠𝑠𝑠
0
41
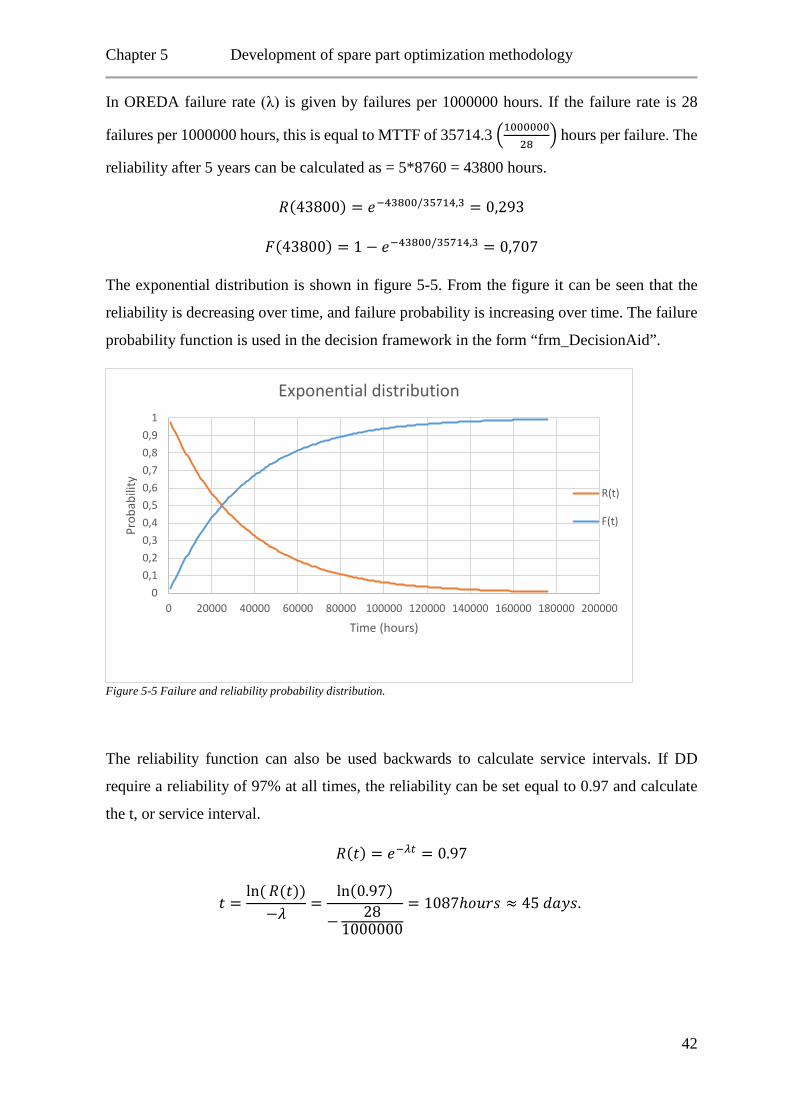
Chapter 5 Development of spare part optimization methodology
In OREDA failure rate (λ) is given by failures per 1000000 hours. If the failure rate is 28
failures per 1000000 hours, this is equal to MTTF of 35714.3 �100000028
� hours per failure. The
reliability after 5 years can be calculated as = 5*8760 = 43800 hours.
𝑅𝑅(43800) = 𝑃𝑃−43800/35714,3 = 0,293
𝑀𝑀(43800) = 1 − 𝑃𝑃−43800/35714,3 = 0,707
The exponential distribution is shown in figure 5-5. From the figure it can be seen that the
reliability is decreasing over time, and failure probability is increasing over time. The failure
probability function is used in the decision framework in the form “frm_DecisionAid”.
Figure 5-5 Failure and reliability probability distribution.
The reliability function can also be used backwards to calculate service intervals. If DD
require a reliability of 97% at all times, the reliability can be set equal to 0.97 and calculate
the t, or service interval.
𝑅𝑅(𝑃𝑃) = 𝑃𝑃−𝜆𝜆𝑠𝑠 = 0.97
𝑃𝑃 =ln(𝑅𝑅(𝑃𝑃))−𝜆𝜆
=ln(0.97)
− 281000000
= 1087ℎ𝑃𝑃𝑝𝑝𝑃𝑃𝐼𝐼 ≈ 45 𝐿𝐿𝑃𝑃𝑃𝑃𝐼𝐼.
00,10,20,30,40,50,60,70,80,9
1
0 20000 40000 60000 80000 100000 120000 140000 160000 180000 200000
Prob
abili
ty
Time (hours)
Exponential distribution
R(t)
F(t)
42
Chapter 5 Development of spare part optimization methodology
This means that equipment with a failure rate of 28 failures/million hours, need service every
45 days to sustain a 97% reliability. This should be implemented in the RCM analysis, when
deciding interval of PM tasks.
Failure during lead time
Many spare parts may be used several places. If only one spare is available, it will be used on
the first failure if it is not a safety stock for a specific FL. In this situation, there is a possibility
of a second failure causing a second demand for the same spare part that was used. The
probability of a second failure during lead time can be useful to be aware of when determining
if the stock levels. The probability can be calculated in the same way as the example above
by replacing t= lifetime with tL=lead time.
𝑀𝑀(𝑃𝑃𝐿𝐿) = 1 − 𝑃𝑃−𝜆𝜆𝑠𝑠𝐿𝐿
𝑅𝑅(𝑃𝑃𝐿𝐿) = 𝑃𝑃−𝜆𝜆𝑠𝑠𝐿𝐿
5.6 Data acquirement In order to get as much input from the real world as possible the Access database was built
with data already stored in SAP. The reason for building the database, is that it makes
manipulation (comparisons of stock levels, showing overstock, etc.) of the data easy. Having
the data stored orderly in tables, queries selecting only specific data for can be created. The
framework is based on data available from SAP, such as attributes of material, equipment or
functional location. Most of the data stored in SAP is easily accessible by exporting the data
to Excel files. Excel files are highly compatible with Access, which made the data import
quite easy. The data used as input to the database is explained in the next section. Most of the
data in table 5-2 could be directly exported from SAP, except from “number installed”. The
reason for this is that there is no attribute called “Number installed”. This issue was solved by
creating one query to count BOMHeaders in the “tbl_Equipmentoverview” table, and one
query to count BOMdetails in the table “tbl_BOMdetail”. The result of the counts was entered
in table “tbl_Material” for each material as well as using the same queries in the forms, in
case this number changes. As the recommended spare part stock level is influenced by how
many times a material is installed, it is important that the user easily finds this information.
Another issue is that not all materials has a price. Only material types ZCON and ZSPR have
prices in SAP. ZCPX materials are depreciated by Dolphin Drilling PTE Limited, in
43
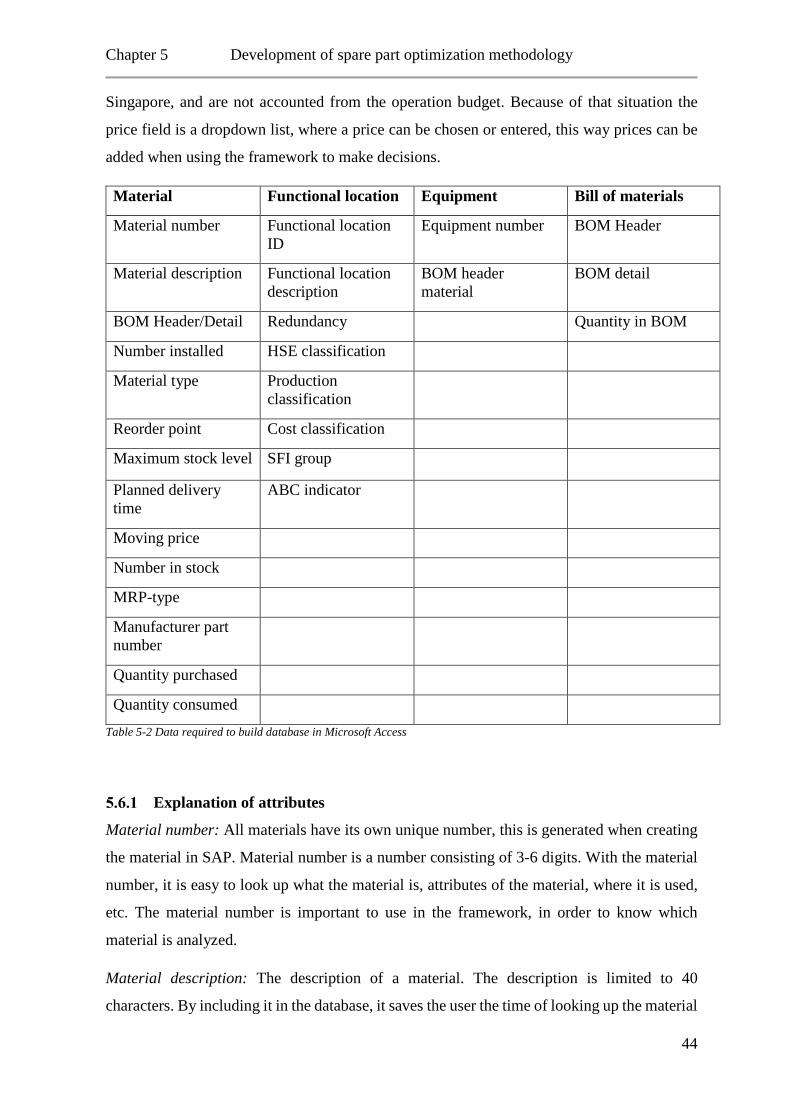
Chapter 5 Development of spare part optimization methodology
Singapore, and are not accounted from the operation budget. Because of that situation the
price field is a dropdown list, where a price can be chosen or entered, this way prices can be
added when using the framework to make decisions.
Material Functional location Equipment Bill of materials
Material number Functional location ID
Equipment number BOM Header
Material description Functional location description
BOM header material
BOM detail
BOM Header/Detail Redundancy Quantity in BOM
Number installed HSE classification
Material type Production classification
Reorder point Cost classification
Maximum stock level SFI group
Planned delivery time
ABC indicator
Moving price
Number in stock
MRP-type
Manufacturer part number
Quantity purchased
Quantity consumed Table 5-2 Data required to build database in Microsoft Access
Explanation of attributes
Material number: All materials have its own unique number, this is generated when creating
the material in SAP. Material number is a number consisting of 3-6 digits. With the material
number, it is easy to look up what the material is, attributes of the material, where it is used,
etc. The material number is important to use in the framework, in order to know which
material is analyzed.
Material description: The description of a material. The description is limited to 40
characters. By including it in the database, it saves the user the time of looking up the material
44
Chapter 5 Development of spare part optimization methodology
in SAP. Material descriptions should be standardized, by standardization fewer materials will
be created because it will be easier to find the correct material. DD has potential for improving
material descriptions, as many duplicate materials was found in the current situation analysis.
BOM header/detail: In the table “tbl_Material” there is a yes/no field to show whether or not
materials is a BOMheader or a BOMdetail, if it is “yes” for BOMheader, it means that the
material has a BOM. If the BOMdetail field is “yes” the material is part of a BOM. By having
these yes/no fields, it is easy to see if the material is in a BOM, or is the header of the BOM.
In the case of materials with “no” in both fields, the material can be used several places, and
should be connected to a BOM. That means that not all BOMs are complete. All consumables
have “no” in the fields, as consumables are not used in BOMs.
Number installed: This is the number of identical items installed throughout the MODU. The
information is used when deciding reorder point and maximum stock level as well as
evaluating the necessity of spares.
Material type: All materials are classified as capital spares (ZCPX), spare parts (ZSPR) or
consumables (ZCON), this is the material type. The material type is useful for the current
situation analysis.
Reorder point: The reorder point (ROP) says at what stock level materials are reordered. If
the stock level is below the ROP, the material should be replenished. For example if a material
has a ROP of 2, it should be reordered when there is 1 left in stock. ROPs is included to
compare the presented framework results with the current situation.
Maximum stock level: MSL is the highest stock level that should be kept of a material. No
materials should be stocked above the MSL. That will contribute to unnecessary large spare
part inventory and tied up capital. As with reorder points, there is a possibility that many
maximum stock levels can be adjusted down.
The ROP and MSL is set by the maintenance onshore team in collaboration with the offshore
maintenance personnel. The collaboration ensures reasonable levels with regard to
consumption.
Moving price: The price of the material. The price in SAP is an average price calculated from
all the purchases of the specific material. This will be further used in analyses of inventory
value.
MRP-type: This is explained in section 3.2, regarding spare parts.
45
Chapter 5 Development of spare part optimization methodology
Manufacturer’s part number: This is the material number the manufacturer uses, for example
a roller bearing has a material number 309141, and manufacturer part number H2RIE001036.
When DD order the part they can refer to the manufacturer part number and be sure that they
get the same bearing as last time it was ordered. The manufacturer part number is brought
into the database because there is a possibility that several materials have the same
manufacturer part number, which means that they are duplicate and inventory control gets
more difficult.
Quantity purchased/consumed: How many of a material that is previously purchased and
consumed/used. In the database a field for quantity purchased and quantity consumed is
included. It then becomes available for comparison with ROPs and MSL. The consumption
also gives an indication of consumption, which is important information when deciding stock
levels.
Functional location ID: The functional location is the location where maintenance is
performed. The object which serves a specific function, for example propulsion thruster unit
number 1 has functional location 540-635-YR-1001. The consequence classification is done
on a functional location level. Including functional locations is necessary for creating the
technical hierarchy matching the hierarchy in SAP in the Access database. By including
functional locations in the database it also becomes possible to sort functional locations by
number of spare parts, overstock, or other information.
Functional location description: The description of functional location ID. See above
example.
SFI: SFI coding is a coding system for main functions. In the case of the azimuth thruster, the
SFI code is 635. It is included in the database to be able to sort for example costs under SFI
codes. The SFI coding system is explained in detail in section 2.3.1.
46
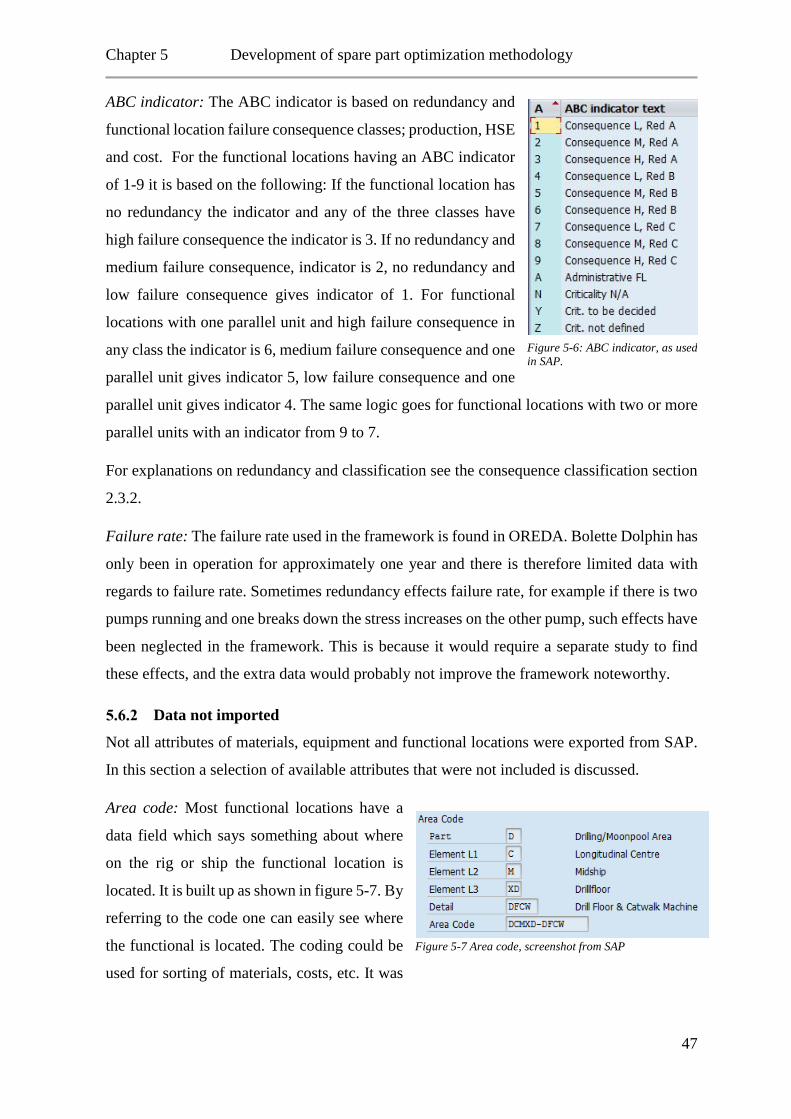
Chapter 5 Development of spare part optimization methodology
ABC indicator: The ABC indicator is based on redundancy and
functional location failure consequence classes; production, HSE
and cost. For the functional locations having an ABC indicator
of 1-9 it is based on the following: If the functional location has
no redundancy the indicator and any of the three classes have
high failure consequence the indicator is 3. If no redundancy and
medium failure consequence, indicator is 2, no redundancy and
low failure consequence gives indicator of 1. For functional
locations with one parallel unit and high failure consequence in
any class the indicator is 6, medium failure consequence and one
parallel unit gives indicator 5, low failure consequence and one
parallel unit gives indicator 4. The same logic goes for functional locations with two or more
parallel units with an indicator from 9 to 7.
For explanations on redundancy and classification see the consequence classification section
2.3.2.
Failure rate: The failure rate used in the framework is found in OREDA. Bolette Dolphin has
only been in operation for approximately one year and there is therefore limited data with
regards to failure rate. Sometimes redundancy effects failure rate, for example if there is two
pumps running and one breaks down the stress increases on the other pump, such effects have
been neglected in the framework. This is because it would require a separate study to find
these effects, and the extra data would probably not improve the framework noteworthy.
Data not imported
Not all attributes of materials, equipment and functional locations were exported from SAP.
In this section a selection of available attributes that were not included is discussed.
Area code: Most functional locations have a
data field which says something about where
on the rig or ship the functional location is
located. It is built up as shown in figure 5-7. By
referring to the code one can easily see where
the functional is located. The coding could be
used for sorting of materials, costs, etc. It was
Figure 5-7 Area code, screenshot from SAP
Figure 5-6: ABC indicator, as used in SAP.
47
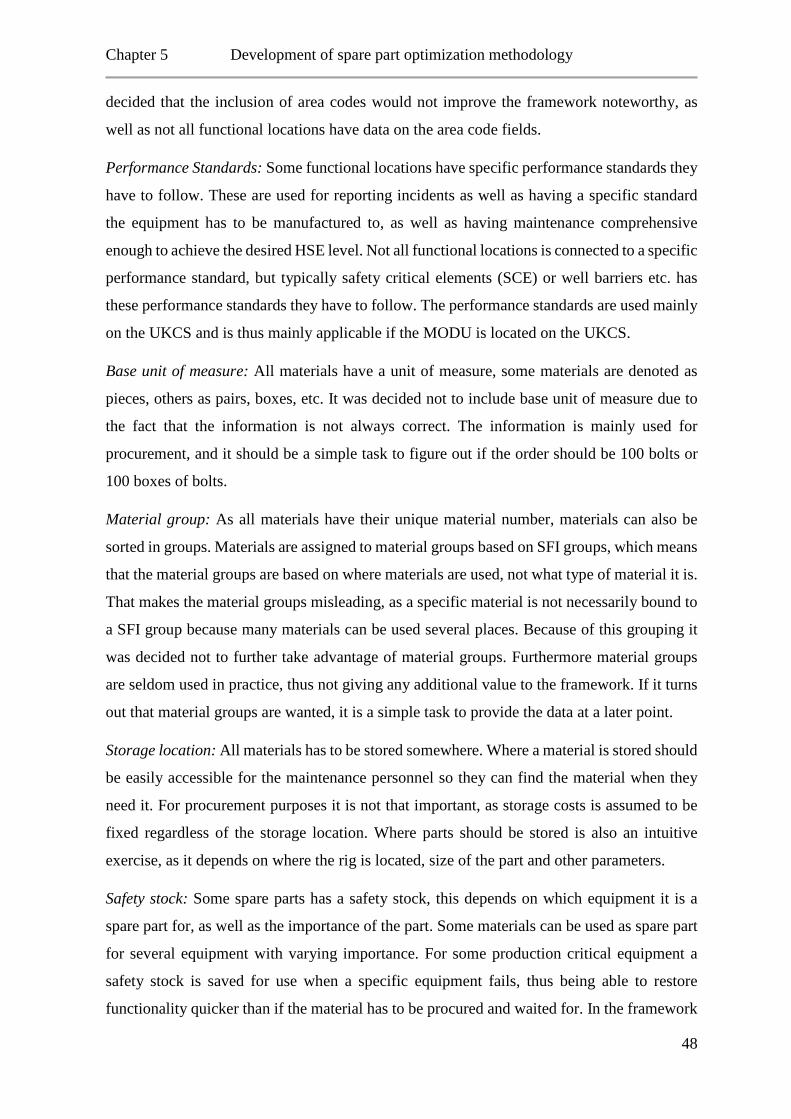
Chapter 5 Development of spare part optimization methodology
decided that the inclusion of area codes would not improve the framework noteworthy, as
well as not all functional locations have data on the area code fields.
Performance Standards: Some functional locations have specific performance standards they
have to follow. These are used for reporting incidents as well as having a specific standard
the equipment has to be manufactured to, as well as having maintenance comprehensive
enough to achieve the desired HSE level. Not all functional locations is connected to a specific
performance standard, but typically safety critical elements (SCE) or well barriers etc. has
these performance standards they have to follow. The performance standards are used mainly
on the UKCS and is thus mainly applicable if the MODU is located on the UKCS.
Base unit of measure: All materials have a unit of measure, some materials are denoted as
pieces, others as pairs, boxes, etc. It was decided not to include base unit of measure due to
the fact that the information is not always correct. The information is mainly used for
procurement, and it should be a simple task to figure out if the order should be 100 bolts or
100 boxes of bolts.
Material group: As all materials have their unique material number, materials can also be
sorted in groups. Materials are assigned to material groups based on SFI groups, which means
that the material groups are based on where materials are used, not what type of material it is.
That makes the material groups misleading, as a specific material is not necessarily bound to
a SFI group because many materials can be used several places. Because of this grouping it
was decided not to further take advantage of material groups. Furthermore material groups
are seldom used in practice, thus not giving any additional value to the framework. If it turns
out that material groups are wanted, it is a simple task to provide the data at a later point.
Storage location: All materials has to be stored somewhere. Where a material is stored should
be easily accessible for the maintenance personnel so they can find the material when they
need it. For procurement purposes it is not that important, as storage costs is assumed to be
fixed regardless of the storage location. Where parts should be stored is also an intuitive
exercise, as it depends on where the rig is located, size of the part and other parameters.
Safety stock: Some spare parts has a safety stock, this depends on which equipment it is a
spare part for, as well as the importance of the part. Some materials can be used as spare part
for several equipment with varying importance. For some production critical equipment a
safety stock is saved for use when a specific equipment fails, thus being able to restore
functionality quicker than if the material has to be procured and waited for. In the framework
48
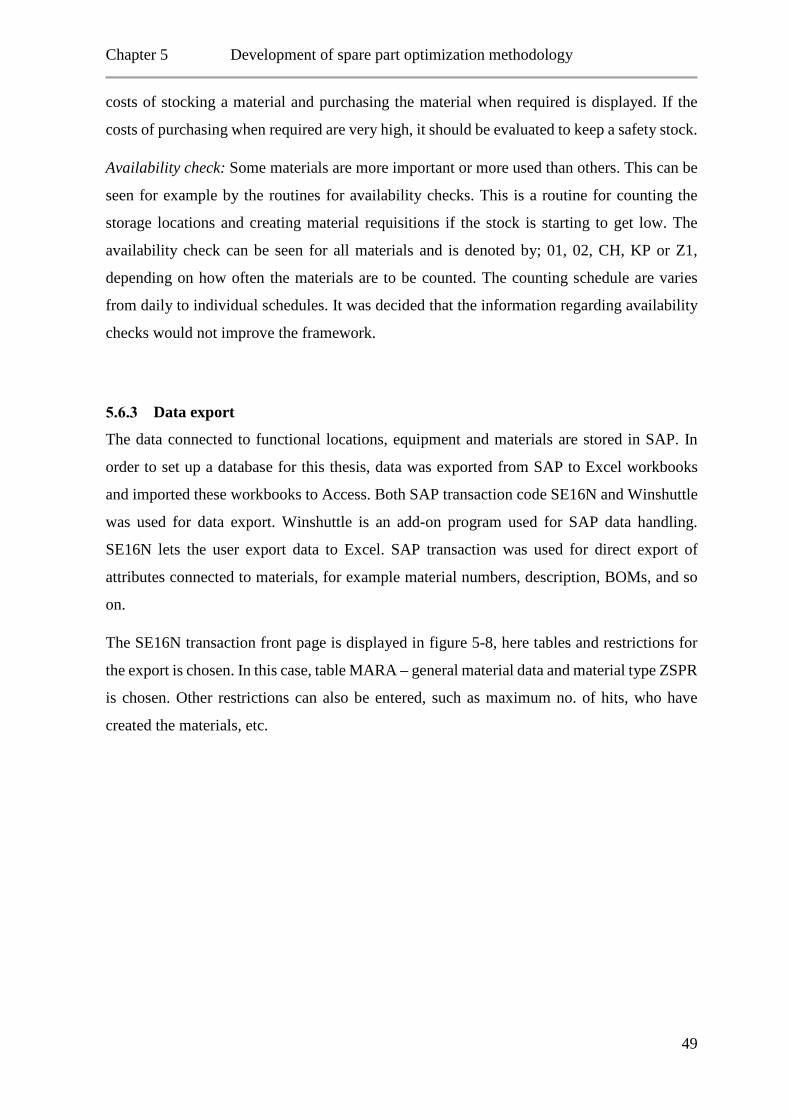
Chapter 5 Development of spare part optimization methodology
costs of stocking a material and purchasing the material when required is displayed. If the
costs of purchasing when required are very high, it should be evaluated to keep a safety stock.
Availability check: Some materials are more important or more used than others. This can be
seen for example by the routines for availability checks. This is a routine for counting the
storage locations and creating material requisitions if the stock is starting to get low. The
availability check can be seen for all materials and is denoted by; 01, 02, CH, KP or Z1,
depending on how often the materials are to be counted. The counting schedule are varies
from daily to individual schedules. It was decided that the information regarding availability
checks would not improve the framework.
Data export
The data connected to functional locations, equipment and materials are stored in SAP. In
order to set up a database for this thesis, data was exported from SAP to Excel workbooks
and imported these workbooks to Access. Both SAP transaction code SE16N and Winshuttle
was used for data export. Winshuttle is an add-on program used for SAP data handling.
SE16N lets the user export data to Excel. SAP transaction was used for direct export of
attributes connected to materials, for example material numbers, description, BOMs, and so
on.
The SE16N transaction front page is displayed in figure 5-8, here tables and restrictions for
the export is chosen. In this case, table MARA – general material data and material type ZSPR
is chosen. Other restrictions can also be entered, such as maximum no. of hits, who have
created the materials, etc.
49
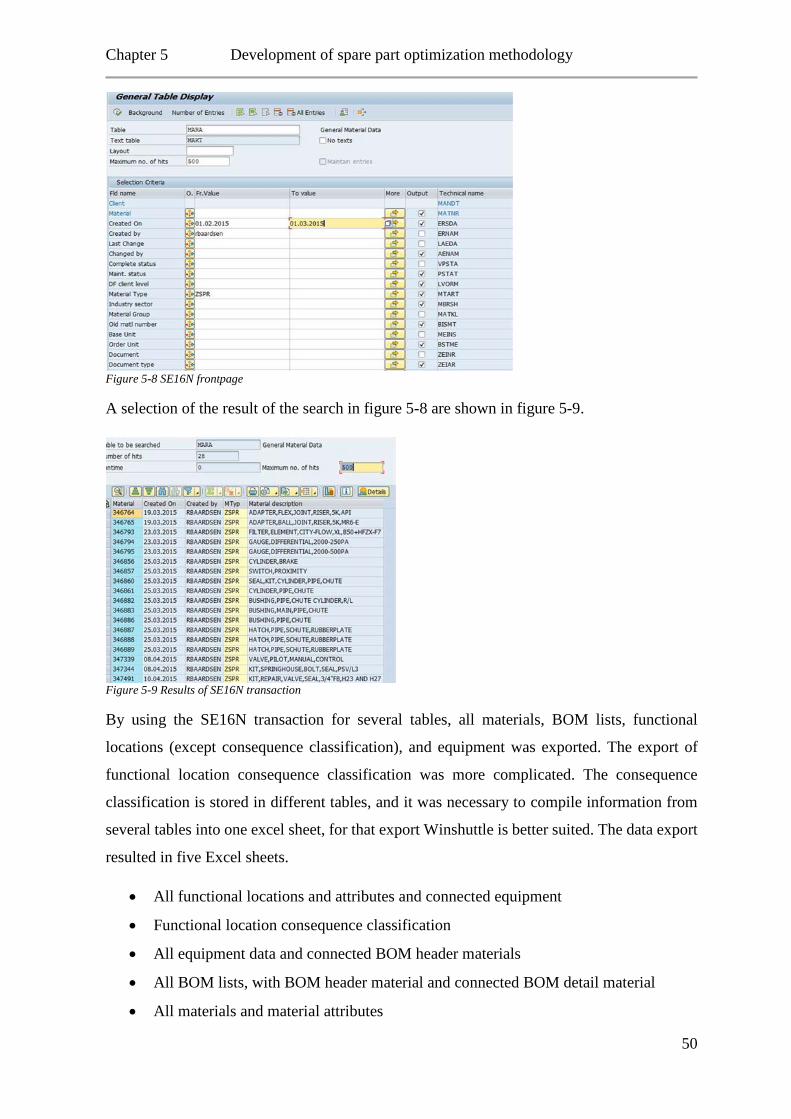
Chapter 5 Development of spare part optimization methodology
Figure 5-8 SE16N frontpage
A selection of the result of the search in figure 5-8 are shown in figure 5-9.
Figure 5-9 Results of SE16N transaction
By using the SE16N transaction for several tables, all materials, BOM lists, functional
locations (except consequence classification), and equipment was exported. The export of
functional location consequence classification was more complicated. The consequence
classification is stored in different tables, and it was necessary to compile information from
several tables into one excel sheet, for that export Winshuttle is better suited. The data export
resulted in five Excel sheets.
• All functional locations and attributes and connected equipment
• Functional location consequence classification
• All equipment data and connected BOM header materials
• All BOM lists, with BOM header material and connected BOM detail material
• All materials and material attributes
50

Chapter 5 Development of spare part optimization methodology
These five excel sheets made up the basis tables for the database. The next section describes
how the database was built.
51
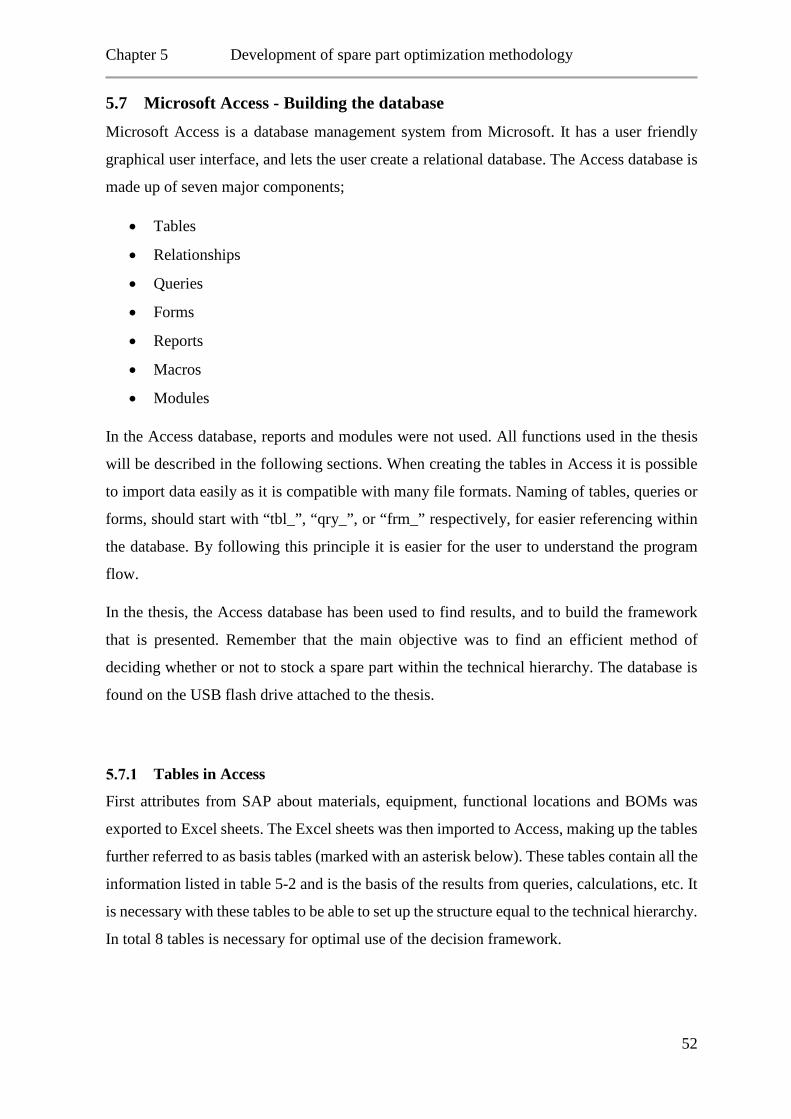
Chapter 5 Development of spare part optimization methodology
5.7 Microsoft Access - Building the database Microsoft Access is a database management system from Microsoft. It has a user friendly
graphical user interface, and lets the user create a relational database. The Access database is
made up of seven major components;
• Tables
• Relationships
• Queries
• Forms
• Reports
• Macros
• Modules
In the Access database, reports and modules were not used. All functions used in the thesis
will be described in the following sections. When creating the tables in Access it is possible
to import data easily as it is compatible with many file formats. Naming of tables, queries or
forms, should start with “tbl_”, “qry_”, or “frm_” respectively, for easier referencing within
the database. By following this principle it is easier for the user to understand the program
flow.
In the thesis, the Access database has been used to find results, and to build the framework
that is presented. Remember that the main objective was to find an efficient method of
deciding whether or not to stock a spare part within the technical hierarchy. The database is
found on the USB flash drive attached to the thesis.
Tables in Access
First attributes from SAP about materials, equipment, functional locations and BOMs was
exported to Excel sheets. The Excel sheets was then imported to Access, making up the tables
further referred to as basis tables (marked with an asterisk below). These tables contain all the
information listed in table 5-2 and is the basis of the results from queries, calculations, etc. It
is necessary with these tables to be able to set up the structure equal to the technical hierarchy.
In total 8 tables is necessary for optimal use of the decision framework.
52
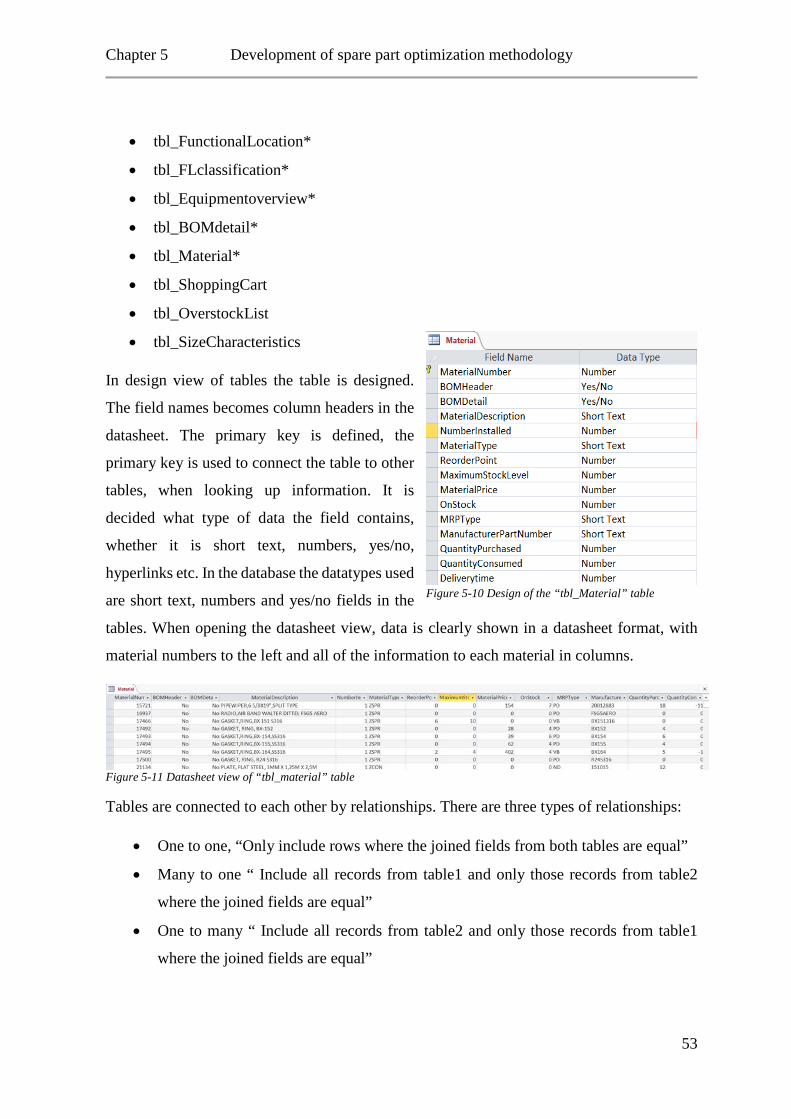
Chapter 5 Development of spare part optimization methodology
• tbl_FunctionalLocation*
• tbl_FLclassification*
• tbl_Equipmentoverview*
• tbl_BOMdetail*
• tbl_Material*
• tbl_ShoppingCart
• tbl_OverstockList
• tbl_SizeCharacteristics
In design view of tables the table is designed.
The field names becomes column headers in the
datasheet. The primary key is defined, the
primary key is used to connect the table to other
tables, when looking up information. It is
decided what type of data the field contains,
whether it is short text, numbers, yes/no,
hyperlinks etc. In the database the datatypes used
are short text, numbers and yes/no fields in the
tables. When opening the datasheet view, data is clearly shown in a datasheet format, with
material numbers to the left and all of the information to each material in columns.
Figure 5-11 Datasheet view of “tbl_material” table
Tables are connected to each other by relationships. There are three types of relationships:
• One to one, “Only include rows where the joined fields from both tables are equal”
• Many to one “ Include all records from table1 and only those records from table2
where the joined fields are equal”
• One to many “ Include all records from table2 and only those records from table1
where the joined fields are equal”
Figure 5-10 Design of the “tbl_Material” table
53
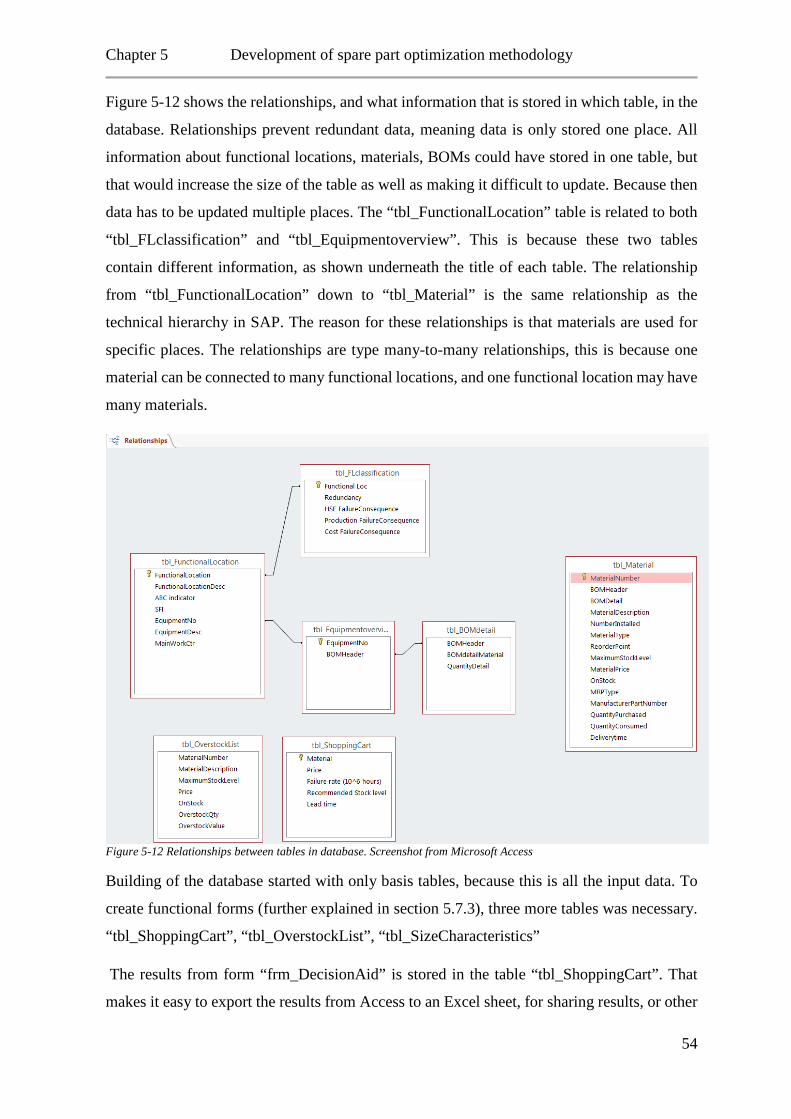
Chapter 5 Development of spare part optimization methodology
Figure 5-12 shows the relationships, and what information that is stored in which table, in the
database. Relationships prevent redundant data, meaning data is only stored one place. All
information about functional locations, materials, BOMs could have stored in one table, but
that would increase the size of the table as well as making it difficult to update. Because then
data has to be updated multiple places. The “tbl_FunctionalLocation” table is related to both
“tbl_FLclassification” and “tbl_Equipmentoverview”. This is because these two tables
contain different information, as shown underneath the title of each table. The relationship
from “tbl_FunctionalLocation” down to “tbl_Material” is the same relationship as the
technical hierarchy in SAP. The reason for these relationships is that materials are used for
specific places. The relationships are type many-to-many relationships, this is because one
material can be connected to many functional locations, and one functional location may have
many materials.
Figure 5-12 Relationships between tables in database. Screenshot from Microsoft Access
Building of the database started with only basis tables, because this is all the input data. To
create functional forms (further explained in section 5.7.3), three more tables was necessary.
“tbl_ShoppingCart”, “tbl_OverstockList”, “tbl_SizeCharacteristics”
The results from form “frm_DecisionAid” is stored in the table “tbl_ShoppingCart”. That
makes it easy to export the results from Access to an Excel sheet, for sharing results, or other
54
Chapter 5 Development of spare part optimization methodology
purposes. “tbl_ShoppingCart” stores data from two forms, “frm_DecisionAid”, and
“frm_DecideSpareQuantity”, the data stored from the two forms are listed below.
• From “frm_DecisionAid “
o Material number
o Price
o Failure rate
o Lead time
• From “frm_DecideSpareQuantity”
o Recommended stock level
The table “tbl_OverstockList”, stores the results from the form “frm_Overstock”. This serves
the same purpose as “tbl_ShoppingCart”, sharing the information with others. The overstock
lists are shown in form “frm_Overstock”, this contains a list of all materials that have larger
on stock quantities than the current maximum stock level.
The table “tbl_SizeCharacteristics” is used to store information regarding holding costs and
logistics costs depend on the size of the material. By storing the information in this table, it is
easy to change later, if it changes. The holding and logistics costs are further calculated in the
form “frm_DecisionAid”.
Queries in Access
What is a query?
A query is a request for data results, for action on data, or for both. You can use a query to answer a simple question, to perform calculations, to combine data from different tables, or even to add, change, or delete table data. Queries that you use to retrieve data from a table or to make calculations are called select queries. Queries that add, change, or delete data are called action queries. You can also use a query to supply data for a form or report. In a well-designed database, the data that you want to present by using a form or report is often located in several different tables. By using a query, you can assemble the data that you want to use before you design your form or report. (support.office.com, 2015)
55
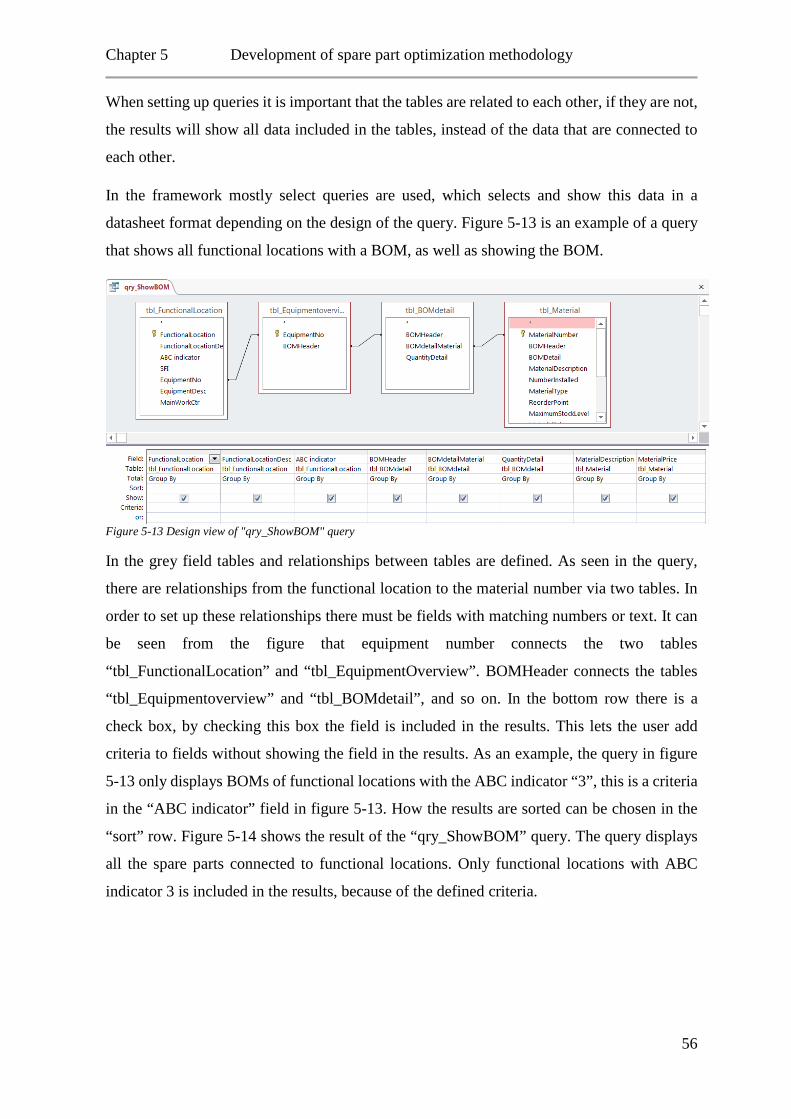
Chapter 5 Development of spare part optimization methodology
When setting up queries it is important that the tables are related to each other, if they are not,
the results will show all data included in the tables, instead of the data that are connected to
each other.
In the framework mostly select queries are used, which selects and show this data in a
datasheet format depending on the design of the query. Figure 5-13 is an example of a query
that shows all functional locations with a BOM, as well as showing the BOM.
Figure 5-13 Design view of "qry_ShowBOM" query
In the grey field tables and relationships between tables are defined. As seen in the query,
there are relationships from the functional location to the material number via two tables. In
order to set up these relationships there must be fields with matching numbers or text. It can
be seen from the figure that equipment number connects the two tables
“tbl_FunctionalLocation” and “tbl_EquipmentOverview”. BOMHeader connects the tables
“tbl_Equipmentoverview” and “tbl_BOMdetail”, and so on. In the bottom row there is a
check box, by checking this box the field is included in the results. This lets the user add
criteria to fields without showing the field in the results. As an example, the query in figure
5-13 only displays BOMs of functional locations with the ABC indicator “3”, this is a criteria
in the “ABC indicator” field in figure 5-13. How the results are sorted can be chosen in the
“sort” row. Figure 5-14 shows the result of the “qry_ShowBOM” query. The query displays
all the spare parts connected to functional locations. Only functional locations with ABC
indicator 3 is included in the results, because of the defined criteria.
56
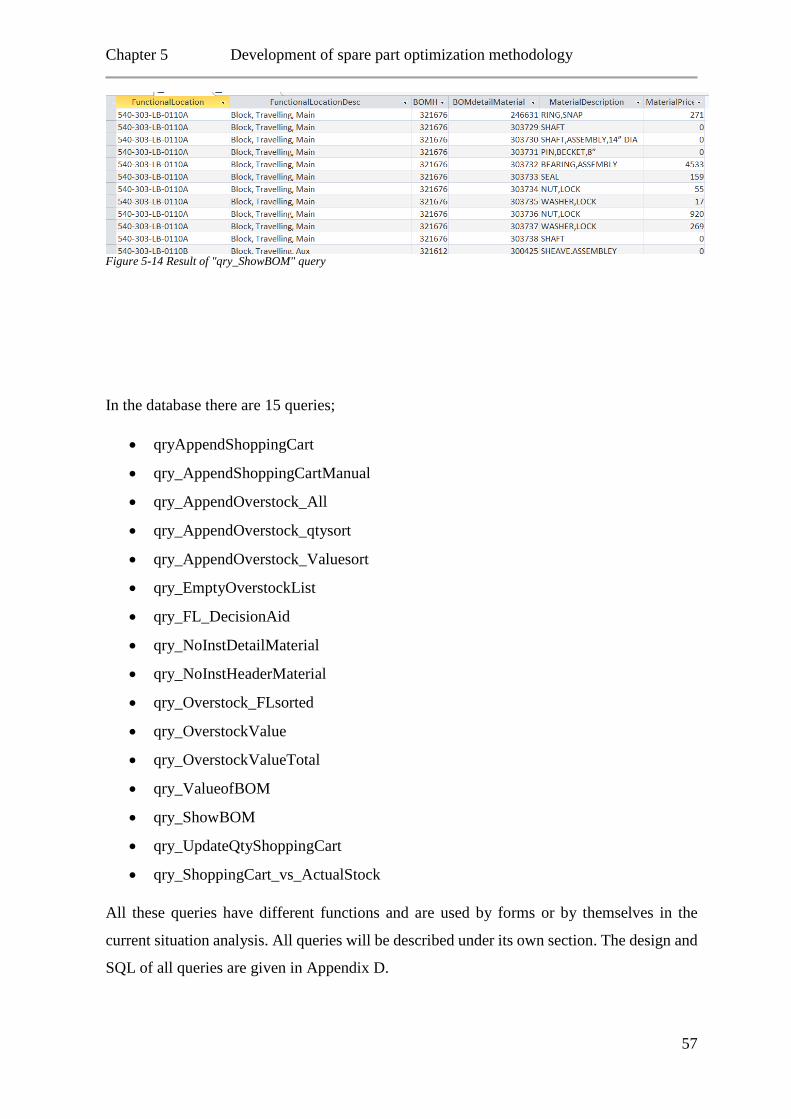
Chapter 5 Development of spare part optimization methodology
Figure 5-14 Result of "qry_ShowBOM" query
In the database there are 15 queries;
• qryAppendShoppingCart
• qry_AppendShoppingCartManual
• qry_AppendOverstock_All
• qry_AppendOverstock_qtysort
• qry_AppendOverstock_Valuesort
• qry_EmptyOverstockList
• qry_FL_DecisionAid
• qry_NoInstDetailMaterial
• qry_NoInstHeaderMaterial
• qry_Overstock_FLsorted
• qry_OverstockValue
• qry_OverstockValueTotal
• qry_ValueofBOM
• qry_ShowBOM
• qry_UpdateQtyShoppingCart
• qry_ShoppingCart_vs_ActualStock
All these queries have different functions and are used by forms or by themselves in the
current situation analysis. All queries will be described under its own section. The design and
SQL of all queries are given in Appendix D.
57
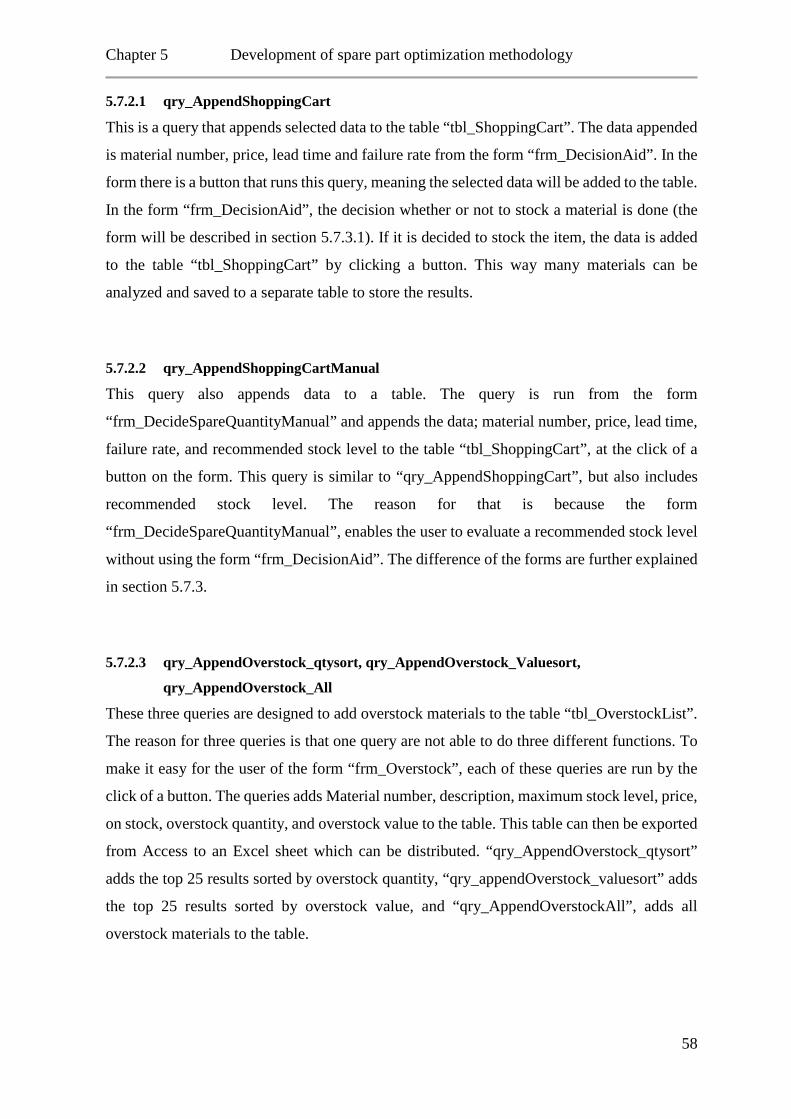
Chapter 5 Development of spare part optimization methodology
5.7.2.1 qry_AppendShoppingCart
This is a query that appends selected data to the table “tbl_ShoppingCart”. The data appended
is material number, price, lead time and failure rate from the form “frm_DecisionAid”. In the
form there is a button that runs this query, meaning the selected data will be added to the table.
In the form “frm_DecisionAid”, the decision whether or not to stock a material is done (the
form will be described in section 5.7.3.1). If it is decided to stock the item, the data is added
to the table “tbl_ShoppingCart” by clicking a button. This way many materials can be
analyzed and saved to a separate table to store the results.
5.7.2.2 qry_AppendShoppingCartManual
This query also appends data to a table. The query is run from the form
“frm_DecideSpareQuantityManual” and appends the data; material number, price, lead time,
failure rate, and recommended stock level to the table “tbl_ShoppingCart”, at the click of a
button on the form. This query is similar to “qry_AppendShoppingCart”, but also includes
recommended stock level. The reason for that is because the form
“frm_DecideSpareQuantityManual”, enables the user to evaluate a recommended stock level
without using the form “frm_DecisionAid”. The difference of the forms are further explained
in section 5.7.3.
5.7.2.3 qry_AppendOverstock_qtysort, qry_AppendOverstock_Valuesort,
qry_AppendOverstock_All
These three queries are designed to add overstock materials to the table “tbl_OverstockList”.
The reason for three queries is that one query are not able to do three different functions. To
make it easy for the user of the form “frm_Overstock”, each of these queries are run by the
click of a button. The queries adds Material number, description, maximum stock level, price,
on stock, overstock quantity, and overstock value to the table. This table can then be exported
from Access to an Excel sheet which can be distributed. “qry_AppendOverstock_qtysort”
adds the top 25 results sorted by overstock quantity, “qry_appendOverstock_valuesort” adds
the top 25 results sorted by overstock value, and “qry_AppendOverstockAll”, adds all
overstock materials to the table.
58
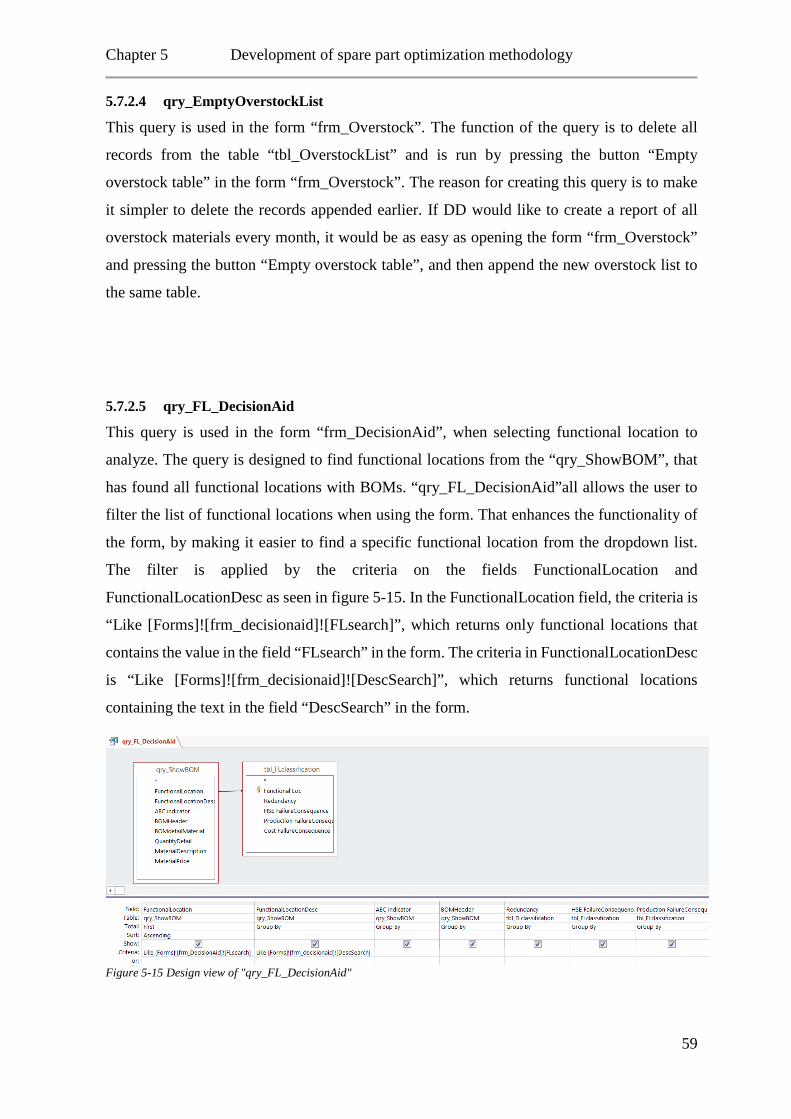
Chapter 5 Development of spare part optimization methodology
5.7.2.4 qry_EmptyOverstockList
This query is used in the form “frm_Overstock”. The function of the query is to delete all
records from the table “tbl_OverstockList” and is run by pressing the button “Empty
overstock table” in the form “frm_Overstock”. The reason for creating this query is to make
it simpler to delete the records appended earlier. If DD would like to create a report of all
overstock materials every month, it would be as easy as opening the form “frm_Overstock”
and pressing the button “Empty overstock table”, and then append the new overstock list to
the same table.
5.7.2.5 qry_FL_DecisionAid
This query is used in the form “frm_DecisionAid”, when selecting functional location to
analyze. The query is designed to find functional locations from the “qry_ShowBOM”, that
has found all functional locations with BOMs. “qry_FL_DecisionAid”all allows the user to
filter the list of functional locations when using the form. That enhances the functionality of
the form, by making it easier to find a specific functional location from the dropdown list.
The filter is applied by the criteria on the fields FunctionalLocation and
FunctionalLocationDesc as seen in figure 5-15. In the FunctionalLocation field, the criteria is
“Like [Forms]![frm_decisionaid]![FLsearch]”, which returns only functional locations that
contains the value in the field “FLsearch” in the form. The criteria in FunctionalLocationDesc
is “Like [Forms]![frm_decisionaid]![DescSearch]”, which returns functional locations
containing the text in the field “DescSearch” in the form.
Figure 5-15 Design view of "qry_FL_DecisionAid"
59
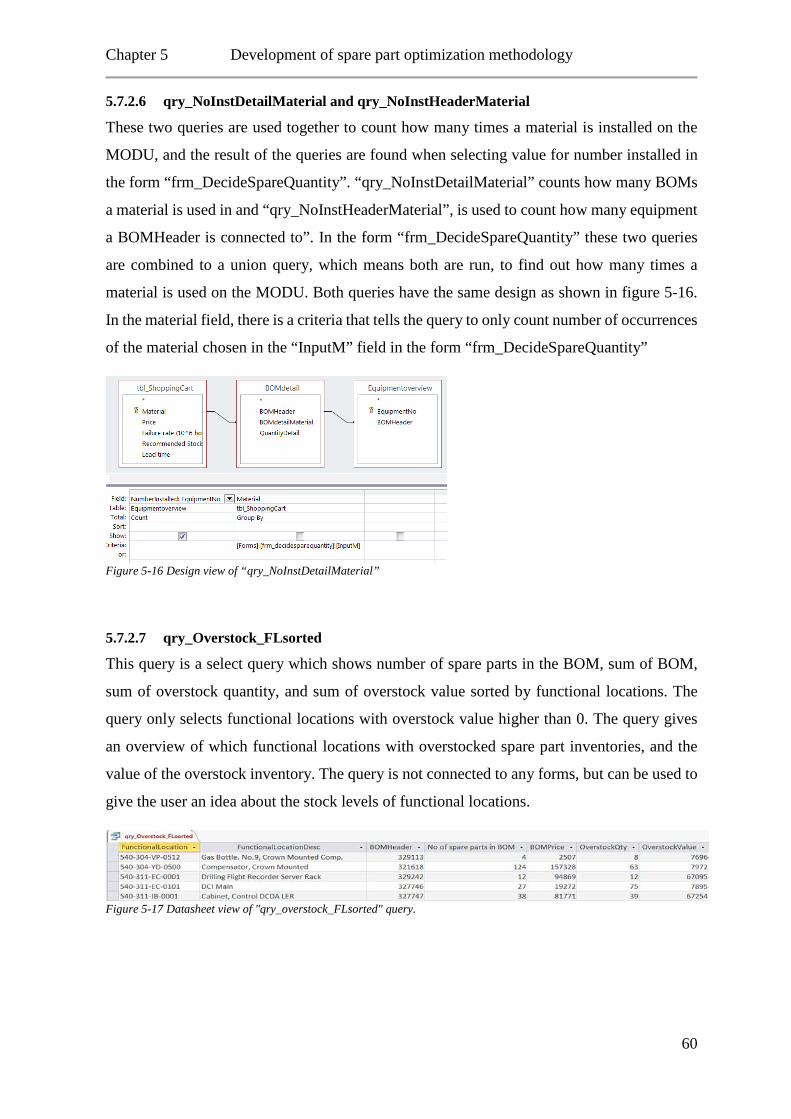
Chapter 5 Development of spare part optimization methodology
5.7.2.6 qry_NoInstDetailMaterial and qry_NoInstHeaderMaterial
These two queries are used together to count how many times a material is installed on the
MODU, and the result of the queries are found when selecting value for number installed in
the form “frm_DecideSpareQuantity”. “qry_NoInstDetailMaterial” counts how many BOMs
a material is used in and “qry_NoInstHeaderMaterial”, is used to count how many equipment
a BOMHeader is connected to”. In the form “frm_DecideSpareQuantity” these two queries
are combined to a union query, which means both are run, to find out how many times a
material is used on the MODU. Both queries have the same design as shown in figure 5-16.
In the material field, there is a criteria that tells the query to only count number of occurrences
of the material chosen in the “InputM” field in the form “frm_DecideSpareQuantity”
Figure 5-16 Design view of “qry_NoInstDetailMaterial”
5.7.2.7 qry_Overstock_FLsorted
This query is a select query which shows number of spare parts in the BOM, sum of BOM,
sum of overstock quantity, and sum of overstock value sorted by functional locations. The
query only selects functional locations with overstock value higher than 0. The query gives
an overview of which functional locations with overstocked spare part inventories, and the
value of the overstock inventory. The query is not connected to any forms, but can be used to
give the user an idea about the stock levels of functional locations.
Figure 5-17 Datasheet view of "qry_overstock_FLsorted" query.
60
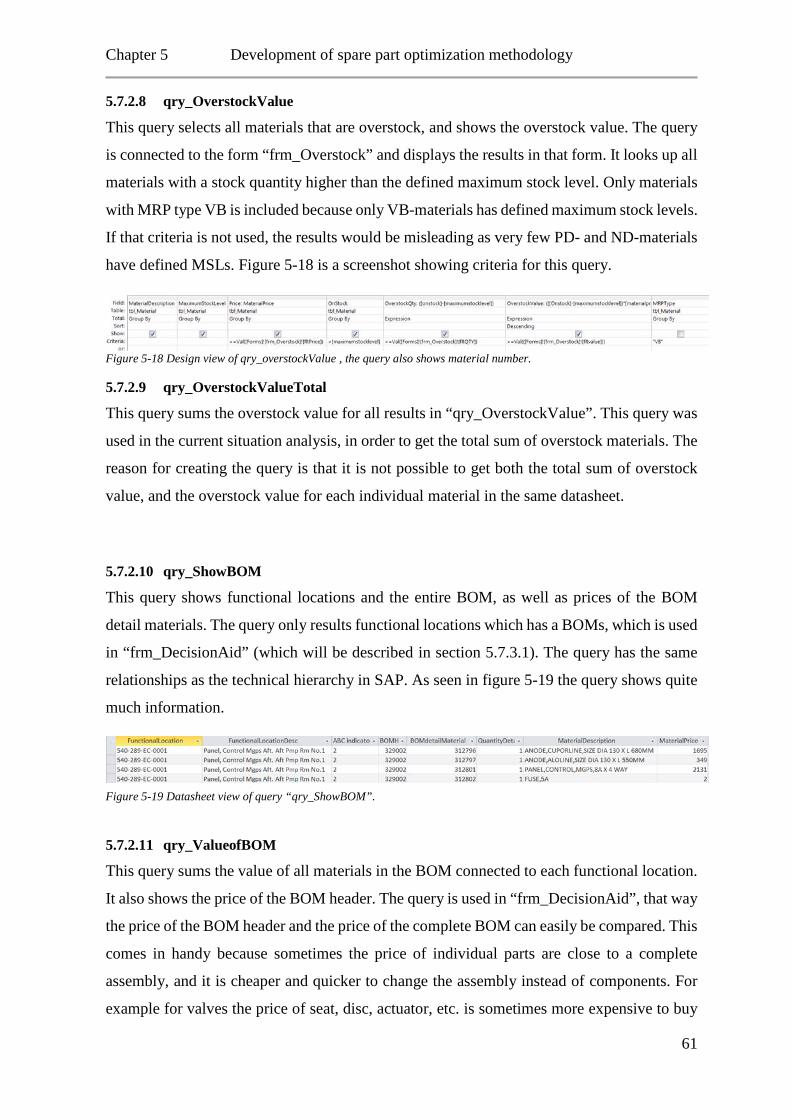
Chapter 5 Development of spare part optimization methodology
5.7.2.8 qry_OverstockValue
This query selects all materials that are overstock, and shows the overstock value. The query
is connected to the form “frm_Overstock” and displays the results in that form. It looks up all
materials with a stock quantity higher than the defined maximum stock level. Only materials
with MRP type VB is included because only VB-materials has defined maximum stock levels.
If that criteria is not used, the results would be misleading as very few PD- and ND-materials
have defined MSLs. Figure 5-18 is a screenshot showing criteria for this query.
Figure 5-18 Design view of qry_overstockValue , the query also shows material number.
5.7.2.9 qry_OverstockValueTotal
This query sums the overstock value for all results in “qry_OverstockValue”. This query was
used in the current situation analysis, in order to get the total sum of overstock materials. The
reason for creating the query is that it is not possible to get both the total sum of overstock
value, and the overstock value for each individual material in the same datasheet.
5.7.2.10 qry_ShowBOM
This query shows functional locations and the entire BOM, as well as prices of the BOM
detail materials. The query only results functional locations which has a BOMs, which is used
in “frm_DecisionAid” (which will be described in section 5.7.3.1). The query has the same
relationships as the technical hierarchy in SAP. As seen in figure 5-19 the query shows quite
much information.
5.7.2.11 qry_ValueofBOM
This query sums the value of all materials in the BOM connected to each functional location.
It also shows the price of the BOM header. The query is used in “frm_DecisionAid”, that way
the price of the BOM header and the price of the complete BOM can easily be compared. This
comes in handy because sometimes the price of individual parts are close to a complete
assembly, and it is cheaper and quicker to change the assembly instead of components. For
example for valves the price of seat, disc, actuator, etc. is sometimes more expensive to buy
Figure 5-19 Datasheet view of query “qry_ShowBOM”.
61
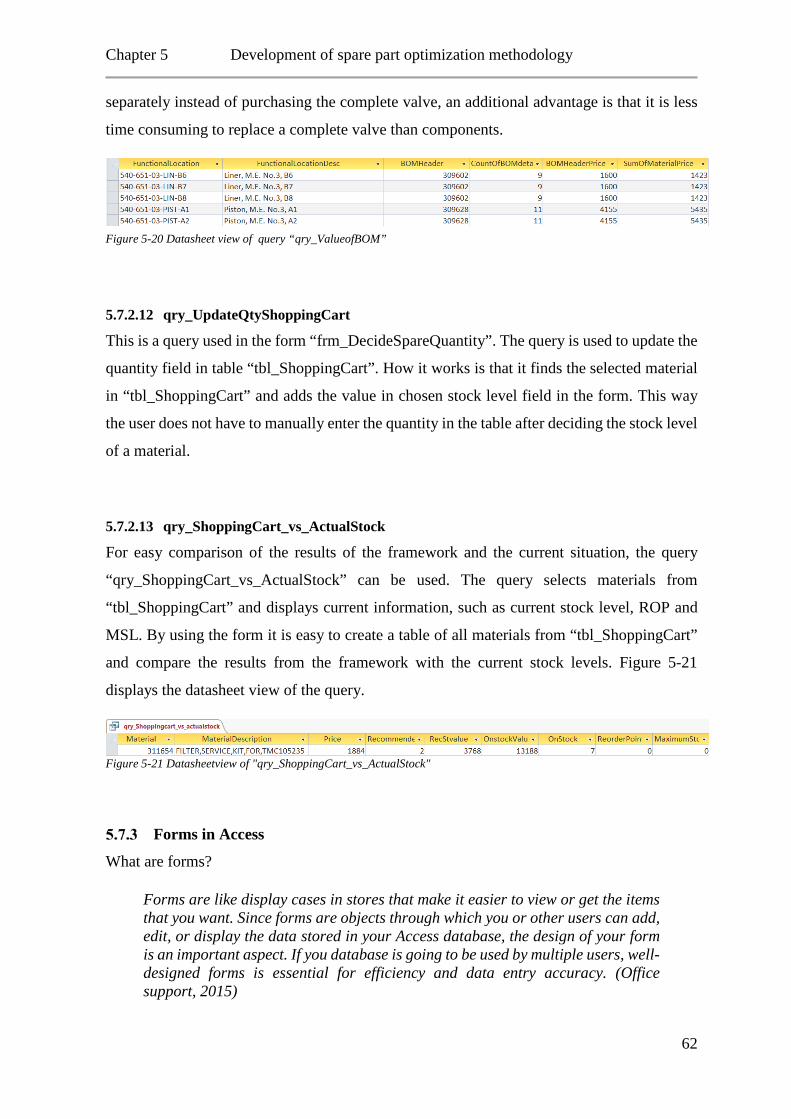
Chapter 5 Development of spare part optimization methodology
separately instead of purchasing the complete valve, an additional advantage is that it is less
time consuming to replace a complete valve than components.
5.7.2.12 qry_UpdateQtyShoppingCart
This is a query used in the form “frm_DecideSpareQuantity”. The query is used to update the
quantity field in table “tbl_ShoppingCart”. How it works is that it finds the selected material
in “tbl_ShoppingCart” and adds the value in chosen stock level field in the form. This way
the user does not have to manually enter the quantity in the table after deciding the stock level
of a material.
5.7.2.13 qry_ShoppingCart_vs_ActualStock
For easy comparison of the results of the framework and the current situation, the query
“qry_ShoppingCart_vs_ActualStock” can be used. The query selects materials from
“tbl_ShoppingCart” and displays current information, such as current stock level, ROP and
MSL. By using the form it is easy to create a table of all materials from “tbl_ShoppingCart”
and compare the results from the framework with the current stock levels. Figure 5-21
displays the datasheet view of the query.
Figure 5-21 Datasheetview of "qry_ShoppingCart_vs_ActualStock"
Forms in Access
What are forms?
Forms are like display cases in stores that make it easier to view or get the items that you want. Since forms are objects through which you or other users can add, edit, or display the data stored in your Access database, the design of your form is an important aspect. If you database is going to be used by multiple users, well-designed forms is essential for efficiency and data entry accuracy. (Office support, 2015)
Figure 5-20 Datasheet view of query “qry_ValueofBOM”
62
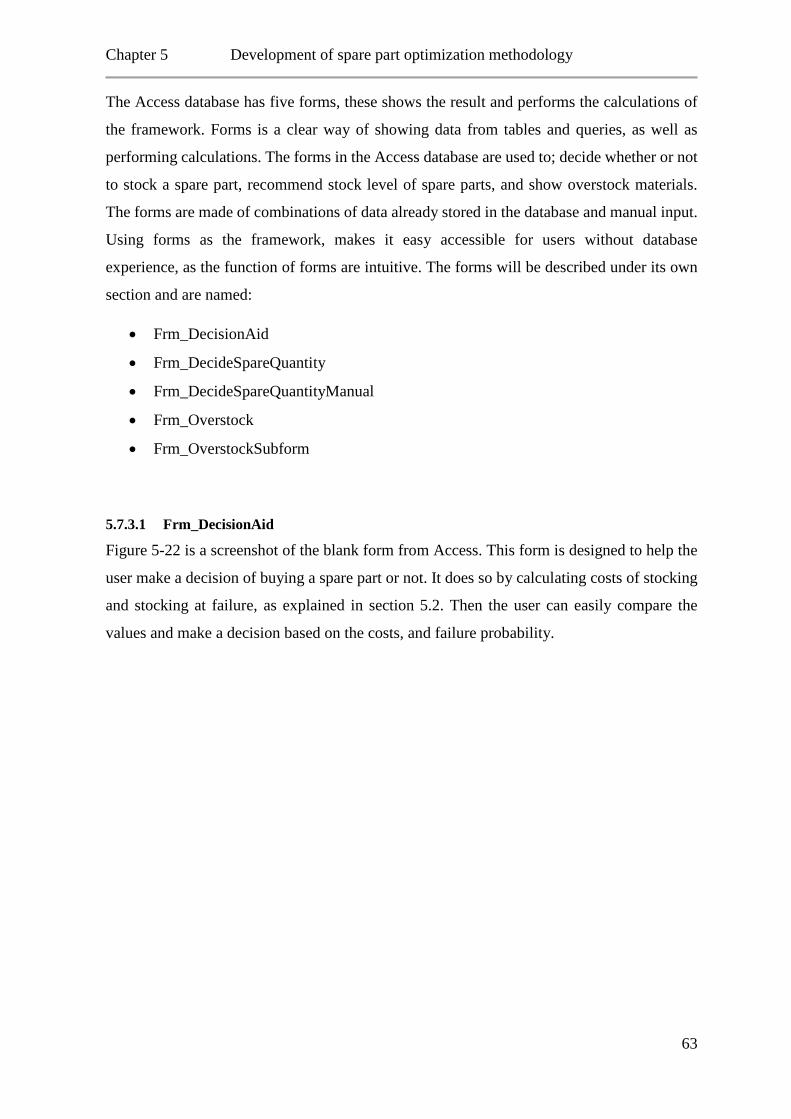
Chapter 5 Development of spare part optimization methodology
The Access database has five forms, these shows the result and performs the calculations of
the framework. Forms is a clear way of showing data from tables and queries, as well as
performing calculations. The forms in the Access database are used to; decide whether or not
to stock a spare part, recommend stock level of spare parts, and show overstock materials.
The forms are made of combinations of data already stored in the database and manual input.
Using forms as the framework, makes it easy accessible for users without database
experience, as the function of forms are intuitive. The forms will be described under its own
section and are named:
• Frm_DecisionAid
• Frm_DecideSpareQuantity
• Frm_DecideSpareQuantityManual
• Frm_Overstock
• Frm_OverstockSubform
5.7.3.1 Frm_DecisionAid
Figure 5-22 is a screenshot of the blank form from Access. This form is designed to help the
user make a decision of buying a spare part or not. It does so by calculating costs of stocking
and stocking at failure, as explained in section 5.2. Then the user can easily compare the
values and make a decision based on the costs, and failure probability.
63
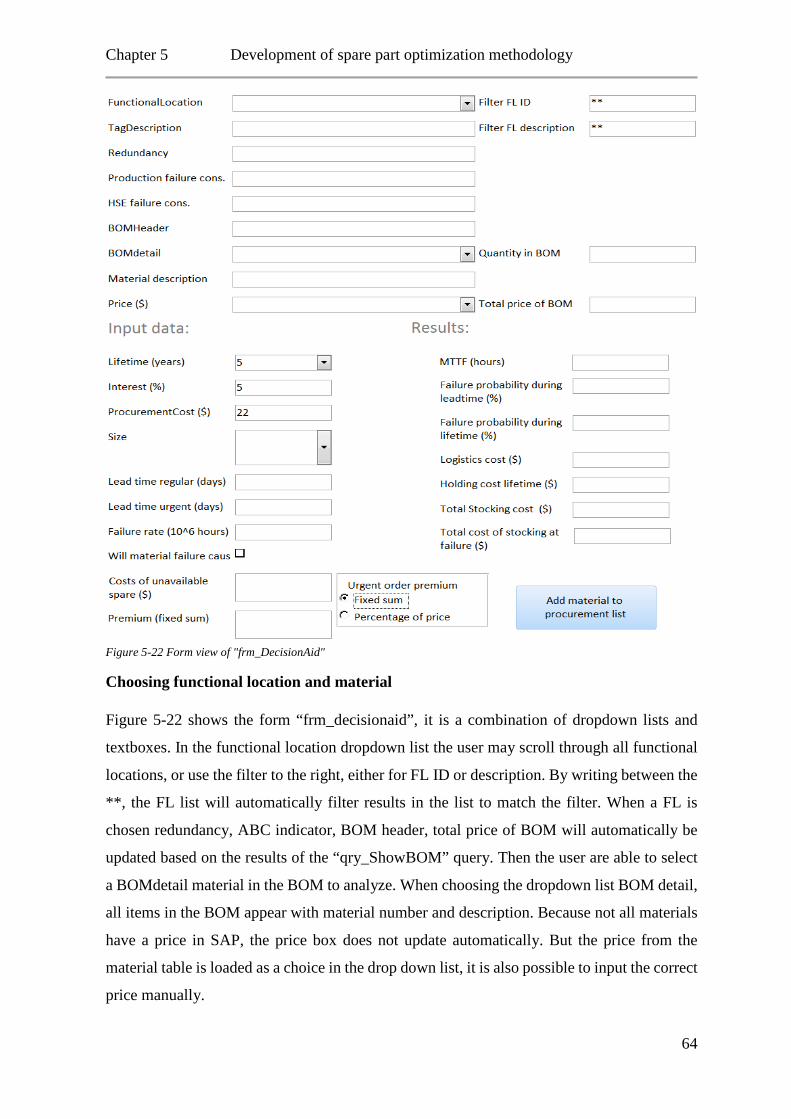
Chapter 5 Development of spare part optimization methodology
Figure 5-22 Form view of "frm_DecisionAid"
Choosing functional location and material
Figure 5-22 shows the form “frm_decisionaid”, it is a combination of dropdown lists and
textboxes. In the functional location dropdown list the user may scroll through all functional
locations, or use the filter to the right, either for FL ID or description. By writing between the
**, the FL list will automatically filter results in the list to match the filter. When a FL is
chosen redundancy, ABC indicator, BOM header, total price of BOM will automatically be
updated based on the results of the “qry_ShowBOM” query. Then the user are able to select
a BOMdetail material in the BOM to analyze. When choosing the dropdown list BOM detail,
all items in the BOM appear with material number and description. Because not all materials
have a price in SAP, the price box does not update automatically. But the price from the
material table is loaded as a choice in the drop down list, it is also possible to input the correct
price manually.
64
Chapter 5 Development of spare part optimization methodology
Input data
To calculate the total costs of materials, the form requires more data than SAP can provide in
order to calculate costs of materials. These are listed under the input column.
Lifetime can be chosen from a list; 5, 10, 15 or 20. The default value is 5 years, other values
can also be used. The lifetime is referred to as the lifetime of the functional location before
an overhaul, for example a complete mud pump.
Interest is set to a default value of 5%, but may be changed manually. Interest is used to
calculate tied capital cost.
Procurement cost is default $22 according to the calculation in section 5.2.2.2, the value can
be changed if assumptions change.
The size field is a drop down list with values; large, medium, and small. This influences
logistics and holding cost as explained in section 5.2.2.3 and 5.2.2.1, the percentages are
stored in the table “characteristics”, this way these may be changed easily if assumptions
change.
Lead time (days) is set as an input value as the data in SAP was entered generically as 70 days
for all materials. Because it is known that the lead time is wrong in SAP the form is set up for
manual input of the lead time.
Failure rate: As the failure rate data in SAP is scarce, failure rates must be found in OREDA.
When the MODU has been in operation for some years, data from SAP may be used to a
larger degree. The failure rates in OREDA is given in failures per million hours, both calendar
time and operational time. For some equipment it is most realistic to use calendar time, and
other it is most realistic to use operational time, this depends on the equipment. In the
calculations calendar time was used because this number is more reliable as data collection
of operational hours for equipment that is only used for some time and turned off is generally
poor. The failure rate is used to calculate MTTF, this is a number which is more intuitive.
That is why it is included as a result, then the user can “get a feel” how long one can expect
equipment to run before failure. If failure rates of the material is available, this should be
used, otherwise the failure rate of the functional location can be used.
MTTF (hours) is used to calculate failure probability. The MTTF is directly calculated (as
MTTF= 1000000/Failure rate) when the failure rate is entered. MTTF is further used to
calculate failure probability during lifetime and lead time.
65
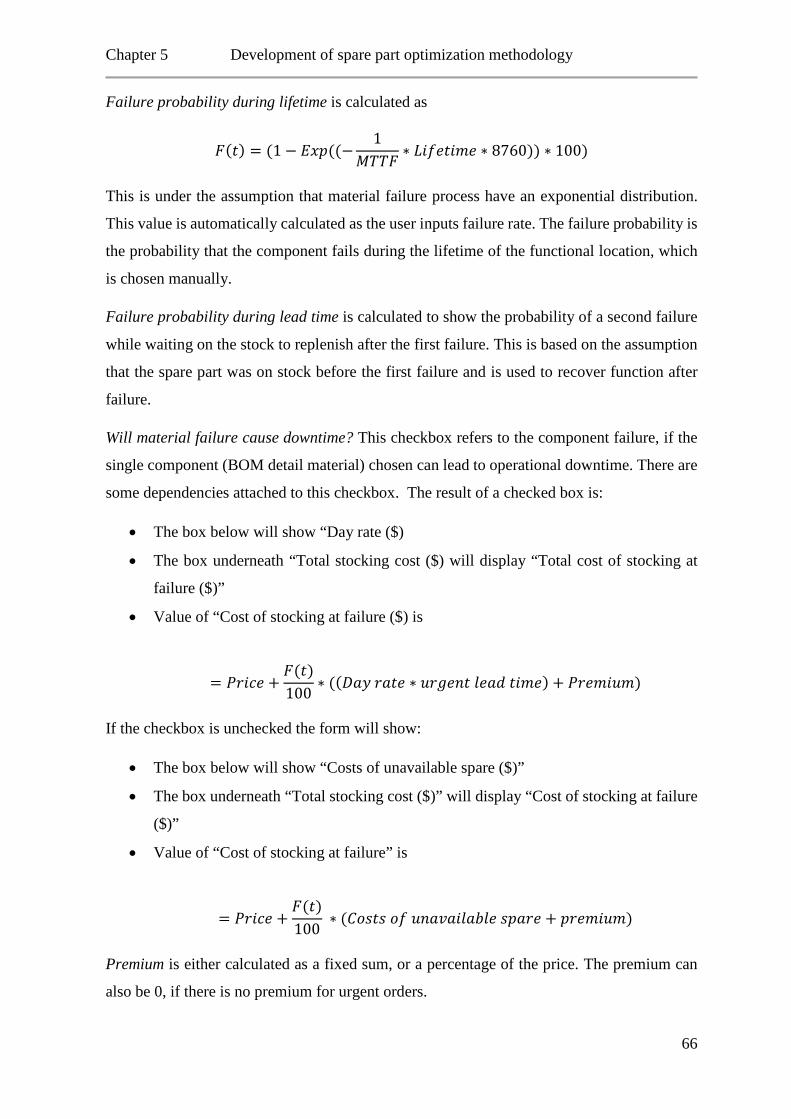
Chapter 5 Development of spare part optimization methodology
Failure probability during lifetime is calculated as
𝑀𝑀(𝑃𝑃) = (1 − 𝐸𝐸𝐸𝐸𝑝𝑝((−1
𝑀𝑀𝑇𝑇𝑇𝑇𝑀𝑀∗ 𝐿𝐿𝑃𝑃𝐿𝐿𝑃𝑃𝑃𝑃𝑃𝑃𝐿𝐿𝑃𝑃 ∗ 8760)) ∗ 100)
This is under the assumption that material failure process have an exponential distribution.
This value is automatically calculated as the user inputs failure rate. The failure probability is
the probability that the component fails during the lifetime of the functional location, which
is chosen manually.
Failure probability during lead time is calculated to show the probability of a second failure
while waiting on the stock to replenish after the first failure. This is based on the assumption
that the spare part was on stock before the first failure and is used to recover function after
failure.
Will material failure cause downtime? This checkbox refers to the component failure, if the
single component (BOM detail material) chosen can lead to operational downtime. There are
some dependencies attached to this checkbox. The result of a checked box is:
• The box below will show “Day rate ($)
• The box underneath “Total stocking cost ($) will display “Total cost of stocking at
failure ($)”
• Value of “Cost of stocking at failure ($) is
= 𝑃𝑃𝑃𝑃𝑃𝑃𝑃𝑃𝑃𝑃 +𝑀𝑀(𝑃𝑃)100
∗ ((𝐷𝐷𝑃𝑃𝑃𝑃 𝑃𝑃𝑃𝑃𝑃𝑃𝑃𝑃 ∗ 𝑝𝑝𝑃𝑃𝑟𝑟𝑃𝑃𝐼𝐼𝑃𝑃 𝑃𝑃𝑃𝑃𝑃𝑃𝐿𝐿 𝑃𝑃𝑃𝑃𝐿𝐿𝑃𝑃) + 𝑃𝑃𝑃𝑃𝑃𝑃𝐿𝐿𝑃𝑃𝑝𝑝𝐿𝐿)
If the checkbox is unchecked the form will show:
• The box below will show “Costs of unavailable spare ($)”
• The box underneath “Total stocking cost ($)” will display “Cost of stocking at failure
($)”
• Value of “Cost of stocking at failure” is
= 𝑃𝑃𝑃𝑃𝑃𝑃𝑃𝑃𝑃𝑃 +𝑀𝑀(𝑃𝑃)100
∗ (𝐶𝐶𝑃𝑃𝐼𝐼𝑃𝑃𝐼𝐼 𝑃𝑃𝐿𝐿 𝑝𝑝𝐼𝐼𝑃𝑃𝐴𝐴𝑃𝑃𝑃𝑃𝑃𝑃𝑃𝑃𝑃𝑃𝑃𝑃𝑃𝑃 𝐼𝐼𝑝𝑝𝑃𝑃𝑃𝑃𝑃𝑃 + 𝑝𝑝𝑃𝑃𝑃𝑃𝐿𝐿𝑃𝑃𝑝𝑝𝐿𝐿)
Premium is either calculated as a fixed sum, or a percentage of the price. The premium can
also be 0, if there is no premium for urgent orders.
66
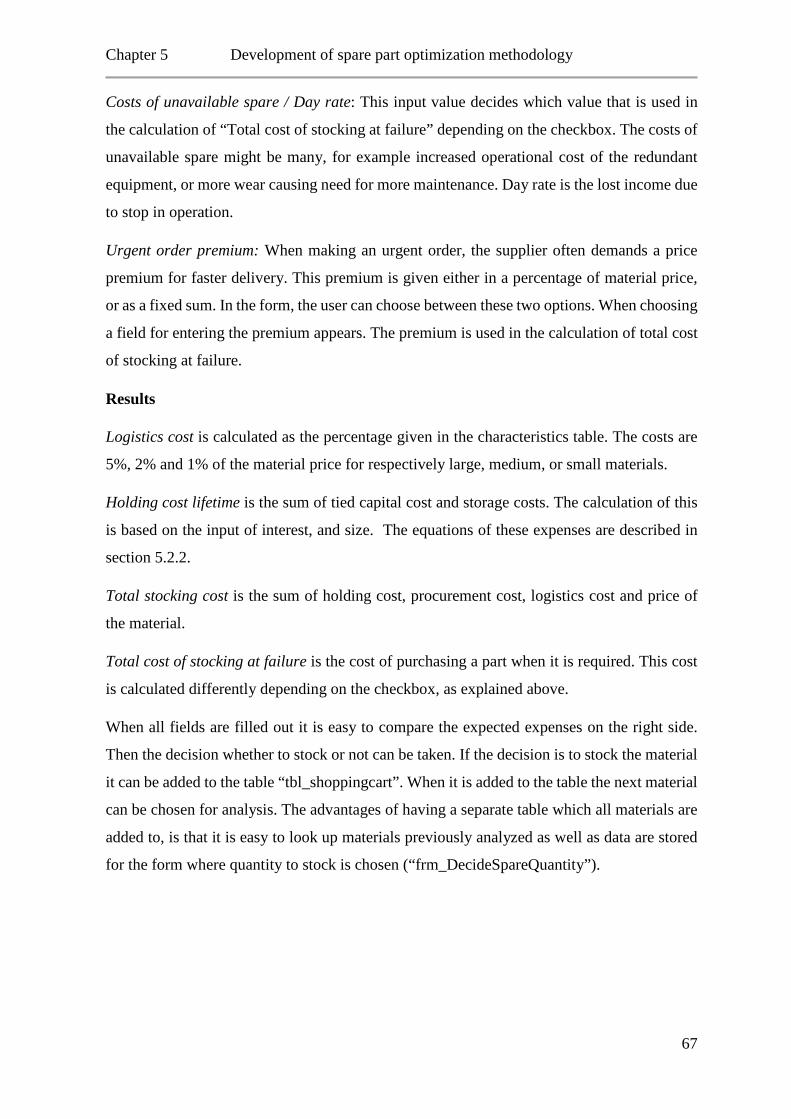
Chapter 5 Development of spare part optimization methodology
Costs of unavailable spare / Day rate: This input value decides which value that is used in
the calculation of “Total cost of stocking at failure” depending on the checkbox. The costs of
unavailable spare might be many, for example increased operational cost of the redundant
equipment, or more wear causing need for more maintenance. Day rate is the lost income due
to stop in operation.
Urgent order premium: When making an urgent order, the supplier often demands a price
premium for faster delivery. This premium is given either in a percentage of material price,
or as a fixed sum. In the form, the user can choose between these two options. When choosing
a field for entering the premium appears. The premium is used in the calculation of total cost
of stocking at failure.
Results
Logistics cost is calculated as the percentage given in the characteristics table. The costs are
5%, 2% and 1% of the material price for respectively large, medium, or small materials.
Holding cost lifetime is the sum of tied capital cost and storage costs. The calculation of this
is based on the input of interest, and size. The equations of these expenses are described in
section 5.2.2.
Total stocking cost is the sum of holding cost, procurement cost, logistics cost and price of
the material.
Total cost of stocking at failure is the cost of purchasing a part when it is required. This cost
is calculated differently depending on the checkbox, as explained above.
When all fields are filled out it is easy to compare the expected expenses on the right side.
Then the decision whether to stock or not can be taken. If the decision is to stock the material
it can be added to the table “tbl_shoppingcart”. When it is added to the table the next material
can be chosen for analysis. The advantages of having a separate table which all materials are
added to, is that it is easy to look up materials previously analyzed as well as data are stored
for the form where quantity to stock is chosen (“frm_DecideSpareQuantity”).
67
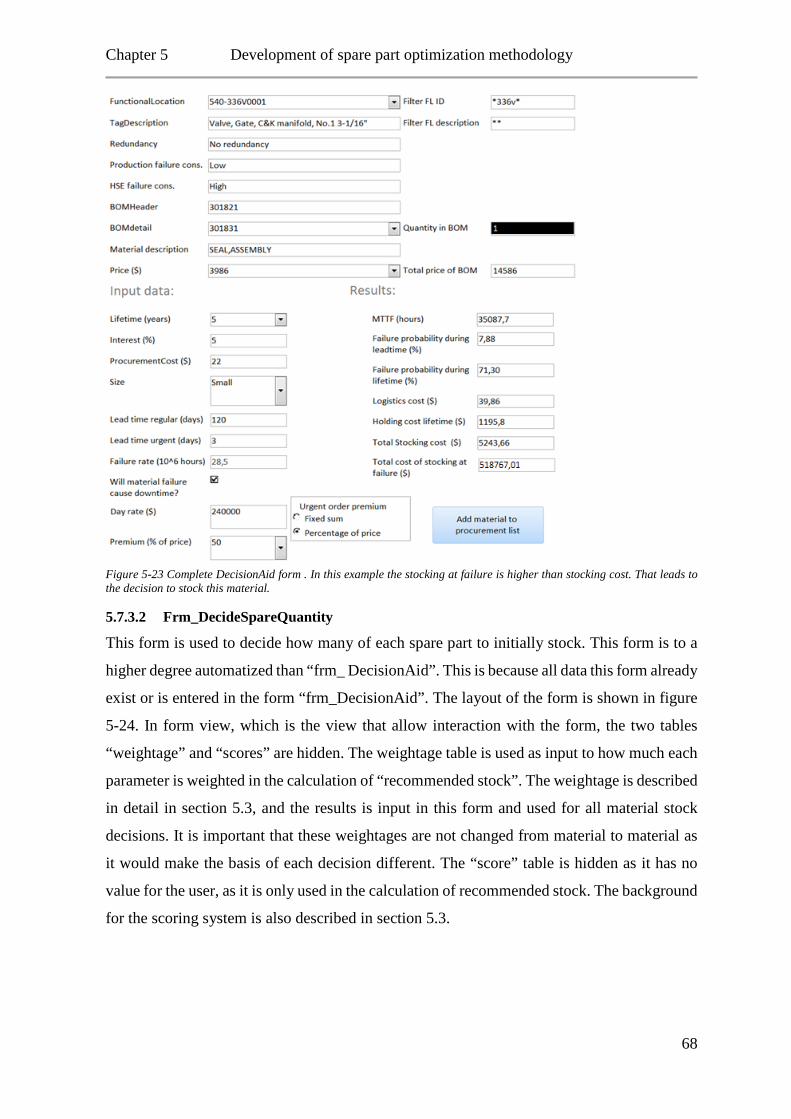
Chapter 5 Development of spare part optimization methodology
Figure 5-23 Complete DecisionAid form . In this example the stocking at failure is higher than stocking cost. That leads to the decision to stock this material.
5.7.3.2 Frm_DecideSpareQuantity
This form is used to decide how many of each spare part to initially stock. This form is to a
higher degree automatized than “frm_ DecisionAid”. This is because all data this form already
exist or is entered in the form “frm_DecisionAid”. The layout of the form is shown in figure
5-24. In form view, which is the view that allow interaction with the form, the two tables
“weightage” and “scores” are hidden. The weightage table is used as input to how much each
parameter is weighted in the calculation of “recommended stock”. The weightage is described
in detail in section 5.3, and the results is input in this form and used for all material stock
decisions. It is important that these weightages are not changed from material to material as
it would make the basis of each decision different. The “score” table is hidden as it has no
value for the user, as it is only used in the calculation of recommended stock. The background
for the scoring system is also described in section 5.3.
68
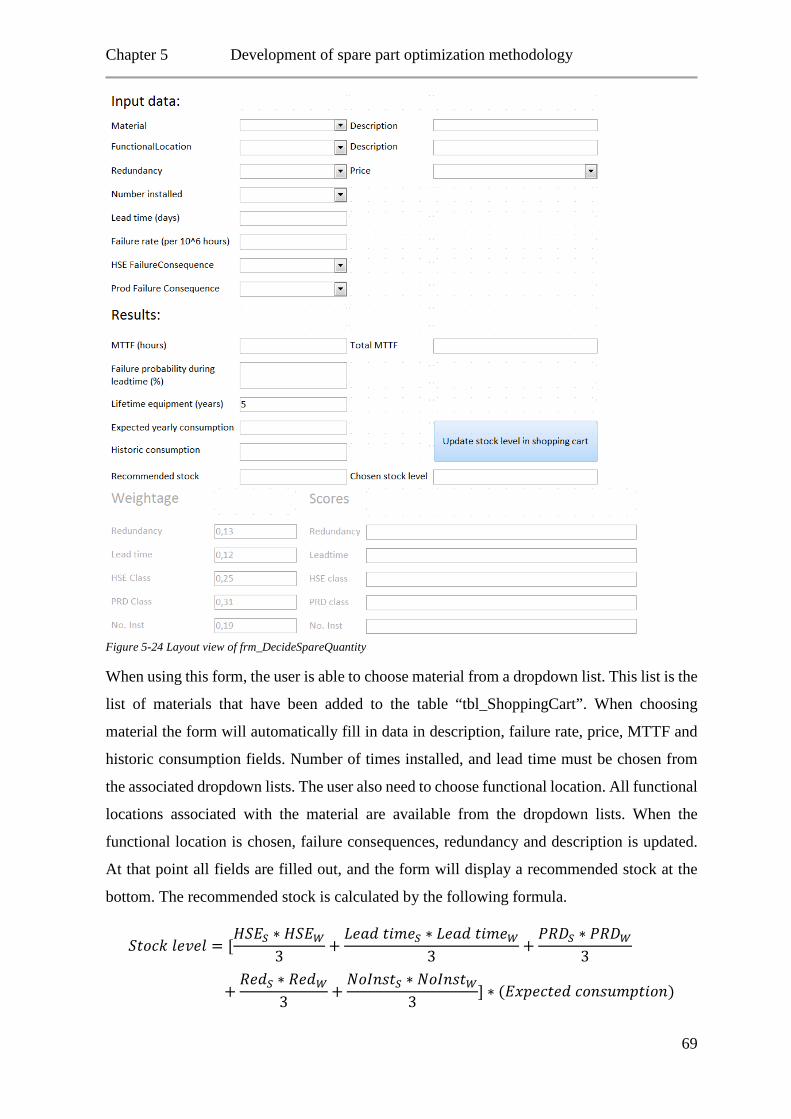
Chapter 5 Development of spare part optimization methodology
Figure 5-24 Layout view of frm_DecideSpareQuantity
When using this form, the user is able to choose material from a dropdown list. This list is the
list of materials that have been added to the table “tbl_ShoppingCart”. When choosing
material the form will automatically fill in data in description, failure rate, price, MTTF and
historic consumption fields. Number of times installed, and lead time must be chosen from
the associated dropdown lists. The user also need to choose functional location. All functional
locations associated with the material are available from the dropdown lists. When the
functional location is chosen, failure consequences, redundancy and description is updated.
At that point all fields are filled out, and the form will display a recommended stock at the
bottom. The recommended stock is calculated by the following formula.
𝑆𝑆𝑃𝑃𝑃𝑃𝑃𝑃𝑠𝑠 𝑃𝑃𝑃𝑃𝐴𝐴𝑃𝑃𝑃𝑃 = [𝐻𝐻𝑆𝑆𝐸𝐸𝑆𝑆 ∗ 𝐻𝐻𝑆𝑆𝐸𝐸𝑊𝑊
3+𝐿𝐿𝑃𝑃𝑃𝑃𝐿𝐿 𝑃𝑃𝑃𝑃𝐿𝐿𝑃𝑃𝑆𝑆 ∗ 𝐿𝐿𝑃𝑃𝑃𝑃𝐿𝐿 𝑃𝑃𝑃𝑃𝐿𝐿𝑃𝑃𝑊𝑊
3+𝑃𝑃𝑅𝑅𝐷𝐷𝑆𝑆 ∗ 𝑃𝑃𝑅𝑅𝐷𝐷𝑊𝑊
3
+𝑅𝑅𝑃𝑃𝐿𝐿𝑆𝑆 ∗ 𝑅𝑅𝑃𝑃𝐿𝐿𝑊𝑊
3+𝑁𝑁𝑃𝑃𝐼𝐼𝐼𝐼𝐼𝐼𝑃𝑃𝑆𝑆 ∗ 𝑁𝑁𝑃𝑃𝐼𝐼𝐼𝐼𝐼𝐼𝑃𝑃𝑊𝑊
3] ∗ (𝐸𝐸𝐸𝐸𝑝𝑝𝑃𝑃𝑃𝑃𝑃𝑃𝑃𝑃𝐿𝐿 𝑃𝑃𝑃𝑃𝐼𝐼𝐼𝐼𝑝𝑝𝐿𝐿𝑝𝑝𝑃𝑃𝑃𝑃𝑃𝑃𝐼𝐼)
69
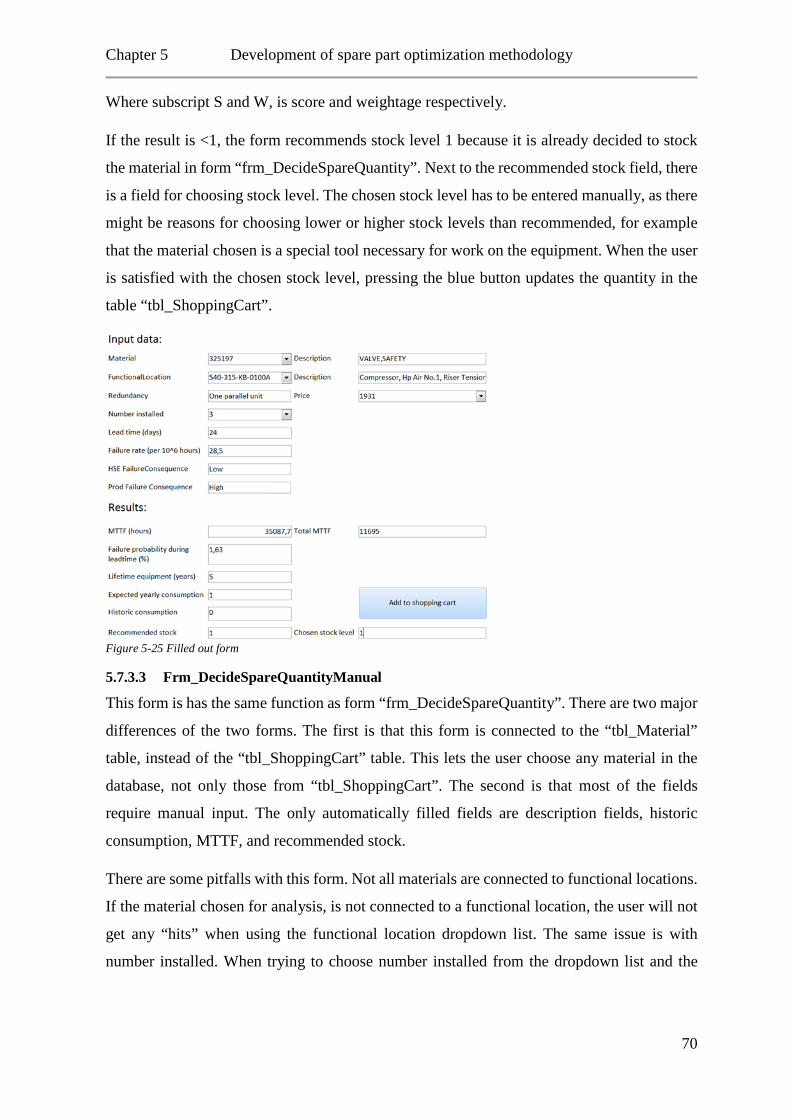
Chapter 5 Development of spare part optimization methodology
Where subscript S and W, is score and weightage respectively.
If the result is <1, the form recommends stock level 1 because it is already decided to stock
the material in form “frm_DecideSpareQuantity”. Next to the recommended stock field, there
is a field for choosing stock level. The chosen stock level has to be entered manually, as there
might be reasons for choosing lower or higher stock levels than recommended, for example
that the material chosen is a special tool necessary for work on the equipment. When the user
is satisfied with the chosen stock level, pressing the blue button updates the quantity in the
table “tbl_ShoppingCart”.
Figure 5-25 Filled out form
5.7.3.3 Frm_DecideSpareQuantityManual
This form is has the same function as form “frm_DecideSpareQuantity”. There are two major
differences of the two forms. The first is that this form is connected to the “tbl_Material”
table, instead of the “tbl_ShoppingCart” table. This lets the user choose any material in the
database, not only those from “tbl_ShoppingCart”. The second is that most of the fields
require manual input. The only automatically filled fields are description fields, historic
consumption, MTTF, and recommended stock.
There are some pitfalls with this form. Not all materials are connected to functional locations.
If the material chosen for analysis, is not connected to a functional location, the user will not
get any “hits” when using the functional location dropdown list. The same issue is with
number installed. When trying to choose number installed from the dropdown list and the
70
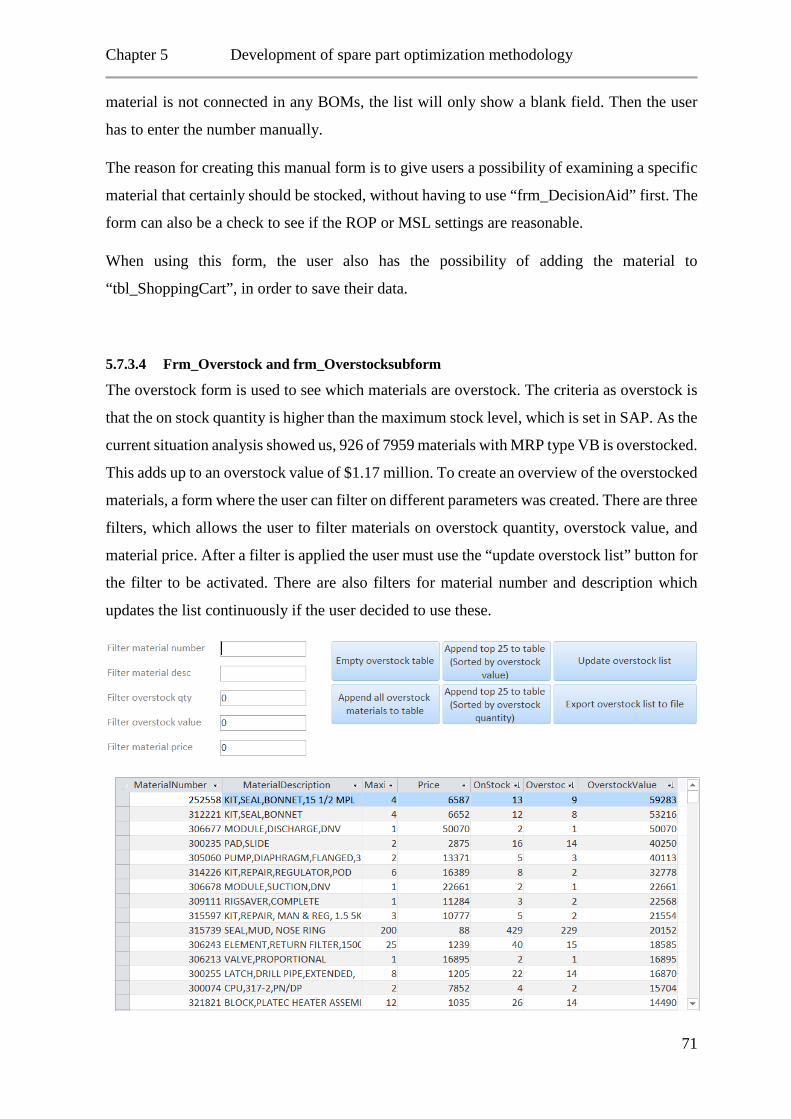
Chapter 5 Development of spare part optimization methodology
material is not connected in any BOMs, the list will only show a blank field. Then the user
has to enter the number manually.
The reason for creating this manual form is to give users a possibility of examining a specific
material that certainly should be stocked, without having to use “frm_DecisionAid” first. The
form can also be a check to see if the ROP or MSL settings are reasonable.
When using this form, the user also has the possibility of adding the material to
“tbl_ShoppingCart”, in order to save their data.
5.7.3.4 Frm_Overstock and frm_Overstocksubform
The overstock form is used to see which materials are overstock. The criteria as overstock is
that the on stock quantity is higher than the maximum stock level, which is set in SAP. As the
current situation analysis showed us, 926 of 7959 materials with MRP type VB is overstocked.
This adds up to an overstock value of $1.17 million. To create an overview of the overstocked
materials, a form where the user can filter on different parameters was created. There are three
filters, which allows the user to filter materials on overstock quantity, overstock value, and
material price. After a filter is applied the user must use the “update overstock list” button for
the filter to be activated. There are also filters for material number and description which
updates the list continuously if the user decided to use these.
71
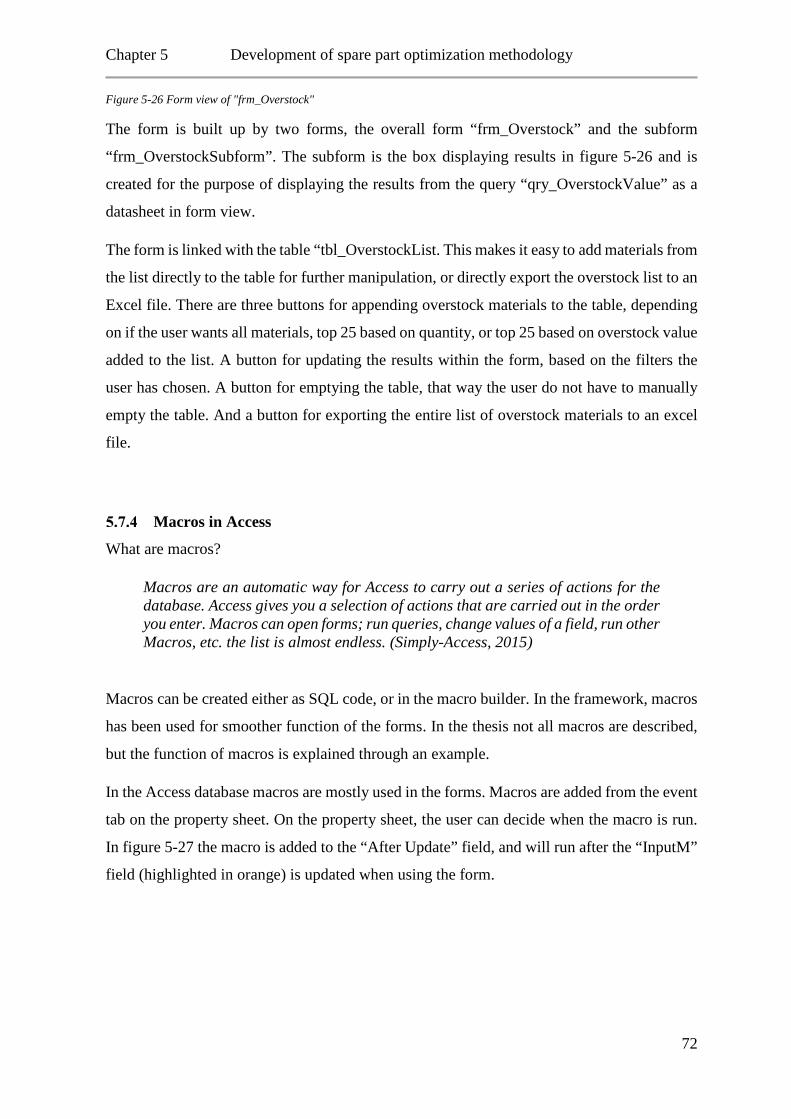
Chapter 5 Development of spare part optimization methodology
Figure 5-26 Form view of "frm_Overstock"
The form is built up by two forms, the overall form “frm_Overstock” and the subform
“frm_OverstockSubform”. The subform is the box displaying results in figure 5-26 and is
created for the purpose of displaying the results from the query “qry_OverstockValue” as a
datasheet in form view.
The form is linked with the table “tbl_OverstockList. This makes it easy to add materials from
the list directly to the table for further manipulation, or directly export the overstock list to an
Excel file. There are three buttons for appending overstock materials to the table, depending
on if the user wants all materials, top 25 based on quantity, or top 25 based on overstock value
added to the list. A button for updating the results within the form, based on the filters the
user has chosen. A button for emptying the table, that way the user do not have to manually
empty the table. And a button for exporting the entire list of overstock materials to an excel
file.
Macros in Access
What are macros?
Macros are an automatic way for Access to carry out a series of actions for the database. Access gives you a selection of actions that are carried out in the order you enter. Macros can open forms; run queries, change values of a field, run other Macros, etc. the list is almost endless. (Simply-Access, 2015)
Macros can be created either as SQL code, or in the macro builder. In the framework, macros
has been used for smoother function of the forms. In the thesis not all macros are described,
but the function of macros is explained through an example.
In the Access database macros are mostly used in the forms. Macros are added from the event
tab on the property sheet. On the property sheet, the user can decide when the macro is run.
In figure 5-27 the macro is added to the “After Update” field, and will run after the “InputM”
field (highlighted in orange) is updated when using the form.
72
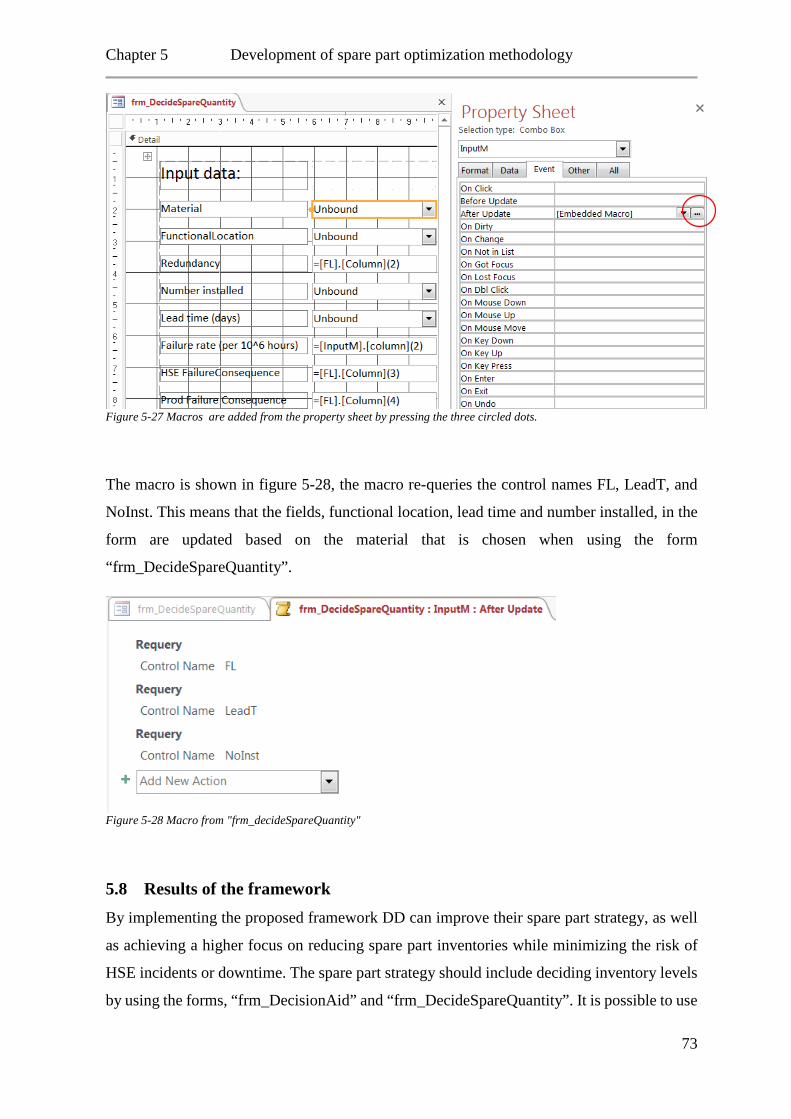
Chapter 5 Development of spare part optimization methodology
Figure 5-27 Macros are added from the property sheet by pressing the three circled dots.
The macro is shown in figure 5-28, the macro re-queries the control names FL, LeadT, and
NoInst. This means that the fields, functional location, lead time and number installed, in the
form are updated based on the material that is chosen when using the form
“frm_DecideSpareQuantity”.
Figure 5-28 Macro from "frm_decideSpareQuantity"
5.8 Results of the framework By implementing the proposed framework DD can improve their spare part strategy, as well
as achieving a higher focus on reducing spare part inventories while minimizing the risk of
HSE incidents or downtime. The spare part strategy should include deciding inventory levels
by using the forms, “frm_DecisionAid” and “frm_DecideSpareQuantity”. It is possible to use
73
Chapter 5 Development of spare part optimization methodology
the form “frm_DecisionAid” to go through the entire BOM structured by choosing functional
location. Materials from the BOM that are determined to be stocked are added to the table
“tbl_ShoppingCart”, then the ROP is decided by using “frm_DecideSpareQuantity”.
In the current situation analysis, it was discovered that many materials are not connected to
functional locations or equipment by BOMs. Because of this a form for deciding stock levels
for such these materials was developed. This is based on the same parameters as
“frm_DecideSpareQuantity”, but requires information such as failure rate, consequence
classification, number installed, etc. to be entered manually.
The use of forms makes it possible to justify and document the spare part needs, by displaying
the relevant parameters, and showing what potential costs of not having sufficient spare parts
on stock are. This makes it easier for the finance people to understand what impact reducing
spare part inventories to a minimum will have. Even though not all functional failures lead to
downtime, there are other related costs to failure, such as reduced capabilities of a pumping
system, or further damage leading to a bigger repair if it is not done within a short time period.
Overstocked materials are easy to find with the framework, and overstock form. When
reporting overstock this should lead to a count of the physical inventory, raise the ROP and/or
MSL, or impose a procurement stop on the overstocked materials.
74
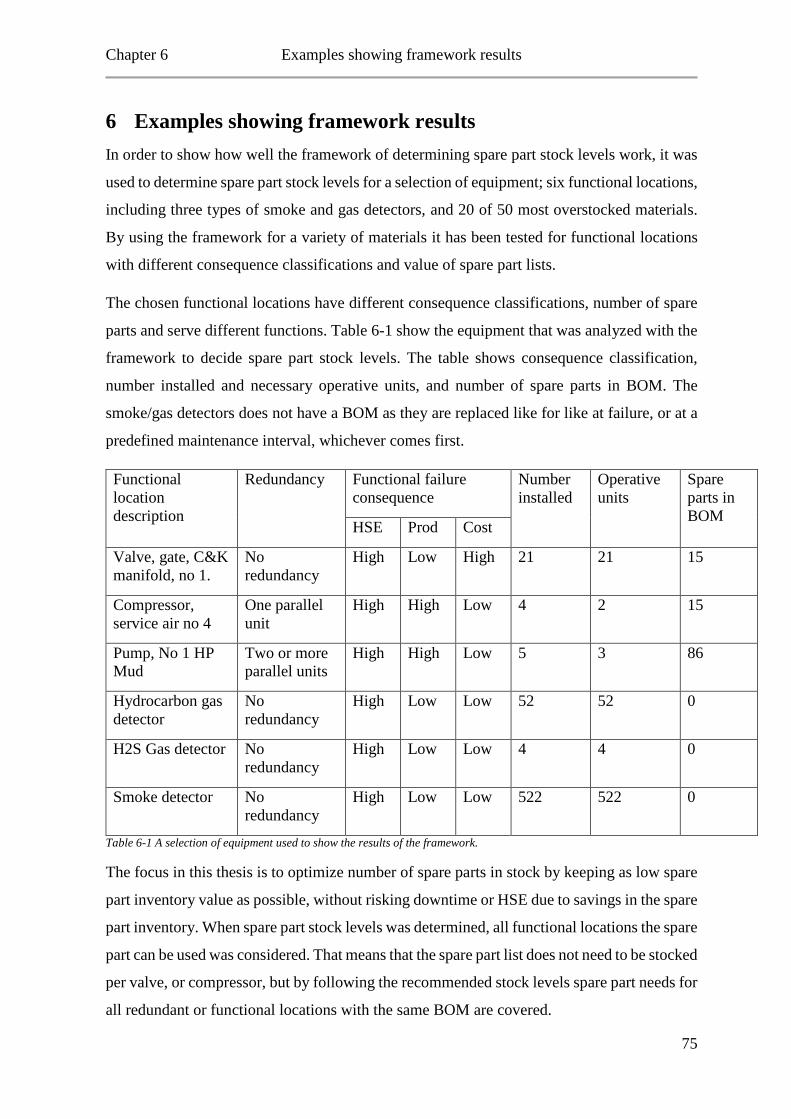
Chapter 6 Examples showing framework results
6 Examples showing framework results In order to show how well the framework of determining spare part stock levels work, it was
used to determine spare part stock levels for a selection of equipment; six functional locations,
including three types of smoke and gas detectors, and 20 of 50 most overstocked materials.
By using the framework for a variety of materials it has been tested for functional locations
with different consequence classifications and value of spare part lists.
The chosen functional locations have different consequence classifications, number of spare
parts and serve different functions. Table 6-1 show the equipment that was analyzed with the
framework to decide spare part stock levels. The table shows consequence classification,
number installed and necessary operative units, and number of spare parts in BOM. The
smoke/gas detectors does not have a BOM as they are replaced like for like at failure, or at a
predefined maintenance interval, whichever comes first.
Functional location description
Redundancy Functional failure consequence
Number installed
Operative units
Spare parts in BOM
HSE Prod Cost
Valve, gate, C&K manifold, no 1.
No redundancy
High Low High 21 21 15
Compressor, service air no 4
One parallel unit
High High Low 4 2 15
Pump, No 1 HP Mud
Two or more parallel units
High High Low 5 3 86
Hydrocarbon gas detector
No redundancy
High Low Low 52 52 0
H2S Gas detector No redundancy
High Low Low 4 4 0
Smoke detector No redundancy
High Low Low 522 522 0
Table 6-1 A selection of equipment used to show the results of the framework.
The focus in this thesis is to optimize number of spare parts in stock by keeping as low spare
part inventory value as possible, without risking downtime or HSE due to savings in the spare
part inventory. When spare part stock levels was determined, all functional locations the spare
part can be used was considered. That means that the spare part list does not need to be stocked
per valve, or compressor, but by following the recommended stock levels spare part needs for
all redundant or functional locations with the same BOM are covered.
75
Chapter 6 Examples showing framework results
When utilizing the framework a day rate of $ 240 000 was used. The lead time attribute are
not updated for all materials, therefore SAP transaction ME2M was used to find lead times
from historic purchase orders.
6.1 Choke and kill manifold, valve 1. The first category chosen for demonstration of the decision framework is valve number 1 in
the choke and kill manifold, 540-336V0001. The manifold is used for well control, by
controlling the back flow from the well (choke), or providing pressure to the well to stop the
back flow (kill). In total there are 35 valves that can be opened and closed separately. The
sizes of the valves are; 2 1/16", 3 1/16", or 4 1/16". 21 of them are 3 1/16” that is why this
size was chosen. According to NORSOK and Performance standards (PS10), the entire
manifold has to be certified every 5th year because it is a well barrier.
The failure consequence classification of the functional locations shows high HSE failure
consequences, low production failure consequences and no redundancy.
In table 6-2, the recommended stock levels for spare parts to the valve is shown next to today’s
stock levels. The total value of the recommended stock levels are $ 144735, and value of the
current stock level is $ 132598. That is a difference of $ 12137 or 9.2 % higher than current
on stock value. The difference is mainly because of two materials, the seal assembly and
cushion fluid flange. These two materials counted for $ 12028 of the total difference.
76
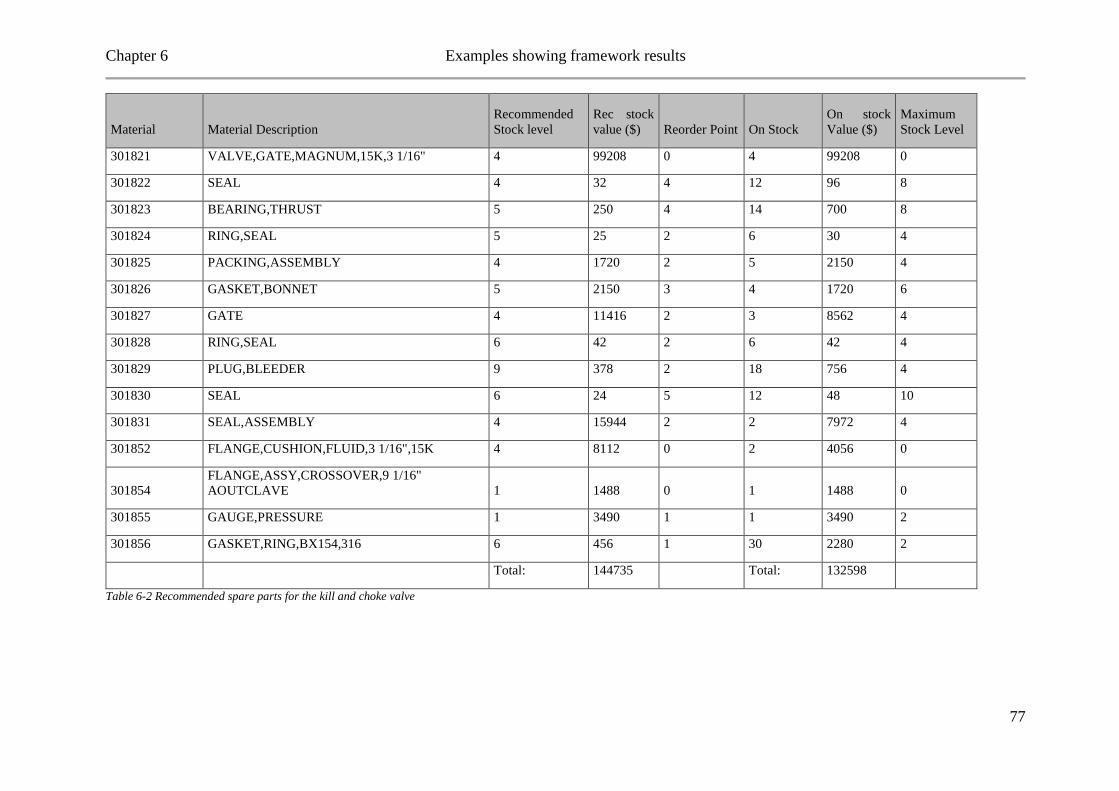
Chapter 6 Examples showing framework results
Material Material Description Recommended Stock level
Rec stock value ($) Reorder Point On Stock
On stock Value ($)
Maximum Stock Level
301821 VALVE,GATE,MAGNUM,15K,3 1/16" 4 99208 0 4 99208 0
301822 SEAL 4 32 4 12 96 8
301823 BEARING,THRUST 5 250 4 14 700 8
301824 RING,SEAL 5 25 2 6 30 4
301825 PACKING,ASSEMBLY 4 1720 2 5 2150 4
301826 GASKET,BONNET 5 2150 3 4 1720 6
301827 GATE 4 11416 2 3 8562 4
301828 RING,SEAL 6 42 2 6 42 4
301829 PLUG,BLEEDER 9 378 2 18 756 4
301830 SEAL 6 24 5 12 48 10
301831 SEAL,ASSEMBLY 4 15944 2 2 7972 4
301852 FLANGE,CUSHION,FLUID,3 1/16",15K 4 8112 0 2 4056 0
301854 FLANGE,ASSY,CROSSOVER,9 1/16" AOUTCLAVE 1 1488 0 1 1488 0
301855 GAUGE,PRESSURE 1 3490 1 1 3490 2
301856 GASKET,RING,BX154,316 6 456 1 30 2280 2
Total: 144735 Total: 132598
Table 6-2 Recommended spare parts for the kill and choke valve
77
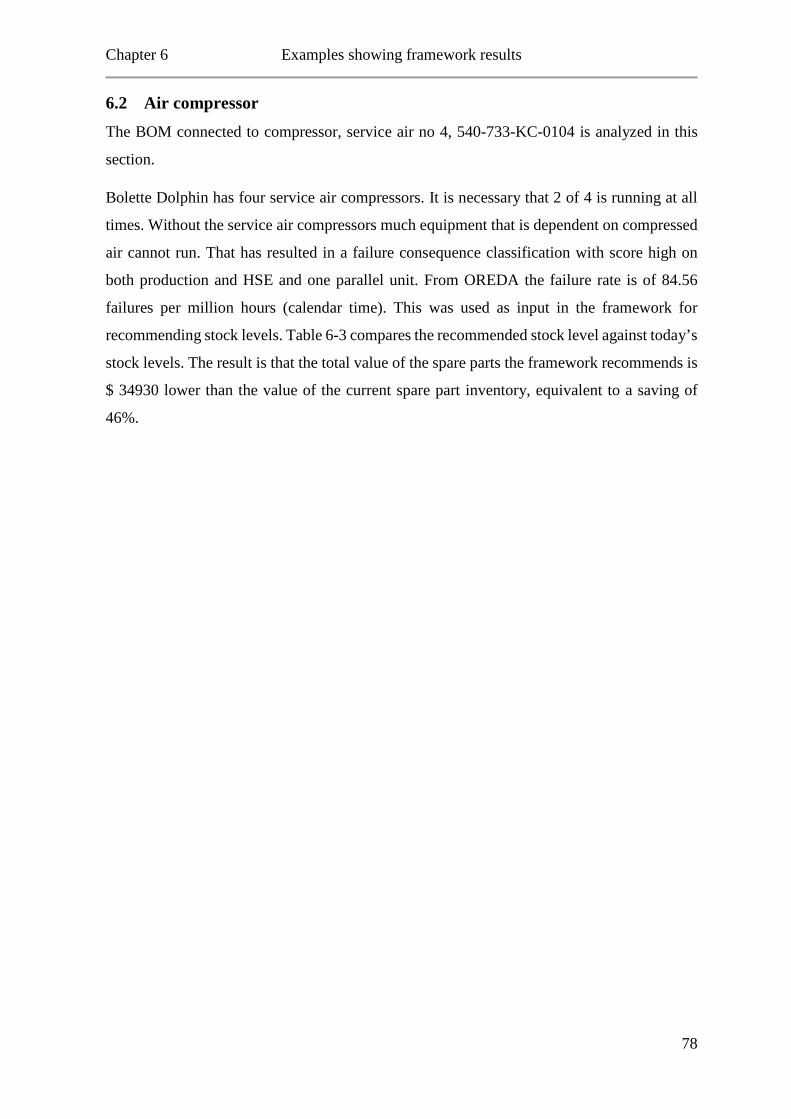
Chapter 6 Examples showing framework results
6.2 Air compressor The BOM connected to compressor, service air no 4, 540-733-KC-0104 is analyzed in this
section.
Bolette Dolphin has four service air compressors. It is necessary that 2 of 4 is running at all
times. Without the service air compressors much equipment that is dependent on compressed
air cannot run. That has resulted in a failure consequence classification with score high on
both production and HSE and one parallel unit. From OREDA the failure rate is of 84.56
failures per million hours (calendar time). This was used as input in the framework for
recommending stock levels. Table 6-3 compares the recommended stock level against today’s
stock levels. The result is that the total value of the spare parts the framework recommends is
$ 34930 lower than the value of the current spare part inventory, equivalent to a saving of
46%.
78
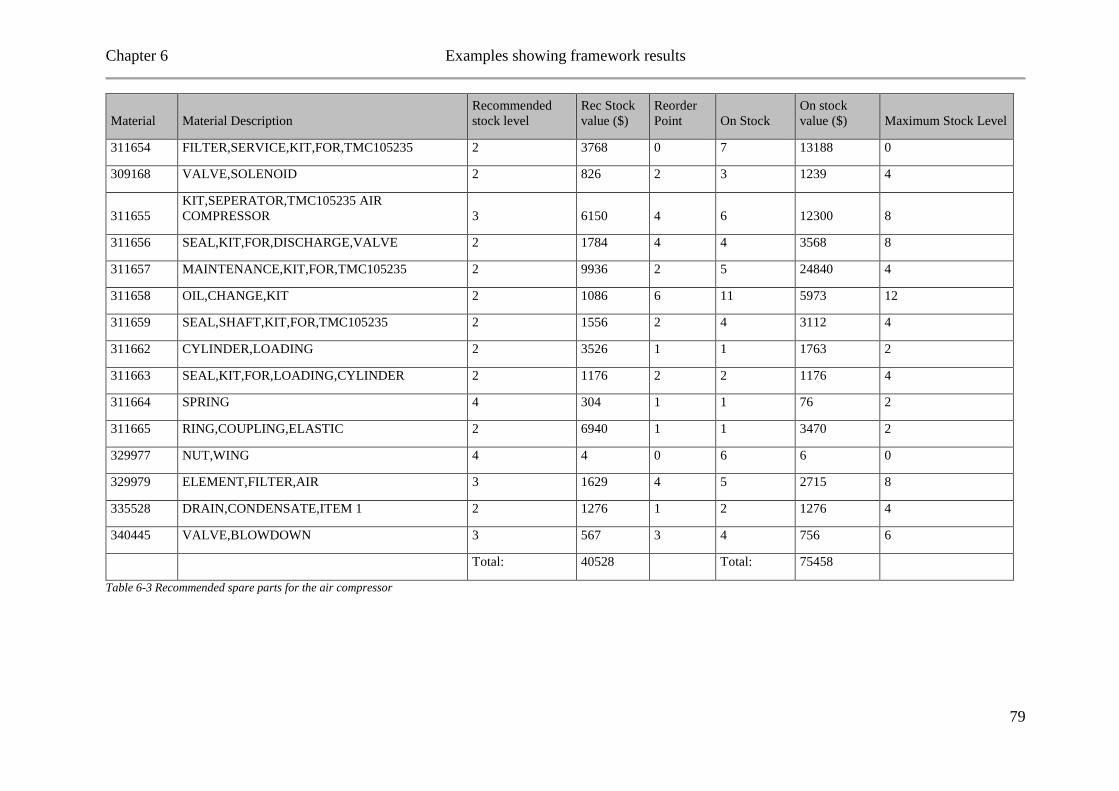
Chapter 6 Examples showing framework results
Material Material Description Recommended stock level
Rec Stock value ($)
Reorder Point On Stock
On stock value ($) Maximum Stock Level
311654 FILTER,SERVICE,KIT,FOR,TMC105235 2 3768 0 7 13188 0
309168 VALVE,SOLENOID 2 826 2 3 1239 4
311655 KIT,SEPERATOR,TMC105235 AIR COMPRESSOR 3 6150 4 6 12300 8
311656 SEAL,KIT,FOR,DISCHARGE,VALVE 2 1784 4 4 3568 8
311657 MAINTENANCE,KIT,FOR,TMC105235 2 9936 2 5 24840 4
311658 OIL,CHANGE,KIT 2 1086 6 11 5973 12
311659 SEAL,SHAFT,KIT,FOR,TMC105235 2 1556 2 4 3112 4
311662 CYLINDER,LOADING 2 3526 1 1 1763 2
311663 SEAL,KIT,FOR,LOADING,CYLINDER 2 1176 2 2 1176 4
311664 SPRING 4 304 1 1 76 2
311665 RING,COUPLING,ELASTIC 2 6940 1 1 3470 2
329977 NUT,WING 4 4 0 6 6 0
329979 ELEMENT,FILTER,AIR 3 1629 4 5 2715 8
335528 DRAIN,CONDENSATE,ITEM 1 2 1276 1 2 1276 4
340445 VALVE,BLOWDOWN 3 567 3 4 756 6
Total: 40528 Total: 75458
Table 6-3 Recommended spare parts for the air compressor
79
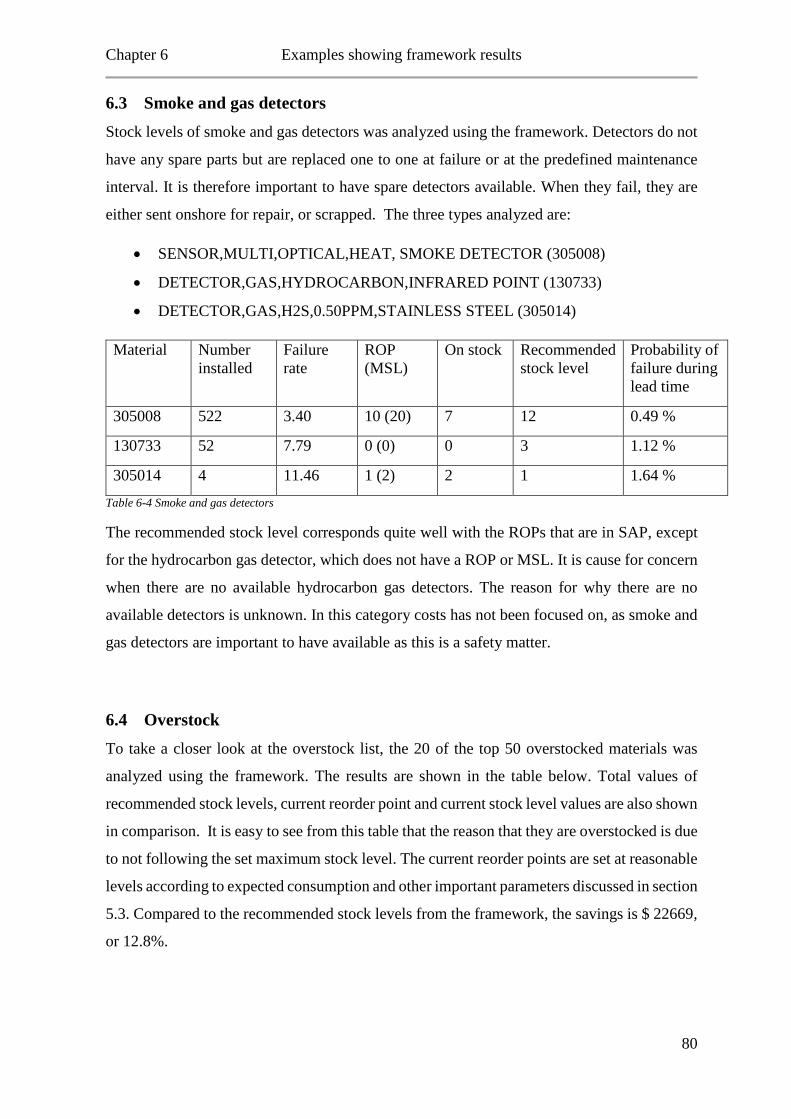
Chapter 6 Examples showing framework results
6.3 Smoke and gas detectors Stock levels of smoke and gas detectors was analyzed using the framework. Detectors do not
have any spare parts but are replaced one to one at failure or at the predefined maintenance
interval. It is therefore important to have spare detectors available. When they fail, they are
either sent onshore for repair, or scrapped. The three types analyzed are:
• SENSOR,MULTI,OPTICAL,HEAT, SMOKE DETECTOR (305008)
• DETECTOR,GAS,HYDROCARBON,INFRARED POINT (130733)
• DETECTOR,GAS,H2S,0.50PPM,STAINLESS STEEL (305014)
Material Number installed
Failure rate
ROP (MSL)
On stock Recommended stock level
Probability of failure during lead time
305008 522 3.40 10 (20) 7 12 0.49 %
130733 52 7.79 0 (0) 0 3 1.12 %
305014 4 11.46 1 (2) 2 1 1.64 % Table 6-4 Smoke and gas detectors
The recommended stock level corresponds quite well with the ROPs that are in SAP, except
for the hydrocarbon gas detector, which does not have a ROP or MSL. It is cause for concern
when there are no available hydrocarbon gas detectors. The reason for why there are no
available detectors is unknown. In this category costs has not been focused on, as smoke and
gas detectors are important to have available as this is a safety matter.
6.4 Overstock To take a closer look at the overstock list, the 20 of the top 50 overstocked materials was
analyzed using the framework. The results are shown in the table below. Total values of
recommended stock levels, current reorder point and current stock level values are also shown
in comparison. It is easy to see from this table that the reason that they are overstocked is due
to not following the set maximum stock level. The current reorder points are set at reasonable
levels according to expected consumption and other important parameters discussed in section
5.3. Compared to the recommended stock levels from the framework, the savings is $ 22669,
or 12.8%.
80
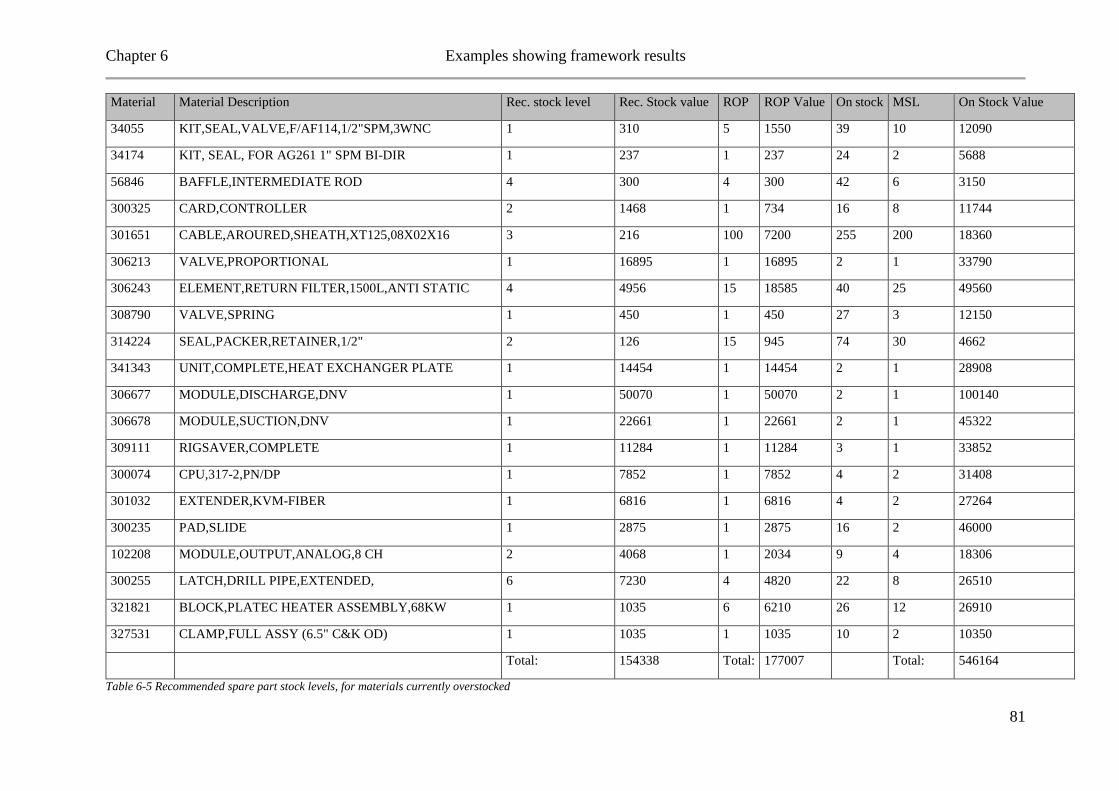
Chapter 6 Examples showing framework results
Material Material Description Rec. stock level Rec. Stock value ROP ROP Value On stock MSL On Stock Value
34055 KIT,SEAL,VALVE,F/AF114,1/2"SPM,3WNC 1 310 5 1550 39 10 12090
34174 KIT, SEAL, FOR AG261 1" SPM BI-DIR 1 237 1 237 24 2 5688
56846 BAFFLE,INTERMEDIATE ROD 4 300 4 300 42 6 3150
300325 CARD,CONTROLLER 2 1468 1 734 16 8 11744
301651 CABLE,AROURED,SHEATH,XT125,08X02X16 3 216 100 7200 255 200 18360
306213 VALVE,PROPORTIONAL 1 16895 1 16895 2 1 33790
306243 ELEMENT,RETURN FILTER,1500L,ANTI STATIC 4 4956 15 18585 40 25 49560
308790 VALVE,SPRING 1 450 1 450 27 3 12150
314224 SEAL,PACKER,RETAINER,1/2" 2 126 15 945 74 30 4662
341343 UNIT,COMPLETE,HEAT EXCHANGER PLATE 1 14454 1 14454 2 1 28908
306677 MODULE,DISCHARGE,DNV 1 50070 1 50070 2 1 100140
306678 MODULE,SUCTION,DNV 1 22661 1 22661 2 1 45322
309111 RIGSAVER,COMPLETE 1 11284 1 11284 3 1 33852
300074 CPU,317-2,PN/DP 1 7852 1 7852 4 2 31408
301032 EXTENDER,KVM-FIBER 1 6816 1 6816 4 2 27264
300235 PAD,SLIDE 1 2875 1 2875 16 2 46000
102208 MODULE,OUTPUT,ANALOG,8 CH 2 4068 1 2034 9 4 18306
300255 LATCH,DRILL PIPE,EXTENDED, 6 7230 4 4820 22 8 26510
321821 BLOCK,PLATEC HEATER ASSEMBLY,68KW 1 1035 6 6210 26 12 26910
327531 CLAMP,FULL ASSY (6.5" C&K OD) 1 1035 1 1035 10 2 10350
Total: 154338 Total: 177007 Total: 546164
Table 6-5 Recommended spare part stock levels, for materials currently overstocked
81
Chapter 6 Examples showing framework results
6.5 Mud pump Mud pumps are often described as the heart of drilling operations. Without it mud, drilling
will quickly come to a halt. On Bolette Dolphin there are 5 mud pumps, functional locations
540-325-BK-0100A-E. As they are that important for the drilling operation they have been
classified with high failure consequences of both HSE and production. For most operations it
is necessary with at least 2-3 operational pumps, making the mud pump system redundant
with 2 parallel units.
OREDA provides a mean failure rate of 6.9 failures per million hours for a reciprocating
pump. This failure rate has been used for most materials, as most of the spare parts are not
listed in OREDA. Where failure rates are available for specific materials, this was used.
The current spare part inventory for the mud pumps are valued at $314796, and value of
inventory following the current ROPs are $175893. The overstock value of the mud pumps’
spare part inventory is $124295. The result of the decision framework is recommended stock
value of $165822, corresponding to savings of 5.7%.
82
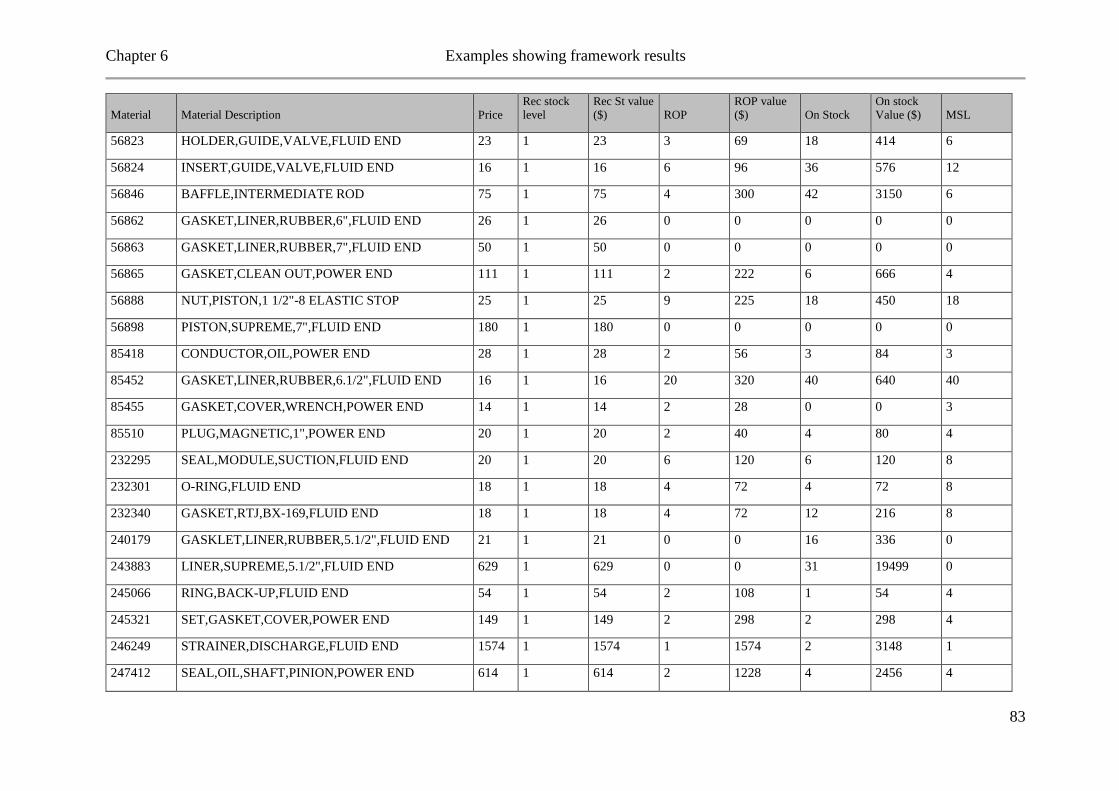
Chapter 6 Examples showing framework results
Material Material Description Price Rec stock level
Rec St value ($) ROP
ROP value ($) On Stock
On stock Value ($) MSL
56823 HOLDER,GUIDE,VALVE,FLUID END 23 1 23 3 69 18 414 6
56824 INSERT,GUIDE,VALVE,FLUID END 16 1 16 6 96 36 576 12
56846 BAFFLE,INTERMEDIATE ROD 75 1 75 4 300 42 3150 6
56862 GASKET,LINER,RUBBER,6",FLUID END 26 1 26 0 0 0 0 0
56863 GASKET,LINER,RUBBER,7",FLUID END 50 1 50 0 0 0 0 0
56865 GASKET,CLEAN OUT,POWER END 111 1 111 2 222 6 666 4
56888 NUT,PISTON,1 1/2"-8 ELASTIC STOP 25 1 25 9 225 18 450 18
56898 PISTON,SUPREME,7",FLUID END 180 1 180 0 0 0 0 0
85418 CONDUCTOR,OIL,POWER END 28 1 28 2 56 3 84 3
85452 GASKET,LINER,RUBBER,6.1/2",FLUID END 16 1 16 20 320 40 640 40
85455 GASKET,COVER,WRENCH,POWER END 14 1 14 2 28 0 0 3
85510 PLUG,MAGNETIC,1",POWER END 20 1 20 2 40 4 80 4
232295 SEAL,MODULE,SUCTION,FLUID END 20 1 20 6 120 6 120 8
232301 O-RING,FLUID END 18 1 18 4 72 4 72 8
232340 GASKET,RTJ,BX-169,FLUID END 18 1 18 4 72 12 216 8
240179 GASKLET,LINER,RUBBER,5.1/2",FLUID END 21 1 21 0 0 16 336 0
243883 LINER,SUPREME,5.1/2",FLUID END 629 1 629 0 0 31 19499 0
245066 RING,BACK-UP,FLUID END 54 1 54 2 108 1 54 4
245321 SET,GASKET,COVER,POWER END 149 1 149 2 298 2 298 4
246249 STRAINER,DISCHARGE,FLUID END 1574 1 1574 1 1574 2 3148 1
247412 SEAL,OIL,SHAFT,PINION,POWER END 614 1 614 2 1228 4 2456 4
83
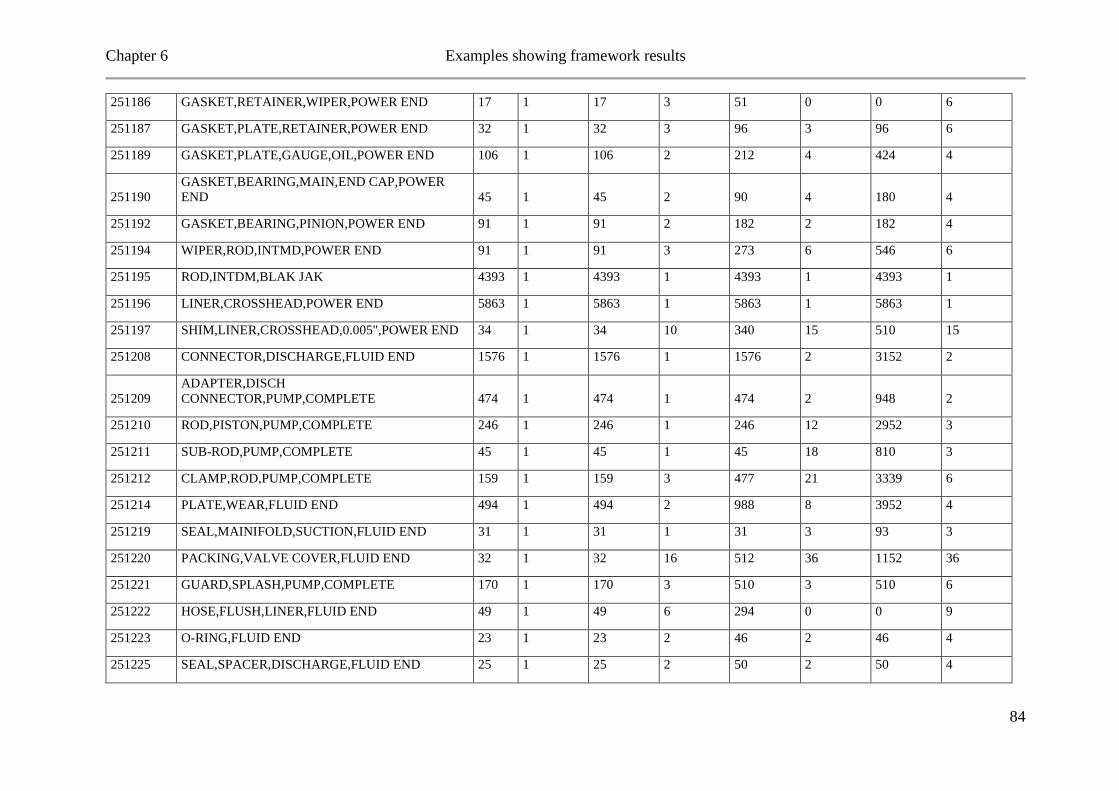
Chapter 6 Examples showing framework results
251186 GASKET,RETAINER,WIPER,POWER END 17 1 17 3 51 0 0 6
251187 GASKET,PLATE,RETAINER,POWER END 32 1 32 3 96 3 96 6
251189 GASKET,PLATE,GAUGE,OIL,POWER END 106 1 106 2 212 4 424 4
251190 GASKET,BEARING,MAIN,END CAP,POWER END 45 1 45 2 90 4 180 4
251192 GASKET,BEARING,PINION,POWER END 91 1 91 2 182 2 182 4
251194 WIPER,ROD,INTMD,POWER END 91 1 91 3 273 6 546 6
251195 ROD,INTDM,BLAK JAK 4393 1 4393 1 4393 1 4393 1
251196 LINER,CROSSHEAD,POWER END 5863 1 5863 1 5863 1 5863 1
251197 SHIM,LINER,CROSSHEAD,0.005",POWER END 34 1 34 10 340 15 510 15
251208 CONNECTOR,DISCHARGE,FLUID END 1576 1 1576 1 1576 2 3152 2
251209 ADAPTER,DISCH CONNECTOR,PUMP,COMPLETE 474 1 474 1 474 2 948 2
251210 ROD,PISTON,PUMP,COMPLETE 246 1 246 1 246 12 2952 3
251211 SUB-ROD,PUMP,COMPLETE 45 1 45 1 45 18 810 3
251212 CLAMP,ROD,PUMP,COMPLETE 159 1 159 3 477 21 3339 6
251214 PLATE,WEAR,FLUID END 494 1 494 2 988 8 3952 4
251219 SEAL,MAINIFOLD,SUCTION,FLUID END 31 1 31 1 31 3 93 3
251220 PACKING,VALVE COVER,FLUID END 32 1 32 16 512 36 1152 36
251221 GUARD,SPLASH,PUMP,COMPLETE 170 1 170 3 510 3 510 6
251222 HOSE,FLUSH,LINER,FLUID END 49 1 49 6 294 0 0 9
251223 O-RING,FLUID END 23 1 23 2 46 2 46 4
251225 SEAL,SPACER,DISCHARGE,FLUID END 25 1 25 2 50 2 50 4
84
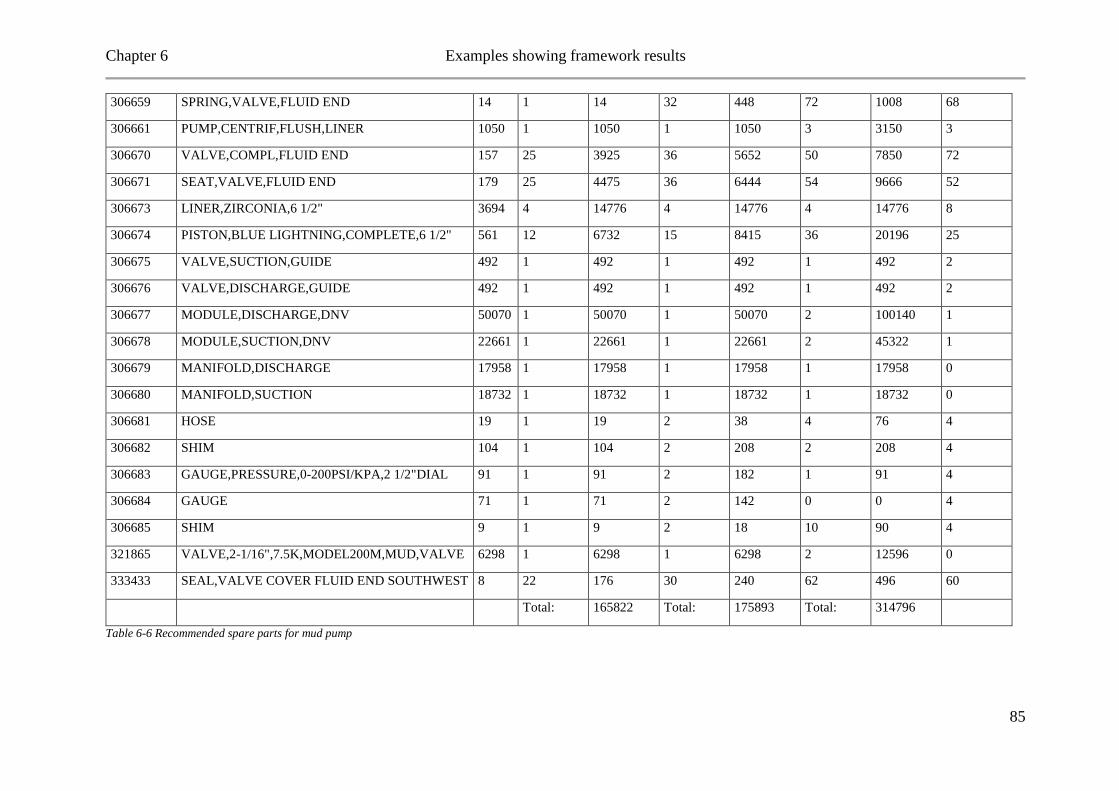
Chapter 6 Examples showing framework results
306659 SPRING,VALVE,FLUID END 14 1 14 32 448 72 1008 68
306661 PUMP,CENTRIF,FLUSH,LINER 1050 1 1050 1 1050 3 3150 3
306670 VALVE,COMPL,FLUID END 157 25 3925 36 5652 50 7850 72
306671 SEAT,VALVE,FLUID END 179 25 4475 36 6444 54 9666 52
306673 LINER,ZIRCONIA,6 1/2" 3694 4 14776 4 14776 4 14776 8
306674 PISTON,BLUE LIGHTNING,COMPLETE,6 1/2" 561 12 6732 15 8415 36 20196 25
306675 VALVE,SUCTION,GUIDE 492 1 492 1 492 1 492 2
306676 VALVE,DISCHARGE,GUIDE 492 1 492 1 492 1 492 2
306677 MODULE,DISCHARGE,DNV 50070 1 50070 1 50070 2 100140 1
306678 MODULE,SUCTION,DNV 22661 1 22661 1 22661 2 45322 1
306679 MANIFOLD,DISCHARGE 17958 1 17958 1 17958 1 17958 0
306680 MANIFOLD,SUCTION 18732 1 18732 1 18732 1 18732 0
306681 HOSE 19 1 19 2 38 4 76 4
306682 SHIM 104 1 104 2 208 2 208 4
306683 GAUGE,PRESSURE,0-200PSI/KPA,2 1/2"DIAL 91 1 91 2 182 1 91 4
306684 GAUGE 71 1 71 2 142 0 0 4
306685 SHIM 9 1 9 2 18 10 90 4
321865 VALVE,2-1/16",7.5K,MODEL200M,MUD,VALVE 6298 1 6298 1 6298 2 12596 0
333433 SEAL,VALVE COVER FLUID END SOUTHWEST 8 22 176 30 240 62 496 60
Total: 165822 Total: 175893 Total: 314796
Table 6-6 Recommended spare parts for mud pump
85
Chapter 6 Examples showing framework results
6.6 Summary of examples The example shows that the decision framework described in this thesis that DD may save up
to 46% on spare part inventories. The savings was respectively 46%, 12.8%, and 5.7% for air
compressor, overstock materials, mud pump spare parts. For the choke and kill manifold
valve, the result was a recommended spare part inventory 9.2% higher than the current
inventory value. On average the savings is approximately 13%. If the entire spare part stock
is reduced by 10%, this adds up to approximately $1.8 million, only for Bolette. This is
without analyzing capital spares, as they are not depreciated in the individual MODUs budget.
DD currently have 10 MODUs in their fleet. If the spare part inventory in the entire fleet is
reduced with 10% the savings adds up to a substantial sum, which proves the potential for
implementing this framework.
The parameters that influence the results of the framework most are number installed and
failure rates. If a material is installed 15 places and have a failure rate of 40 failures per million
hours, it is reasonable that more spare parts are stocked for that material than a material that
is installed one place with the same or lower failure rate.
Reducing the total spare part inventory will reduce the capital tied up in parts, making it
available for other purposes. Reducing inventories will in turn reduce work load for keeping
spare parts in good condition, as well as reduce the need for storage space. The framework
does not always provide the best recommended stock levels, but it is a good indication and by
using the framework together with experience and understanding of the expected
consumption provide reasonable levels of spare parts.
The framework has shown that stock levels regarding smoke and gas detectors are low.
Especially for hydrocarbon gas detectors which there are 52 installed, and no spare detectors.
When using the framework it is advantageous to have lead time of materials available. As
mentioned, all materials have a lead time of 70 days in SAP. Therefore those lead times were
disregarded, and historic lead times were used instead. If DD not implements lead time in
SAP for each material, the framework takes longer time to use, as old purchase orders has to
be looked up in SAP or lead times must be provided by the supplier. The implementation of
lead time for materials can be done in the same manner as prices, namely by having an average
lead time which is automatically updated each time the material is purchased.
86
Chapter 7 Results and discussion
7 Results and discussion
7.1 Framework The thesis proposes two forms that maintenance personnel can use to determine spare parts
stock levels. It was shown that by using the forms for deciding stock levels, DD can reduce
their spare part inventory, and save money. It must be mentioned that the framework must be
used alongside some experience and knowledge concerning rules and regulations, as well as
common sense. A simulation to verify that the recommended stock levels will be sufficient to
keep the MODU in operation without any major stops due to lack of spare parts, has not been
performed. Assuming failure rates provided by OREDA are trustworthy, the framework
provides a reasonable and sufficient spare part inventory. The thesis has proposed a framework
for spare part management that easily can be established across the organization, the framework
can also be used to justify the spare part inventory.
Maintenance will always be a support function of the main business process of the offshore
drilling industry, and in order to increase profit all processes are under consideration when
trying to cut expenses. The disadvantage of cutting expenses in the maintenance department is
that the future expenses of equipment increases as they get shorter useful life due to poor
maintenance. By cutting the maintenance budget a result may be more failures leading to more
corrective maintenance and downtime. When deciding spare part stock levels there are mainly
three departments that want to influence the stock levels. It is the financial department, the
operational department and the maintenance department. Especially because the financial
department want to cut costs of maintenance by reducing spare part levels, it is important to be
able to justify the spare part stock levels.
The framework of deciding spare part stock levels can be divided into a 3 step process.
1. Using the form “frm_DecisionAid” to map all costs, and decide if the spare part is
necessary to keep in stock
2. Using the form “frm_DecideSpareQuantity” to get a calculated recommended stock
level.
3. Evaluate if the recommended stock level is appropriate, and update recommended stock
levels. The form does not recognize the material description, in some BOMs materials
that are used for testing, or special tools, are included. For such materials it is often
sufficient with one on stock.
87

Chapter 7 Results and discussion
There are both pros and cons of the framework, the most important are listed below.
Pros:
• Matches well with reality
• Saves money by reducing stock
levels
• Makes decision maker aware of
relevant parameters
• Easy to see what is overstocked
• Possible to override the
recommended stock level
• Easy user interface
Cons:
• Requires manual input of failure
rates
• Some intuition has to be used
• Easier to use if BOM is already
established
• Not possible to run through all
BOMs automatically
• Not simulated over a long period
to see that it does not affect
downtime
If the framework had provided results far off current stock levels, it would have pointed in
the direction that it was unreliable because ROPs and MSLs has been set according to
experience and rule of thumb. As seen from chapter 6, the recommended stock levels are
generally at similar but slightly lower than current ROPs. This is a sign that the framework is
reliable.
The framework cannot always be used blindly. Some equipment spare part stock levels must
be according to rules and regulations. The framework does not account for any regulations,
and it is required that the user is aware of the relevant regulations. In addition, some materials
in BOMs are not necessary to have more than one of, if a high failure rate is entered for these
materials, the recommended stock of these materials will be higher than necessary. In those
cases the users should see that, and only choose to stock one.
By using the framework for determining stock levels, the user becomes aware of all
parameters that may influence spare part stock levels. When aware of the parameters a better
decision can be made, than if the decision is based on rule of thumb.
When making the first decision, if the spare part should be stocked or not, it is necessary that
the spare parts are connected to BOMs of equipment of functional locations. Then the BOM
can be used in form “frm_DecisionAid”, and each material can easily be evaluated. Without
the BOM, that task has to be done manually.
88
Chapter 7 Results and discussion
The overstock form gives the user a clear picture of materials that are stocked higher than
maximum stock levels. It is easy to create an overstock report that can be used to increase
focus on not stocking more than necessary. As there are many possible reasons for stock
inventories are overstocked, the overstock list provides a good incentive to double check the
physical spare part inventory to find out if the data are correct.
7.2 Results from the current situation analysis While working with the thesis several findings related to DDs spare part management were
made. These findings provide improvement potential in spare part and maintenance
management. The findings will first be listed and then discussed in separate sections.
• Incomplete material information
o Duplicate materials
• Tracking number of repairs to serialized materials
• Overstocking.
• Materials not connected to functional locations
Incomplete material information
When using the MM03 transaction in SAP it is possible to look at all the attributes of
materials. Not all of them are used by DD. It takes time to fill out the information for each
material that is created, and that not all attributes will give additional value to the user. But
some of the possible fields should be filled out. The most important attributes that either does
not have any information, or wrong information is lead time, price, weight and volume. These
attributes can make material planning easier for the maintenance crew, even though the
information is not 100% correct. For example knowing that the lead time from supplier to the
base is usually 15-30 days instead of not knowing anything, is valuable in the planning phase
of corrective maintenance.
674 spare parts in BOMs have a price of $0. As mentioned, prices in SAP are not updated
until the material is purchased. But most of these materials have been purchased, and should
have price. By having prices of all materials that are stocked, it would be possible to get the
real value of the spare part inventory. That is not possible today. Usually when a material
number is created, it is when a MODU needs that specific material. Then the person creating
89
Chapter 7 Results and discussion
the material will have a price and lead time at hand, even though this might not be 100%
correct, it is close to the real value.
There are many duplicate materials, from a quick analysis it was found that 582
manufacturer’s part numbers are used for two or more materials. When creating new materials
for purchase, it should be put in more effort to find out if the material is already created in
SAP. This way DD will avoid having material lists containing more materials than physically
on the rig.
Number of repairs are not tracked
A typical equipment sent to vendor for repair are electric motors. DD policy is to repair
materials if the repair cost is less than 60%. Repaired equipment is not always as good as new
equipment, and after some repairs the failure rate of the motor will be higher than a new
motor. By tracking the number of repairs of serialized materials, DD would be in a better
position to decide to replace the motor with a new, rather than repairing it for 50-60% of the
new price. SAP already has processes addressing this issue, but DD does not use them.
Overstocking
From the current situation analysis, chapter 4, it was shown that DD has overstocked materials
for a total value of $ 1.17 million, or 6.5% of the total measurable inventory value. Overstock
materials is defined as materials with higher stock levels than the defined maximum stock
level. The maximum stock level is defined for all materials with MRP type VB.
There may be several reasons for overstocking. One is that the actual on hand quantity is not
correct in SAP, because the storekeeper has not updated the stock levels. Another cause is
that all of the parts purchased for the five yearly rig classification was not used, and transferred
to the spare part stock. A third cause is that the maintenance personnel thinks the maximum
stock levels are too low, and ordered more spare parts to avoid getting in the situation of not
having the necessary parts. If so they should also have communicated with the onshore
maintenance team to increase the levels if necessary. It should also be picked up by the
procurement department that materials are ordered even though the stock levels are above, or
close to the maximum stock level. Most likely it is a combination of these and maybe other
reasons that Bolette Dolphin has large overstock values. The only thing to do about it is to
90
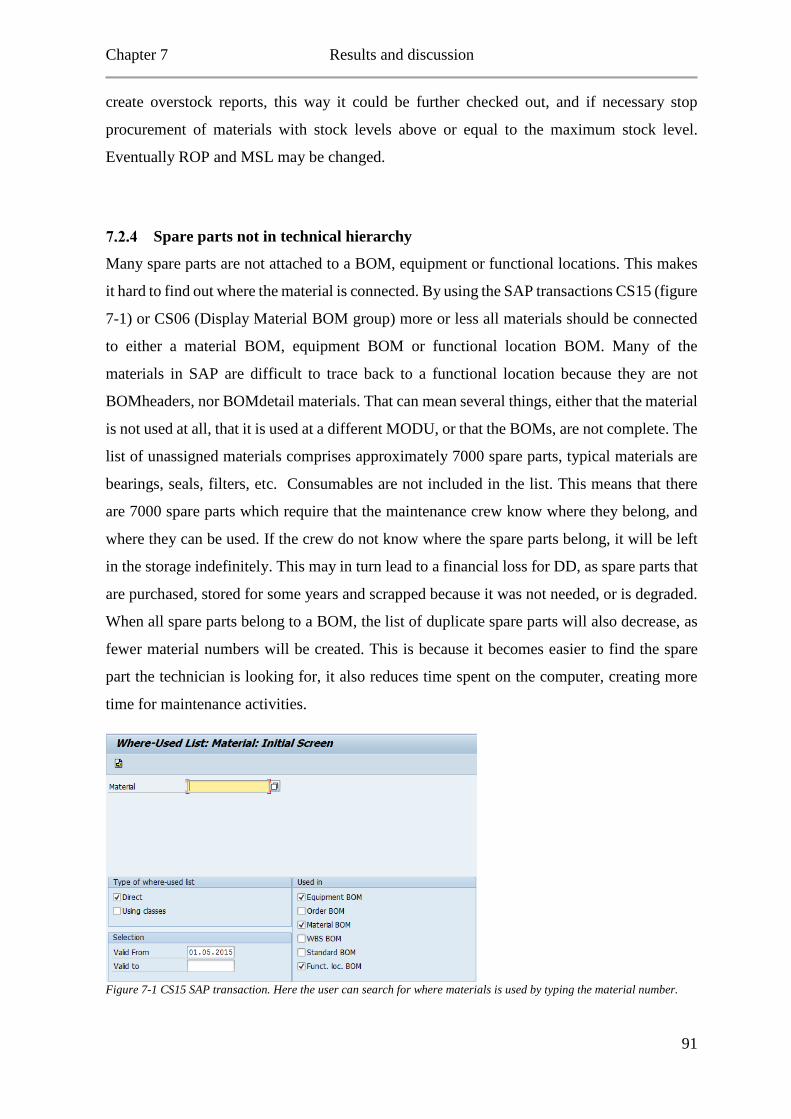
Chapter 7 Results and discussion
create overstock reports, this way it could be further checked out, and if necessary stop
procurement of materials with stock levels above or equal to the maximum stock level.
Eventually ROP and MSL may be changed.
Spare parts not in technical hierarchy
Many spare parts are not attached to a BOM, equipment or functional locations. This makes
it hard to find out where the material is connected. By using the SAP transactions CS15 (figure
7-1) or CS06 (Display Material BOM group) more or less all materials should be connected
to either a material BOM, equipment BOM or functional location BOM. Many of the
materials in SAP are difficult to trace back to a functional location because they are not
BOMheaders, nor BOMdetail materials. That can mean several things, either that the material
is not used at all, that it is used at a different MODU, or that the BOMs, are not complete. The
list of unassigned materials comprises approximately 7000 spare parts, typical materials are
bearings, seals, filters, etc. Consumables are not included in the list. This means that there
are 7000 spare parts which require that the maintenance crew know where they belong, and
where they can be used. If the crew do not know where the spare parts belong, it will be left
in the storage indefinitely. This may in turn lead to a financial loss for DD, as spare parts that
are purchased, stored for some years and scrapped because it was not needed, or is degraded.
When all spare parts belong to a BOM, the list of duplicate spare parts will also decrease, as
fewer material numbers will be created. This is because it becomes easier to find the spare
part the technician is looking for, it also reduces time spent on the computer, creating more
time for maintenance activities.
Figure 7-1 CS15 SAP transaction. Here the user can search for where materials is used by typing the material number.
91
Chapter 7 Results and discussion
7.3 Consequences of not having spare available The consequences of not having spare parts available may be severe. This is why the spare
part inventories often are higher than necessary, leading to capital being tied up in parts. The
consequences of not having spare parts ranges from stopping the operation of the rig to
nothing. This thesis addressed these consequences by using failure consequence classification
of functional locations, as well as having a check box, that can be checked if materials may
lead to downtime if they should fail. The reason is that it is not always easy to know which
parts are most critical based on the failure consequence classification as it ranges from low to
high. The consequence classification does not say anything about the individual materials,
which is why it is helpful to include such a checkbox in the framework. Some equipment
failures causes a stop in operation. Then the equipment must be repaired before commencing
operation, if spare parts are not available an order for the necessary parts must be made.
Sometimes other MODUs have the necessary part on hand, then the company operating that
MODU are often helpful by selling the part directly to the company on downtime. The other
option is to order the part as a downtime order.
Downtime orders are well known in the industry and the major equipment suppliers have
systems to support rigs that suffer downtime due to equipment failure. Typical extra services
that are available if rigs are on downtime is faster delivery on spare parts, available service
technicians or other help to restore equipment function. These services often cost a lot, and
typical downtime order premiums is a 100% markup fee in addition to the price. The
alternative cost of having to shut down the rig while waiting is much higher, and this option
will then be used. That means that there are more or less always a solution to restore functions
if failure occur and spare parts are not available.
7.4 Equations/parameters The main focus while developing the presented framework was to make an optimization
which is understandable and practically possible to implement. Because of this focus complex
equations requiring much manual input was kept to a minimum. This resulted in a spare part
inventory framework based on parameters that are mainly static. Such as failure consequence
classification of functional locations is initially static, but can change. If they change it is easy
to update the tables containing the values that have been changed. By using live data, or
exported data at predefined intervals, this is issue is solved.
92
Chapter 7 Results and discussion
The most unreliable parameter that are used in the framework is the failure rate. The reason
for the unreliability of this parameter is that it has to be collected either from SAP, OREDA
or OEM. Failure rates from SAP is scarce as Bolette Dolphin has only been in operation for
approximately one year, for other MODUs the failure rates might be more reliable. OREDA
data are collected from many installations and categorized by type of equipment. Regarding
failure rates for a specific pump for instance NOV- 14-P-220 Mud Pump, cannot be obtained,
as OREDA divide pumps as centrifugal, reciprocating and rotary. This means that when using
OREDA data, the user has to find the most suiting equipment type.
The assumption of exponentially distributed failure rates means that failures in the “burn-in”
phase is assumed to be non-existent. This assumption holds if all problems due to poor
production quality are avoided. When installing new equipment there are strict procedures for
commissioning and testing. This will sort out any issues during installation, which can lead
to a higher failure rate than expected. When describing the failure process service levels was
briefly explained. Service levels could have been implemented to further improve the
framework for deciding spare part stock levels, but it was decided not to implement it. This
is because there are not defined specific service levels per functional location, and it would
introduce one more parameter that needs to be defined and entered. In the future by
introducing service levels, this could be a part of the RCM analysis for functional locations,
by doing that the RCM would be more complete as spare part stock levels could have been
decided as a part of the RCM analysis.
When determining spare part stock levels, a parameter called total score is multiplied with the
expected consumption. The total score is found by multiplying the weightage of each
parameter (HSE/Production consequence classification, no. installed, redundancy, and lead
time), with the scores of each parameter. The total score defines if the spare part should be
considered vital (0,667-1), essential (0,334-0,666) or desirable (0-0,333). By using this
scoring system DD achieve higher probability of having the most important spare parts
available when needed. This is reasonable way of reducing stock levels, without negatively
influencing uptime of the rig.
93
Chapter 7 Results and discussion
7.5 How to implement the framework A framework has no value if it is not used, which is why it is important to have a plan for
implementing the framework. There are several possibilities for the implementation. One is
to use the Access database as is, and export data from SAP at predefined frequencies as input
to the database. It is possible to set up Winshuttle to export defined datasets at set frequencies.
It requires a bit more effort to set up Winshuttle than using the SE16N transaction, but if the
data export from SAP will be done regularly it saves time as exporting data via SAP
transactions has to be done manually each time. When setting up the data export it is important
to set up the excel sheets with the same design as the tables in Access, to make the import to
Access easier. Then DD can use Access directly to determine spare part stock levels and look
up overstock materials.
Another possibility of implementing the framework is to use the Access database as a template
and set up the same queries and calculations in a web-based system called QlikView. DD has
already established a material management system in QlikView, making it the most likely
option of implementation. QlikView updates inventory data automatically every morning. If
DD decides to use QlikView, a separate page can be created by using the Access forms as
templates. It requires some extra programming to develop the pages, but the data export does
not have to be set up as it is already in place. Another advantage of adding it to QlikView is
that all material management software will be in one place.
Failure rates from a MODU becomes more reliable as it is in operation. By using live data
from SAP, DD can further take advantage of failure rates from the MODU instead of looking
up failure rates in OREDA. This requires some editing of the tables, such as including number
of failures, and repair times in the data export.
7.6 Data quality For all optimization models it is important with reliable data. Most of the data, regarding
materials and DD maintenance history, used for developing the framework was exported from
SAP. Failure rates is a combination of fault reports in SAP and data from OREDA. Data from
OREDA is compiled from maintenance systems from many different installations with
different operating conditions. There are some uncertainties of the data collected in OREDA.
Some of the factors that influence the data are:
94
Chapter 7 Results and discussion
• Different operating conditions
• Training and competence of crew
• Different maintenance strategies
• Computer literacy, poor data skills may influence the data entered
These factors affects the data that is collected, as some of it might be incorrectly entered,
leading to a certain error percentage in the compiled data. The maintenance on some
installation may be of better quality than others. To account for this issue, OREDA provides
standard deviations, upper and lower percentiles in addition to the mean failure rate. OREDA
have been collecting data since the 1980s, and uses all of the data they have collected since
by using a weightage formula. This formula gives most weight to the most recent and reliable
data as equipment has become better over the years. Despite these uncertainties, OREDA
provide the most reliable reliability data available, due to the collaboration across many
companies and the data provided is based on a representative selection. The data has been
controlled by a proficient group and filtered to give the most accurate reliability data possible.
Data in OREDA is presented in a structured way, and by separating main groups such as
pumps, engines, valves, etc., into subgroups with different types of pumps, engines, valves,
etc. This makes it easy for the user to find a similar subgroup of equipment he/she wants the
reliability data for.
From SAP functional location, equipment, and material attributes has been exported in order
to build the Access database. When implementing the framework it is recommended to use
live data, or update the data regularly to account for new materials and updated stock levels,
etc. That will improve the reliability of the results. Prices of the materials updated as an
average in SAP for each purchase, as the price can vary from supplier to supplier and time to
time. For more up to date attributes in SAP it is recommended to implement the same function
for lead times in SAP. This is not currently used and the data on lead times are generically set
to 70 days. By updating this data for each purchase, the framework would be less time
consuming because the user would not have to find lead times for each material.
Bolette Dolphin has been in operation for approximately one year. This makes the data
regarding failure rates uncertain. When the fault reports are made in SAP it is important that
the correct functional location is used, and if the same failure happen several times it should
be recorded against the same functional location each time. The quality of failure reports in
SAP is varying depending on the author of the failure reports. To resolve this, the crews need
95
Chapter 7 Results and discussion
more training in SAP. With more training the historic quality of maintenance will improve
thus improving the foundation for determining spare part inventories based on failure rates
from the MODU the spare parts will be used as well as improving maintenance strategy.
Today DD has too limited data to use SAP as a main source for failure rates. Historic
consumption data may be used as a failure rate for materials, as it is known how many of each
materials that are installed in the MODU. The consumption can be divided on number of
hours in operation and number installed to find the failure rate of the specific material. The
consumption will widely vary if the material is used in different machines with different
operating mode, this makes the historic consumption data too uncertain to use as failure rate
in most cases.
Data format
All of the input data is stored in the basis tables. As these are designed in Access it makes
data import easier if the export from SAP matches the design of these tables. The advantage
of designing the tables in Access is that it is easy to update large amounts of data by the use
of queries, or editing the fields with regard to data format.
When working in Access, it is important to name tables, queries, forms, and objects in forms
logically. This makes referencing within the database much easier. With logical names
troubleshooting is easier, as error messages often include the object names.
7.7 Further work with framework The proposed framework provides lower stock levels than the current stock levels, and a
framework that easily can be implemented across the organization. There is however possible
to further improve the framework.
Before utilizing the framework it is necessary that there exist some data regarding the
materials to analyze. The minimum requirement is that the material number and description
and belong to a functional location which is consequence classified, as the rest can be entered
manually when using the forms. If DD decides to invest in new equipment, this framework
cannot be used for deciding the spare part levels, before the new functional location has been
consequence classified, and material numbers have been created for the BOM. By creating a
framework that can be used independently of SAP, further savings could be made.
96
Chapter 7 Results and discussion
When DD gets more MODUs up and running in SAP, this framework can be used to optimize
spare part stocks across the fleet. It is then possible to see which spare parts that are available
on other rigs. Then it will be possible to create a pool for capital spares that can be shared
across the fleet, this will in turn reduce the necessary spare parts. For this to be possible the
MODUs should be within reasonable distance of each other.
Another suggestion for improving the framework is to combine the two forms,
“frm_DecisionAid” and “frm_DecideSpareQuantity”. It was decided to create two separate
forms, to have one form for easily going through the BOM of functional location by functional
location and the other for deciding quantity to stock. Due to the large number of materials not
connected to BOMs, this method made it possible to have a manual form for analyzing
materials not connected to a BOM.
In order to further improve the robustness of the framework a sensitivity analysis can be
performed. The sensitivity analysis may further reduce uncertainties, such as uncertainties of
failure rates. A sensitivity analysis will further quantify the relationships of the different
parameters, and what the result of unexpected parameter values will do to the result.
Often in maintenance one has to decide whether to replace a complete unit, or replace
components of the unit. In some instances it is more economic to replace components, and
other instances it is more economic to replace the unit. This judgement has to be made from
equipment to equipment. As an example, Statoil has a technical requirement, TR2000,
regarding valves and pipes. In this technical requirement, the replacement level of different
valve sizes is generalized. For example, valves of a certain type and size are only replaced by
a complete valve, while larger sizes are repaired by component replacement. If such a criteria
or generalization could be implemented in the framework, it would further reduce overall
maintenance costs for DD.
97
Chapter 8 Conclusion
8 Conclusion The objective of this thesis was to create a framework DD can use for determining spare part
stock levels. The framework is divided into two parts. The first part consists of deciding if the
spare part should be stocked, or purchased when required. The second part is determining
stock levels. The first decision is based on weighing costs of stocking and costs of stocking
at failure, as well as evaluating failure probability. If it is high probability of failure during
the equipment lifetime or the costs of stocking is lower than stocking at failure, the spare part
should be stocked. Costs of stocking includes procurement, logistics and holding costs of the
spare part. Costs of stocking at failure include costs of not having spare part available, e.g.
downtime and premium of urgent orders.
To be able to make a reasoned decision for spare part stock levels parameters influencing
stock levels was evaluated, and implemented in the framework. These parameters were used
for a scoring system. In the framework six parameters are proposed, whereof three are
attributes of the functional location the spare part belongs to, and three are attributes of the
spare part. The two most important parameters were found to be number of identical parts
installed and expected consumption.
With the use of the framework for deciding stock levels, it has been achieved a reduction of
spare part inventory value with between 5.8% and 46%. For the choke and kill valve, the
result was an increase of the spare part inventory value of 9%.
In the current situation analysis many materials were found to be overstocked. In order to
focus on keeping spare part stocks within the defined limits a form to get a list of the
overstocked materials was designed. This list will help in reducing stocks by introducing
purchasing stops, or get a new evaluation of the defined limits.
The framework proposed in this thesis may be used to improve business processes, continuous
improvement is a trademark of a successful organization.
By implementing a framework that provides a reduction of 10% of the spare part inventory,
DD will in a better position to handle rough market conditions than their competitors. If a
spare part inventory is assumed to be roughly $20 million for each MODU, the savings across
the fleet will substantial. More important than the savings is to avoid downtime, by being able
to show to efficient and highly productive MODUs over time DD will fulfill their vision to
be the preferred drilling contractor.
98
Chapter 9 References
9 References American Petroleum Institute (API), (1997) Recommended Practice 53, Blowout Prevention
Equipment Systems for Drilling Wells, USA.
Dolphin Drilling, http://www.dolphindrilling.no/index.php/about-us (Accessed 17.04.2015)
Electric Power Research Institute (EPRI). Demonstration of Reliability Centered
Maintenance Volume 1-3, Available:
http://www.epri.com/abstracts/Pages/ProductAbstract.aspx?ProductId=NP-7233-V1
(Accessed 17.03.15)
Fred. Olsen Energy (FOE), Fleet Status, Available: http://fredolsen-energy.com/fleet-status
(Accessed 20.03.15)
Gajpal, P., P., Ganesh, L., S., Rajendran, C. (1994), Criticality analysis of spare parts using
the analytic hierarchy process. International Journal of Production Economics 35.
Goepel, Klaus D., AHP Excel template with multiple inputs, version 26.07.2014, BPMSG
Singapore 2013, Available at http://bpmsg.com, (Accessed 03.04.2015)
Kumar, U. D., Crocker, J., Knezevic, J., El-Harem, M. (2000), Reliability, Maintenance and
Logistic support: A life cycle approach. Boston, Dordrecht, London, Kluwer Academic
Publisher.
Niebel, B.W, (1994), Engineering Maintenance Management, Chapter 6: Inventory Control
of Maintenance Materials, Marcel Dekker Inc.
NORSOK Z-008, Ed. 3, (2011) Risk based Maintenance and consequence classification.
Standards Norway, Norway.
NPTEL, Mechanical Engineering – Industrial Engineering. Available:
http://www.nptel.ac.in/courses/112107142/27 (Accessed 15.05.2015)
OREDA, Ed. (2009), Offshore Reliability Data 5th edition, volume 1 – Topside Equipment,
Trondheim Norway, OREDA Participants: BP Exploration Operating Company Ltd,
ConocoPhillips Skandinavia AS, Eni S.p.A. Exploration & Production Division,
ExxonMobil Production Company, Gassco, Shell Global Solutions UK, Statoil ASA, Total
S.A.
99
Chapter 9 References
Petroleum Safety Authority Norway. Activities Regulation:
http://www.psa.no/activities/category399.html#_Toc407534803 (Accessed 02.06.2015)
Pintelon, L., Parodi-Hertz, A, (2008), Maintenance: An Evolutionary Perspective, Complex
System Maintenance Handbook. Springer-Verlag London
Rausand, M., (1998) Reliability centered maintenance. Reliability Engineering and system
safety 60, Elsevier Science Limited, Northern Ireland.
Simply-Access.com, What is Microsoft Access, Available: http://www.simply-
access.com/What-Is-Microsoft-Access.html (Accessed 05.06.2015)
Standard.no, NORSOK standards, Available: http://www.standard.no/en/sectors/energi-og-
klima/petroleum/norsok-standards/#.VRgTUZOUfnI (Accessed 29.03.15)
http://www.nptel.ac.in/courses/112107142/27 (Accessed 21.05.2015)
Support.office.com, Create a form in Access 2013, Available: https://support.office.com/en-
us/article/Create-an-Access-form-5d550a3d-92e1-4f38-9772-7e7e21e80c6b (Accessed
12.05.2015)
Support.office.com, Introduction to queries Available: https://support.office.com/en-
in/article/Introduction-to-queries-d85e4893-0ed7-4118-8297-785a01357516 (Accessed
12.05.2015)
Vatn, J. (1996), Maintenance optimization: models and methods. PhD dissertation,
Norwegian University of Science and Technology, Department of Production and Quality
Engineering, N-7034 Trondheim, Norway.
100
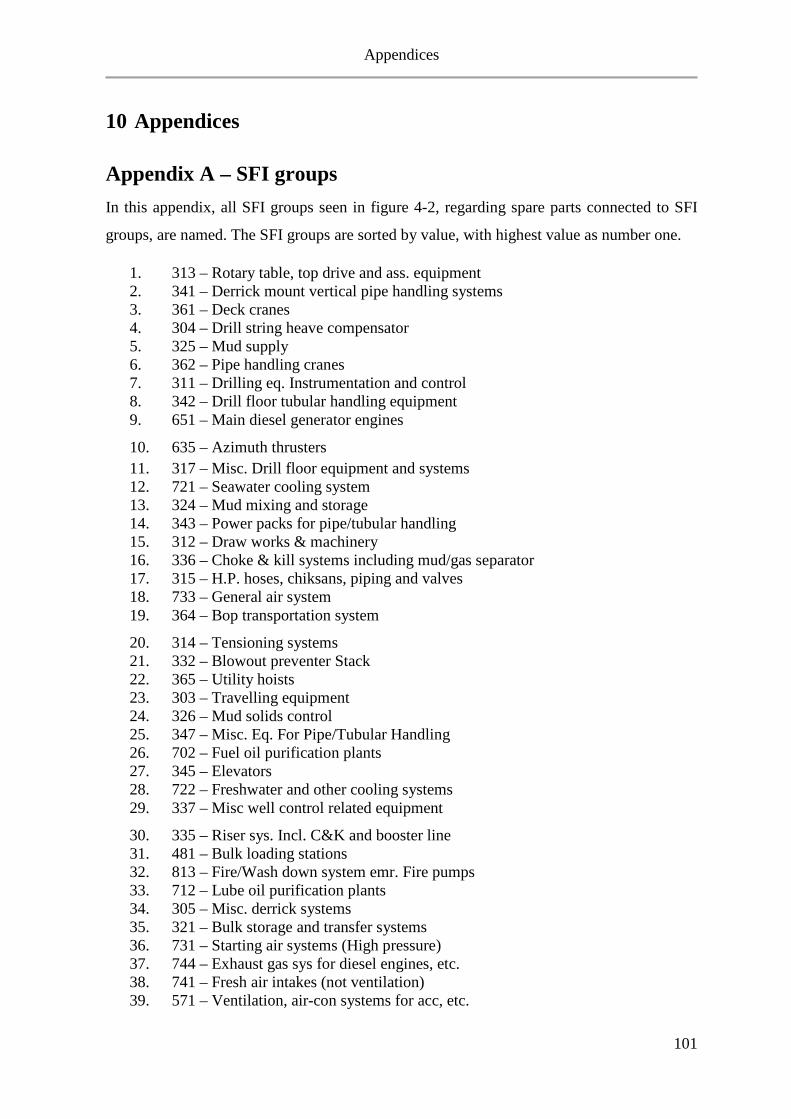
Appendices
10 Appendices
Appendix A – SFI groups In this appendix, all SFI groups seen in figure 4-2, regarding spare parts connected to SFI
groups, are named. The SFI groups are sorted by value, with highest value as number one.
1. 313 – Rotary table, top drive and ass. equipment 2. 341 – Derrick mount vertical pipe handling systems 3. 361 – Deck cranes 4. 304 – Drill string heave compensator 5. 325 – Mud supply 6. 362 – Pipe handling cranes 7. 311 – Drilling eq. Instrumentation and control 8. 342 – Drill floor tubular handling equipment 9. 651 – Main diesel generator engines
10. 635 – Azimuth thrusters 11. 317 – Misc. Drill floor equipment and systems 12. 721 – Seawater cooling system 13. 324 – Mud mixing and storage 14. 343 – Power packs for pipe/tubular handling 15. 312 – Draw works & machinery 16. 336 – Choke & kill systems including mud/gas separator 17. 315 – H.P. hoses, chiksans, piping and valves 18. 733 – General air system 19. 364 – Bop transportation system
20. 314 – Tensioning systems 21. 332 – Blowout preventer Stack 22. 365 – Utility hoists 23. 303 – Travelling equipment 24. 326 – Mud solids control 25. 347 – Misc. Eq. For Pipe/Tubular Handling 26. 702 – Fuel oil purification plants 27. 345 – Elevators 28. 722 – Freshwater and other cooling systems 29. 337 – Misc well control related equipment
30. 335 – Riser sys. Incl. C&K and booster line 31. 481 – Bulk loading stations 32. 813 – Fire/Wash down system emr. Fire pumps 33. 712 – Lube oil purification plants 34. 305 – Misc. derrick systems 35. 321 – Bulk storage and transfer systems 36. 731 – Starting air systems (High pressure) 37. 744 – Exhaust gas sys for diesel engines, etc. 38. 741 – Fresh air intakes (not ventilation) 39. 571 – Ventilation, air-con systems for acc, etc.
101
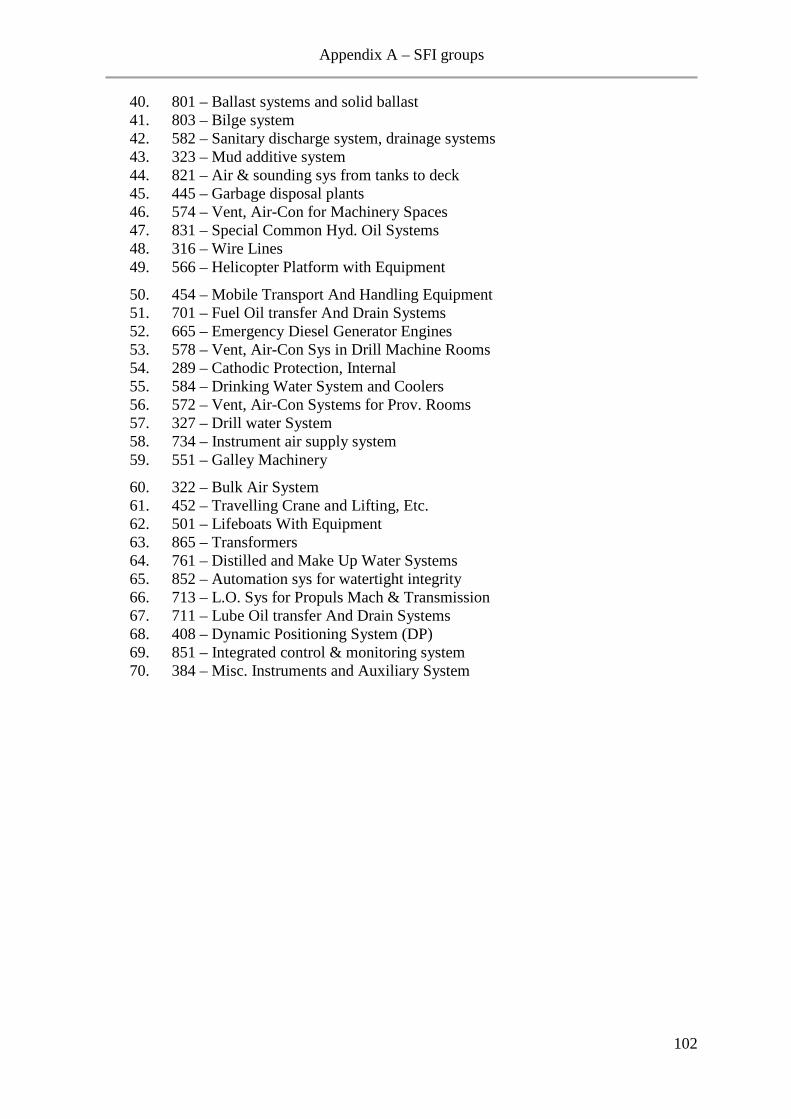
Appendix A – SFI groups
40. 801 – Ballast systems and solid ballast 41. 803 – Bilge system 42. 582 – Sanitary discharge system, drainage systems 43. 323 – Mud additive system 44. 821 – Air & sounding sys from tanks to deck 45. 445 – Garbage disposal plants 46. 574 – Vent, Air-Con for Machinery Spaces 47. 831 – Special Common Hyd. Oil Systems 48. 316 – Wire Lines 49. 566 – Helicopter Platform with Equipment
50. 454 – Mobile Transport And Handling Equipment 51. 701 – Fuel Oil transfer And Drain Systems 52. 665 – Emergency Diesel Generator Engines 53. 578 – Vent, Air-Con Sys in Drill Machine Rooms 54. 289 – Cathodic Protection, Internal 55. 584 – Drinking Water System and Coolers 56. 572 – Vent, Air-Con Systems for Prov. Rooms 57. 327 – Drill water System 58. 734 – Instrument air supply system 59. 551 – Galley Machinery
60. 322 – Bulk Air System 61. 452 – Travelling Crane and Lifting, Etc. 62. 501 – Lifeboats With Equipment 63. 865 – Transformers 64. 761 – Distilled and Make Up Water Systems 65. 852 – Automation sys for watertight integrity 66. 713 – L.O. Sys for Propuls Mach & Transmission 67. 711 – Lube Oil transfer And Drain Systems 68. 408 – Dynamic Positioning System (DP) 69. 851 – Integrated control & monitoring system 70. 384 – Misc. Instruments and Auxiliary System
102
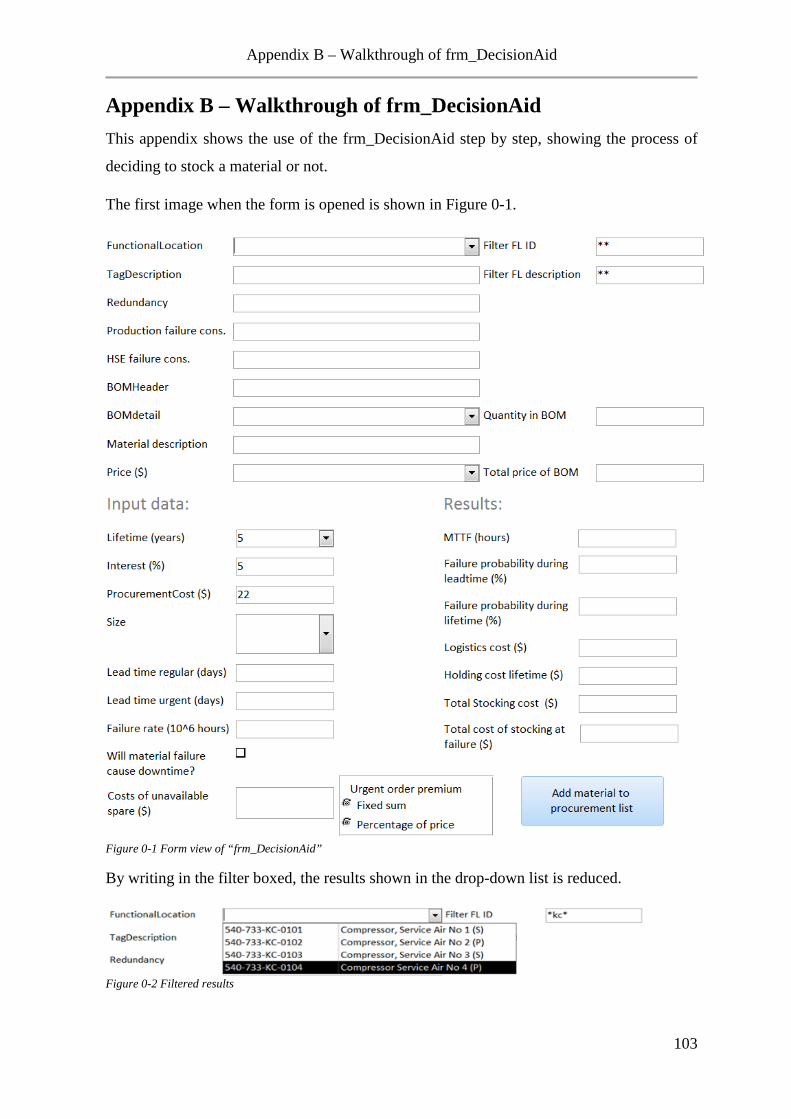
Appendix B – Walkthrough of frm_DecisionAid
Appendix B – Walkthrough of frm_DecisionAid This appendix shows the use of the frm_DecisionAid step by step, showing the process of
deciding to stock a material or not.
The first image when the form is opened is shown in Figure 0-1.
Figure 0-1 Form view of “frm_DecisionAid”
By writing in the filter boxed, the results shown in the drop-down list is reduced.
Figure 0-2 Filtered results
103
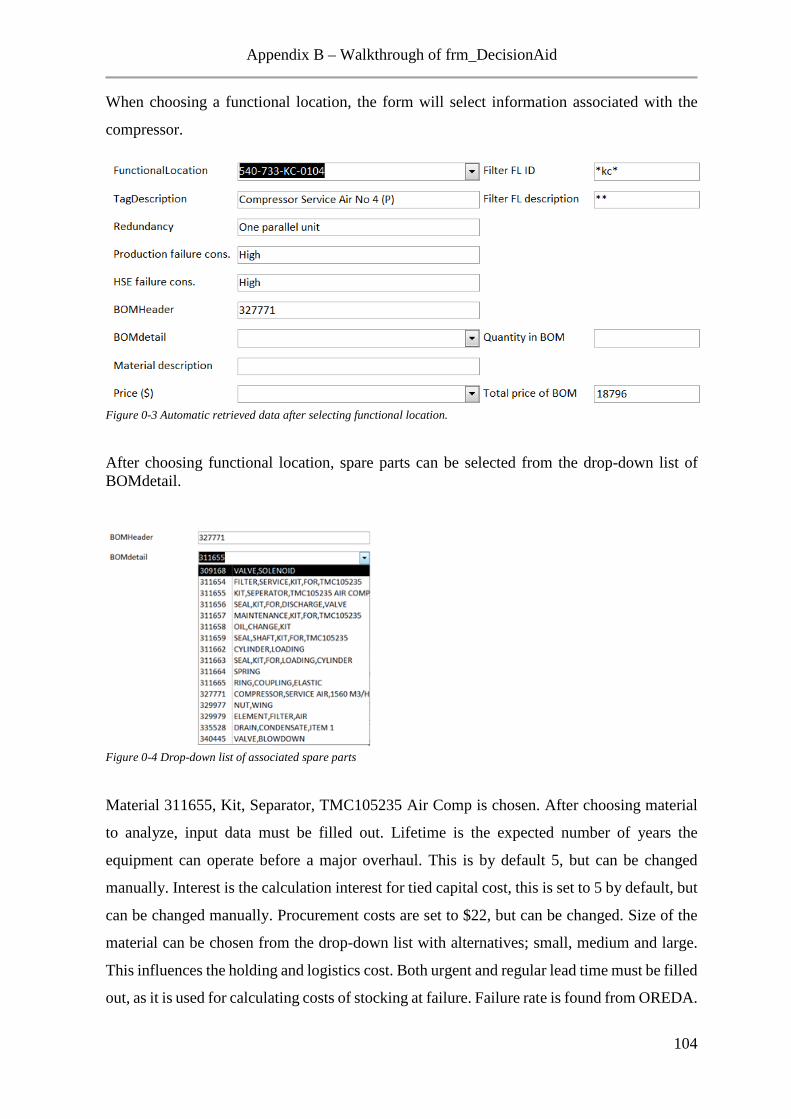
Appendix B – Walkthrough of frm_DecisionAid
When choosing a functional location, the form will select information associated with the
compressor.
Figure 0-3 Automatic retrieved data after selecting functional location.
After choosing functional location, spare parts can be selected from the drop-down list of BOMdetail.
Figure 0-4 Drop-down list of associated spare parts
Material 311655, Kit, Separator, TMC105235 Air Comp is chosen. After choosing material
to analyze, input data must be filled out. Lifetime is the expected number of years the
equipment can operate before a major overhaul. This is by default 5, but can be changed
manually. Interest is the calculation interest for tied capital cost, this is set to 5 by default, but
can be changed manually. Procurement costs are set to $22, but can be changed. Size of the
material can be chosen from the drop-down list with alternatives; small, medium and large.
This influences the holding and logistics cost. Both urgent and regular lead time must be filled
out, as it is used for calculating costs of stocking at failure. Failure rate is found from OREDA.
104
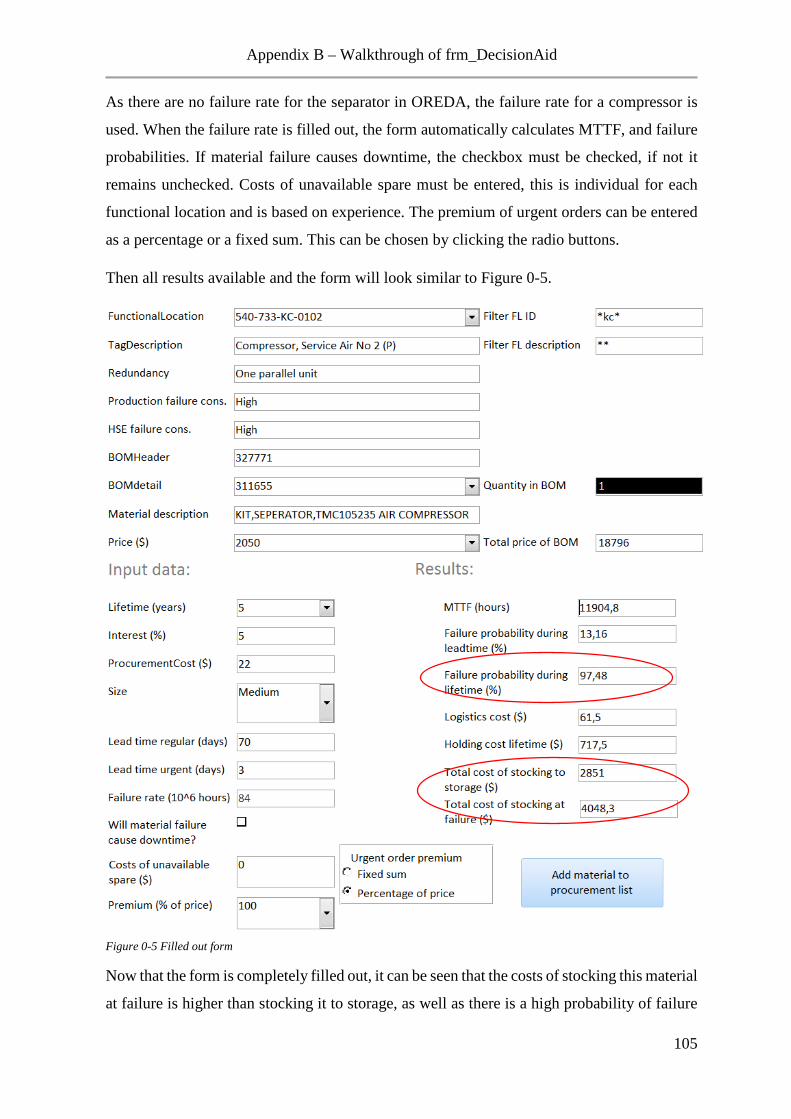
Appendix B – Walkthrough of frm_DecisionAid
As there are no failure rate for the separator in OREDA, the failure rate for a compressor is
used. When the failure rate is filled out, the form automatically calculates MTTF, and failure
probabilities. If material failure causes downtime, the checkbox must be checked, if not it
remains unchecked. Costs of unavailable spare must be entered, this is individual for each
functional location and is based on experience. The premium of urgent orders can be entered
as a percentage or a fixed sum. This can be chosen by clicking the radio buttons.
Then all results available and the form will look similar to Figure 0-5.
Figure 0-5 Filled out form
Now that the form is completely filled out, it can be seen that the costs of stocking this material
at failure is higher than stocking it to storage, as well as there is a high probability of failure
105

Appendix B – Walkthrough of frm_DecisionAid
causing need for this material. This means that the material should be stocked. By clicking
the blue button the material will be added to the table “tbl_ShoppingCart”, and the quantity
has to be decided with the use of form “frm_DecideSpareQuantity”.
106
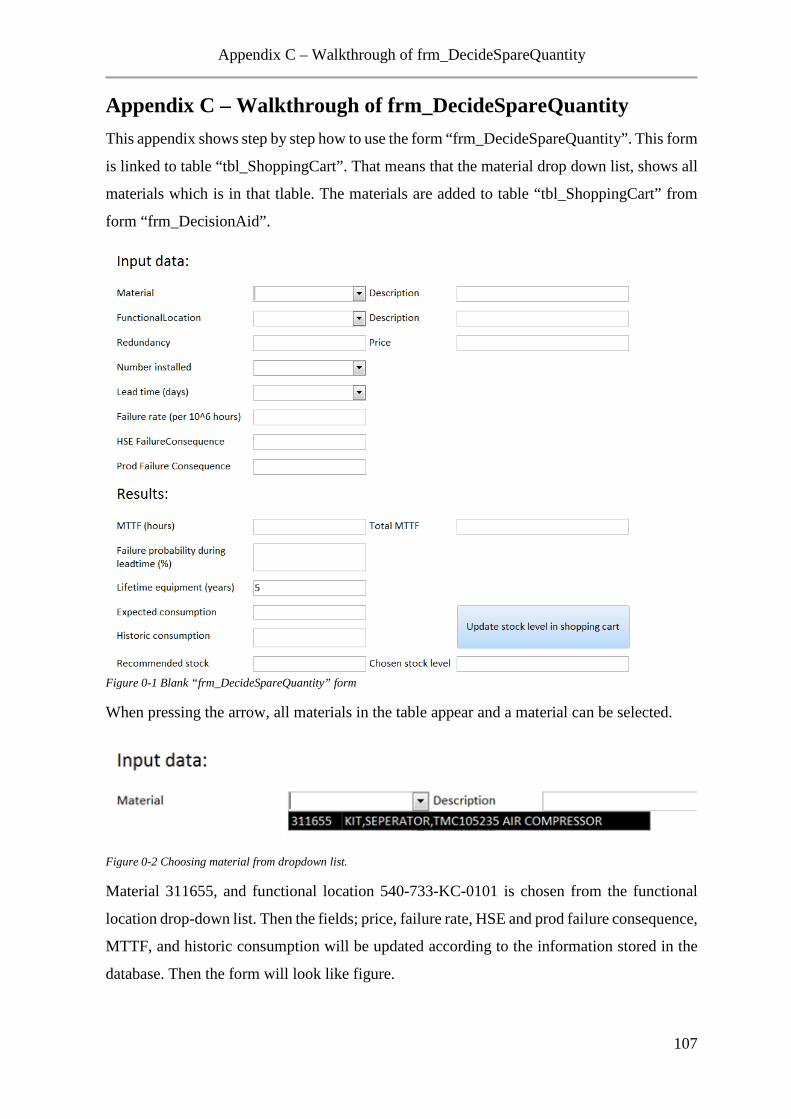
Appendix C – Walkthrough of frm_DecideSpareQuantity
Appendix C – Walkthrough of frm_DecideSpareQuantity This appendix shows step by step how to use the form “frm_DecideSpareQuantity”. This form
is linked to table “tbl_ShoppingCart”. That means that the material drop down list, shows all
materials which is in that tlable. The materials are added to table “tbl_ShoppingCart” from
form “frm_DecisionAid”.
Figure 0-1 Blank “frm_DecideSpareQuantity” form
When pressing the arrow, all materials in the table appear and a material can be selected.
Figure 0-2 Choosing material from dropdown list.
Material 311655, and functional location 540-733-KC-0101 is chosen from the functional
location drop-down list. Then the fields; price, failure rate, HSE and prod failure consequence,
MTTF, and historic consumption will be updated according to the information stored in the
database. Then the form will look like figure.
107
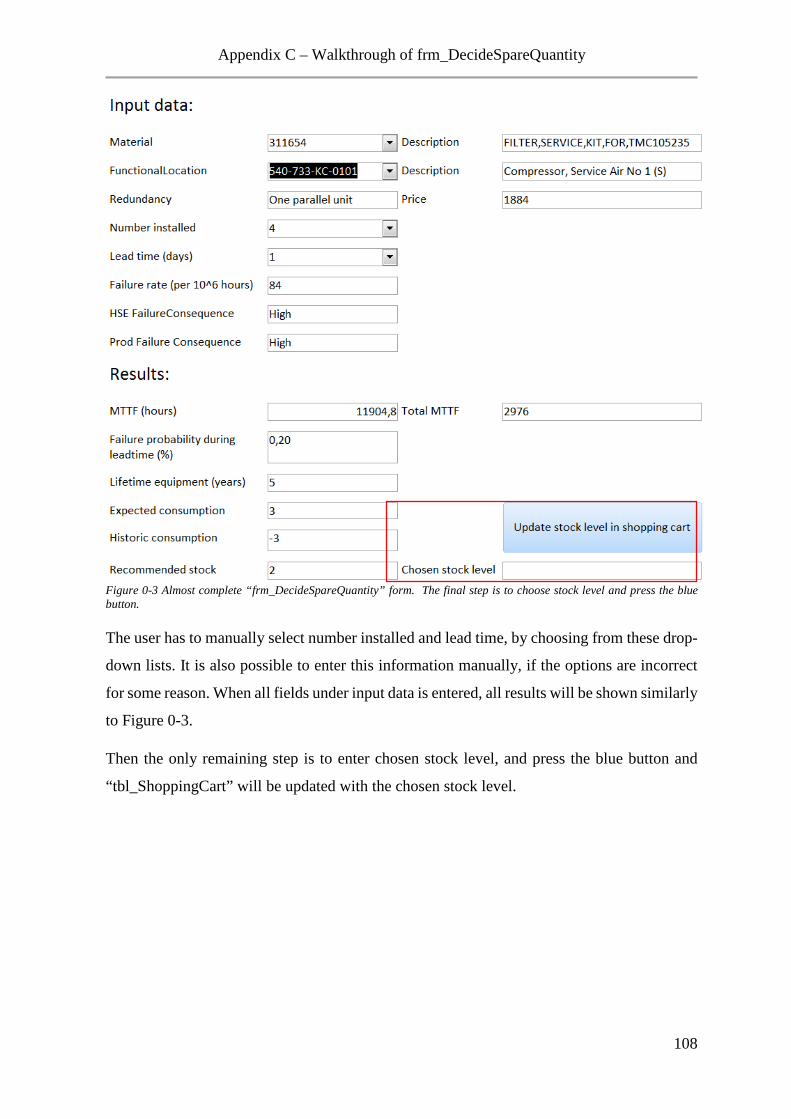
Appendix C – Walkthrough of frm_DecideSpareQuantity
Figure 0-3 Almost complete “frm_DecideSpareQuantity” form. The final step is to choose stock level and press the blue button.
The user has to manually select number installed and lead time, by choosing from these drop-
down lists. It is also possible to enter this information manually, if the options are incorrect
for some reason. When all fields under input data is entered, all results will be shown similarly
to Figure 0-3.
Then the only remaining step is to enter chosen stock level, and press the blue button and
“tbl_ShoppingCart” will be updated with the chosen stock level.
108
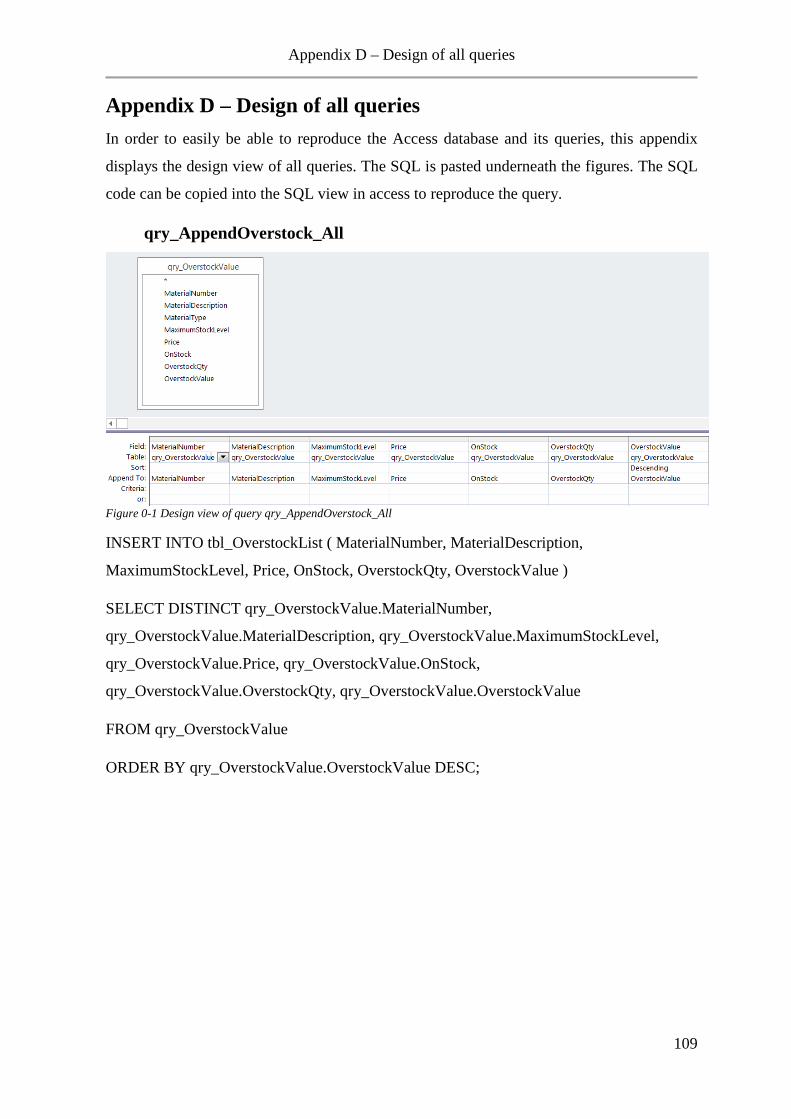
Appendix D – Design of all queries
Appendix D – Design of all queries In order to easily be able to reproduce the Access database and its queries, this appendix
displays the design view of all queries. The SQL is pasted underneath the figures. The SQL
code can be copied into the SQL view in access to reproduce the query.
qry_AppendOverstock_All
Figure 0-1 Design view of query qry_AppendOverstock_All
INSERT INTO tbl_OverstockList ( MaterialNumber, MaterialDescription,
MaximumStockLevel, Price, OnStock, OverstockQty, OverstockValue )
SELECT DISTINCT qry_OverstockValue.MaterialNumber,
qry_OverstockValue.MaterialDescription, qry_OverstockValue.MaximumStockLevel,
qry_OverstockValue.Price, qry_OverstockValue.OnStock,
qry_OverstockValue.OverstockQty, qry_OverstockValue.OverstockValue
FROM qry_OverstockValue
ORDER BY qry_OverstockValue.OverstockValue DESC;
109
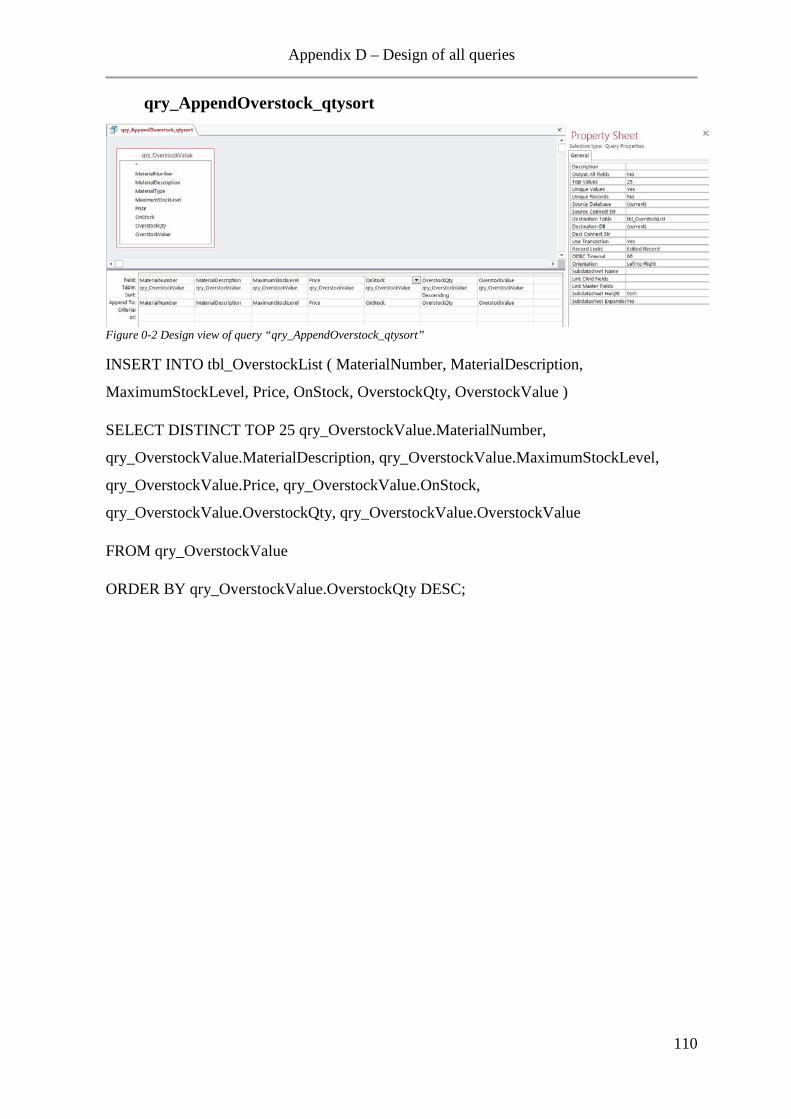
Appendix D – Design of all queries
qry_AppendOverstock_qtysort
Figure 0-2 Design view of query “qry_AppendOverstock_qtysort”
INSERT INTO tbl_OverstockList ( MaterialNumber, MaterialDescription,
MaximumStockLevel, Price, OnStock, OverstockQty, OverstockValue )
SELECT DISTINCT TOP 25 qry_OverstockValue.MaterialNumber,
qry_OverstockValue.MaterialDescription, qry_OverstockValue.MaximumStockLevel,
qry_OverstockValue.Price, qry_OverstockValue.OnStock,
qry_OverstockValue.OverstockQty, qry_OverstockValue.OverstockValue
FROM qry_OverstockValue
ORDER BY qry_OverstockValue.OverstockQty DESC;
110
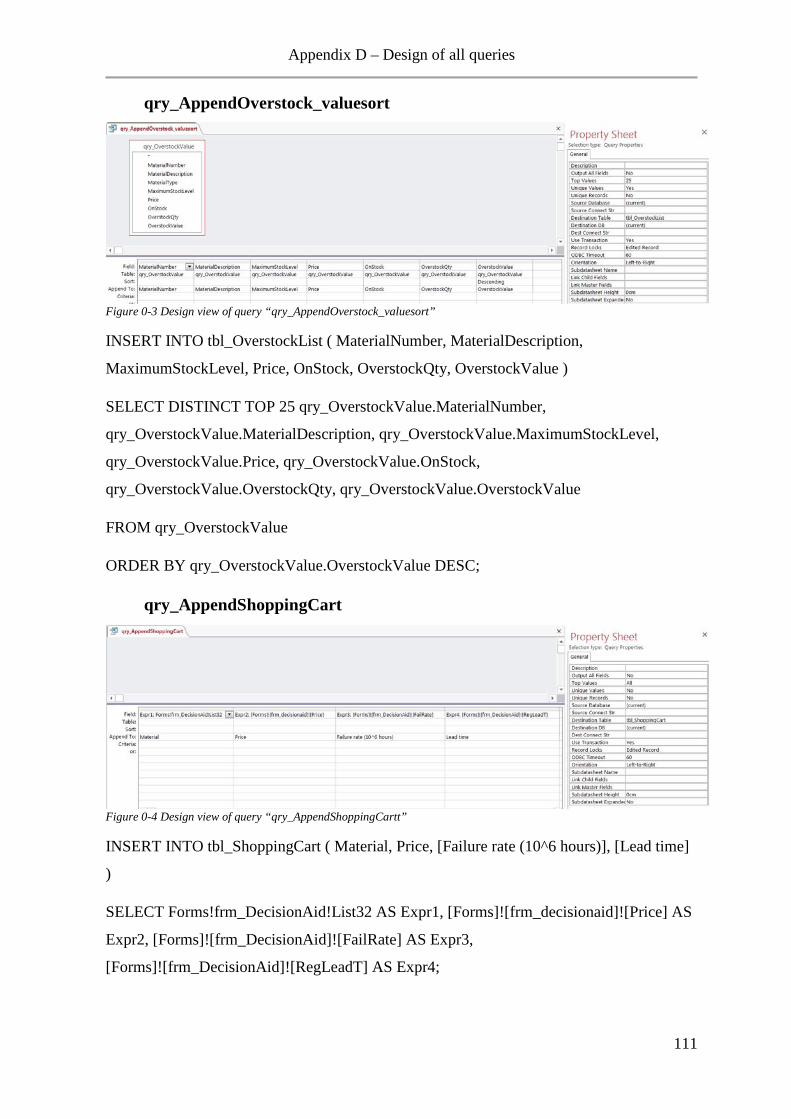
Appendix D – Design of all queries
qry_AppendOverstock_valuesort
Figure 0-3 Design view of query “qry_AppendOverstock_valuesort”
INSERT INTO tbl_OverstockList ( MaterialNumber, MaterialDescription,
MaximumStockLevel, Price, OnStock, OverstockQty, OverstockValue )
SELECT DISTINCT TOP 25 qry_OverstockValue.MaterialNumber,
qry_OverstockValue.MaterialDescription, qry_OverstockValue.MaximumStockLevel,
qry_OverstockValue.Price, qry_OverstockValue.OnStock,
qry_OverstockValue.OverstockQty, qry_OverstockValue.OverstockValue
FROM qry_OverstockValue
ORDER BY qry_OverstockValue.OverstockValue DESC;
qry_AppendShoppingCart
Figure 0-4 Design view of query “qry_AppendShoppingCartt”
INSERT INTO tbl_ShoppingCart ( Material, Price, [Failure rate (10^6 hours)], [Lead time]
)
SELECT Forms!frm_DecisionAid!List32 AS Expr1, [Forms]![frm_decisionaid]![Price] AS
Expr2, [Forms]![frm_DecisionAid]![FailRate] AS Expr3,
[Forms]![frm_DecisionAid]![RegLeadT] AS Expr4;
111
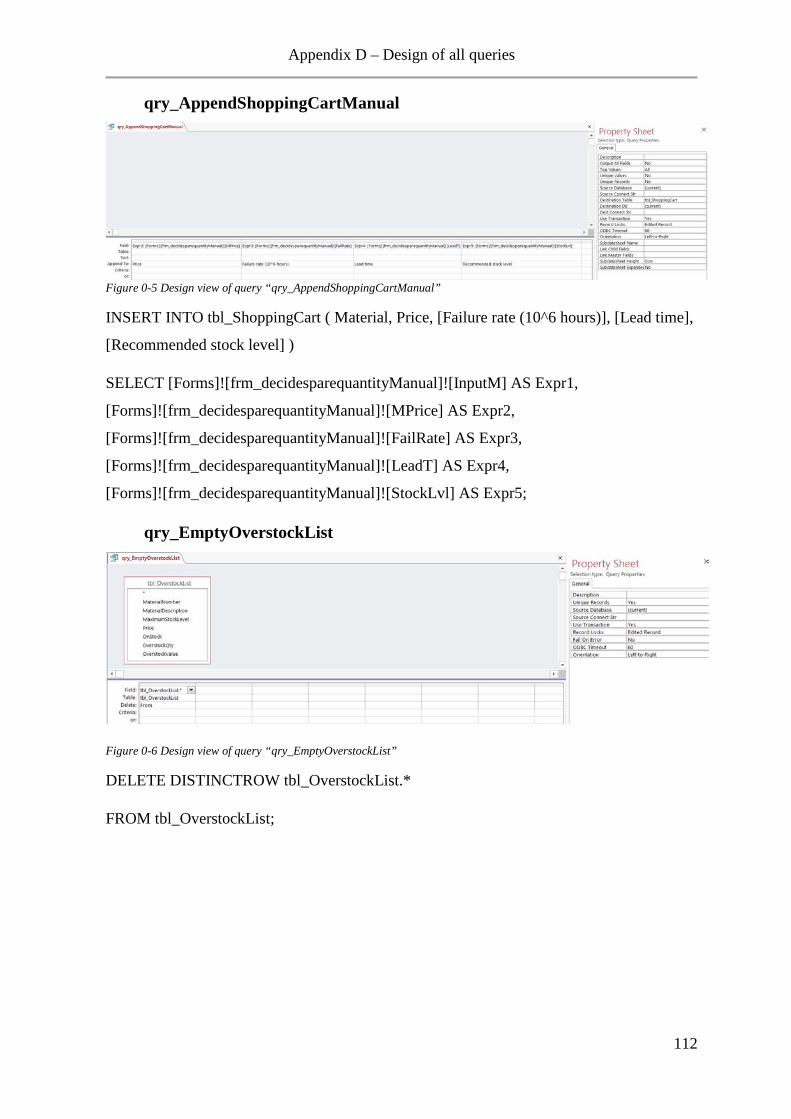
Appendix D – Design of all queries
qry_AppendShoppingCartManual
Figure 0-5 Design view of query “qry_AppendShoppingCartManual”
INSERT INTO tbl_ShoppingCart ( Material, Price, [Failure rate (10^6 hours)], [Lead time],
[Recommended stock level] )
SELECT [Forms]![frm_decidesparequantityManual]![InputM] AS Expr1,
[Forms]![frm_decidesparequantityManual]![MPrice] AS Expr2,
[Forms]![frm_decidesparequantityManual]![FailRate] AS Expr3,
[Forms]![frm_decidesparequantityManual]![LeadT] AS Expr4,
[Forms]![frm_decidesparequantityManual]![StockLvl] AS Expr5;
qry_EmptyOverstockList
Figure 0-6 Design view of query “qry_EmptyOverstockList”
DELETE DISTINCTROW tbl_OverstockList.*
FROM tbl_OverstockList;
112
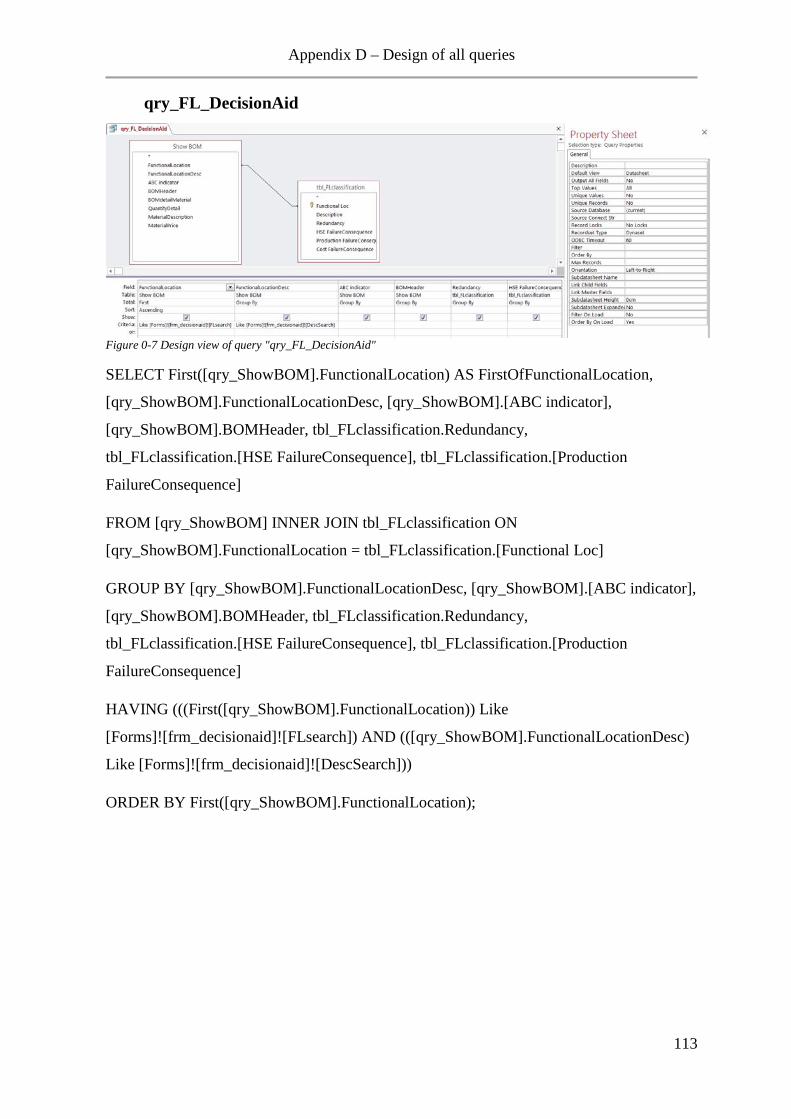
Appendix D – Design of all queries
qry_FL_DecisionAid
Figure 0-7 Design view of query "qry_FL_DecisionAid"
SELECT First([qry_ShowBOM].FunctionalLocation) AS FirstOfFunctionalLocation,
[qry_ShowBOM].FunctionalLocationDesc, [qry_ShowBOM].[ABC indicator],
[qry_ShowBOM].BOMHeader, tbl_FLclassification.Redundancy,
tbl_FLclassification.[HSE FailureConsequence], tbl_FLclassification.[Production
FailureConsequence]
FROM [qry_ShowBOM] INNER JOIN tbl_FLclassification ON
[qry_ShowBOM].FunctionalLocation = tbl_FLclassification.[Functional Loc]
GROUP BY [qry_ShowBOM].FunctionalLocationDesc, [qry_ShowBOM].[ABC indicator],
[qry_ShowBOM].BOMHeader, tbl_FLclassification.Redundancy,
tbl_FLclassification.[HSE FailureConsequence], tbl_FLclassification.[Production
FailureConsequence]
HAVING (((First([qry_ShowBOM].FunctionalLocation)) Like
[Forms]![frm_decisionaid]![FLsearch]) AND (([qry_ShowBOM].FunctionalLocationDesc)
Like [Forms]![frm_decisionaid]![DescSearch]))
ORDER BY First([qry_ShowBOM].FunctionalLocation);
113
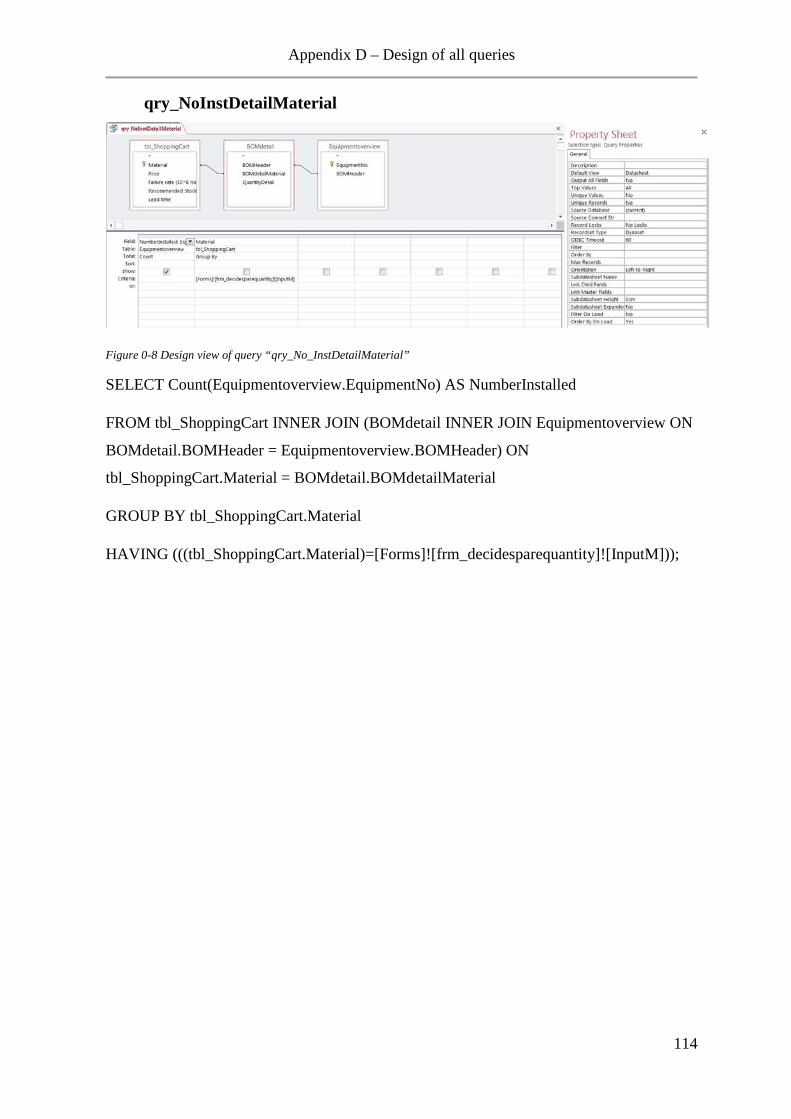
Appendix D – Design of all queries
qry_NoInstDetailMaterial
Figure 0-8 Design view of query “qry_No_InstDetailMaterial”
SELECT Count(Equipmentoverview.EquipmentNo) AS NumberInstalled
FROM tbl_ShoppingCart INNER JOIN (BOMdetail INNER JOIN Equipmentoverview ON
BOMdetail.BOMHeader = Equipmentoverview.BOMHeader) ON
tbl_ShoppingCart.Material = BOMdetail.BOMdetailMaterial
GROUP BY tbl_ShoppingCart.Material
HAVING (((tbl_ShoppingCart.Material)=[Forms]![frm_decidesparequantity]![InputM]));
114
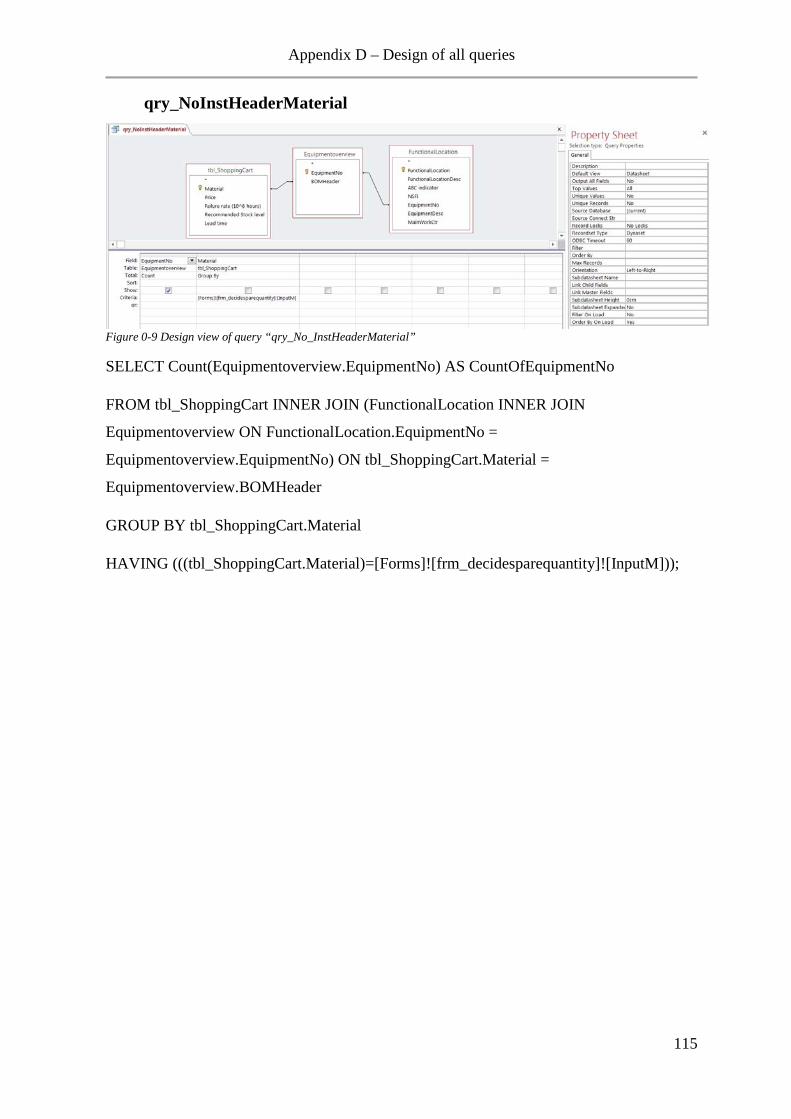
Appendix D – Design of all queries
qry_NoInstHeaderMaterial
Figure 0-9 Design view of query “qry_No_InstHeaderMaterial”
SELECT Count(Equipmentoverview.EquipmentNo) AS CountOfEquipmentNo
FROM tbl_ShoppingCart INNER JOIN (FunctionalLocation INNER JOIN
Equipmentoverview ON FunctionalLocation.EquipmentNo =
Equipmentoverview.EquipmentNo) ON tbl_ShoppingCart.Material =
Equipmentoverview.BOMHeader
GROUP BY tbl_ShoppingCart.Material
HAVING (((tbl_ShoppingCart.Material)=[Forms]![frm_decidesparequantity]![InputM]));
115
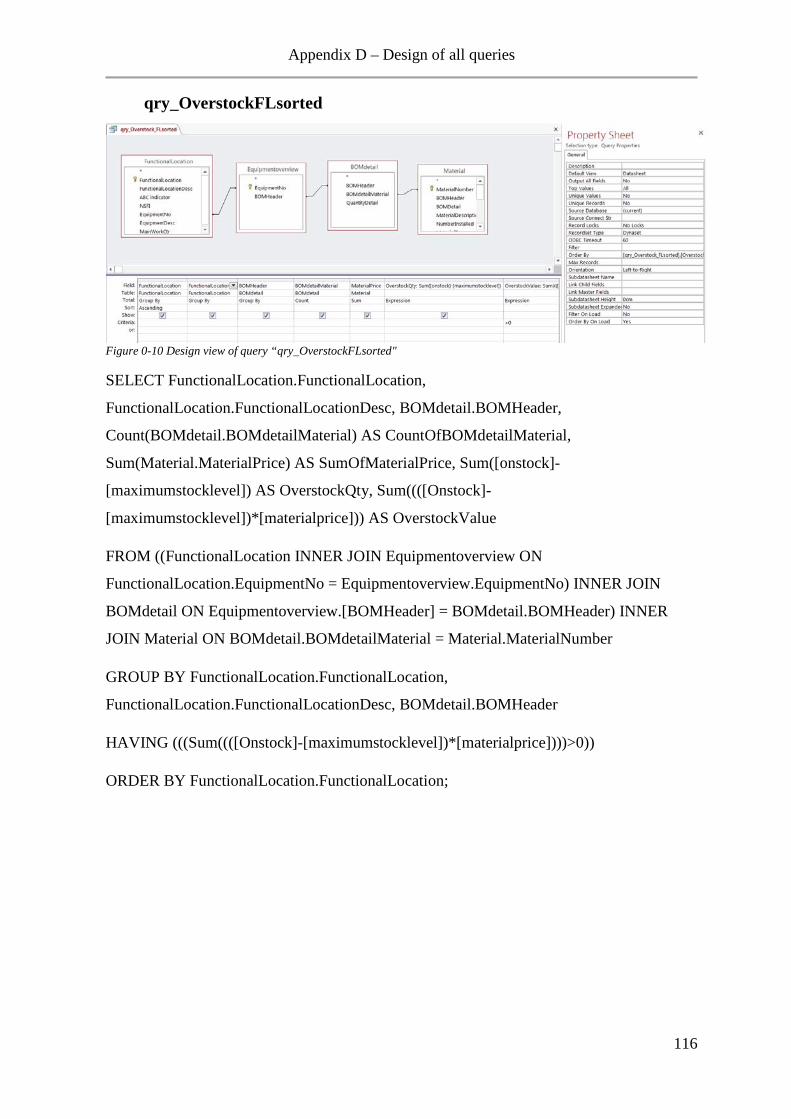
Appendix D – Design of all queries
qry_OverstockFLsorted
Figure 0-10 Design view of query “qry_OverstockFLsorted"
SELECT FunctionalLocation.FunctionalLocation,
FunctionalLocation.FunctionalLocationDesc, BOMdetail.BOMHeader,
Count(BOMdetail.BOMdetailMaterial) AS CountOfBOMdetailMaterial,
Sum(Material.MaterialPrice) AS SumOfMaterialPrice, Sum([onstock]-
[maximumstocklevel]) AS OverstockQty, Sum((([Onstock]-
[maximumstocklevel])*[materialprice])) AS OverstockValue
FROM ((FunctionalLocation INNER JOIN Equipmentoverview ON
FunctionalLocation.EquipmentNo = Equipmentoverview.EquipmentNo) INNER JOIN
BOMdetail ON Equipmentoverview.[BOMHeader] = BOMdetail.BOMHeader) INNER
JOIN Material ON BOMdetail.BOMdetailMaterial = Material.MaterialNumber
GROUP BY FunctionalLocation.FunctionalLocation,
FunctionalLocation.FunctionalLocationDesc, BOMdetail.BOMHeader
HAVING (((Sum((([Onstock]-[maximumstocklevel])*[materialprice])))>0))
ORDER BY FunctionalLocation.FunctionalLocation;
116
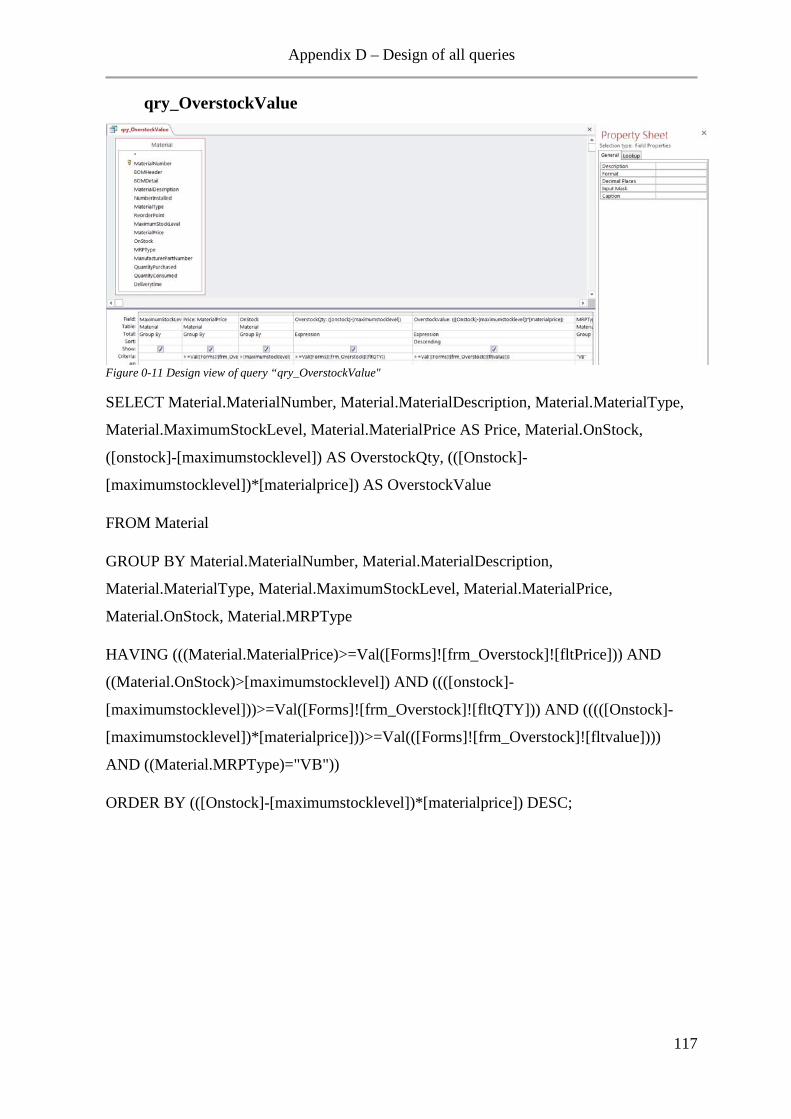
Appendix D – Design of all queries
qry_OverstockValue
Figure 0-11 Design view of query “qry_OverstockValue"
SELECT Material.MaterialNumber, Material.MaterialDescription, Material.MaterialType,
Material.MaximumStockLevel, Material.MaterialPrice AS Price, Material.OnStock,
([onstock]-[maximumstocklevel]) AS OverstockQty, (([Onstock]-
[maximumstocklevel])*[materialprice]) AS OverstockValue
FROM Material
GROUP BY Material.MaterialNumber, Material.MaterialDescription,
Material.MaterialType, Material.MaximumStockLevel, Material.MaterialPrice,
Material.OnStock, Material.MRPType
HAVING (((Material.MaterialPrice)>=Val([Forms]![frm_Overstock]![fltPrice])) AND
((Material.OnStock)>[maximumstocklevel]) AND ((([onstock]-
[maximumstocklevel]))>=Val([Forms]![frm_Overstock]![fltQTY])) AND (((([Onstock]-
[maximumstocklevel])*[materialprice]))>=Val(([Forms]![frm_Overstock]![fltvalue])))
AND ((Material.MRPType)="VB"))
ORDER BY (([Onstock]-[maximumstocklevel])*[materialprice]) DESC;
117
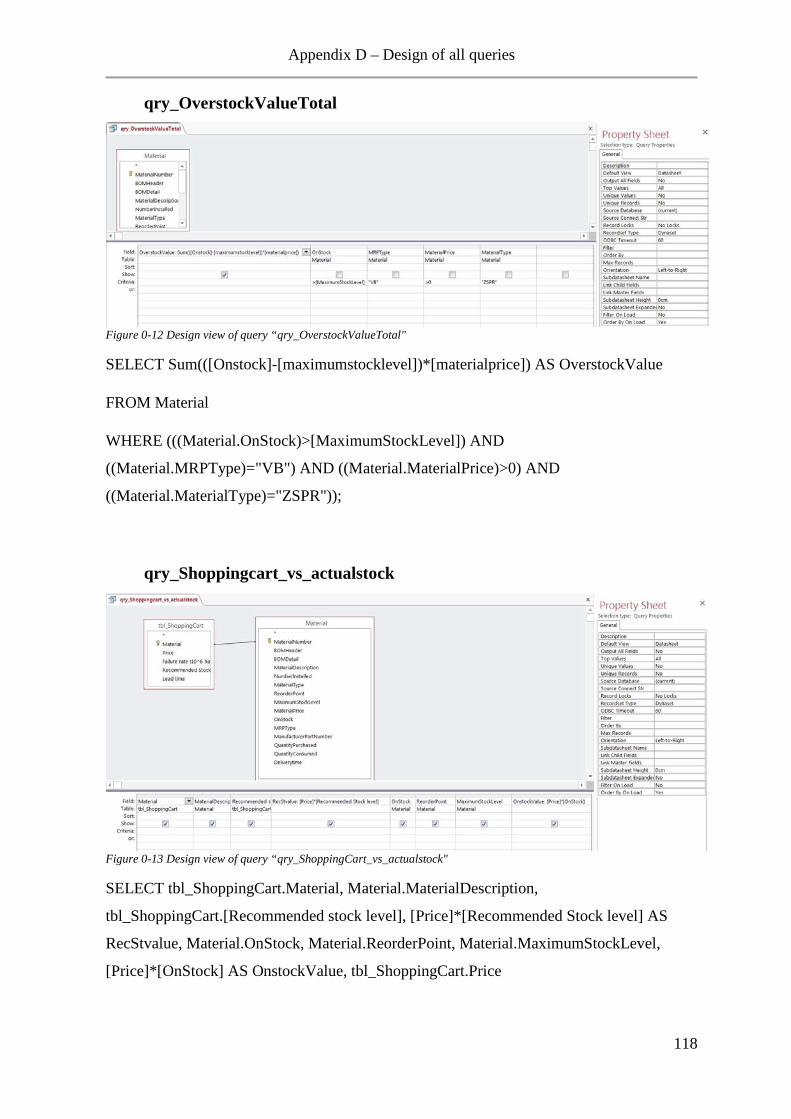
Appendix D – Design of all queries
qry_OverstockValueTotal
Figure 0-12 Design view of query “qry_OverstockValueTotal"
SELECT Sum(([Onstock]-[maximumstocklevel])*[materialprice]) AS OverstockValue
FROM Material
WHERE (((Material.OnStock)>[MaximumStockLevel]) AND
((Material.MRPType)="VB") AND ((Material.MaterialPrice)>0) AND
((Material.MaterialType)="ZSPR"));
qry_Shoppingcart_vs_actualstock
Figure 0-13 Design view of query “qry_ShoppingCart_vs_actualstock"
SELECT tbl_ShoppingCart.Material, Material.MaterialDescription,
tbl_ShoppingCart.[Recommended stock level], [Price]*[Recommended Stock level] AS
RecStvalue, Material.OnStock, Material.ReorderPoint, Material.MaximumStockLevel,
[Price]*[OnStock] AS OnstockValue, tbl_ShoppingCart.Price
118
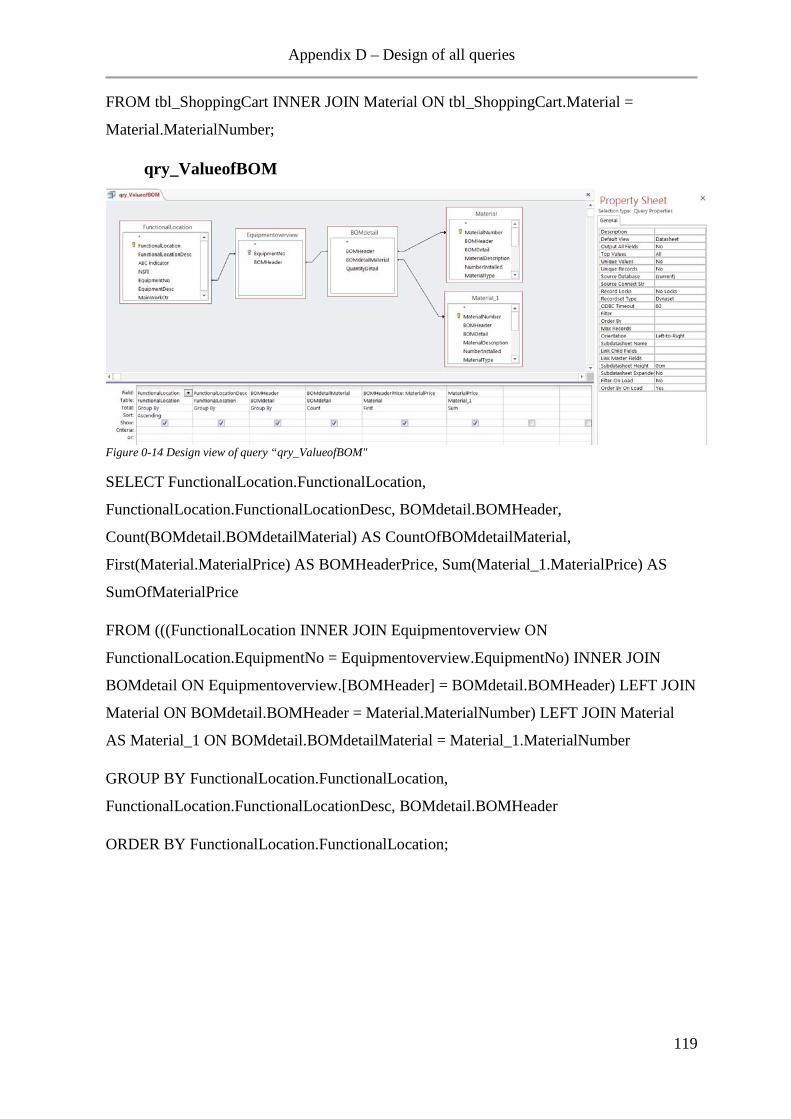
Appendix D – Design of all queries
FROM tbl_ShoppingCart INNER JOIN Material ON tbl_ShoppingCart.Material =
Material.MaterialNumber;
qry_ValueofBOM
Figure 0-14 Design view of query “qry_ValueofBOM"
SELECT FunctionalLocation.FunctionalLocation,
FunctionalLocation.FunctionalLocationDesc, BOMdetail.BOMHeader,
Count(BOMdetail.BOMdetailMaterial) AS CountOfBOMdetailMaterial,
First(Material.MaterialPrice) AS BOMHeaderPrice, Sum(Material_1.MaterialPrice) AS
SumOfMaterialPrice
FROM (((FunctionalLocation INNER JOIN Equipmentoverview ON
FunctionalLocation.EquipmentNo = Equipmentoverview.EquipmentNo) INNER JOIN
BOMdetail ON Equipmentoverview.[BOMHeader] = BOMdetail.BOMHeader) LEFT JOIN
Material ON BOMdetail.BOMHeader = Material.MaterialNumber) LEFT JOIN Material
AS Material_1 ON BOMdetail.BOMdetailMaterial = Material_1.MaterialNumber
GROUP BY FunctionalLocation.FunctionalLocation,
FunctionalLocation.FunctionalLocationDesc, BOMdetail.BOMHeader
ORDER BY FunctionalLocation.FunctionalLocation;
119
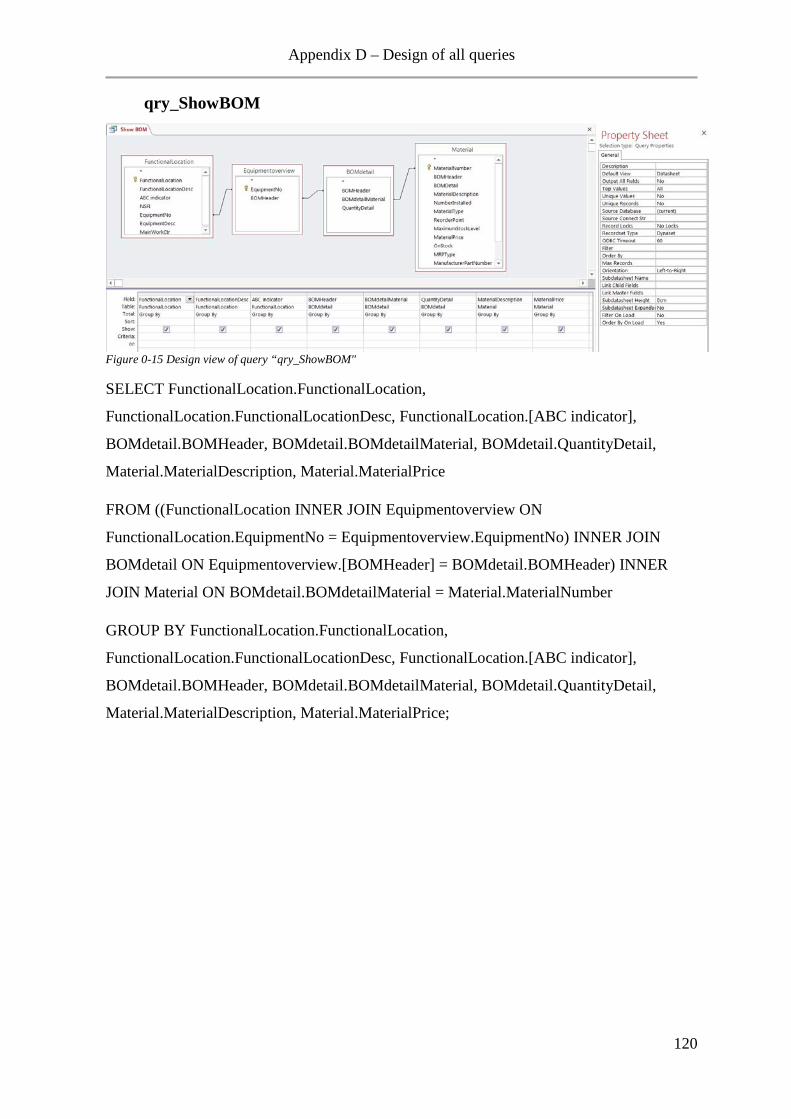
Appendix D – Design of all queries
qry_ShowBOM
Figure 0-15 Design view of query “qry_ShowBOM"
SELECT FunctionalLocation.FunctionalLocation,
FunctionalLocation.FunctionalLocationDesc, FunctionalLocation.[ABC indicator],
BOMdetail.BOMHeader, BOMdetail.BOMdetailMaterial, BOMdetail.QuantityDetail,
Material.MaterialDescription, Material.MaterialPrice
FROM ((FunctionalLocation INNER JOIN Equipmentoverview ON
FunctionalLocation.EquipmentNo = Equipmentoverview.EquipmentNo) INNER JOIN
BOMdetail ON Equipmentoverview.[BOMHeader] = BOMdetail.BOMHeader) INNER
JOIN Material ON BOMdetail.BOMdetailMaterial = Material.MaterialNumber
GROUP BY FunctionalLocation.FunctionalLocation,
FunctionalLocation.FunctionalLocationDesc, FunctionalLocation.[ABC indicator],
BOMdetail.BOMHeader, BOMdetail.BOMdetailMaterial, BOMdetail.QuantityDetail,
Material.MaterialDescription, Material.MaterialPrice;
120
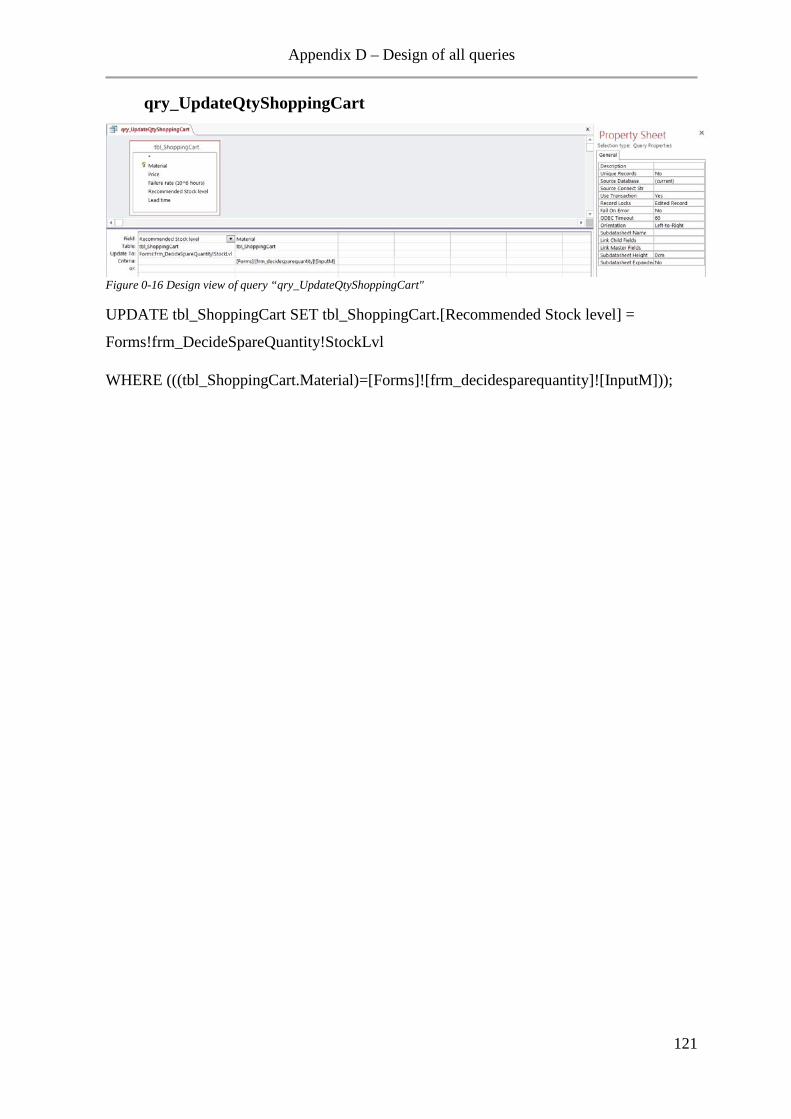
Appendix D – Design of all queries
qry_UpdateQtyShoppingCart
Figure 0-16 Design view of query “qry_UpdateQtyShoppingCart"
UPDATE tbl_ShoppingCart SET tbl_ShoppingCart.[Recommended Stock level] =
Forms!frm_DecideSpareQuantity!StockLvl
WHERE (((tbl_ShoppingCart.Material)=[Forms]![frm_decidesparequantity]![InputM]));
121

Appendix E - Database with framework
Appendix E - Database with framework The Microsoft Access database with framework is attached to the thesis on a USB flash drive.
122