Embed Size (px)
Citation preview
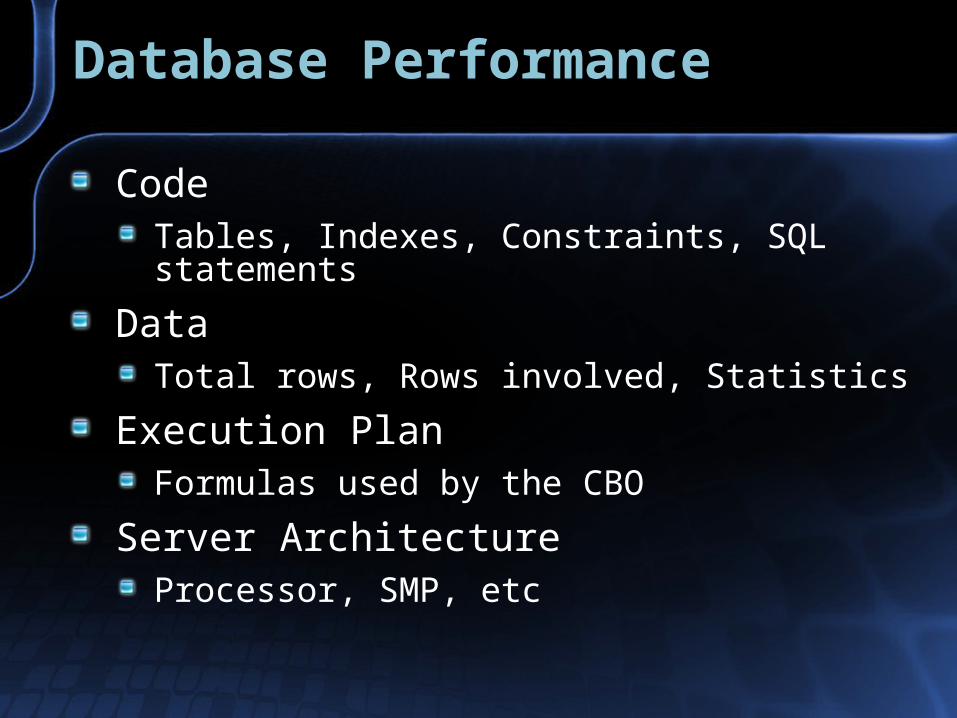
Database Performance
CodeTables, Indexes, Constraints, SQL statements
DataTotal rows, Rows involved, Statistics
Execution PlanFormulas used by the CBO
Server ArchitectureProcessor, SMP, etc
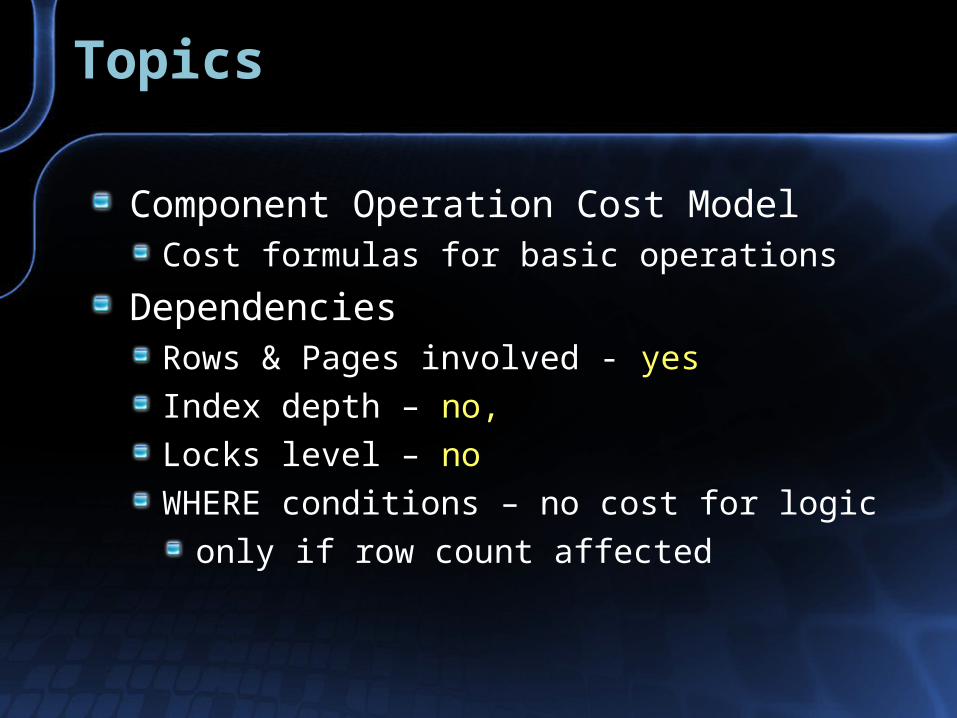
Topics
Component Operation Cost ModelCost formulas for basic operations
DependenciesRows & Pages involved - yes
Index depth – no,
Locks level – no
WHERE conditions – no cost for logic
only if row count affected
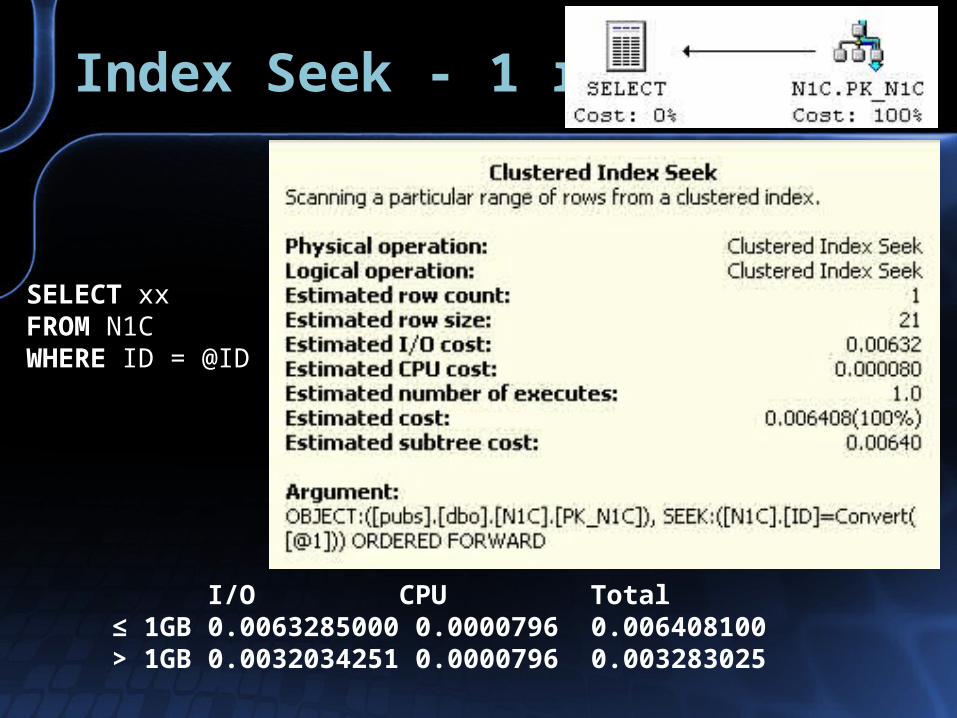
Index Seek - 1 row
SELECT xx FROM N1C WHERE ID = @ID
I/O CPU Total≤ 1GB 0.0063285000 0.0000796 0.006408100> 1GB 0.0032034251 0.0000796 0.003283025
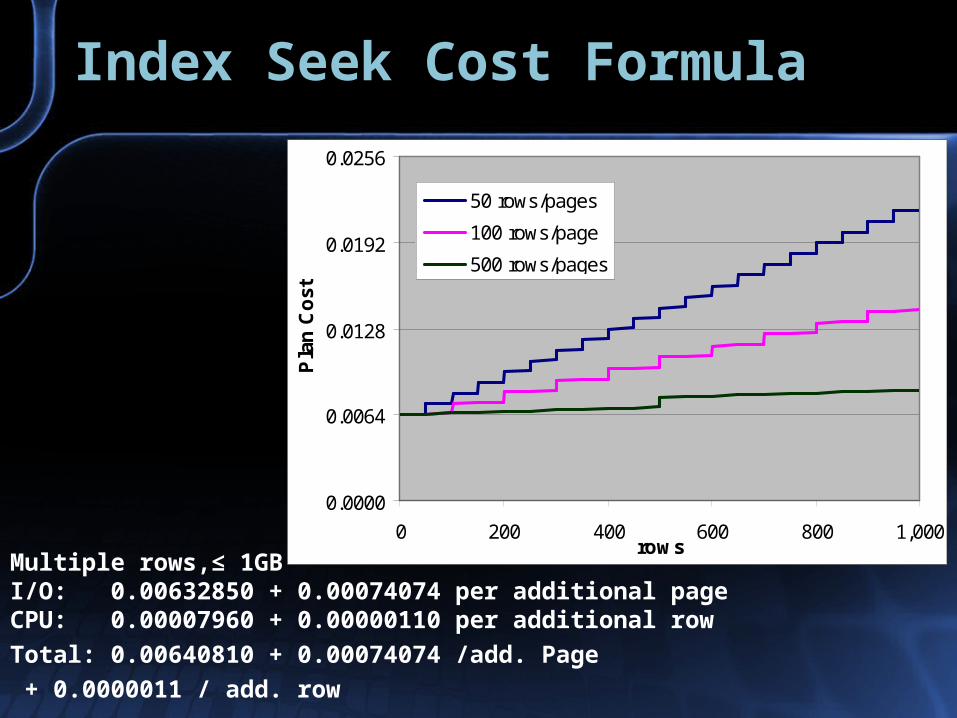
Index Seek Cost Formula
Multiple rows,≤ 1GBI/O: 0.00632850 + 0.00074074 per additional page CPU: 0.00007960 + 0.00000110 per additional row
Total: 0.00640810 + 0.00074074 /add. Page
+ 0.0000011 / add. row
0.0000
0.0064
0.0128
0.0192
0.0256
0 200 400 600 800 1,000rows
Pla
n C
ost
50 rows/pages
100 rows/page
500 rows/pages
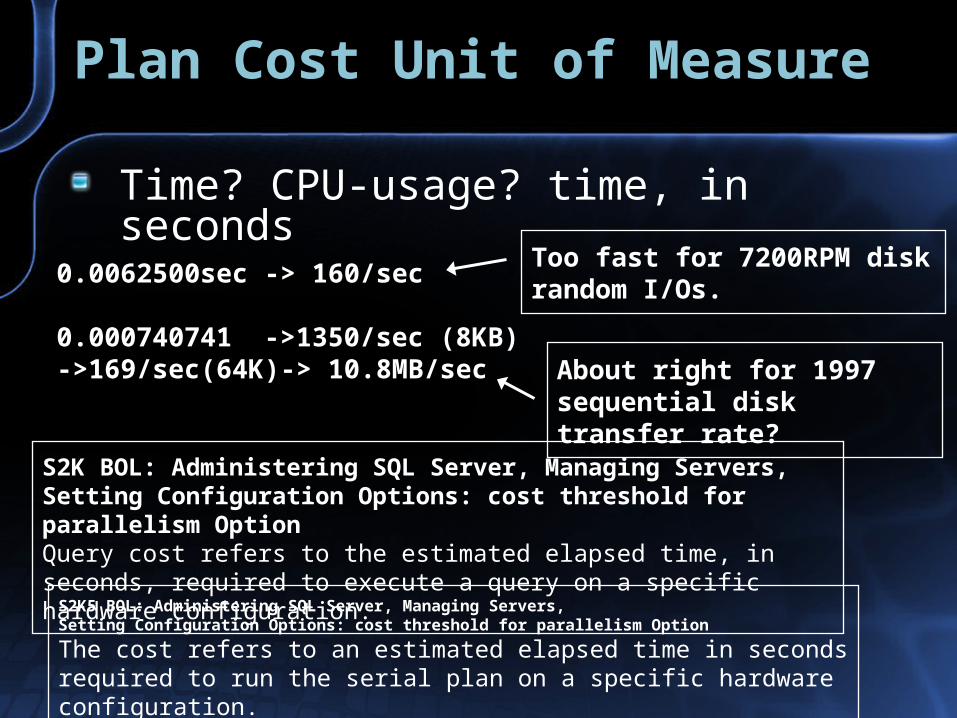
Plan Cost Unit of Measure
Time? CPU-usage? time, in seconds
0.0062500sec -> 160/sec
0.000740741 ->1350/sec (8KB)->169/sec(64K)-> 10.8MB/sec
Too fast for 7200RPM disk random I/Os.
About right for 1997 sequential disk transfer rate?
S2K BOL: Administering SQL Server, Managing Servers,Setting Configuration Options: cost threshold for parallelism OptionQuery cost refers to the estimated elapsed time, in seconds, required to execute a query on a specific hardware configuration.
S2K5 BOL: Administering SQL Server, Managing Servers,Setting Configuration Options: cost threshold for parallelism Option
The cost refers to an estimated elapsed time in seconds required to run the serial plan on a specific hardware configuration.
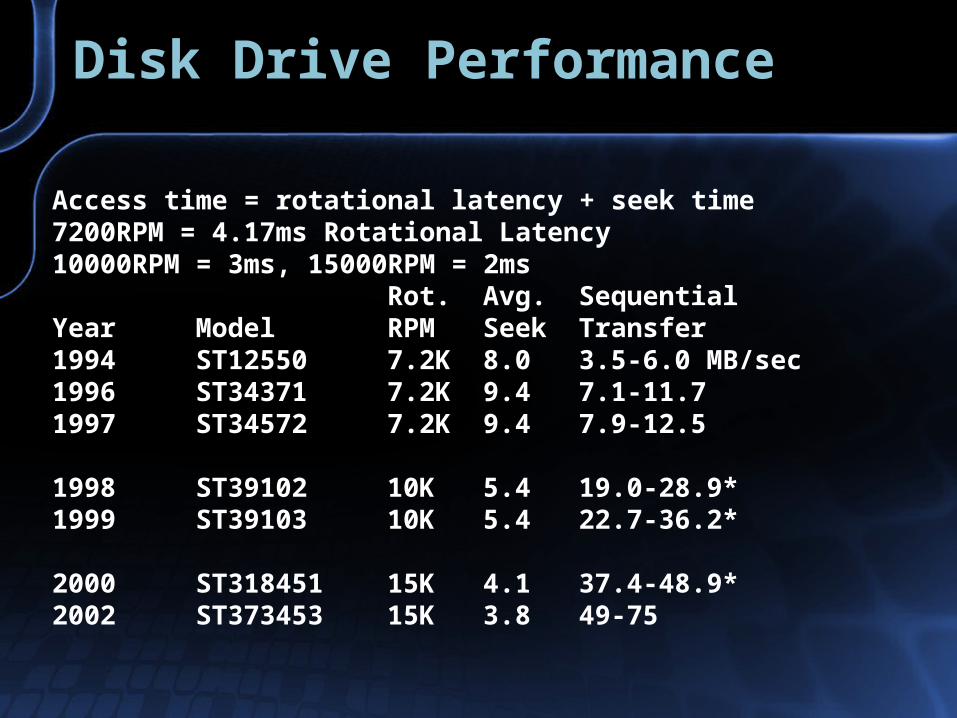
Disk Drive Performance
Access time = rotational latency + seek time7200RPM = 4.17ms Rotational Latency10000RPM = 3ms, 15000RPM = 2ms
Rot. Avg. SequentialYear Model RPM Seek Transfer1994 ST12550 7.2K 8.0 3.5-6.0 MB/sec1996 ST34371 7.2K 9.4 7.1-11.71997 ST34572 7.2K 9.4 7.9-12.5
1998 ST39102 10K 5.4 19.0-28.9*1999 ST39103 10K 5.4 22.7-36.2*
2000 ST318451 15K 4.1 37.4-48.9*2002 ST373453 15K 3.8 49-75
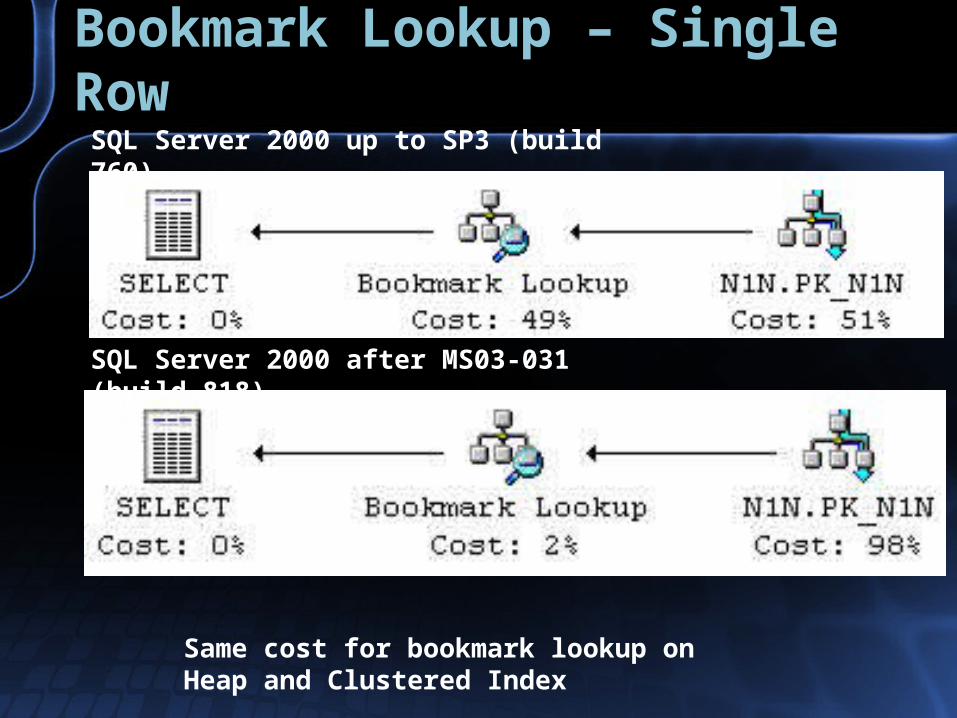
Bookmark Lookup – Single Row
Same cost for bookmark lookup on Heap and Clustered Index
SQL Server 2000 up to SP3 (build 760)
SQL Server 2000 after MS03-031 (build 818)
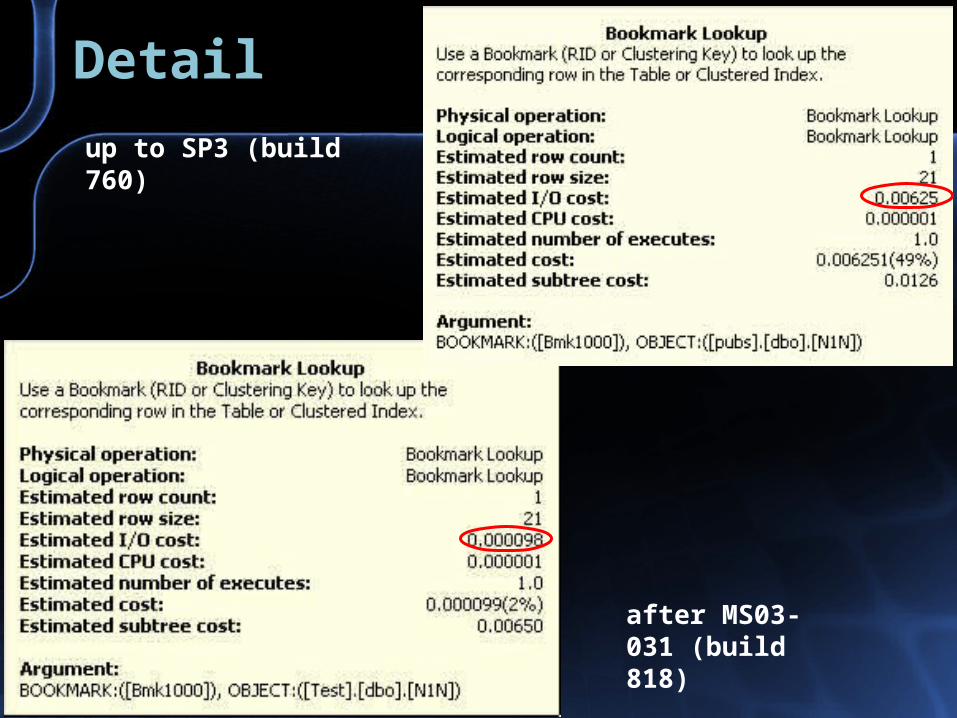
Detail
up to SP3 (build 760)
after MS03-031 (build 818)
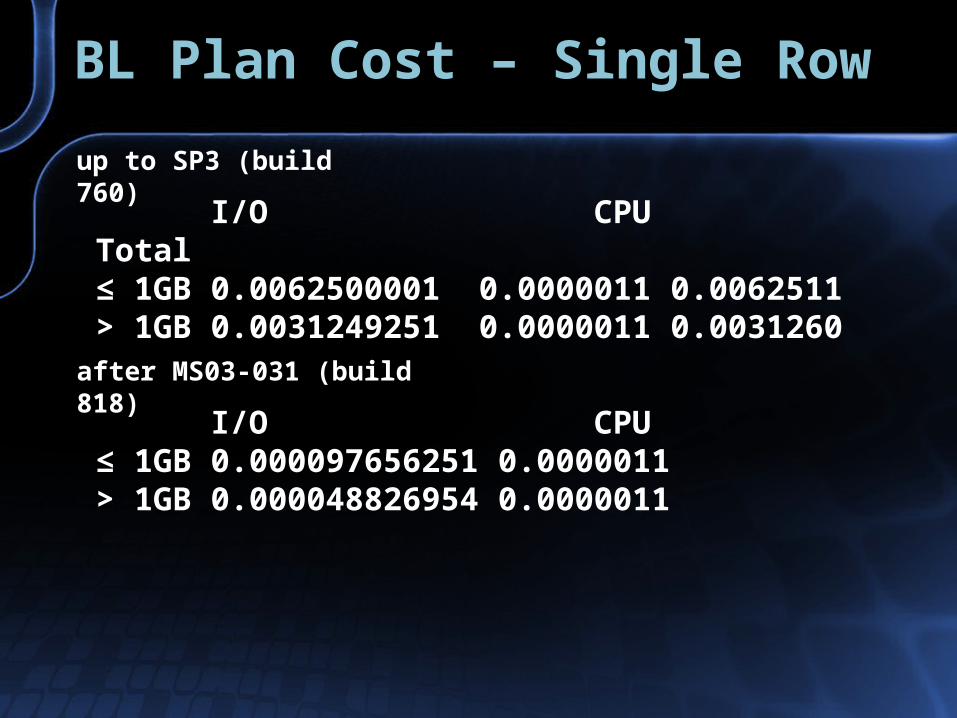
BL Plan Cost – Single Row
I/O CPU ≤ 1GB 0.000097656251 0.0000011> 1GB 0.000048826954 0.0000011
I/O CPU Total≤ 1GB 0.0062500001 0.0000011 0.0062511> 1GB 0.0031249251 0.0000011 0.0031260
up to SP3 (build 760)
after MS03-031 (build 818)
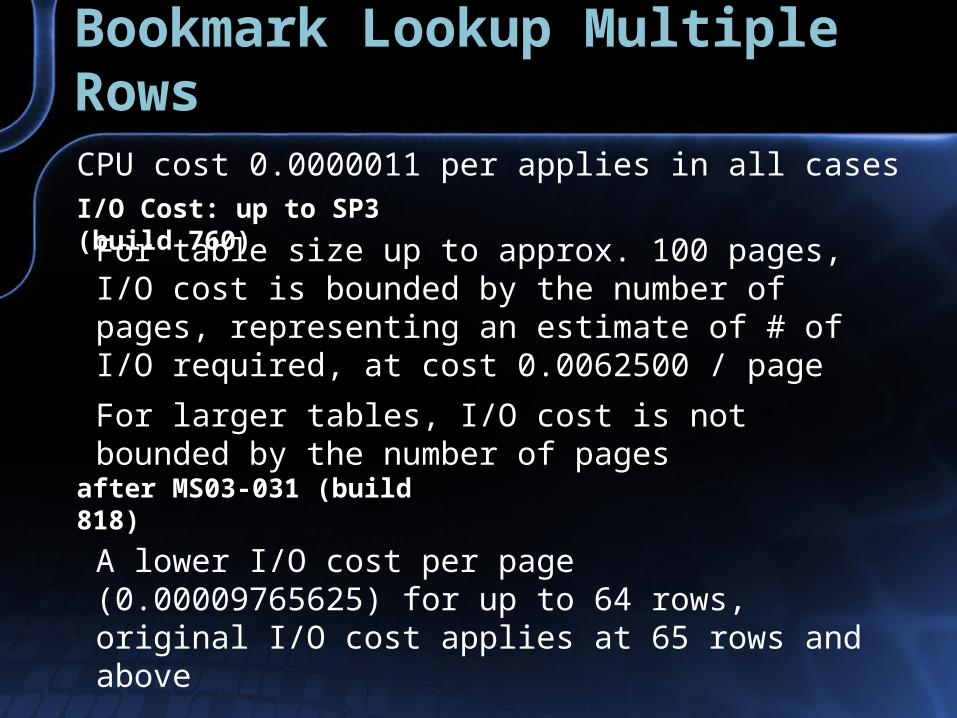
Bookmark Lookup Multiple Rows
A lower I/O cost per page (0.00009765625) for up to 64 rows, original I/O cost applies at 65 rows and above
For table size up to approx. 100 pages, I/O cost is bounded by the number of pages, representing an estimate of # of I/O required, at cost 0.0062500 / page
For larger tables, I/O cost is not bounded by the number of pages
I/O Cost: up to SP3 (build 760)
after MS03-031 (build 818)
CPU cost 0.0000011 per applies in all cases
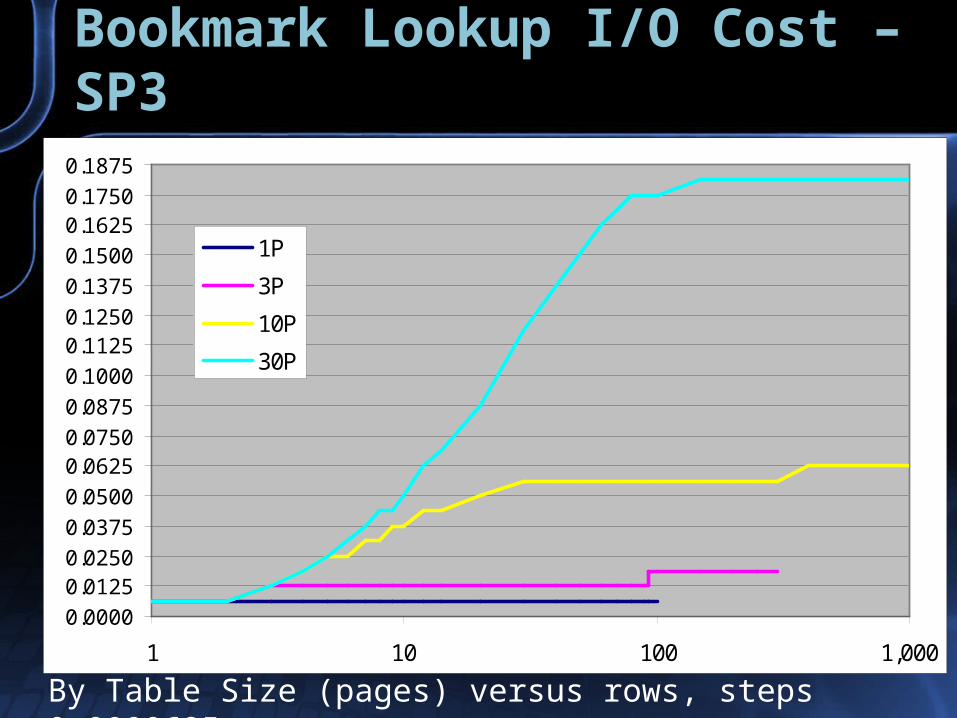
Bookmark Lookup I/O Cost – SP3
By Table Size (pages) versus rows, steps 0.0000625
0.0000
0.01250.0250
0.0375
0.0500
0.06250.0750
0.0875
0.1000
0.11250.1250
0.1375
0.1500
0.16250.1750
0.1875
1 10 100 1,000
1P
3P
10P
30P
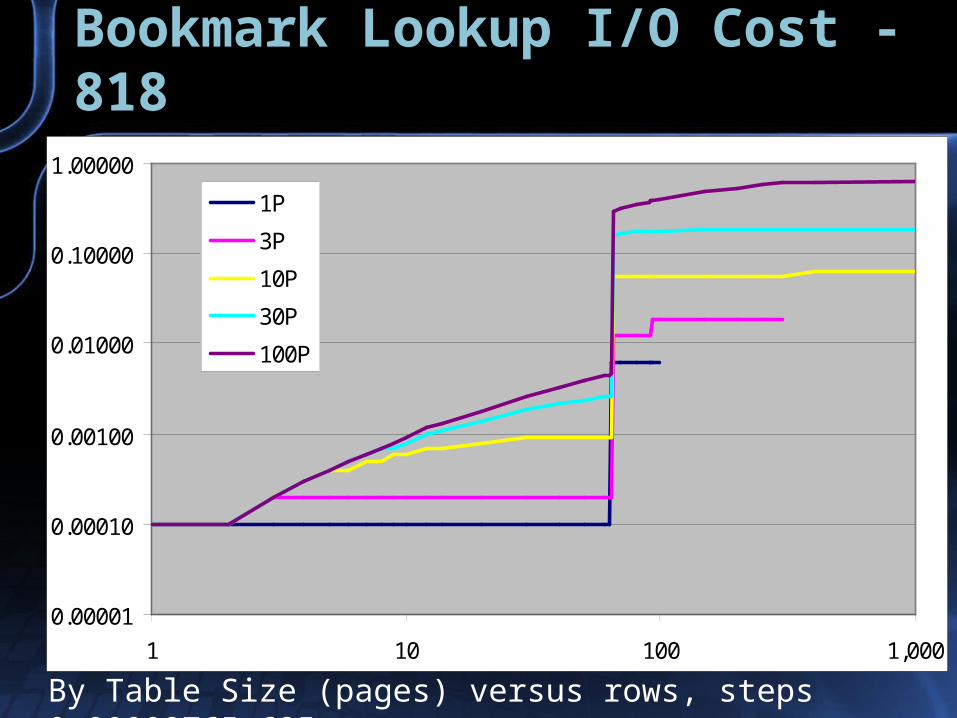
Bookmark Lookup I/O Cost - 818
By Table Size (pages) versus rows, steps 0.00009765 625
0.00001
0.00010
0.00100
0.01000
0.10000
1.00000
1 10 100 1,000
1P
3P
10P
30P
100P
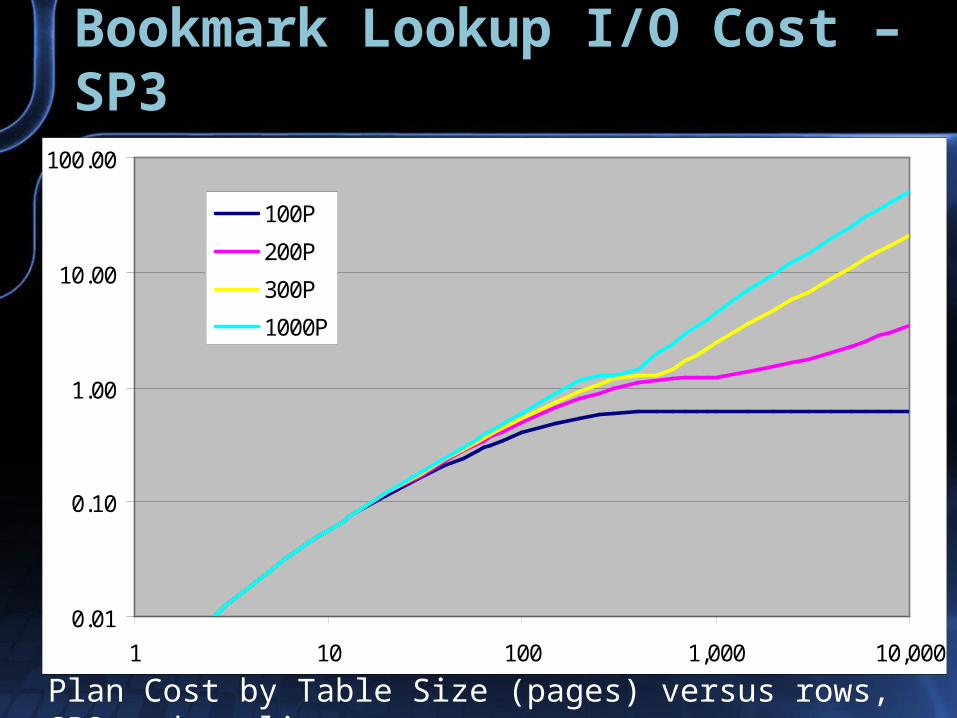
Bookmark Lookup I/O Cost – SP3
Plan Cost by Table Size (pages) versus rows, SP3 and earlier
0.01
0.10
1.00
10.00
100.00
1 10 100 1,000 10,000
100P
200P
300P
1000P
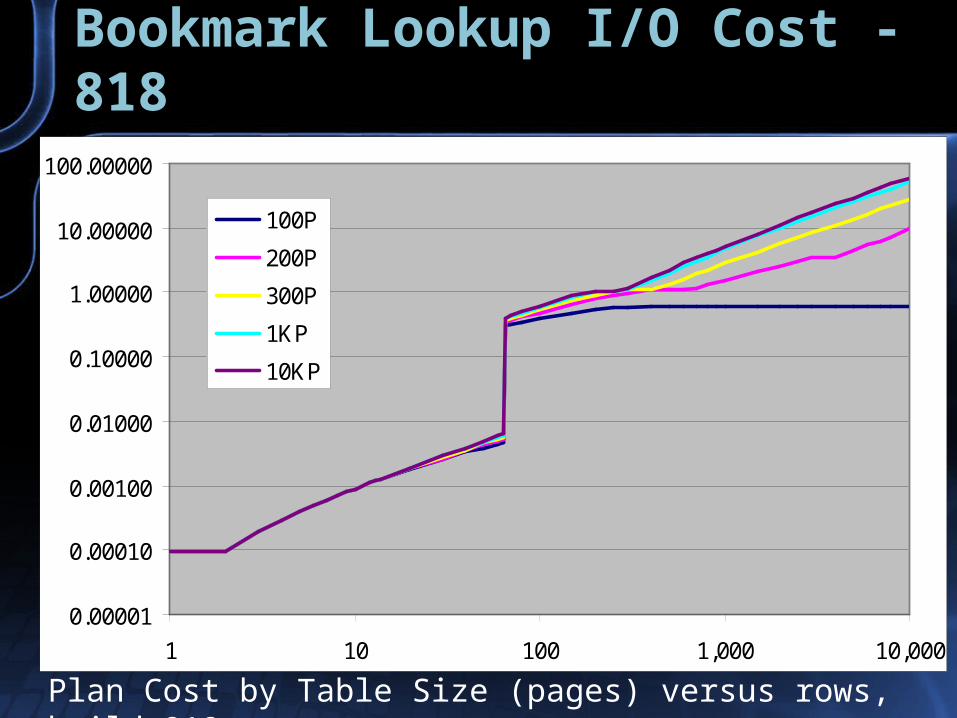
Bookmark Lookup I/O Cost - 818
Plan Cost by Table Size (pages) versus rows, build 818+
0.00001
0.00010
0.00100
0.01000
0.10000
1.00000
10.00000
100.00000
1 10 100 1,000 10,000
100P
200P
300P
1KP
10KP
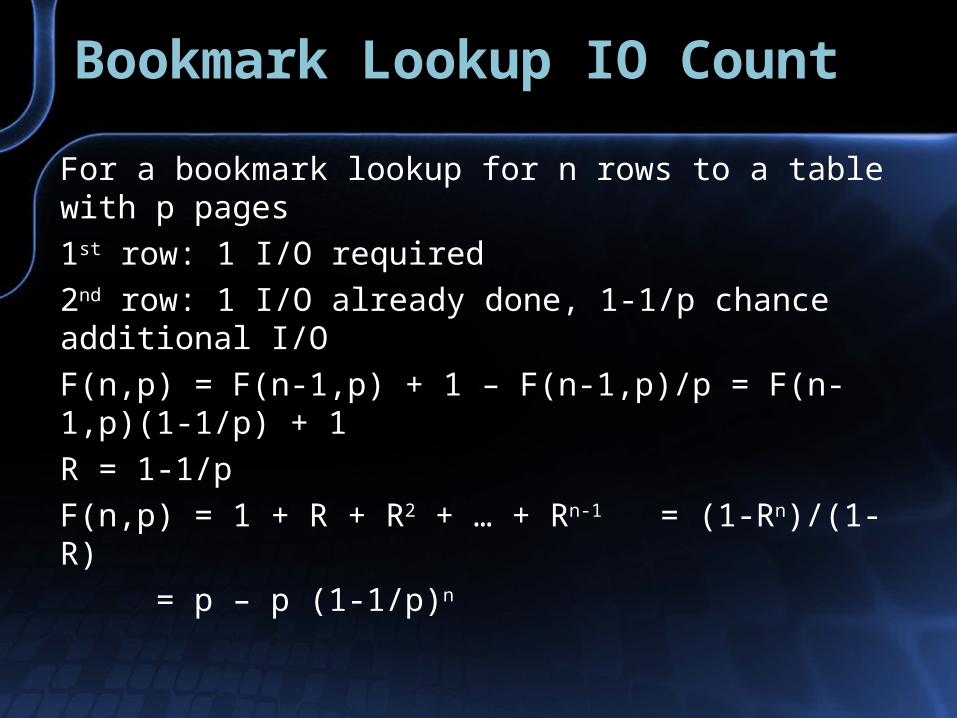
Bookmark Lookup IO Count
For a bookmark lookup for n rows to a table with p pages
1st row: 1 I/O required
2nd row: 1 I/O already done, 1-1/p chance additional I/O
F(n,p) = F(n-1,p) + 1 – F(n-1,p)/p = F(n-1,p)(1-1/p) + 1
R = 1-1/p
F(n,p) = 1 + R + R2 + … + Rn-1 = (1-Rn)/(1-R)
= p – p (1-1/p)n
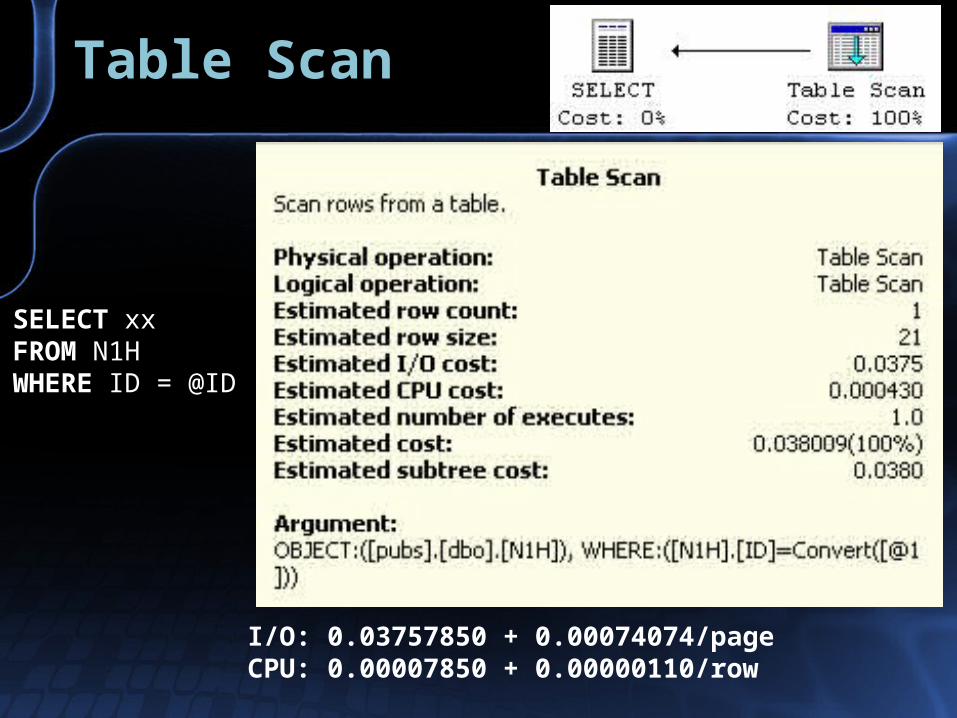
Table Scan
SELECT xxFROM N1H WHERE ID = @ID
I/O: 0.03757850 + 0.00074074/pageCPU: 0.00007850 + 0.00000110/row

Bookmark versus Scan
Table scan cost for 50,000 row, 506 pagesIndex Seek and Bookmark Lookup cost for ≤ 1GB, SP3
0.1
1.0
10.0
100.0
10 100 1000 10000rows
Pla
n C
ost
Bookmark Lookup
Table Scan
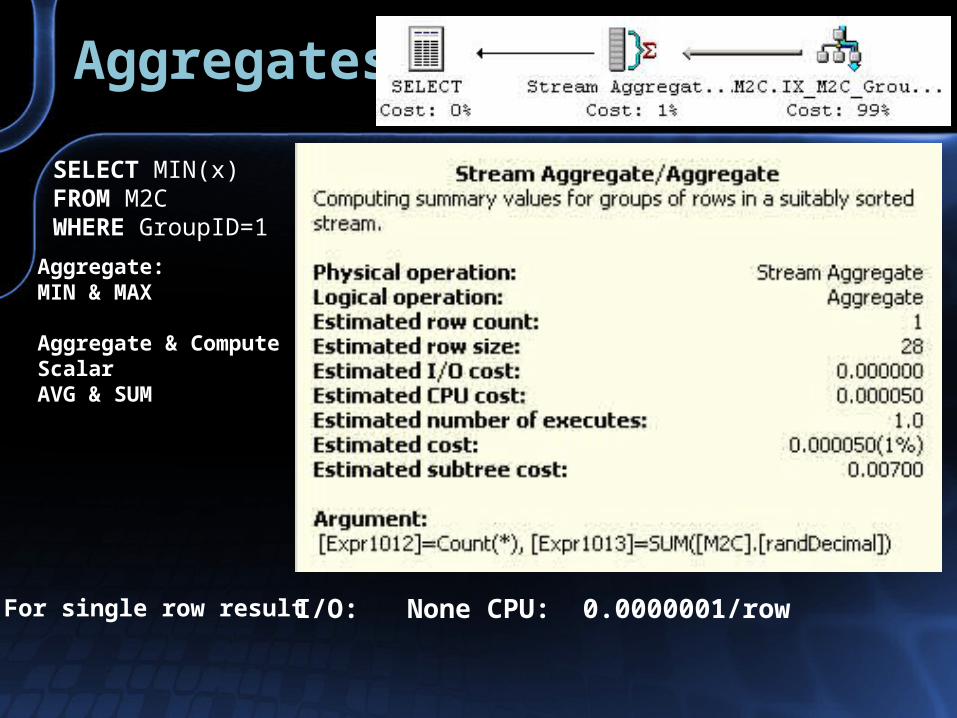
Aggregates
SELECT MIN(x) FROM M2C WHERE GroupID=1
I/O: None CPU: 0.0000001/row
Aggregate: MIN & MAX
Aggregate & Compute ScalarAVG & SUM
For single row result
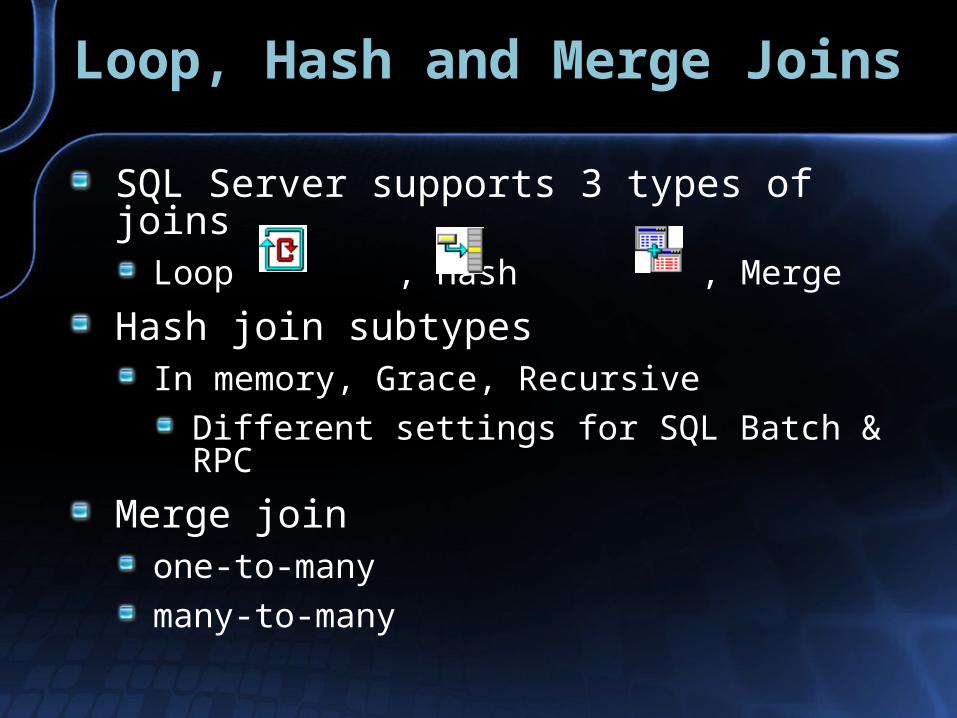
Loop, Hash and Merge Joins
SQL Server supports 3 types of joinsLoop , Hash , Merge
Hash join subtypesIn memory, Grace, Recursive
Different settings for SQL Batch & RPC
Merge join one-to-many
many-to-many
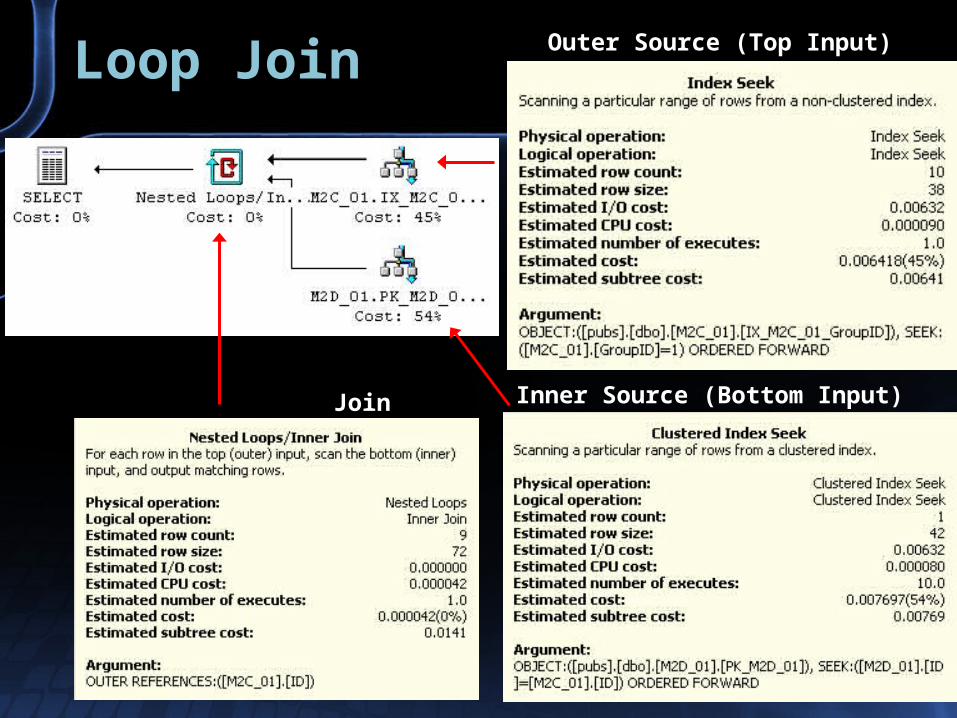
Loop Join Outer Source (Top Input)
Inner Source (Bottom Input)Join
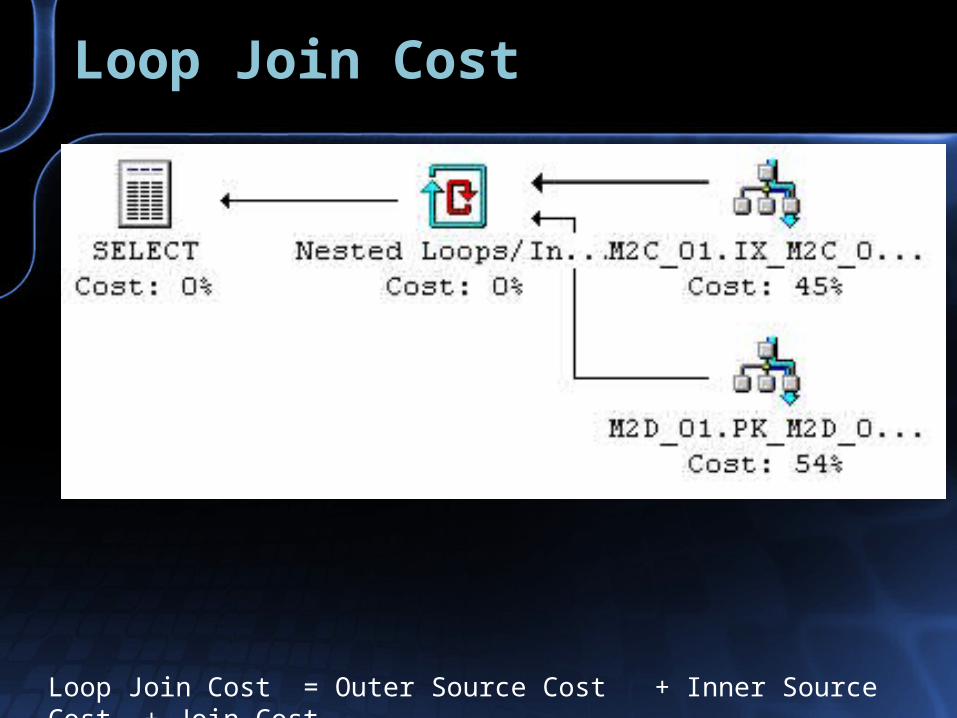
Loop Join Cost
Loop Join Cost = Outer Source Cost + Inner Source Cost + Join Cost
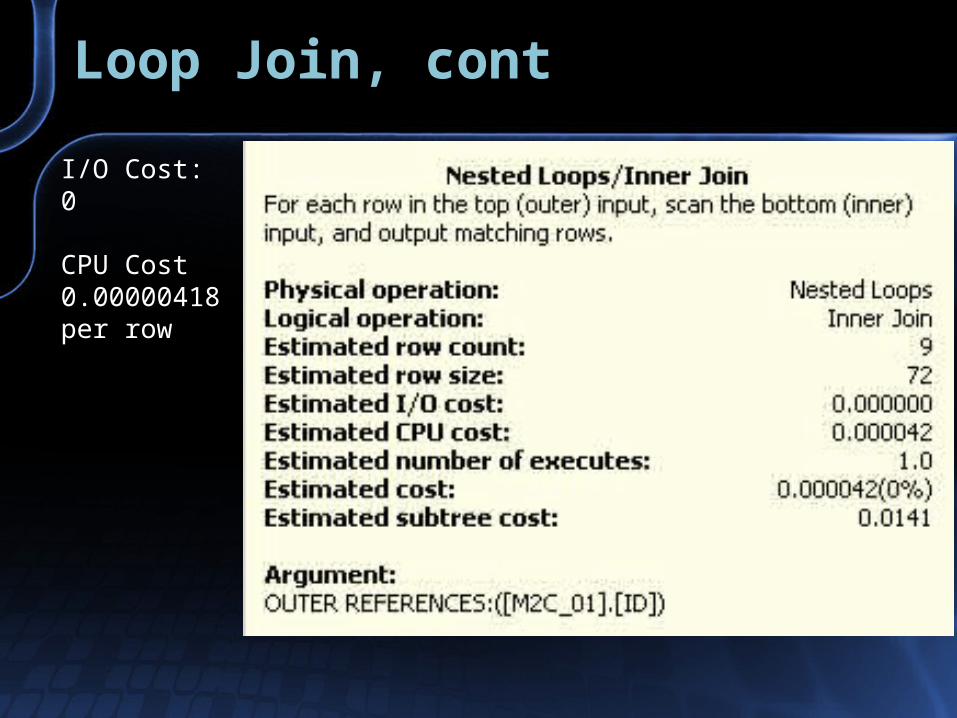
Loop Join, cont
I/O Cost: 0
CPU Cost0.00000418per row
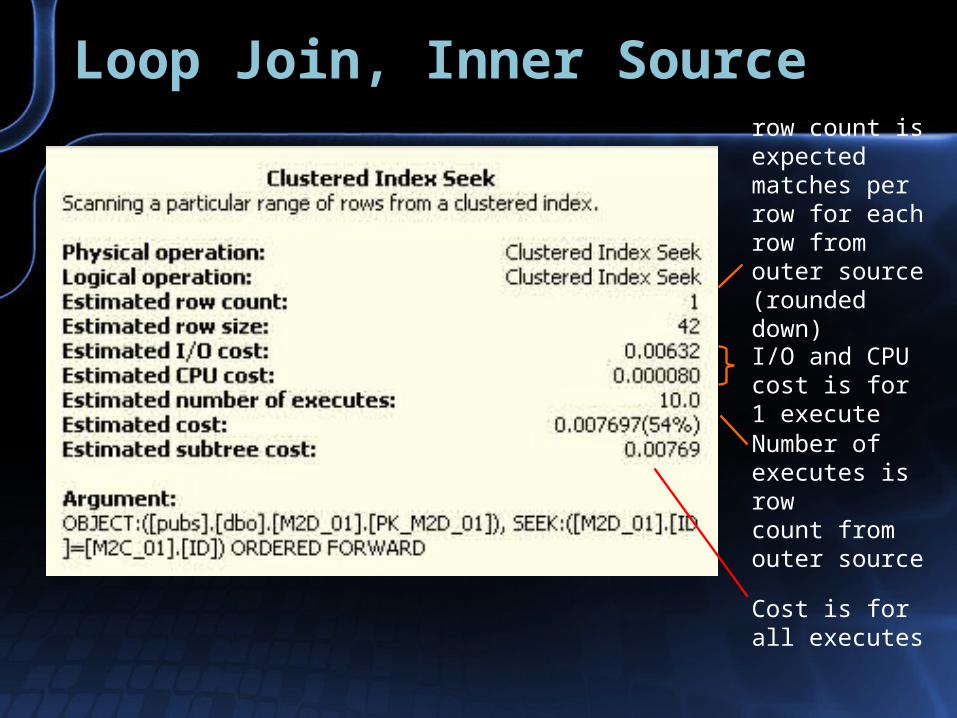
Loop Join, Inner Source
I/O and CPU cost is for 1 execute
Cost is for all executes
Number of executes is row count from outer source
row count is expected matches per row for each row from outer source (rounded down)
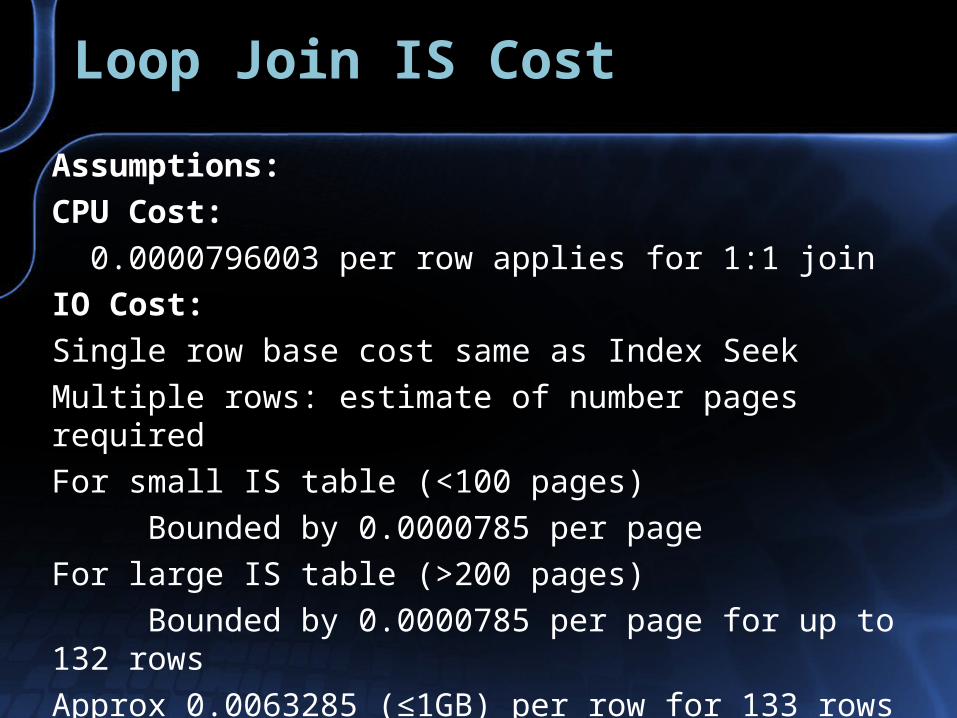
Loop Join IS Cost
Assumptions:
CPU Cost:
0.0000796003 per row applies for 1:1 join
IO Cost:
Single row base cost same as Index Seek
Multiple rows: estimate of number pages required
For small IS table (<100 pages)
Bounded by 0.0000785 per page
For large IS table (>200 pages)
Bounded by 0.0000785 per page for up to 132 rows
Approx 0.0063285 (≤1GB) per row for 133 rows and above
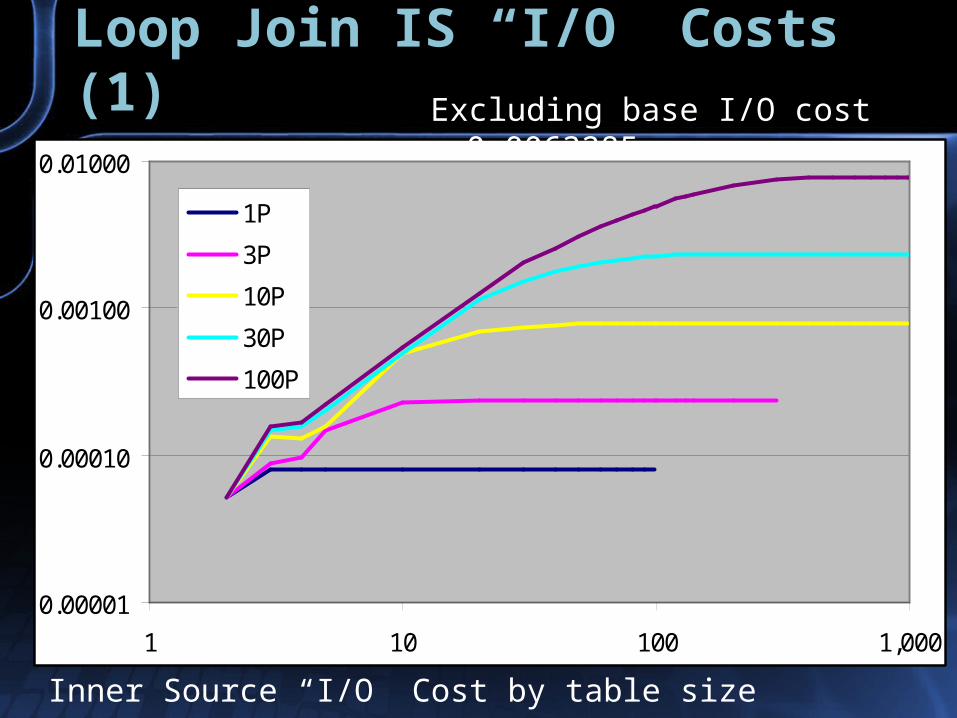
Loop Join IS “I/O” Costs (1)
Inner Source “I/O” Cost by table size versus rows
0.00001
0.00010
0.00100
0.01000
1 10 100 1,000
1P
3P
10P
30P
100P
Excluding base I/O cost 0.0063285
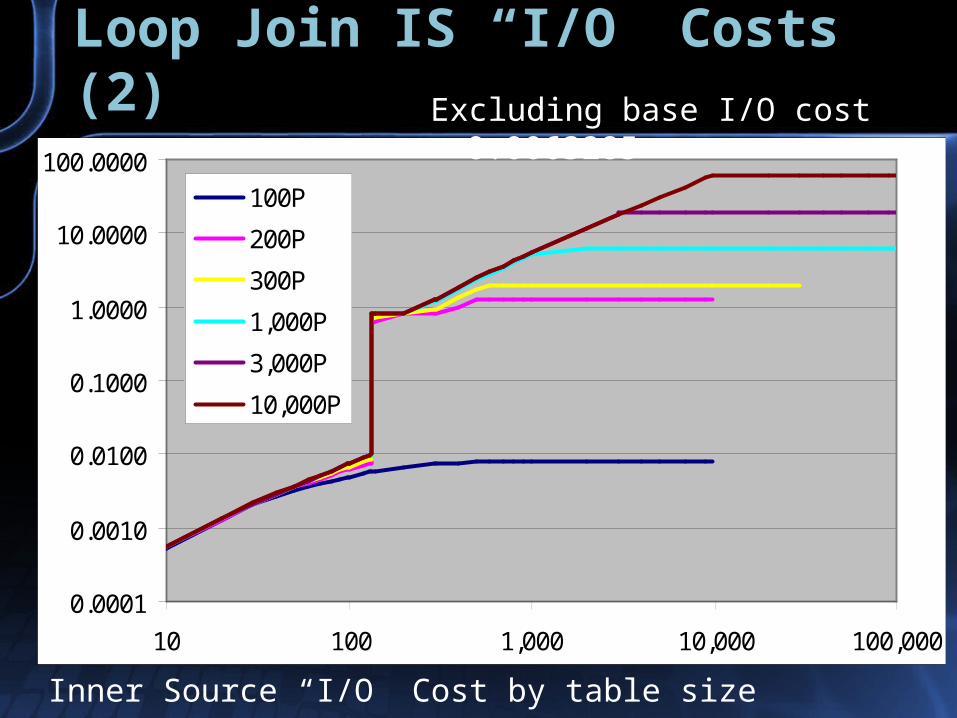
Loop Join IS “I/O” Costs (2)
Inner Source “I/O” Cost by table size versus rows
0.0001
0.0010
0.0100
0.1000
1.0000
10.0000
100.0000
10 100 1,000 10,000 100,000
100P
200P
300P
1,000P
3,000P
10,000P
Excluding base I/O cost 0.0063285
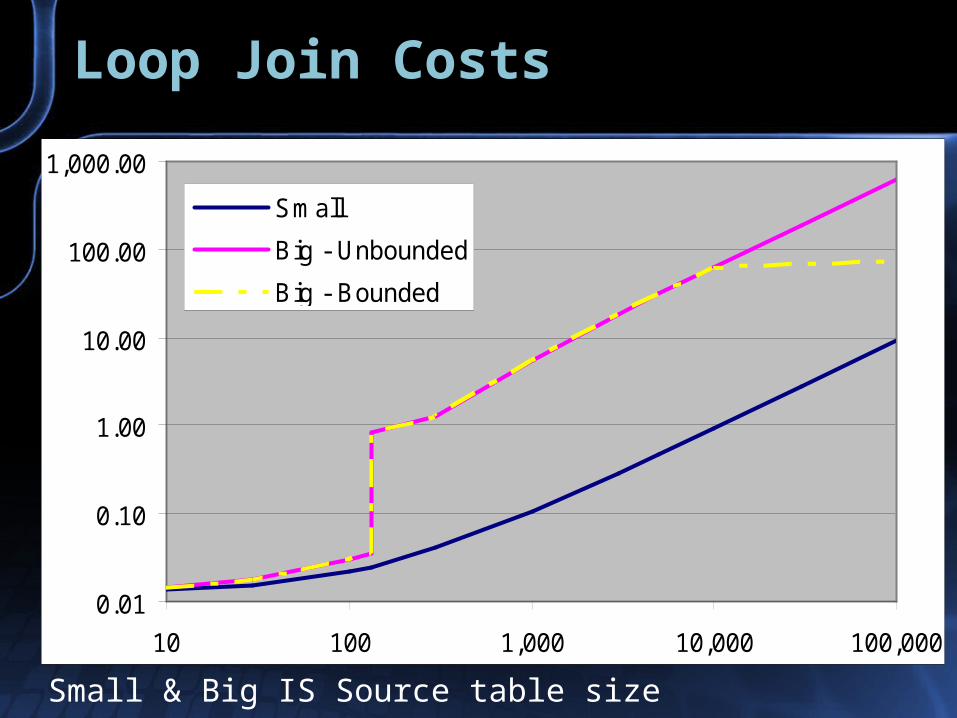
Loop Join Costs
Small & Big IS Source table size
0.01
0.10
1.00
10.00
100.00
1,000.00
10 100 1,000 10,000 100,000
Small
Big - Unbounded
Big - Bounded

Hash Join
Hash Join Cost = Outer Source + Inner Source + Hash Match
SELECT * FROM M2C m INNER HASH JOIN M2D n ON n.ID = m.ID WHERE m.GroupID = @Group1 AND n.GroupID = @Group2
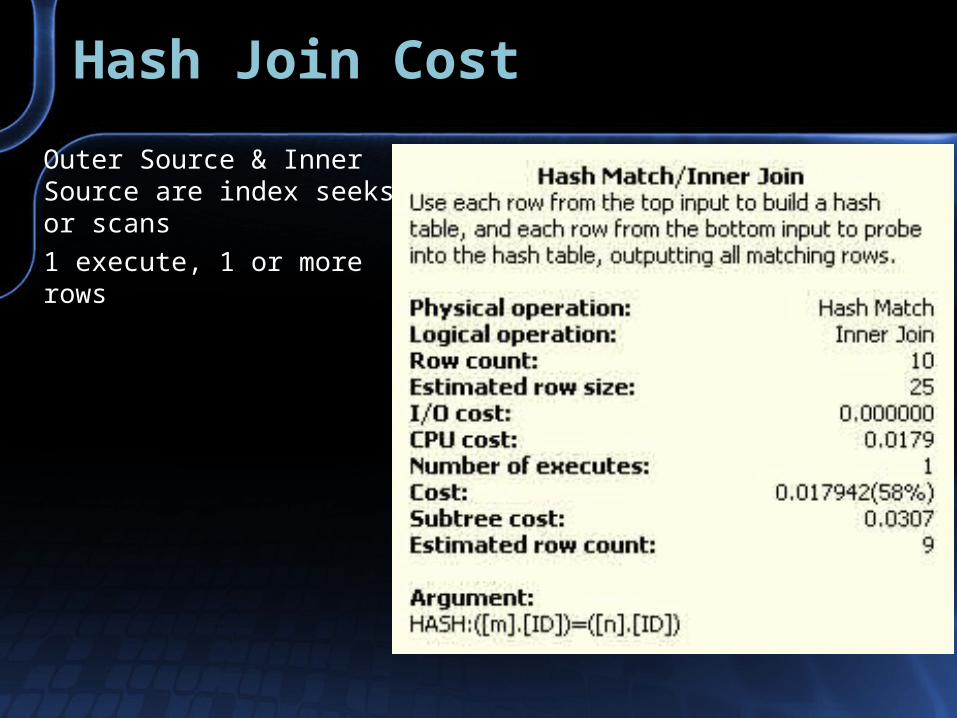
Hash Join Cost
Outer Source & Inner Source are index seeks or scans
1 execute, 1 or more rows

Hash Join - IS
Hash join cost independent of IS column count or size
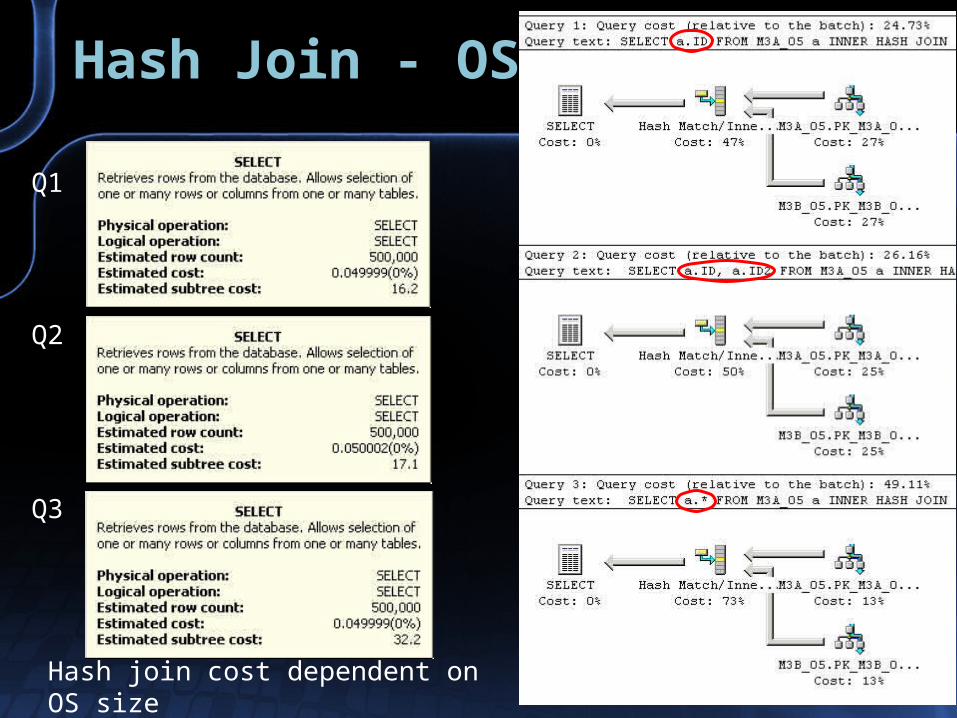
Hash Join - OS
Hash join cost dependent on OS size
Q1
Q2
Q3
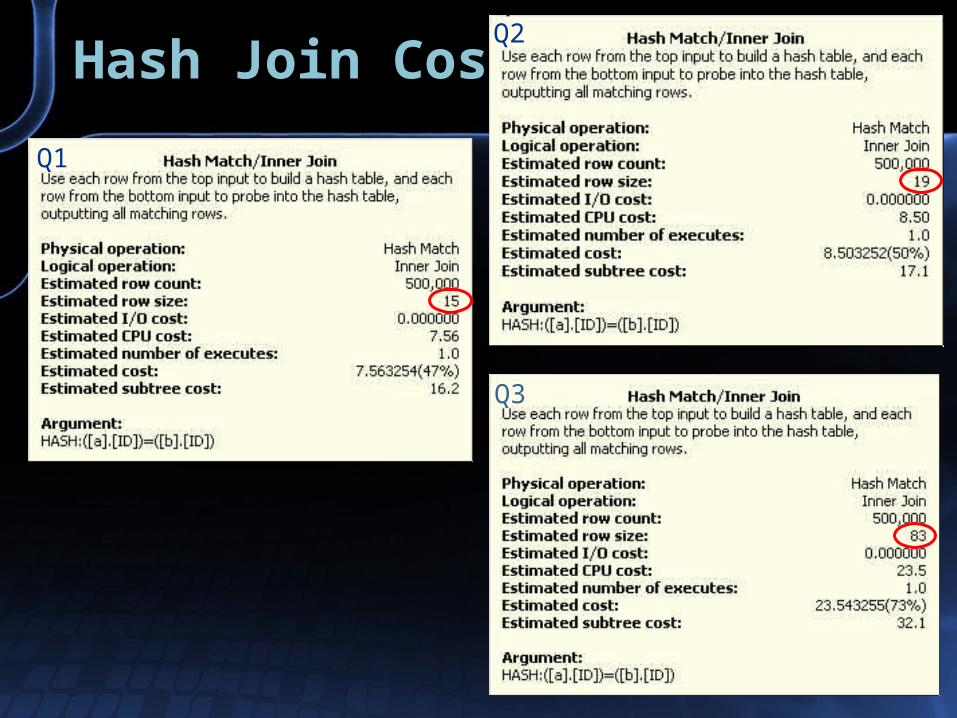
Hash Join Cost
Q1
Q2
Q3
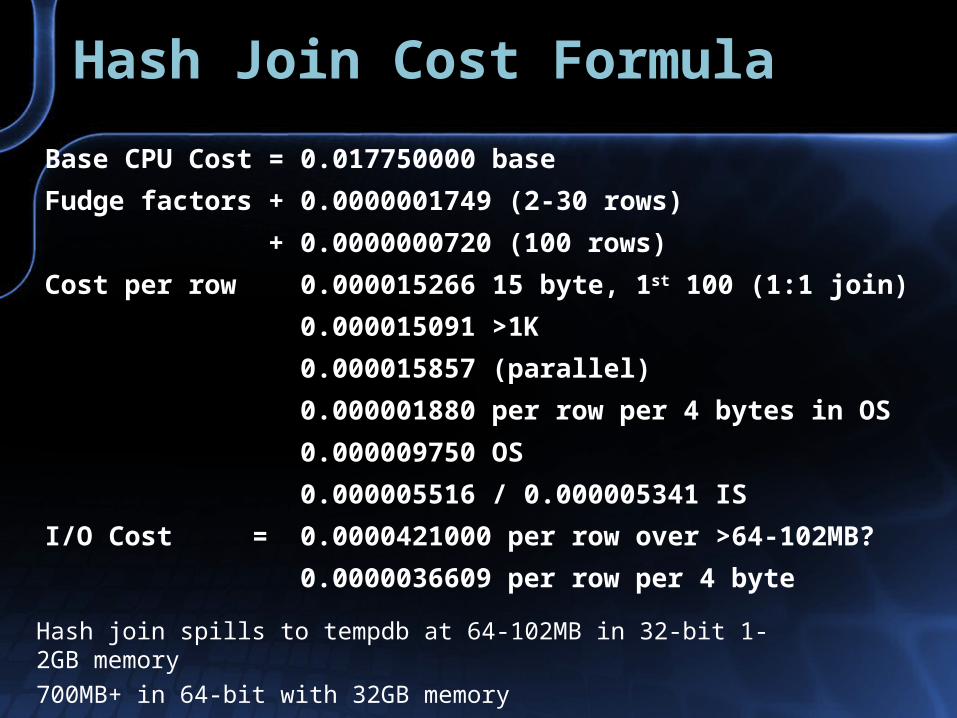
Hash Join Cost Formula
Base CPU Cost = 0.017750000 base
Fudge factors + 0.0000001749 (2-30 rows)
+ 0.0000000720 (100 rows)
Cost per row 0.000015266 15 byte, 1st 100 (1:1 join)
0.000015091 >1K
0.000015857 (parallel)
0.000001880 per row per 4 bytes in OS
0.000009750 OS
0.000005516 / 0.000005341 IS
I/O Cost = 0.0000421000 per row over >64-102MB?
0.0000036609 per row per 4 byte
Hash join spills to tempdb at 64-102MB in 32-bit 1-2GB memory
700MB+ in 64-bit with 32GB memory
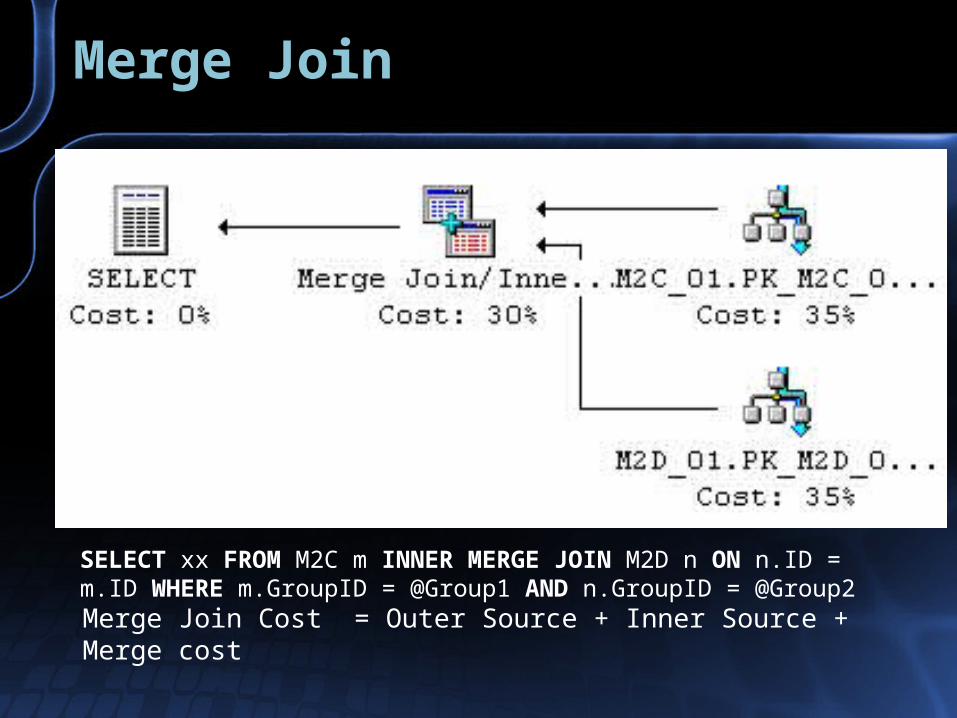
Merge Join
Merge Join Cost = Outer Source + Inner Source + Merge cost
SELECT xx FROM M2C m INNER MERGE JOIN M2D n ON n.ID = m.ID WHERE m.GroupID = @Group1 AND n.GroupID = @Group2
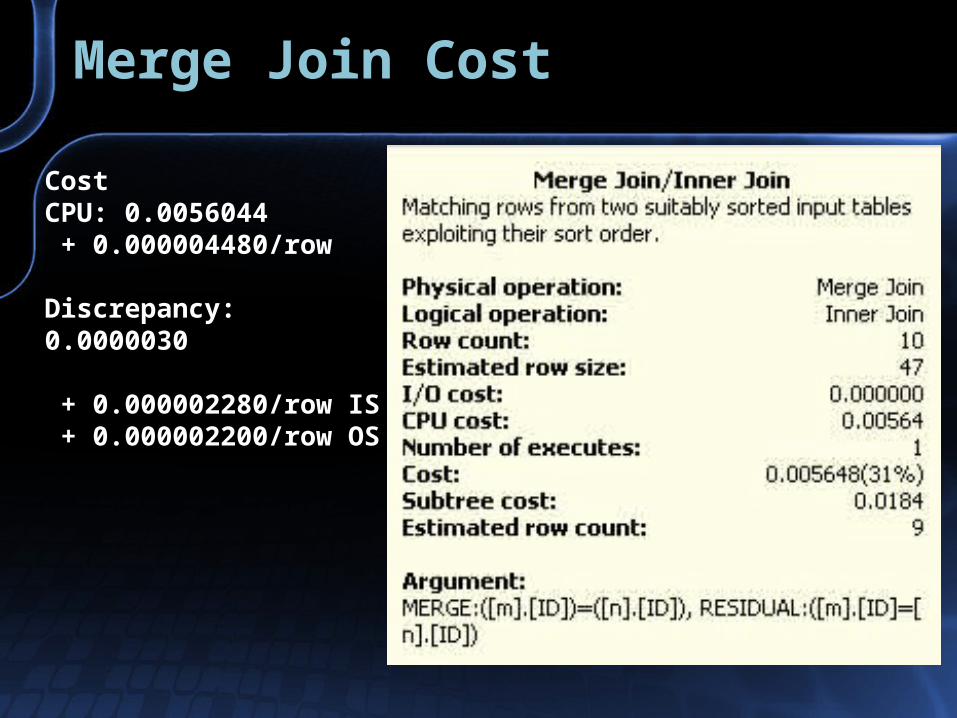
Merge Join Cost
Cost CPU: 0.0056044 + 0.000004480/row
Discrepancy: 0.0000030
+ 0.000002280/row IS + 0.000002200/row OS
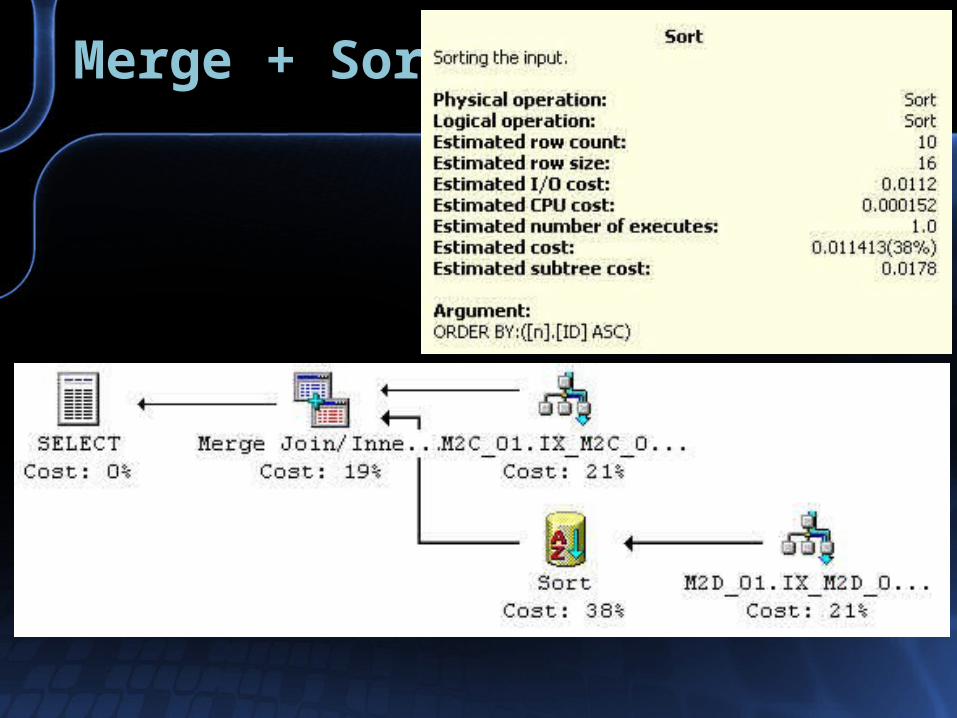
Merge + Sort
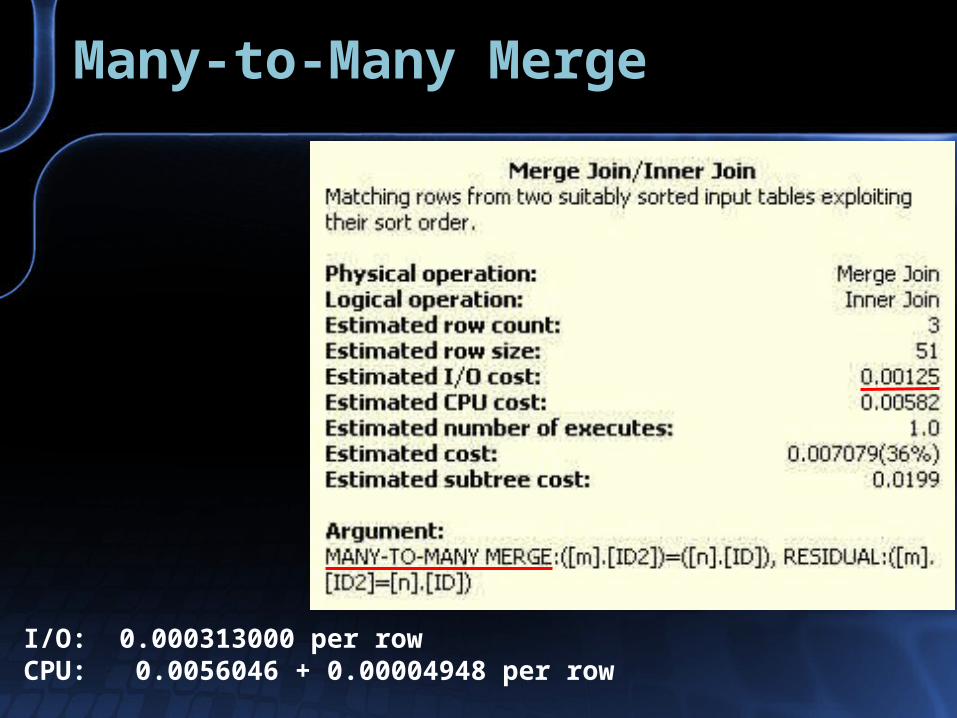
Many-to-Many Merge
I/O: 0.000313000 per rowCPU: 0.0056046 + 0.00004948 per row
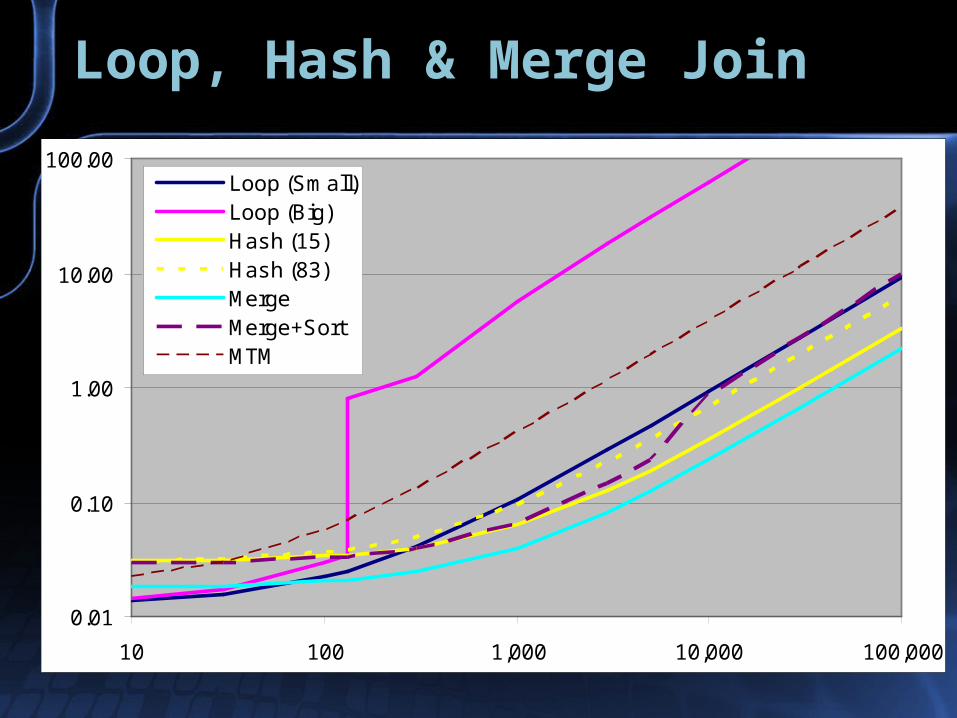
Loop, Hash & Merge Join
0.01
0.10
1.00
10.00
100.00
10 100 1,000 10,000 100,000
Loop (Small)Loop (Big)Hash (15)Hash (83)MergeMerge+SortMTM
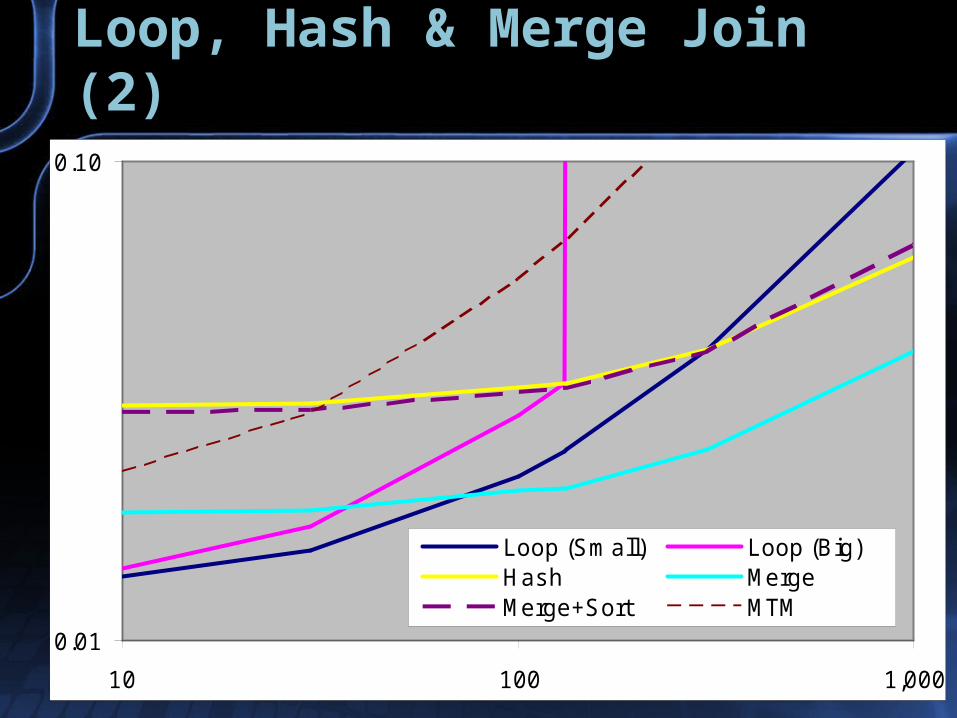
Loop, Hash & Merge Join (2)
0.01
0.10
10 100 1,000
Loop (Sm all) Loop (Big)Hash MergeMerge+Sort MTM
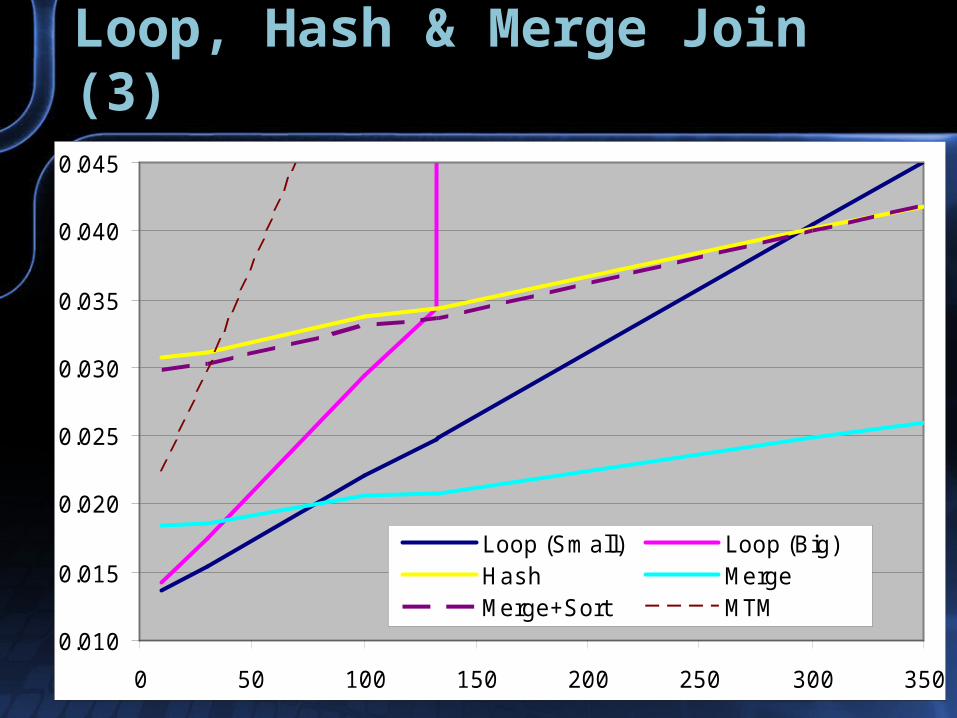
Loop, Hash & Merge Join (3)
0.010
0.015
0.020
0.025
0.030
0.035
0.040
0.045
0 50 100 150 200 250 300 350
Loop (Sm all) Loop (Big)Hash MergeMerge+Sort MTM
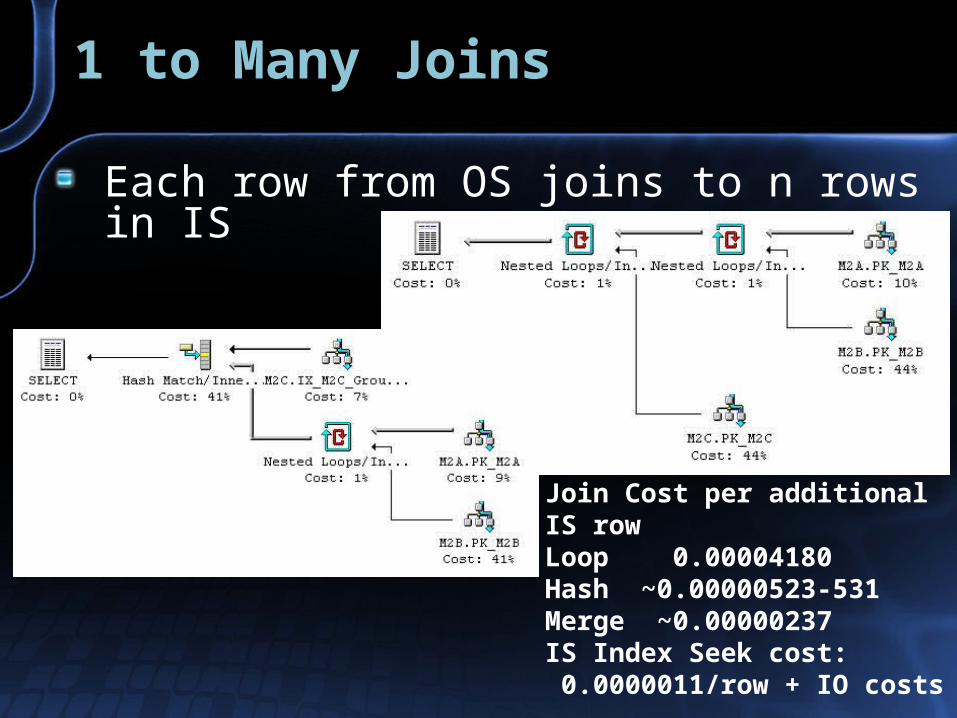
1 to Many Joins
Each row from OS joins to n rows in IS
Join Cost per additional IS rowLoop 0.00004180 Hash ~0.00000523-531 Merge ~0.00000237IS Index Seek cost: 0.0000011/row + IO costs
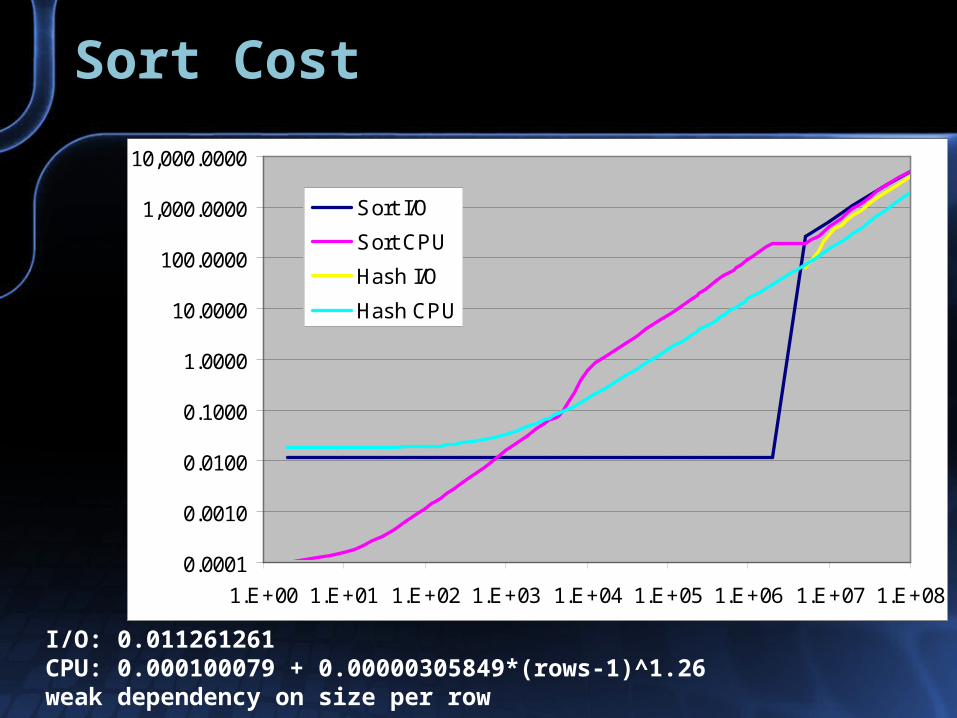
Sort Cost
I/O: 0.011261261CPU: 0.000100079 + 0.00000305849*(rows-1)^1.26weak dependency on size per row
0.0001
0.0010
0.0100
0.1000
1.0000
10.0000
100.0000
1,000.0000
10,000.0000
1.E+00 1.E+01 1.E+02 1.E+03 1.E+04 1.E+05 1.E+06 1.E+07 1.E+08
Sort I/O
Sort CPU
Hash I/O
Hash CPU
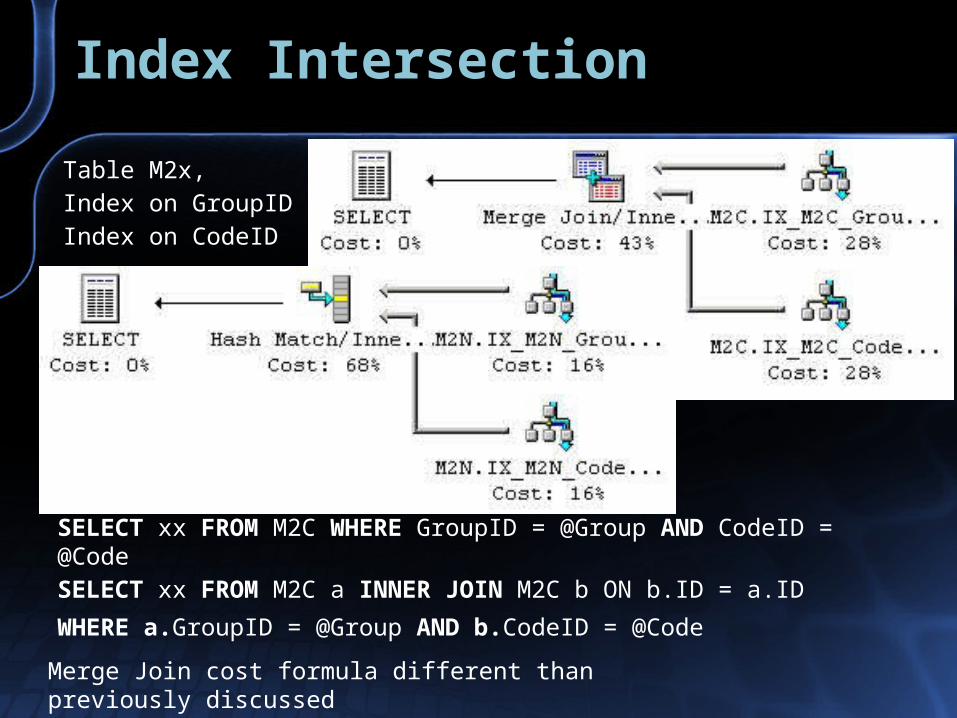
Index Intersection
SELECT xx FROM M2C WHERE GroupID = @Group AND CodeID = @Code
SELECT xx FROM M2C a INNER JOIN M2C b ON b.ID = a.ID
WHERE a.GroupID = @Group AND b.CodeID = @Code
Table M2x, Index on GroupID Index on CodeID
Merge Join cost formula different than previously discussed
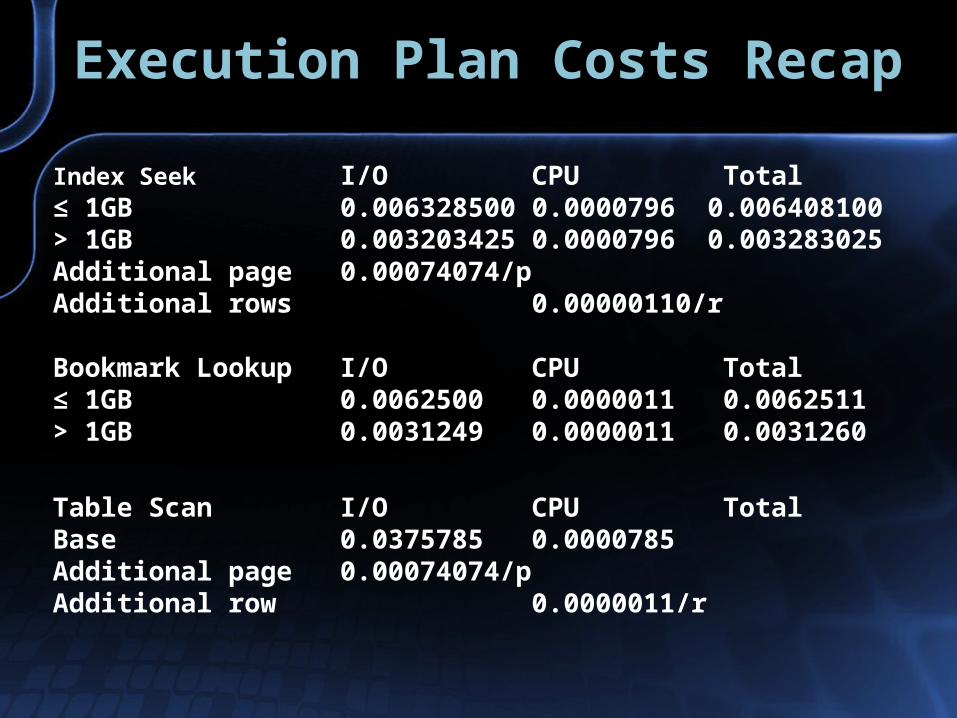
Execution Plan Costs Recap
Index Seek I/O CPU Total≤ 1GB 0.006328500 0.0000796 0.006408100> 1GB 0.003203425 0.0000796 0.003283025Additional page 0.00074074/pAdditional rows 0.00000110/r
Bookmark Lookup I/O CPU Total≤ 1GB 0.0062500 0.0000011 0.0062511> 1GB 0.0031249 0.0000011 0.0031260
Table Scan I/O CPU TotalBase 0.0375785 0.0000785Additional page 0.00074074/p Additional row 0.0000011/r
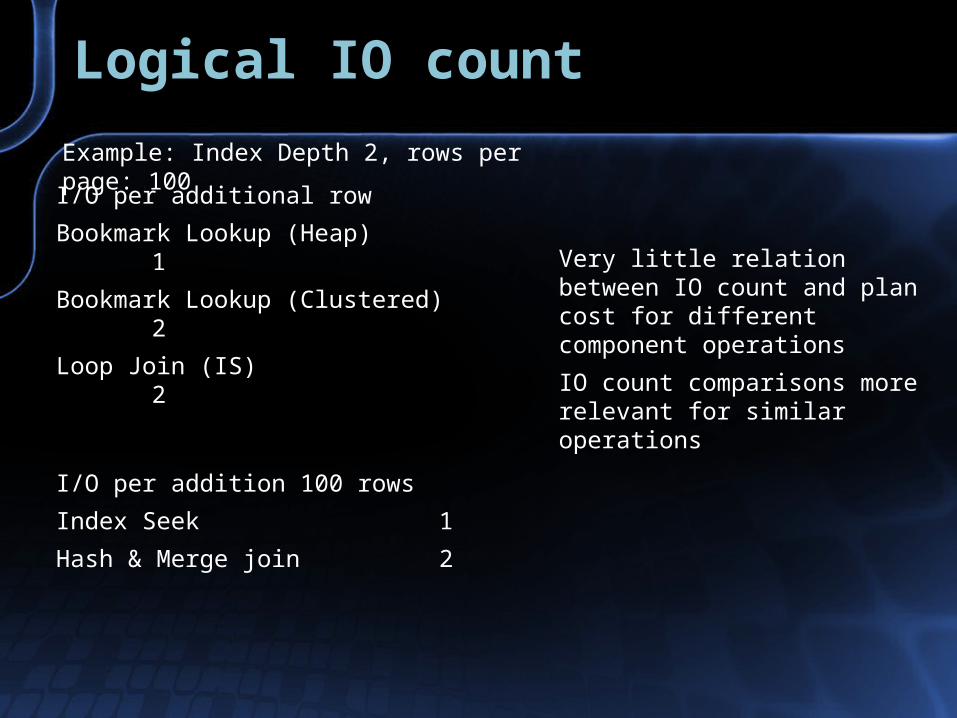
Logical IO count
Example: Index Depth 2, rows per page: 100
I/O per additional row
Bookmark Lookup (Heap) 1
Bookmark Lookup (Clustered) 2
Loop Join (IS) 2
I/O per addition 100 rows
Index Seek 1
Hash & Merge join 2
Very little relation between IO count and plan cost for different component operations
IO count comparisons more relevant for similar operations
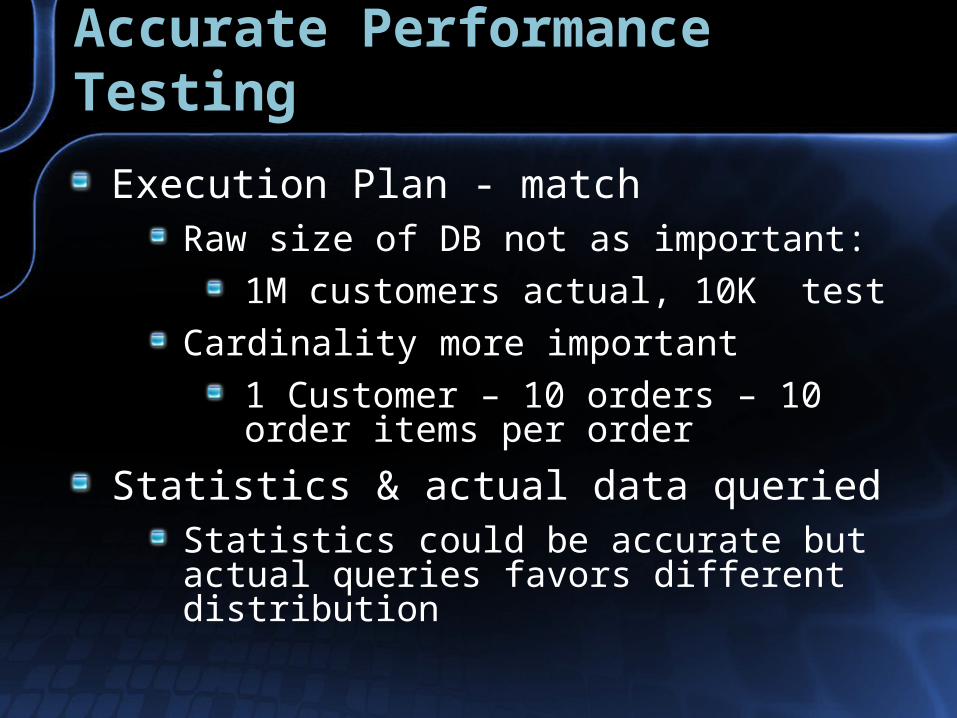
Accurate Performance Testing
Execution Plan - matchRaw size of DB not as important:
1M customers actual, 10K test
Cardinality more important
1 Customer – 10 orders – 10 order items per order
Statistics & actual data queriedStatistics could be accurate but actual queries favors different distribution
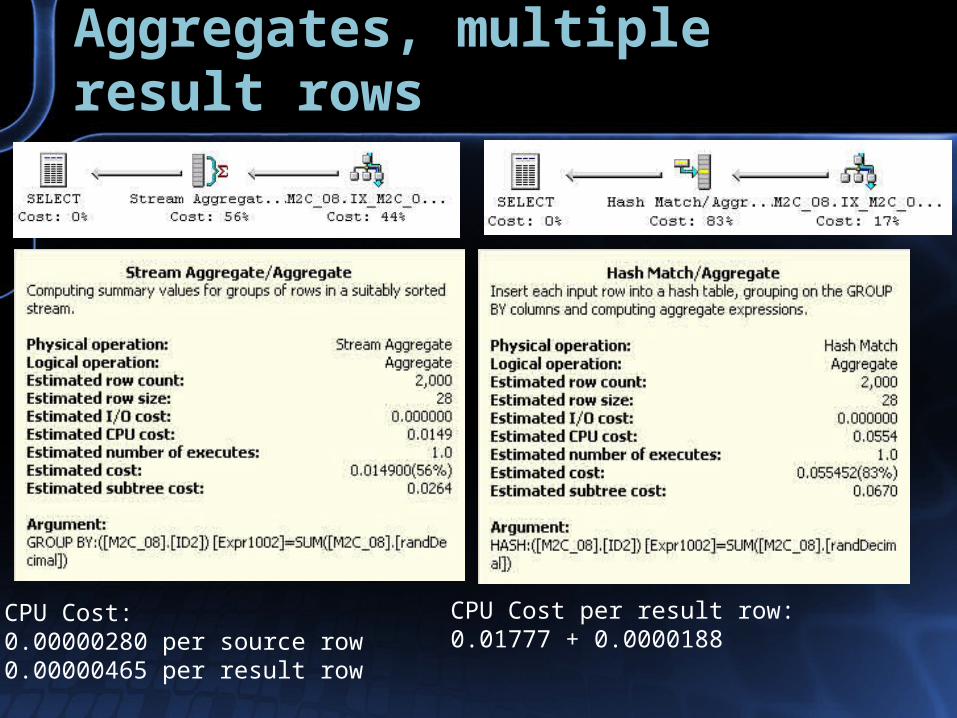
Aggregates, multiple result rows
CPU Cost: 0.00000280 per source row0.00000465 per result row
CPU Cost per result row: 0.01777 + 0.0000188
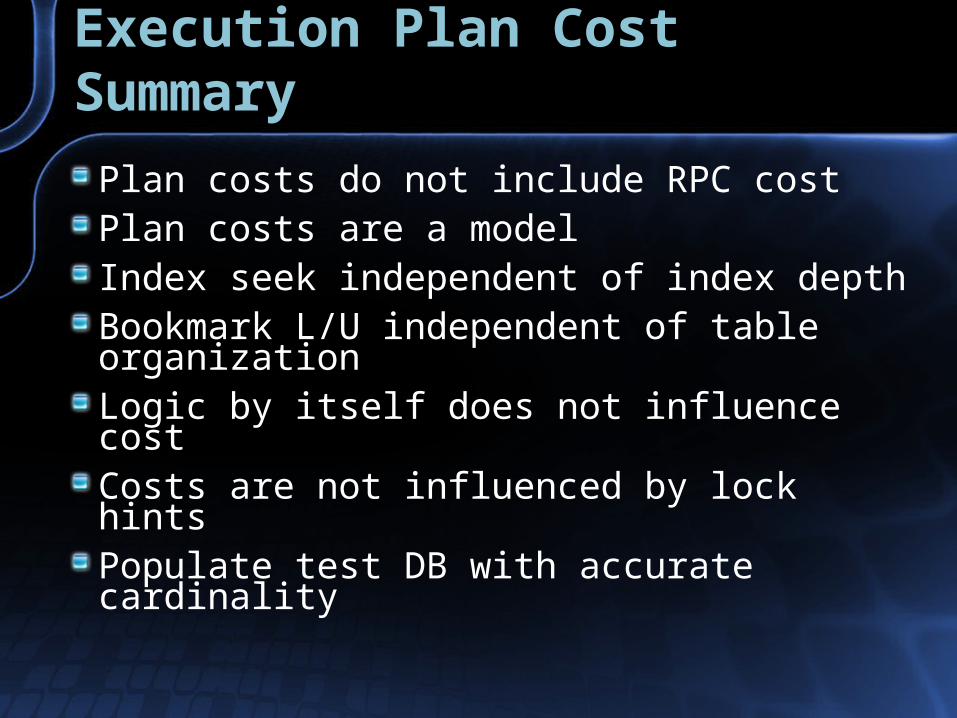
Execution Plan Cost Summary
Plan costs do not include RPC costPlan costs are a modelIndex seek independent of index depthBookmark L/U independent of table organizationLogic by itself does not influence costCosts are not influenced by lock hintsPopulate test DB with accurate cardinality
Additional Information
www.sql-server-performance.com/joe_chang.asp
SQL Server Quantitative Performance AnalysisSQL Server Quantitative Performance AnalysisServer System ArchitectureServer System ArchitectureProcessor PerformanceProcessor PerformanceDirect Connect Gigabit NetworkingDirect Connect Gigabit NetworkingParallel Execution PlansParallel Execution PlansLarge Data OperationsLarge Data OperationsTransferring StatisticsTransferring StatisticsSQL Server Backup Performance with Imceda LiteSpeedSQL Server Backup Performance with Imceda LiteSpeed