Embed Size (px)
Citation preview
ASIA-PACIFIC FORESTRY SECTOR OUTLOOK STUDY II
WORKING PAPER SERIES
Working Paper No. APFSOS II/WP/2009/29
SRI LANKA FORESTRY OUTLOOK STUDY
by
Forest Department Government of Sri Lanka
FOOD AND AGRICULTURE ORGANIZATION OF THE UNITED NATIONS REGIONAL OFFICE FOR ASIA AND THE PACIFIC
Bangkok, 2009
APFSOS II: Sri Lanka
ii
Contents
1. INTRODUCTION 1 Background 1 The scope of the study and the coverage 1 Key questions 2 The process 2 The structure of the report 2 2. CURRENT STATUS OF FORESTS AND FORESTRY IN THE COUNTRY 4 Forests and other tree resources in relation to the other land uses 4 The forest estate and other tree resources 4 Wood and wood products 16 Wood as a source of energy 21 Non-wood forest products 24 The service functions of forests 26 The state institutions and policy 29 Trends in forest resources 32 Key issues and an overview of overall state of forests and forestry 34 3. FACTORS INFLUENCING THE FUTURE STATE OF FORESTS
AND FORESTRY 36 Demographic changes 36 The political and institutional environment 37 Economic changes 39 Future energy demand and its implication on forests 45 Impact of globalization and regional and sub-regional integration 45 Technological changes within and outside the forestry sector 46 Environmental issues and policies and their impact on the forestry sector 46 Summary of key factors that are likely to impact forests in the next 20 years 47 4. PROBABLE SCENARIOS AND THEIR IMPLICATIONS 49 Rational for scenario definition 49 Important elements (parameters) for scenario definition and uncertainties 49 The business as usual scenario 50 Alternative scenarios and probable shifts 51 The most likely situation 52 5. THE POSSIBLE SITUATION IN 2020 54 Forest resources in the future 54 Wood and wood products 55 Wood as a source for energy 55 Future of non-wood forest products 57 Service functions of forests 57 Social functions of forests 58 An overview of the future of forests and forestry in 2020 58 6. HOW COULD WE CREATE A BETTER FUTURE? 60 7. SUMMARY AND CONCLUSIONS 61 8. ANNEXES 62
APFSOS II: Sri Lanka
iii
INFORMATION NOTE ON THE ASIA-PACIFIC FORESTRY SECTOR OUTLOOK STUDY
The Asia-Pacific Forestry Sector Outlook Study (APFSOS) is a wide-ranging initiative to gather information on, and examine, the evolution of key forestry issues as well as to review important trends in forests and forestry. The main purpose of the study is to provide a better understanding of the changing relationships between society and forests and thus to facilitate timely policy reviews and reforms in national forest sectors. The specific objectives are to:
1. Identify emerging socio-economic changes impacting on forest and forestry 2. Analyze probable scenarios for forestry developments to 2020 3. Identify priorities and strategies to address emerging opportunities and challenges
The first APFSOS was completed in 1998, with an outlook horizon to 2010. During its twenty-first session, held in Dehradun, India, in April 2006, the Asia-Pacific Forestry Commission (APFC) resolved to update the outlook extending the horizon to 2020. The study commenced in October 2006 and is expected to be completed by September 2009. The study has been coordinated by the Food and Agriculture Organization of the United Nations (FAO), through its regional office in Bangkok and its headquarters in Rome, and implemented in close partnership with APFC member countries with support from a number of international and regional agencies. The Asian Development Bank (ADB), the International Tropical Timber Organization (ITTO), and the United Kingdom’s Department for International Development (DFID) provided substantial financial support to implement the study. Partnerships with the Asia-Pacific Association of Forest Research Institutes (APAFRI) and the Secretariat of the Pacific Community (SPC) supported the organizing and implementing of national focal points’ workshops and other activities, which have been crucial to the success of this initiative. The contributions of many other individuals and institutions are gratefully acknowledged in the main APFSOS report. Working papers have been contributed or commissioned on a wide range of topics. These fall under the following categories: country profiles, sub-regional studies and thematic studies. Working papers have been prepared by individual authors or groups of authors and represent their personal views and perspectives; therefore, opinions expressed do not necessarily reflect the views of their employers, the governments of the APFC member countries or of FAO. Material from these working papers has been extracted and combined with information from a wide range of additional sources to produce the main regional outlook report. Working papers are moderately edited for style and clarity and are formatted to provide a measure of uniformity, but otherwise remain the work of the authors. Copies of these working papers, as well as more information on the Asia-Pacific Forestry Sector Study, can be obtained from: Mr. Patrick Durst Senior Forestry Officer FAO Regional Office for Asia and the Pacific 39 Phra Atit Road Bangkok 10200 THAILAND Ph. (66-2) 697 4000 Fax: (66-2) 697 4445 Email: [email protected]
APFSOS II: Sri Lanka
1
1. INTRODUCTION Background This study was undertaken within the framework of the Asia-Pacific Forestry Sector Outlook Study implemented under the auspices of the Food and Agriculture Organization of the United Nations. The study commenced with a consultative meeting of the national focal points of the member countries in the Asian and Pacific region held in Thailand during the early part of 2007. The preparation of this paper was undertaken in-country following the guidelines agreed upon during the consultative meeting. The island of Sri Lanka is located at 6055’northern latitude and 79052’eastern longitude and covers an area of 65,610 km2 including inland water bodies. The country has a tropical climate characterized by two major monsoon periods; the southwest monsoon from May to September and the northeast monsoon from December to February. The total dense and open forest cover of the island (excluding forest plantations and other forms of vegetation) was estimated at 19,422 km2 in 1996,1 accounting for 29.6% of the total land area of the country. In addition to the natural forests and the forest plantations, a wide range of non-forest tree resources are available in the form of home gardens, rubber, coconut and tea plantations. A conservative estimate made in 19952 on the contribution of the forestry sector to the national economy of Sri Lanka stood at 6%, mainly from the production of timber, sawn wood and firewood. In addition, the national forests provide other benefits to the nation through their high floral and faunal biodiversity, conservation of soil and water that leads to a positive impact on agricultural production and high aesthetic value which has contributed to the development of ecotourism in recent times. Therefore an outlook study forecasting the development of the forestry sector during the next decade is a significant exercise and would be beneficial for the strategic planners, policy makers and to all those who are involved with forestry development in the country. The scope of the study and the coverage This study covers mainly the forest resources owned, managed and protected by two government entities: the Forest Department (FD), empowered by the Forest Ordinance, and the Department of Wildlife Conservation (DWLC), empowered by the Fauna and Flora Protection Ordinance. Forest resources owned by other sources are minute and negligible. The total land area under the jurisdiction of the FD is roughly estimated at 12,708 km2, thus making it 19.4% of the total area of the island. The DWLC has responsibility of over 6,714 km2 of protected areas, or 10.2% of the total land area. Therefore forest lands managed by the DWLC3 are vital to the study, especially in forest cover estimations at the national level and forecasting its future changes. During the estimation of the productive potential or capacity of forests as sources for timber and wood energy, non-wood forest products (NWFPs) or the contribution to national economy other than the income gained by ecotourism, the forest lands managed by the DWLC were excluded, as its mission and management objectives differ from those undertaken by the FD. The demand for wood and wood products is met from a number of sources including home gardens, tea, rubber and coconut plantations and private woodlot owners. Thus the scope of
1 Source: Forest Department Manual, 2008. 2 Source: Forestry Sector Master Plan, 1995, Colombo. 3 Wildlife conservation areas within the purview of the DWLC are classified as National Parks (18), Sanctuaries (56), Strict Nature Reserves (3), Nature Reserves (7)and Jungle corridors (3 proposed).
APFSOS II: Sri Lanka
2
this study includes the role of these contributors to the wood and energy sectors by analyzing their present status and forecasting their possible contribution till the end of the next decade. This study also includes the aspects of possible institutional development pertaining to the forestry sector in the future. During the last few decades, the institutional infrastructure of the forestry administration has been expanded and decentralization of the administration up to a certain degree has taken place. Participatory approaches in forestry development have been a significant feature during the recent past. Forestry operations such as afforestation, conservation and protection have pronounced components of community participation to varying degrees. The potential for the sustainability of this favourable trend falls within the scope of this study. Key questions Forecasting forest development to the end of the next decade would lead to the following complex questions:
• Will forest cover decline, remain stable or improve in the future in view of the larger political, policy and socio-economic changes?
• What is the future of forest management? Will it be based on the principles of ‘sustainability’ in respect to timber production and providing other services? This must be examined and forecasted based on the present and planned practices
• What will be the future demand for wood in the country? Will there be a significant increase in demand for timber and fuelwood based on the changing demographic and socio-economic situations? This complex issue has many interwoven factors
• What will be the main sources for wood in the future and how much will local non-forest tree resources and wood imports be depended upon?
• In the overall energy sector of Sri Lanka, how much will wood fuel contribute? Will the demand be steadily rising or replaced by alternatives?
• What is the role of the forestry sector in the provision of environmental services? Can such benefits be quantified? What are the present measures undertaken in this direction and do they suffice to reach the goal?
The process Preparation of the report was undertaken by a forestry consultant in collaboration with a team of specialists in forestry and related fields under the supervision of the national coordinator. Many consultations and discussions were held with the stakeholders of the forestry development process including representatives of community-based organizations (CBOs). Among the consulted government institutions were the DWLC, the Survey Department Timber Corporation, Sri Lanka Customs and the Central Environmental Authority. The draft paper was reviewed by a group of forestry professionals and necessary amendments were made. The structure of the report This report consists of seven main sections. Section 1 provides an introduction with information on the scope of the study, key issues and questions and the study process. Section 2 gives the status of forests apropos land use, changing forest cover, growing stock, the importance of other tree resources, share of wood supply of different origin, the role of biomass in the energy balance, alternative energy sources, forests as protected areas and the institutional arrangements and stakeholders. Section 3 describes the factors influencing forest and tree resources and the current trends. The sustainability of forest and tree resources is

APFSOS II: Sri Lanka
3
influenced by many external (social, demographic and political) factors and internal (institutional) factors and the effects of such factors are discussed in this group. Section 4 offers a scenario analysis to identify the possible status of forestry towards the end of the next decade. Important parameters for scenario definition and the most possible scenario have been identified. Section 5 describes the most likely situation of forest resources towards the end of the next decade. This includes the requirement for wood and wood products, demand for biofuel and sources, status of forest management and social and other service functions of forests. Section 6 discusses the necessities for a better future for the forestry sector. Section 7 summarizes the contents of the paper.
APFSOS II: Sri Lanka
4
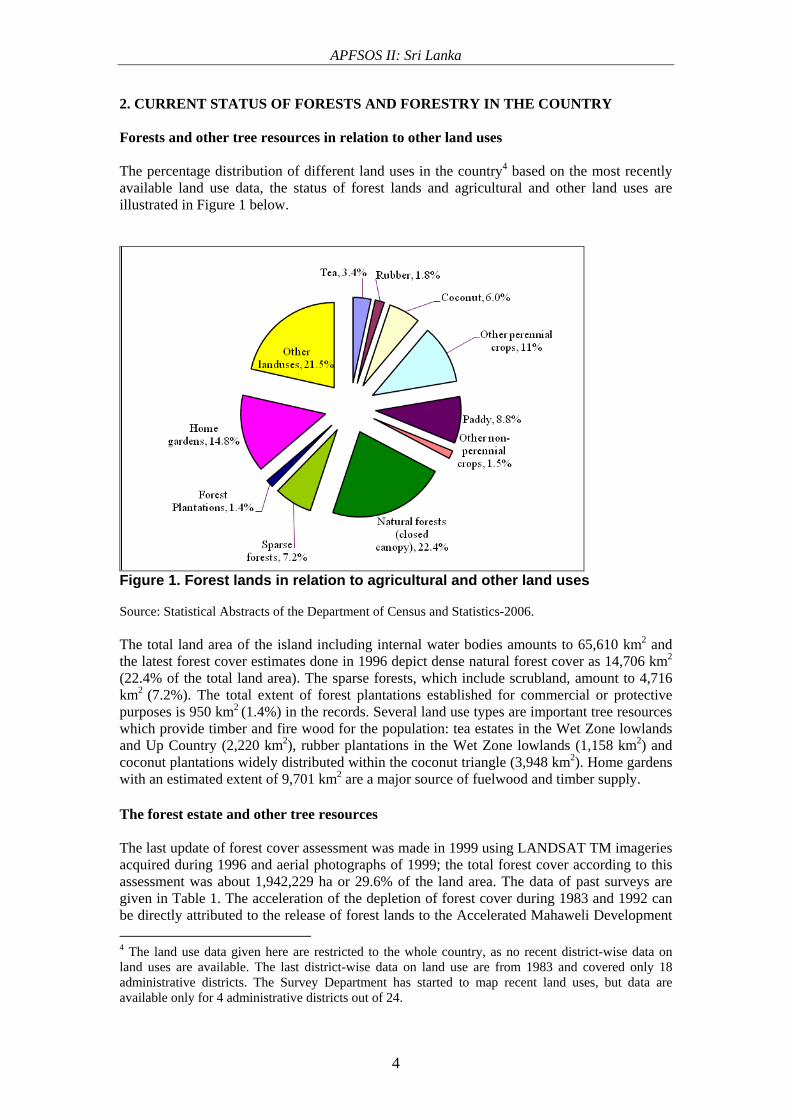
2. CURRENT STATUS OF FORESTS AND FORESTRY IN THE COUNTRY Forests and other tree resources in relation to other land uses The percentage distribution of different land uses in the country4 based on the most recently available land use data, the status of forest lands and agricultural and other land uses are illustrated in Figure 1 below.
Figure 1. Forest lands in relation to agricultural and other land uses Source: Statistical Abstracts of the Department of Census and Statistics-2006. The total land area of the island including internal water bodies amounts to 65,610 km2 and the latest forest cover estimates done in 1996 depict dense natural forest cover as 14,706 km2
(22.4% of the total land area). The sparse forests, which include scrubland, amount to 4,716 km2 (7.2%). The total extent of forest plantations established for commercial or protective purposes is 950 km2 (1.4%) in the records. Several land use types are important tree resources which provide timber and fire wood for the population: tea estates in the Wet Zone lowlands and Up Country (2,220 km2), rubber plantations in the Wet Zone lowlands (1,158 km2) and coconut plantations widely distributed within the coconut triangle (3,948 km2). Home gardens with an estimated extent of 9,701 km2 are a major source of fuelwood and timber supply. The forest estate and other tree resources The last update of forest cover assessment was made in 1999 using LANDSAT TM imageries acquired during 1996 and aerial photographs of 1999; the total forest cover according to this assessment was about 1,942,229 ha or 29.6% of the land area. The data of past surveys are given in Table 1. The acceleration of the depletion of forest cover during 1983 and 1992 can be directly attributed to the release of forest lands to the Accelerated Mahaweli Development 4 The land use data given here are restricted to the whole country, as no recent district-wise data on land uses are available. The last district-wise data on land use are from 1983 and covered only 18 administrative districts. The Survey Department has started to map recent land uses, but data are available only for 4 administrative districts out of 24.
APFSOS II: Sri Lanka
5
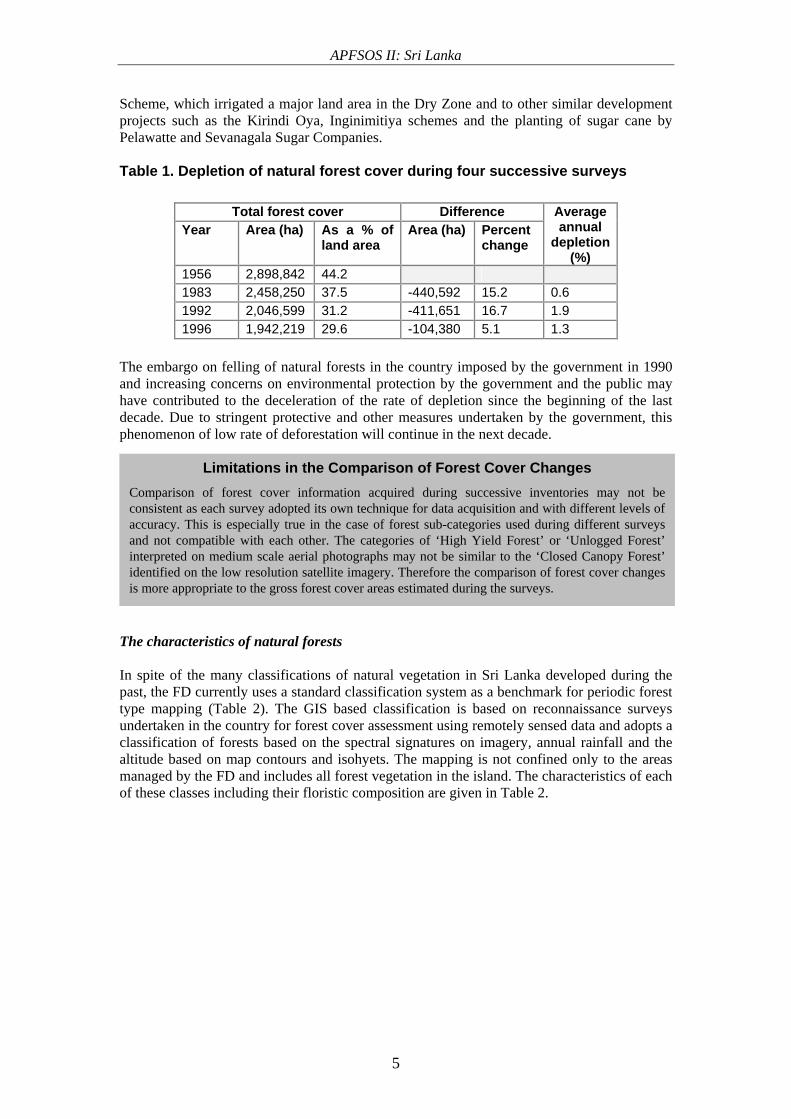
Scheme, which irrigated a major land area in the Dry Zone and to other similar development projects such as the Kirindi Oya, Inginimitiya schemes and the planting of sugar cane by Pelawatte and Sevanagala Sugar Companies. Table 1. Depletion of natural forest cover during four successive surveys The embargo on felling of natural forests in the country imposed by the government in 1990 and increasing concerns on environmental protection by the government and the public may have contributed to the deceleration of the rate of depletion since the beginning of the last decade. Due to stringent protective and other measures undertaken by the government, this phenomenon of low rate of deforestation will continue in the next decade.
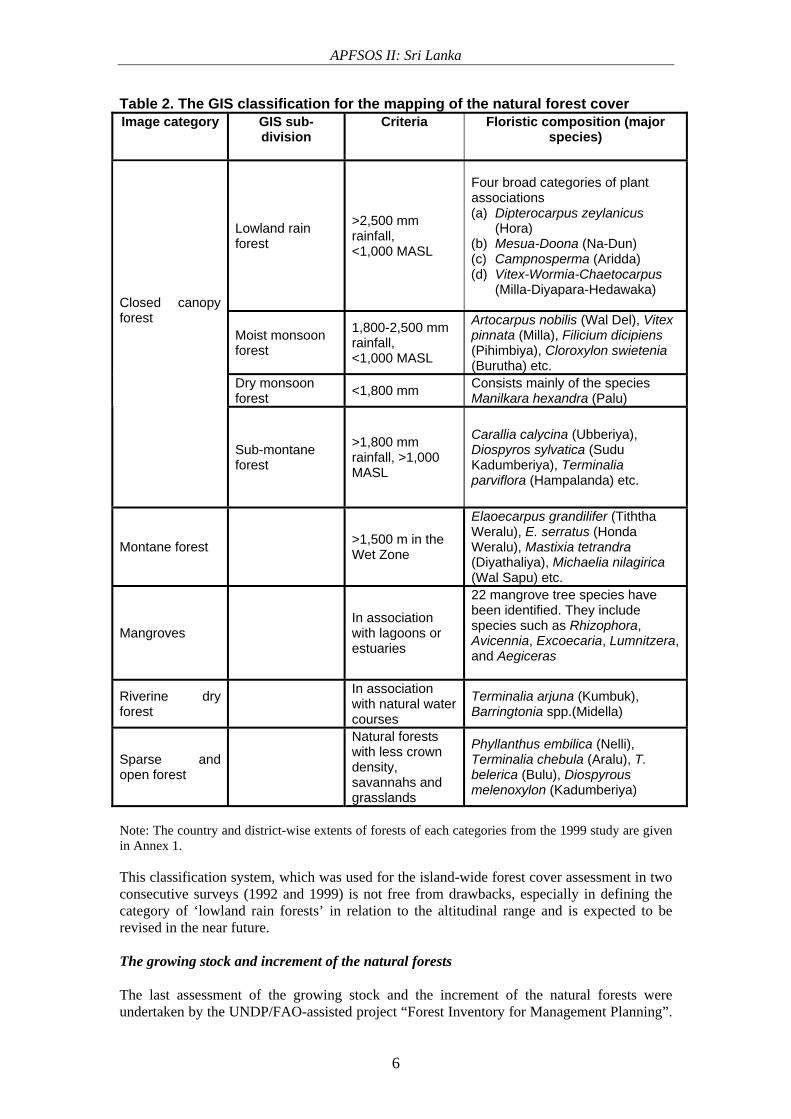
The characteristics of natural forests In spite of the many classifications of natural vegetation in Sri Lanka developed during the past, the FD currently uses a standard classification system as a benchmark for periodic forest type mapping (Table 2). The GIS based classification is based on reconnaissance surveys undertaken in the country for forest cover assessment using remotely sensed data and adopts a classification of forests based on the spectral signatures on imagery, annual rainfall and the altitude based on map contours and isohyets. The mapping is not confined only to the areas managed by the FD and includes all forest vegetation in the island. The characteristics of each of these classes including their floristic composition are given in Table 2.
Total forest cover Difference Year Area (ha) As a % of
land area Area (ha) Percent
change
Average annual
depletion (%)
1956 2,898,842 44.2 1983 2,458,250 37.5 -440,592 15.2 0.6 1992 2,046,599 31.2 -411,651 16.7 1.9 1996 1,942,219 29.6 -104,380 5.1 1.3
Limitations in the Comparison of Forest Cover Changes Comparison of forest cover information acquired during successive inventories may not be consistent as each survey adopted its own technique for data acquisition and with different levels of accuracy. This is especially true in the case of forest sub-categories used during different surveys and not compatible with each other. The categories of ‘High Yield Forest’ or ‘Unlogged Forest’ interpreted on medium scale aerial photographs may not be similar to the ‘Closed Canopy Forest’ identified on the low resolution satellite imagery. Therefore the comparison of forest cover changes is more appropriate to the gross forest cover areas estimated during the surveys.
APFSOS II: Sri Lanka
6
Table 2. The GIS classification for the mapping of the natural forest cover Image category GIS sub-
division Criteria Floristic composition (major
species)
Lowland rain forest
>2,500 mm rainfall, <1,000 MASL
Four broad categories of plant associations (a) Dipterocarpus zeylanicus
(Hora) (b) Mesua-Doona (Na-Dun) (c) Campnosperma (Aridda) (d) Vitex-Wormia-Chaetocarpus
(Milla-Diyapara-Hedawaka)
Moist monsoon forest
1,800-2,500 mm rainfall, <1,000 MASL
Artocarpus nobilis (Wal Del), Vitex pinnata (Milla), Filicium dicipiens (Pihimbiya), Cloroxylon swietenia (Burutha) etc.
Dry monsoon forest <1,800 mm Consists mainly of the species
Manilkara hexandra (Palu)
Closed canopy forest
Sub-montane forest
>1,800 mm rainfall, >1,000 MASL
Carallia calycina (Ubberiya), Diospyros sylvatica (Sudu Kadumberiya), Terminalia parviflora (Hampalanda) etc.
Montane forest >1,500 m in the Wet Zone
Elaoecarpus grandilifer (Tiththa Weralu), E. serratus (Honda Weralu), Mastixia tetrandra (Diyathaliya), Michaelia nilagirica (Wal Sapu) etc.
Mangroves In association with lagoons or estuaries
22 mangrove tree species have been identified. They include species such as Rhizophora, Avicennia, Excoecaria, Lumnitzera, and Aegiceras
Riverine dry forest
In association with natural water courses
Terminalia arjuna (Kumbuk), Barringtonia spp.(Midella)
Sparse and open forest
Natural forests with less crown density, savannahs and grasslands
Phyllanthus embilica (Nelli), Terminalia chebula (Aralu), T. belerica (Bulu), Diospyrous melenoxylon (Kadumberiya)
Note: The country and district-wise extents of forests of each categories from the 1999 study are given in Annex 1. This classification system, which was used for the island-wide forest cover assessment in two consecutive surveys (1992 and 1999) is not free from drawbacks, especially in defining the category of ‘lowland rain forests’ in relation to the altitudinal range and is expected to be revised in the near future. The growing stock and increment of the natural forests The last assessment of the growing stock and the increment of the natural forests were undertaken by the UNDP/FAO-assisted project “Forest Inventory for Management Planning”.
APFSOS II: Sri Lanka
7
The productive coups in the Wet Zone Lowland forests on average yielded 35-45 m3 timber/ha. Sometimes this was as low as 8 m3/ha. The growth percentage of gross volume per annum of all species above 30 cm diameter at breast height (DBH) in the Wet Zone natural forests was estimated as 1.93%. The logged over natural forests in the Wet Zone lowland showed a higher annual increment of 2.4 m3/ha/annum of the gross volume (>30 cm DBH). The average allowable cut in productive natural forests of the Wet Zone was fixed as 40 m3/ha in a 30 year felling cycle. The Dry Zone forests are normally poorly stocked and low yielding, in comparison to the Wet Zone natural forests. The same study estimated the volume increment of Dry Zone forests as 0.45-0.5 m3/ha/annum. Due to the policy changes of the government on exploitation of natural forests, a logging ban in natural forests was imposed in 1990 and it is still continuing. Since then no stock assessment of timber in the natural forests has ever been undertaken. The forests, which were subjected to felling prior to 1990, are now in an advanced regeneration stage and are managed purely as conservation forests. A change to this policy is not to be anticipated in the near future.
Forest plantations The man-made forests occupy a significant place in the national forest estate and generally fall into the category of multiple use reserved forests as defined in the Forest Policy, unless being classified in the categories of strict conservation or conservation forests due to specific reasons. At present, the forest plantations consist of even-aged monocultures, except in the case of the mixed mahogany plantations, and stocked with species such as teak (Tectona grandis), several eucalypt species (E. grandis, E. microcorys, E. robusta etc.), Caribbean pine (Pinus caribaea), African mahogany (Khaya senegalensis) and with several other local species. At the turn of the twentieth century, the total extent of forest plantations in the island was reported as 713 ha. The forest inventory of 1956 indicated this had increased to 20,157 ha (Andrews, 1961). The estimate in 1986 showed 75,315 ha of forest plantations, which is above the figure produced by the survey of 1992 (72,340 ha). This discrepancy is somewhat unexplainable, but could be attributed to the different types of survey methodologies. The latest available figure of 79,941 ha of forest plantations from the 1996 reconnaissance survey obtained by the interpretation of low resolution satellite imagery needs to be confirmed by detailed ground surveys. The FD has already initiated this activity by intensive ground surveys of forest plantations within the framework of the recent updating of the forest plantation data base. This would clarify the discrepancies between the extents of different species in records, which are normally on the higher side, and the extents obtained by reconnaissance surveys. The figures given above on the total extent of man-made forests indicate a rapid expansion of the forest plantation estate in the early postindependence period, which has now reached a more stable stage, probably due to the non-availability of suitable lands for expansion. For many years, the establishment of new forests plantations was confined mostly to the second rotation areas and this is likely to continue in the future. With the demarcation of the permanent forest estate, the total area under forest plantations would remain more or less static. The composition of the forest plantation growing stock and the extents of different species are given in Table 3.
APFSOS II: Sri Lanka
8
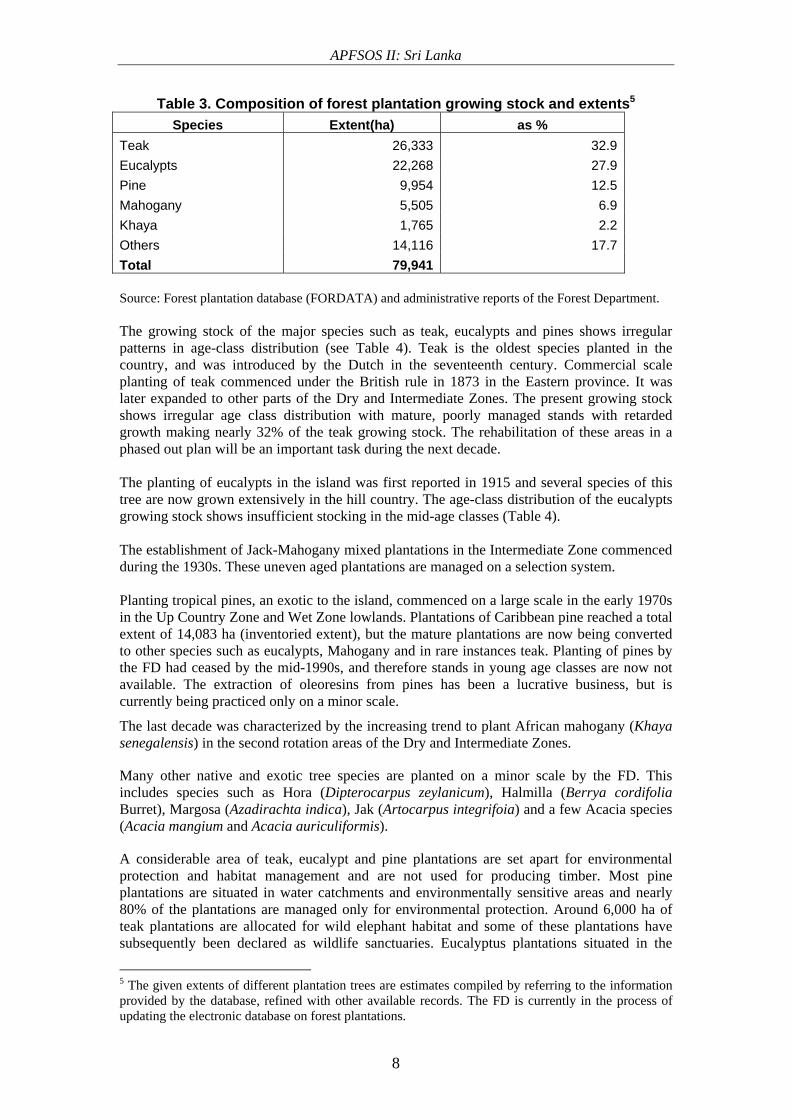
Table 3. Composition of forest plantation growing stock and extents5 Species Extent(ha) as %
Teak 26,333 32.9 Eucalypts 22,268 27.9 Pine 9,954 12.5 Mahogany 5,505 6.9 Khaya 1,765 2.2 Others 14,116 17.7 Total 79,941 Source: Forest plantation database (FORDATA) and administrative reports of the Forest Department. The growing stock of the major species such as teak, eucalypts and pines shows irregular patterns in age-class distribution (see Table 4). Teak is the oldest species planted in the country, and was introduced by the Dutch in the seventeenth century. Commercial scale planting of teak commenced under the British rule in 1873 in the Eastern province. It was later expanded to other parts of the Dry and Intermediate Zones. The present growing stock shows irregular age class distribution with mature, poorly managed stands with retarded growth making nearly 32% of the teak growing stock. The rehabilitation of these areas in a phased out plan will be an important task during the next decade. The planting of eucalypts in the island was first reported in 1915 and several species of this tree are now grown extensively in the hill country. The age-class distribution of the eucalypts growing stock shows insufficient stocking in the mid-age classes (Table 4). The establishment of Jack-Mahogany mixed plantations in the Intermediate Zone commenced during the 1930s. These uneven aged plantations are managed on a selection system. Planting tropical pines, an exotic to the island, commenced on a large scale in the early 1970s in the Up Country Zone and Wet Zone lowlands. Plantations of Caribbean pine reached a total extent of 14,083 ha (inventoried extent), but the mature plantations are now being converted to other species such as eucalypts, Mahogany and in rare instances teak. Planting of pines by the FD had ceased by the mid-1990s, and therefore stands in young age classes are now not available. The extraction of oleoresins from pines has been a lucrative business, but is currently being practiced only on a minor scale.
The last decade was characterized by the increasing trend to plant African mahogany (Khaya senegalensis) in the second rotation areas of the Dry and Intermediate Zones.
Many other native and exotic tree species are planted on a minor scale by the FD. This includes species such as Hora (Dipterocarpus zeylanicum), Halmilla (Berrya cordifolia Burret), Margosa (Azadirachta indica), Jak (Artocarpus integrifoia) and a few Acacia species (Acacia mangium and Acacia auriculiformis).
A considerable area of teak, eucalypt and pine plantations are set apart for environmental protection and habitat management and are not used for producing timber. Most pine plantations are situated in water catchments and environmentally sensitive areas and nearly 80% of the plantations are managed only for environmental protection. Around 6,000 ha of teak plantations are allocated for wild elephant habitat and some of these plantations have subsequently been declared as wildlife sanctuaries. Eucalyptus plantations situated in the
5 The given extents of different plantation trees are estimates compiled by referring to the information provided by the database, refined with other available records. The FD is currently in the process of updating the electronic database on forest plantations.

APFSOS II: Sri Lanka
9
higher elevations are kept for environmental protection and about 2,000 ha of such plantations are excluded from timber production.
Growing stock and increment of forest plantations
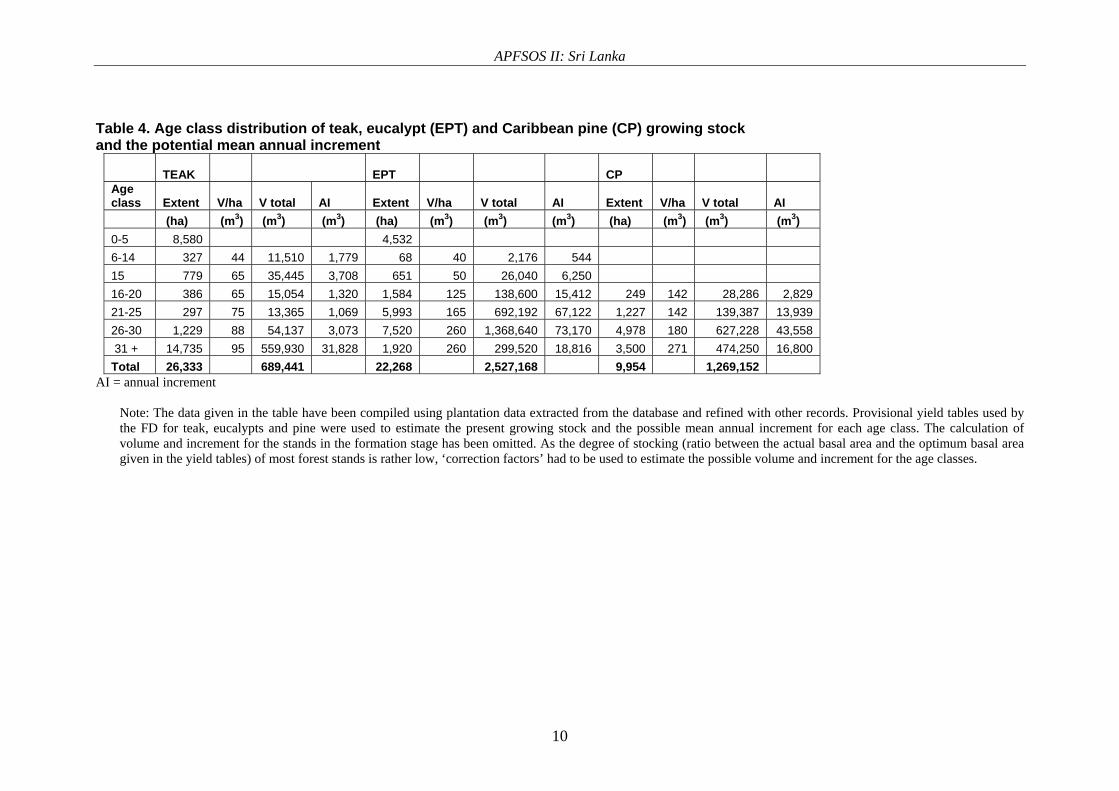
The age-class distribution of the even-aged growing stock of the three major plantation species and their estimated annual increment are given in Table 4. The volume increment of most of the stands may not be at optimum levels, especially with teak, due to insufficient stand treatments undertaken in the past.
APFSOS II: Sri Lanka
10
Table 4. Age class distribution of teak, eucalypt (EPT) and Caribbean pine (CP) growing stock and the potential mean annual increment
TEAK EPT CP Age class Extent V/ha V total AI Extent V/ha V total AI Extent V/ha V total AI (ha) (m3) (m3) (m3) (ha) (m3) (m3) (m3) (ha) (m3) (m3) (m3) 0-5 8,580 4,532 6-14 327 44 11,510 1,779 68 40 2,176 544 15 779 65 35,445 3,708 651 50 26,040 6,250 16-20 386 65 15,054 1,320 1,584 125 138,600 15,412 249 142 28,286 2,829 21-25 297 75 13,365 1,069 5,993 165 692,192 67,122 1,227 142 139,387 13,939 26-30 1,229 88 54,137 3,073 7,520 260 1,368,640 73,170 4,978 180 627,228 43,558 31 + 14,735 95 559,930 31,828 1,920 260 299,520 18,816 3,500 271 474,250 16,800 Total 26,333 689,441 22,268 2,527,168 9,954 1,269,152
AI = annual increment
Note: The data given in the table have been compiled using plantation data extracted from the database and refined with other records. Provisional yield tables used by the FD for teak, eucalypts and pine were used to estimate the present growing stock and the possible mean annual increment for each age class. The calculation of volume and increment for the stands in the formation stage has been omitted. As the degree of stocking (ratio between the actual basal area and the optimum basal area given in the yield tables) of most forest stands is rather low, ‘correction factors’ had to be used to estimate the possible volume and increment for the age classes.
APFSOS II: Sri Lanka
11
Other tree resources In addition to the forest plantations managed by the FD, home gardens, and rubber, tea and coconut plantations of the plantation sector provide timber and other wood products to meet the national demand in significant quantities. The present status of these wood sources and the possible contribution towards the next decade is discussed below. Home gardens These gardens are a traditional perennial system of cropping that uses a wide range of economically valuable trees including fruit, medicinal, spice and timber species. Home gardens in the Dry Zone are low in density with respect to trees. Home gardens in the Up Country zone (Kandy, Matale and Kurunegala Districts) are known as ‘Kandyan Home Gardens’ due to their rich diversity of tree species and the very dense structure. The National Forest Policy of 1995, referring to the policy on the management of private forest tree resources, states that tree growing on homesteads, and other agro-forestry, will be promoted as a main strategy to supply wood and other forest products for meeting household and market needs. This aspect of promoting the growing of multiple-use and timber trees in home gardens was intensively addressed in the projects undertaken by the FD, i.e. the Participatory Forestry Project (1993-2000) and the recently concluded ‘Forestry Programme for Early Rehabilitation In Asian Tsunami Affected Countries’, which had pronounced social forestry components. Distribution of home gardens: The average size and the species composition of home gardens vary according to factors such as agro-ecological region and the population density of the locality. Kandyan home gardens are typically established on sloping lands of small holdings, varying in size from 0.4 ha to 2 ha with an average of 1 ha. The total extent of home gardens6 in 1992 was estimated as 858,490 ha. Sampling undertaken by the EA1P7 in 1998 after carrying out studies in home gardens revealed that the average stocking of timber providing trees varied between 54 and 419 trees/ha. Home gardens in the Kalutara and Kurunegala Districts showed higher stocking densities, averaging 508 and 284 trees/ha respectively. The higher densities are attributed to rubber and coconut trees cultivated in these districts. In districts where no plantation crops (rubber or coconut) are present home gardens have lower stocking densities with timber providing trees, but include highly valued trees such as teak, mahogany and Jak. The number of home gardens in the country is steadily rising. The Forestry Sector Master Plan (FSMP) reckons the increase to be 1% per annum. Both the number of home gardens and the extent under home gardens is increasing due to new settlements and fragmentation of some of the existing home gardens. Lands available in the urban areas, mainly coconut plantations, are used for commercial housing schemes in the wet and intermediate zones while the land category called ‘sparsely used croplands’ is used for new housing programmes in the dry zone. The distribution of home gardens in different administrative districts is listed in the Table 5.
6 Forestry Sector Master Plan, 1995. 7 Environmental Action 1 Project (EA1P), 1998. ‘The Effect Of The Wood Products Industry On Natural Forests’, Final Report, Ministry of Forestry and Environment, Colombo, Sri Lanka.
APFSOS II: Sri Lanka
12
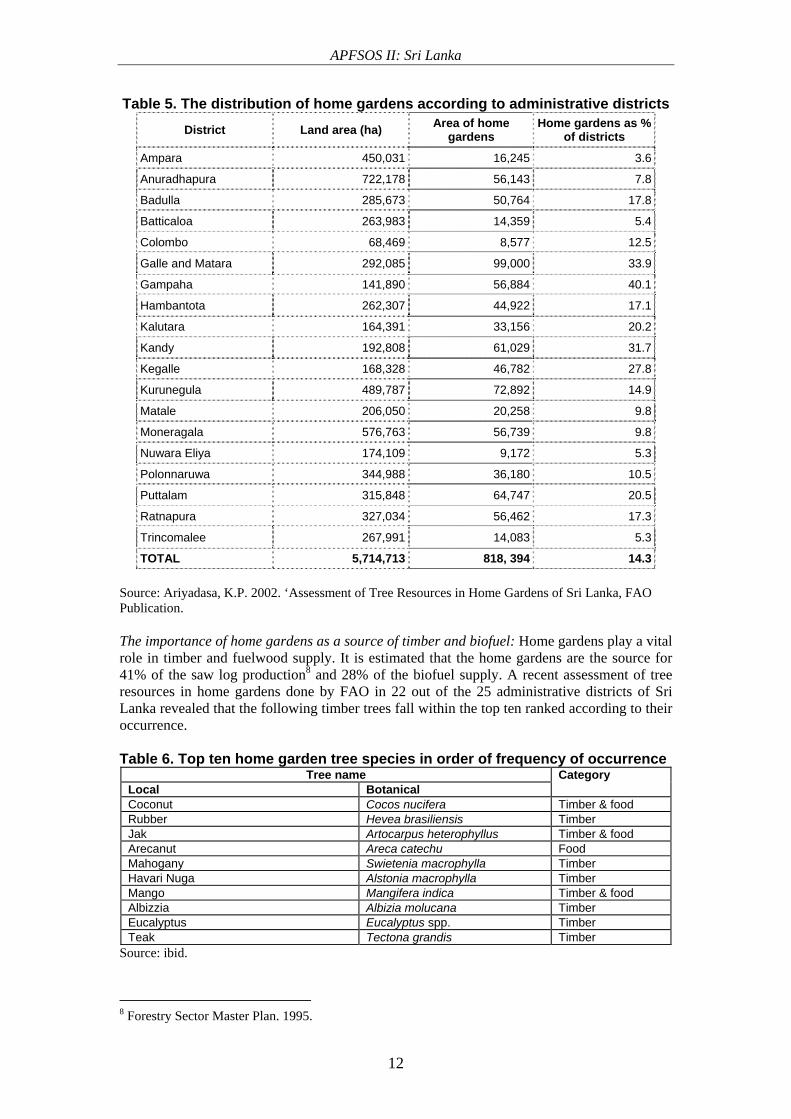
Table 5. The distribution of home gardens according to administrative districts
District Land area (ha) Area of home gardens
Home gardens as % of districts
Ampara 450,031 16,245 3.6
Anuradhapura 722,178 56,143 7.8
Badulla 285,673 50,764 17.8
Batticaloa 263,983 14,359 5.4
Colombo 68,469 8,577 12.5
Galle and Matara 292,085 99,000 33.9
Gampaha 141,890 56,884 40.1
Hambantota 262,307 44,922 17.1
Kalutara 164,391 33,156 20.2
Kandy 192,808 61,029 31.7
Kegalle 168,328 46,782 27.8
Kurunegula 489,787 72,892 14.9
Matale 206,050 20,258 9.8
Moneragala 576,763 56,739 9.8
Nuwara Eliya 174,109 9,172 5.3
Polonnaruwa 344,988 36,180 10.5
Puttalam 315,848 64,747 20.5
Ratnapura 327,034 56,462 17.3
Trincomalee 267,991 14,083 5.3
TOTAL 5,714,713 818, 394 14.3 Source: Ariyadasa, K.P. 2002. ‘Assessment of Tree Resources in Home Gardens of Sri Lanka, FAO Publication. The importance of home gardens as a source of timber and biofuel: Home gardens play a vital role in timber and fuelwood supply. It is estimated that the home gardens are the source for 41% of the saw log production8 and 28% of the biofuel supply. A recent assessment of tree resources in home gardens done by FAO in 22 out of the 25 administrative districts of Sri Lanka revealed that the following timber trees fall within the top ten ranked according to their occurrence. Table 6. Top ten home garden tree species in order of frequency of occurrence
Tree name Local Botanical
Category
Coconut Cocos nucifera Timber & food Rubber Hevea brasiliensis Timber Jak Artocarpus heterophyllus Timber & food Arecanut Areca catechu Food Mahogany Swietenia macrophylla Timber Havari Nuga Alstonia macrophylla Timber Mango Mangifera indica Timber & food Albizzia Albizia molucana Timber Eucalyptus Eucalyptus spp. Timber Teak Tectona grandis Timber
Source: ibid.
8 Forestry Sector Master Plan. 1995.
APFSOS II: Sri Lanka
13
The study by EA1P revealed that the proportion of the mature timber trees (i.e. >15 years old) in non-plantation crop areas was 5%, whereas in plantation crop areas (Kurunegala, Kalutara and Ratnapura Districts) the figure could reach 90% on average. Several studies have identified home gardens as a significant source of timber and fuelwood (FSMP9 1995; EA1P10 1998; Ariyadasa11 2002). In 1995, saw logs extracted from home gardens amounted to 551,000 m3 and this was considerably higher than the total saw logs produced by the State Timber Corporation in 2001 (109,032 m3). Based on the projections of the FSMP study, the current wood production in home gardens is estimated as 641,800 m3 and due to the intensive nature of interventions on home garden development described below, it may reach the level of 681,400 m3 in 2020. Rubber plantations The cultivation of rubber (Hevea brasiliensis) in the island commenced during the colonial rule of the country and plantations are now widely distributed in Sabaragamuwa (Kegalle and Ratnapura Districts), Northwestern (Kurunegala District), Central (Matale and partly Kandy), Uva (Badulla and Moneragala), Southern (Galle, Kalutara, partly Matara and Hambantota ) and Western (Gampaha and Kalutara Districts) provinces. The total area cultivated with rubber for 2006 was estimated at 118,000 ha12 and out of it 95,000 ha were suitable for tapping.
In addition to latex, rubber plantations are a vital source for timber and firewood once the mature and unproductive plantations are uprooted. They are also much in demand as a raw material for the manufacture of MDF.13 Boron-treated rubber wood is used for the manufacturing of furniture and paneling. A study undertaken by FAO 14 estimated the wood supply from 1 ha of rubber plantations as 0.24 m3 logs, 65 m3 saw logs, and 127 m3 fuelwood (a total of 192.2 m3 per hectare for all wood assortments).
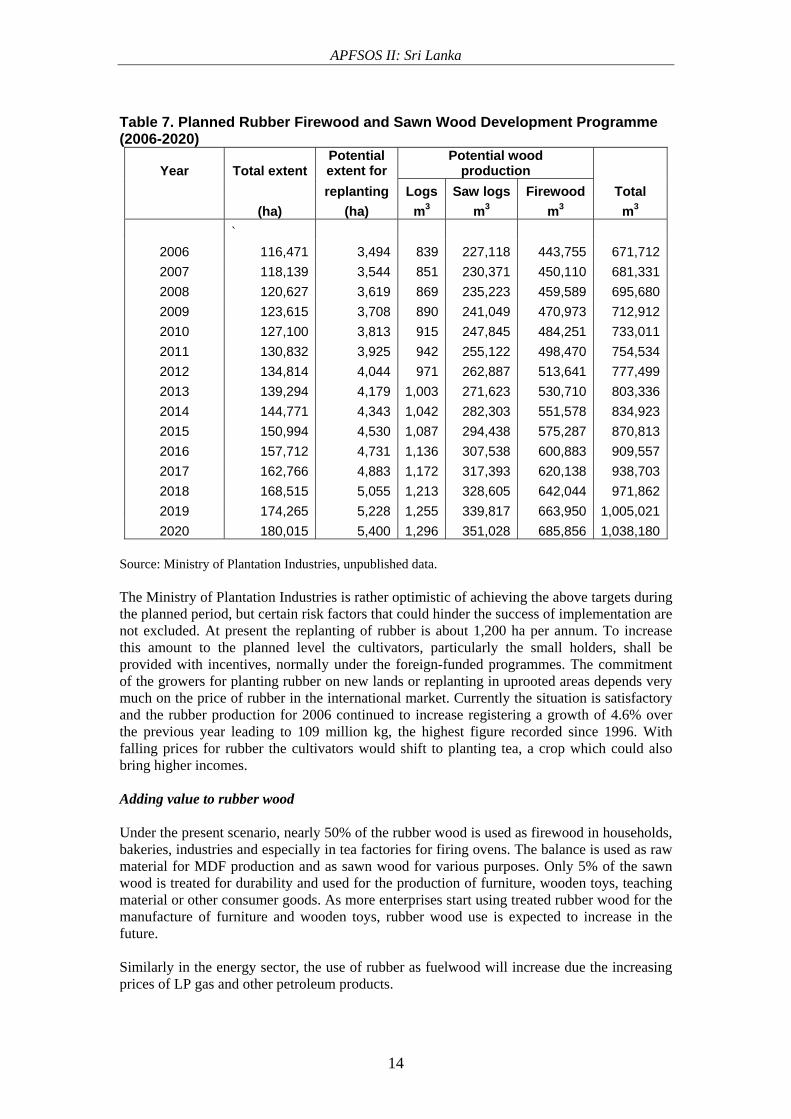
The Ministry of Plantation Industries launched a rubber development programme in 2006. Under the planned programme, the present extent of 116,000 ha under rubber cultivation will be raised to 180,000 ha in 2020. New planting will take place mainly in the abandoned shifting cultivation areas in the intermediate zone. Annual replanting areas would rise from 3,490 ha to 5,400 ha during this period. The potential wood extraction from the rubber plantations based on the volume figures given in the previous paragraph is given in Table 7.
9 Forestry Sector Master Plan. 1995. 10 Action 1 Project (EA1P). 1998. ‘The Effect of the Wood Products Industry on Natural Forests’. Final Report. Ministry of Forestry and Environment, Colombo, Sri Lanka. 11 Ariyadasa, K.P. 2002. ‘Assessment of Tree Resources in Home Gardens of Sri Lanka’, FAO Publication. 12 Annual Report of the Central Bank of Sri Lanka for Year 2006. 13 Micro Density Fibreboard. 14 FAO, FRA 2000. ‘Forest Resources of Sri Lanka’.
APFSOS II: Sri Lanka
14
Table 7. Planned Rubber Firewood and Sawn Wood Development Programme (2006-2020)
Year Total extent Potential extent for
Potential wood production
replanting Logs Saw logs Firewood Total (ha) (ha) m3 m3 m3 m3
` 2006 116,471 3,494 839 227,118 443,755 671,7122007 118,139 3,544 851 230,371 450,110 681,3312008 120,627 3,619 869 235,223 459,589 695,6802009 123,615 3,708 890 241,049 470,973 712,9122010 127,100 3,813 915 247,845 484,251 733,0112011 130,832 3,925 942 255,122 498,470 754,5342012 134,814 4,044 971 262,887 513,641 777,4992013 139,294 4,179 1,003 271,623 530,710 803,3362014 144,771 4,343 1,042 282,303 551,578 834,9232015 150,994 4,530 1,087 294,438 575,287 870,8132016 157,712 4,731 1,136 307,538 600,883 909,5572017 162,766 4,883 1,172 317,393 620,138 938,7032018 168,515 5,055 1,213 328,605 642,044 971,8622019 174,265 5,228 1,255 339,817 663,950 1,005,0212020 180,015 5,400 1,296 351,028 685,856 1,038,180
Source: Ministry of Plantation Industries, unpublished data. The Ministry of Plantation Industries is rather optimistic of achieving the above targets during the planned period, but certain risk factors that could hinder the success of implementation are not excluded. At present the replanting of rubber is about 1,200 ha per annum. To increase this amount to the planned level the cultivators, particularly the small holders, shall be provided with incentives, normally under the foreign-funded programmes. The commitment of the growers for planting rubber on new lands or replanting in uprooted areas depends very much on the price of rubber in the international market. Currently the situation is satisfactory and the rubber production for 2006 continued to increase registering a growth of 4.6% over the previous year leading to 109 million kg, the highest figure recorded since 1996. With falling prices for rubber the cultivators would shift to planting tea, a crop which could also bring higher incomes. Adding value to rubber wood Under the present scenario, nearly 50% of the rubber wood is used as firewood in households, bakeries, industries and especially in tea factories for firing ovens. The balance is used as raw material for MDF production and as sawn wood for various purposes. Only 5% of the sawn wood is treated for durability and used for the production of furniture, wooden toys, teaching material or other consumer goods. As more enterprises start using treated rubber wood for the manufacture of furniture and wooden toys, rubber wood use is expected to increase in the future. Similarly in the energy sector, the use of rubber as fuelwood will increase due the increasing prices of LP gas and other petroleum products.
APFSOS II: Sri Lanka
15
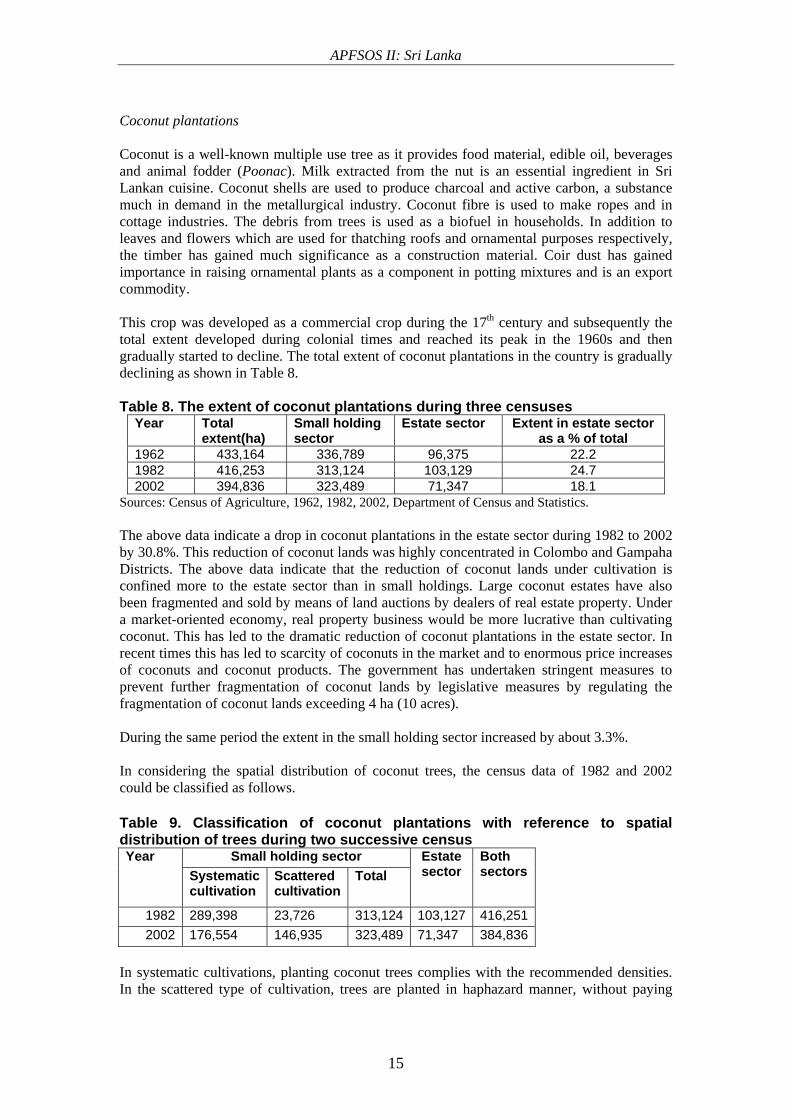
Coconut plantations Coconut is a well-known multiple use tree as it provides food material, edible oil, beverages and animal fodder (Poonac). Milk extracted from the nut is an essential ingredient in Sri Lankan cuisine. Coconut shells are used to produce charcoal and active carbon, a substance much in demand in the metallurgical industry. Coconut fibre is used to make ropes and in cottage industries. The debris from trees is used as a biofuel in households. In addition to leaves and flowers which are used for thatching roofs and ornamental purposes respectively, the timber has gained much significance as a construction material. Coir dust has gained importance in raising ornamental plants as a component in potting mixtures and is an export commodity. This crop was developed as a commercial crop during the 17th century and subsequently the total extent developed during colonial times and reached its peak in the 1960s and then gradually started to decline. The total extent of coconut plantations in the country is gradually declining as shown in Table 8. Table 8. The extent of coconut plantations during three censuses
Year Total extent(ha)
Small holding sector
Estate sector Extent in estate sector as a % of total
1962 433,164 336,789 96,375 22.2 1982 416,253 313,124 103,129 24.7 2002 394,836 323,489 71,347 18.1
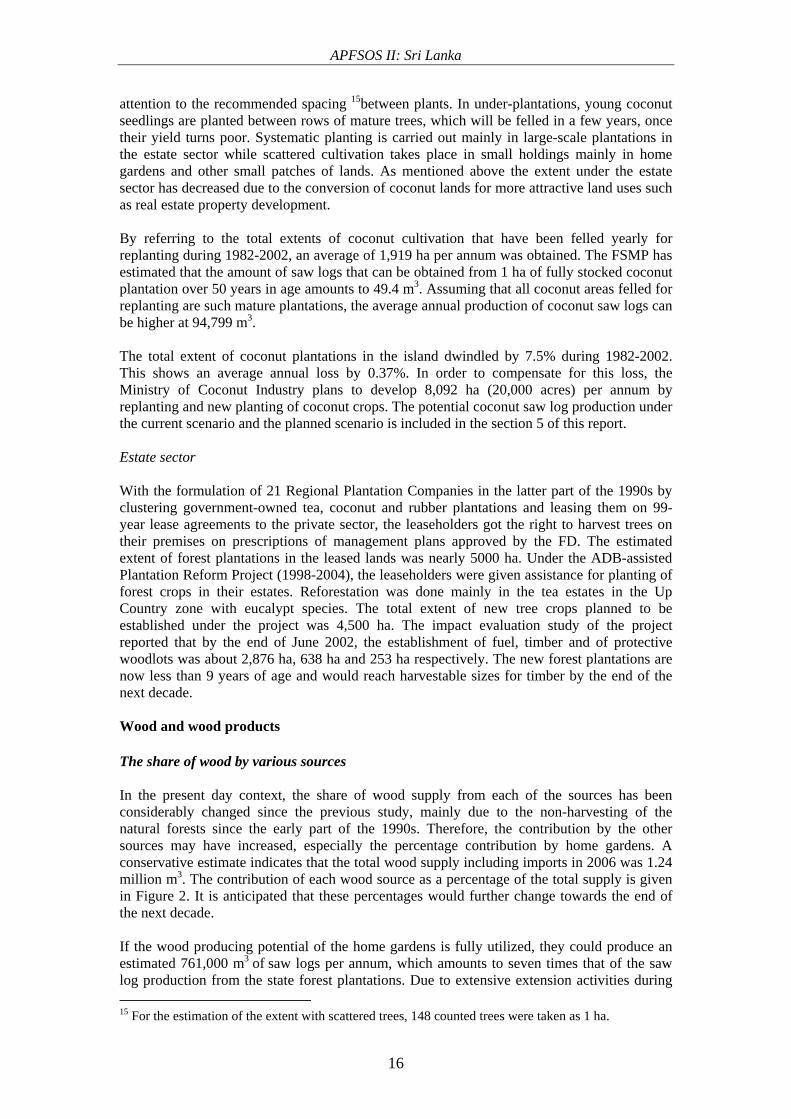
Sources: Census of Agriculture, 1962, 1982, 2002, Department of Census and Statistics. The above data indicate a drop in coconut plantations in the estate sector during 1982 to 2002 by 30.8%. This reduction of coconut lands was highly concentrated in Colombo and Gampaha Districts. The above data indicate that the reduction of coconut lands under cultivation is confined more to the estate sector than in small holdings. Large coconut estates have also been fragmented and sold by means of land auctions by dealers of real estate property. Under a market-oriented economy, real property business would be more lucrative than cultivating coconut. This has led to the dramatic reduction of coconut plantations in the estate sector. In recent times this has led to scarcity of coconuts in the market and to enormous price increases of coconuts and coconut products. The government has undertaken stringent measures to prevent further fragmentation of coconut lands by legislative measures by regulating the fragmentation of coconut lands exceeding 4 ha (10 acres). During the same period the extent in the small holding sector increased by about 3.3%. In considering the spatial distribution of coconut trees, the census data of 1982 and 2002 could be classified as follows.
Table 9. Classification of coconut plantations with reference to spatial distribution of trees during two successive census
Small holding sector Year Systematic cultivation
Scattered cultivation
Total Estate sector
Both sectors
1982 289,398 23,726 313,124 103,127 416,2512002 176,554 146,935 323,489 71,347 384,836
In systematic cultivations, planting coconut trees complies with the recommended densities. In the scattered type of cultivation, trees are planted in haphazard manner, without paying
APFSOS II: Sri Lanka
16
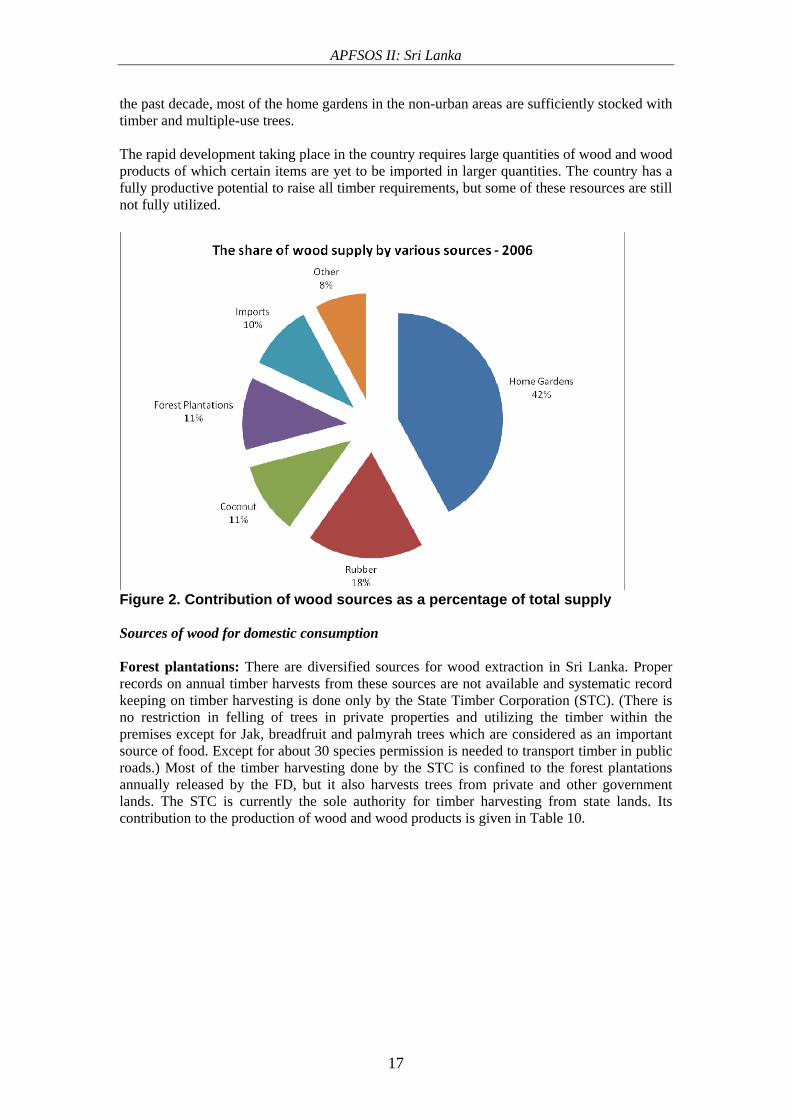
attention to the recommended spacing 15between plants. In under-plantations, young coconut seedlings are planted between rows of mature trees, which will be felled in a few years, once their yield turns poor. Systematic planting is carried out mainly in large-scale plantations in the estate sector while scattered cultivation takes place in small holdings mainly in home gardens and other small patches of lands. As mentioned above the extent under the estate sector has decreased due to the conversion of coconut lands for more attractive land uses such as real estate property development. By referring to the total extents of coconut cultivation that have been felled yearly for replanting during 1982-2002, an average of 1,919 ha per annum was obtained. The FSMP has estimated that the amount of saw logs that can be obtained from 1 ha of fully stocked coconut plantation over 50 years in age amounts to 49.4 m3. Assuming that all coconut areas felled for replanting are such mature plantations, the average annual production of coconut saw logs can be higher at 94,799 m3. The total extent of coconut plantations in the island dwindled by 7.5% during 1982-2002. This shows an average annual loss by 0.37%. In order to compensate for this loss, the Ministry of Coconut Industry plans to develop 8,092 ha (20,000 acres) per annum by replanting and new planting of coconut crops. The potential coconut saw log production under the current scenario and the planned scenario is included in the section 5 of this report. Estate sector With the formulation of 21 Regional Plantation Companies in the latter part of the 1990s by clustering government-owned tea, coconut and rubber plantations and leasing them on 99-year lease agreements to the private sector, the leaseholders got the right to harvest trees on their premises on prescriptions of management plans approved by the FD. The estimated extent of forest plantations in the leased lands was nearly 5000 ha. Under the ADB-assisted Plantation Reform Project (1998-2004), the leaseholders were given assistance for planting of forest crops in their estates. Reforestation was done mainly in the tea estates in the Up Country zone with eucalypt species. The total extent of new tree crops planned to be established under the project was 4,500 ha. The impact evaluation study of the project reported that by the end of June 2002, the establishment of fuel, timber and of protective woodlots was about 2,876 ha, 638 ha and 253 ha respectively. The new forest plantations are now less than 9 years of age and would reach harvestable sizes for timber by the end of the next decade. Wood and wood products The share of wood by various sources In the present day context, the share of wood supply from each of the sources has been considerably changed since the previous study, mainly due to the non-harvesting of the natural forests since the early part of the 1990s. Therefore, the contribution by the other sources may have increased, especially the percentage contribution by home gardens. A conservative estimate indicates that the total wood supply including imports in 2006 was 1.24 million m3. The contribution of each wood source as a percentage of the total supply is given in Figure 2. It is anticipated that these percentages would further change towards the end of the next decade. If the wood producing potential of the home gardens is fully utilized, they could produce an estimated 761,000 m3 of saw logs per annum, which amounts to seven times that of the saw log production from the state forest plantations. Due to extensive extension activities during 15 For the estimation of the extent with scattered trees, 148 counted trees were taken as 1 ha.
APFSOS II: Sri Lanka
17
the past decade, most of the home gardens in the non-urban areas are sufficiently stocked with timber and multiple-use trees. The rapid development taking place in the country requires large quantities of wood and wood products of which certain items are yet to be imported in larger quantities. The country has a fully productive potential to raise all timber requirements, but some of these resources are still not fully utilized.
Figure 2. Contribution of wood sources as a percentage of total supply Sources of wood for domestic consumption Forest plantations: There are diversified sources for wood extraction in Sri Lanka. Proper records on annual timber harvests from these sources are not available and systematic record keeping on timber harvesting is done only by the State Timber Corporation (STC). (There is no restriction in felling of trees in private properties and utilizing the timber within the premises except for Jak, breadfruit and palmyrah trees which are considered as an important source of food. Except for about 30 species permission is needed to transport timber in public roads.) Most of the timber harvesting done by the STC is confined to the forest plantations annually released by the FD, but it also harvests trees from private and other government lands. The STC is currently the sole authority for timber harvesting from state lands. Its contribution to the production of wood and wood products is given in Table 10.
APFSOS II: Sri Lanka
18
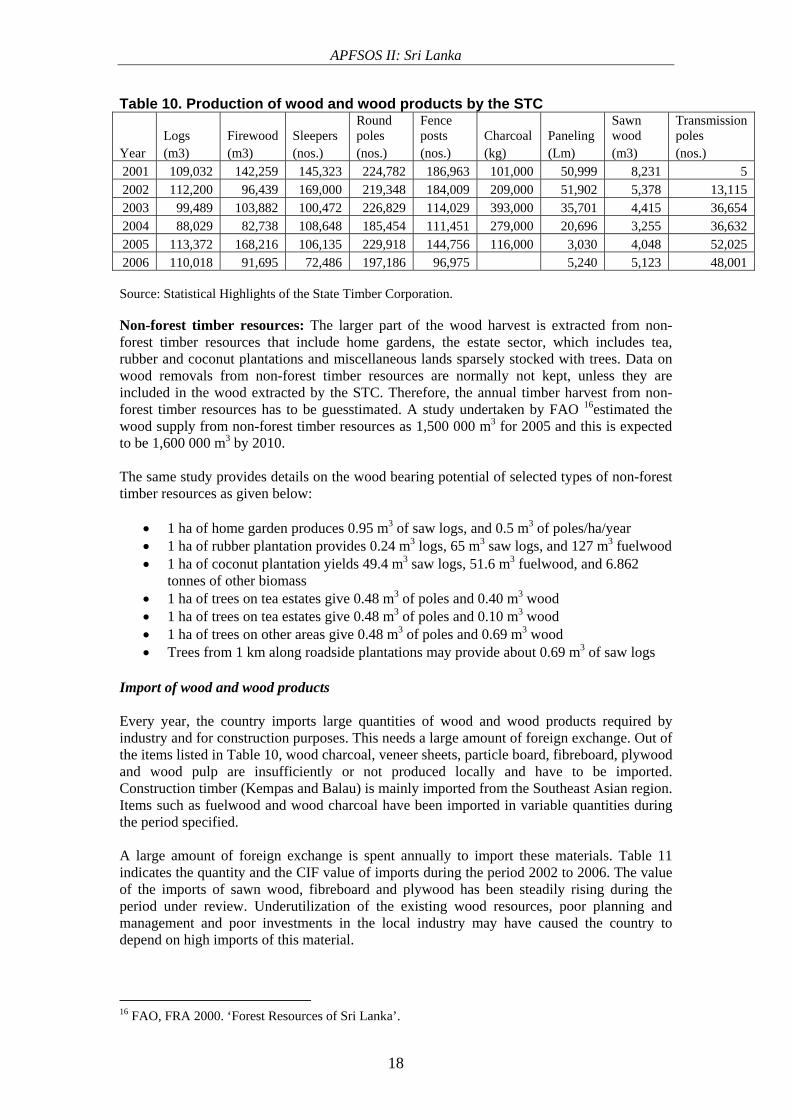
Table 10. Production of wood and wood products by the STC
Logs Firewood Sleepers Round poles
Fence posts Charcoal Paneling
Sawn wood
Transmission poles
Year (m3) (m3) (nos.) (nos.) (nos.) (kg) (Lm) (m3) (nos.) 2001 109,032 142,259 145,323 224,782 186,963 101,000 50,999 8,231 5 2002 112,200 96,439 169,000 219,348 184,009 209,000 51,902 5,378 13,115 2003 99,489 103,882 100,472 226,829 114,029 393,000 35,701 4,415 36,654 2004 88,029 82,738 108,648 185,454 111,451 279,000 20,696 3,255 36,632 2005 113,372 168,216 106,135 229,918 144,756 116,000 3,030 4,048 52,025 2006 110,018 91,695 72,486 197,186 96,975 5,240 5,123 48,001 Source: Statistical Highlights of the State Timber Corporation. Non-forest timber resources: The larger part of the wood harvest is extracted from non-forest timber resources that include home gardens, the estate sector, which includes tea, rubber and coconut plantations and miscellaneous lands sparsely stocked with trees. Data on wood removals from non-forest timber resources are normally not kept, unless they are included in the wood extracted by the STC. Therefore, the annual timber harvest from non-forest timber resources has to be guesstimated. A study undertaken by FAO 16estimated the wood supply from non-forest timber resources as 1,500 000 m3 for 2005 and this is expected to be 1,600 000 m3 by 2010. The same study provides details on the wood bearing potential of selected types of non-forest timber resources as given below:
• 1 ha of home garden produces 0.95 m3 of saw logs, and 0.5 m3 of poles/ha/year • 1 ha of rubber plantation provides 0.24 m3 logs, 65 m3 saw logs, and 127 m3 fuelwood • 1 ha of coconut plantation yields 49.4 m3 saw logs, 51.6 m3 fuelwood, and 6.862
tonnes of other biomass • 1 ha of trees on tea estates give 0.48 m3 of poles and 0.40 m3 wood • 1 ha of trees on tea estates give 0.48 m3 of poles and 0.10 m3 wood • 1 ha of trees on other areas give 0.48 m3 of poles and 0.69 m3 wood • Trees from 1 km along roadside plantations may provide about 0.69 m3 of saw logs
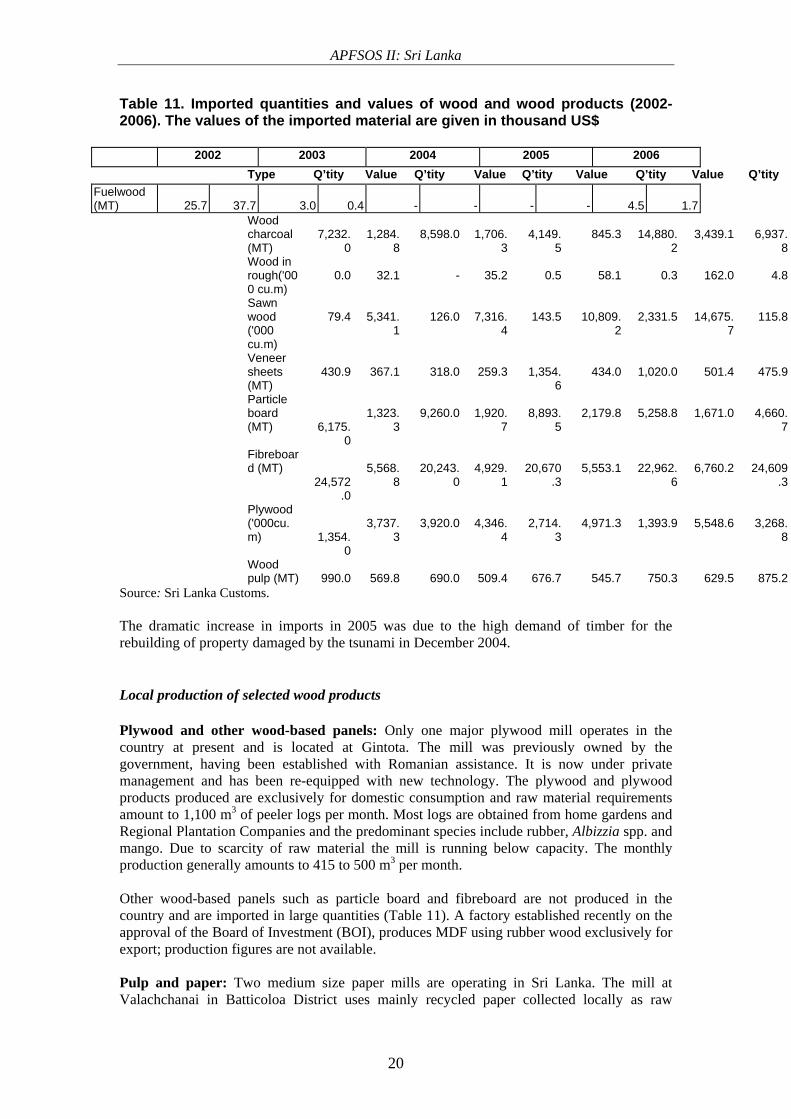
Import of wood and wood products Every year, the country imports large quantities of wood and wood products required by industry and for construction purposes. This needs a large amount of foreign exchange. Out of the items listed in Table 10, wood charcoal, veneer sheets, particle board, fibreboard, plywood and wood pulp are insufficiently or not produced locally and have to be imported. Construction timber (Kempas and Balau) is mainly imported from the Southeast Asian region. Items such as fuelwood and wood charcoal have been imported in variable quantities during the period specified. A large amount of foreign exchange is spent annually to import these materials. Table 11 indicates the quantity and the CIF value of imports during the period 2002 to 2006. The value of the imports of sawn wood, fibreboard and plywood has been steadily rising during the period under review. Underutilization of the existing wood resources, poor planning and management and poor investments in the local industry may have caused the country to depend on high imports of this material.
16 FAO, FRA 2000. ‘Forest Resources of Sri Lanka’.
APFSOS II: Sri Lanka
19
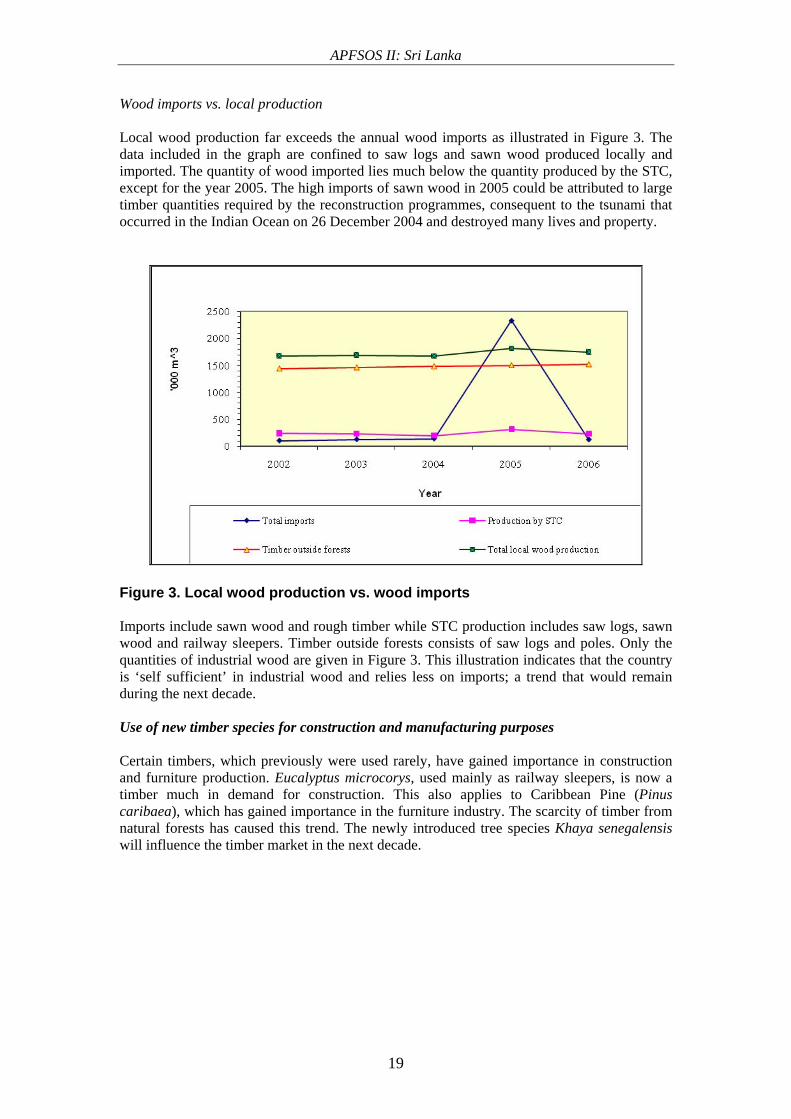
Wood imports vs. local production Local wood production far exceeds the annual wood imports as illustrated in Figure 3. The data included in the graph are confined to saw logs and sawn wood produced locally and imported. The quantity of wood imported lies much below the quantity produced by the STC, except for the year 2005. The high imports of sawn wood in 2005 could be attributed to large timber quantities required by the reconstruction programmes, consequent to the tsunami that occurred in the Indian Ocean on 26 December 2004 and destroyed many lives and property.
Figure 3. Local wood production vs. wood imports Imports include sawn wood and rough timber while STC production includes saw logs, sawn wood and railway sleepers. Timber outside forests consists of saw logs and poles. Only the quantities of industrial wood are given in Figure 3. This illustration indicates that the country is ‘self sufficient’ in industrial wood and relies less on imports; a trend that would remain during the next decade. Use of new timber species for construction and manufacturing purposes Certain timbers, which previously were used rarely, have gained importance in construction and furniture production. Eucalyptus microcorys, used mainly as railway sleepers, is now a timber much in demand for construction. This also applies to Caribbean Pine (Pinus caribaea), which has gained importance in the furniture industry. The scarcity of timber from natural forests has caused this trend. The newly introduced tree species Khaya senegalensis will influence the timber market in the next decade.
APFSOS II: Sri Lanka
20
Table 11. Imported quantities and values of wood and wood products (2002-2006). The values of the imported material are given in thousand US$
2002 2003 2004 2005 2006 Type Q’tity Value Q’tity Value Q’tity Value Q’tity Value Q’tity
Fuelwood (MT) 25.7
37.7
3.0 0.4 - - -
-
4.5 1.7
Wood charcoal (MT)
7,232.
0
1,284.
8
8,598.0
1,706.
3
4,149.
5
845.3
14,880.
2
3,439.1
6,937.
8 Wood in rough('000 cu.m)
0.0
32.1
-
35.2
0.5
58.1
0.3
162.0
4.8
Sawn wood ('000 cu.m)
79.4
5,341.
1
126.0
7,316.
4
143.5
10,809.
2
2,331.5
14,675.
7
115.8
Veneer sheets (MT)
430.9
367.1
318.0
259.3
1,354.
6
434.0
1,020.0
501.4
475.9
Particle board (MT)
6,175.0
1,323.
3
9,260.0
1,920.
7
8,893.
5
2,179.8
5,258.8
1,671.0
4,660.
7
Fibreboard (MT)
24,572.0
5,568.
8
20,243.
0
4,929.
1
20,670
.3
5,553.1
22,962.
6
6,760.2
24,609
.3
Plywood ('000cu.m)
1,354.0
3,737.
3
3,920.0
4,346.
4
2,714.
3
4,971.3
1,393.9
5,548.6
3,268.
8
Wood pulp (MT)
990.0
569.8
690.0
509.4
676.7
545.7
750.3
629.5
875.2
Source: Sri Lanka Customs. The dramatic increase in imports in 2005 was due to the high demand of timber for the rebuilding of property damaged by the tsunami in December 2004.
Local production of selected wood products
Plywood and other wood-based panels: Only one major plywood mill operates in the country at present and is located at Gintota. The mill was previously owned by the government, having been established with Romanian assistance. It is now under private management and has been re-equipped with new technology. The plywood and plywood products produced are exclusively for domestic consumption and raw material requirements amount to 1,100 m3 of peeler logs per month. Most logs are obtained from home gardens and Regional Plantation Companies and the predominant species include rubber, Albizzia spp. and mango. Due to scarcity of raw material the mill is running below capacity. The monthly production generally amounts to 415 to 500 m3 per month. Other wood-based panels such as particle board and fibreboard are not produced in the country and are imported in large quantities (Table 11). A factory established recently on the approval of the Board of Investment (BOI), produces MDF using rubber wood exclusively for export; production figures are not available. Pulp and paper: Two medium size paper mills are operating in Sri Lanka. The mill at Valachchanai in Batticoloa District uses mainly recycled paper collected locally as raw
APFSOS II: Sri Lanka
21
material. The current production of this mill is below its potential capacity and is limited to the manufacture of paper boards and typing paper with an average output of 600 tonnes per month. The mill at Embilipitiya is closed at present due to several constraints the company faced when it was in operation; it used about 30% recycled paper and 70% imported pulp and locally collected pulpwood (Albizzia sp. and Eucalyptus spp.) collected from tea estates and other private lands. The National Paper Company Limited, the government entity which manages these two factories, intends to develop this industry in the long run, but details of the future plans were not available. Currently, Sri Lanka produces only 10% of the demand for paper and paper products. Under improved conditions, this can be raised to nearly 14%, the minimum. Most of the imported paper pulp is used by industries manufacturing other pulp-based products.
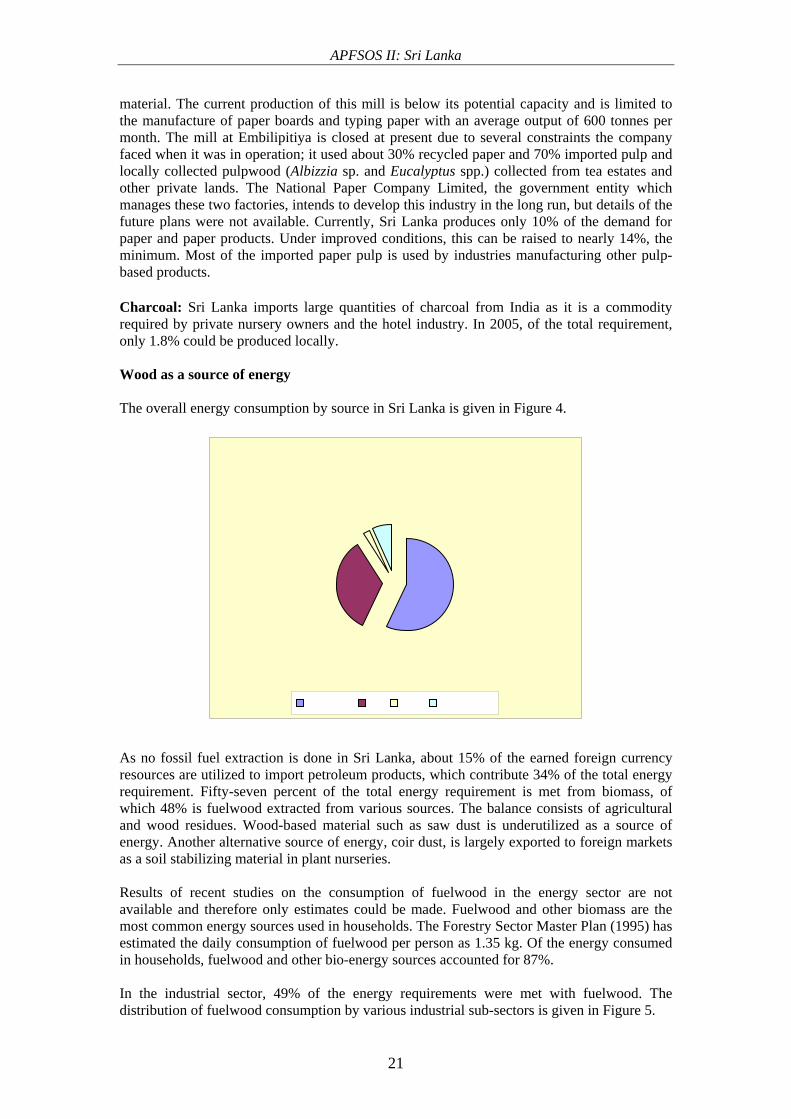
Charcoal: Sri Lanka imports large quantities of charcoal from India as it is a commodity required by private nursery owners and the hotel industry. In 2005, of the total requirement, only 1.8% could be produced locally. Wood as a source of energy The overall energy consumption by source in Sri Lanka is given in Figure 4.
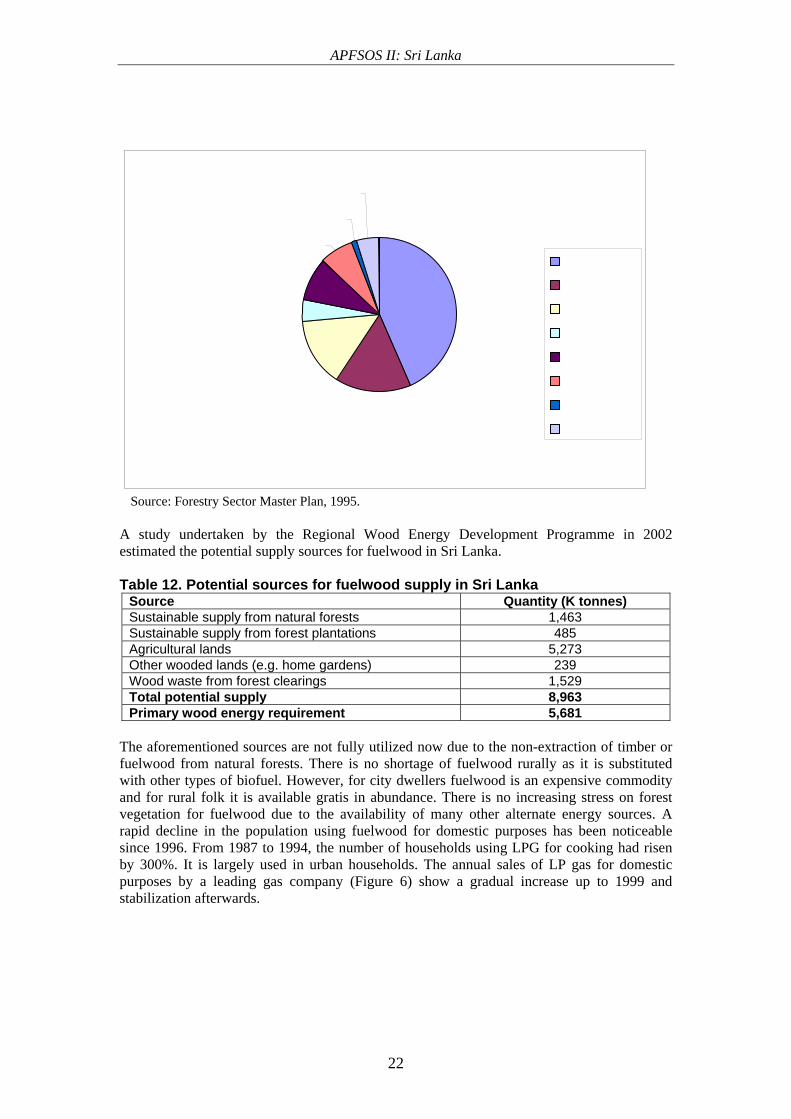
As no fossil fuel extraction is done in Sri Lanka, about 15% of the earned foreign currency resources are utilized to import petroleum products, which contribute 34% of the total energy requirement. Fifty-seven percent of the total energy requirement is met from biomass, of which 48% is fuelwood extracted from various sources. The balance consists of agricultural and wood residues. Wood-based material such as saw dust is underutilized as a source of energy. Another alternative source of energy, coir dust, is largely exported to foreign markets as a soil stabilizing material in plant nurseries. Results of recent studies on the consumption of fuelwood in the energy sector are not available and therefore only estimates could be made. Fuelwood and other biomass are the most common energy sources used in households. The Forestry Sector Master Plan (1995) has estimated the daily consumption of fuelwood per person as 1.35 kg. Of the energy consumed in households, fuelwood and other bio-energy sources accounted for 87%. In the industrial sector, 49% of the energy requirements were met with fuelwood. The distribution of fuelwood consumption by various industrial sub-sectors is given in Figure 5.
APFSOS II: Sri Lanka
22
Source: Forestry Sector Master Plan, 1995. A study undertaken by the Regional Wood Energy Development Programme in 2002 estimated the potential supply sources for fuelwood in Sri Lanka. Table 12. Potential sources for fuelwood supply in Sri Lanka
Source Quantity (K tonnes) Sustainable supply from natural forests 1,463 Sustainable supply from forest plantations 485 Agricultural lands 5,273 Other wooded lands (e.g. home gardens) 239 Wood waste from forest clearings 1,529 Total potential supply 8,963 Primary wood energy requirement 5,681
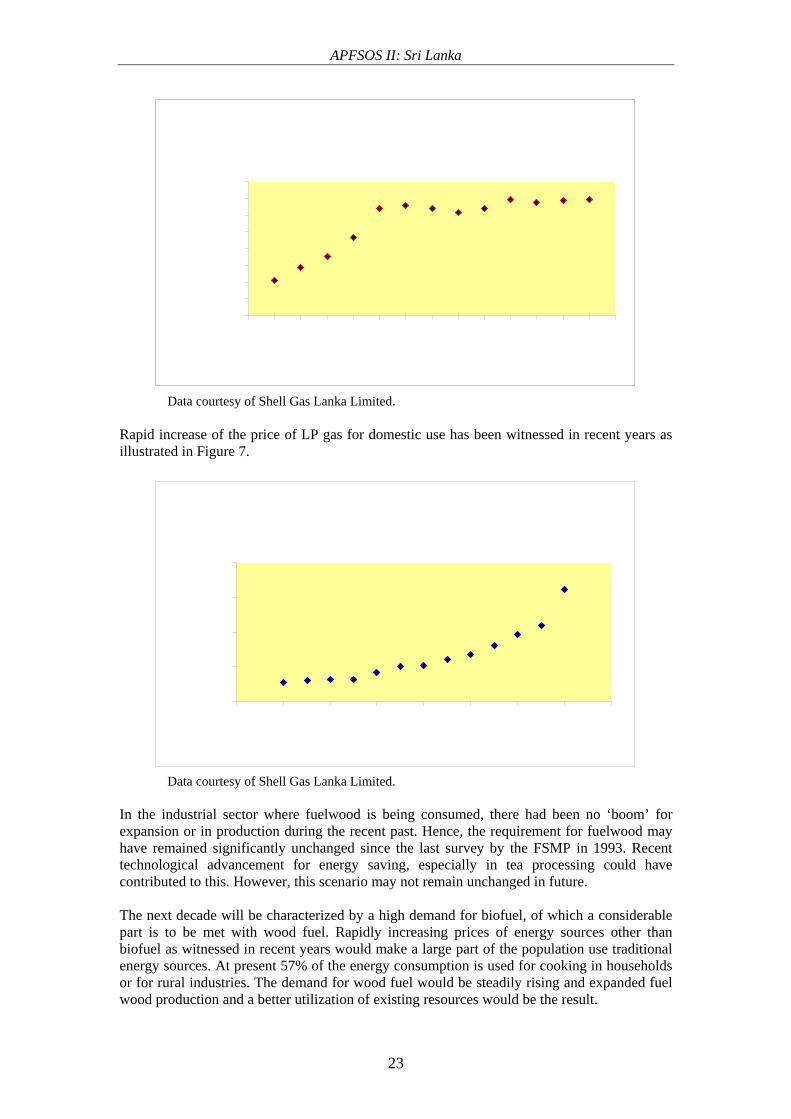
The aforementioned sources are not fully utilized now due to the non-extraction of timber or fuelwood from natural forests. There is no shortage of fuelwood rurally as it is substituted with other types of biofuel. However, for city dwellers fuelwood is an expensive commodity and for rural folk it is available gratis in abundance. There is no increasing stress on forest vegetation for fuelwood due to the availability of many other alternate energy sources. A rapid decline in the population using fuelwood for domestic purposes has been noticeable since 1996. From 1987 to 1994, the number of households using LPG for cooking had risen by 300%. It is largely used in urban households. The annual sales of LP gas for domestic purposes by a leading gas company (Figure 6) show a gradual increase up to 1999 and stabilization afterwards.
APFSOS II: Sri Lanka
23
Data courtesy of Shell Gas Lanka Limited.
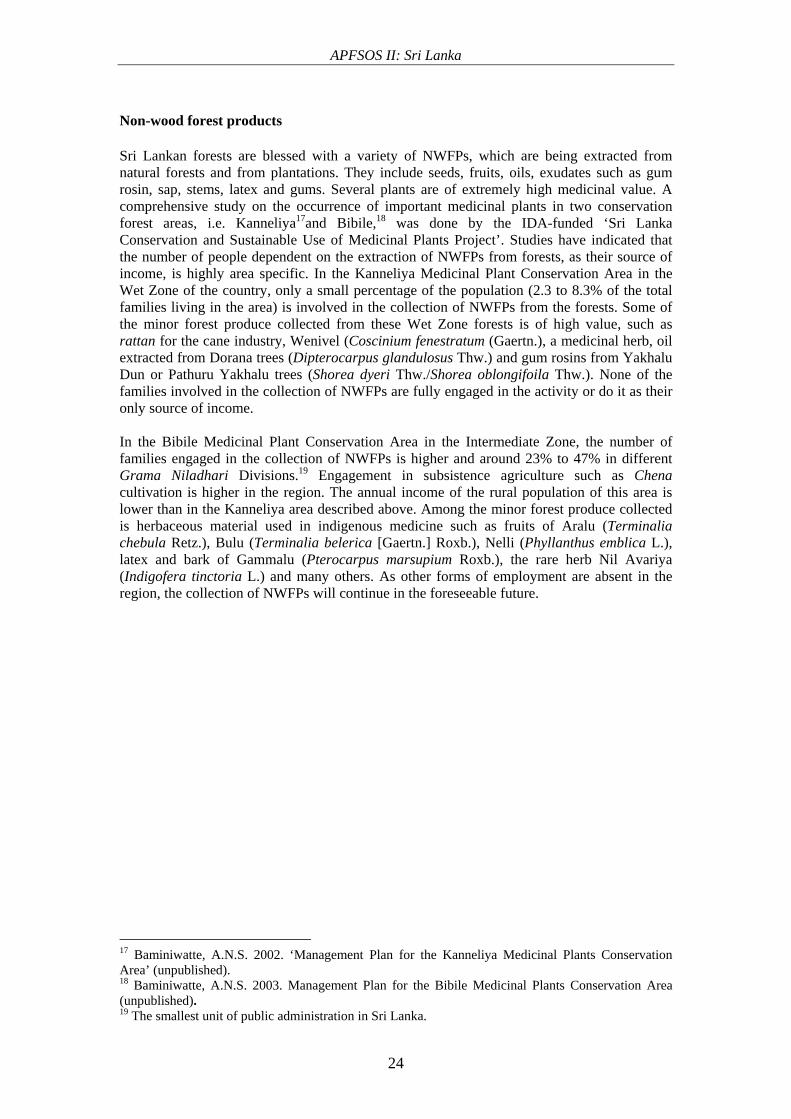
Rapid increase of the price of LP gas for domestic use has been witnessed in recent years as illustrated in Figure 7.
Data courtesy of Shell Gas Lanka Limited.
In the industrial sector where fuelwood is being consumed, there had been no ‘boom’ for expansion or in production during the recent past. Hence, the requirement for fuelwood may have remained significantly unchanged since the last survey by the FSMP in 1993. Recent technological advancement for energy saving, especially in tea processing could have contributed to this. However, this scenario may not remain unchanged in future. The next decade will be characterized by a high demand for biofuel, of which a considerable part is to be met with wood fuel. Rapidly increasing prices of energy sources other than biofuel as witnessed in recent years would make a large part of the population use traditional energy sources. At present 57% of the energy consumption is used for cooking in households or for rural industries. The demand for wood fuel would be steadily rising and expanded fuel wood production and a better utilization of existing resources would be the result.
APFSOS II: Sri Lanka
24
Non-wood forest products Sri Lankan forests are blessed with a variety of NWFPs, which are being extracted from natural forests and from plantations. They include seeds, fruits, oils, exudates such as gum rosin, sap, stems, latex and gums. Several plants are of extremely high medicinal value. A comprehensive study on the occurrence of important medicinal plants in two conservation forest areas, i.e. Kanneliya17and Bibile,18 was done by the IDA-funded ‘Sri Lanka Conservation and Sustainable Use of Medicinal Plants Project’. Studies have indicated that the number of people dependent on the extraction of NWFPs from forests, as their source of income, is highly area specific. In the Kanneliya Medicinal Plant Conservation Area in the Wet Zone of the country, only a small percentage of the population (2.3 to 8.3% of the total families living in the area) is involved in the collection of NWFPs from the forests. Some of the minor forest produce collected from these Wet Zone forests is of high value, such as rattan for the cane industry, Wenivel (Coscinium fenestratum (Gaertn.), a medicinal herb, oil extracted from Dorana trees (Dipterocarpus glandulosus Thw.) and gum rosins from Yakhalu Dun or Pathuru Yakhalu trees (Shorea dyeri Thw./Shorea oblongifoila Thw.). None of the families involved in the collection of NWFPs are fully engaged in the activity or do it as their only source of income. In the Bibile Medicinal Plant Conservation Area in the Intermediate Zone, the number of families engaged in the collection of NWFPs is higher and around 23% to 47% in different Grama Niladhari Divisions.19 Engagement in subsistence agriculture such as Chena cultivation is higher in the region. The annual income of the rural population of this area is lower than in the Kanneliya area described above. Among the minor forest produce collected is herbaceous material used in indigenous medicine such as fruits of Aralu (Terminalia chebula Retz.), Bulu (Terminalia belerica [Gaertn.] Roxb.), Nelli (Phyllanthus emblica L.), latex and bark of Gammalu (Pterocarpus marsupium Roxb.), the rare herb Nil Avariya (Indigofera tinctoria L.) and many others. As other forms of employment are absent in the region, the collection of NWFPs will continue in the foreseeable future.
17 Baminiwatte, A.N.S. 2002. ‘Management Plan for the Kanneliya Medicinal Plants Conservation Area’ (unpublished). 18 Baminiwatte, A.N.S. 2003. Management Plan for the Bibile Medicinal Plants Conservation Area (unpublished). 19 The smallest unit of public administration in Sri Lanka.
APFSOS II: Sri Lanka
25
The Forest Department issues permits in a regulated manner for the extraction of some NWFPs from forests such as rattan or for the tapping of the Kithul palm. According to FD records the overall demand for NWFPs has declined over the past two decades. This may attributed to the change of socio-economic status and the availability of alternate income generating activities in other sectors. A more rational approach for the extraction of NWFPs from government forests is foreseen under the revised Forest Act. In the zoning of conservation forests for the preparation of management plans, special zones will be designated for sustainable extraction of NWFPs by the local population. An expansion of the production of NWFPs from natural forests is not to be anticipated, unless they are enriched with selected varieties. Extraction of oleoresin from Caribbean pine plantations, an activity that commenced in the mid-1980s, is continuing with private collaboration. Currently, 3,932 ha of pine plantations in the island are being tapped by five companies on ten-year lease agreements. However, due to the policy of the FD on converting pine forests with other suitable tree species, resin tapping will gradually cease as an economic activity during the next decade.
Conservation Forestry and Indigenous Medical Practices
Sri Lankan heritage is much characterized by an indigenous system of medicine, which has been in practice since ancient times. It has been influenced by the Ayurveda system of medicine of North India, Siddha system of South India and the Unani system of the Arabs. It has been reported that nearly 17,000 traditional and Ayurvedic medical practitioners are currently available in the country. Only 30% of them have received a formal education in their specific discipline, while the others have been trained by their Gurus. A large part of the population adheres to indigenous medical practices.
A remarkable characteristic of the indigenous system of medicine is the higher dependency on plant material. Almost all the plant parts such as roots, bark, leaves, fruits, seeds or stem of selected medicinal plant species are used for medicinal preparations. In addition, plant exudates such as latex of certain trees and plant oils are used to treat certain ailments.
A large number of medicinal plants grow in Sri Lankan forests and therefore conservation efforts are needed to ensure the sustainability of this wealth of medicinal plants. Some of these are harvested on the basis of a permit system. Their conservation and management will be a priority during the next decade and strategies need to be developed to utilize these plants in a sustainable manner. As mentioned in the main text, the degree of dependency by the local inhabitants on the collection of medicinal plants is location specific and the planners need to consider this aspect during the preparation of management plans. In the recent past efforts have been made to domesticate certain rare and endangered medicinal plants such as Nil Avariya (Indigofera tinctoria L.) and Bin Kohomba (Munronia pinnata Wight) by certain institutions, but a significant outcome has not been reported. The Department of Indigenous Medicine maintains five herbal gardens with a limited number of medicinal plants species in different locations. Large-scale cultivation of the important medicinal plants outside the forests is not being undertaken. A large quantity of ingredients of plant origin for the preparation of Ayurvedic medicines is imported, mainly from India.
Ayurvedic practices have now gained an important place in the tourist industry. Many westerners visit Sri Lanka for Ayurvedic treatment bringing substantial income to the country. Many tourist hotels are now equipped with facilities for Ayurvedic treatment. Therefore, conservation forest management has a significant effect on the indigenous medicine in Sri Lanka and will be a priority area during the coming decade.
APFSOS II: Sri Lanka
26
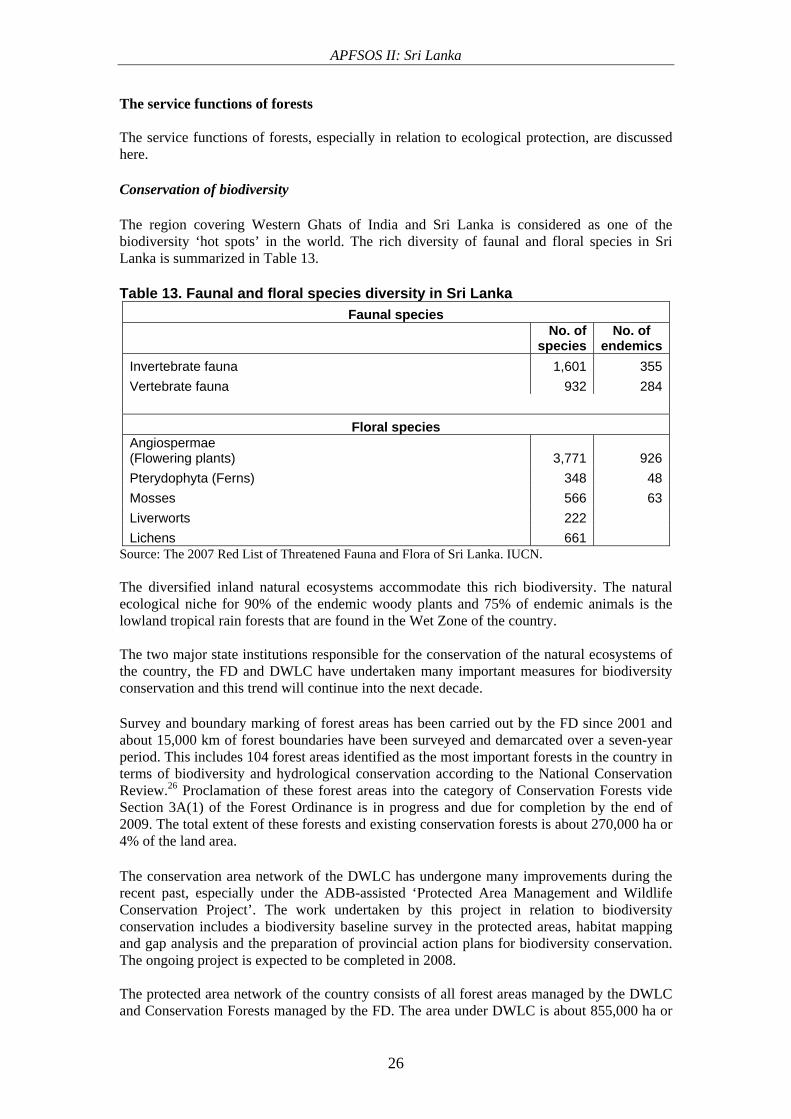
The service functions of forests The service functions of forests, especially in relation to ecological protection, are discussed here. Conservation of biodiversity The region covering Western Ghats of India and Sri Lanka is considered as one of the biodiversity ‘hot spots’ in the world. The rich diversity of faunal and floral species in Sri Lanka is summarized in Table 13. Table 13. Faunal and floral species diversity in Sri Lanka
Faunal species
No. of
species No. of
endemicsInvertebrate fauna 1,601 355Vertebrate fauna 932 284
Floral species Angiospermae (Flowering plants) 3,771 926Pterydophyta (Ferns) 348 48Mosses 566 63Liverworts 222 Lichens 661
Source: The 2007 Red List of Threatened Fauna and Flora of Sri Lanka. IUCN. The diversified inland natural ecosystems accommodate this rich biodiversity. The natural ecological niche for 90% of the endemic woody plants and 75% of endemic animals is the lowland tropical rain forests that are found in the Wet Zone of the country. The two major state institutions responsible for the conservation of the natural ecosystems of the country, the FD and DWLC have undertaken many important measures for biodiversity conservation and this trend will continue into the next decade. Survey and boundary marking of forest areas has been carried out by the FD since 2001 and about 15,000 km of forest boundaries have been surveyed and demarcated over a seven-year period. This includes 104 forest areas identified as the most important forests in the country in terms of biodiversity and hydrological conservation according to the National Conservation Review.26 Proclamation of these forest areas into the category of Conservation Forests vide Section 3A(1) of the Forest Ordinance is in progress and due for completion by the end of 2009. The total extent of these forests and existing conservation forests is about 270,000 ha or 4% of the land area. The conservation area network of the DWLC has undergone many improvements during the recent past, especially under the ADB-assisted ‘Protected Area Management and Wildlife Conservation Project’. The work undertaken by this project in relation to biodiversity conservation includes a biodiversity baseline survey in the protected areas, habitat mapping and gap analysis and the preparation of provincial action plans for biodiversity conservation. The ongoing project is expected to be completed in 2008. The protected area network of the country consists of all forest areas managed by the DWLC and Conservation Forests managed by the FD. The area under DWLC is about 855,000 ha or
APFSOS II: Sri Lanka
27
13% of the land area while the extent of Conservation Forests managed by the FD is about 270,000 ha or 4% of the land area. As such 17% of the land area is currently under the protected area network and this will increase with the further proclamation of new forest areas into the category of Conservation Forests. Watershed protection Being an agricultural country and a producer of hydroelectricity, Sri Lanka relies much on sustainable water sources. Therefore, watershed protection is of utmost importance. The central highlands, with a maximum altitude of 2,524 MASL, is the origin of seven major rivers that flow in many directions through the island , before being discharged to the Indian Ocean. The conservation of all natural forests, especially on higher and lower catchments, and the establishment of protective woodlots on areas prone to heavy soil erosion and the non-harvesting of timber on areas exceeding 1,515 m elevation are a few measures undertaken by the government in the right direction for watershed protection. The agricultural extension services promote best cultural practices to farmers to mitigate high soil erosion. Most of the critical watersheds in the uplands fall within the protected area network of the DWLC (e.g. Horton Plains, Peak Wilderness). Coastal zone protection The importance of coastal zone protection by vegetative measures came into limelight in the aftermath of the 2004 tsunami, which took many human lives and devastated many coastal resources and infrastructure. Coastal afforestation for the establishment of protective shelterbelts commenced under the project ‘Forestry Programme for Early Rehabilitation in Asian Tsunami Affected Countries’ (2006-2007) implemented with the technical assistance of FAO. Nearly 120 ha of coastal shelterbelts have been established in vulnerable coastal areas, especially by planting Casuarina sp. The establishment of such coastal shelterbelts exercises several positive impacts on the environment such as the fixation of sand dunes and the prevention of the effect of sea breeze. In the latter instance, this could lead to change of land use patterns in the hinterland, by increasing the extent of arable lands or settlements. This has been observed especially at Hambantota (Mirijjavila) and in Ampara Districts. The future scope of this work is rather limited due to land scarcity suitable for coastal plantings. The proclamation of 15 important mangrove areas in the west and the southern coastal belt as Conservation Forests is an important step towards coastal zone protection. Ecotourism Ecotourism is an activity that has gained momentum in recent times and the role of forests under the management of the FD and the DWLC is quite significant in this respect. Currently the FD maintains several major forests as recreational areas20 for the public. The revenue to the government from the visitors to these areas amounted to Rs.6.3 million in 2007. There were 55,529 visitors. Improvement of infrastructural facilities to these conservation areas has been recently undertaken. The total number of visitors for 2007 seems to be below the potential level, but could be improved by publicity campaigns. The potential exists to designate more areas for ecotourism out of the other forests managed by the FD.
20 The areas designated currently for ecotourism by the FD include: Sinharaja world heritage site (Sabaragamuwa and Southern Provinces), Udawattakelle (Kandy), Kottawa and Kanneliya (Southern Province), Knuckles International Biosphere Reserve (Central Province) and Hurulu Reserve (North Central Province).
APFSOS II: Sri Lanka
28
Contrary to the FD, the DWLC has a higher turnover of visitors to the national parks and the other protected areas. In 2005, the DWLC earned revenue of Rs.197 million, which was higher than the annual budget for the department itself. Due to the security situation prevailing in the country, this higher income may have somewhat declined during the following years. The number of visitors to forest areas has not been changed significantly over the last few years. With the improved security situation, as a result of liberating the areas under the control of a separatist movement over the last three decades, a significant increase in both local and foreign visitors is anticipated. Current status of protected area management by the DWLC In recent times the DWLC has undertaken many significant steps that are necessary for efficient protected area management. The protected area network of the DWLC consists of National Parks (18), Sanctuaries (56), Strict Nature Reserves (3) and Nature Reserves (7). The steps undertaken are outlined below.
• The Fauna and Flora Protection Ordinance (FFPO) has been revised by an amended act and the cabinet approved it on 12 March 2008. Approval by parliament is expected in May 2008. This revision took place after nearly 28 years since the last amendment in 1970 and includes new features such as making management plans for the national reserves or sanctuaries mandatory, assessment of impacts of activities within national reserves and sanctuaries and the restriction of development activities within one mile of a National Reserve and many other new features
• The DWLC is on the verge of decentralization. As the result of a restructuring programme, central and regional administration has been strengthened by appointing new staff of professional grades and expanding the number of cadre positions. Financial, management and administration functions have been so far delegated to the regions
• Boundary redefinition of 8 National Parks was done by resurveying and mapping a total length of 627 km with assistance provided by the Protected Area and Wildlife Management Project of ADB
• Management plans for nine conservation areas have been prepared with assistance rendered by the same project. Updating of these plans has been delegated to the regional wildlife administration
• A new feature is the establishment of CBOs in the buffer zones of eight major conservation areas and providing them with micro credit facilities to establish new ventures. The Protected Area Conservation Fund (PACF) has provided assistance to the fringe dwellers of selected protected areas to establish ventures such as carpentry work, poultry farming, retail shops, computer training centres, and manufacturing dairy products. In one instance, the project has assisted in the establishment of a mini hydroelectricity station.
The government’s commitment to international conventions and agreements The government is very keen on environment-related matters and is committed to honouring the international conventions and agreements on biodiversity and conservation. This includes the UNESCO Man & Biosphere Programme (1970), Convention on International Trade in Endangered Species of Wild Flora and Faun, CITES (1979), World Heritage Convention (1980), Ramsar Wetland Convention (1990), Convention on Climate Change (1992), Kyoto Protocol on Climate Change(2002), Convention on Biological Diversity (1992) and many
APFSOS II: Sri Lanka
29
others. An international convention on conservation of marine life has been signed by the government but has yet to be ratified. The state institutions and policy In order to utilize the productive, protective and aesthetic functions of forests in a more fruitful manner, the state maintains the following institutional infrastructure. The Forest Department The FD is the state institution which is responsible for the management, protection and the development of forest resources in the island. It is an entity which has enjoyed 120 years of productive work. The Forest Ordinance21 empowers the forest officers to enact its provisions with the objective of protecting the national forest resources. The territorial administrative units of the FD follow a strict hierarchical order, starting from the ‘region’ and followed by the units of ‘Divisions’, ‘Ranges’ and ‘Beats’. The country consists of 25 administrative districts, and with the exception of the districts of Jaffna, Mullaitivu, Mannar and Kilinochchi in the north and Colombo, all other administrative districts are declared as forestry divisions and follow their boundaries. Hierarchically , the second level unit for public administration of a district is the ‘Divisional Secretary Division’ and the discrepancies between the forest range boundaries and these units have been rectified in the past considering the practicalities for efficient work coordination. The most primary unit of the forestry administration is the ‘Beat’. The Beat Forest Officers in charge of ‘beats’ are assisted by Forest Field Assistants. The FD has now commenced redefining the boundaries of ‘beats’ within a range in a rational manner on a pilot scale, by considering the current status of staff availability and the service requirements, especially in relation to forest protection. The FD coordinates and implements its activities centrally from the Head Office. In 2003, decentralization of work commenced with the formation of four forestry regions, each headed by a Senior Deputy Conservator of Forests. The regional administration has been delegated with certain powers to implement some selected activities. The main stream of the FD consists of seven technical divisions to implement the activities related to the following functional groups, namely forestry education, forestry research, production forestry, social forestry and extension, conservation forestry, protection and law enforcement and planning and monitoring. The financial and the administrative divisions provide the necessary support services for the implementation of these tasks. The present institutional framework of the FD with the details of the allocated staff, especially of the supervisory capacity, is given in Annex 2. Since the promulgation of the first forest policy in 1929, the national forest policy of Sri Lanka has evolved through many revisions on several occasions (in 1935, 1945, 1953 and 1980) up to the last policy promulgation in 1995. At the early stages, the policy emphasis was more on timber and firewood production, but environmental protective measures such as the
21 The Forest Ordinance was first enacted in 1907 during British rule and was subjected to many revisions subsequently. The last revision was in 1995 empowering the minister to declare ecologically important forests as ‘conservation forests’.
APFSOS II: Sri Lanka
30
prevention of land degradation or water conservation were not excluded. The Forest Policy22 promulgated in 1980 emphasized the great need for sustainable management of forest resources to supply timber and fuelwood and in the involvement of local communities in development of private woodlots and forest farms through a programme of social forestry. The promulgation of this policy was the first occasion in which the concerns regarding amelioration and preservation of the environment related to forestry and the involvement of the local communities had been sufficiently addressed.
The concern regarding depletion of forest resources at global and national levels and other reasons necessitated the promulgation of a new Forest Policy in 1995. The main objectives of the present policy are:
• To conserve forests for posterity, with particular regard to biodiversity, soils, water, and historical, cultural, religious and aesthetic values
• To increase the tree cover and productivity of forests to meet the needs of present and future generations for forest products and services
• To enhance the contribution of forestry to the welfare of the rural population, and strengthen the national economy, with special attention to equity in economic development
As this policy determines the future course of forestry development in this country during the next decade, the complete text on the policy and the strategies for implementation are given in Annex 3 for further reference. The Department of Wildlife Conservation Wildlife management was initially a task of the Forest Department, but was separated in 1949 due to the formation of the Department of Wildlife Conservation. As indicated earlier, a certain part of the forests and the other forms of the natural habitats fall within the purview of the DWLC. The State Timber Corporation The STC was established in 1968, ending the long-term role of the FD in timber harvesting and marketing. It is the sole authority for timber harvesting in the country. It harvests and markets timber from plantations released annually by the FD. The old system of paying royalty for the converted timber by the STC is now being replaced by the payment of stumpage values of timber. The STC is well equipped with machinery and trained staff for timber harvesting and is organized island-wide for the purpose. The Central Environmental Authority The Central Environmental Authority (CEA) was established by the National Environmental Act No. 47 of 1980. It is empowered to make provisions for the protection and management of the environment and matters connected therewith or thereto. Vide the act, the role of the CEA in relation to forestry is to recommend the minister in charge about the following systems with assistance of the ministry in charge of forestry.
(a) (i) rational exploitation of forest resources, (ii) regulation of the marketing of threatened forest resources,
22 Nanayakkara, V.R. 1982. ‘Forests-Policies and Strategies for Development’ The Sri Lanka Forester, Volume XV, Nos.1 & 2.
APFSOS II: Sri Lanka
31
(iii) conservation of threatened species of flora, and the encouragement of citizen participation therewith to keep the country’s forest resources at maximum productivity at all times, (b) promoting a continuing effort on reforestation, timber stand improvement, forest protection, land classification, forest occupancy management, industrial tree plantation, parks and wildlife management, multiple use forest, timber management and forest research.
However, in the forestry sector the role of the CEA is confined practically to the approval of the following activities based on the environmental impact assessment or initial environmental examination (vide Provisions of the National Environmental Act No. 47 of 1980 as contained in Gazette Extraordinary No.772/22 dated 24 June 1993).
i Extraction of timber covering land area exceeding 5 hectares. ii Conversion of forests covering an area exceeding 1 hectare into non-forest uses. iii Reclamation of land, wetland area exceeding 4 hectares. iv Clearing of land areas exceeding 50 hectares
Other stakeholders Local administration The forestry administration maintains links with other local administrative bodies, especially with the Divisional Secretariats. The Divisional Secretariats play a vital role in granting permission for the felling of some tree species, i.e. Jak (Artocarpus integrifolia), Wal Del (Artocarpus nobilis) and palmyra (Borassus flabellifer), which have a high food value. Granting permits for a large number of timber species originating from private lands is done also by the Divisional Secretaries. In both cases, it is done with the collaboration of the FD. For forestry extension activities collaboration with Divisional Secretariats, schools and other state institutions is necessary. Community-based organizations There is no large-scale involvement of CBOs in the forestry sector. Work undertaken by CBOs so far occurs on a minor scale such as raising seedlings in temporary nurseries, under-planting with utility species, forest boundary maintenance, processing of medicinal plants etc. Most of the implemented work has received financial support from foreign-funded projects and the scope of work was limited only to the project duration. However, the establishment of community woodlots has been successful in some areas. Compared to many other countries in the region, forest dependency is very low in Sri Lanka and people are not living inside the forests. There are no clearly identifiable ‘forest communities’ who are largely depending on forests for their day to day needs. These factors and the availability of alternate income generating activities outside the forests may have contributed to the low level of community participation. Private tree growers
The private tree growers can be categorized as:
i. Private individuals who have obtained lands from the FD on 30-year leases under a special reforestation scheme in the Dry Zone. The area of a land parcel varies from 5-100 ha and the total extent of lands leased under this scheme is around 1,500 ha. Intercropping was practiced during the initial years of plantation establishment. The most common tree species that has been planted is teak.
APFSOS II: Sri Lanka
32
ii. Regional Plantation Companies who has undertaken reforestation work in their lands. Details are given in under ‘Other Tree Resources’ in Section 2.
iii. A few private companies offer small plots of lands stocked with teak or mahogany seedlings to the public on long-term leases forecasting higher incomes for timber by the end of the lease period.
The contribution by private tree growers is only a minute part of the total plantation growing stock. Trends in forest resources In order to obtain a better understanding of the future status of forestry and forest resources, it is necessary to analyse the present trends in relation to forest resources. These trends are of institutional, political or of social origin, sometimes interrelated and not completely free from the influence of global concerns. The major trends related to forest resources are outlined below. Growing concern on the importance of forests among the public The importance of the natural forest cover, especially in relation to its environmental significance, has gained a significant position among the public. The logging of the Sinharaja rain forests during the latter part of the 1970s caused a huge outcry from various strata of the society and the then government appointed a special committee to look into the matter. The new government elected in 1977 was compelled to terminate the logging operations in the Sinharaja forest and to undertake conservation measures. This unique forest, which is rich in biodiversity, was declared as a Biosphere Reserve in 1978 and World Heritage Site in 1988. Increasingly being presented in school curricula, the environmental significance of forests is felt also at the primary level of the society. In certain instances, farmer communities have protested against the logging of mature forest plantations in the vicinity of their cultivated lands. One such area is an old mixed mahogany plantation in closer proximity to the city of Kurunegala planted in the 1930s; it has now reached an uneven aged stand structure and resembles a natural forest. In another instance, a farming community has protested at the removal of a mature forest stand in closer proximity to its cultivated land. Ironically, this stand consisted of eucalypts, a kind of tree opposed by certain groups of ‘environmentalists’ as thoroughly ‘disastrous’ to the environment.
Establishment of a permanent forest estate Defining a permanent forest estate for the island under the jurisdiction of the FD is an essential pre-requisite for the intensive management of the island’s forest resources. A ‘permanent forest estate’ is a valid concept needed for better forest management and administration. The ongoing re-demarcation of all forest boundaries by the Forest Resources Management Project with financial assistance provided by the ADB is a move towards the right direction as it facilitates the formation of a permanent forest estate. Policy decisions of the government and declarations The present forest policy of the government emphasizes conservation, especially of the natural forests. This is much reflected in the forest policy of 1995 and in proposed amendments to the Forest Ordinance. In addition to the existing ones, most of the natural forests are classified as Conservation Forests. A major policy decision towards conservation was undertaken by the government in 1990, by imposing a logging ban in the Wet Zone natural forests, which has also been extended to the natural forests in the other areas of the island.
APFSOS II: Sri Lanka
33
Since 2000, the government has declared many forest areas and unique ecosystems as conservation forests vide Section 3A(1) of the Forest Ordinance. This includes 15 mangrove areas in the western and southern coastline (2000-2002), Knuckles Conservation Area (2000) and Ranavakanda in 2005. It is anticipated that this trend will be continued. Systematic survey and boundary marking of natural forests is currently underway and many forest areas are due to be declared as Conservation Forests based on the findings of the National Conservation Review during 2009. Decentralization of administrative and technical activities The trend for the decentralization will continue but will be dependent on any change in the political infrastructure that could arise in the future. Prioritizing the participatory approach During the past two decades, efforts have been made to deviate from the orthodox system of forest practices by absorbing local communities into planning, decision making and implementation of local forestry activities. The national forest policy of 1995 promotes the formation of partnerships with local people, rural communities and other stakeholders where appropriate. Participatory approaches are now an integral component in forest practices, especially in implementing donor-assisted projects. Establishment of timber and fuelwood plantations, agro-forestry woodlots, delineation and protection of forest boundaries, mangrove management and ecotourism are some recent spheres implemented with community participation with varying degrees of success. During the next two decades, stakeholder participation will remain a major tool in the implementation of many forestry operations. Technological advances The forestry practices in the country move in line with technological development, especially in the field of information technology. This relates especially to the activities of the Forest Management and Inventory Division, which is responsible for the sustainable management of forest resources. For the most part, the conventional compass and chain surveys are now replaced by GPS surveys. Forest boundaries are being digitized and incorporated into a GIS database. The old database on forest plantations (FORDATA) is now being replaced by a new plantation database (FORMPLAN) prepared using the latest database management software. Once completed, this database will be coupled with the plantation map database. Efforts are underway to investigate the feasibility of using high resolution satellite imagery for forest mapping by replacing the conventional black and white panchromatic aerial photographs used in the past. Changes are also foreseen in the production forestry sector, especially by improving nursery practices. This would include the use of high grade certified seeds, better germination and growing media, seedling grading and the vegetative propagation of the main plantation species etc. As total extent of lands devoted for forest plantations cannot be expanded due to land scarcity, the productive potential of the available lands has to be utilized more fruitfully. Under this context, large areas of failed plantations are being restored by converting them to productive stands by improved site preparation, optimum species selection, better tending after planting and protection from destructive agents. Forestry research
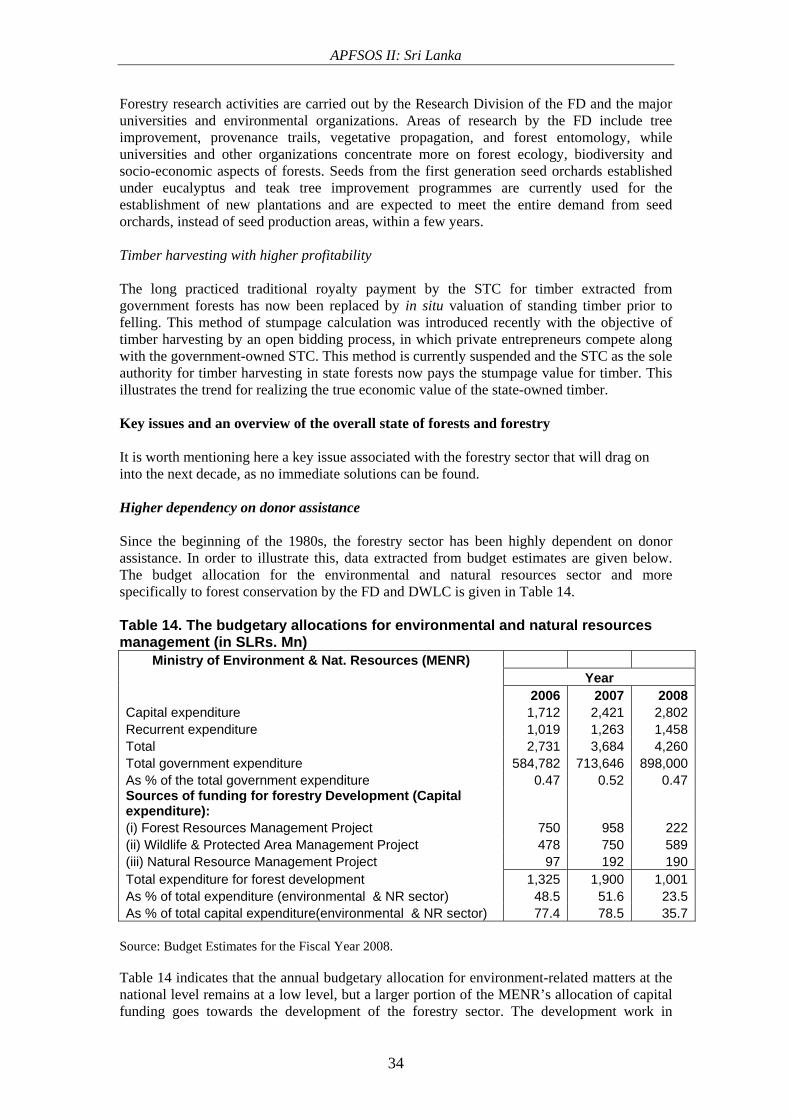
APFSOS II: Sri Lanka
34
Forestry research activities are carried out by the Research Division of the FD and the major universities and environmental organizations. Areas of research by the FD include tree improvement, provenance trails, vegetative propagation, and forest entomology, while universities and other organizations concentrate more on forest ecology, biodiversity and socio-economic aspects of forests. Seeds from the first generation seed orchards established under eucalyptus and teak tree improvement programmes are currently used for the establishment of new plantations and are expected to meet the entire demand from seed orchards, instead of seed production areas, within a few years. Timber harvesting with higher profitability The long practiced traditional royalty payment by the STC for timber extracted from government forests has now been replaced by in situ valuation of standing timber prior to felling. This method of stumpage calculation was introduced recently with the objective of timber harvesting by an open bidding process, in which private entrepreneurs compete along with the government-owned STC. This method is currently suspended and the STC as the sole authority for timber harvesting in state forests now pays the stumpage value for timber. This illustrates the trend for realizing the true economic value of the state-owned timber. Key issues and an overview of the overall state of forests and forestry It is worth mentioning here a key issue associated with the forestry sector that will drag on into the next decade, as no immediate solutions can be found. Higher dependency on donor assistance Since the beginning of the 1980s, the forestry sector has been highly dependent on donor assistance. In order to illustrate this, data extracted from budget estimates are given below. The budget allocation for the environmental and natural resources sector and more specifically to forest conservation by the FD and DWLC is given in Table 14. Table 14. The budgetary allocations for environmental and natural resources management (in SLRs. Mn)
Ministry of Environment & Nat. Resources (MENR) Year 2006 2007 2008Capital expenditure 1,712 2,421 2,802Recurrent expenditure 1,019 1,263 1,458Total 2,731 3,684 4,260Total government expenditure 584,782 713,646 898,000As % of the total government expenditure 0.47 0.52 0.47Sources of funding for forestry Development (Capital expenditure): (i) Forest Resources Management Project 750 958 222(ii) Wildlife & Protected Area Management Project 478 750 589(iii) Natural Resource Management Project 97 192 190Total expenditure for forest development 1,325 1,900 1,001As % of total expenditure (environmental & NR sector) 48.5 51.6 23.5As % of total capital expenditure(environmental & NR sector) 77.4 78.5 35.7
Source: Budget Estimates for the Fiscal Year 2008. Table 14 indicates that the annual budgetary allocation for environment-related matters at the national level remains at a low level, but a larger portion of the MENR’s allocation of capital funding goes towards the development of the forestry sector. The development work in

APFSOS II: Sri Lanka
35
relation to the forestry sector is very much dependent on donor assistance. The estimates for the development work in 2008 have been reduced in comparison to the previous two years, as the contribution by the Forest Resources Management Project funded by the ADB has been reduced. This project with a duration of seven years has now reached its final year. Donor assistance to the forestry sector has been a very significant event in past. Due to the present stage of development in the country, especially in the economic sphere where the availability of local funding is constrained, this will remain as a necessity in years to come. Donor assistance for forestry development work will remain a major requirement also during the next decade.
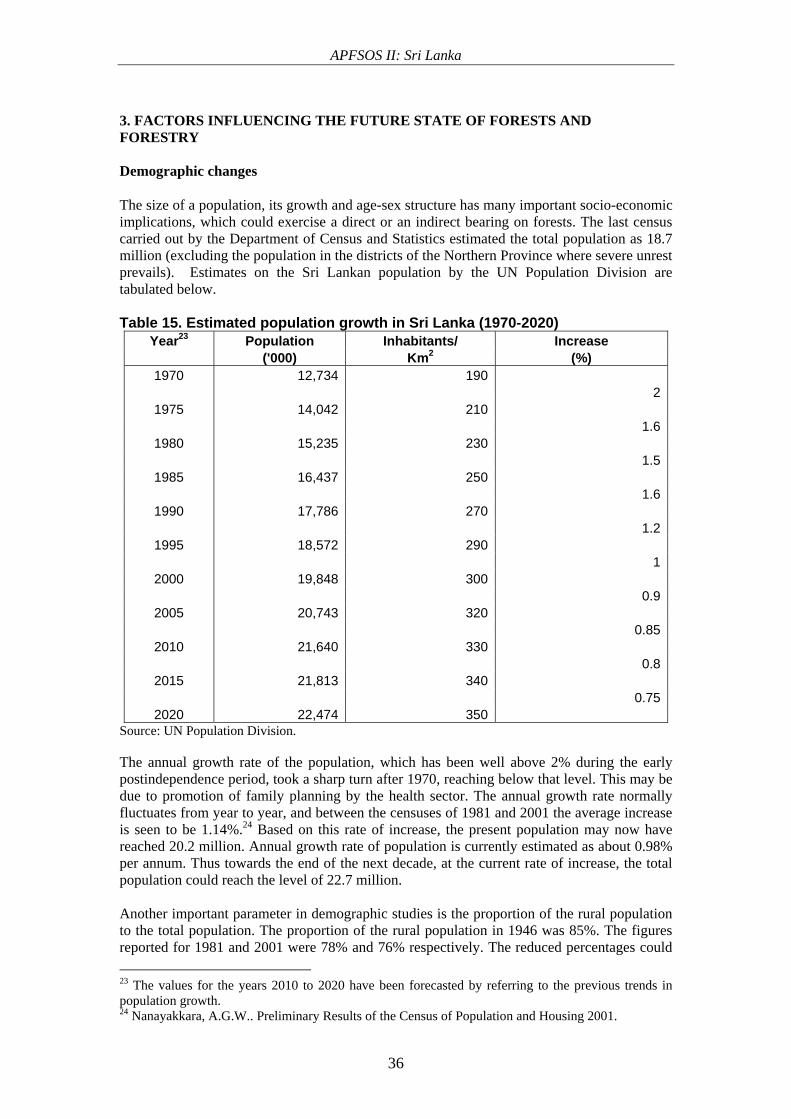
APFSOS II: Sri Lanka
36
3. FACTORS INFLUENCING THE FUTURE STATE OF FORESTS AND FORESTRY Demographic changes The size of a population, its growth and age-sex structure has many important socio-economic implications, which could exercise a direct or an indirect bearing on forests. The last census carried out by the Department of Census and Statistics estimated the total population as 18.7 million (excluding the population in the districts of the Northern Province where severe unrest prevails). Estimates on the Sri Lankan population by the UN Population Division are tabulated below. Table 15. Estimated population growth in Sri Lanka (1970-2020)
Year23 Population Inhabitants/ Increase ('000) Km2 (%)
1970 12,734 190 2
1975 14,042 210 1.6
1980 15,235 230 1.5
1985 16,437 250 1.6
1990 17,786 270 1.2
1995 18,572 290 1
2000 19,848 300 0.9
2005 20,743 320 0.85
2010 21,640 330 0.8
2015 21,813 340 0.75
2020 22,474 350 Source: UN Population Division. The annual growth rate of the population, which has been well above 2% during the early postindependence period, took a sharp turn after 1970, reaching below that level. This may be due to promotion of family planning by the health sector. The annual growth rate normally fluctuates from year to year, and between the censuses of 1981 and 2001 the average increase is seen to be 1.14%.24 Based on this rate of increase, the present population may now have reached 20.2 million. Annual growth rate of population is currently estimated as about 0.98% per annum. Thus towards the end of the next decade, at the current rate of increase, the total population could reach the level of 22.7 million. Another important parameter in demographic studies is the proportion of the rural population to the total population. The proportion of the rural population in 1946 was 85%. The figures reported for 1981 and 2001 were 78% and 76% respectively. The reduced percentages could 23 The values for the years 2010 to 2020 have been forecasted by referring to the previous trends in population growth. 24 Nanayakkara, A.G.W.. Preliminary Results of the Census of Population and Housing 2001.
APFSOS II: Sri Lanka
37
be due to migration of rural folk to cities or the urbanization of certain rural areas in closer proximity to cities. The population living in urban areas of Sri Lanka is expected to be 40% of the population25 in 2020. Sri Lankan society is characterized by a higher life expectancy of the population, which has increased considerably in recent decades. The average life expectancy at birth of 63.1 years for the 1970/1975 period for both sexes had increased to 73.9 years in 2000/2005. During the same period, it increased from 61.9 years to 71.3 years for the male population. The female population, which is characterized by a higher life expectancy, had an increase of 64.7 to 73.9 years. Infant mortality per 1,000 live births decreased from 56 to 17 from 1970 to 2005. The index of ageing is rising considerably and it indicates a higher proportion of inhabitants over the age of sixty years. This may lead to the reduction of the available labour in the long run as already felt sometimes in rural areas. Literacy rates of the population of Sri Lanka are remarkably high. Enrollment in primary and secondary education is higher in the country. The environmental awareness among people is significantly notable and the higher level of education could be the reason for it. The vital role played by forests in the environmental sphere is highly recognized by society. Table 16 includes several indicators of human and social development in recent decades. Free education introduced in 1945 and social welfare undertaken by the successive governments since independence at different levels have resulted in comparatively higher standards in the health and educational sectors. It is anticipated that this phenomenon will continue during the next decade. The political and institutional environment Since independence in 1948, Sri Lanka has been ruled by many successive governments, each with its own specific political agenda, which have shifted from left to right or vice versa, probably on par with existing international political trends. Under all such political conditions, forestry has been given a high priority.
25 United Nations (1995). World Urbanization Prospects: The 1994 Revision, (New York: United Nations).
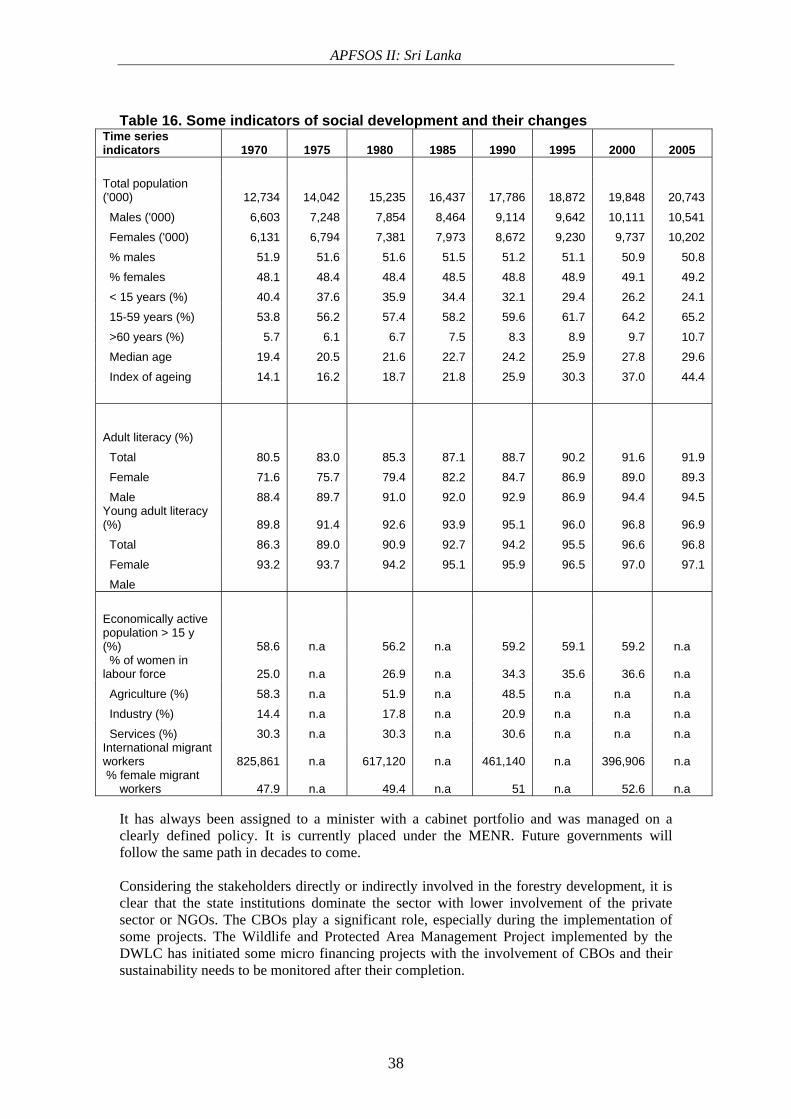
APFSOS II: Sri Lanka
38
Table 16. Some indicators of social development and their changes
Time series indicators 1970 1975 1980 1985 1990 1995 2000 2005
Total population ('000) 12,734 14,042 15,235 16,437 17,786 18,872 19,848 20,743
Males ('000) 6,603 7,248 7,854 8,464 9,114 9,642 10,111 10,541
Females ('000) 6,131 6,794 7,381 7,973 8,672 9,230 9,737 10,202
% males 51.9 51.6 51.6 51.5 51.2 51.1 50.9 50.8
% females 48.1 48.4 48.4 48.5 48.8 48.9 49.1 49.2
< 15 years (%) 40.4 37.6 35.9 34.4 32.1 29.4 26.2 24.1
15-59 years (%) 53.8 56.2 57.4 58.2 59.6 61.7 64.2 65.2
>60 years (%) 5.7 6.1 6.7 7.5 8.3 8.9 9.7 10.7
Median age 19.4 20.5 21.6 22.7 24.2 25.9 27.8 29.6
Index of ageing 14.1 16.2 18.7 21.8 25.9 30.3 37.0 44.4
Adult literacy (%) Total 80.5 83.0 85.3 87.1 88.7 90.2 91.6 91.9
Female 71.6 75.7 79.4 82.2 84.7 86.9 89.0 89.3
Male 88.4 89.7 91.0 92.0 92.9 86.9 94.4 94.5 Young adult literacy (%) 89.8 91.4 92.6 93.9 95.1 96.0 96.8 96.9
Total 86.3 89.0 90.9 92.7 94.2 95.5 96.6 96.8
Female 93.2 93.7 94.2 95.1 95.9 96.5 97.0 97.1
Male
Economically active population > 15 y (%) 58.6 n.a 56.2 n.a 59.2 59.1 59.2 n.a % of women in labour force 25.0 n.a 26.9 n.a 34.3 35.6 36.6 n.a
Agriculture (%) 58.3 n.a 51.9 n.a 48.5 n.a n.a n.a
Industry (%) 14.4 n.a 17.8 n.a 20.9 n.a n.a n.a
Services (%) 30.3 n.a 30.3 n.a 30.6 n.a n.a n.a International migrant workers 825,861 n.a 617,120 n.a 461,140 n.a 396,906 n.a % female migrant workers 47.9 n.a 49.4 n.a 51 n.a 52.6 n.a
It has always been assigned to a minister with a cabinet portfolio and was managed on a clearly defined policy. It is currently placed under the MENR. Future governments will follow the same path in decades to come. Considering the stakeholders directly or indirectly involved in the forestry development, it is clear that the state institutions dominate the sector with lower involvement of the private sector or NGOs. The CBOs play a significant role, especially during the implementation of some projects. The Wildlife and Protected Area Management Project implemented by the DWLC has initiated some micro financing projects with the involvement of CBOs and their sustainability needs to be monitored after their completion.
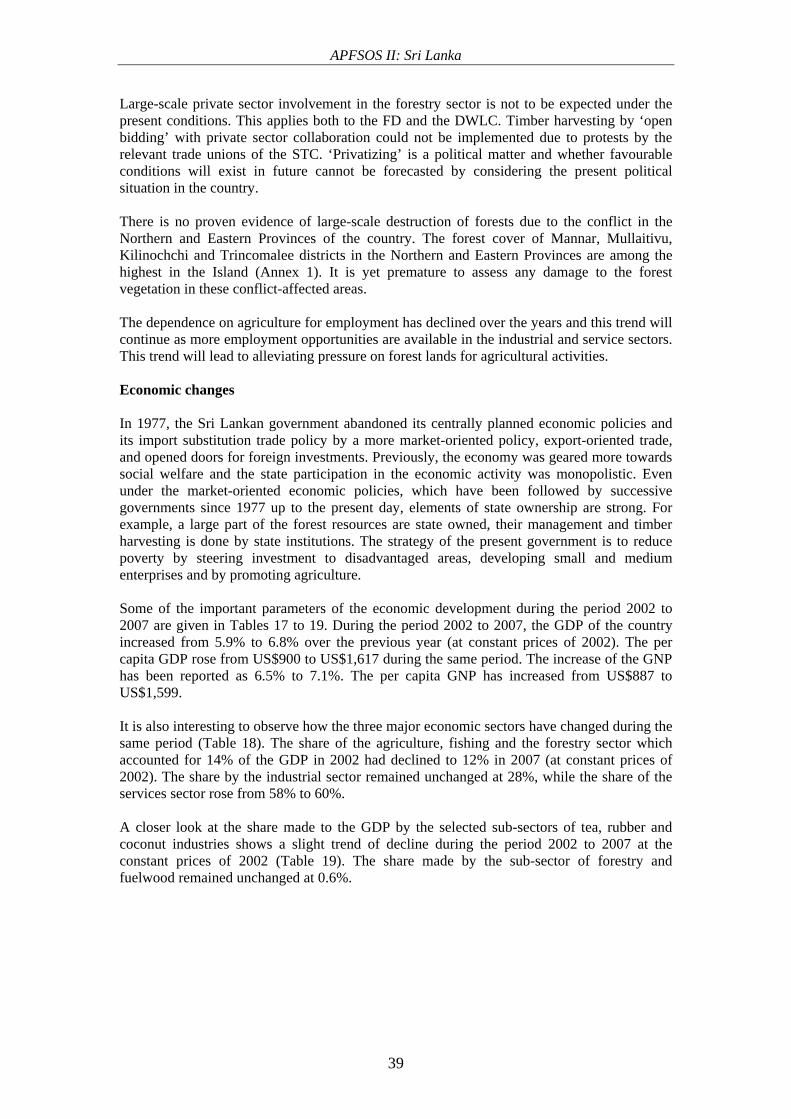
APFSOS II: Sri Lanka
39
Large-scale private sector involvement in the forestry sector is not to be expected under the present conditions. This applies both to the FD and the DWLC. Timber harvesting by ‘open bidding’ with private sector collaboration could not be implemented due to protests by the relevant trade unions of the STC. ‘Privatizing’ is a political matter and whether favourable conditions will exist in future cannot be forecasted by considering the present political situation in the country. There is no proven evidence of large-scale destruction of forests due to the conflict in the Northern and Eastern Provinces of the country. The forest cover of Mannar, Mullaitivu, Kilinochchi and Trincomalee districts in the Northern and Eastern Provinces are among the highest in the Island (Annex 1). It is yet premature to assess any damage to the forest vegetation in these conflict-affected areas. The dependence on agriculture for employment has declined over the years and this trend will continue as more employment opportunities are available in the industrial and service sectors. This trend will lead to alleviating pressure on forest lands for agricultural activities. Economic changes In 1977, the Sri Lankan government abandoned its centrally planned economic policies and its import substitution trade policy by a more market-oriented policy, export-oriented trade, and opened doors for foreign investments. Previously, the economy was geared more towards social welfare and the state participation in the economic activity was monopolistic. Even under the market-oriented economic policies, which have been followed by successive governments since 1977 up to the present day, elements of state ownership are strong. For example, a large part of the forest resources are state owned, their management and timber harvesting is done by state institutions. The strategy of the present government is to reduce poverty by steering investment to disadvantaged areas, developing small and medium enterprises and by promoting agriculture. Some of the important parameters of the economic development during the period 2002 to 2007 are given in Tables 17 to 19. During the period 2002 to 2007, the GDP of the country increased from 5.9% to 6.8% over the previous year (at constant prices of 2002). The per capita GDP rose from US$900 to US$1,617 during the same period. The increase of the GNP has been reported as 6.5% to 7.1%. The per capita GNP has increased from US$887 to US$1,599. It is also interesting to observe how the three major economic sectors have changed during the same period (Table 18). The share of the agriculture, fishing and the forestry sector which accounted for 14% of the GDP in 2002 had declined to 12% in 2007 (at constant prices of 2002). The share by the industrial sector remained unchanged at 28%, while the share of the services sector rose from 58% to 60%. A closer look at the share made to the GDP by the selected sub-sectors of tea, rubber and coconut industries shows a slight trend of decline during the period 2002 to 2007 at the constant prices of 2002 (Table 19). The share made by the sub-sector of forestry and fuelwood remained unchanged at 0.6%.
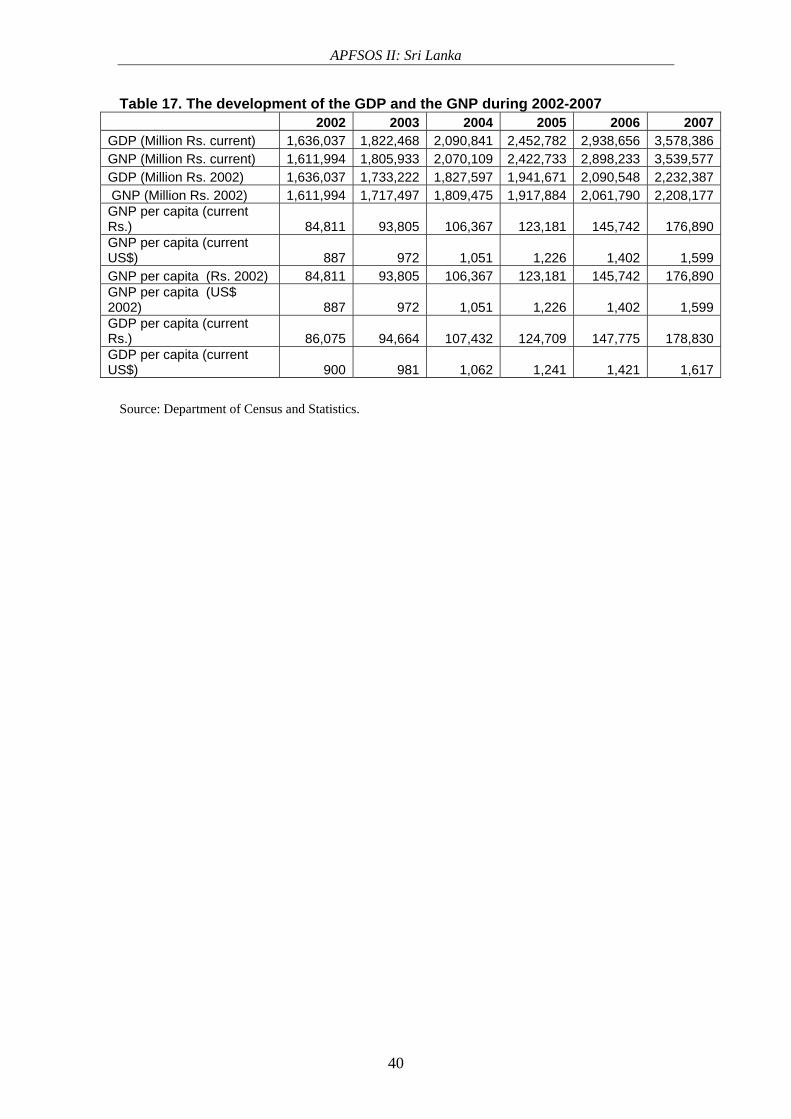
APFSOS II: Sri Lanka
40
Table 17. The development of the GDP and the GNP during 2002-2007 2002 2003 2004 2005 2006 2007GDP (Million Rs. current) 1,636,037 1,822,468 2,090,841 2,452,782 2,938,656 3,578,386GNP (Million Rs. current) 1,611,994 1,805,933 2,070,109 2,422,733 2,898,233 3,539,577GDP (Million Rs. 2002) 1,636,037 1,733,222 1,827,597 1,941,671 2,090,548 2,232,387 GNP (Million Rs. 2002) 1,611,994 1,717,497 1,809,475 1,917,884 2,061,790 2,208,177GNP per capita (current Rs.) 84,811 93,805 106,367 123,181 145,742 176,890GNP per capita (current US$) 887 972 1,051 1,226 1,402 1,599GNP per capita (Rs. 2002) 84,811 93,805 106,367 123,181 145,742 176,890GNP per capita (US$ 2002) 887 972 1,051 1,226 1,402 1,599GDP per capita (current Rs.) 86,075 94,664 107,432 124,709 147,775 178,830GDP per capita (current US$) 900 981 1,062 1,241 1,421 1,617
Source: Department of Census and Statistics.
APFSOS II: Sri Lanka
41
Table 18. The development of the GDP according to sectors 2002-2007
2002%
GDP 2003%
GDP 2004%
GDP 2005%
GDP 2006%
GDP 2007%
GDP At current market prices: - Agriculture, forestry & fishing
233,615 14 241,122 13 262,271 13 289,906 12 333,114 11 417,353 12 - Industry 458,265 28 518,029 28 598,359 29 740,448 30 900,479 31 1,070,683 30 - Services 944,157 58 1,063,317 58 1,230,211 59 1,422,428 58 1,705,064 58 2,090,350 58 Total 1,636,037 1,822,468 2,090,841 2,452,782 2,938,657 3,578,386 At constant (2002) prices: - Agriculture, forestry & fishing
233,615 14 237,531 14 237,506 13 241,851 12 257,131 12 265,586 12 - Industry 458,264 28 479,647 28 505,602 28 545,981 28 590,298 28 635,199 28 - Services 944,158 58 1,016,045 59 1,084,459 59 1,153,839 59 1,243,119 59 1,331,602 60 Total 1,636,037 1,733,223 1,827,567 1,941,671 2,090,548 100 2,232,387
Source: Department of Census and Statistics.
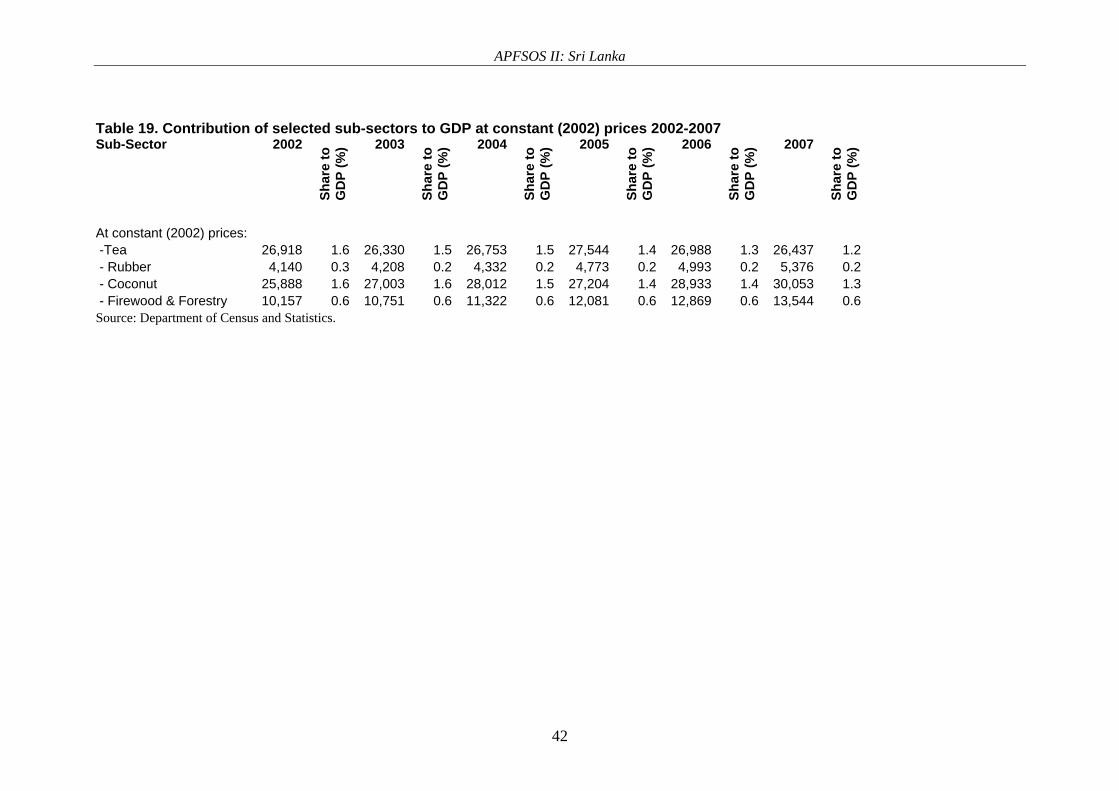
APFSOS II: Sri Lanka
42
Table 19. Contribution of selected sub-sectors to GDP at constant (2002) prices 2002-2007 Sub-Sector 2002
Shar
e to
G
DP
(%) 2003
Shar
e to
G
DP
(%) 2004
Shar
e to
G
DP
(%) 2005
Shar
e to
G
DP
(%) 2006
Shar
e to
G
DP
(%) 2007
Shar
e to
G
DP
(%)
At constant (2002) prices: -Tea 26,918 1.6 26,330 1.5 26,753 1.5 27,544 1.4 26,988 1.3 26,437 1.2 - Rubber 4,140 0.3 4,208 0.2 4,332 0.2 4,773 0.2 4,993 0.2 5,376 0.2 - Coconut 25,888 1.6 27,003 1.6 28,012 1.5 27,204 1.4 28,933 1.4 30,053 1.3 - Firewood & Forestry 10,157 0.6 10,751 0.6 11,322 0.6 12,081 0.6 12,869 0.6 13,544 0.6Source: Department of Census and Statistics.
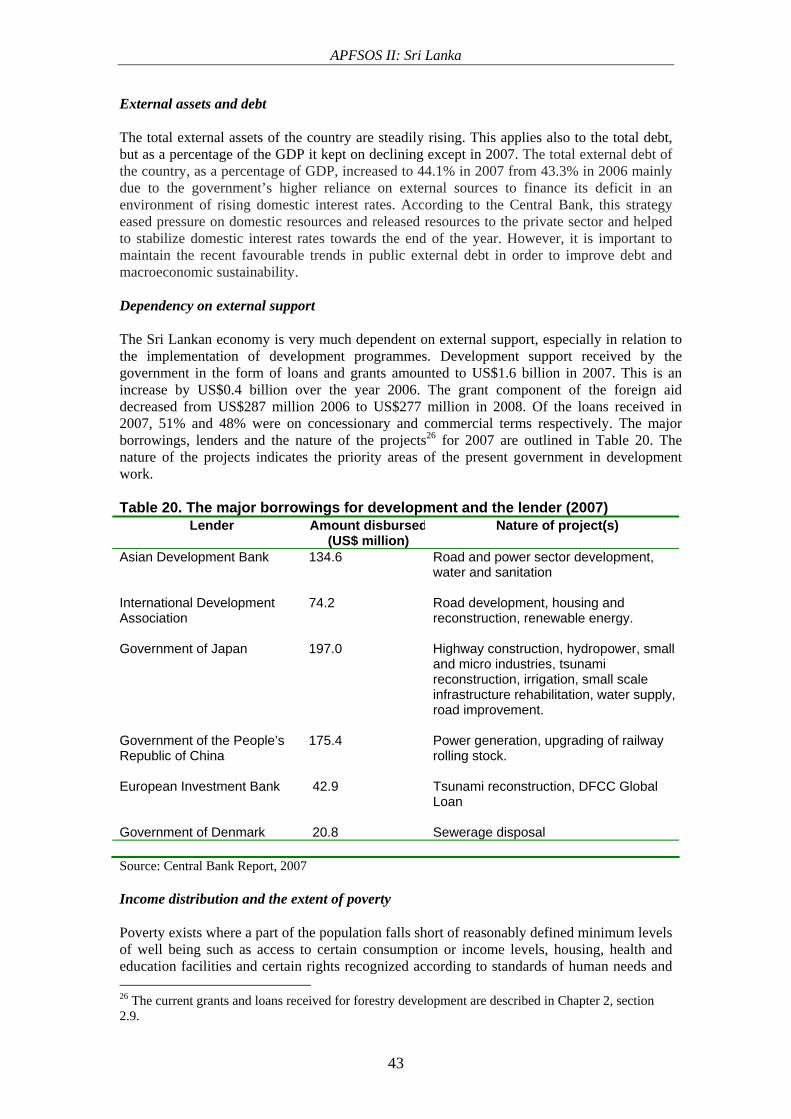
APFSOS II: Sri Lanka
43
External assets and debt The total external assets of the country are steadily rising. This applies also to the total debt, but as a percentage of the GDP it kept on declining except in 2007. The total external debt of the country, as a percentage of GDP, increased to 44.1% in 2007 from 43.3% in 2006 mainly due to the government’s higher reliance on external sources to finance its deficit in an environment of rising domestic interest rates. According to the Central Bank, this strategy eased pressure on domestic resources and released resources to the private sector and helped to stabilize domestic interest rates towards the end of the year. However, it is important to maintain the recent favourable trends in public external debt in order to improve debt and macroeconomic sustainability. Dependency on external support The Sri Lankan economy is very much dependent on external support, especially in relation to the implementation of development programmes. Development support received by the government in the form of loans and grants amounted to US$1.6 billion in 2007. This is an increase by US$0.4 billion over the year 2006. The grant component of the foreign aid decreased from US$287 million 2006 to US$277 million in 2008. Of the loans received in 2007, 51% and 48% were on concessionary and commercial terms respectively. The major borrowings, lenders and the nature of the projects26 for 2007 are outlined in Table 20. The nature of the projects indicates the priority areas of the present government in development work. Table 20. The major borrowings for development and the lender (2007)
Lender Amount disbursed(US$ million)
Nature of project(s)
Asian Development Bank 134.6 Road and power sector development, water and sanitation
International Development Association
74.2 Road development, housing and reconstruction, renewable energy.
Government of Japan 197.0 Highway construction, hydropower, small and micro industries, tsunami reconstruction, irrigation, small scale infrastructure rehabilitation, water supply, road improvement.
Government of the People’s Republic of China
175.4 Power generation, upgrading of railway rolling stock.
European Investment Bank 42.9 Tsunami reconstruction, DFCC Global Loan
Government of Denmark 20.8 Sewerage disposal
Source: Central Bank Report, 2007 Income distribution and the extent of poverty Poverty exists where a part of the population falls short of reasonably defined minimum levels of well being such as access to certain consumption or income levels, housing, health and education facilities and certain rights recognized according to standards of human needs and 26 The current grants and loans received for forestry development are described in Chapter 2, section 2.9.
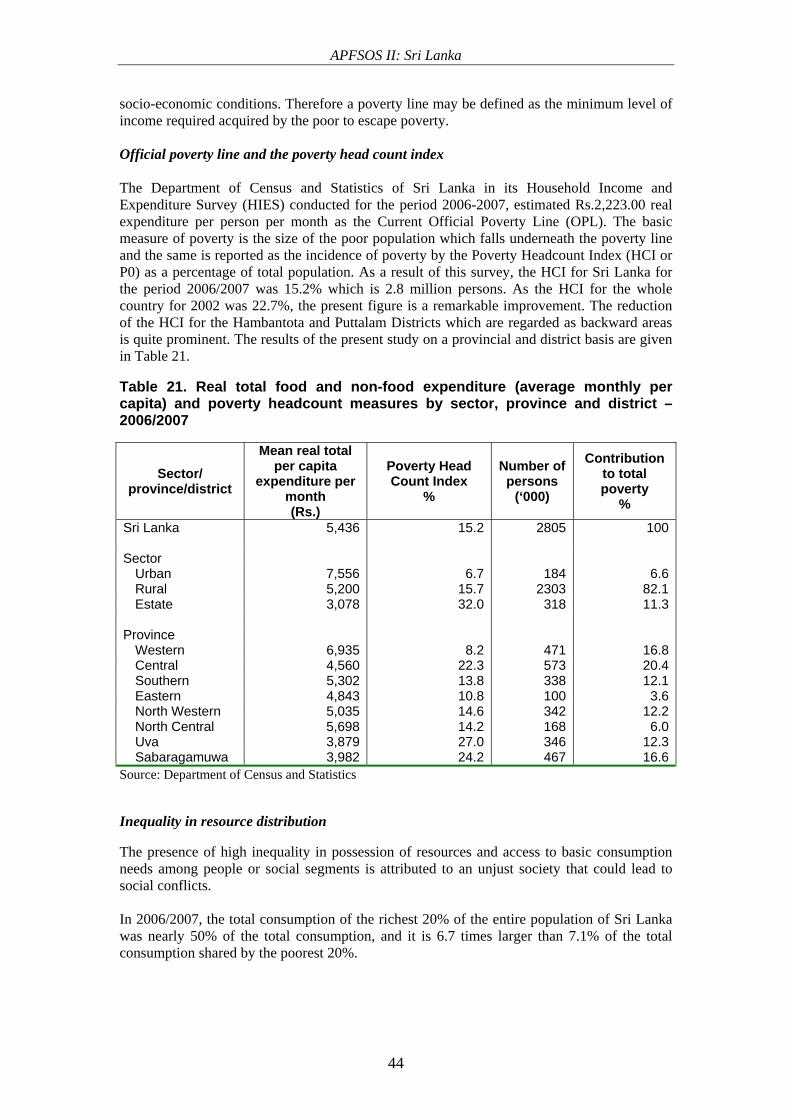
APFSOS II: Sri Lanka
44
socio-economic conditions. Therefore a poverty line may be defined as the minimum level of income required acquired by the poor to escape poverty. Official poverty line and the poverty head count index The Department of Census and Statistics of Sri Lanka in its Household Income and Expenditure Survey (HIES) conducted for the period 2006-2007, estimated Rs.2,223.00 real expenditure per person per month as the Current Official Poverty Line (OPL). The basic measure of poverty is the size of the poor population which falls underneath the poverty line and the same is reported as the incidence of poverty by the Poverty Headcount Index (HCI or P0) as a percentage of total population. As a result of this survey, the HCI for Sri Lanka for the period 2006/2007 was 15.2% which is 2.8 million persons. As the HCI for the whole country for 2002 was 22.7%, the present figure is a remarkable improvement. The reduction of the HCI for the Hambantota and Puttalam Districts which are regarded as backward areas is quite prominent. The results of the present study on a provincial and district basis are given in Table 21. Table 21. Real total food and non-food expenditure (average monthly per capita) and poverty headcount measures by sector, province and district – 2006/2007
Sector/ province/district
Mean real total per capita
expenditure per month (Rs.)
Poverty Head Count Index
%
Number of persons
(‘000)
Contribution to total poverty
%
Sri Lanka
5,436 15.2 2805 100
Sector Urban 7,556 6.7 184 6.6Rural 5,200 15.7 2303 82.1Estate 3,078 32.0 318 11.3
Province
Western 6,935 8.2 471 16.8Central 4,560 22.3 573 20.4Southern 5,302 13.8 338 12.1Eastern 4,843 10.8 100 3.6North Western 5,035 14.6 342 12.2North Central 5,698 14.2 168 6.0Uva 3,879 27.0 346 12.3Sabaragamuwa 3,982 24.2 467 16.6
Source: Department of Census and Statistics Inequality in resource distribution The presence of high inequality in possession of resources and access to basic consumption needs among people or social segments is attributed to an unjust society that could lead to social conflicts. In 2006/2007, the total consumption of the richest 20% of the entire population of Sri Lanka was nearly 50% of the total consumption, and it is 6.7 times larger than 7.1% of the total consumption shared by the poorest 20%.
APFSOS II: Sri Lanka
45
Strengths and weaknesses of the economy The recent economic growth in the country with more than 6% per annum for three consecutive years since independence could be regarded as a favourable trend towards the future. It is noted that historically annual economic growth has remained at 4% to 5%. The growth of the industrial sector (7.6%) and services (7.1%) is remarkable but in the agriculture sector annual growth remains low (3.3%). It is said that the unemployment rate has declined below the 6% level. The Sri Lankan currency has currently attained stability as depreciation has come to a lower level. The Sri Lankan economy is currently hit by the steep increase in petroleum prices and the soaring prices of food and other commodities. The per capita GDP/GNP do not reflect the income distribution among the population; hence other criteria need to be looked into. As shown by Table 21 high disparities exist among the population in the distribution of the national wealth at national and regional levels. Future energy demand and its implication on forests The future energy demand of the country will be steadily rising. Under the present conditions, the prices of LP gas and of other petroleum products are rising at an alarming rate. New power stations would contribute to the total electricity requirement of the country, but the high cost of electricity will cause consumers to look for alternative energy. It is too optimistic to rely on new petroleum sources as the exploration work is still in initial stages. Therefore, biomass will remain as an important source of energy in the future. The future demand for biomass energy at national and district levels will steadily increase in the future, at a rate of 3% per annum. The FSMP by considering the trends that existed in 1993, predicted a 4.8% increase of the demand for biomass energy from 1993 to 2020. Under the present conditions this demand will be much higher. The potential supply of bio-energy during the same period will rise at a lesser rate at 2.4%. Due to the ample presence of suitable biomass in the country the supply will be ample even by 2020. Under the FSMP scenario, the role of natural forests as a source of bio-energy would drop from 7% to 5%. The share of forest plantations will remain unchanged at 4%. The new trends for the declaration of a permanent forest estate, zoning, protection, rigid management practices and the establishment of community wood lots for fuelwood would reduce the role of natural forests as a supplier of bio-energy. The forest plantation estate would remain rather static without any significant expansion, but increased harvesting would increase its contribution to the bio-energy sector. The increase of the contribution of home gardens from 26% to 33% and of the processing residues from saw mills would compensate the reduction in supply from natural forests and would maintain the balance between demand and supply. Impact of globalization and regional and sub-regional integration Globalization has significant effects on the economy of Sri Lanka, which is for the most part export-oriented. Moderate global economic expansion, as experienced currently in countries with advanced economies, affects the Sri Lankan economy adversely. US dollar and the Euro areas with depreciated economic growth ranging from 1.5 to 1.6% (2008) are the major export destinations for most Sri Lankan products. Global inflation is likely to be aggravated further with higher prices for crude oil and other commodities. Rising prices on crude oil and food items will increase inflation in countries, in
APFSOS II: Sri Lanka
46
which food items often represent 25-40% of the consumption basket and Sri Lanka will not be an exemption. Sri Lanka still maintains tea, rubber and coconut as the major export products. Alternative export items such as rubber based products, diamond processing, fabricated metal, gems and jewellery, machinery and transport equipment have shown a healthy growth recently. In the services sector, the hotel industry is facing problems on account of the prevailing security situation in the country. The country has entered into bi-lateral and regional trade agreements with other countries for mutual benefits. The major trade agreements in the regional context are the South Asia Free Trade Agreement (SAFTA), the Asia-Pacific Trade Arrangement (APTA), and the Bay of Bengal Initiative for Multi-Sectoral Technical and Economic Cooperation (BIMST-EC). The major bilateral trade agreements are the Indo-Sri Lanka Free Trade Agreement (ISLFTA) and the Pakistan-Sri Lanka Free Trade Agreement (PSLFTA) signed in 2005. Such agreements have their merits and demerits. Sri Lanka still depends heavily on a few export items and lags behind in export diversification. Thus, systematic efforts need to be taken by exporters to exploit the benefits availed to them under these agreements. As a benefit due to the agreement with Pakistan, Sri Lankan exports increased by 27% in 2007. Such agreements had no direct link to the import or export of any forest product. Technological changes within and outside the forestry sector Sri Lanka’s efforts for industrialization were abandoned with the introduction of the liberalized economy in the late 1970s and the markets were soon flooded with imported items. Under this situation, the development of technologies was not a priority. However, a favourable climate for industrial development exists now in the country. The government promotes local industries and they are incorporated in development plans. Recent technological developments can be seen in the fields of information technology, processing of agricultural products, rubber technology and in the automobile industry. Forest industries have a lesser scope for large-scale development in the future. Therefore, a ‘technological revolution’ in the economic sphere cannot be anticipated in the foreseeable future. Environmental issues and policies and their impact on the forestry sector Environmental issues of different magnitude may arise from time to time as perceived by people on different matters. In general, people are aware of the consequences of large-scale deforestation. People oppose planting of certain exotic tree species, i.e. pine or eucalypts, as they are allegedly environmentally ‘unfriendly’. Public comments are often heard on the human-elephant conflicts in the Dry Zone or on wild elephants run over by trains. In more specific instances, people protest on the construction of a new highway or environmentally enthusiastic groups challenge the implementation of a new development project in a court of law. It is a legal requirement that the environmental impact assessment reports of development projects should be opened for public comments for a period of 30 days. Public involvement in environmental issues is a part of the democratic process in the country. High level of environmental awareness can be attributed to the higher literacy rate, formal environmental education in the school system and the efforts of governmental and nongovernmental organizations on environmental awareness building. The government is committed to the implementation of many international conventions on environmental protection. Among them are the Convention on Biodiversity (1992) and the Cartagena Protocol on Biosafety (1994), Convention on International Trade on Endangered Species (2005), United Nations Framework on Climatic Change (1992) and the Kyoto
APFSOS II: Sri Lanka
47
Protocol (2002). The implementation of these conventions has direct impact on the forestry sector. In recent times, the Clean Development Mechanism has come to the forefront. Summary of key factors that are likely to impact forests in the next 20 years
• Many factors would exercise an impact on forests and forestry during the next two decades. Social changes will continue gradually with increased urbanization, but remnants of the old social order would still prevail especially in rural areas. As a result, traditional practices such as Chena cultivation may still continue, but at a lesser degree than in the past (with the demarcation of forest boundaries, clearing of forest lands for shifting cultivation has been reduced significantly over the last five years. Nearly 14,000 ha of lands previously used for shifting cultivation have been set apart for assisted natural regeneration while another 2,000 ha of lands have been converted to forest plantations since 2000)
• Development projects and their outcome have a direct impact on the environment and
forests. Development activities should be ‘ecofriendly’ and not detrimental. Regional development programmes would attract rural people to other forms of employment, abandoning their old practices such as Chena cultivation or other disastrous practices that harm natural vegetation
• Access to education will have a direct impact on the consciousness of the society on
forestry and other environment-related matters. It has already been mentioned that Sri Lanka maintains comparatively higher standards in health services and education in the region. The people’s attitude towards forests will have a major impact in the future
• The economic development of the country should be fair. Large-scale disparities
among certain sectors of the population in consumption, especially in the rural sector, may lead to indiscriminate clearing of forests
• Energy demand and the share of electricity, LP gas and other petroleum products in
the energy balance and their pricing will exercise a significant impact on forests and other tree resources
• Many external factors will influence the forestry situation, especially in relation to
policy decisions. The priorities of the forestry sector have always remained dynamic following global trends and donor agencies will play a significant role in this context. Forest resource assessments and production-oriented management were a priority in the 1960s, 1970s and in the first half of the 1980s. Then priorities changed, and biodiversity conservation and the participatory approach in management were the new priorities. As the priorities of the forestry sector are of a more dynamic nature more changes can be anticipated in the future
• Most of the forestry projects in the future will be implemented with donor assistance
and some loan covenants could result in significant impacts. Regional and sub-regional integration for relevant sectors could also contribute to this phenomenon
• A forest policy is drawn up by considering many factors in an era, and among them
are the status of the forest resource, socio-economic conditions of the dependents and their potential contribution, environmental problems, the state of industrialization, demand for timber, the energy balance and the nature of the stakeholders etc. Global trends and regional and sub-regional integration will also contribute to new policy revision or formulation. Therefore, as policy is of a dynamic nature it may get revised
APFSOS II: Sri Lanka
48
from time to time. As the country, by nature, is prone to natural disasters, policy may get amended by including clauses on the role of forestry in mitigating them
• The need for wood and wood products is steadily rising. The FSMP has estimated by
referring to current trends that the demand for sawn wood would rise from 688,000 m3 in 2005 to 885,000 m3 in 2020. The demand for plywood and other wood-based panels would rise from 49,000 m3 in 2005 to 82,000 m3 in 2020. As a consequence of the 2004 tsunami a large quantity of sawn wood had to be imported for reconstruction and other development work. The country will need large quantities of industrial timber in the future, especially for planned development programmes for the North and Eastern Provinces and the extension of the railroad network, and these requirements may have to be imported. Inadequate foreign currency reserves may cause increased harvesting of forest plantations and other tree resources
APFSOS II: Sri Lanka
49
4. PROBABLE SCENARIOS AND THEIR IMPLICATIONS Rational for scenario definition Scenario definition by reason is a tool for analyzing possible future events by considering alternative possible outcomes (scenarios). The analysis is designed to allow improved decision making by planners giving adequate consideration to possible outcomes and their implications. Scenarios are based on coherent and an internally consistent set of assumptions about the key relationships of a process and the driving forces. As forestry is a long-term venture, scenario definition by considering present and possible decisive factors over a long time span is of utmost importance. The scenario analysis undertaken in this exercise was done in the following manner. All factors affecting the future status of forests and the forestry sector were reviewed and the most important variables were selected for further analysis. The scenario analysis was done using the two variables with topmost uncertainties in the future course. Important elements (parameters) for scenario definition and uncertainties Elements affecting forests used in this study for the definition of possible scenarios fall in the following broad categories, which are also interrelated. Demographic aspects: This includes population changes in rural and urban areas, urbanization, migration, employment patterns and level of income generation, dependency on forests, human settlement and types, energy sources and consumption levels, people’s awareness on environmental issues and the importance of the forestry sector etc. Government policy on economic development and on forests: The development priorities of the government play a vital role in scenario definition. A ‘markets first’ scenario driven by market-oriented forces would not place much emphasis on the sustainable principles of the forestry sector or the environment. In a ‘policy first’ scenario much emphasis is given to the forestry policy and the environmental protection policy of the government and is concerned with the sustainability of forest resources. Institutional aspects: The government policy on forestry and environment, availability of resources for forestry development and environmental protection, the status of institutional development, the availability of improved technology and qualified personnel are elements in institutional aspects. Development of the national economy: Growth of the GDP and GNP, infrastructure development, industrialization, expansion of the arable area for agriculture, employment generation and the fair distribution of national wealth etc. are possible elements. Major uncertainties Out of the variables given above, the future development of the national economy (economic growth) and the implementation of the government policy on forests and environment could be considered as the two potential variables with uncertainties. The reasons are discussed below.
1. The development of the national economy is dependent on several factors. The most crucial factor is the economic policy of the government. In a parliamentary democracy, as the case in Sri Lanka, ruling power could be changed periodically between two major political parties and their alliances. Matters such as privatization, foreign investments, donor assistance for development work including forestry,
APFSOS II: Sri Lanka
50
external trade etc. are highly dependent on the policy of the ruling party and the current political stability of the country. Each political party will address these issues in a different manner. The economy is also much affected by the global energy and food crisis. The future political scenario and the status of the national economy are unpredictable variables.
2. The government policy on forests and forestry and its implementation may change in
time to come. Since independence, the forest policy has been revised on three occasions (1953, 1980 and 1995) to be on par with the prevailing social, environmental and economic conditions. Currently, forest conservation for biodiversity and environmental protection is given the highest priority in forest policy. The present drive for increased food production, reducing the impacts of natural disasters, infrastructure development, increased timber production to reduce imports and the drive for alternative energy sources are the potential areas that could lead to policy revisions in future.
The business as usual scenario The current situation of the forestry sector and other ancillary information are important inputs for the future scenario definition. These aspects are described here, within the framework of the categories with the major uncertainties mentioned above. Economic growth: The present position of economic growth is described in detail in Section 3, but some extracts are reproduced briefly here. The country has a mixed economy with the GDP increasing from 5.9% to 6.8% per annum during 2002 to 2007. Per capita income increased from US$ 887 to 1,599 during the same period. A recent survey has indicated that the percentage of the population below the poverty line dropped from 22.7% to 15.2% between 2002 and 2007. However, the inequality in the distribution of national wealth is quite prominent, especially in urban areas. The country has launched major development programmes and among them is offshore oil exploration. If successful, it would be a major breakthrough for the future development of the country. The civil unrest in the country and the global fuel and food crisis have been the major constraints to the development of the national economy during the past three decades. However, the major achievements by the government of liberating the entire eastern province from the separatist movement and restoring civil administration there in 2008 and liberating the entire northern province from the separatist movement in early 2009 will effectively end the civil unrest in the country. This would lead to higher economic growth in the foreseeable future. Government policy: The government has a well-defined national development programme. Its commitment to the environmental and forestry sectors is well defined in the National Environmental Act No. 47 of 1980 and the Forest Policy of 1995. The National Environmental Act includes provisions to mitigate potential large scale environmental hazards that could arise during the development process. The forest policy relies on measures to maintain the sustainability and development of forest resources, protection ofbio-diversity, production of timber and NWFPs and emphasizes the participatory approach. The implementation of the relevant government policies and the available institutional aspects are currently at a satisfactory level. Institutional framework: An optimal institutional arrangement is an essential pre-requisite for efficient policy implementation. All governments since independence recognized the importance of forests and forestry and the FD was placed under the supervision of a minister
APFSOS II: Sri Lanka
51
holding a cabinet portfolio. Currently it functions under the MENR. This applies also to the DWLC which is currently placed under the same ministry. Similarly, the rubber, coconut and tea sectors which accommodate a significant part of other tree resources fall under the overview of the Ministry of Plantation Industries. The government awarded rubber, coconut and tea plantations to the private sector on long-term leases during the latter part of the 1990s and as a result 23 Regional Plantation Companies were formed. The forestry activities of these Regional Plantation Companies, especially in timber harvesting, are supervised by the Ministry of Plantation Industries in collaboration with the FD. Alternative scenarios and probable shifts The status of forests and the forestry sector during the next decade could be forecasted under the following alternative scenarios, formulated on the unpredictable variables given above. For the scenario analysis, the extreme ends of the driving forces have been selected.
No. Possible Scenarios I Fast growth of the national economy and poor policy implementation II Fast growth of the national economy and efficient policy implementation III Slow growth of the national economy and poor policy implementation IV Slow growth of the national economy and efficient policy implementation
Probable outcomes under the alternative scenarios Fast growth of the national economy and poor policy implementation: This will be disastrous to forest resources as it works against the concept of sustainability. The situation would be much worse if the fast growth is due to the rapid expansion of the agriculture sector. In such a case ‘economic boom’ without proper policy implementation would be disastrous and indiscriminate conversion of forests lands for other land uses would be unavoidable. On the other hand if the fast growth is due to the expansion of the industrial and service sectors with a declining growth in the agriculture sector as is the case in Sri Lanka, the adverse impact on forest resources due to fast growth, even with poor policy implementation, would be much less. Fast growth of the national economy and efficient policy implementation: Hypothetically, this should be the ideal situation as economic development could be on par with the ‘sustainability’ of the forest resources. It would deviate considerably from the current scenario. Threats to forests due to rapid industrialization, infrastructure development and urbanization would be mitigated due to stringent policy implementation. More commercially oriented timber production would be practiced with higher investments for plantation establishment and with higher degree of mechanization. Higher investments could be made in forest management due to the expanding national economy. The rate of deforestation will be minimal under this scenario. A higher participation of stakeholders in forestry development would take place. With higher income levels, the number of visitors to ecotourism centres would increase. However, a fair distribution of the national income among the population is an essential prerequisite for this scenario to be a complete success. Slow growth of the national economy and poor policy implementation: This scenario would be characterized by low economic development, less industrialization with reduced employment opportunities and poor regional development. As no rural development takes place, the peasant population would revert to the traditional Chena cultivation which is detrimental to forest vegetation. The state would seek more financial sources by overexploitation of forest resources, especially plantations with valuable growing stock. If
APFSOS II: Sri Lanka
52
donor assistance would not be forthcoming, the social forestry programmes and other forest development work would be in jeopardized. Under such a scenario, environmental protective measures would be given low priority. Environmental concerns would thrive only among a certain strata of the population. Slow growth of the national economy and efficient policy implementation: Slow growth of the national economy would contradict efficient policy implementation making the latter a failure. The development of the forestry sector would stagnate due to the lack of necessary investments. Slow development of the rural sector could cause a threat to forest resources, as the poor or the landless could revert back to unauthorized use of forest resources including Chena cultivation. This could lead to conflicts with local forest authorities. The country would depend more on bio-energy sources and imports of timber and wood-based material than at present. The most likely situation The most likely situation until the end of the next decade is the continuation of the present trend, which is characterized by a moderate growth of the national economy and satisfactory policy implementation. Scenario II described above would resemble this situation. Accordingly, the forestry sector in the next decade will be characterized by:
• Economic development in the country would take place at a moderate rate with some impact on the poverty level. The percentage of the population below the poverty line would be reduced. However, the inequity in income distribution would remain. If the planned development activities of the government could be realized, rural development would take place in the long run
• Reduction of natural forests would take place, but at a slower rate than in the past. It would be concentrated on areas where human activity is higher such as areas with major development work. Sparse vegetation will be more affected than the high forests
• Some revision to the forest policy would take place due to changing social and economic conditions. The current policy on keeping natural forests intact for environmental services and meeting the demand for forest products from sources outside the forests, however, would remain unchanged. The global energy crisis and the drive for increased food production would be the main driving forces. Agroforestry systems, especially home garden development, will be given high priority to increase the production of food and timber. The role of forestry in mitigating the effects of natural disasters such as tsunamis, landslides and floods as well as in maintaining carbon storage capacity will be given due consideration
• Conservation forestry and fauna and flora protection will be given high priority with an increased demand for ecotourism. This will be given high priority also by the DWLC
• Increasing fuel prices would remain a bottleneck in the development process. In the domestic sector, rising prices of LP gas could result in many households reverting to traditional sources of energy. The need for social forestry programmes would rise, especially for the production of fuelwood
• Unless the productivity of forest plantations and the timber bearing capacity of home gardens and of other tree sources are increased, timber imports would gradually rise
• Forest plantation management would take a new turn. The overstocked mature plantations will be felled and replanted in a phased manner. The annual clear felling areas will be higher than at present (the present total annual felling area in plantations is nearly 800 ha on average). More investments would be needed for reforestation, especially for the restoration of degraded stands. Further, the present practice of the conversion of mature stands of exotic species, especially pine plantations, with
APFSOS II: Sri Lanka
53
indigenous trees through assisted natural regeneration and enrichment planting will be continued as the majority of these plantations are situated in environmentally sensitive water catchments. Both the government and general public are supporting the conversion of these plantations into natural stands rather than management for timber production mainly due to the environmental concerns
• Technological improvement in the wood processing industry will be in place to minimize waste. The area of forest plantations under certification would increase and the export of value-added timber products such as furniture would also be increased
• Community participation in the forestry sector would remain at a higher rate and more volunteer participation in forest conservation in place of incentive-based participation is envisaged with increased extension and education activities. Due to the prevailing economic situation and the financial requirements of the high priority sectors, the forestry sector would have to rely much on donor assistance for its development work
• However, the future scenario of forestry would not be free from the impact of global and regional trends. As experienced in the past, new concepts could evolve and management priorities would be based on them
APFSOS II: Sri Lanka
54
5. THE POSSIBLE SITUATION IN 2020 Forest resources in the future Natural forests: Under the most likely situation with a moderate economic growth and satisfactory policy implementation, the depletion of the natural forest cover would take place at a slower rate. As population growth is not the only factor causing deforestation, calculation of the possible forest cover by the end of the next decade empirically using past values will be a futile exercise. The present programmes undertaken by the government for a stable forest estate is more prominent than during 1992-1996 and therefore a lower deforestation rate could be anticipated favouring scenario II. However, a higher deforestation rate due to human intervention will be confined to specific areas, whereas in certain other areas forest cover would tend to increase. This view is supported by a recent study27 undertaken by the National Physical Planning Department of Sri Lanka. A study undertaken with semi-automated computer interpretation of LANDSAT 7 ETM + data revealed that in three administrative districts of Sri Lanka (Batticoloa, Polonnaruwa and Vavunia), forest cover rapidly decreased from 1992 to 2001. Expanded agricultural activities in the first two districts and the influx of people in the latter have been identified as the reasons for the forest cover loss. In contrast to this, forest cover in Kandy, Matale, Nuwara Eliya, Ratnapura districts in the Wet Zone and the Dry Zone district of Ampara show a substantial increase over the previous surveys. As the Wet Zone districts mentioned above include important watersheds of major rivers, increasing forest cover is of utmost importance. It is anticipated that the changing forest cover would follow this pattern in future. Forest plantations: The extent of lands available for plantation forestry would remain significantly unchanged in the future due to the scarcity of additional lands and of other necessary resources needed for the expansion. Under such a scenario ‘the forest plantation estate’ would be permanent land parcels clearly marked and permanently designated for raising forest plantations. Future reforestation activities will be confined mainly to the second rotation areas. This trend is currently observed. The age-class distribution of the growing stock of the major plantation species (teak, pine and eucalypts) is quite irregular. The average annual clear cutting area lies at present around 800 ha. Unless the extents of annual harvesting areas are increased over a lengthy time span, the growing stock of these species cannot be brought into proper management regimes with regular age-class distribution. The increase in annual clear cutting areas, especially to ‘normalize’ the extents of large ‘unmanaged’ mature teak plantations, would flood the market with teak logs and lower prices. Under such circumstances, export of a certain part of the timber harvest in value-added forms would be possible. The conversion of plantations of exotic species to indigenous species is the presently supported trend by the political authority; hence a shift of the species composition of the plantation growing stock with more indigenous species is to be anticipated in the long run. However, this can be achieved only by the success of the conversion programmes, which have to be monitored over a considerable period of time. Increased stakeholder participation in forest plantation establishment and management could be observed during the next decade. Agroforestry systems will gain much importance due to the increased drive for food production in the country.
27 Ratnayake, J., Abeykoon, M. & Chemin, Yan. ‘District-wise forest area variation in Sri Lanka from 1992 to 2001 for supporting the National Physical Planning Policy’. Web: http:// www.gisdevelopment.net/aars/acrs/2002/for/015,pdf
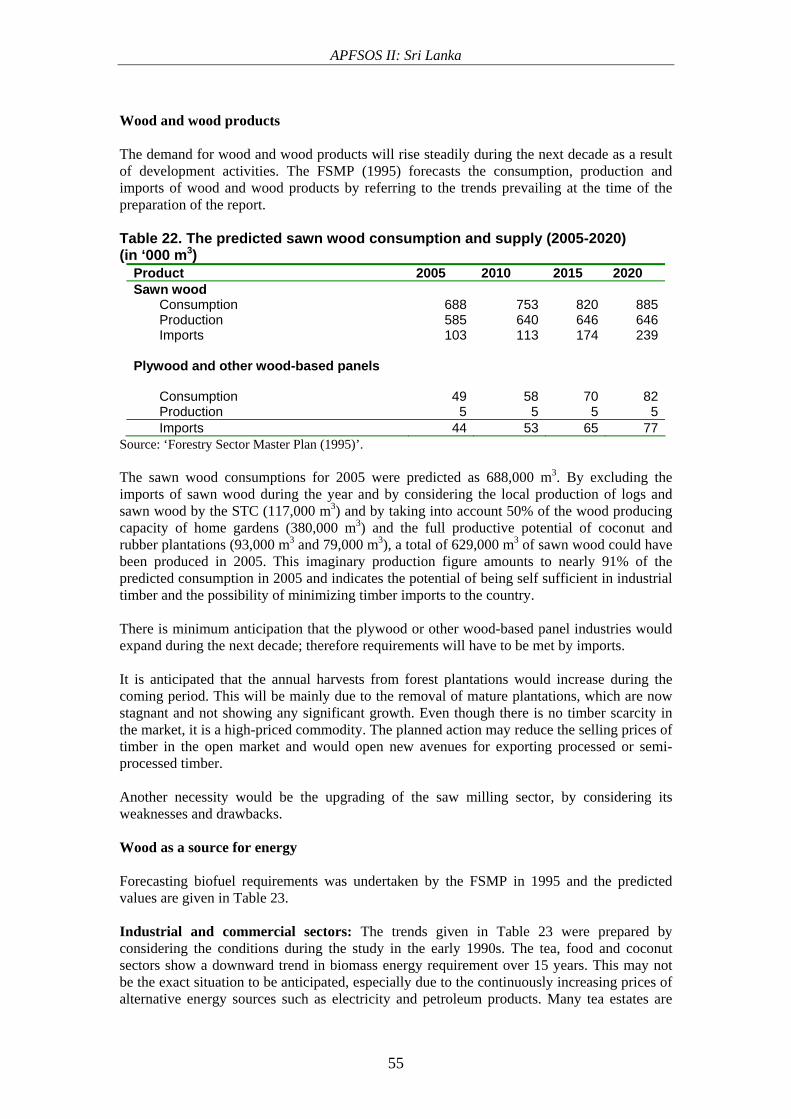
APFSOS II: Sri Lanka
55
Wood and wood products The demand for wood and wood products will rise steadily during the next decade as a result of development activities. The FSMP (1995) forecasts the consumption, production and imports of wood and wood products by referring to the trends prevailing at the time of the preparation of the report. Table 22. The predicted sawn wood consumption and supply (2005-2020) (in ‘000 m3)
Product 2005 2010 2015 2020 Sawn wood Consumption 688 753 820 885 Production 585 640 646 646 Imports 103 113 174 239 Plywood and other wood-based panels
Consumption 49 58 70 82 Production 5 5 5 5 Imports 44 53 65 77
Source: ‘Forestry Sector Master Plan (1995)’.
The sawn wood consumptions for 2005 were predicted as 688,000 m3. By excluding the imports of sawn wood during the year and by considering the local production of logs and sawn wood by the STC (117,000 m3) and by taking into account 50% of the wood producing capacity of home gardens (380,000 m3) and the full productive potential of coconut and rubber plantations (93,000 m3 and 79,000 m3), a total of 629,000 m3 of sawn wood could have been produced in 2005. This imaginary production figure amounts to nearly 91% of the predicted consumption in 2005 and indicates the potential of being self sufficient in industrial timber and the possibility of minimizing timber imports to the country. There is minimum anticipation that the plywood or other wood-based panel industries would expand during the next decade; therefore requirements will have to be met by imports. It is anticipated that the annual harvests from forest plantations would increase during the coming period. This will be mainly due to the removal of mature plantations, which are now stagnant and not showing any significant growth. Even though there is no timber scarcity in the market, it is a high-priced commodity. The planned action may reduce the selling prices of timber in the open market and would open new avenues for exporting processed or semi-processed timber. Another necessity would be the upgrading of the saw milling sector, by considering its weaknesses and drawbacks. Wood as a source for energy Forecasting biofuel requirements was undertaken by the FSMP in 1995 and the predicted values are given in Table 23. Industrial and commercial sectors: The trends given in Table 23 were prepared by considering the conditions during the study in the early 1990s. The tea, food and coconut sectors show a downward trend in biomass energy requirement over 15 years. This may not be the exact situation to be anticipated, especially due to the continuously increasing prices of alternative energy sources such as electricity and petroleum products. Many tea estates are
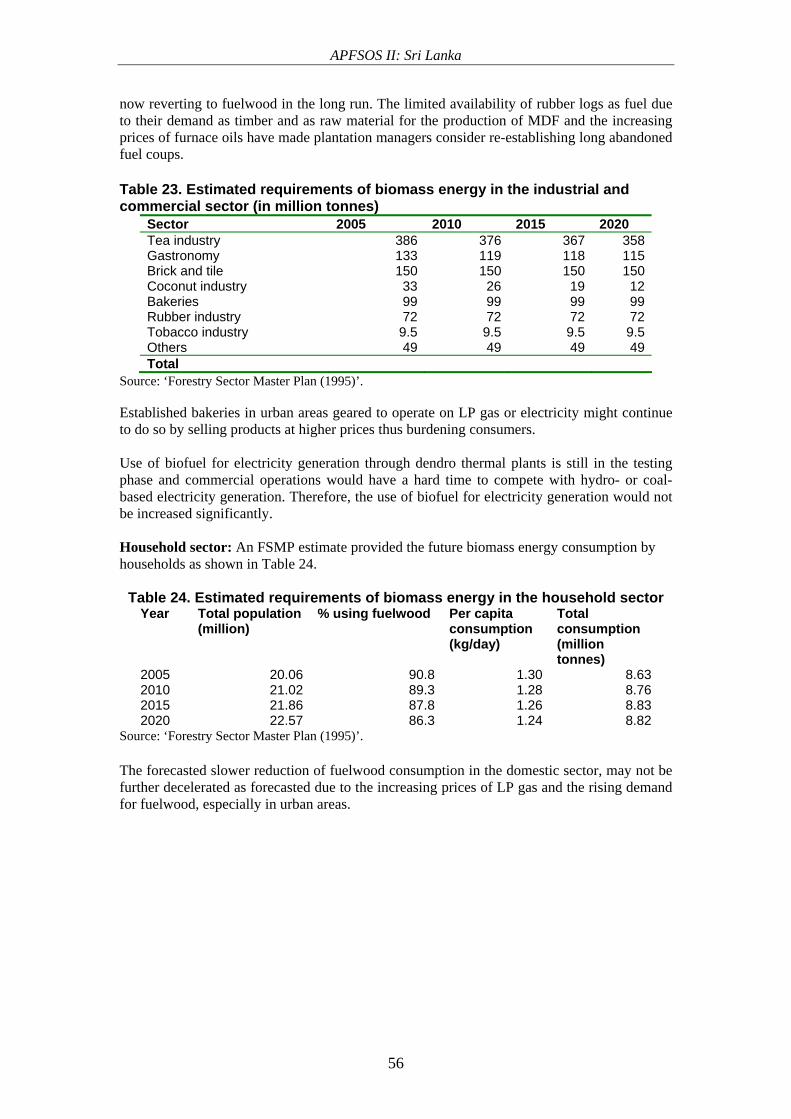
APFSOS II: Sri Lanka
56
now reverting to fuelwood in the long run. The limited availability of rubber logs as fuel due to their demand as timber and as raw material for the production of MDF and the increasing prices of furnace oils have made plantation managers consider re-establishing long abandoned fuel coups.
Table 23. Estimated requirements of biomass energy in the industrial and commercial sector (in million tonnes)
Sector 2005 2010 2015 2020 Tea industry 386 376 367 358 Gastronomy 133 119 118 115 Brick and tile 150 150 150 150 Coconut industry 33 26 19 12 Bakeries 99 99 99 99 Rubber industry 72 72 72 72 Tobacco industry 9.5 9.5 9.5 9.5 Others 49 49 49 49 Total
Source: ‘Forestry Sector Master Plan (1995)’.
Established bakeries in urban areas geared to operate on LP gas or electricity might continue to do so by selling products at higher prices thus burdening consumers. Use of biofuel for electricity generation through dendro thermal plants is still in the testing phase and commercial operations would have a hard time to compete with hydro- or coal-based electricity generation. Therefore, the use of biofuel for electricity generation would not be increased significantly. Household sector: An FSMP estimate provided the future biomass energy consumption by households as shown in Table 24.
Table 24. Estimated requirements of biomass energy in the household sector Year Total population
(million) % using fuelwood Per capita
consumption (kg/day)
Total consumption (million tonnes)
2005 20.06 90.8 1.30 8.63 2010 21.02 89.3 1.28 8.76 2015 21.86 87.8 1.26 8.83 2020 22.57 86.3 1.24 8.82
Source: ‘Forestry Sector Master Plan (1995)’. The forecasted slower reduction of fuelwood consumption in the domestic sector, may not be further decelerated as forecasted due to the increasing prices of LP gas and the rising demand for fuelwood, especially in urban areas.
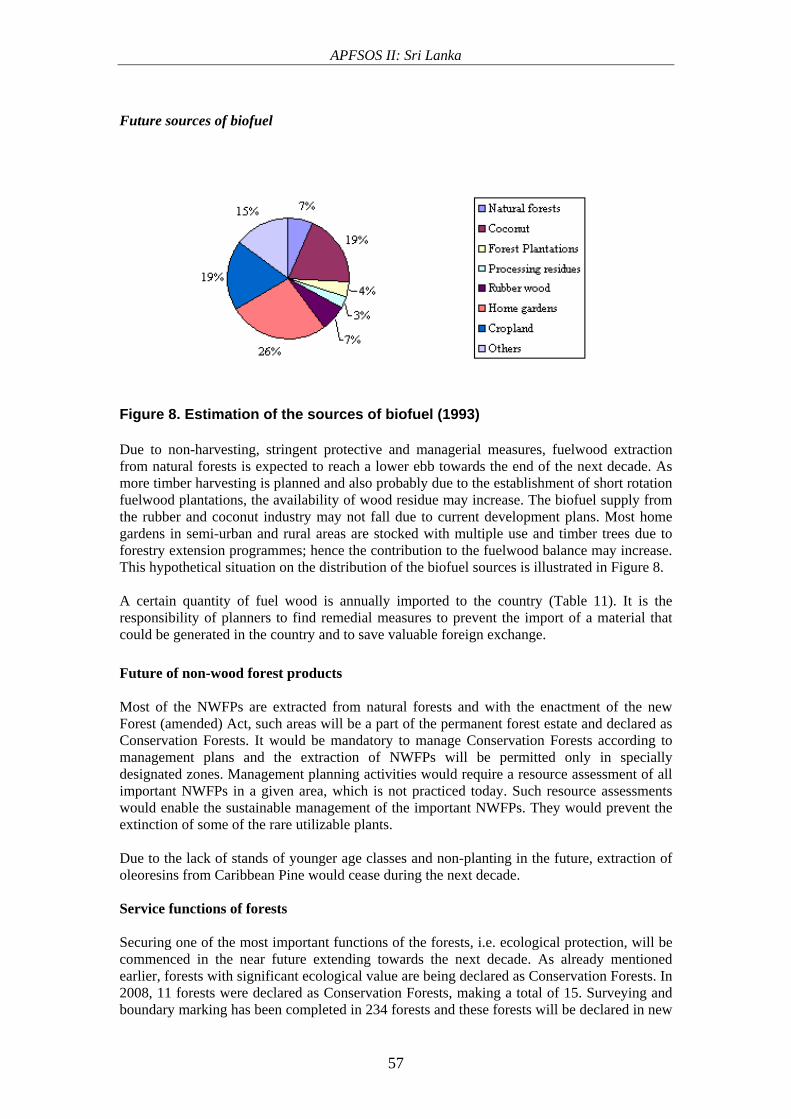
APFSOS II: Sri Lanka
57
Future sources of biofuel
Figure 8. Estimation of the sources of biofuel (1993) Due to non-harvesting, stringent protective and managerial measures, fuelwood extraction from natural forests is expected to reach a lower ebb towards the end of the next decade. As more timber harvesting is planned and also probably due to the establishment of short rotation fuelwood plantations, the availability of wood residue may increase. The biofuel supply from the rubber and coconut industry may not fall due to current development plans. Most home gardens in semi-urban and rural areas are stocked with multiple use and timber trees due to forestry extension programmes; hence the contribution to the fuelwood balance may increase. This hypothetical situation on the distribution of the biofuel sources is illustrated in Figure 8. A certain quantity of fuel wood is annually imported to the country (Table 11). It is the responsibility of planners to find remedial measures to prevent the import of a material that could be generated in the country and to save valuable foreign exchange. Future of non-wood forest products Most of the NWFPs are extracted from natural forests and with the enactment of the new Forest (amended) Act, such areas will be a part of the permanent forest estate and declared as Conservation Forests. It would be mandatory to manage Conservation Forests according to management plans and the extraction of NWFPs will be permitted only in specially designated zones. Management planning activities would require a resource assessment of all important NWFPs in a given area, which is not practiced today. Such resource assessments would enable the sustainable management of the important NWFPs. They would prevent the extinction of some of the rare utilizable plants. Due to the lack of stands of younger age classes and non-planting in the future, extraction of oleoresins from Caribbean Pine would cease during the next decade. Service functions of forests Securing one of the most important functions of the forests, i.e. ecological protection, will be commenced in the near future extending towards the next decade. As already mentioned earlier, forests with significant ecological value are being declared as Conservation Forests. In 2008, 11 forests were declared as Conservation Forests, making a total of 15. Surveying and boundary marking has been completed in 234 forests and these forests will be declared in new
APFSOS II: Sri Lanka
58
categories during 2009; most will be in the category of Conservation Forests. This will be a positive step towards ensuring the environmental service functions of forests in a sustainable manner. Special zones will be designated in Conservation Forests for local inhabitants to extract NWFPs. It is anticipated that the plantation growing stock would show much qualitative improvement by providing better yields as a result of better silvicultural practices. Each plantation sub-block will be an element in a comprehensive database with digital map attributes. The irregular age-class distribution of major plantation tree species would be brought to ‘normality’ by regulated fellings and restoration, which are planned at present. Under the present trend, a large part of the plantations with exotic species would be converted with indigenous trees wherever appropriate. Therefore, the structure of the growing stock in relation to age and species composition would be quite different from the present structure by the end of the next decade. Income generation from forests will be a continuing activity. The state forest plantations will continue to contribute to the national demand for wood and wood products. This will be supplemented by wood and wood products produced by the other tree growers explained in this report. Social functions of forests The social functions of forests somewhat overlaps with the services they render to society. The social significance of forests will be felt during the next decade in an enhanced manner due to increase of the population, urbanization and various development activities. The total area of home gardens in the country was estimated as 818,394 ha in 2002. With an average increase of 1% per annum, this extent would reach 965,704 ha in 2020. As home gardens are a potential source for timber and fuelwood, these additional areas needs to be stocked with utilizable trees. Therefore, extensive extension services should be continued during the next decade. The country will have an additional network of highways and new settlements by the end of the next decade. Avenue and roadside planting with trees will have multiple benefits such as improved aesthetic value, providing shade and roadside safety. Many new development projects, such as in the Eastern Province, would benefit from social forestry components. Social forestry programmes have been implemented in the past with the underprivileged strata of society as the beneficiaries. A certain part of the Farmers Woodlots established in the 1990s on lease agreements for 25 years under the Participatory Forestry Programme (1993-1990) will be ready for harvesting during the latter part of the next decade and the beneficiaries will receive a substantial income from intermittent and final yields. Social forestry programmes will replace the conventional forest plantation establishment and management programmes. Establishment of agroforestry woodlots is an efficient method to reduce the expansion of shifting cultivation. The role of ecotourism will be further enhanced towards the end of the next decade to cater to the needs of the population. The FD and the DWLC will increase their protected area networks and provide more opportunities in ecotourism for the population. An overview of the future of forests and forestry in 2020 It is very challenging for foresters to review the status of forests and forestry at the beginning of a new decade and to plan the necessary interventions for the well-being and the
APFSOS II: Sri Lanka
59
sustainability of the sector. The situation in 2020 is examined based on the facts revealed so far in this paper. A complete halt to the depletion of forest cover may not be possible as depletion is caused by many complex factors. However, due to many protective and other managerial measures, deforestation would take place at a slower rate. The loss could be compensated by increasing the cover of man-made forests as appropriate. Forest plantations will continue to produce high quality wood compared to other sources outside the forests. By 2020, the contribution of the forest plantations of the FD to the island’s requirement for wood and wood products may rise from the present level due to more intensive management and the expansion of the annual cutting areas. Possibility may also exist on the participation of private entrepreneurs for timber harvesting by competitive bidding, but this would depend on the prevailing government policies. It is anticipated that the forest plantations will have a more regular age-class structure and a slightly different species composition. The forest nurseries would be run on improved nursery techniques to produce better seedlings. Tree growers of the private sector would also contribute to the production of wood and wood products in a significant capacity. In this respect, the role of home gardens as a supplier of logs to small-scale saw mills especially in rural areas would be quite significant. However, the import of high quality construction timber from Southeast Asian countries would continue. The forestry scenario in the coming decade will be characterized by the declaration of a National Forest Estate with the categorization of each forest in an appropriate management class. Conservation and Reserved Forests will be managed according to approved management plans as required by legislature. The forestry administration would be further decentralized by delegating more authority to the regional forestry administration. The Forest Department Manual, expected to be published in 2008, will provide standard guidance for general forestry practices. Revisions to this manual during the period are not excluded. The possibility of having a revised forest policy by 2020 is anticipated, as policies depend mostly on the prevailing priorities at a given period of time. Critics of the present policy stress the fact that it does not include the role of forests in mitigating certain natural disasters. The availability of local funding and some physical resources would remain a bottleneck for forestry development during the decade, and therefore donor assistance would remain as a major requirement. One mechanism to address this issue would be to utilize the income generated by the FD, especially in the form of stumpage and to invest a part of the proceeds in a revolving fund meant to be used for forestry development. Under the present circumstances, such a proposal would seem to be overoptimistic, but may not be impossible to implement. Forestry in 2020 will be characterized by more stakeholder participation in both productive and protective spheres. The importance of forests and forestry will be felt more by society, due to their pivotal role in maintaining environmental safeguards, aesthetic and recreational significance. In spite of these factors, a fair balance between the protective and productive capacity of forests should be maintained, as wood and wood products will remain an eternal requirement.
APFSOS II: Sri Lanka
60
6. HOW COULD WE CREATE A BETTER FUTURE? A better future for the forestry sector could be created only by reviewing the present situation, identifying pros and cons, taking remedial measures and maintaining them in a sustainable manner. It should be borne in mind that forests are a renewable resource that can be restored and rejuvenated. Forestry is a long-term venture and therefore long-term planning and periodic reviewing of progress is necessary. The Forest Policy should be reviewed periodically and amendments need to be made where necessary. The forestry sector cannot be considered in isolation from other relevant sectors. Therefore much coordination will be needed with other sectors such as wildlife conservation, land use planning, water management, environmental management, the timber industry, paper manufacturing and disaster management etc. Initially, it will be sufficient to have this collaboration at policy making and planning levels. Raising the productivity of forest plantations is an essential activity that should be undertaken. This includes a wide number of activities such as improved seedling production, better site and species matching, improved planting techniques and better silvicultural treatment of the stands (these practices are currently being applied for the establishment of second rotation plantations and expect to increase productivity over original plantations that were established not necessarily to optimize commercial wood production). Felling and conversion should be done in a productive manner. Saw mills should be upgraded to ensure that losses are minimal during sawing. Many recent studies have been undertaken in this direction, and it is anticipated that forestry practices will be on the right track during the next decade. Within the sector itself, much collaboration will be needed among all stakeholders in planning and implementation. Projects undertaken with inadequate stakeholder analysis have failed. The orthodox nature of forest management has lost its significance in the recent past and a ‘participatory approach’ with the relevant stakeholders is now being promoted. A participatory approach is a commitment to equity in forest management. It ensures that local people can share in the benefits of forestry and can take decisions about forestry matters that affect their lives. This does not mean that the scientific basics of forest management would be neglected, but on the contrary it should be conveyed to the stakeholders in an appropriate manner. Cooperation on forestry matters should be maintained among the countries of the region. Although these countries may differ culturally and economically, problems facing the forestry sectors could be common. Regional cooperation among nations would form a common platform to discuss these problems and to find common solutions.
APFSOS II: Sri Lanka
61
7. SUMMARY AND CONCLUSIONS In Sri Lanka, the major institutions responsible for forests are the FD and the DWLC. In accordance with the current Forest Policy, the conservation aspect of forestry is given a high priority. In spite of intensive protective measures undertaken by the government, the forest cover is dwindling, but at a slower rate than in the past. The depletion of forest cover depends on many complex factors and this paper discusses the possible situation towards the end of the next decade by considering the multitude of relevant parameters. The country is for the most part self-sufficient in timber. In spite of this, construction timber and certain wood products are being imported. Due to the increasing prices of petroleum products which include LP gas and electricity, the demand for fuelwood is rising. On the other hand, the conservation value of forests is highly recognized by the government and society. A scenario analysis was undertaken to find the most possible situation of forests and the forestry sector in 2020. Out of a list of factors that affect the situation of forests in 2020, a few major factors were selected as key driving forces. The growth of the national economy and the government policies towards the national economy and forestry and the environment were selected as variables with highest uncertainties. The policies may change following local and global trends especially in energy and food production. A most possible scenario was identified by considering the current trends. The next decade will possibly be characterized by moderate economic growth depending on many factors. The state policy on environment and forestry will be highly conservation oriented and will be implemented at an adequate level. Some policy revisions may not be excluded. High deforestation may occur in areas with increased human activity, but this phenomenon will not be common to every location in the island. Conflicting situations between development work and conservation policies will arise from time to time. However, forest conservation will remain as a high priority area. The forestry sector of the country is now in a gradually changing environment. Efforts are being made to establish a permanent forest estate and to classify forests into appropriate management classes. Ad hoc management of forests has been replaced by regular management planning, and new technologies have been introduced. The orthodox forest management practices of the past have now been replaced by a participatory approach and oriented more towards social development. The forestry administration functions more on a decentralized basis, by delegating more authority to the territorial levels. Extension activities are given a high priority; hence the Sri Lankan society has a high awareness on the importance of forests and forestry.
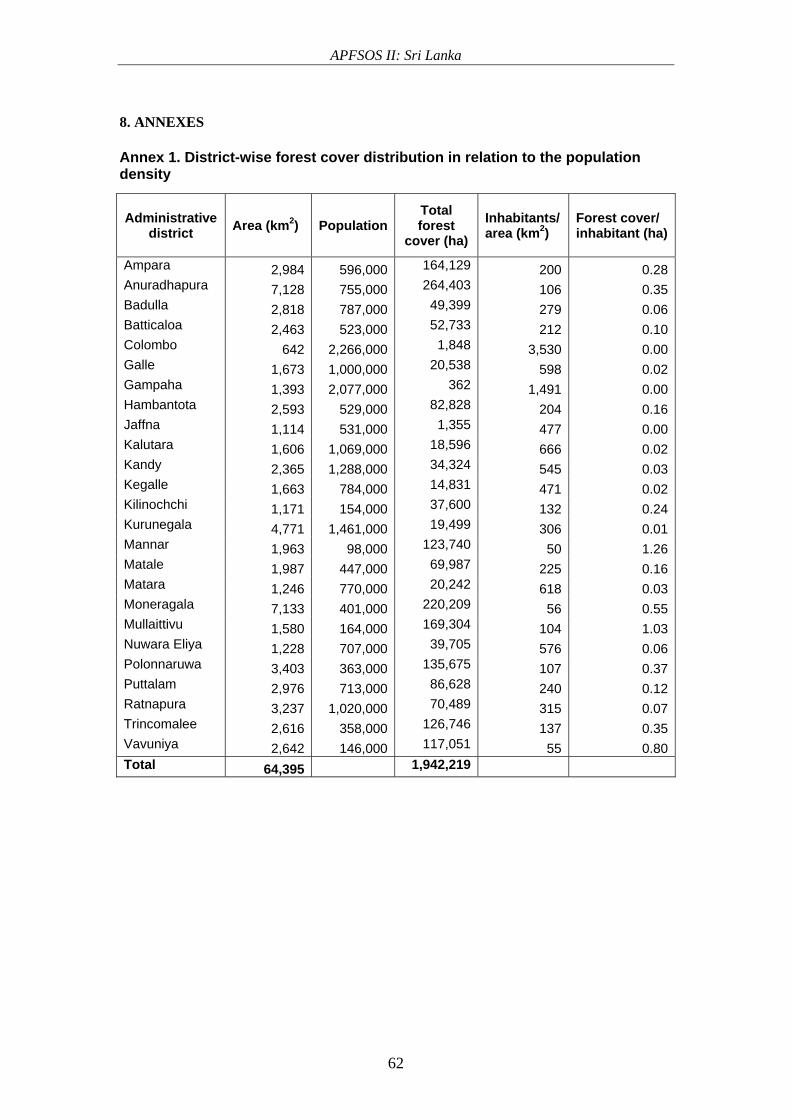
APFSOS II: Sri Lanka
62
8. ANNEXES Annex 1. District-wise forest cover distribution in relation to the population density
Administrative district Area (km2) Population
Total forest
cover (ha) Inhabitants/ area (km2)
Forest cover/ inhabitant (ha)
Ampara 2,984 596,000 164,129 200 0.28Anuradhapura 7,128 755,000 264,403 106 0.35Badulla 2,818 787,000 49,399 279 0.06Batticaloa 2,463 523,000 52,733 212 0.10Colombo 642 2,266,000 1,848 3,530 0.00Galle 1,673 1,000,000 20,538 598 0.02Gampaha 1,393 2,077,000 362 1,491 0.00Hambantota 2,593 529,000 82,828 204 0.16Jaffna 1,114 531,000 1,355 477 0.00Kalutara 1,606 1,069,000 18,596 666 0.02Kandy 2,365 1,288,000 34,324 545 0.03Kegalle 1,663 784,000 14,831 471 0.02Kilinochchi 1,171 154,000 37,600 132 0.24Kurunegala 4,771 1,461,000 19,499 306 0.01Mannar 1,963 98,000 123,740 50 1.26Matale 1,987 447,000 69,987 225 0.16Matara 1,246 770,000 20,242 618 0.03Moneragala 7,133 401,000 220,209 56 0.55Mullaittivu 1,580 164,000 169,304 104 1.03Nuwara Eliya 1,228 707,000 39,705 576 0.06Polonnaruwa 3,403 363,000 135,675 107 0.37Puttalam 2,976 713,000 86,628 240 0.12Ratnapura 3,237 1,020,000 70,489 315 0.07Trincomalee 2,616 358,000 126,746 137 0.35Vavuniya 2,642 146,000 117,051 55 0.80Total 64,395 1,942,219

APFSOS II: Sri Lanka
63
HEAD OF THE FOREST DEPARTMENT Conservator General of Forests
CF (Education & Research ) CF(Operations) CF(Administration) Director (Finance)
RESEARCH STATION(S)
CRO
SLFI Director
Production forestry SDCF
Social forestry & Extension
SDCF
Conservation forestry SDCF
Protection & Law enforcement
SDCF
Planning & monitoring
SDCF
Dy.Director (Finance)
Colombo region RDCF
Anuradhapura region RDCF
Ratnapura region RDCF
Nuwaraeliya region RDCF Research
Officers
Lecturers FORESTRY DIVISIONS (20)
Divisional Forest Officers
FOREST RANGES (73) Range Forest Officers
BEATS (389) Beat Forest Officers
Dy.Director
FORESTRY REGIONS(4)
TECHNICAL DIVISIONS (5)
Snr. Foresters, Foresters
Addtl. RFO, Forestry Extension Officers
Forest Field Assistants, watchers etc.
Annex 2. Institutional infrastructure of the Forest Department
APFSOS II: Sri Lanka
64
Annex 3. National Forestry Policy of 199528 1. National Forestry Policy objectives
o To conserve forests for posterity, with particular regard to biodiversity, soils, water, and historical, cultural, religious and aesthetic values.
o To increase the tree cover and productivity of the forests to meet the needs of present
and future generations for forest products and services.
o To enhance the contribution of forestry to the welfare of the rural population, and strengthen the national economy, with special attention paid to equity in economic development.
2. Policy on management of state forest resources
o All state forest resources will be brought under sustainable management both in terms of the continued existence of important ecosystems and the flow of forest products and services.
o The traditional rights, cultural values, and religious beliefs of people living within or
adjacent to forest areas will be recognized and respected.
o The natural forests will be allocated firstly for conservation, and secondly for regulated multiple-use production forestry.
o For the management and protection of the natural forests and forest plantations, the
state will, where appropriate, form partnerships with local people, rural communities and other stakeholders, and introduce appropriate tenurial arrangements.
o The establishment and management of industrial forest plantations on the state lands
will be entrusted progressively to local people, rural communities, industries and other private bodies, in pace with institutionalizing effective environmental safeguards.
o Degraded forestland will be rehabilitated as forest for conservation and multiple-use
production, where it is economically and technically feasible, mainly for the benefit of local people.
o Planned conversion of forests into other land uses can take place only in accordance
with procedures defined in legislation and with accepted conservation and scientific norms.
3. Policy on management of private forest and tree resources
o Tree growing on homesteads, and other agro-forestry, will be promoted as a main strategy to supply wood and other forest products for meeting household and market needs.
28 An extract of the document “National Forest Policy and Executive Summary” published by the Ministry of Agriculture, Lands and Forestry in November 1995.
APFSOS II: Sri Lanka
65
o The establishment, management, and harvesting of industrial forest plantations by local people, communities, industries, and others in the private sector will be promoted.
o The state will promote tree growing by local people, rural communities, NGOs and other non-state sector bodies for the protection of environmentally sensitive areas.
4 Policy on wood and non-wood forest products, industries and marketing
o Greater responsibility will be given to local people, organized groups, cooperatives, industries, and other private bodies in commercial forest production, industrial manufacturing, and marketing.
o Efficient forest products utilization, development of competitive forest industries
based on sustainable wood sources, and manufacture of value-added forest products will be promoted.
o The state will facilitate the harvesting and transport of forest products grown on
private lands. o Effective measures to protect the forests and prevent illegal trade in wood, non-wood
forest products and in endangered species of flora and fauna will be instituted. 5 Policy on institutional support for forestry development
o The National Forestry Policy will be kept up to date and implemented in a participatory and transparent manner.
o Legislation will be amended or revised, as necessary, to support the implementation
of the policy. o The state will provide full support to the various resource managers for sustainable
forestry development, and its institutions will be reoriented and strengthened to enable them to accomplish their role.
o The state will coordinate, carry out and promote research that pays attention to the
requirements of beneficiaries and supports the implementation of the sectoral policy. o NGOs and community-based organizations will be supported in their forest-based
rural development activities. 6. Policy on intersectoral linkages
o The National Forestry Policy and other sectoral policies will be kept consistent with each other.
o Efficient use of scarce forest products and their substitution by other materials will be
promoted. o Nature-based tourism will be promoted to the extent that it does not damage the
ecosystems and insofar as it provides benefits to the local population. o Urban forests and greenery will be developed and maintained.

APFSOS II: Sri Lanka
66
o The general public and industries will be educated about the importance of forestry, and of conserving biodiversity and protecting watersheds.
7. Policy on international forest-related conventions o The state will observe international forest-related conventions and principles that
have been agreed to by Sri Lanka.