Embed Size (px)
Citation preview
Srishti Bhatnagar
Household Debt Service Ratio: Indicator of Consumer Spending and Financial Stability in the United States
Abstract: Debt is a big indicator in any nation’s economic growth. The debt of a specific household, otherwise known as the Household Debt Service Ratio, is one example of an economic indicator that can potentially explain the upward and downward swings of an economy. This report contains supporting data on this indicator taken from the Federal Reserve Board, Trading Economics website, and the Federal Reserve Economic Data site. Looking at data from these sources show just how much household debt determines consumer spending which then affects the nation’s economy and how financially stable it is. The data shows that, specifically in the US, higher household debts decrease consumer spending which, in return, increase the chance of a recession in an economy. In 2008, the US economy experienced a major economic downfall in the housing market. In the aftermath of that recession, recent household debt service ratios have been indicating nothing less than a stable economy aiming for positive growth. Household Debt Service Ratio: The Household Debt Service Ratio, otherwise referred to as DSR, is a strong indicator of the well-being of an economy. It is particularly indicative of a possible economic crisis as the ratio explains a lot of the current level of consumer spending and it is calculated quarterly.1 Logically, a higher than normal ratio of debt means that consumers are burdened with more debt than usual and accompanied with a decline in spending. So an economic downturn is most likely the result of household debt service ratios staying at relatively high levels for a long period of time. Alternatively, a series of low household debt ratios usually indicates that people are currently harboring reasonable amounts of debt and they do not feel pressured or stressed by their financial situations. In this scenario consumer spending is at higher levels which means, by an extension, the economy experiences growth. Thus the DSR is a countercyclical indicator for the economy. It tends to decrease when the economy is growing and increase when the economy is failing. Unfortunately, the Household Debt Service is only an overall estimate of the debts consumers face. It is nearly impossible to account for every single loan made in every single household so the data for this index can never be exact1. However, as with many types of data, once large amounts of DSR data is amassed definite trends of the burden of household debts can be clear. Another important economic indicator that is usually shown alongside the Household Debt Service Ratio is the Financial Obligations Ratio. This second ratio includes the DSR as well as “rent payments for tenants, real estate taxes and home insurance for homeowners. It also includes, as part of income, rent paid by tenants to property owners”2. As a result, the Financial Obligations Ratio, or the FOR, is always greater than the DSR. Alone, the DSR cannot give an accurate representation of all debt a consumer in the economy is facing because it only covers mortgages and consumer debt payment. That is why the DSR is always reported alongside the
FOR. Together, these ratios give a complete representation of the burden of all kinds of debt on a consumer. Calculating the DSR:
Starting from quarter 3 of the year 2013 the Federal Reserve Board of Governors decided to alter the way the Household Debt Ratio is displayed3. Now when the DSR is calculated, it is comprised of two smaller components: the Mortgage DSR and the Consumer DSR. The Mortgage Debt Service Ratio is calculated by dividing the total quarterly required mortgage payments by total quarterly disposable personal income. Similarly, the Consumer DSR is found by dividing total quarterly scheduled consumer debt payments by a consumer’s total quarterly disposable personal income. The sum of the Mortgage DSR and the Consumer DSR gives us the total DSR or Household Debt Service Ratio which is the total quarterly debt payments of a consumer divided by the total quarterly disposable personal income.
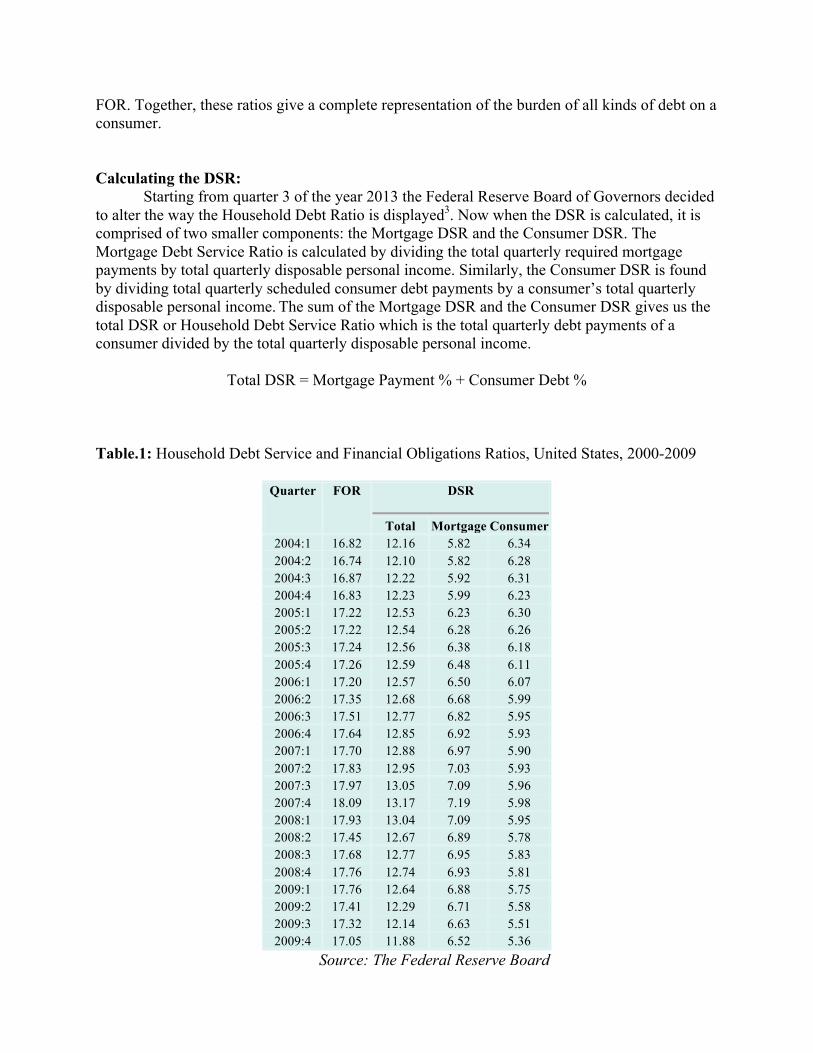
Total DSR = Mortgage Payment % + Consumer Debt % Table.1: Household Debt Service and Financial Obligations Ratios, United States, 2000-2009
Quarter FOR DSR
Total Mortgage Consumer 2004:1 16.82 12.16 5.82 6.34 2004:2 16.74 12.10 5.82 6.28 2004:3 16.87 12.22 5.92 6.31 2004:4 16.83 12.23 5.99 6.23 2005:1 17.22 12.53 6.23 6.30 2005:2 17.22 12.54 6.28 6.26 2005:3 17.24 12.56 6.38 6.18 2005:4 17.26 12.59 6.48 6.11 2006:1 17.20 12.57 6.50 6.07 2006:2 17.35 12.68 6.68 5.99 2006:3 17.51 12.77 6.82 5.95 2006:4 17.64 12.85 6.92 5.93 2007:1 17.70 12.88 6.97 5.90 2007:2 17.83 12.95 7.03 5.93 2007:3 17.97 13.05 7.09 5.96 2007:4 18.09 13.17 7.19 5.98 2008:1 17.93 13.04 7.09 5.95 2008:2 17.45 12.67 6.89 5.78 2008:3 17.68 12.77 6.95 5.83 2008:4 17.76 12.74 6.93 5.81 2009:1 17.76 12.64 6.88 5.75 2009:2 17.41 12.29 6.71 5.58 2009:3 17.32 12.14 6.63 5.51 2009:4 17.05 11.88 6.52 5.36
Source: The Federal Reserve Board
This table above taken from the Federal Reserve Board contains the Household Debt
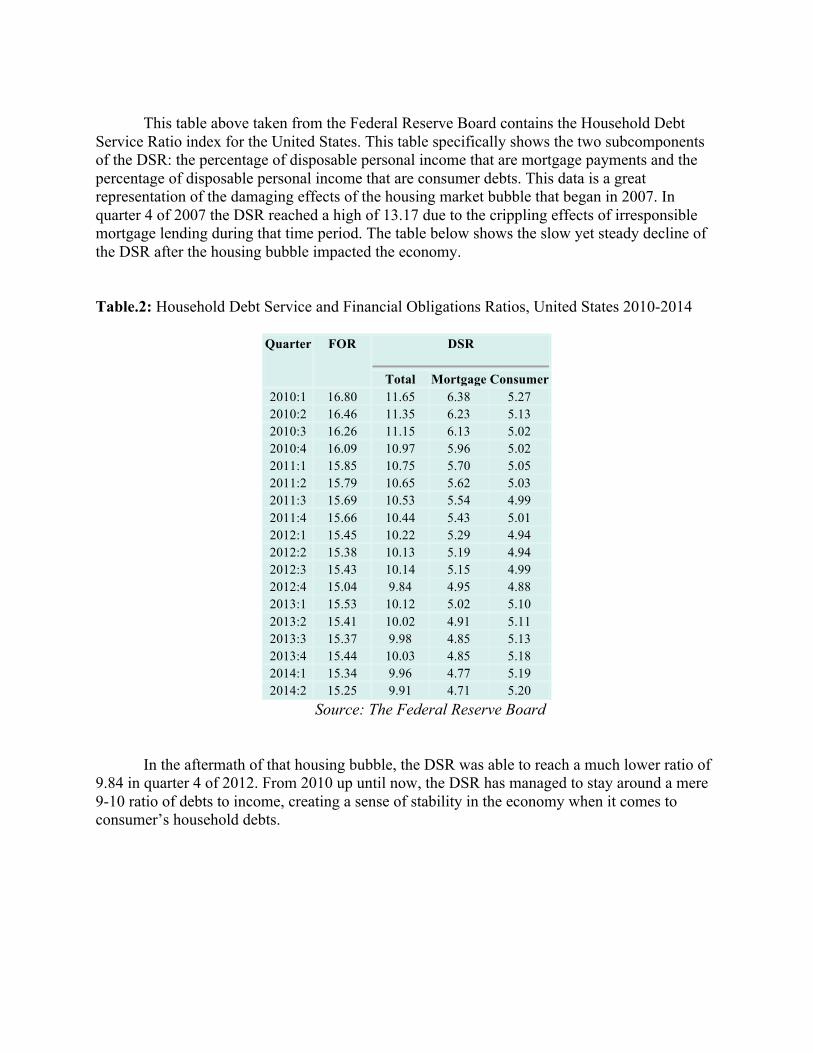
Service Ratio index for the United States. This table specifically shows the two subcomponents of the DSR: the percentage of disposable personal income that are mortgage payments and the percentage of disposable personal income that are consumer debts. This data is a great representation of the damaging effects of the housing market bubble that began in 2007. In quarter 4 of 2007 the DSR reached a high of 13.17 due to the crippling effects of irresponsible mortgage lending during that time period. The table below shows the slow yet steady decline of the DSR after the housing bubble impacted the economy. Table.2: Household Debt Service and Financial Obligations Ratios, United States 2010-2014
Quarter FOR DSR
Total Mortgage Consumer 2010:1 16.80 11.65 6.38 5.27 2010:2 16.46 11.35 6.23 5.13 2010:3 16.26 11.15 6.13 5.02 2010:4 16.09 10.97 5.96 5.02 2011:1 15.85 10.75 5.70 5.05 2011:2 15.79 10.65 5.62 5.03 2011:3 15.69 10.53 5.54 4.99 2011:4 15.66 10.44 5.43 5.01 2012:1 15.45 10.22 5.29 4.94 2012:2 15.38 10.13 5.19 4.94 2012:3 15.43 10.14 5.15 4.99 2012:4 15.04 9.84 4.95 4.88 2013:1 15.53 10.12 5.02 5.10 2013:2 15.41 10.02 4.91 5.11 2013:3 15.37 9.98 4.85 5.13 2013:4 15.44 10.03 4.85 5.18 2014:1 15.34 9.96 4.77 5.19 2014:2 15.25 9.91 4.71 5.20
Source: The Federal Reserve Board
In the aftermath of that housing bubble, the DSR was able to reach a much lower ratio of
9.84 in quarter 4 of 2012. From 2010 up until now, the DSR has managed to stay around a mere 9-10 ratio of debts to income, creating a sense of stability in the economy when it comes to consumer’s household debts.
0,47
0,48
0,49
0,5
0,51
0,52
0,53
0,54
0,55
0,56
2002 2004 2006 2008 2010 2012 2014 2016
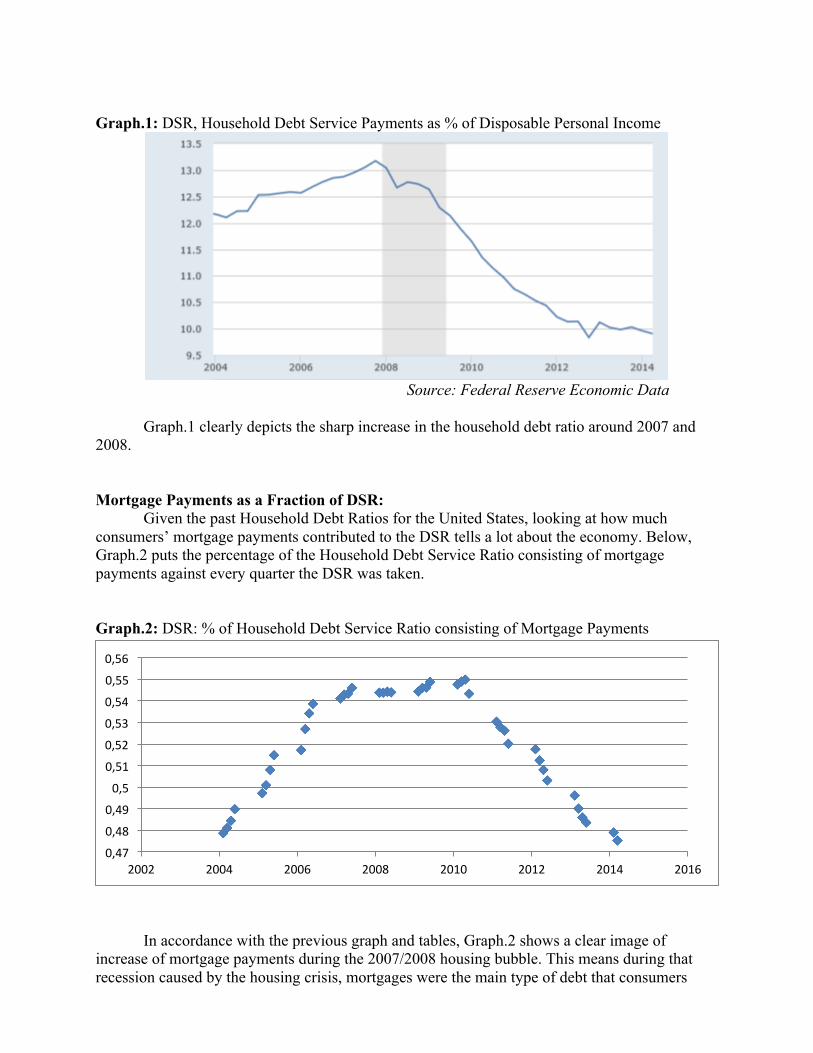
Graph.1: DSR, Household Debt Service Payments as % of Disposable Personal Income
Source: Federal Reserve Economic Data
Graph.1 clearly depicts the sharp increase in the household debt ratio around 2007 and 2008. Mortgage Payments as a Fraction of DSR: Given the past Household Debt Ratios for the United States, looking at how much consumers’ mortgage payments contributed to the DSR tells a lot about the economy. Below, Graph.2 puts the percentage of the Household Debt Service Ratio consisting of mortgage payments against every quarter the DSR was taken. Graph.2: DSR: % of Household Debt Service Ratio consisting of Mortgage Payments
In accordance with the previous graph and tables, Graph.2 shows a clear image of
increase of mortgage payments during the 2007/2008 housing bubble. This means during that recession caused by the housing crisis, mortgages were the main type of debt that consumers
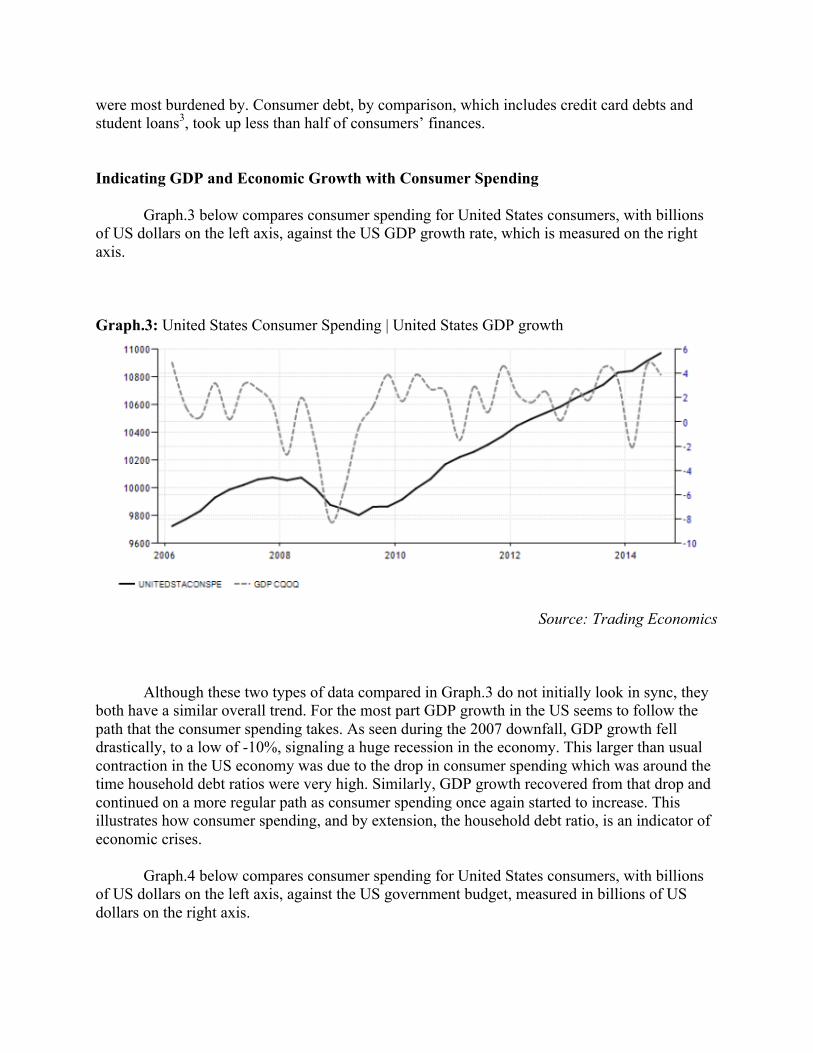
were most burdened by. Consumer debt, by comparison, which includes credit card debts and student loans3, took up less than half of consumers’ finances. Indicating GDP and Economic Growth with Consumer Spending Graph.3 below compares consumer spending for United States consumers, with billions of US dollars on the left axis, against the US GDP growth rate, which is measured on the right axis. Graph.3: United States Consumer Spending | United States GDP growth
Source: Trading Economics Although these two types of data compared in Graph.3 do not initially look in sync, they both have a similar overall trend. For the most part GDP growth in the US seems to follow the path that the consumer spending takes. As seen during the 2007 downfall, GDP growth fell drastically, to a low of -10%, signaling a huge recession in the economy. This larger than usual contraction in the US economy was due to the drop in consumer spending which was around the time household debt ratios were very high. Similarly, GDP growth recovered from that drop and continued on a more regular path as consumer spending once again started to increase. This illustrates how consumer spending, and by extension, the household debt ratio, is an indicator of economic crises.
Graph.4 below compares consumer spending for United States consumers, with billions of US dollars on the left axis, against the US government budget, measured in billions of US dollars on the right axis.

Graph.4: United States Consumer Spending | United States Government Budget
Source: Trading Economics
Graph.5 below compares consumer spending for United Kingdom consumers, with millions of British Pounds on the left axis, against the UK government budget, measured in millions of British Pounds on the right axis. Graph.5: United Kingdom Consumer Spending | United Kingdom Government Budget
Source: Trading Economics Graph.4 and Graph.5, illustrate a possible connection between spending at the consumer level and the government budget. For example, it is clear that consumer spending and the government budget dropped (around early 2008) and rose (around 2010) at around the same times. Looking at Graph.5, there seems to be an even greater correlation between consumer spending and government budget.

Both graphs seem to tell us that consumer spending roughly indicates how much the government budget is. In Graph.4 and Graph.5, each country’s government budget is lagging and tends to follow the path of that consumer spending takes. This further proves that thee household debt service, which tells us how consumer spending is in the economy, can really indicate troublesome or expanding times in the economy. So far, all data and graphs have clearly pointed out that the DSR signaled a recession in the US economy at around the end of 2007. If the household debt service ratio was able to point out such significant economic changes then it is a reliable indicator for financial stability in the economy as well as future economic recessions or booms. Endnotes
1. "Household Debt Service and Financial Obligations Ratios." The Federal Reserve Board.
Web. 11 Nov. 2014. http://www.federalreserve.gov/releases/housedebt/about.htm.
2. "Household Debt Service and Financial Obligations Ratios -‐ Federal Reserve." IRE. Web. 10 Nov. 2014. https://www.ire.org/resource-‐center/econocheck/household-‐debt-‐service-‐and-‐financial-‐obligations-‐ratios/.
3. "Household Debt Service and Financial Obligations Ratios (FOR)." The Federal Reserve
Board. 9 Dec. 2013. Web. 11 Nov. 2014. http://www.federalreserve.gov/feeds/for.html.


