Embed Size (px)
Citation preview

International Journal of Geoengineering Case Histories ©, Vol. 3, Issue 3, p. http://casehistories.geoengineer.org
162
Stacked Tunnelling Induced Surface Settlements in Soft Soil – A Case Study from Singapore
GT Senthilnath, Geoconsult Asia Singapore Private Limited, Singapore; email: [email protected]
Diwakar Velu, Land Transport Authority, Singapore; email: [email protected]
ABSTRACT: The growing demand for public and sustainable transportation in heavily urbanized areas like Singapore
requires construction of an increasing number of Metro Lines. Complicated technical challenges are associated with such
an activity and settlement prediction models play a key role in assessing the tunnelling-related risk assessments and
planning mitigation techniques. Although a significant amount of research has been performed to study the settlements
induced by side-by-side twin tunnels, the settlement prediction of stacked tunnelling has been, relatively, limited. In this
paper, stacked tunnelling induced settlements are predicted using 2D numerical simulation. The extensive data from the
instrumentation measurements collected during the construction of a stacked configuration tunnel in Singapore Downtown
Line MRT tunnels have been used to study the validity of the principle of superposition for stacked tunnels. Key
observations are presented by comparing empirical, numerical and actual field settlement data. Using the Monte-Carlo
simulation technique, the empirical trough parameter is back-calculated to fit the actual settlements observed in Kallang
formation. This could be used for future settlement predictions in similar ground conditions.
KEYWORDS: Stacked tunnelling, soft soil, buildings, TBM, Monte-Carlo simulation
SITE LOCATION: IJGCH-database.kmz (requires Google Earth)
INTRODUCTION
Singapore has been expanding the Mass Rapid Transit system in the recent years. The current project in progress is the
Downtown Line (DTL) which is the Fifth MRT line in Singapore and upon completion it will be Singapore’s longest
automated underground line. This will connect the north western and eastern regions of Singapore to the Central Business
District and Marina Bay area comprising of 32 stations and is 43 km long. The whole project is being constructed in three
stages as shown in Figure 1.
Figure 1. Alignment of Downtown Line in Singapore MRT System.
Submitted: 05 November 2015; Published: 10 October 2016
Reference: Senthilnath, G.T., and Velu, D. (2016). Stacked Tunnelling Induced Surface Settlements in Soft Soil – A
Case Study from Singapore. International Journal of Geoengineering Case histories,
http://casehistories.geoengineer.org, Vol.3, Issue 3, p.162-175. doi: 10.4417/IJGCH-03-03-03

International Journal of Geoengineering Case Histories ©, Vol. 3, Issue 3, p. http://casehistories.geoengineer.org
163
Currently, DTL Stage1 is completed and is in operation whereas DTL Stage 2 and DTL Stage 3 are still in the construction
phase. Downtown Line Stage 3 is divided further into 3 Packages. This paper discusses the stacked tunnelling induced
settlement at the DTL Stage 3 Package A - Contract Bendemeer Station (C933). Contract C933 has 4 EPB drives from the
Bendemeer station, 2 drives each on east and west side. The Bendemeer station is being built under the Kallang Bahru Road
and will serve commuters accessing to the commercial and industrial buildings in the area. The tunnel alignment on the
west drive (towards Jalan Besar station) runs under a number of public roads including the Jalan Besar, the Lavender Street
etc. whereas the east side has to undercross the Kallang River. Due to various site constraints along the alignment a
significant section of these tunnels have to be stacked. The ground conditions show both tunnels are in Old Alluvium (OA-
A) strata and Kallang strata on east side (as shown in Figure 2). Because of the sensitive ground and adjacent critical
structures along the alignment, an extensive instrumentation regime has been implemented. Location of instrumentation
arrays installed along the alignment is shown in Figure 3.
Figure 2. Geological profile along the alignment.
Figure 3. Location of monitoring instrumentation arrays along the alignment.
TBM FACE PRESSURE
Figure 4 shows the target face pressure and actual pressure along the alignment for Tunnel 1 (Bukit Panjang bound tunnel)
and Tunnel 2 (Expo bound tunnel). Since the overburden of the two tunnels is different, normalized face pressure is
presented in Figure 5 for comparing the TBM face pressure in both drives. Table 1 shows the face pressure at different
Chainage locations together with the nearest instrumentation array.

International Journal of Geoengineering Case Histories ©, Vol. 3, Issue 3, p. http://casehistories.geoengineer.org
164
Figure 4. Face Pressure Plot for Tunnel 1 and Tunnel 2.
Figure 5. Normalized face pressure.
Table 1. Details of TBM Face Pressure at array locations.
Ring No. Instrumentation Array Actual Face Pressure
[bar]
BP Bound
(Tunnel 1)
142 D 3.1
255 P1 2.65
438 C1 2.5
488 C2 2.6
545 C 4.8
635 B 4.7
Expo Bound
(Tunnel 2)
115 D 2.4
215 P1 1.9
398 C1 1.7
448 C2 2.5
505 C 3.1
611 B 3.1

International Journal of Geoengineering Case Histories ©, Vol. 3, Issue 3, p. http://casehistories.geoengineer.org
165
EVALUATION OF SETTLEMENTS
Empirical Methods
With recent advancements in numerical modelling capability, finite element modelling has become a very popular tool in
prediction of tunnelling induced ground settlement. However, the use of numerical modelling always required
understanding of constitutive material model selection to represent soil behaviour. Thus, there has always been an emphasis
on simple, but reliable, methods for estimation of tunnelling induced settlements. The empirical formulation commonly
utilised in engineering practice is developed by Peck (1969) and Schmidt (1974). Peck (1969) and New and O’Reilly
(1992) assumed that the transverse ground settlement trough can be reasonably represented by a Gaussian (or Normal)
distribution curve as shown in Figure 6.
Figure 6. Ground settlement trough induced by a single tunnel.
From the Gaussian distribution curve, the empirical equation for settlement is:
(1)
where S is the ground surface settlement at a distance ‘x’ from the tunnel centre, Smax is the maximum ground settlement
at the vertical tunnel axis. Trough width parameter i, is the distance from the tunnel centre line to the point of inflexion of
the trough. Mair et al. (1993) suggested that the total half width of the settlement trough is about 2.5i.
As an improvement to Peck’s empirical method, Sagaseta et al. (1980) proposed a modified Peck’s error curve to consider
some additional tunnel and ground parameters like Young’s modulus and Poisson’s ratio. Romo and Diaz (1981) proposed
an empirical formula derived from finite element analysis which considers additional parameters like horizontal stress, face
pressure acting at the excavation face and the average value of strain at failure (Romo and Diaz, 1981).
Analytical Methods
Sagaseta et al. (1987) proposed a closed form solution by combining fluid flow with elastic solution for half space. This
method allows the strain field evaluation in an initially isotropic and homogeneous incompressible soil. Later, Booker and
Verruijt (1998) presented an analytical solution using generalisation of the Sagaseta’s solution. This method allows for the
computation of surface vertical displacements as well as vertical displacements at different depths below ground level and
horizontal displacements along a cross-section.

International Journal of Geoengineering Case Histories ©, Vol. 3, Issue 3, p. http://casehistories.geoengineer.org
166
Figure 7. Ground deformation (a) Uniform radial displacement (b) Oval shaped radial displacement.
Loganathan and Poulos (1998) presented a modified form of Booker and Verruijt (1998) by suggesting the use of a
modified equivalent ground loss parameter. The surface settlement and lateral displacement can be obtained as
(2)
(3)
where, g is the gap parameter, H is the depth of tunnel from the ground surface, R is the radius of the tunnel, z is the depth
measure from the ground surface and x is the lateral distance from the tunnel centre line. Recent methods like Pinto and
Whittle (2014) have proposed simplified analytical closed form solution to account for soil plasticity in the analysis.
Numerical Methods
The tunnelling process is a three dimensional problem which involves stress change and deformation in all three directions.
However for the simplified modelling, it is reasonable to assume a plane strain or two dimensional model for a long tunnel
section in studying tunnelling induced settlements. In order to simulate tunnel excavation in 2D FE analysis, the effect of
the missing third dimension has in some way to be included. Figure 8 shows the 3D arch around the unsupported tunnel
heading by displaying rotated principal stress directions. This arch is able to carry the vertical ground loads by transferring
them around the unsupported cut stretch.
Figure 8. 3D arch support and 2D FE approximation with support pressure.
When using 2D numerical analysis to simulate tunnel excavation, consideration must be given to the ground in front of the
shield machine which will move both radially and axially towards the tunnel face. To simulate shield tunnelling 2D FE
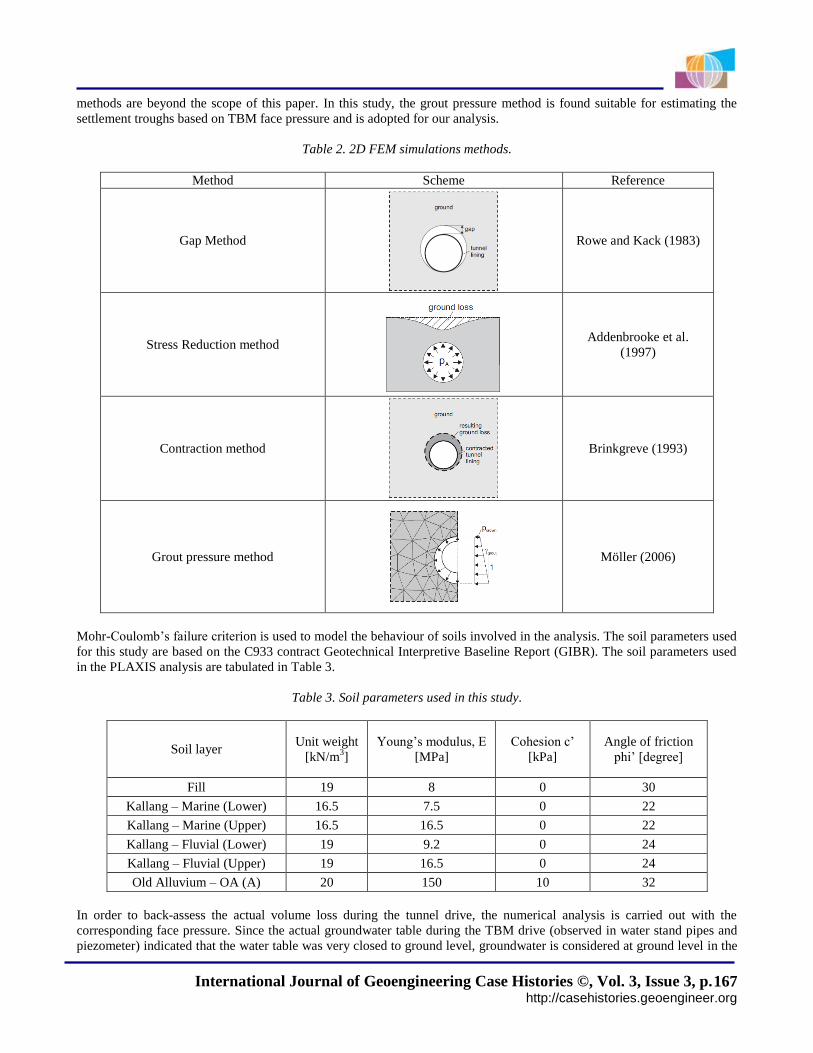
analysis are frequently used and different methods are used to simulate the ground loss and settlement (Möller 2006). Table
2 lists the different methods possible for simulating the TBM installation in 2D model. Detailed explanation of all the
International Journal of Geoengineering Case Histories ©, Vol. 3, Issue 3, p. http://casehistories.geoengineer.org
167
methods are beyond the scope of this paper. In this study, the grout pressure method is found suitable for estimating the
settlement troughs based on TBM face pressure and is adopted for our analysis.
Table 2. 2D FEM simulations methods.
Method Scheme Reference
Gap Method
Rowe and Kack (1983)
Stress Reduction method
Addenbrooke et al.
(1997)
Contraction method
Brinkgreve (1993)
Grout pressure method
Möller (2006)
Mohr-Coulomb’s failure criterion is used to model the behaviour of soils involved in the analysis. The soil parameters used
for this study are based on the C933 contract Geotechnical Interpretive Baseline Report (GIBR). The soil parameters used
in the PLAXIS analysis are tabulated in Table 3.
Table 3. Soil parameters used in this study.
Soil layer Unit weight
[kN/m3]
Young’s modulus, E
[MPa]
Cohesion c’
[kPa]
Angle of friction
phi’ [degree]
Fill 19 8 0 30
Kallang – Marine (Lower) 16.5 7.5 0 22
Kallang – Marine (Upper) 16.5 16.5 0 22
Kallang – Fluvial (Lower) 19 9.2 0 24
Kallang – Fluvial (Upper) 19 16.5 0 24
Old Alluvium – OA (A) 20 150 10 32
In order to back-assess the actual volume loss during the tunnel drive, the numerical analysis is carried out with the
corresponding face pressure. Since the actual groundwater table during the TBM drive (observed in water stand pipes and
piezometer) indicated that the water table was very closed to ground level, groundwater is considered at ground level in the

International Journal of Geoengineering Case Histories ©, Vol. 3, Issue 3, p. http://casehistories.geoengineer.org
168
FEM model. After obtaining the initial stresses, all the nodal displacements were then reset to zero prior to the excavation
of tunnels. The analysis for this study typically involved the following stages: Stage 1 involved initialization of the stresses.
Stage 2 involved the excavation of the first tunnel and subsequent installation of its lining elements. The tunnel lining is
simulated as flexible impermeable membrane (with low flexural and axial stiffness). The impermeable membrane ensures
prevention of any dissipation of applied face pressure. The pore-water pressure inside the tunnel is modified to simulate the
TBM face pressure (based on actual face pressure used for the TBM driving at that particular chainage). Stage 3 involved
the excavation of the second tunnel and installation of its lining parameters. The pore pressure is similarly set to simulate
the TBM operating face pressure. The settlement trough at the end of stage 2 and stage 3 is extracted from the PLAXIS
output. This settlement troughs are integrated to obtain the equivalent volume loss caused by Tunnel 1 and combined
volume loss caused by Tunnel 1 + Tunnel 2. The above simulation could have been performed by using tail void grout
pressure instead of TBM operating pressure but it was noted that grout pressure data at certain location spiked and were
sporadic due to clogging and various other operational issue and hence not considered in this study.
Actual Settlement (Field Measurements)
A total of six monitoring arrays were installed at ground surface along the stretch under discussion. Each array consists of
11 to 16 settlements markers used to monitor the transverse ground settlement during and after the excavation of the
stacked tunnels. The location of these settlement markers are shown in Figure 9. Maximum field measurements recorded 1-
2 days after the TBM has crossed the monitoring array has been considered as the instantaneous settlement caused due the
TBM crossing (i.e, the TBM just crossed the monitoring arrays when the readings were recorded for this analysis).
The development of transverse ground surface settlement troughs of each array during the tunnelling is shown in Figure 10.
The maximum ground surface settlement observed from this study ranged from 5 mm to 15 mm. Comparison of these
estimates are performed at the six array location along the stretch under study. The corresponding ground information and
tunnel alignment data are represented in Figure 9.
(a) Section B
(b) Section C

International Journal of Geoengineering Case Histories ©, Vol. 3, Issue 3, p. http://casehistories.geoengineer.org
169
(c) Section C1
(d) Section D
(e) Section D
Figure 9. Ground information and array arrangement.
Table 4. Comparison of actual and design Volume Loss.
Array
Design
Volume
Loss [%]
Expected Volume loss for
the applied face pressure
[%]
Actual Volume Loss (back
calculated based on actual
trough) [%]
Numerical Observed
B 3 1.5 0.5
C 3 1.4 1.24
C1 1 0.88 0.12
D 1 0.6 0.1
P1 1 0.75 0.17

International Journal of Geoengineering Case Histories ©, Vol. 3, Issue 3, p. http://casehistories.geoengineer.org
170

International Journal of Geoengineering Case Histories ©, Vol. 3, Issue 3, p. http://casehistories.geoengineer.org
171

International Journal of Geoengineering Case Histories ©, Vol. 3, Issue 3, p. http://casehistories.geoengineer.org
172
Figure 10. Comparison of Empirical results, numerical results and field measurements.
Figure 10 shows settlement predictions based on the empirical method, numerical method and the actual field settlement
data. The empirical estimate of settlement pattern is shown in solid line (blue and red, blue line indicates the settlement due
to T1 alone, whereas red line indicates the combined settlement due to T1 and T2). Dotted line represents the settlement
trough from numerical simulation. Actual field settlement data are shown as points – scatter plot. Table 4 presents the
comparison of design volume loss, expected volume loss and actual volume loss. Expected volume loss is calculated by
integrating the settlement trough obtained from the numerical analysis. The design volume loss presented in second column
of Table 4 is the volume loss considered for the emperical settlement prediction.
Among the five array sections studied, three sections (Array C, C1 and P1) are the sections in which the tunnels are stacked
nearly one above the other. Maximum surface settlements at these sections over a period of six months are studied and
presented in Figure 11. The settlement vs time plot for the tunnels passing through old alluvium (OA-A) soil (array P1 and
C1) do not indicate any particular pattern. However, the settlement vs time plot in Kallang formation (array C) clearly
indicates that most of the ground movement occurs immediately after mining of first tunnel. Longitudinal ground
settlement profile in Kallang formation is represented using scattered plot in Figure 12. Positive X axis indicates distance
behind the TBM cutter head and Negative X axis indicated distance ahead of TBM cutter head (i.e, the TBM is considered
to move from right to left direction). Scattered data on left side of the vertical line (monitored section) indicates settlement
observed ahead of the TBM. From the (polynomial) trend line, it can be clearly noted that the ground settlement starts
significantly ahead of the TBM excavation face and the settlement continues even after the TBM has passed the monitored
section.

International Journal of Geoengineering Case Histories ©, Vol. 3, Issue 3, p. http://casehistories.geoengineer.org
173
(a) In Old Alluvium (OA-A)
(b) In Kallang Formation
Figure 11. Maximum surface settlement over time recorded by various arrays.
Figure 12. Surface settlement ahead of TBM excavation face.

International Journal of Geoengineering Case Histories ©, Vol. 3, Issue 3, p. http://casehistories.geoengineer.org
174
RESULTS AND DISCUSSION
Stacked Tunnel Settlements
The results presented in Figure 10 indicate the surface settlement trough using numerical analysis and Peck’s formulation.
In general, the trend of the settlement trough is similar in all the scenarios. Most of the ground movement seems to occur
during the excavation of the first tunnel and the total volume loss is observed to be less than the summation of the volume
loss of the two tunnels separately. Peck’s empirical estimation (for the given trough parameter), which are based on the
Gaussian form, seem to overestimate the settlements. Numerical analysis for the exact TBM face pressure predicted
settlement values which are similar in magnitude to the actual field measurements.
The width of the settlement trough is more appropriately predicted by the numerical analysis because the exact face
pressure is used to predict the settlement pattern. It is to be noted that Rowe and Cack (1983) reported that the numerical
analysis overestimates the width of the settlement trough if the settlement trough is calculated based on the contraction
parameter in PLAXIS software. It is demonstrated in this study that the use of actual face pressure in estimating the
deformations results in realistic settlement trough.
Applicability of Peck’s Empirical Formula
This study examines the validity of the principle of superposition and appropriateness of the trough parameter (k)
prescribed in LTA CDC guidelines for the encountered soil in this project. Although Peck’s equation is more superior in
estimating the transverse ground surface settlements induced by tunnelling than the cumbersome FE analysis (Chen et al.
2012), the choice of trough parameters plays a key role in estimating the settlement pattern which is closer to reality. In the
present analysis, the trough parameter is set as per LTA CDC guidelines and it is observed that the assumed trough
parameter (k) does not represent a realistic settlement trough. Available field data is used to curve fit and back-calculate the
appropriate parameter for the Kallang formation and presented in Table 5. In order to achieve a good Gaussian curve fit,
Monte Carlo simulation with a large number of fictitious k values are performed to determine The root mean square error
(RMSE) for each of the fictitious k values. The median value of k with the least error is chosen as the appropriate trough
parameter for the selected soil type.
Table 5. Recommended trough parameter k.
Soil layer Recommended trough parameter LTA CDC Guidelines
Kallang Formation 0.7 0.5
Excavation Parameters Influencing Surface Settlements
The role of TBM operating pressure and grouting pressure in the volume loss has been reported in recent projects (Fargnoli
et al. 2013, Russo et al. 2013, Shirlaw et al. 2002 and Dimmock et al. 2002). In this study, an attempt was made to explore
the relationship between volume loss and face pressure (based on TBM operational parameters in Kallang formation). Since
the face pressure and grouting pressure have similar effect in volume loss control, the data points were combined to plot
this trend. The data is mostly dispersed and no particular conclusion could be drawn based on our limited data; hence is not
included in this paper. Usually higher face pressure / backfill grout pressure (for a given ground condition) will lead to
lower volume loss.
CONCLUSION
This paper focused on the settlements of stacked tunnels of C933 Contract in Downtown Line 3 in Singapore MRT System,
constructed using EPB machine. A series of ground settlement analyses have been carried out for a stacked tunnel using an
empirical equation (that assumed principle of superposition) as well as numerical simulation and were compared with the
actual field settlement data. Key observations are presented based on this comparison. It is demonstrated that the use of
TBM face pressure in the numerical simulation of settlement troughs (i.e using “grout pressure” method instead of
empirical method) results in realistic settlement prediction. Further, based on the field settlement data and using Monte-
Carlo simulation technique, the empirical trough parameter (k) is back-calculated to fit the actual settlements observed in

International Journal of Geoengineering Case Histories ©, Vol. 3, Issue 3, p. http://casehistories.geoengineer.org
175
the Kallang formation. This could be used for future settlement predictions in similar ground conditions. Further studies
using 3D numerical simulation to consider settlements due to overcut and consolidation of tail void grout could be
considered to refine these observations.
REFERENCES
Senthilnath, G. T. (2014). “Face Stability of Closed TBMs in Urban Tunnels.” MSc Thesis, Politecnico di Torino, Italy.
Peck, R. B. (1969). “Deep excavations and tunneling in soft ground.” Proc., 7th Int. Conf. on Soil Mechanics and
Foundation Engineering, Sociedad Mexicana de Mecanica, Mexico City, 225–290.
Schmidt, B. (1974). “Prediction of settlements due to tunneling in soil: three case histories.” Proc., Rapid Excav. Tunneling
Conf,, Am. Soc. of Civ. Eng. and the Am. Inst. of Min., Metall. and Pet. Eng., San Francisco, California, 1179-1199.
New, B. M., and O’Reilly, M. P. (1992). “Tunneling induced ground movements: Predicting their Magnitude and Effects.”
Proc., 4th
International Conference on Ground Movements and Structures, University of Wales College, Cardiff, 671–
697.
Mair, R. J., Taylor, R. N., and Bracegirdle, A. (1993). “Subsurface settlement profile above tunnels in clays.” J.
Geotechnique, 43(2), 315–320.
Sagaseta, C., Moya, J. F., and Oteo, C. (1980). “Estimation of ground subsidence over urban tunnels.” Proc., 2nd
International Conference on Ground Movements and Structures, University of Wales College, Cardiff, 331–344.
Romo, M. P., and Diaz, C. M. (1981). “Face stability and ground settlements in shield tunneling.” Proc. 10th
Int. Conf. on
Soil Mechanics and Foundation Engineering, Balkema, Stockholm, 357–60.
Sagaseta, C. (1987). “Analysis of undrained soil deformation due to ground loss.” J. Geotechnique, 37(3), 301–320.
Booker, J. R., and Verruijt, A. (1998). “Surface settlements due to deformation of a tunnel in an elastic half plane.” J.
Géotechnique, 48(5), 709–713.
Loganathan, N., and Poulos, H. G. (1998). “Analytical Prediction for Tunneling-Induced Ground Movements in Clays,” J.
Geotech. Geoenvironmental Eng., 124(9), 846–856.
Möller, S. (2006). "Tunnel induced settlements and structural forces in linings." PhD Thesis, Institut fur Geotechnik,
Universität Stuttgart, Germany.
Rowe, R. K., and Kack, G. J. (1983). “A theoretical examination of the settlements induced by tunnelling: four case
histories.” Can. Geotech. J., 20(2), 299–314.
Chen, S. L., Gui, M. W., and Yang, M. C. (2012). “Applicability of the principle of superposition in estimating ground
surface settlement of twin- and quadruple-tube tunnels.” J. Tunn. Undergr. Sp. Technol., 28, 135–149.
Fargnoli, V., Boldini, D., and Amorosi, A. (2013). “TBM tunnelling-induced settlements in coarse-grained soils: The case
of the new Milan underground line 5.” J. Tunn. Undergr. Sp. Technol., 38, 336–347.
Russo, G., Viggiani, C., and Viggiani, G. M. B. (2012). “Geotechnische Planung und Ausführung der U-Bahnlinien 1 und 6
in Neapel [Geotechnical design and construction issues for Lines 1 and 6 of the Naples Underground],” J. Geomech.
Tunn., 5(3), 300–311.
Shirlaw, J. N., Ong, J. C. W., Osborne, J. C. W., and Tan, C. G. (2002). “The relationship between face pressure and
immediate settlement due to tunnelling for the North East Line, Singapore.” Proc., Geotech. Asp. Undergr. Constr. In
Soft Ground., CRC Press, Toulouse, 311–316.
Dimmock, P. S., Mair, R. J., and Standing, J. R. (2002). “Ground movements caused by tunnelling with an earth pressure
balance machine: a greenfield case study at Southwark Park, London.” Proc., Geotech. Asp. Undergr. Constr. In Soft
Ground., CRC Press, Toulouse, 361-366.
Pinto, F., and Whittle, A. J. (2014). "Ground Movements due to Shallow Tunnels in Soft Ground. I: Analytical Solutions."
J. of Geotechnical and Geoenvironmental Engineering, 140(4), 04013040.

The International Journal of Geoengineering Case Histories (IJGCH) is funded by:
Email us at [email protected] if your company wishes to fund the ISSMGE International Journal of Geoengineering Case Histories.