Embed Size (px)
Citation preview
REVIEW ARTICLE
Standard methods for American foulbrood research
Dirk C de Graaf1*, Adriana M Alippi2, Karina Antúnez3, Katherine A Aronstein4, Giles Budge5, Dieter De Koker1 §, Lina De Smet1, Douglas W Dingman6, Jay D Evans7, Leonard J Foster8, Anne Fünfhaus9,
Eva Garcia-Gonzalez9, Aleš Gregorc10, Hannelie Human11, K Daniel Murray12, Bach Kim Nguyen13, Lena Poppinga9, Marla Spivak14, Dennis vanEngelsdorp15, Selwyn Wilkins5 and Elke Genersch9 1Ghent University, Laboratory of Zoophysiology, K.L. Ledeganckstraat 35, B-9000 Ghent, Belgium. 2Universidad Nacional de La Plata, Facultad de Ciencias Agrarias y Forestales, Centro de Investigaciones de Fitopatología, calles 60 y 118, c.c. 31, 1900 La Plata, Argentina. 3Instituto de Investigaciones Biológicas Clemente Estable, Department of Microbiology, Avda. Italia 3318, 11600 Montevideo, Uruguay. 4USDA-ARS, Honey Bee Research Unit, Kika de la Garza Subtropical Agricultural Center, 2413 E. Hwy 83, 78596 Weslaco TX, USA. 5National Bee Unit, Food and Environment Research Agency, Sand Hutton, YO41 1LZ York, UK. 6The Connecticut Agricultural Experiment Station, Department of Biochemistry and Genetics, New Haven CT 06504, USA. 7USDA-ARS, Bee Research Lab, BARC-E Bldg 476, Beltsville MD 20705, USA. 8University of British Columbia, Department of Biochemistry & Molecular Biology, 2125 East Mall, V6T 1Z4 Vancouver BC, Canada. 9Institute for Bee Research, Friedrich-Engels-Str. 32, 16540 Hohen Neuendorf, Germany. 10Agricultural Institute of Slovenia, Hacquetova 17, 1000 Ljubljana, Slovenia. 11University of Pretoria, Department of Zoology and Entomology, Pretoria, South Africa. 12South Texas College, Biology Department, 400 N. Border, 78596 Weslaco TX, USA. 13Université de Liège, Gembloux Agro-Bio Tech, Entomologie fonctionnelle & évolutive, Passage des Déportés 2, B-5030 Gembloux, Belgium. 14University of Minnesota, Department of Entomology, 219 Hodson Hall, 1980 Folwell Ave., 55108 St. Paul MN, USA. 15University of Maryland, Department of Entomology, 3136 Plant Sciences, College Park, MD 20742, USA § in memoriam: ° July 24, 1987 - † May 30, 2012 Received 10 April 2012, accepted subject to revision 18 June 2012, accepted for publication 5 November 2012. *Corresponding author: Email: [email protected]
Summary
American foulbrood is one of the most devastating diseases of the honey bee. It is caused by the spore-forming, Gram-positive rod-shaped
bacterium Paenibacillus larvae. The recent updated genome assembly and annotation for this pathogen now permits in-depth molecular
studies. In this paper, selected techniques and protocols for American foulbrood research are provided, mostly in a recipe-like format that
permits easy implementation in the laboratory. Topics covered include: working with Paenibacillus larvae, basic microbiological techniques,
experimental infection, and “’omics” and other sophisticated techniques. Further, this chapter covers other technical information including
biosafety measures to guarantee the safe handling of this pathogen.
Métodos para la investigación de la loque americana
Resumen
La loque americana es una de las enfermedades más devastadoras de la abeja melífera, causada por el bacilo, formador de esporas Gram-
positivo Paenibacillus larvae. El reciente ensamblaje y anotación del genoma de este patógeno permite actualmente la realización de
profundos estudios moleculares. En este trabajo, se proporcionan técnicas y protocolos seleccionados para la investigación de la loque
americana, principalmente bajo la forma de protocolos de trabajo con una estructura similar al de las recetas, para facilitar su implementación
en el laboratorio. Los temas desarrollados incluyen: el trabajo con Paenibacillus larvae, técnicas básicas microbiológicas, la infección
experimental, y "'ómicas" y otras técnicas sofisticadas. Además, este capítulo abarca otro tipo de información técnica, incluyendo medidas de
bioseguridad para garantizar la seguridad en el manejo de este patógeno.
Journal of Apicultural Research 52(1): (2013) © IBRA 2013 DOI 10.3896/IBRA.1.52.1.11
Footnote: Please cite this paper as: DE GRAAF, D C; ALIPPI, A M; ANTÚNEZ, K; ARONSTEIN, K A; BUDGE, G; DE KOKER, D; DE SMET, L; DINGMAN, D W; EVANS, J D; FOSTER, L J; FÜNFHAUS, A; GARCIA-GONZALEZ, E; GREGORC, A; HUMAN, H; MURRAY, K D; NGUYEN, B K; POPPINGA, L; SPIVAK, M; VANENGELSDORP, D;
WILKINS, S; GENERSCH, E (2013) Standard methods for American foulbrood research. In V Dietemann; J D Ellis; P Neumann (Eds) The COLOSS BEEBOOK, Volume II: standard methods for Apis mellifera pest and pathogen research. Journal of Apicultural Research 52(1): http://dx.doi.org/10.3896/IBRA.1.52.1.11
2 de Graaf et al.
Page No.
4.2.1. Inoculation with known spore concentration solution 15
4.2.2. Inoculation with diseased brood 15
4.3. Measuring colony resistance to AFB 15
4.3.1. Surveying inoculated colonies 15
4.3.2. Colony Resistance 15
5. ‘omics and other sophisticated techniques 16
5.1. Paenibacillus larvae gene expression 16
5.1.1. Reference gene selection 16
5.1.1.1. Sample collection and storage 16
5.1.1.2. RNA and cDNA preparation 16
5.1.1.3. Primer design and secondary structures 16
5.1.1.4. qRT-PCR reactions 16
5.1.1.5. qRT-PCR program 16
5.1.1.6. qRT-PCR analysis 16
5.1.2. Differential gene expression 16
5.2. Comparative genome analysis within the species Paenibacillus larvae using suppression subtractive
hybridization
16
5.3. Conventional proteomics using two-dimensional gel electrophoresis
18
5.4. Differential proteomics of Paenibacillus larvae 19
5.4.1. Sample preparation 20
5.4.1.1. Extract proteins 20
5.4.1.2. Reduce, alkylate and digest proteins to peptides 20
5.4.1.3. Clean up peptides 20
5.4.1.4. Label peptides with stable isotopes 20
5.4.1.5. Clean up peptides
20
5.4.1.6. Mass spectrometry analysis 20
5.5. Expression of heterologous proteins in Paenibacillus larvae
21
5.5.1. Transformation of Paenibacillus larvae 21
5.5.2. Detection of GFP-expression 21
5.6. Fluorescent in situ hybridization for the detection of Paenibacillus larvae
22
5.6.1. Preparation and embedding of larval tissues 22
5.6.2. Performing fluorescence in situ hybridization
22
6. Final remarks 22
7. Acknowledgements 23
8. References 23
美洲幼虫腐臭病研究的标准方法
美洲幼虫腐臭病是最具毁灭性的疾病之一,由革兰氏阳性杆状菌 Paenibacillus larvae 引起。近年来,随着基因组学的开展,该病原体的基因组
组装和注释已成为开展,深入的分子研究成为可能。本文提供了经选择的美洲幼虫腐臭病研究技术和实验程序,大多数以“食谱”的格式给出,
很容易在实验室开展操作。覆盖的主题包括:Paenibacillus larvae 的处理技术,基本微生物技术、实验感染技术、“组学”以及其他的一些复杂技
术。此外,本章还包含了生物安全的评价方法,以确保安全的开展该病原体的研究
Key words: honey bee, American foulbrood, Paenibacillus larvae, brood, disease, pathogen, technique, BEEBOOK, COLOSS
Table of Contents Page No.
1. Introduction 3
2. Working with Paenibacillus larvae 3
2.1. Biosafety measures 3
2.2. Strains 3
2.3. Sampling for AFB monitoring or diagnosis 3
3. Basic microbiological techniques 3
3.1. Cultivation 3
3.2 Identification 6
3.2.1. Bacterial DNA extraction 7
3.2.2. Polymerase chain reaction 7
3.3. Genotyping 7
3.3.1. PCR amplification of repetitive elements 8
3.3.2. Pulsed-field gel electrophoresis 8
3.3.2.1 Preparation of genomic DNA agarose plugs 8
3.3.2.2. Restriction enzyme digestion 9
3.3.2.3. Gel loading and electrophoresis
9
3.4. In vitro sporulation of Paenibacillus larvae
9
3.4.1. Sporulation of solid growth medium 10
3.4.2. Sporulation in liquid growth medium 10
3.5. Long term conservation of vegetative cells 10
3.5.1. Short-term preservation 11
3.5.2. Preservation via ultra-low freezing 11
3.5.3. Preservation via lyophilization 11
3.6. Measuring susceptibility/resistance to antibiotics of Paenibacillus larvae
11
3.6.1. Determination of minimal inhibitory concentrations (MICs) 12
3.6.2. Determination of antibiotic susceptibility testing by the disc diffusion method
12
3.6.2.1. Preparation of discs 13
3.6.2.2. Preparation of plates 13
3.6.2.3. Determination of resistance/susceptibility
13
4. Experimental infection 13
4.1. Infection of in vitro reared larvae for the analysis of virulence and pathomechanisms of Paenibacillus larvae
13
4.1.1. Protocol for exposure bioassays 14
4.1.2. Analysis of generated data 14
4.2. Experimental infection of a bee colony 15
1. Introduction
American foulbrood (AFB) is a devastating brood disease of the honey
bee caused by the spore-forming, Gram-positive rod-shaped
bacterium Paenibacillus larvae. AFB is one of the bee diseases listed in
the OIE (Office International des Epizooties – the World Organization
for Animal Health) Terrestrial Animal Health Code (2011) and member
countries and territories are obliged to report its occurrence. In 2006,
a draft of the P. larvae genome was published at an estimated 5-6x
coverage (Qin et al., 2006). Last year, this coverage was further
extended and the genome sequence was further annotated with a
combination of bioinformatics and proteomics (Chan et al., 2011).
These efforts will certainly help to usher in the next level of research
for this economically important pathogen, ultimately allowing us to
better understand the intimate relationship between the pathogen and
its host. More generally, the honey bee / AFB system provides a
wealth of opportunities and tools for addressing basic questions
regarding microbe-microbe interactions, host immunity, strain
virulence, and horizontal transmission, among others.
In the present paper, selected techniques and protocols in
American foulbrood research are provided, mostly in a recipe-like
format that permits easy implementation in the laboratory. The
different topics that are covered include: working with Paenibacillus
larvae, basic microbiological techniques, experimental infection and
“’omics” and other sophisticated techniques. Thus, the chapter covers
a broad set of technical information going from biosafety measures to
guarantee the safe handling of this pathogen to the expression of
heterologous proteins in P. larvae. Techniques exclusively related to
the diagnosis of AFB are not included as they have been reviewed
elsewhere (de Graaf et al., 2006a; OIE, 2008).
2. Working with Paenibacillus larvae
2.1. Biosafety measures
In some countries, microbial species are categorized in different
classes based on biosafety risk. Each biosafety risk class has its own
recommendations with respect to facility design, safety equipment,
and working practices (de Graaf et al., 2008). This classification
mostly takes into account the risk for human health, potential for
dispersal of the disease, and the potential economic impact of the
disease. However, a generally accepted biosafety risk classification
has not been prescribed for P. larvae. Consideration of the severity of
clinical American foulbrood infections in honey bee colonies, the
contagiousness, the longevity of the spores, the legal context of AFB
(a notifiable disease), and the economic value of honey bee
pollination services, justifies P. larvae classification as an organism
with ‘high biosafety risk for animals’. Table 1 summarizes basic
biosafety practices - mainly in accordance with the Belgian model
The COLOSS BEEBOOK: American foulbrood 3
(http://www.biosafety.be/) - that should be considered when
manipulating P. larvae for research or diagnosis. It should be noted
that P. larvae has been safely cultured in the laboratory for decades
using only standard bacteriological procedures (i.e. aseptic handling
techniques and careful decontamination of biological waste), and to
date, no known AFB outbreaks due to intentional/accidental
laboratory release of this organism have been reported.
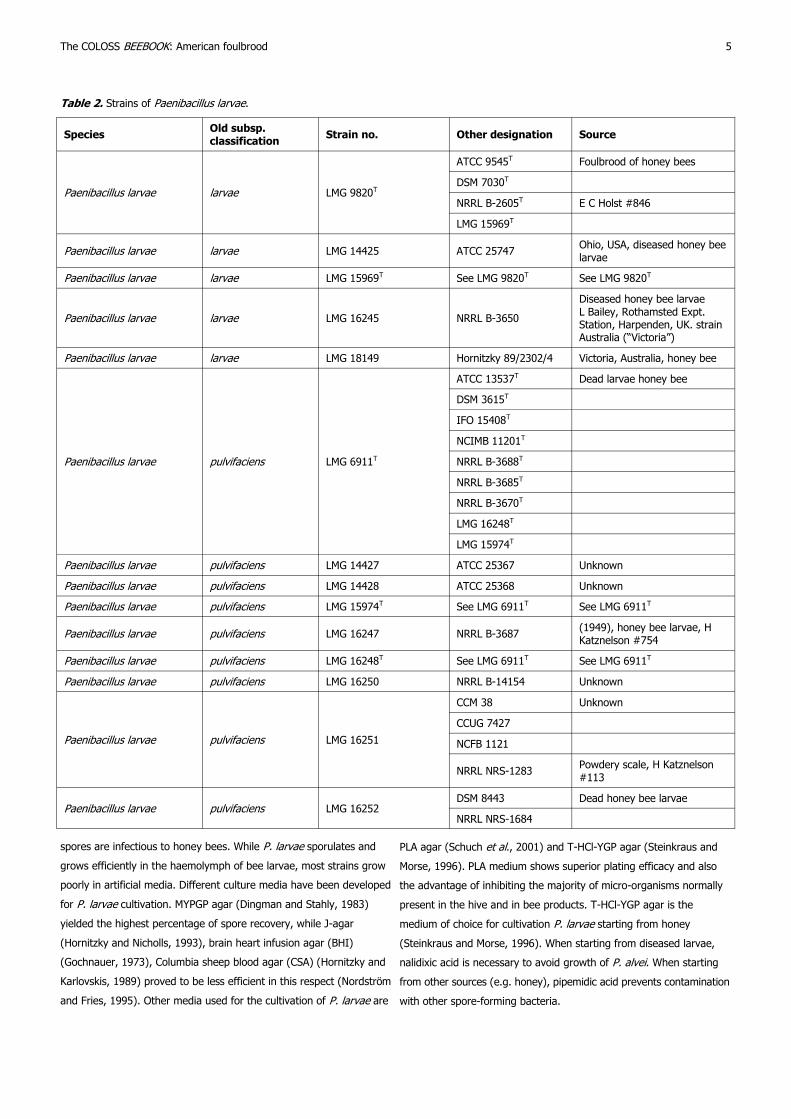
2.2. Strains
Various P. larvae strains can be obtained from bacterial culture
collections. However, many of these collection agencies store exactly
the same strains but with their own strain designations. This fact is
relevant when comparing different P. larvae strains for research
purposes, or when using strains as positive controls in diagnosis or
species identification. Table 2 shows many of the important strains
that are available in these culture collections and shows some
alternate designations. With regard to obtaining strains, it should be
noted that certain countries have import/export and interstate
transport shipping regulations regarding the movement and storage of
this pathogen (http://www.biosafety.be/RA/Class/ListBact.html).
2.3. Sampling for AFB monitoring or diagnosis
Testing for the presence of P. larvae may be carried out for different
reasons – for example either as part of national monitoring or
prevention programmes, or as part of scientific research projects such
as epidemiological studies. The proper collection procedure depends
on whether the testing is to be carried out following the observation
of suspected clinical signs of AFB, or the testing is part of general
surveillance to identify a potential sub-clinical presence of P. larvae in
colonies within a population. These considerations are addressed in
the OIE Manual of Diagnostic Tests and Vaccines for Terrestrial
Animals vol.1 (OIE, 2008), and we advise readers to consult the AFB
chapter in that resource.
3. Basic microbiological techniques
3.1. Cultivation
As P. larvae is a spore-forming bacterium, its isolation from biological
samples is typically preceded by a heat treatment step to kill all
vegetative microorganisms. This step significantly reduces the risk
that P. larvae colonies will be masked by competitors. Different
genotypes of P. larvae show variation in germination ability, and their
response to heat treatment is variable (Forsgren et al., 2008). MYPGP
agar (Dingman and Stahly, 1983) is routinely used to cultivate P.
larvae for AFB diagnosis. This medium makes incubation under CO2
unnecessary although the presence of 5% CO2 significantly increases
germination (Nordstrom and Fries, 1995). Contaminants of the genera
Bacillus and Brevibacillus, as well as other Paenibacillus species, are
4 de Graaf et al.
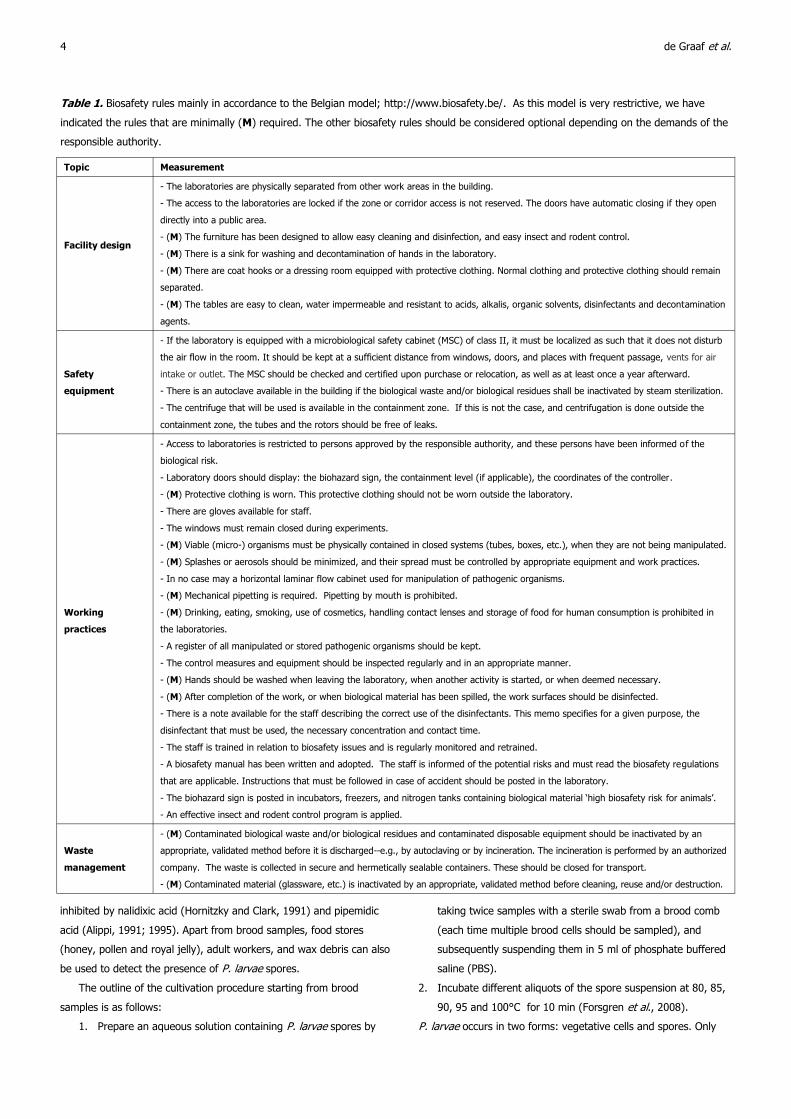
Table 1. Biosafety rules mainly in accordance to the Belgian model; http://www.biosafety.be/. As this model is very restrictive, we have
indicated the rules that are minimally (M) required. The other biosafety rules should be considered optional depending on the demands of the
responsible authority.
Topic Measurement
Facility design
- The laboratories are physically separated from other work areas in the building.
- The access to the laboratories are locked if the zone or corridor access is not reserved. The doors have automatic closing if they open
directly into a public area.
- (M) The furniture has been designed to allow easy cleaning and disinfection, and easy insect and rodent control.
- (M) There is a sink for washing and decontamination of hands in the laboratory.
- (M) There are coat hooks or a dressing room equipped with protective clothing. Normal clothing and protective clothing should remain
separated.
- (M) The tables are easy to clean, water impermeable and resistant to acids, alkalis, organic solvents, disinfectants and decontamination
agents.
Safety
equipment
- If the laboratory is equipped with a microbiological safety cabinet (MSC) of class II, it must be localized as such that it does not disturb
the air flow in the room. It should be kept at a sufficient distance from windows, doors, and places with frequent passage, vents for air
intake or outlet. The MSC should be checked and certified upon purchase or relocation, as well as at least once a year afterward.
- There is an autoclave available in the building if the biological waste and/or biological residues shall be inactivated by steam sterilization.
- The centrifuge that will be used is available in the containment zone. If this is not the case, and centrifugation is done outside the
containment zone, the tubes and the rotors should be free of leaks.
Working
practices
- Access to laboratories is restricted to persons approved by the responsible authority, and these persons have been informed of the
biological risk.
- Laboratory doors should display: the biohazard sign, the containment level (if applicable), the coordinates of the controller.
- (M) Protective clothing is worn. This protective clothing should not be worn outside the laboratory.
- There are gloves available for staff.
- The windows must remain closed during experiments.
- (M) Viable (micro-) organisms must be physically contained in closed systems (tubes, boxes, etc.), when they are not being manipulated.
- (M) Splashes or aerosols should be minimized, and their spread must be controlled by appropriate equipment and work practices.
- In no case may a horizontal laminar flow cabinet used for manipulation of pathogenic organisms.
- (M) Mechanical pipetting is required. Pipetting by mouth is prohibited.
- (M) Drinking, eating, smoking, use of cosmetics, handling contact lenses and storage of food for human consumption is prohibited in
the laboratories.
- A register of all manipulated or stored pathogenic organisms should be kept.
- The control measures and equipment should be inspected regularly and in an appropriate manner.
- (M) Hands should be washed when leaving the laboratory, when another activity is started, or when deemed necessary.
- (M) After completion of the work, or when biological material has been spilled, the work surfaces should be disinfected.
- There is a note available for the staff describing the correct use of the disinfectants. This memo specifies for a given purpose, the
disinfectant that must be used, the necessary concentration and contact time.
- The staff is trained in relation to biosafety issues and is regularly monitored and retrained.
- A biosafety manual has been written and adopted. The staff is informed of the potential risks and must read the biosafety regulations
that are applicable. Instructions that must be followed in case of accident should be posted in the laboratory.
- The biohazard sign is posted in incubators, freezers, and nitrogen tanks containing biological material ‘high biosafety risk for animals’.
- An effective insect and rodent control program is applied.
Waste
management
- (M) Contaminated biological waste and/or biological residues and contaminated disposable equipment should be inactivated by an
appropriate, validated method before it is discharged--e.g., by autoclaving or by incineration. The incineration is performed by an authorized
company. The waste is collected in secure and hermetically sealable containers. These should be closed for transport.
- (M) Contaminated material (glassware, etc.) is inactivated by an appropriate, validated method before cleaning, reuse and/or destruction.
inhibited by nalidixic acid (Hornitzky and Clark, 1991) and pipemidic
acid (Alippi, 1991; 1995). Apart from brood samples, food stores
(honey, pollen and royal jelly), adult workers, and wax debris can also
be used to detect the presence of P. larvae spores.
The outline of the cultivation procedure starting from brood
samples is as follows:
1. Prepare an aqueous solution containing P. larvae spores by
taking twice samples with a sterile swab from a brood comb
(each time multiple brood cells should be sampled), and
subsequently suspending them in 5 ml of phosphate buffered
saline (PBS).
2. Incubate different aliquots of the spore suspension at 80, 85,
90, 95 and 100°C for 10 min (Forsgren et al., 2008).
P. larvae occurs in two forms: vegetative cells and spores. Only
5 The COLOSS BEEBOOK: American foulbrood
Table 2. Strains of Paenibacillus larvae.
Species Old subsp. classification
Strain no. Other designation Source
Paenibacillus larvae larvae LMG 9820T
ATCC 9545T Foulbrood of honey bees
DSM 7030T
NRRL B-2605T E C Holst #846
LMG 15969T
Paenibacillus larvae larvae LMG 14425 ATCC 25747 Ohio, USA, diseased honey bee larvae
Paenibacillus larvae larvae LMG 15969T See LMG 9820T See LMG 9820T
Paenibacillus larvae larvae LMG 16245 NRRL B-3650
Diseased honey bee larvae L Bailey, Rothamsted Expt. Station, Harpenden, UK. strain Australia (“Victoria”)
Paenibacillus larvae larvae LMG 18149 Hornitzky 89/2302/4 Victoria, Australia, honey bee
Paenibacillus larvae pulvifaciens LMG 6911T
ATCC 13537T Dead larvae honey bee
DSM 3615T
IFO 15408T
NCIMB 11201T
NRRL B-3688T
NRRL B-3685T
NRRL B-3670T
LMG 16248T
LMG 15974T
Paenibacillus larvae pulvifaciens LMG 14427 ATCC 25367 Unknown
Paenibacillus larvae pulvifaciens LMG 14428 ATCC 25368 Unknown
Paenibacillus larvae pulvifaciens LMG 15974T See LMG 6911T See LMG 6911T
Paenibacillus larvae pulvifaciens LMG 16247 NRRL B-3687 (1949), honey bee larvae, H Katznelson #754
Paenibacillus larvae pulvifaciens LMG 16248T See LMG 6911T See LMG 6911T
Paenibacillus larvae pulvifaciens LMG 16250 NRRL B-14154 Unknown
Paenibacillus larvae pulvifaciens LMG 16251
CCM 38 Unknown
CCUG 7427
NCFB 1121
NRRL NRS-1283 Powdery scale, H Katznelson #113
Paenibacillus larvae pulvifaciens LMG 16252 DSM 8443 Dead honey bee larvae
NRRL NRS-1684
spores are infectious to honey bees. While P. larvae sporulates and
grows efficiently in the haemolymph of bee larvae, most strains grow
poorly in artificial media. Different culture media have been developed
for P. larvae cultivation. MYPGP agar (Dingman and Stahly, 1983)
yielded the highest percentage of spore recovery, while J-agar
(Hornitzky and Nicholls, 1993), brain heart infusion agar (BHI)
(Gochnauer, 1973), Columbia sheep blood agar (CSA) (Hornitzky and
Karlovskis, 1989) proved to be less efficient in this respect (Nordström
and Fries, 1995). Other media used for the cultivation of P. larvae are
PLA agar (Schuch et al., 2001) and T-HCl-YGP agar (Steinkraus and
Morse, 1996). PLA medium shows superior plating efficacy and also
the advantage of inhibiting the majority of micro-organisms normally
present in the hive and in bee products. T-HCl-YGP agar is the
medium of choice for cultivation P. larvae starting from honey
(Steinkraus and Morse, 1996). When starting from diseased larvae,
nalidixic acid is necessary to avoid growth of P. alvei. When starting
from other sources (e.g. honey), pipemidic acid prevents contamination
with other spore-forming bacteria.
MYPGP agar (per litre):
10 g Mueller-Hinton broth (Oxoid CM0405)
15 g yeast extract
3 g K2HPO4
1 g Na-pyruvate
20 g agar
Autoclave at 121°C/15 min.
Add 20 ml 10% glucose (autoclaved separately).
BHI agar:
Suspend 47 g brain heart infusion agar (Oxoid CM1136) in 1
litre of distilled water.
Autoclave at 121°C for 15 min.
Add 1 mg thiamine hydrochloride per litre.
CSA-agar:
Dissolve 39 g Columbia blood agar base (Oxoid CM0331) in 1
litre distilled water.
Autoclave at 121°C/15 min.
Supplement with 50 ml sterile defibrinated blood (at 50°C).
T-HCl-YGP (per litre):
15 g yeast extract
1 g pyruvic acid
200 ml 0.1 M Tris-HCl, pH 7.0
20 g agar
Autoclave at 121°C/15 min.
Add 40 ml 10% glucose (autoclaved separately).
J agar (per litre):
5 g tryptone
3 g K2HPO4
15 g yeast extract
20 g agar
Adjust pH to 7.3 to 7.5.
Autoclave at 121°C/15 min.
Add 20 ml 10% glucose (autoclaved separately).
PLA medium consists of three different media supplemented with egg
yolk. Equal quantities (100 ml) of sterile, molten Bacillus cereus
selective agar base (Oxoid CM617), trypticase soy agar (Merck 5458)
and supplemented nutrient agar (SNA) are combined and mixed. SNA
is composed of (per litre):
23 g nutrient agar
6 g yeast extract
3 g meat extract
10 g NaCl
2 g Na2HPO4
Adjust pH to 7.4 ± 0.2.
6 de Graaf et al.
All solid media are sterilized at 121°C for 15 min. After the three
molten media are combined 30 ml of 50% egg-yolk suspension is
added to form the PLA medium.
Cool the media to 50°C and add the antibiotics to a final
concentration of 20 µg/ml for nalidixic acid and 10 µg/ml for pipemidic
acid.
Nalidixic acid stock solution (1 mg/ml) is prepared by
dissolving 0.1 g in 2 ml of 1 M NaOH and diluting to 100 ml
with 0.01 M phosphate buffer (pH 7.2).
Pipemidic acid stock solution (2 mg/ml) is prepared by
dissolving 0.2 g in 2 ml of 1 M NaOH and then diluting to 100
ml with 0.01 M phosphate buffer (pH 7.2).
Both antibiotic solutions are filter sterilized.
The medium is poured (20 ml) into sterile Petri dishes and plates
are dried before use (15 min).
Plates inoculated with 150 µl heat-shocked spore suspension are
incubated at 35°C up to 6 days in either aerobic conditions or under
an atmosphere of 5-10% CO2. Vegetative bacteria are grown
overnight at 35°C without heat-shock treatment.
The outline of the procedure starting from honey samples is as
follows:
1. Dilute 20 g of honey in 20 ml PBS.
2. Shake vigorously.
3. Centrifuge the suspension 40 min at 6,000 x g to harvest the
spores.
4. Resuspend the pellet in 1 ml of PBS.
5. Heat treat and plate this spore containing aqueous solution as
described above.
3.2. Identification
Often the first step in the identification of P. larvae growing on solid
media is the verification of its growth rate and colony morphology.
Visible colonies may appear on the second day of incubation.
However, if no colonies emerge it is advisable to extend the
incubation time for a few more days. Two serial subcultures should be
grown to insure culture purity. Pure P. larvae colonies have a
characteristic morphology but this appears to be highly dependent on
the medium that was used (see OIE, 2008). Using P. larvae reference
strains is highly advisable.
Some non-molecular identification protocols exist and provide a
good alternative for diagnostic purposes when sophisticated
equipment is lacking (see OIE, 2008). However, for research purposes
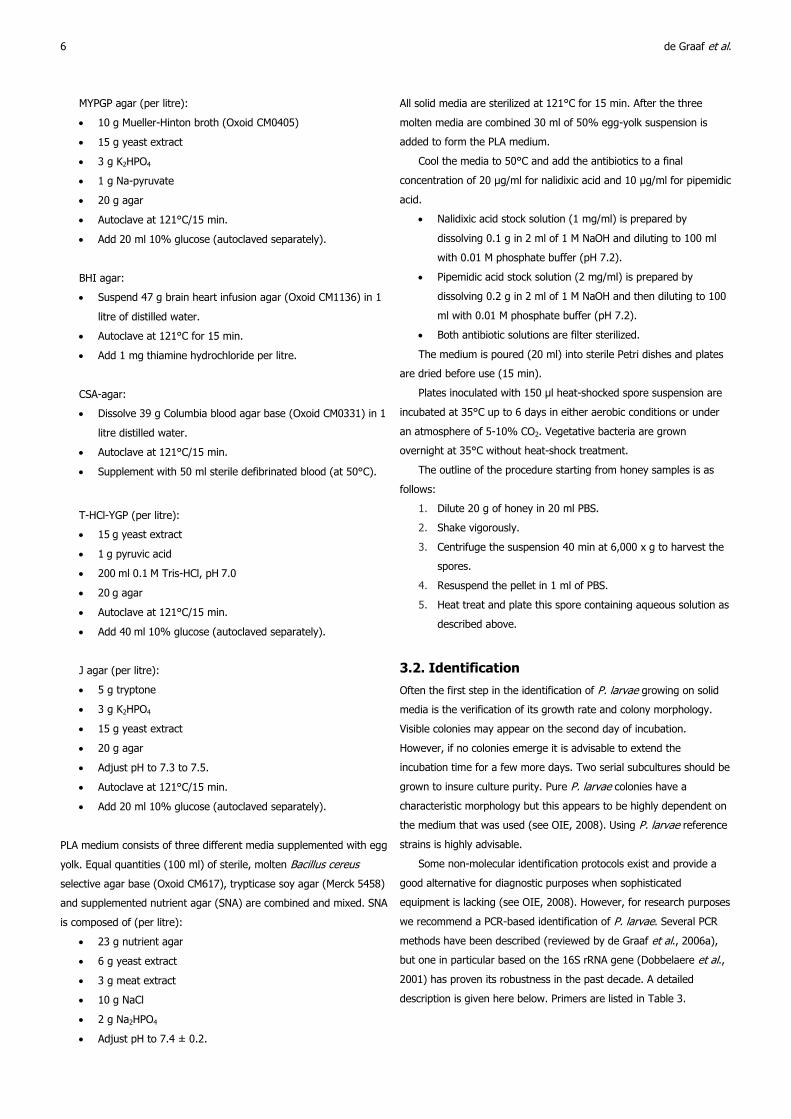
we recommend a PCR-based identification of P. larvae. Several PCR
methods have been described (reviewed by de Graaf et al., 2006a),
but one in particular based on the 16S rRNA gene (Dobbelaere et al.,
2001) has proven its robustness in the past decade. A detailed
description is given here below. Primers are listed in Table 3.
3.2.1. Bacterial DNA extraction
Bacterial DNA extraction can be done using commercialized kits/
matrices (InstaGene matrix, Bio-Rad, Genersch and Otten, 2003;
Genome DNA Extraction kit, Sigma, Antúnez et al., 2007). However,
heating the bacterial suspension at 95°C for 15 min works also fine
for simple species identification.
3.2.2. Polymerase chain reaction
PCR reactions (modified from Dobbelaere et al., 2001) are set up as
50 µl mixtures containing:
1-5 µl template DNA
50 pmol forward (AFB-F) and reverse primer (AFB-R);
(primers used by Govan et al., 1999 also work well)
10 nmol of each dNTP
1-2.5 U of Taq polymerase in the appropriate PCR buffer
containing 2 mM MgCl2.
Use the following PCR conditions: a 95°C (1-15 min) step; 30
cycles of 93°C (1 min), 55°C (30 sec), and 72°C (1 min); and a final
cycle of 72°C (5 min).
3.3. Genotyping
The availability of standardized techniques that allow the
discrimination of different P. larvae strains is essential for studying the
epidemiology of AFB. This will allow scientists to identify outbreaks of
the disease, determine the source of infection, determine the
relationship between outbreaks, recognize more virulent strains, and
monitor prevention and treatment strategies.
To date different techniques have been used in order to evaluate
the diversity of P. larvae isolates. Some of them are based on the
analysis of phenotypic characteristics, such as study of cell and colony
morphology, analysis of whole bacterial proteins by SDS-PAGE or
biochemical profile, among others (Hornitzky and Djordevic, 1992;
Neuendorf et al., 2004; de Graaf et al., 2006a; Genersch et al., 2006;
Antúnez et al., 2007). During the last decade methods based on
genetic analysis have gained more attention. Different strategies have
been used to evaluate the genetic diversity of P. larvae, including
The COLOSS BEEBOOK: American foulbrood 7
restriction endonuclease fragment patterns (Djordjevic et al., 1994;
Alippi et al., 2002), pulsed-field gel electrophoresis (Wu et al., 2005;
Genersch et al., 2006), amplified fragment length polymorphism (de
Graaf et al., 2006b), ribotyping and denaturing gradient gel
electrophoresis (Antúnez et al., 2007). Nevertheless, some of these
techniques differentiating P. larvae genotypes, have not been adopted
by the scientific community.
An appropriate genotyping method should be highly discriminatory,
but also demonstrate interlaboratory and intralaboratory reproducibility.
It should be easy to use and interpret (Genersch and Otten, 2003).
For these reasons, the most utilized method is rep-PCR, or PCR
amplification of repetitive elements (Versalovic et al., 1994), although
presently its reproducibility in other labs has not been proven. There
are three sets of repetitive elements randomly dispersed in the
genome of bacteria, enterobacterial repetitive intergenic consensus
(ERIC) sequences, repetitive extragenic palindromic (REP) elements,
and BOX elements (which includes boxA, boxB, and boxC). Primers to
amplify those elements have been reported and proved to be useful
for subtyping of Gram-positive and Gram-negative bacteria (Versalovic
et al., 1994; Olive and Bean, 1999).
rep-PCR has been widely used for the study of P. larvae (Alippi
and Aguilar, 1998a, 1998b; Genersch and Otten, 2003; Alippi et al.,
2004; Antúnez et al., 2007; Peters et al., 2006; Loncaric et al., 2009).
The most useful pair of primers are ERIC1R-ERIC2, which allowed the
differentiation of four different genotypes (ERIC I, II, III and IV)
(Genersch et al., 2006). Genotypes ERIC I and II corresponds to the
former subspecies P. l. larvae while genotypes ERIC III and IV
corresponds to the former subspecies P. l. pulvifaciens (Genersch,
2010).
P. larvae genotype ERIC I is the most frequent genotype and is
present in Europe and in America, genotype ERIC II seems to be
restricted to Europe and genotypes ERIC III and IV have not been
identified in field for decades, but exist as few isolates in culture
collections (Genersch, 2010). In order to enhance the discrimination
of strains, the analysis using ERIC primers can be complemented with
the use of other primers. The use of BOXA1R primer allowed the
Table 3. Primer sets for identification and genotyping of P. larvae by PCR.
Name Sequence PCR-
product size Reference
AFB-F
AFB-R
5'-CTTGTGTTTCTTTCGGGAGACGCCA-3'
5'-TCTTAGAGTGCCCACCTCTGCG-3' 1106 bp Dobbelaere et al., 2001
Primer 1
Primer 2
5’-AAGTCGAGCGGACCTTGTGTTTC-3’
5-’TCTATCTCAAAACCGGTCAGAGG-3’ 973 bp
Govan et al., 1999
ERIC1R
ERIC2
5´-ATGTAAGCTCCTGGGGATTCAC-3´
5´-AAGTAAGTGACTGGGGTGAGCG-3´ Several amplicons Versalovic et al., 1994
BOXA1R 5´-CTACGGCAAGGCGACGCTGACG-3 Several amplicons Versalovic et al., 1994
MBO-REP1 5´-CCGCCGTTGCCGCCGTTGCCGCCG-3 Several amplicons Versalovic et al., 1994
discrimination of four banding patterns in America, all of them
belonging to genotype ERIC I (Alippi et al., 2004; Antúnez et al., 2007)
and three in Europe (Genersch and Otten, 2003; Peters et al., 2006;
Loncaric et al., 2009). Primers BOX B1 and BOX C1 did not amplify
P. larvae DNA (Genersch and Otten, 2003). When REP primers were
used, four banding patterns were found in America and Europe
although results could not be compared since different pairs of
primers (REP1R-I and REP2-I and MBO REP1 primers) were used
(Alippi et al., 2004; Kilwinski et al., 2004; Loncaric et al., 2009).
Protocols for subtyping of P. larvae are provided below.
Restriction fragment length polymorphic (RFLP) analysis of
bacterial genomes, as visualized via pulsed-field gel electrophoresis
(PFGE), is also a very effective procedure for bacterial genotyping
(PFGE-typing). PFGE-typing of 44 P. larvae isolates, obtained from
honey bee larval smears and honey samples collected in Australia and
from Argentinean honey, has demonstrated resolution of this
bacterium into 12 distinct genotypes when using restriction
endonuclease XbaI (Wu et al., 2005). Outlined below is a PFGE-typing
procedure for P. larvae. This procedure is presented as a three-part
operation of genomic DNA preparation, restriction digestion of DNA,
and then electrophoresis of the digested DNA. Performance of PFGE-
typing is labour intensive. Also, many factors can contribute to an
unsuccessful electrophoresis run. Therefore, troubleshooting PFGE
and helpful hints for performing this technique can be found in the
protocols section of the Bio-Rad website (http://www.bio-rad.com/
evportal/en/US/LSR/Solutions/LUSORPDFX/Pulsed-Field-Gel-
Electrophoresis).
3.3.1. PCR amplification of repetitive elements
Polymerase chain reaction (according to Genersch and Otten, 2003):
1. Carry out PCR reactions in a final volume of 25 μl consisting of
1 × reaction buffer and a final concentration of 2.5 mM MgCl2,
250 μM of each dNTP, 10 μM of primer, and 0.3 µg of Hot
start Taq polymerase. Five to ten µl of template DNA is added
to the reaction.
2. The cycling conditions are: an initial activation step at 95°C
for 15 min, 35 cycles at 94°C for 1 min, 53°C for 1 min, and
at 72°C for 2.5 min, and a final elongation step at 72°C for 10
min.
3. Analyse five µl of the PCR reaction by electrophoresis on 0.8%
agarose gel in TAE or TBE buffer.
4. Stain the amplified bands by incubation of the agarose gel in
ethidium bromide (0.5 μg/ml in water) for 30 min.
5. Visualize under UV light and photograph using a digital
camera.
6. Compare obtained fingerprints visually or using specific
analysis programs.
Independent PCR reactions should be performed using primers
ERIC1R/ERIC2, BOXA1R and MBO-REP1 (Table 3).
8 de Graaf et al.
Modifications of the present protocol, such as those reported by Alippi
et al. (2004) or Antúnez et al. (2007) also resulted useful, allowing
the differentiation of P. larvae genotypes.
Interpretation of the results:
ERIC1R-ERIC2 primers: four different genotypes (ERIC I, II,
III and IV) can be distinguished (Genersch et al., 2006).
BOXA1R primers: three different patterns can be found in Europe
patterns
can be found in America (A, B, C and D) (Alippi et al., 2004).
MBO REP1 primers: four band patterns can be found in
Europe (B, b, β, Б) (Peters et al., 2006).
3.3.2. Pulsed-field gel electrophoresis
3.3.2.1. Preparation of genomic DNA agarose plugs
1. Culture an isolate of P. larvae on an MYPGP agar plate for 48 h
at 37°C.
2. Suspend a loopful of bacteria (2-3 colonies from an isolated
area on the plate) into 500 µl MYPGP broth and centrifuge for
1 min at RT.
3. Remove the broth, suspend the pellet with 1 ml washing
buffer (see recipe below), and centrifuge for 1 min at RT.
4. Remove the washing buffer.
5. Completely suspend the bacterial cell pellet in 0.30 ml
washing buffer + 0.05 ml Proteinase K (0.5 mg/ml).
6. Warm the suspension to 50°C.
7. Mix the suspension with an equal volume of melted 2%
SeaKem Gold agarose (prepared in washing buffer; Cambrex
Bio Science Rockland, Inc., ME) at 50°C.
8. Quickly pipette into two wells of a plug mold (Bio-Rad
Laboratories, Inc.) warmed to 37°C.
9. Solidify the plugs at 4°C for 30 min.
10. Remove the two plugs from the mold.
11. Add plugs to 5 ml preheated Proteinase K Solution in a 50 ml
plastic culture tube.
12. Incubate overnight at 50°C with gentle agitation (shaker
water bath).
13. Preheat 10 ml H2O and 40 ml TE80 buffer (see recipe below)
to 50°C.
14. Wash plugs (use a sterile BioRad green screened caps; part
#170-3711) with 10 ml 50°C H2O (add, swirl, and drain).
15. Wash plugs with 10 ml 50°C TE80 buffer 4X (15 min for each
wash with gentle shaking).
16. Add 5 ml RT TE80 buffer to the plugs in the 50 ml culture
tube and store at 4°C. Plugs are good for approximately 2
months in TE80 buffer at 4oC.
Wash Buffer (100 ml):
200 mM NaCl (4.0 ml of 5 M stock)
10 mM Tris-HCl (pH 7.5) (1.0 ml of 1 M stock)
100 mM EDTA (20.0 ml of 0.5 M stock)
Proteinase K Solution (100 ml):
50 mM EDTA (10.0 ml of 0.5 M stock)
1.0 g N-lauroylsarcosine
50 mg Proteinase K (final 0.5 mg/ml)
50 mg Lysozyme (final 0.5 mg/ml)
TE80 Buffer (100ml):
10 mM Tris-HCl (pH 8.0) (1.0 ml of 1 M stock)
1 mM EDTA (0.2 ml of 500 mM stock)
3.3.2.2. Restriction enzyme digestion
1. Aseptically remove a plug from the TE80 buffer and place
onto the inner surface of a sterile petri dish.
2. Using a plastic ruler under the petri dish, cut two 2 mm slices
from the plug with a sterile razor blade.
3. Place the two plug slices into 1 ml TE80 buffer in a 1.5 ml
microcentrifuge tube.
4. Wash the slices 2X with 1 ml TE80 buffer (30 min for each
wash with gentle agitation).
5. Quickly rinse the slices with 500 µl restriction digestion buffer
(without restriction enzyme).
6. Add 100 µl of XbaI Digestion Mixture (see recipe below) and
incubate 3 h at 37°C with gentle agitation.
7. Remove digestion mixture solution.
8. Rinse slices 2X with 1 ml 0.5X TBE Buffer (see recipe below).
9. Suspend the plug slices in 1 ml 0.5X TBE Buffer.
10. Store overnight at 4°C.
XbaI Digestion Mixture (10 samples):
10X New England BioLabs Buffer 4 (100 µl)
100X BSA (10 µl)
XbaI enzyme (20 µl) New England BioLabs (20,000 U/ml)
H2O (870 µl)
5X TBE Buffer (500 ml):
Tris Base (54 g)
Boric Acid (27.5 g)
0.5 M EDTA (pH 8.0) (20 ml)
H2O to 500 ml volume
3.3.2.3. Gel loading and electrophoresis
1. Make 2.3 litres of 0.5X TBE buffer (230 ml 5X TBE + 2070 ml
H2O).
2. Add 1.0 g Seakem Gold agarose to 100 ml 0.5X TBE Buffer.
3. Carefully melt agarose in microwave oven. Save 5 ml (at 55°C)
to seal the wells.
4. Assemble the gel forming tray, assure that the tray is level
with the well comb in place, and pour melted agarose into
forming tray (cool melted agarose to 55-60°C before pouring).
The COLOSS BEEBOOK: American foulbrood 9
5. Allow gel to solidify for a minimum of 30 min.
6. Add remaining 2.2 litres of 0.5X TBE buffer to the CHEF
electrophoresis box.
7. Chill the buffer to 14°C by circulation through the chiller-pump
unit.
8. Adjust flow rate of buffer through the chiller-pump unit to
between 0.75 and 1.0 l/min.
9. Once gel has solidified and the comb is removed, remove a
digested plug slice from the microcentrifuge tube.
10. Place the slice onto inner surface of sterile Petri dish.
11. Carefully slide the plug slice onto the side of a sterile razor
blade using a sterile microspatula.
12. Holding the razor blade (with the plug slice sticking to the
side) at the edge of a well, carefully use the microspatula to
slide the plug slice into the well. Use care not to introduce air
bubbles in the well.
13. Wash and flame sterilize the razor blade and microspatula for
continued loading of wells with other prepared DNA plug
slices.
14. Add low range molecular size standards (4.9-120 kb) (Bio-Rad)
to outer wells.
15. Seal the wells with the saved SeaKem Gold agarose. Use care
not to introduce any air bubbles during sealing and fill any
wells that do not contain slices.
16. Place the gel into the circulating pre-cooled buffer within the
CHEF electrophoresis box.
17. Allow the gel to cool for 15 min prior to beginning
electrophoresis.
18. Perform electrophoresis in the Bio-Rad CHEF DR III system
using the following electrophoresis run parameters:
Switch angle: 120°
Switch time: 1-6 sec
Voltage: 6 V/cm
Temperature: 14°C
Run time: 16 hours
19. Following electrophoresis, remove and stain the gel in the
dark with Sybr Green (Molecular Probes, Inc., Eugene, OR)
(30 µl of 10,000X concentrate diluted into 300 ml TE pH 7.5)
at RT for 45 min.
20. Photodocument the gel via UV transillumination/epi-illumination
(254 nm).
3.4. In vitro sporulation of Paenibacillus larvae
Paenibacillus larvae and Paenibacillus popilliae, “catalase-minus”
paenibacilli as defined by the loop test (i.e. scraping growth from a
slant or plate with an inoculating loop, placing into 3% H2O2, and
examining for bubble formation), have the characteristic of
sporulating efficiently in their insect hosts, but usually exhibit very
poor sporulation when general in vitro growth conditions are used.
For P. larvae, suppression of in vitro sporulation has been postulated
to result from oxygen toxicity (Dingman and Stahly, 1984). Growth of
strain NRRL B-3650 under limiting O2 improves sporulation in liquid
culture. Also, nutrient availability at time of sporulation has been
shown to influence spore production (Dingman and Stahly, 1983).
Procedures promoting effective sporulation of P. larvae on solid,
and in liquid, growth media have been developed (Dingman, 1983).
By limiting colony number, many strains have been observed to
sporulate well on MYPGP agar plates (see section 3.1. for recipe).
However, Mueller-Hinton broth – one of its ingredients – was
inhibitory to sporulation of strain NRRL B-3650 in liquid culture,
rendering use of this growth medium in liquid form ineffective for
sporulation. Development of a liquid growth medium (TMYGP; 1.5%
Difco yeast extract; 0.4% glucose; 0.1% sodium pyruvate; 0.03M Tris
-maleate, pH 7.0; in distilled water) and conditions that aided
sporulation of P. larvae NRRL B-3650 has been reported (Dingman
and Stahly, 1983). Unfortunately, other strains of this bacterium
sporulated poorly, if at all, in this medium. However, Genersch et al.
(2005) reported using the liquid part of Columbia sheep-blood agar
slants for production of endospores from different P. larvae strains.
Following are protocols using solid and liquid media growth conditions
for in vitro sporulation of P. larvae.
3.4.1. Sporulation on solid growth medium
1. Create a 2-fold dilution series of the P. larvae bacterial culture
being studied using MYPGP broth and spread each dilution
onto several MYPGP agar plates (see section 3.1. for recipe).
2. Incubate plates at 37°C for 6-7 days and select plates
exhibiting 50 to 5,000 colonies per plate. Note: When high
numbers of colonies are present on a plate, sporulation
efficiency can decline. Also, maximum sporulation obtained in
relation to the plate colony number will vary between bacterial
strains.
3. During the 6-7 days of incubation, microscopically monitor
cellular growth and sporulation via single colony analysis.
4. After incubation, remove spores from the surface of the agar
medium by washing three times (5 ml sterile H2O per wash).
5. Combine the three washes. Once H2O is added to a plate, use
gentle rubbing of the agar surface with the sterile glass
pipette to loosen spores from the surface.
6. To produce a spore stock following removal of spores from a
plate surface, concentrate the spore suspension via
centrifugation (12,000 x g, 15 min, 4°C).
7. Discard the supernatant.
8. Suspend the resulting spore pellet in 30 ml cold sterile H2O.
9. Perform alternate centrifugation and pellet suspension four
times.
10. Suspend the spore pellet in a final volume of 5 ml cold sterile
H2O.
10 de Graaf et al.
11. Store at 4°C. Note: Spores must be removed from the solid
growth medium for preservation. When left on the agar plates
for extended time, heat-resistant counts decline rapidly
(Dingman, 1983). Also, long-term survival of washed spores
that have been desiccated is not known.
12. Obtain spore concentration by heating a portion of the spore
stock at 65°C for 15 min.
13. Perform serial-dilution plating onto MYPGP or T-HCl-YGP
(Steinkraus and Morse, 1996) agar plates.
14. Incubate inoculated plates 6-7 days at 37°C to determine
colony counts (i.e., spore counts). Alternatively, determine
spore number by direct microscopic counting. Note: The latter
will give an overestimation. Heat resistant spore counts are
usually about 6% of direct microscopic spore counts
(Dingman and Stahly, 1983).
3.4.2. Sporulation in liquid growth medium
1. Inoculate TMYGP broth (6 ml in a 20 x 150 mm loosely
capped screw-cap glass culture tube, see section 3.1. for
recipe) with P. larvae NRRL B-3650. Note: Other bacterial
strains must be tested separately because they may sporulate
poorly in this medium and under these growth conditions.
2. Incubate the culture at 37°C in a rotary incubator shaker
adjusted to 195 rpm. The culture tube is held at a 45° angle
in a wire test tube rack during incubation and aeration.
3. Incubate for 3 to 4 days while microscopically monitoring
cellular growth and sporulation. Other strains of P. larvae may
require a longer incubation time for sporulation to occur.
Alternatively, see Genersch et al. (2005) for sporulation of P.
larvae in the liquid part of Columbia sheep-blood agar slants.
4. Collect and concentrate spores via centrifugation.
5. Wash the spores four times with 30 ml cold sterile H2O (as
described in section 3.4.1.).
6. Suspend the washed spores in a final volume of 5 ml cold H2O.
7. Store at 4°C.
8. Obtain spore counts (i.e. heat resistant counts) by serial-
dilution plating of the spore suspension onto MYPGP plates
following heating of the suspension at 65°C for 15 min or
determine counts by direct microscopic counting.
Note: Heat resistant spore counts are usually about 6% of direct
microscopic spore counts (Dingman and Stahly, 1983).
3.5. Long term conservation of vegetative cells
Experimental work using P. larvae requires a readily available source
of this bacterium in culture. However, P. larvae quickly dies in culture
and some means of preserving an isolate must be used. Although
short-term preservation works (see section 3.5.1.), long-term
conservation is required to maintain the genetic integrity of the
original isolate.
Production of frozen endospore stock suspensions is a very good
procedure for long-term preservation. However, some isolates may
not sporulate well in vitro and the slow rate of spore germination can
hamper the start of experiments. Methods employing ultra-low
freezing and lyophilization of vegetative cells (see sections 3.5.2. and
3.5.3. below) are suitable for long-term storage of this microbe.
Use of ultra-low freezing of P. larvae in glycerol has been routinely
used and cultures exceeding five years of storage at -80°C remain
viable (Douglas W Dingman; personal observations). No known
research regarding preservation of P. larvae by lyophilization has
been published. However, Haynes et al. (1961) developed a method
to preserve P. popilliae by lyophilization and Gordon et al. (1973)
imply that this method can be used for P. larvae. The protocol long
used to preserve P. larvae strains at the National Center for Agricultural
Utilization Research (USDA-ARS Culture Collection; NRRL) is similar to
that described by Haynes et al. (1961) for P. popilliae.
3.5.1. Short-term preservation
1. Weekly transfer of an isolate onto fresh growth medium.
2. Incubate for two days at 37°C.
3. Store at 4°C.
3.5.2. Preservation via ultra-low freezing
1. Inoculate MYPGP broth (see section 3.1. for recipe) using a
fresh culture of P. larvae.
2. Grow overnight at 37°C with moderate aeration.
3. Growth in the morning should show light to moderate
turbidity. Note: Turbidity should not reach the point where the
culture has become opaque. A light turbidity will place the
culture in early to mid-exponential growth. Also, growth can
be washed from the surface of a solid medium using fresh
liquid medium.
4. Examine the culture microscopically to gauge contamination
while chilling the culture on ice (optional).
5. Add an appropriate volume of a sterile solution of 100%
glycerol to the culture to produce a bacterial suspension
containing 20% glycerol (i.e. 0.25 ml of glycerol per 1.0 ml of
culture).
6. Aliquot 0.5 ml of the bacterial / glycerol suspension into
cryovials. Snap-top microcentrifuge tubes also work, but may
result in faster loss of viability during storage.
7. Label and date the vials.
8. (Optional) Quickly freeze the aliquots in an ethanol/dry ice
bath.
9. Place the bacterial suspensions in a pre-chilled storage box
and store at -80°C.
3.5.3. Preservation via lyophilization
(J. Swezey, USDA-ARS Culture Collection (NRRL), Peoria , IL; personal
communication)
The COLOSS BEEBOOK: American foulbrood 11
To prepare lyophilization vials:
1. Cut Pyrex glass tubing (6 mm diameter glass with 1 mm wall
thickness) 15 cm long and seal one end by melting.
2. Plug the open ends of the vials with cotton.
3. Autoclave. Note: Ampules using rubber septa and aluminium
sealing rings may be used as an alternative to the above three
steps. However, use of these ampules increase costs and the
vacuum may be lost over time.
4. After 2-3 days incubation of the bacterium from an agar slant/
plate, wash with sterile bovine serum (e.g. Colorado Serum Co.,
Denver, CO).
5. Place 0.1 ml aliquots of the cell/serum suspension into the
sterilized vials, label, date.
6. Attach the vials to a lyophilizer apparatus.
7. Lower the vials into a solution of 50% ethylene glycol and 50%
water (chilled to -50°C with dry ice) to freeze the cell
suspensions.
8. Turn on the lyophilizer vacuum pump.
9. Evacuate for 3 hours while letting the temperature of the
glycol/water bath gradually warm to -4°C.
10. Lift the vials from the glycol/water bath.
11. Allow the outer surfaces to dry for 1 hour at RT.
12. Carefully cut the vials from the lyophilizer apparatus using a
dual tip burner, running on natural gas and oxygen, to melt
the upper portion of the glass vial while sealing the contents
under vacuum.
13. Store sealed vials refrigerated in the dark.
3.6. Measuring susceptibility/resistance to
antibiotics of Paenibacillus larvae
In some countries, the antibiotic oxytetracycline (OTC) has been used
by beekeepers for decades to prevent and control AFB in honey bee
colonies as an alternative to the burning of infected beehives in areas
where disease incidence is high. However, the intensive use of
tetracyclines in professional beekeeping resulted in tetracycline-
resistant (TcR) and oxytetracycline-resistant (OTCR) P. larvae isolates.
There is now general concern about widespread resistance involving
horizontal-transfer via non-genomic (i.e. plasmid or conjugal
transposon) routes and also induced resistance by the presence of
sub-inhibitory concentrations of tetracycline (Alippi et al., 2007).
P. larvae highly resistant phenotypes have been correlated with the
presence of natural plasmids carrying different Tc resistance
determinants, including tetK and tetL genes (Murray and Aronstein,
2006; Alippi et al., 2007; Murray et al., 2007).
Most Paenibacillus species, including P. larvae, are highly
susceptible to tetracyclines; it has been reported that the growth of
P. larvae strains is inhibited at concentrations as low as 0.012 µg of
oxytetracycline per ml of culture medium. Alternatively, when a disc
containing 5 µg of oxytetracycline is placed on an agar plate previously
spread with a bacterial suspension, the clear zones formed by the
sensitive strains usually average 50 mm in diameter including the disc
(Shimanuki and Knox, 2000). Any reduction of the inhibition zone or
an increase in the minimal inhibitory concentration (MIC) required to
prevent the growth of P. larvae would be evidence of the development
of resistant strains.
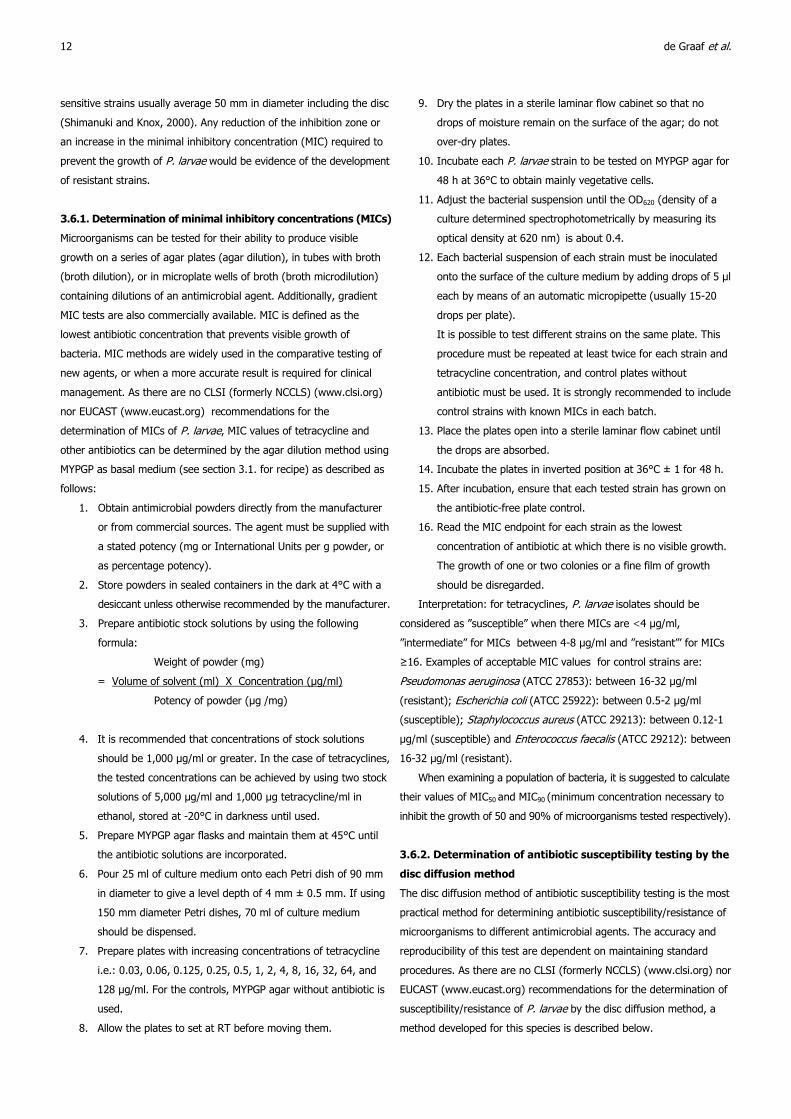
3.6.1. Determination of minimal inhibitory concentrations (MICs)
Microorganisms can be tested for their ability to produce visible
growth on a series of agar plates (agar dilution), in tubes with broth
(broth dilution), or in microplate wells of broth (broth microdilution)
containing dilutions of an antimicrobial agent. Additionally, gradient
MIC tests are also commercially available. MIC is defined as the
lowest antibiotic concentration that prevents visible growth of
bacteria. MIC methods are widely used in the comparative testing of
new agents, or when a more accurate result is required for clinical
management. As there are no CLSI (formerly NCCLS) (www.clsi.org)
nor EUCAST (www.eucast.org) recommendations for the
determination of MICs of P. larvae, MIC values of tetracycline and
other antibiotics can be determined by the agar dilution method using
MYPGP as basal medium (see section 3.1. for recipe) as described as
follows:
1. Obtain antimicrobial powders directly from the manufacturer
or from commercial sources. The agent must be supplied with
a stated potency (mg or International Units per g powder, or
as percentage potency).
2. Store powders in sealed containers in the dark at 4°C with a
desiccant unless otherwise recommended by the manufacturer.
3. Prepare antibiotic stock solutions by using the following
formula:
Weight of powder (mg)
= Volume of solvent (ml) X Concentration (µg/ml)
Potency of powder (µg /mg)
4. It is recommended that concentrations of stock solutions
should be 1,000 µg/ml or greater. In the case of tetracyclines,
the tested concentrations can be achieved by using two stock
solutions of 5,000 µg/ml and 1,000 µg tetracycline/ml in
ethanol, stored at -20°C in darkness until used.
5. Prepare MYPGP agar flasks and maintain them at 45°C until
the antibiotic solutions are incorporated.
6. Pour 25 ml of culture medium onto each Petri dish of 90 mm
in diameter to give a level depth of 4 mm ± 0.5 mm. If using
150 mm diameter Petri dishes, 70 ml of culture medium
should be dispensed.
7. Prepare plates with increasing concentrations of tetracycline
i.e.: 0.03, 0.06, 0.125, 0.25, 0.5, 1, 2, 4, 8, 16, 32, 64, and
128 µg/ml. For the controls, MYPGP agar without antibiotic is
used.
8. Allow the plates to set at RT before moving them.
12 de Graaf et al.
9. Dry the plates in a sterile laminar flow cabinet so that no
drops of moisture remain on the surface of the agar; do not
over-dry plates.
10. Incubate each P. larvae strain to be tested on MYPGP agar for
48 h at 36°C to obtain mainly vegetative cells.
11. Adjust the bacterial suspension until the OD620 (density of a
culture determined spectrophotometrically by measuring its
optical density at 620 nm) is about 0.4.
12. Each bacterial suspension of each strain must be inoculated
onto the surface of the culture medium by adding drops of 5 µl
each by means of an automatic micropipette (usually 15-20
drops per plate).
It is possible to test different strains on the same plate. This
procedure must be repeated at least twice for each strain and
tetracycline concentration, and control plates without
antibiotic must be used. It is strongly recommended to include
control strains with known MICs in each batch.
13. Place the plates open into a sterile laminar flow cabinet until
the drops are absorbed.
14. Incubate the plates in inverted position at 36°C ± 1 for 48 h.
15. After incubation, ensure that each tested strain has grown on
the antibiotic-free plate control.
16. Read the MIC endpoint for each strain as the lowest
concentration of antibiotic at which there is no visible growth.
The growth of one or two colonies or a fine film of growth
should be disregarded.
Interpretation: for tetracyclines, P. larvae isolates should be
considered as ”susceptible” when there MICs are <4 µg/ml,
”intermediate” for MICs between 4-8 µg/ml and ”resistant”’ for MICs
≥16. Examples of acceptable MIC values for control strains are:
Pseudomonas aeruginosa (ATCC 27853): between 16-32 µg/ml
(resistant); Escherichia coli (ATCC 25922): between 0.5-2 µg/ml
(susceptible); Staphylococcus aureus (ATCC 29213): between 0.12-1
µg/ml (susceptible) and Enterococcus faecalis (ATCC 29212): between
16-32 µg/ml (resistant).
When examining a population of bacteria, it is suggested to calculate
their values of MIC50 and MIC90 (minimum concentration necessary to
inhibit the growth of 50 and 90% of microorganisms tested respectively).
3.6.2. Determination of antibiotic susceptibility testing by the
disc diffusion method
The disc diffusion method of antibiotic susceptibility testing is the most
practical method for determining antibiotic susceptibility/resistance of
microorganisms to different antimicrobial agents. The accuracy and
reproducibility of this test are dependent on maintaining standard
procedures. As there are no CLSI (formerly NCCLS) (www.clsi.org) nor
EUCAST (www.eucast.org) recommendations for the determination of
susceptibility/resistance of P. larvae by the disc diffusion method, a
method developed for this species is described below.
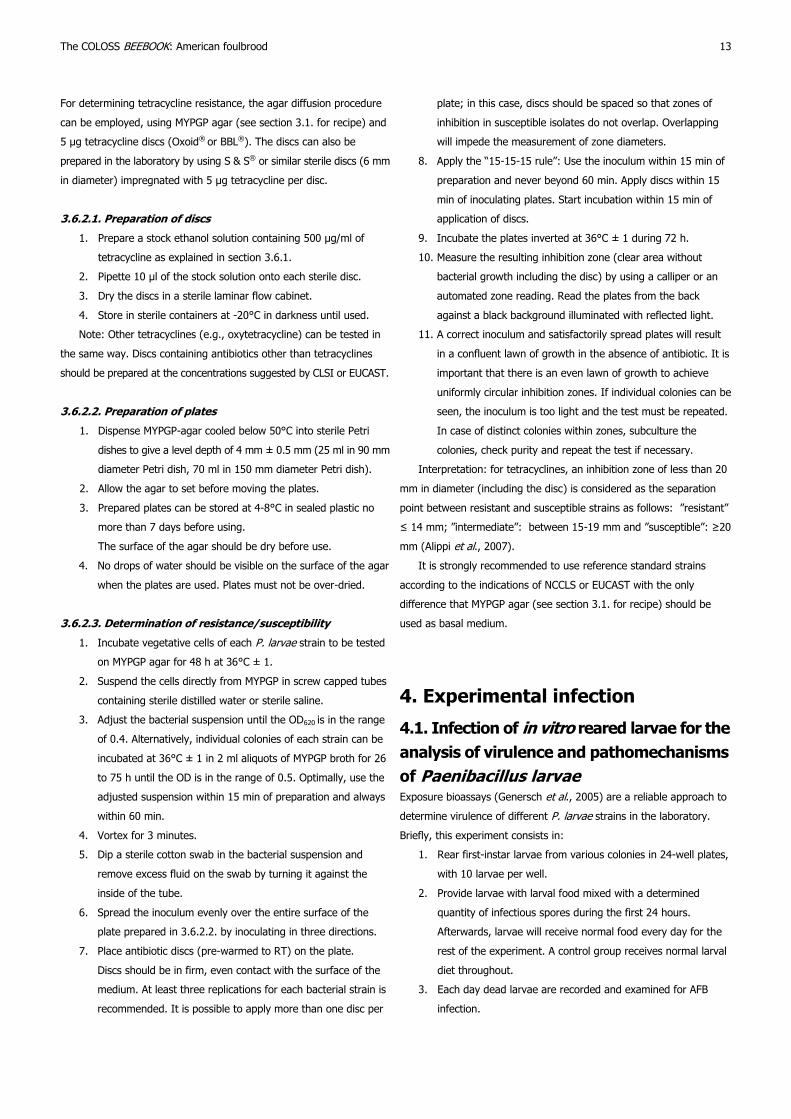
For determining tetracycline resistance, the agar diffusion procedure
can be employed, using MYPGP agar (see section 3.1. for recipe) and
5 µg tetracycline discs (Oxoid® or BBL®). The discs can also be
prepared in the laboratory by using S & S® or similar sterile discs (6 mm
in diameter) impregnated with 5 µg tetracycline per disc.
3.6.2.1. Preparation of discs
1. Prepare a stock ethanol solution containing 500 µg/ml of
tetracycline as explained in section 3.6.1.
2. Pipette 10 µl of the stock solution onto each sterile disc.
3. Dry the discs in a sterile laminar flow cabinet.
4. Store in sterile containers at -20°C in darkness until used.
Note: Other tetracyclines (e.g., oxytetracycline) can be tested in
the same way. Discs containing antibiotics other than tetracyclines
should be prepared at the concentrations suggested by CLSI or EUCAST.
3.6.2.2. Preparation of plates
1. Dispense MYPGP-agar cooled below 50°C into sterile Petri
dishes to give a level depth of 4 mm ± 0.5 mm (25 ml in 90 mm
diameter Petri dish, 70 ml in 150 mm diameter Petri dish).
2. Allow the agar to set before moving the plates.
3. Prepared plates can be stored at 4-8°C in sealed plastic no
more than 7 days before using.
The surface of the agar should be dry before use.
4. No drops of water should be visible on the surface of the agar
when the plates are used. Plates must not be over-dried.
3.6.2.3. Determination of resistance/susceptibility
1. Incubate vegetative cells of each P. larvae strain to be tested
on MYPGP agar for 48 h at 36°C ± 1.
2. Suspend the cells directly from MYPGP in screw capped tubes
containing sterile distilled water or sterile saline.
3. Adjust the bacterial suspension until the OD620 is in the range
of 0.4. Alternatively, individual colonies of each strain can be
incubated at 36°C ± 1 in 2 ml aliquots of MYPGP broth for 26
to 75 h until the OD is in the range of 0.5. Optimally, use the
adjusted suspension within 15 min of preparation and always
within 60 min.
4. Vortex for 3 minutes.
5. Dip a sterile cotton swab in the bacterial suspension and
remove excess fluid on the swab by turning it against the
inside of the tube.
6. Spread the inoculum evenly over the entire surface of the
plate prepared in 3.6.2.2. by inoculating in three directions.
7. Place antibiotic discs (pre-warmed to RT) on the plate.
Discs should be in firm, even contact with the surface of the
medium. At least three replications for each bacterial strain is
recommended. It is possible to apply more than one disc per
The COLOSS BEEBOOK: American foulbrood 13
plate; in this case, discs should be spaced so that zones of
inhibition in susceptible isolates do not overlap. Overlapping
will impede the measurement of zone diameters.
8. Apply the “15-15-15 rule”: Use the inoculum within 15 min of
preparation and never beyond 60 min. Apply discs within 15
min of inoculating plates. Start incubation within 15 min of
application of discs.
9. Incubate the plates inverted at 36°C ± 1 during 72 h.
10. Measure the resulting inhibition zone (clear area without
bacterial growth including the disc) by using a calliper or an
automated zone reading. Read the plates from the back
against a black background illuminated with reflected light.
11. A correct inoculum and satisfactorily spread plates will result
in a confluent lawn of growth in the absence of antibiotic. It is
important that there is an even lawn of growth to achieve
uniformly circular inhibition zones. If individual colonies can be
seen, the inoculum is too light and the test must be repeated.
In case of distinct colonies within zones, subculture the
colonies, check purity and repeat the test if necessary.
Interpretation: for tetracyclines, an inhibition zone of less than 20
mm in diameter (including the disc) is considered as the separation
point between resistant and susceptible strains as follows: ”resistant”
≤ 14 mm; ”intermediate”: between 15-19 mm and ”susceptible”: ≥20
mm (Alippi et al., 2007).
It is strongly recommended to use reference standard strains
according to the indications of NCCLS or EUCAST with the only
difference that MYPGP agar (see section 3.1. for recipe) should be
used as basal medium.
4. Experimental infection
4.1. Infection of in vitro reared larvae for the
analysis of virulence and pathomechanisms
of Paenibacillus larvae Exposure bioassays (Genersch et al., 2005) are a reliable approach to
determine virulence of different P. larvae strains in the laboratory.
Briefly, this experiment consists in:
1. Rear first-instar larvae from various colonies in 24-well plates,
with 10 larvae per well.
2. Provide larvae with larval food mixed with a determined
quantity of infectious spores during the first 24 hours.
Afterwards, larvae will receive normal food every day for the
rest of the experiment. A control group receives normal larval
diet throughout.
3. Each day dead larvae are recorded and examined for AFB
infection.
Spore preparations for experimental infection can be performed as
described under section 3.4. or as described below (Genersch et al.,
2005):
1. Resuspend around 100 P. larvae colonies in 300 µl of brain
heart infusion broth (BHI).
2. Inoculate on Columbia sheep blood agar (CSA) slants.
3. Incubate slants containing bacterial suspension at 37°C for 10
days or until sporulation has occurred.
4. Collect medium containing spores.
5. Calculate spore concentration in the medium in colony
forming units after plating different dilutions of the collected
medium.
6. Count colonies after 6 days of incubation.
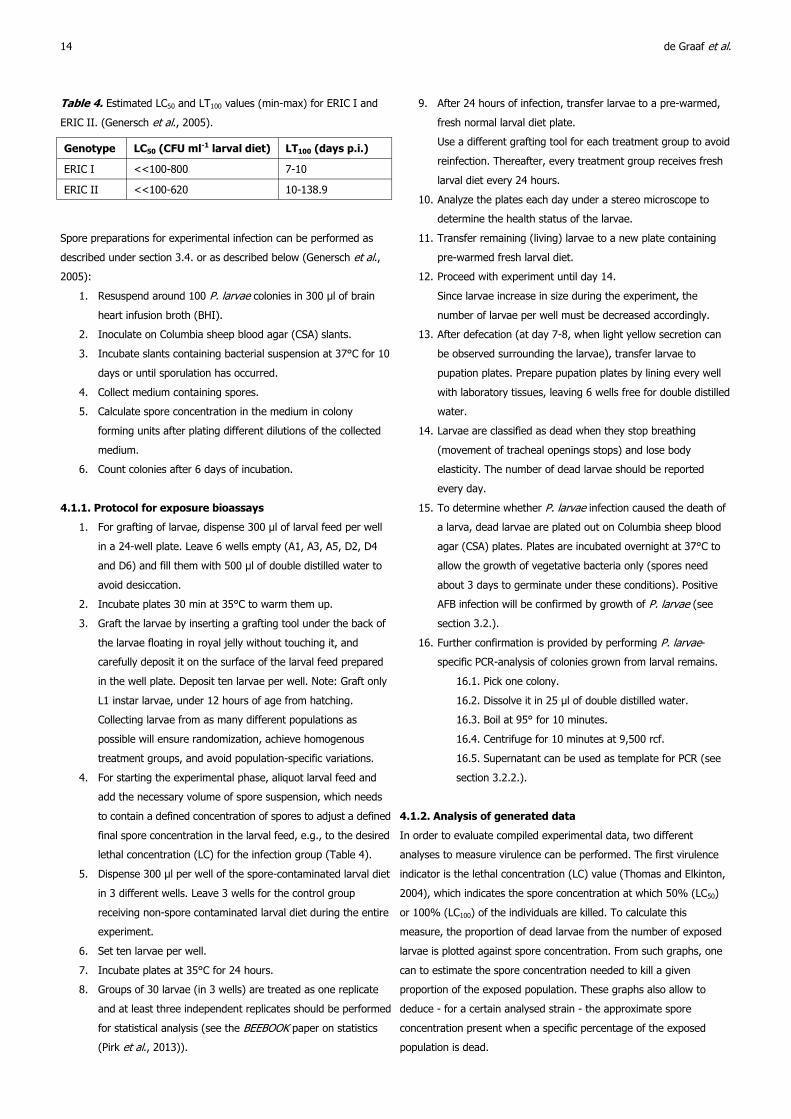
4.1.1. Protocol for exposure bioassays
1. For grafting of larvae, dispense 300 µl of larval feed per well
in a 24-well plate. Leave 6 wells empty (A1, A3, A5, D2, D4
and D6) and fill them with 500 µl of double distilled water to
avoid desiccation.
2. Incubate plates 30 min at 35°C to warm them up.
3. Graft the larvae by inserting a grafting tool under the back of
the larvae floating in royal jelly without touching it, and
carefully deposit it on the surface of the larval feed prepared
in the well plate. Deposit ten larvae per well. Note: Graft only
L1 instar larvae, under 12 hours of age from hatching.
Collecting larvae from as many different populations as
possible will ensure randomization, achieve homogenous
treatment groups, and avoid population-specific variations.
4. For starting the experimental phase, aliquot larval feed and
add the necessary volume of spore suspension, which needs
to contain a defined concentration of spores to adjust a defined
final spore concentration in the larval feed, e.g., to the desired
lethal concentration (LC) for the infection group (Table 4).
5. Dispense 300 µl per well of the spore-contaminated larval diet
in 3 different wells. Leave 3 wells for the control group
receiving non-spore contaminated larval diet during the entire
experiment.
6. Set ten larvae per well.
7. Incubate plates at 35°C for 24 hours.
8. Groups of 30 larvae (in 3 wells) are treated as one replicate
and at least three independent replicates should be performed
for statistical analysis (see the BEEBOOK paper on statistics
(Pirk et al., 2013)).
14 de Graaf et al.
9. After 24 hours of infection, transfer larvae to a pre-warmed,
fresh normal larval diet plate.
Use a different grafting tool for each treatment group to avoid
reinfection. Thereafter, every treatment group receives fresh
larval diet every 24 hours.
10. Analyze the plates each day under a stereo microscope to
determine the health status of the larvae.
11. Transfer remaining (living) larvae to a new plate containing
pre-warmed fresh larval diet.
12. Proceed with experiment until day 14.
Since larvae increase in size during the experiment, the
number of larvae per well must be decreased accordingly.
13. After defecation (at day 7-8, when light yellow secretion can
be observed surrounding the larvae), transfer larvae to
pupation plates. Prepare pupation plates by lining every well
with laboratory tissues, leaving 6 wells free for double distilled
water.
14. Larvae are classified as dead when they stop breathing
(movement of tracheal openings stops) and lose body
elasticity. The number of dead larvae should be reported
every day.
15. To determine whether P. larvae infection caused the death of
a larva, dead larvae are plated out on Columbia sheep blood
agar (CSA) plates. Plates are incubated overnight at 37°C to
allow the growth of vegetative bacteria only (spores need
about 3 days to germinate under these conditions). Positive
AFB infection will be confirmed by growth of P. larvae (see
section 3.2.).
16. Further confirmation is provided by performing P. larvae-
specific PCR-analysis of colonies grown from larval remains.
16.1. Pick one colony.
16.2. Dissolve it in 25 µl of double distilled water.
16.3. Boil at 95° for 10 minutes.
16.4. Centrifuge for 10 minutes at 9,500 rcf.
16.5. Supernatant can be used as template for PCR (see
section 3.2.2.).
4.1.2. Analysis of generated data
In order to evaluate compiled experimental data, two different
analyses to measure virulence can be performed. The first virulence
indicator is the lethal concentration (LC) value (Thomas and Elkinton,
2004), which indicates the spore concentration at which 50% (LC50)
or 100% (LC100) of the individuals are killed. To calculate this
measure, the proportion of dead larvae from the number of exposed
larvae is plotted against spore concentration. From such graphs, one
can to estimate the spore concentration needed to kill a given
proportion of the exposed population. These graphs also allow to
deduce - for a certain analysed strain - the approximate spore
concentration present when a specific percentage of the exposed
population is dead.
Table 4. Estimated LC50 and LT100 values (min-max) for ERIC I and
ERIC II. (Genersch et al., 2005).
Genotype LC50 (CFU ml-1 larval diet) LT100 (days p.i.)
ERIC I <<100-800 7-10
ERIC II <<100-620 10-138.9
Another measure of virulence is the lethal time (LT) (Thomas and
Elkinton, 2004) which is the time it takes the pathogen to kill 50%
(LT50) or 100% (LT100) of the infected animals. In order to obtain this
measure, the time course of infection must be determined.
Cumulative mortality per day is calculated as percentage of all
individuals which died from P. larvae infection during the course of
the experiment (total number of P. larvae-killed animals until the end
of the experiment). Average values are calculated every day from at
least three independent replicates, and plotted against every time
point (day post-infection).
4.2. Experimental infection of a bee colony
Colony assays of AFB prevalence can be used to determine the
efficacies of antibiotics and other treatments as well as the resistance
traits of specific colonies.
4.2.1. Inoculation with known spore concentration solution
Below is one protocol for a field evaluation of AFB prevalence, derived
from Evans and Pettis (2005):
1. Establish clean colonies of equal strength by placing 1.2 kg of
worker bees and a marked queen (from resistant or
susceptible stock, if desired) into a standard (e.g. Langstroth)
hive body.
2. Following establishment and the initiation of brood rearing
(ca. 1 month), inoculate each colony twice (2-4 weeks apart)
with spores from a fresh field isolate of P. larvae.
3. Inoculate by spraying approximately 2,000 immature bees
(eggs, embryos, and first-and second-instar larvae) with a
sucrose-water (1:10 weight/volume) suspension containing
ca. 200 million P. larvae spores.
Sufficient inoculant for > 50 colonies is prepared by
macerating and suspending ca. 100 scales (dried larval
remains) collected from symptomatic colonies.
4. Spray inoculation is effective at initiating AFB infection in
colonies, with ca. 50% of managed colonies exhibiting AFB
disease one month following a single inoculation, and nearly
all of susceptible colonies showing symptoms by three weeks
after the second inoculation.
4.2.2. Inoculation with diseased brood
If it is not important to inoculate colonies with a known quantity of
spores (e.g. if the goal of the experiment is simply to induce clinical
symptoms of AFB), a comb section (15 cm x 15 cm) can be cut from
frames containing infective AFB scales (dried spores). At least 50% of
the cells should contain scale. Introduce the comb sections with AFB
scale into the middle frame in each colony.
The COLOSS BEEBOOK: American foulbrood 15
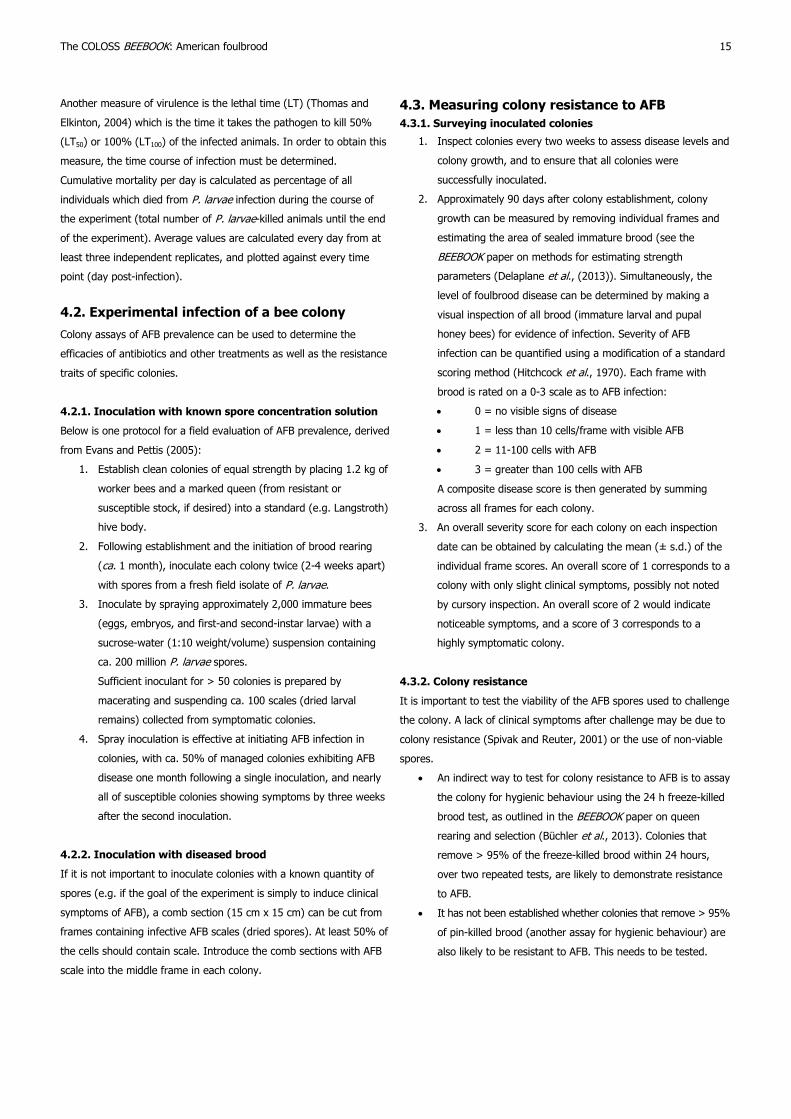
4.3. Measuring colony resistance to AFB
4.3.1. Surveying inoculated colonies
1. Inspect colonies every two weeks to assess disease levels and
colony growth, and to ensure that all colonies were
successfully inoculated.
2. Approximately 90 days after colony establishment, colony
growth can be measured by removing individual frames and
estimating the area of sealed immature brood (see the
BEEBOOK paper on methods for estimating strength
parameters (Delaplane et al., (2013)). Simultaneously, the
level of foulbrood disease can be determined by making a
visual inspection of all brood (immature larval and pupal
honey bees) for evidence of infection. Severity of AFB
infection can be quantified using a modification of a standard
scoring method (Hitchcock et al., 1970). Each frame with
brood is rated on a 0-3 scale as to AFB infection:
0 = no visible signs of disease
1 = less than 10 cells/frame with visible AFB
2 = 11-100 cells with AFB
3 = greater than 100 cells with AFB
A composite disease score is then generated by summing
across all frames for each colony.
3. An overall severity score for each colony on each inspection
date can be obtained by calculating the mean (± s.d.) of the
individual frame scores. An overall score of 1 corresponds to a
colony with only slight clinical symptoms, possibly not noted
by cursory inspection. An overall score of 2 would indicate
noticeable symptoms, and a score of 3 corresponds to a
highly symptomatic colony.
4.3.2. Colony resistance
It is important to test the viability of the AFB spores used to challenge
the colony. A lack of clinical symptoms after challenge may be due to
colony resistance (Spivak and Reuter, 2001) or the use of non-viable
spores.
An indirect way to test for colony resistance to AFB is to assay
the colony for hygienic behaviour using the 24 h freeze-killed
brood test, as outlined in the BEEBOOK paper on queen
rearing and selection (Büchler et al., 2013). Colonies that
remove > 95% of the freeze-killed brood within 24 hours,
over two repeated tests, are likely to demonstrate resistance
to AFB.
It has not been established whether colonies that remove > 95%
of pin-killed brood (another assay for hygienic behaviour) are
also likely to be resistant to AFB. This needs to be tested.

5. ‘omics and other sophisticated
techniques 5.1. Paenibacillus larvae gene expression
P. larvae gene expression under different experimental conditions can
be investigated at the transcriptional level by making use of
quantitative reverse transcriptase polymerase chain reactions (qRT-PCR).
The state-of-the-art-analysis of qRT-PCR data relies on normalized
and calibrated relative quantities (Vandesompele et al., 2002;
Hellemans et al., 2007). In order to normalize the qRT-PCR data on
target genes, normalization factors (NFs), based on the geometric
mean of converted threshold cycle values (Ct-values), need to be
calculated for each sample. Before calculating NFs, one has to decide
how many reference genes should be included in this calculation. This
decision is based on the expression stability of candidate reference
genes under all examined experimental conditions. Therefore, the
protocol below describes how to select reference genes for P. larvae.
5.1.1. Reference gene selection
5.1.1.1. Sample collection and storage
1. Grow at least ten independent P. larvae cultures for each
condition to be analysed with qRT-PCR.
2. Centrifuge cultures for 5 min at 8,000 x g and 4°C.
3. Pour off the supernatant.
4. Resuspend the bacterial pellet in RNAlater solution (Ambion).
5. Incubate for approximately half an hour on ice.
6. Divide the suspension in aliquots.
7. Centrifuge aliquots for 2 min at 8,000 x g and 4°C.
8. Store at -80°C.
5.1.1.2. RNA and cDNA preparation
1. Centrifuge thawed aliquots for 2 min at 6,500 x g and 4°C.
2. Resuspend bacterial pellets in TE buffer with Lysozyme (15
mg/ml) and Proteinase K (Qiagen).
3. Vortex for 10 sec.
4. Incubate 10 min at RT with constant shaking.
5. Isolate RNA with RNeasy Plus Mini Kit and protocol
“Purification of Total RNA for Animal Cells” (with on-column
DNase I treatment).
6. Elute RNA with 30 µl RNase-free water.
7. Store at -80°C.
8. Convert RNA to cDNA with RevertAid First Strand cDNA
Synthesis Kit (Fermentas), using random hexamer primers.
5.1.1.3. Primer design and secondary structures
Design primers (80 – 150 bp) with Primer3Plus (Untergasser
et al., 2007).
Evaluate secondary structures of amplicon with MFold (Zuker,
2003) for 60°C, 50 mM Na+ and 3 mM Mg2+. Selected
candidate reference genes for P. larvae are listed in Table 5.
16 de Graaf et al.
5.1.1.4. qRT-PCR reactions
For a single reaction, assemble the following components (total
volume: 15 µl/reaction):
7.5 µl 2x Platinum SYBR Green qPCR SuperMix-UDG
(Invitrogen)
0.03 µl of 100 µM forward and reverse primer each
1.0 µl cDNA template
6.5 µl distilled water
5.1.1.5. qRT-PCR program
Set program as follows:
50°C, 2 min, 1 cycle
95°C, 2 min, 1 cycle
[95°C, 20 sec; 60°C, 40 sec] 40 cycles
After PCR amplification, perform a melt curve analysis by
measuring fluorescence after each temperature increase of 0.5°C for
5 sec over a range from 65°C to 95°C.
5.1.1.6. qRT-PCR analysis
Analyze the reference gene stability with geNormPLUS within qBasePLUS
(Vandesompele et al., 2002; Hellemans et al., 2007) using target-
specific amplification efficiencies.
5.1.2. Differential gene expression
Sample collection and storage (except for the recommendation of ten
cultures), RNA and cDNA synthesis, in silico primer design and
secondary structure evaluation, and qPCR experimental procedures
(reactions, program and analysis, except for geNormPLUS analysis)
are essentially the same for the study of differential gene expression
by qRT-PCR as described in section 5.1.1. for reference gene
selection.
5.2. Comparative genome analysis within the
species Paenibacillus larvae using suppression
subtractive hybridization
Suppression subtractive hybridization (SSH) is a powerful tool for
elucidating genomic sequence differences among closely related
bacteria. SSH is a PCR-based DNA subtraction method which was
originally developed for generating differentially regulated or tissue-
specific cDNA probes and libraries (Diatchenko et al., 1996). However,
it has also been successfully adapted for bacteria, especially for the
identification of genes that contribute to the virulence of bacterial
organisms (Akopyants et al., 1998). For example, SSH has been
successfully employed to compare genomes of pathogenic and non-
pathogenic (Janke et al., 2001; Reckseidler et al., 2001) or virulent
and avirulent strains of bacterial pathogens (Zhang et al., 2000). SSH
has also led to the identification of pathogenicity islands (Hacker et al.,
1997) in infectious bacteria (Agron et al., 2002). Recently, SSH
analysis of all four genotypes of P. larvae led to the identification of
putative virulence factors like potent antibiotics belonging to the class
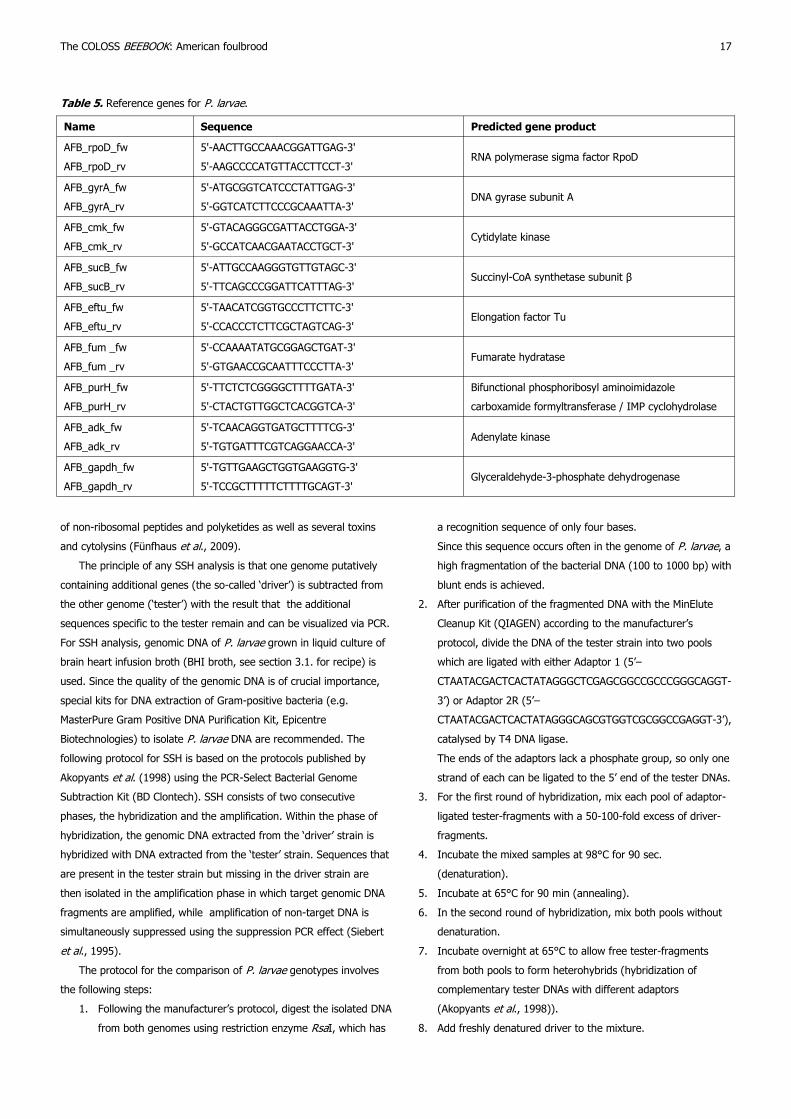
of non-ribosomal peptides and polyketides as well as several toxins
and cytolysins (Fünfhaus et al., 2009).
The principle of any SSH analysis is that one genome putatively
containing additional genes (the so-called ‘driver’) is subtracted from
the other genome (‘tester’) with the result that the additional
sequences specific to the tester remain and can be visualized via PCR.
For SSH analysis, genomic DNA of P. larvae grown in liquid culture of
brain heart infusion broth (BHI broth, see section 3.1. for recipe) is
used. Since the quality of the genomic DNA is of crucial importance,
special kits for DNA extraction of Gram-positive bacteria (e.g.
MasterPure Gram Positive DNA Purification Kit, Epicentre
Biotechnologies) to isolate P. larvae DNA are recommended. The
following protocol for SSH is based on the protocols published by
Akopyants et al. (1998) using the PCR-Select Bacterial Genome
Subtraction Kit (BD Clontech). SSH consists of two consecutive
phases, the hybridization and the amplification. Within the phase of
hybridization, the genomic DNA extracted from the ‘driver’ strain is
hybridized with DNA extracted from the ‘tester’ strain. Sequences that
are present in the tester strain but missing in the driver strain are
then isolated in the amplification phase in which target genomic DNA
fragments are amplified, while amplification of non-target DNA is
simultaneously suppressed using the suppression PCR effect (Siebert
et al., 1995).
The protocol for the comparison of P. larvae genotypes involves
the following steps:
1. Following the manufacturer’s protocol, digest the isolated DNA
from both genomes using restriction enzyme RsaI, which has
The COLOSS BEEBOOK: American foulbrood 17
a recognition sequence of only four bases.
Since this sequence occurs often in the genome of P. larvae, a
high fragmentation of the bacterial DNA (100 to 1000 bp) with
blunt ends is achieved.
2. After purification of the fragmented DNA with the MinElute
Cleanup Kit (QIAGEN) according to the manufacturer’s
protocol, divide the DNA of the tester strain into two pools
which are ligated with either Adaptor 1 (5’–
CTAATACGACTCACTATAGGGCTCGAGCGGCCGCCCGGGCAGGT-
3’) or Adaptor 2R (5’–
CTAATACGACTCACTATAGGGCAGCGTGGTCGCGGCCGAGGT-3’),
catalysed by T4 DNA ligase.
The ends of the adaptors lack a phosphate group, so only one
strand of each can be ligated to the 5’ end of the tester DNAs.
3. For the first round of hybridization, mix each pool of adaptor-
ligated tester-fragments with a 50-100-fold excess of driver-
fragments.
4. Incubate the mixed samples at 98°C for 90 sec.
(denaturation).
5. Incubate at 65°C for 90 min (annealing).
6. In the second round of hybridization, mix both pools without
denaturation.
7. Incubate overnight at 65°C to allow free tester-fragments
from both pools to form heterohybrids (hybridization of
complementary tester DNAs with different adaptors
(Akopyants et al., 1998)).
8. Add freshly denatured driver to the mixture.
Table 5. Reference genes for P. larvae.
Name Sequence Predicted gene product
AFB_rpoD_fw
AFB_rpoD_rv
5'-AACTTGCCAAACGGATTGAG-3'
5'-AAGCCCCATGTTACCTTCCT-3' RNA polymerase sigma factor RpoD
AFB_gyrA_fw
AFB_gyrA_rv
5'-ATGCGGTCATCCCTATTGAG-3'
5'-GGTCATCTTCCCGCAAATTA-3' DNA gyrase subunit A
AFB_cmk_fw
AFB_cmk_rv
5'-GTACAGGGCGATTACCTGGA-3'
5'-GCCATCAACGAATACCTGCT-3' Cytidylate kinase
AFB_sucB_fw
AFB_sucB_rv
5'-ATTGCCAAGGGTGTTGTAGC-3'
5'-TTCAGCCCGGATTCATTTAG-3' Succinyl-CoA synthetase subunit β
AFB_eftu_fw
AFB_eftu_rv
5'-TAACATCGGTGCCCTTCTTC-3'
5'-CCACCCTCTTCGCTAGTCAG-3' Elongation factor Tu
AFB_fum _fw
AFB_fum _rv
5'-CCAAAATATGCGGAGCTGAT-3'
5'-GTGAACCGCAATTTCCCTTA-3' Fumarate hydratase
AFB_purH_fw
AFB_purH_rv
5'-TTCTCTCGGGGCTTTTGATA-3'
5'-CTACTGTTGGCTCACGGTCA-3'
Bifunctional phosphoribosyl aminoimidazole
carboxamide formyltransferase / IMP cyclohydrolase
AFB_adk_fw
AFB_adk_rv
5'-TCAACAGGTGATGCTTTTCG-3'
5'-TGTGATTTCGTCAGGAACCA-3' Adenylate kinase
AFB_gapdh_fw
AFB_gapdh_rv
5'-TGTTGAAGCTGGTGAAGGTG-3'
5'-TCCGCTTTTTCTTTTGCAGT-3' Glyceraldehyde-3-phosphate dehydrogenase
9. Allow the samples to hybridize.
During this step, hybrid molecules are formed, but only DNA
fragments which are exclusively present in the sample of the
tester strain are amplified in the subsequent amplification
phase.
10. For amplification, perform a nested PCR with adaptor specific
primers.
For the first PCR, the primer 1 (5'-
CTAATACGACTCACTATAGGGC-3') is used. For the second PCR,
the nested primer 1 (5'-TCGAGCGGCCGCCCGGGCAGGT-3')
and the nested primer 2R (5'-AGCGTGGTCGCGGCCGAGGT-3')
are used.
11. To obtain a library of tester-specific sequences, secondary
PCR products - i.e., clone tester specific DNA fragments - are
then cloned into appropriate vectors (e.g. pCR2.1TOPO
vector, Invitrogen, containing an ampR gene).
12. Transform into competent E. coli (e.g. TOP10 cells,
Invitrogen) following the manufacturer’s instructions.
13. Plate transformation mixes on agar plates supplemented with
Ampicillin (100 µg/ml)
14. Incubate overnight at 37°C.
15. Pick and grow clones individually overnight in Luria broth in
the presence of Ampicillin (100 µg ml/ml) at 37°C and 300
rpm.
16. Extract plasmid DNA from these overnight cultures (e.g. by
using the Qiagen plasmid mini kit).
17. The presence of inserted P. larvae DNA can be verified by
restriction digestion. In the case of pCR2.1TOPO, perform
digestion with EcoRI.
18. Sequence detected inserts from positive clones using
appropriate primers.
For pCR2.1TOPO, use primers M13 uni (-21)
5’-TGTAAAACGACGGCCAGT-3’ and M13 rev (-29)
CAGGAAACAGCTATGACC.
19. To verify the specificity of the DNA fragments for the tester
strain, perform a PCR with fragment specific PCR primers on
DNA from the tester strain and related P. larvae strains (i.e.,
representatives of the same genotype).
In each subtraction, all controls recommended by the
manufacturer must be performed and all must test positive. Analysis
of the tester-specific sequences is performed with BLASTx (Altschul et al.,
1990, 1997) followed by functional annotation based on the COG
(cluster of orthologous groups) classification (Tatusov et al., 1997,
2003).
5.3. Conventional proteomics using two-
dimensional gel electrophoresis
Genomic sequences are not sufficient for explaining biological
functions because there is no strict linear correlation between the
genome and the proteome of an organism. For example, protein
modifications and relative concentration of proteins cannot be
determined by genomic analysis (Pandey and Mann, 2000).
Furthermore, the DNA sequences give no information about conditions
and time for translation as well as effects of up or down regulation of
gene expression (Humphery-Smith et al., 1997). Therefore,
predictions on the basis of genetic information should be completed
by expression data at the level of the transcriptome and the
proteome. By means of proteome analysis, a holistic approach of
protein expression under specific conditions is possible. The classical
method of proteomics is the two-dimensional (2D) gel electrophoresis
(O’Farrell, 1975; Klose, 1975). Recently, it was successfully used for a
comparison of the P. larvae genotypes ERIC I and II (Fünfhaus and
Genersch, 2012).
Sample preparation for 2D electrophoresis uses the following
protocol (Fünfhaus and Genersch, 2012):
1. Cultivate P. larvae strains to be analysed on Columbia sheep
blood agar (CSA; see section 3.1. for recipe) plates for three
days at 37°C.
2. To obtain a pre-culture, inoculate 3 ml brain heart infusion
broth (BHI, see section 3.1 for recipe) with one bacterial
colony and the cells are grown overnight at 37°C with shaking
at 200 x g.
3. To obtain a 10 ml main culture, inoculate 9 ml BHI with a pre-
culture to achieve a final OD600 of 0.01 after adjustment to a
final volume of 10 ml with BHI.
4. Incubate at 37°C with shaking at 200 x g.
5. Monitor growth continuously by measuring OD600.
6. Stop growth in the late exponential phase (OD600 0.65) by
harvesting the cells via centrifugation (20 min, 5,000 x g, 4°C).
7. Wash the bacterial cell pellets three times with ice-cold PBS.
8. Resuspended in 1 ml lysis buffer (7 M urea, 2M thiourea, 4%
(w/v) CHAPS, complete protease inhibitor cocktail (Roche)).
9. Disrupt cells by using a sonicator, e.g. ranson Sonifier 250
(duty control: 10%; output control: 1). Repeated sonication
cycles (ten times for 30 sec) are interrupted by cooling phases
for 60 sec.
10. Incubate samples for 1 h at RT to facilitate dissolving the
proteins.
11. Separate crude protein extracts from cellular debris by
centrifugation at 16,100 x g for 25 min at 4°C.
The resulting supernatant contains the cytosolic proteins but
also salts and other small charged molecules which need to
be removed from the solution by precipitation.
12. Precipitate the cytosolic proteins of P. larvae with one volume
20% TCA, 2% Triton X-100 overnight at 4°C.
13. Pellet the precipitated proteins by centrifugation (16,100 x g,
25 min, 4°C).
14. Wash the pellets with 80% acetone to remove residual TCA.
18 de Graaf et al.
15. Resuspend the washed pellet in 200 µl sample buffer (7 M urea,
2M thiourea, 4% (w/v) CHAPS, 100 mM DTT, 1% Bio-Lyte
Ampholyte (Bio-Rad), complete protease inhibitor cocktail
(Roche)).
16. Vortex for 1 h at RT.
17. Separate the insoluble material from the soluble proteins by
centrifugation (15,000 x g, 1 h, 15°C) to obtain the soluble
cytoplasmic fraction.
18. Determine the protein concentration by performing the
Pierce® 660 nm Protein Assay (Thermo Scientific) according to
the manufacturer’s protocol.
19. Store samples at -80°C until further analysis.
These protein samples are then subjected to 2D-gel
electrophoresis with the isoelectric focussing (IEF) as the first
dimension followed by SDS-PAGE analysis as second dimension.
20. Dilute the samples with rehydration buffer (7 M urea, 2 M
thiourea, 1% (w/v) CHAPS, 10 mM DTT, 0.25% Bio-Lyte
Ampholyte (Bio-Rad)).
21. Determine the amount of protein to load on IPG strip
according to the sample, the pH range, the length of the IPG
strip and the staining method.
22. Focussing of proteins is best performed in commercially
available, immobilized pH gradient strips (IPG strips) selecting
a suitable pH gradient. For the analysis of P. larvae proteins
IPG strips with a pH gradient 5-8 and a length of 7 cm (Bio-Rad)
proved to be useful.
23. Load 60 µg cytosolic P. larvae proteins in a total rehydration
volume of 125 µl on the IPG strips.
The following protocol for IEF is adapted to the PROTEAN IEF Cell
(Bio-Rad) at 20°C:
24. Load the samples on the IPG strips by an active in-gel
rehydration for 18 h at 50 V followed by a voltage profile with
increasing values:
linear increase from 50 – 200 V for 1 min.
200 V for 200 Vh.
linear increase from 200 – 500 V for 1 min.
500 V for 500 Vh.
linear increase from 500 – 1000 V for 1 min.
1000 V for 1000 Vh.
linear increase from 1000 – 2000 V for 1 min.
2000 V for 2000 Vh.
linear increase from 2000 – 4000 V for 1 min.
4000 V for 4500 Vh.
25. Subsequently, saturate the proteins separated in the IEF gel
with SDS by equilibrating the IPG strips in equilibration buffer
I (6M urea, 30% (v/v) glycerol, 5% (w/v) SDS, 0.05 M Tris pH
8.8, 1% (w/v) DTT) for 10 min.
The COLOSS BEEBOOK: American foulbrood 19
26. Block free SH-groups of the separated proteins by
equilibrating the IPG strips in equilibration buffer II (6M urea,
30% (v/v) glycerol, 5% (w/v) SDS, 0.05 M Tris pH 8.8, 5% (w/v)
iodoacetamide) for 10 min.
27. For the SDS-PAGE as second dimension a 12% polyacrylamide
gel run at 35 mA in a PROTEAN II XL Cell (Bio-Rad) proved to
be suitable.
28. Gels are stained with Coomassie (Page Blue Protein Solution,
Fermentas) according to standard protocol (see the BEEBOOK
paper on physiological and biochemical methods (Hartfelder
et al., 2013)).
Analysis of the 2D gels can be performed by using software
PDQuest 8.0 (Bio-Rad). Protein identification can be achieved by mass
spectrometric analysis followed by comparison of peptide masses and
sequence information of the sample with different databases (see the
BEEBOOK paper on physiological and biochemical methods (Hartfelder
et al., 2013) and the BEEBOOK paper on chemical ecology (Torto et al.,
2013)).
5.4. Differential proteomics of Paenibacillus larvae
Liquid chromatography coupled directly to mass spectrometry
provides another means for monitoring a proteome or changes in a
proteome. Such global monitoring of changes in levels of proteins in
response to a stimulus (e.g. a pathogen such as P. larvae) can
provide very direct insight into the molecular mechanisms employed
to respond to that challenge. For example, bee larvae up-regulate
expression and activation of phenoloxidase in response to a P. larvae
challenge (Chan et al., 2009). Mass spectrometry is currently the
favoured detection method for monitoring the entire protein
component of a system (i.e. the proteome), and various methods
exist for comparing protein expression in one state to that in another.
The most quantitative approach involves the use of stable isotopes to
introduce a ‘mass tag’ into the proteins from two or more different
conditions and then in subsequent mass spectrometric analyses, the
intensities of the differently tagged forms reflect the relative
quantities in the original sample. Several such labelling methods exist
and are reviewed elsewhere (Ong et al., 2003), so here we focus on
the method that has been used most extensively in honey bee
proteomics. It involves the reductive dimethylation of primary amines
in peptides using formaldehyde isotopologues.
Assumptions: a suitable, controlled experiment should be
designed to compare untreated bees/cells to equivalent samples
treated with a stimulus or challenged with a pathogen. If the following
steps cannot be carried out immediately, then samples can typically
be stored as a cell pellet, tissue, or whole bee at -80˚C for weeks or
months without protein degradation.
5.4.1. Sample preparation
5.4.1.1. Extract proteins
Extract proteins into 50 mM NH4HCO3 (pH 8.0) with 1% sodium
deoxycholate (ABC/DOC).
Option 1: For cultured or primary cells:
1. Wash cells first in PBS.
2. Pellet at 600 x g.
3. Remove supernatant.
4. Solubilize the pellet in ABC/DOC at a ratio of 100 µl per
2E+07 cells.
The final protein concentration, measured by the BCA method,
should be approximately 1 µg/µl.
Option 2: For any bee tissues:
1. Place the material in a beadmill tube with enough 6 M urea, 2 M
thiourea and 50 mM Tris (pH 8.0) to fully immerse the tissue.
2. Pulverize the tissue in a beadmill.
Determine the specific conditions empirically for each tissue
and beadmill type.
3. After milling, pellet insoluble material at 16,000 x g for 10 min
at 4°C.
4. Move the supernatant to a clean tube.
5. Precipitate the proteins in the supernatant by adding four
volumes of 100% ethanol, 20 µg of molecular biology-grade
glycogen and 50 mM sodium acetate (pH 5, from a 2.5 M
stock solution).
6. Allow the solution to stand at RT for 90 min.
7. Pellet the proteins by centrifuging for 10 min at 16,000 x g.
8. Resuspend the pellet from this final step in ABC/DOC to bring
the protein concentration to 1 µg/µl.
5.4.1.2. Reduce, alkylate and digest proteins to peptides
1. For each sample, add 1 µg dithiothreitol (from a stock solution
of 1 µg/µl) to 50 µg total protein.
2. Incubate the solution for 30 min at 37°C.
3. Add 5 µg iodoaccetamide (from a stock solution of 5 µg/µl).
4. Incubate for 20 min at 37°C.
5. Add 1 µg trypsin (mass spectrometry-grade, Promega).
6. Incubate overnight at 37°C.
5.4.1.3. Clean up peptides
1. Adjust pH of overnight digestion to ~2 using 10% acetic acid.
2. For each sample, prepare a STAGE tip (Rappsilber et al., 2007)
by pushing 20 µl methanol through, followed by 20 µl 0.5%
acetic acid.
3. Push 10 µg total peptide mass (based on original 50 µg input)
through the STAGE tip.
4. Wash each tip with 20 µl 0.5% acetic acid.
5. Elute the peptides from each tip into a clean microfuge tube
with 10 µl 80% acetonitrile, 0.5% acetic acid.
6. Evaporate the solvent from each sample in a vacuum centrifuge.
20 de Graaf et al.
5.4.1.4. Label peptides with stable isotopes
1. Add 20 μl of 100 mM triethylammonium bicarbonate to each
tube of dried peptides.
2. Sonicate for 5 min to solubilize peptides.
3. Add 20 μl of formaldehyde isotopologues to respective
samples.
200 mM CH2O (L)-light to the first sample.
200 mM C2H2O (M)- medium to the second sample.
200 mM 13C2H2O – heavy (H) to the third sample).
4. Add 2 μl of 1 M light ALD solution (sodium cyanoborohydride)
to the first (L) sample and second (M) sample.
5. Add 2 μl of 1 M heavy ALD solution (sodium cyanoborodeuteride)
to the third (H) sample.
6. Sonicate for 5 min.
7. If required, centrifuge for 1 min at low speed to collect all of
the solution at the bottom.
8. Leave at ambient temperature in the dark for 90 min.
9. Add 20 μl of 3.0 M NH4Cl.
10. Leave at ambient temperature in the dark for 10 min.
11. Add acetic acid until pH < 2.5.
5.4.1.5. Clean up peptides
1. From the final step in paragraph 5.4.1.4. ‘Label peptides with
stable isotopes’, combine the two (for duplex labelling) or
three (for triplex labelling) into a single tube.
2. Repeat all steps from paragraph 5.4.1.3. ‘Clean up peptides’
above, eluting the peptides in step 5 into a 96-well microwell
plate.
5.4.1.6. Mass spectrometry analysis
1. Analyze the combined sample with at least a two-hour
gradient into a liquid chromatography-tandem mass
spectrometry system (LC-MS/MS).
Most labs will access such a system through a core facility
rather than operating the system themselves. Interested
readers are referred elsewhere for details on setting up such a
system (Forner et al., 2007).
2. Search the LC-MS/MS data against a protein database using
MaxQuant (Cox and Mann, 2008), Proteome Discoverer (from
ThermoFisher) or SpectrumMill (from Agilent).
Background on the principles underlying such database searching
has been covered elsewhere (Forner et al., 2007). The database
should contain all protein sequences from all species that might be in
the sample. For example, if the experiment has involved infecting
bees with P. larvae, the database should contain all A. mellifera and
all P. larvae sequences available from their respective genome project
pages in GenBank. The search engines mentioned above should also
report the isotope ratios representing the relative amounts of each
protein detected among the different samples.
5.5. Expression of heterologous proteins in
Paenibacillus larvae
The understanding of phenotypic differences within the species P. larvae
(Genersch and Otten, 2003; Genersch et al., 2005; Neuendorf et al.,
2004; Rauch et al., 2009) and the role of genotype-specific putative
virulence factors (Fünfhaus et al., 2009; Fünfhaus and Genersch, 2012)
have been hampered by the lack of molecular tools allowing genetic
manipulation of this pathogen.
To functionally analyse putative virulence factors during bacterial
pathogenesis, the corresponding genes need to be disrupted,
manipulated, or labelled for specific visualisation. Likewise, the
expression of homologous or heterologous proteins in P. larvae would
be a valuable tool to further study the molecular pathogenesis of
P. larvae infections. Recently, the first protocol for the expression of a
foreign protein (green fluorescent protein, GFP) in P. larvae has been
described (Poppinga and Genersch, 2012). Since GFP expression is
one of the most successful molecular tools to specifically label
proteins and to visualize them under native conditions (Tsien, 1998),
this can be considered a breakthrough in AFB research. Constitutive
expression of GFP in P. larvae will help to visualize and quantify
bacterial cells in larval experiments. Additionally, GFP-fused virulence
factors that are expressed during infection can be detected and
visualised in and/or outside the bacterial cell.
5.5.1. Transformation of Paenibacillus larvae
For this purpose plasmid pAD43-25 (BGSC, Bacillus Genetic Stock
Center), carrying the gene sequence for a GFP variant (gfpmut3a),
was transformed into wild type P. larvae strains ATCC9545 and 04-309
representing both relevant genotypes ERIC I and ERIC II, respectively
(Genersch et al., 2005, 2006). Plasmid pAD43-25 functions as an E.
coli/Gram-positive shuttle vector and enables bacteria to constitutively
express the GFP variant gfpmut3a (Dunn and Handelsman, 1999).
High level constitutive expression of mutant GFP in vegetative cells is
facilitated by the Bacillus cereus UW85 Pupp promoter upstream of
gfpmut3a. Mutant gfpmut3a has an optimal excitation wavelength of
498 nm and the plasmid contains a chloramphenicol resistance cassette.
The first critical step of the molecular manipulation of P. larvae is
the uptake of foreign DNA, e. g. plasmid DNA. Because P. larvae is a
gram-positive bacterium, transformation needs a high voltage electric
pulse for a successful uptake of foreign plasmid DNA. For this purpose
electrocompetent bacterial cells need to be prepared as described by
Murray and Aronstein (2008):
1. Grow P. larvae cultures to early exponential phase (OD600
0.3).
2. Harvest by centrifugation.
3. Wash bacterial pellets three times using 0.625 M sucrose.
The COLOSS BEEBOOK: American foulbrood 21
4. Resuspend the final bacterial pellet in 1/500 of the initial
culture volume.
5. Store at -80°C in 40 µl aliquots.
Electrocompetent P. larvae cells can then be transformed with a
plasmid containing a GFP-gene like pAD43-25 using the following
protocol:
1. For pAD43-25 transformation, thaw competent cells at 4°C.
2. Add 500 ng of pAD43-25 in a maximum volume of 10 µl.
3. During an incubation time of 15-20 min gently mix each
transformation tube every 5 min.
4. Pulse probes in ice cold 1 mm electroporation cuvettes
(Eppendorf).
5. The best transformation results can be achieved with 9 kV/cm
for representatives of the genotype ERIC I and 10 kV/cm for
representatives of the genotype ERIC II. An average of
1.8E+04 and 1.1E+06 transformants per 0.5 µg DNA
(3.6E+04 and 2.2E+06 transformants per µg DNA) for ERIC I
and ERIC II, is obtained using these conditions.
6. Immediately transfer transformation tubes containing shocked
cells to 960 µl pre-warmed MYPGP broth.
7. Incubated at 37°C for 16 hours with shaking (350 x g).
8. Dilute regenerated transformation mixes.
9. Plate on MYPGP agar supplemented with 5 µg/ml
chloramphenicol.
10. Incubate agar plates at 37°C.
11. Determine the number of colony forming units (cfu) after 3 days.
5.5.2. Detection of GFP-expression
For GFP detection in the vegetative recombinant P. larvae isolates
ATCC9545 (ERIC I) + pAD43-25 and P. larvae 04-309 (ERIC II) +
pAD43-25, clones can be cultivated and analysed during different
stages of growth in liquid MYPGP media (Dingman and Stahly, 1983),
supplemented with 5 µg/ml chloramphenicol. In each bacterial stage
of growth, 10 µl aliquots of the suspension are analysed bright field
microscopically using differential interference contrast (DIC).
Fluorescence activity is detected by a FITC filter block (e.g. Nikon Ti-E
Inverted Microscope). All stages of growth are analysed and it can be
observed that the rate of gfpmut3a expressing P. larvae clones
remains stable throughout the logarithmic as well as the stationary
growth phase, indicating that plasmid pAD43-25 is correctly replicated
throughout bacterial growth.
Expression of GFP remained stable even after sporulation and
germination. This is an essential prerequisite for using recombinant
bacteria in infection assays because only spores can be used for
infection, and the vegetative bacteria inside the larvae should still
carry and express the introduced gene.
5.6. Fluorescent in situ hybridization for the
detection of Paenibacillus larvae
Recently, Yue and collaborators (Yue et al., 2008) described a P. larvae
specific method based on a previously described general technique of
fluorescence in situ hybridization (FISH) (Moter et al., 1998). FISH
methods are based on specific binding of fluorescent-labelled
oligonucleotide probes to complementary sequences in fixed and
permeabilized sections (Itzkovitz and van Oudenaarden, 2011). This
approach provides a highly specific method to visualize P. larvae in
infected larval histological sections, thereby allowing disease
monitoring and observation of the life cycle of the bacterium inside
the host. P. larvae FISH methodology uses a specific complementary
P. larvae 16S rRNA targeted oligonucleotide probe coupled with
fluorescein isothiocyanate (FITC), that specifically binds to P. larvae
rRNA. Since bacterial cells are filled with ribosomes, this technique
allows the ”staining“ of the vegetative bacteria. In order to
simultaneously visualize the cytoplasm of larval cells, cyanine Cy3-
labeled oligonucleotides universally detecting conserved 18S rRNA
eukaryotic sequences are used. Finally, 4',6-diamidino-2-phenylindole
(DAPI), a fluorescent dye that binds A-T rich regions of DNA, is
employed to visualize cell nuclei.
The following protocol provides a method to fix and embed larval
tissues, in order to obtain histological sections, as well as for further
processing these sections by fluorescence in situ hybridization.
5.6.1. Preparation and embedding of larval tissues
1. Perform infection assays as described in section 4.1.
2. Wash each larva for 5 seconds with 100% ethanol.
3. Fix larvae by overnight incubation with 4% Roti Histofix (Roth,
Karlsruhe) at 4°C at 20 rpm.
4. Wash samples overnight with 1X PBS solution containing 6.8%
sucrose under the same conditions.
5. Wash samples with 100% acetone.
During the first five minutes, change acetone until the solution
becomes clear.
6. Incubate with the final change of acetone for 1 hour under
the same conditions.
7. Mix equal volumes of 100% acetone and Technovit 8100
solution (Heraeus Kulzer, Wehrheim).
8. Incubate samples for 2 hours with this solution under
previous conditions.
9. Perform infiltration and embedding using Technovit 8100
according to manufacturer´s instructions.
10. Cut 4 µm-sections using a microtome, straighten them with
warm sterile water on slides.
11. Store slides at 4°C until further use.
22 de Graaf et al.
5.6.2. Performing fluorescence in situ hybridization
1. Sections should be rehydrated and prepared for hybridization
as follows in order to improve permeability:
1.1. Wash slides with xylene 3 x 10 min.
1.2. Wash slides with 100% ethanol 3 x 3 min.
1.3. Wash slides with 90% ethanol 2 x 3 min.
1.4. Wash slides with 80% ethanol 2 x 3 min.
1.5. Wash slides with 70% ethanol 1 x 3 min.
1.6. Wash slides with 50% ethanol 2 x 3 min.
1.7. Wash slides with double distilled water (DEPC) 2 x 3 min.
1.8. Incubate slides with 1 mg/ml Proteinase K in 0.2M Tris-HCl
(pH 7.9) for 5 min at 37°C in a humid chamber.
1.9. Incubate slides with 1 mg/ml lysozyme in DEPC double-
destilled water for 15 min at 37°C in a humid chamber.
1.10. Wash slides three times with 1X PBS.
2. Incubate slides with 100 ng of each probe (specific bacterial
16S rRNA-probe and universal eukaryotic 18S rRNA-probe)
diluted in 20 µl of FISH-hybridization buffer (20% (v/v)
deionized formamide, 0.9 M NaCl, 20 mM Tris-HCl pH 7.9,
0.01% (m/v) SDS).
3. Cover with slip and transfer to a Corning chamber.
4. Dispense double-distilled water into the cavities of the
chamber and close it.
5. Incubate in a humid chamber at 46°C from 4 h to overnight.
6. Carefully remove cover slip in 1X PBS.
7. Wash slides three times with 1X PBS.
8. Add 50 µl of DAPI solution (1 µg/ml in methanol) to each slide.
9. Cover again.
10. Incubate at RT for 10 min.
11. Remove cover slip in 1X PBS and wash slides three times with
1X PBS.
12. Mount slides with antifade reagent.
6. Final remarks
In the past decade, different basic issues related to American
foulbrood have been addressed, including the reclassification of its
aetiological agent (Genersch et al., 2006; Ashiralieva and Genersch,
2006), the development of methods for genotyping (Genersch and
Otten, 2003; Alippi et al., 2004; Genersch et al., 2006; Antúnez et al.,
2007) and the annotation of its genome sequence (Qin et al., 2006;
Chan et al., 2011). The latter permitted the introduction of techniques
for studying the bacterial transcriptome and proteome. Candidate
reference genes and the methods to select them have been described
in this paper. The availability of a protocol for heterologous expression
of foreign proteins in P. larvae can be considered a great breakthrough
in AFB research (Poppinga and Genersch, 2012). Nevertheless, we are
only at the start of understanding the intimate relationship between
P. larvae and its host. We hope that methods that are presented in
this paper can help scientists to further explore the secrets of
American foulbrood disease in honey bees.
7. Acknowledgements
We mourn the passing of Drs. Dieter De Koker who contributed to this
chapter. Dieter was a talented PhD student at Ghent University. Our
thoughts are with his family and friends. DCdG and LDS gratefully
acknowledge the Research Foundation of Flanders (FWO-Vlaanderen;
G.0163.11) for financial support.
8. References
AGRON, P G; MACHT, M; RADNEDGE, L; SKOWRONSKI, E W; MILLER,
W; ANDERSEN, G L (2002) Use of subtractive hybridization for
comprehensive surveys of prokaryotic genome differences. FEMS
Microbiology Letters 211: 175–182.
http://dx.doi.org/10.1111/j.1574-6968.2002.tb11221.x
AKOPYANTS, N S; FRADKOV, A; DIATCHENKO, L; HILL, J E; SIEBERT,
P D; LUKYANOV, S; SVERDLOV, E; BERG, D E (1998) PCR-based
subtractive hybridization and differences in gene content among
strains of Helicobacter pylori. Proceedings of the National
Academy of Sciences USA 95 (22): 13108-13113.
http://dx.doi.org/10.1073/pnas.95.22.13108
ALIPPI, A M (1991) A comparison of laboratory techniques for the
detection of significant bacteria of the honey bee Apis mellifera L.
in Argentina. Journal of Apicultural Research 30(2): 75–80.
ALIPPI, A M (1995) Detection of Bacillus larvae spores in Argentinian
honeys by using a semi-selective medium. Microbiologia SEM 11:
343–350.
ALIPPI, A M; AGUILAR, O M (1998a) Characterization of isolates of
Paenibacillus larvae subsp. larvae from diverse geographical origin
by the polymerase chain reaction and BOX primers. Journal of
Invertebrate Pathology 72: 21-27.
http://dx.doi.org/10.1006/jipa.1998.4748
ALIPPI, A M; AGUILAR, O M (1998b). Unique fingerprints of
Paenibacillus larvae subsp. larvae strains. Journal of Apicultural
Research 37: 273-280.
ALIPPI, A M ; LOPEZ, A C; AGUILAR, O M (2002) Differentiation of
Paenibacillus larvae subsp. larvae, the cause of American
foulbrood of honey bees, by using PCR and restriction fragment
analysis of genes encoding 16S rRNA. Applied and Environmental
Microbiology 68(7): 3655-3660.
http://dx.doi.org/10.1128/AEM.68.7.3655-3660.2002
The COLOSS BEEBOOK: American foulbrood 23
ALIPPI, A M; LÓPEZ, A C; REYNALDI, F J; GRASSO, D H; AGUILAR, O M
(2007) Evidence for plasmid-mediated tetracycline resistance in
Paenibacillus larvae, the causal agent of a honey bee larval disease.
Veterinary Microbiology 125: 290-303.
http://dx.doi.org/10.1016/j.vetmic.2007.05.018
ALIPPI, A M; REYNALDI, F J; LÓPEZ, A C; DE GIUSTI, M R; AGUILAR,
O M (2004) Molecular epidemiology of Paenibacillus larvae larvae
and incidence of American foulbrood in Argentinean honeys from
Buenos Aires Province. Journal of Apicultural Research 43: 135-143.
ALTSCHUL, S F; GISH, W; MILLER, W; MYERS, E W; LIPMAN, D J
(1990) Basic local alignment search tool. Journal of Molecular
Biology 215(3): 403-410. http://dx.doi.org/10.1006/jmbi.1990.9999
ALTSCHUL, S F; MADDEN, T L; SCHÄFFER, A A; ZHANG, J; ZHANG, Z;
MILLER, W; LIPMAN, D J (1997) Gapped BLAST and PSI-BLAST: a
new generation of protein database search programs. Nucleic
Acids Research 25(17): 3389-3402.
http://dx.doi.org/10.1093/nar/25.17.3389
ANTUNEZ, K; PICCINI, C; CASTRO-SOWINSKI, S; ROSADO, A S;
SELDIN, L; ZUNINO, P (2007) Phenotypic and genotypic
characterization of Paenibacillus larvae isolates. Veterinary
Microbiology 124: 178-183.
http://dx.doi.org/10.1016/j.vetmic.2007.04.012
ASHIRALIEVA, A; GENERSCH, E (2006) Reclassification, genotypes
and virulence of Paenibacillus larvae, the etiological agent of
American foulbrood in honey bees – a review. Apidologie 37(4):
411-420. http://dx.doi.org/10.1051/apido:2006028
BÜCHLER, R; ANDONOV, S; BIENEFELD, K; COSTA, C; HATJINA, F;
KEZIC, N; KRYGER, P; SPIVAK, M; UZUNOV, A; WILDE, J (2013)
Standard methods for rearing and selection of Apis mellifera
queens. In V Dietemann; J D Ellis; P Neumann (Eds) The COLOSS
BEEBOOK, Volume I: standard methods for Apis mellifera research.
Journal of Apicultural Research 52(1):
http://dx.doi.org/10.3896/IBRA.1.52.1.07
CHAN, Q W T; MELATHOPOULOS, A P; PERNAL, S F; FOSTER, L J
(2009) The innate immune and systemic response in honey bees
to a bacterial pathogen, Paenibacillus larvae. BMC Genomics 10: 387.
http://dx.doi.org/10.1186/1471-2164-10-387
CHAN, Q W T; CORNMAN, R S; BIROL, I; LIAO, N Y; CHAN, S K;
DOCKING, T R; JACKMAN, S D; TAYLOR, G A; JONES, S J M; DE
GRAAF, D C; EVANS, J D; FOSTER, L J (2011) Updated genome
assembly and annotation of Paenibacillus larvae, the agent of
American foulbrood disease of honey bees. BMC Genomics 12: 450.
http://dx.doi.org/10.1186/1471-2164-12-450
DE GRAAF, D C; ALIPPI, A M; BROWN, M; EVANS, J D; FELDLAUFER, M;
GREGORC, A; HORNITZKY, M A Z; PERNAL, S F; SCHUCH, D M T;
TITERA, D; TOMKIES, V; RITTER, W (2006a) Diagnosis of
American foulbrood in honey bees: a synthesis and proposed
analytical protocols. Letters in Applied Microbiology 43: 583-590.
http://dx.doi.org/10.1111/j.1472-765X.2006.02057.x
24 de Graaf et al.
FORSGREN, E; STEVANOVIC, J; FRIES, I (2008) Variability in
germination and in temperature and storage resistance among
Paenibacillus larvae genotypes. Veterinary Microbiology 129: 342-349.
http://dx.doi.org/10.1016/j.vetmic.2007.12.001
FÜNFHAUS, A; ASHIRALIEVA, A; BORRISS, R; GENERSCH, E (2009)
Use of suppression subtractive hybridization to identify genetic
differences between differentially virulent genotypes of
Paenibacillus larvae, the etiological agent of American foulbrood of
honey bees. Environmental Microbiology Reports 1(4): 240-250.
http://dx.doi.org/10.1111/j.1758-2229.2009.00039.x
FÜNFHAUS, A; GENERSCH, E (2012) Proteome analysis of
Paenibacillus larvae reveals the existence of a putative S-layer
protein. Environmental Microbiology Reports 4: 194-202.
http://dx.doi.org/10.1111/j.1758-2229.2011.00320.x
GENERSCH, E; OTTEN, C (2003) The use of repetitive element PCR
fingerprinting (rep-PCR) for genetic subtyping of German field
isolates of Paenibacillus larvae subsp. larvae. Apidologie 34: 195-
206. http://dx.doi.org/10.1051/apido:2003025
GENERSCH, E; ASHIRALIEVA, A; FRIES, I (2005) Strain- and genotype
-specific differences in virulence of Paenibacillus larvae subsp.
larvae, a bacterial pathogen causing American foulbrood disease
in honey bees. Applied and Environmental Microbiology 71: 7551-
7555. http://dx.doi.org/10.1128/AEM.71.11.7551-7555.2005
GENERSCH, E; FORSGREN, E; PENTIKÄINEN, J; ASHIRALIEVA, A;
RAUCH, S; KILWINSKI, J; FRIES, I (2006) Reclassification of
Paenibacillus larvae subsp. pulvifaciens and Paenibacillus larvae
subsp. larvae as Paenibacillus larvae without subspecies
differentiation. International Journal of Systematic and Evolutionary
Microbiology 56(3): 501-511.
http://dx.doi.org/10.1099/ijs.0.63928-0
GENERSCH, E (2010) American foulbrood in honey bees and its
causative agent, Paenibacillus larvae. Journal of Invertebrate
Pathology 103 Suppl. 1: 10-19.
http://dx.doi.org/10.1016/j.jip.2009.06.015
GOCHNAUER, T A (1973) Growth, protease formation, and sporulation
of Bacillus larvae in aerated broth culture. Journal of Invertebrate
Pathology 22: 251-257.
GORDON, R E; HAYNES, W C; PANG, C H (1973) The genus Bacillus.
Agriculture handbook no. 427, Agricultural Research Service, US
Dept. of Agriculture, Washington, DC, USA.
GOVAN, V A; ALLSOPP, M H; DAVISON, S (1999) A PCR detection
method for rapid identification of Paenibacillus larvae. Applied and
Environmental Microbiology 65: 2243-2245.
HACKER, J; BLUM-OEHLER, G; MUHLDORFER, I; TSCHAPE, H (1997)
Pathogenicity islands of virulent bacteria: structure, function and
impact on microbial evolution. Molecular Microbiology 23: 1089–
1097. http://dx.doi.org/10.1046/j.1365-2958.1997.3101672.x
DE GRAAF, D C; DE VOS, P; HEYNDRICKX, M; VAN TRAPPEN, S;
PEIREN, N; JACOBS, F J (2006b) Identification of Paenibacillus
larvae to the subspecies level: an obstacle for AFB diagnosis.
Journal of Invertebrate Pathology 91(2): 115-123.
http://dx.doi.org/10.1016/j.jip.2005.10.010
DE GRAAF, D C; BRUNAIN, M; JACOBS, F J (2008) Implementation of
quality control and biosafety measurements in the diagnosis of
honey bee diseases. Journal of Apicultural Research 47(2): 151-153.
DELAPLANE, K S; VAN DER STEEN, J; GUZMAN, E (2013) Standard
methods for estimating strength parameters of Apis mellifera
colonies. In V Dietemann; J D Ellis; P Neumann (Eds) The
COLOSS BEEBOOK, Volume I: standard methods for Apis mellifera
research. Journal of Apicultural Research 52(1):
http://dx.doi.org/10.3896/IBRA.1.52.1.03
DIATCHENKO, L; LAU, Y F; CAMPBELL, A P; CHENCHIK, A;
MOQADAM, F; HUANG, B; LUKYANOV, S; LUKYANOV, K;
SVERDLOV, E D; SIEBERT, P D (1996) Suppression subtractive
hybridization: a method for generating differentially regulated or
tissue-specific cDNA probes and libraries. Proceedings of the
National Academy of Science USA 93(12): 6025-6030.
http://dx.doi.org/10.1073/pnas.93.12.6025
DINGMAN, D W (1983) Bacillus larvae: parameters involved with
sporulation and characteristics of two bacteriophages. PhD thesis,
University of Iowa, Iowa City, Iowa, USA.
DINGMAN, D W; STAHLY, D P (1983) Medium promoting sporulation
of Bacillus larvae and metabolism of medium components. Applied
and Environmental Microbiology 46: 860–869.
DINGMAN, D W; STAHLY, D P (1984) Protection of Bacillus larvae
from oxygen toxicity with emphasis on the role of catalase.
Applied and Environmental Microbiology 47: 1228-1237.
DOBBELAERE, W; DE GRAAF, D C ; PEETERS, J E; JACOBS, F J (2001)
Development of a fast and reliable diagnostic method for
American foulbrood disease (Paenibacillus larvae subsp. larvae)
using a 16S rRNA gene based PCR. Apidologie 32: 363-370.
DJORDJEVIC, S; HO-SHON, M; HORNITZKY, M A Z (1994) DNA
restriction endonuclease profiles and typing of geographically
diverse isolates of Bacillus larvae. Journal of Apicultural Research
33(2): 95-103.
DUNN, A K; HANDELSMAN; J (1999) A vector for promoter trapping in
Bacillus cereus. Gene 226: 297-305.
http://dx.doi.org/10.1016/S0378-1119(98)00544-7
EVANS, J D; PETTIS, J S (2005) Colony-level impacts of immune
responsiveness in honey bees, Apis mellifera. Evolution 59: 2270-
2274. http://dx.doi.org/10.1554/05-060.1
FORNER, F; FOSTER, L J; TOPPO, S (2007) Mass spectrometry data
analysis in the proteomics era. Current Bioinformatics 2(14): 63-93.
http://dx.doi.org/10.2174/157489307779314285
HARTFELDER, K; GENTILE BITONDI, M M; BRENT, C; GUIDUGLI-
LAZZARINI, K R; SIMÕES, Z L P; STABENTHEINER, A; DONATO
TANAKA, É; WANG, Y (2013) Standard methods for physiology
and biochemistry research in Apis mellifera. In V Dietemann; J D
Ellis; P Neumann (Eds) The COLOSS BEEBOOK, Volume I:
standard methods for Apis mellifera research. Journal of Apicultural
Research 52(1): http://dx.doi.org/10.3896/IBRA.1.52.1.06
HAYNES, W C; ST JULIAN, G; SHEKLETON, M C; HALL, H H;
TASHIRO, H (1961) Preservation of infectious milky disease
bacteria by lyophilization. Journal of Insect Pathology 3: 55-61.
HELLEMANS, J; MORTIER, G; DE PAEPE, A; SPELEMAN, F;
VANDESOMPELE, J (2007) qBase relative quantification framework
and software for management and automated analysis of real-time
quantitative PCR data. Genome Biology 8: R19.
http://dx.doi.org/10.1186/gb-2007-8-2-r19
HITCHCOCK, J D; MOFFETT, J O; LACKETT, J J; ELLIOTT, J R (1970)
Tylosin for control of American foulbrood disease in honey bees.
Journal of Economic Entomology 63: 204–207.
HORNITZKY, M A Z; CLARK, S (1991) Culture of Bacillus larvae from
bulk honey samples for the detection of American foulbrood.
Journal of Apicultural Research 30: 13–16.
HORNITZKY, M A Z; DJORDEVIC, S (1992). Sodium dodecyl sulphate
polyacrylamide profiles and Western blots of Bacillus larvae.
Journal of Apicultural Research 31(1): 47-49.
HORNITZKY, M A Z; KARLOVSKIS, S (1989) A culture technique for
the detection of Bacillus larvae in honey bees. Journal of
Apicultural Research 28(2): 118–120.
HORNITZKY, M A Z; NICHOLLS, P J (1993) J-medium is superior to
sheep blood agar and brain heart infusion agar for the isolation of
Bacillus larvae from honey samples. Journal of Apicultural Research
32: 51–52.
HUMPHERY-SMITH, I; CORDWELL, S J; BLACKSTOCK, W P (1997)
Proteome research: Complementarity and limitations with respect
to the RNA and DNA worlds. Electrophoresis 18(8): 1217-1242.
http://dx.doi.org/10.1002/elps.1150180804
ITZKOVITZ, S; VAN OUDENAARDEN, A (2011) Validating transcripts
with probes and imaging technology. Nature Methods 8: S12-S19.
http://dx.doi.org/10.1038/NMETH.1573
JANKE, B; DOBRINDT, U; HACKER, J; BLUM-OEHLER, G (2001) A
subtractive hybridization analysis of genomic differences between
the uropathogenic E. coli strain 536 and the E. coli K-12 strain
MG1655. FEMS Microbiology Letters 199: 61–66.
http://dx.doi.org/10.1111/j.1574-6968.2001.tb10651.x
KILWINSKI, J; PETERS, M; ASHIRALIEVA, A; GENERSCH, E (2004)
Proposal to reclassify Paenibacillus larvae subsp. pulvifaciens DSM
3615 (ATCC 49843) as Paenibacillus larvae subsp. larvae. Results
of a comparative biochemical and genetic study. Veterinary
Microbiology. 104: 31-42.
http://dx.doi.org/10.1016/j.vetmic.2004.08.001
The COLOSS BEEBOOK: American foulbrood 25
KLOSE, J (1975) Protein mapping by combined isoelectric focusing
and electrophoresis of mouse tissues. A novel approach to testing
for induced point mutations in mammals. Humangenetik 26(3):
231-243.
LONCARIC, I; DERAKHSHIFAR, I; OBERLERCHNER, J T;
KÃGLBERGER, H; MOOSBECKHOFER, R (2009) Genetic diversity
among isolates of Paenibacillus larvae from Austria. Journal of
Invertebrate Pathology 100(1): 44-46.
http://dx.doi.org/10.1016/j.jip.2008.09.003
MOTER, A; LEIST, G; RUDOLPH, R; SCHRANK, K; CHOI, B K;
WAGNER, M; GÖBEL, U B (1998) Fluorescence in situ
hybridization shows spatial distribution of as yet uncultured
treponemes in biopsies from digital dermatitis lesions.
Microbiology 144(9): 2459-2467.
MURRAY, K D; ARONSTEIN, K A (2006) Oxytetracycline-resistance in
the honey bee pathogen Paenibacillus larvae is encoded on novel
plasmid pMA67. Journal of Apicultural Research. 45: 207-214.
MURRAY, K D; ARONSTEIN, K A; DE LEÓN, J H (2007) Analysis of
pMA67, a predicted rolling-circle replicating, mobilizable,
tetracycline-resistance plasmid from the honey bee pathogen,
Paenibacillus larvae. Plasmid 58: 89-100.
http://dx.doi.org/10.1016/j.plasmid.2007.02.001
MURRAY, K D; ARONSTEIN, K A (2008) Transformation of the Gram-
positive honey bee pathogen, Paenibacillus larvae, by
electroporation. Journal of Microbiological Methods 75: 325-328.
http://dx.doi.org/10.1016/j.mimet.2008.07.007
NEUENDORF, S; HEDTKE, K; TANGEN, G; GENERSCH, E (2004)
Biochemical characterization of different genotypes of Paenibacillus
larvae subsp. larvae, a honey bee bacterial pathogen. Microbiology
150(7): 2381-2390. http://dx.doi.org/10.1099/mic.0.27125-0
NORDSTRÖM, S; FRIES, I (1995) A comparison of media and cultural
conditions for identification of Bacillus larvae in honey. Journal of
Apicultural Research 34: 97-103.
O’FARRELL, P H (1975) High resolution two-dimensional
electrophoresis of proteins. Journal of Biological Chemistry 250
(10): 4007-4021.
OIE (2008) Chapter 2.2.2. American foulbrood. In OIE Manual of
Diagnostic Tests and Vaccines for Terrestrial Animals (mammals,
birds and bees), vol. 1 (Sixth Edition). OIE; Paris, France. pp 395-
404.
OIE (2011) Chapter 9.2. American foulbrood. In OIE Terrestrial
Animal Health Code, vol. 2 (Twentieth Edition). OIE; Paris, France.
pp 504-506.
OLIVE, D M; BEAN, P (1999) Principles and applications of methods
for DNA-based typing of microbial organisms. Journal of Clinical
Microbiology 37(6): 1661-1669.
ONG, S E; FOSTER, L J; MANN, M (2003) Mass spectrometric-based
approaches in quantitative proteomics. Methods. 29(2): 124-30.
http://dx.doi.org/10.1016/S1046-2023(02)00303-1
PANDEY, A; MANN, M (2000) Proteomics to study genes and genomes.
Nature 405(6788): 837-846.
PETERS, M; KILWINSKI, J; BERINGHOFF, A; RECKLING, D;
GENERSCH, E (2006) American foulbrood of the honey bee:
Occurrence and distribution of different genotypes of Paenibacillus
larvae in the administrative district of Arnsberg (North Rhine-
Westphalia). Journal of Veterinary Medicine 53(2): 100-104.
http://dx.doi.org/10.1111/j.1439-0450.2006.00920.x
PIRK, C W W; DE MIRANDA, J R; FRIES, I; KRAMER, M; PAXTON, R;
MURRAY, T; NAZZI, F; SHUTLER, D; VAN DER STEEN, J J M; VAN
DOOREMALEN, C (2013) Statistical guidelines for Apis mellifera
research. In V Dietemann; J D Ellis; P Neumann (Eds) The
COLOSS BEEBOOK, Volume I: standard methods for Apis mellifera
research. Journal of Apicultural Research 52(4):
http://dx.doi.org/10.3896/IBRA.1.52.4.13
POPPINGA, L; GENERSCH, E (2012) Heterologous expression of green
fluorescent protein in Paenibacillus larvae, the causative agent of
American foulbrood of honey bees. Journal of Applied Microbiology
112: 430-435. http://dx.doi.org/10.1111/j.1365-2672.2011.05214.x
QIN, X; EVANS, J D; ARONSTEIN, K A; MURRAY, K D; WEINSTOCK,
G M (2006) Genome sequences of the honey bee pathogens
Paenibacillus larvae and Ascosphaera apis. Insect Molecular
Biology 15(5): 715-718.
http://dx.doi.org/10.1111/j.1365-2583.2006.00694.x
RAPPSILBER, J; MANN, M; ISHIHAMA, Y (2007) Protocol for micro-
purification, enrichment, pre-fractionation and storage of peptides
for proteomics using StageTips. Nature Protocols 2(8): 1896-906.
http://dx.doi.org/10.1038/nprot.2007.261
RAUCH, S; ASHIRALIEVA, A; HEDTKE, K; GENERSCH, E (2009)
Negative correlation between individual-insect-level virulence and
colony-level virulence of Paenibacillus larvae, the etiological agent
of American foulbrood of honey bees. Applied and Environmental
Microbiology 75: 3344-3347.
http://dx.doi.org/10.1128/AEM.02839-08
RECKSEIDLER, S L; DESHAZER, D; SOKOL, P A; WOODS, D E (2001)
Detection of bacterial virulence genes by subtractive hybridization:
identification of capsular polysaccharide of Burkholderia
pseudomallei as a major virulence determinant. Infection and
Immunity 69: 34–44. http://dx.doi.org/10.1128/IAI.69.1.34-44.2001
SCHUCH, D M T; MADDEN, R H; SATTLER, A (2001) An improved
method for the detection and presumptive identification of
Paenibacillus larvae subsp larvae spores in honey. Journal of
Apicultural Research 40: 59–64.
SHIMANUKI, H; KNOX, D A (2000) Diagnosis of honey bee diseases.
USDA Agricultural Handbook No. H-690, Washington DC, USA. 61 pp.
SIEBERT, P D; CHENCHIK, A; KELLOGG, D E; LUKYANOV, K A;
LUKYANOV, S A (1995) An improved PCR method for walking in
uncloned genomic DNA. Nucleic Acids Research 23: 1087-1088.
http://dx.doi.org/10.1093/nar/23.6.1087
26 de Graaf et al.
SPIVAK, M; REUTER, G S (2001) Resistance to American foulbrood
disease by honey bee colonies, Apis mellifera, bred for hygienic
behaviour. Apidologie 32: 555-565.
STEINKRAUS, K H; MORSE, R A (1996) Media for the detection of
Bacillus larvae spores in honey. Acta Biotechnologica 16: 57-64.
TATUSOV, R L; KOONIN, E V; LIPMAN, D J (1997) A genomic
perspective on protein families. Science 278(5338): 631-637.
http://dx.doi.org/10.1126/science.278.5338.631
TATUSOV, R L; FEDOROVA, N D; JACKSON, J D; JACOBS, A R;
KIRYUTIN, B; KOONIN, E V; KRYLOV, D M; MAZUMDER, R;
MEKHEDOV, S L; NIKOLSKAYA, A N; RAO, B S; SMIRNOV, S;
SVERDLOV, A V; VASUDEVAN, S; WOLF, Y I; YIN, J J; NATALE, D A
(2003) The COG database: an updated version includes
eukaryotes. BMC Bioinformatics 4: 41.
http://dx.doi.org/10.1186/1471-2105-4-41
THOMAS, S R; ELKINTON, J S (2004) Pathogenicity and virulence.
Journal of Invertebrate Pathology 85: 146-151.
http://dx.doi.org/10.1016/j.jip.2004.01.006
TORTO, B; CARROLL, M J; DUEHL, A; FOMBONG, A T; NAZZI, F,
GOZANSKY, K T; SOROKER, V, TEAL, P E A (2013) Standard
methods for chemical ecology research in Apis mellifera. In V
Dietemann; J D Ellis; P Neumann (Eds) The COLOSS BEEBOOK,
Volume I: standard methods for Apis mellifera research. Journal
of Apicultural Research 52(4):
http://dx.doi.org/10.3896/IBRA.1.52.4.06
TSIEN, R Y (1998) The green fluorescent protein. Annual Review of
Biochemistry 67: 509-44.
http://dx.doi.org/10.1146/annurev.biochem.67.1.509
UNTERGASSER, A; NIJVEEN, H; RAO, X; BISSELING, T; GEURTS, R;
LEUNISSEN, J A M (2007) Primer3plus, an enhanced web
interface to primer3. Nucleic Acids Research 35: W71-W74.
http://dx.doi.org/10.1093/nar/gkm306
VANDESOMPELE, J; DE PRETER, K; PATTYN, F; POPPE, B; VAN ROY, N;
DE PAEPE, A; SPELEMAN, F (2002) Accurate normalization of real-
time quantitative RT-PCR data by geometric averaging of multiple
internal control genes. Genome Biology 3(7): 0034.1.
http://dx.doi.org/10.1186/gb-2002-3-7-research0034
VERSALOVIC, J; SCHNEIDER, M; DE BRUIJN, F J; LUPSKI, J R (1994).
Genomic fingerprinting of bacteria using repetitive sequence-
based polymerase chain reaction. Methods in Molecular and
Cellular Biology 5: 25-40.
WU, X Y; CHIN, J; GHALAYINI, A; HORNITZKY, M A Z (2005) Pulsed-
field gel electrophoresis typing and oxytetracycline sensitivity of
Paenibacillus larvae subsp. larvae isolates of Australian origin and
those recovered from honey imported from Argentina. Journal of
Apicultural Research 44: 87-92.

YUE, D; NORDHOFF, M; WIELER, L H; GENERSCH, E (2008)
Fluorescence in situ hybridization (FISH) analysis of the
interactions between honey bee larvae and Paenibacillus larvae,
the causative agent of American foulbrood of honey bees
(Apis mellifera). Environmental Microbiology 10: 1612-1620.
http://dx.doi.org/10.1111/j.1462-2920.2008.01579.x
The COLOSS BEEBOOK: American foulbrood 27
ZHANG, Y L; ONG, C T; LEUNG, K Y (2000) Molecular analysis of
genetic differences between virulent and avirulent strains of
Aeromonas hydrophila isolated from diseased fish. Microbiology
146: 999–1009.
ZUKER, M (2003) Mfold web server for nucleic acid folding and
hybridization prediction. Nucleic Acids Research 31: 3406-3415.
http://dx.doi.org/10.1093/nar/gkg595

Journal of Apicultural Research 52(1) © IBRA 2013

![A Note from Our Director - ncagr.gov · Nicolas Vidal-Naquet DVM, DIE American and European foulbrood diseases [Conference] // Hon-ey Bee Veterinary Consortium Conference. - Raleigh](https://img.pdfslide.net/doc/110x75/5c4c2c3993f3c3143646d416/a-note-from-our-director-ncagrgov-nicolas-vidal-naquet-dvm-die-american.jpg)