Embed Size (px)
Citation preview
STANFORD CENTER FOR INTERNATIONAL DEVELOPMENT
Working Paper No. 269
Development Strategy or Endogenous Process? The Industrialization of Latin America
by
Stephen Haber*
November 2005
* Department of Political Science, Stanford University
Stanford University 579 Serra Mall @ Galvez, Landau Economics Building, Room 153
Stanford, CA 94305-6015
Development Strategy or Endogenous Process?
The Industrialization of Latin America
Stephen Haber
(Date of this Draft: September 30, 2005)
JEL Classifications: N66, N76, O14, O54
Keywords: Industrial Growth, Latin America
This paper benefited from useful discussions with Herbert Klein, Noel Maurer, Victor
Menaldo, James Robinson, Kenneth Sokoloff, and Barry Weingast.
2
This essay builds upon recent research by scholars across a broad number of
disciplines to offer a reinterpretation of the history of Latin American industrialization. It
departs from the standard view that underlies much of the Latin Americanist literature in
political science, economics, and history: that Latin America had “open, primary product
export economies” from the 1870s to the 1950s; that these export economies were then
transformed into “import substituting industrial” economies during the period 1950-1980;
that the mechanism that drove this dramatic transformation was an about face in
economic policy making, from laissez faire to protectionism; and that this shift in
“development strategy” was strongly influenced by the writings of Raul Prebisch and
other economists at the United Nation’s Economic Commission for Latin America in the
1950s.
The reinterpretation that I offer contains three arguments. First, there is no neat
divide between a period of export-oriented growth and a period of import substituting
industrialization. The development of large-scale, mechanized (and even “heavy”)
industry can be dated from the 1890s in the region’s larger economies. Second, Latin
American industrialization began as an endogenous outcome of the growth of the export
sector, not the result of a rethinking of export-led development. Third, once
industrialization got underway, governments enacted protectionist policies at the behest
of manufacturers, but they did so in a haphazard manner, responding to specific political
and economic problems as they were overtaken by them. The notion that Latin America
embarked on a new “development strategy” influenced by Prebisch and ECLA in the
1950s is belied both by the fact that Latin America had been protectionist since the 1890s
3
and by the fact that the policies themselves— in the 1890s as well as in the 1950s and
1960s— were implemented in what can only be described as an ad hoc fashion.
The reinterpretation I offer has implications not only for economic history, but
for a broad range of literatures in political science and economics. The notion that there
are easily definable phases of Latin American development is an essential component of
Cardoso and Faletto’s theory of dependency, O’Donnell’s theory of bureaucratic
authoritarianism, and Haggard’s comparative analysis of East Asian and Latin American
development strategies.1 Indeed, some of these accounts (O’Donnell being a case in
point) not only posit a neat divide between primary product export economies and import
substituting industrialization (ISI), but then go on to argue that there was a causal
relationship between ISI and the collapse of democracy in the 1960s and 1970s. In short,
the reinterpretation that I offer suggests that many of the standard interpretations of Latin
American political economy are based on sets of stylized facts that are supported by little
more than their frequent repetition.
This is not to argue that industry did not grow in the decades after 1950, nor is it
to argue that the Latin American economies were not characterized by trade intensity in
the decades before World War I. It is to argue, however, that industrialization did not
spring fully grown and fully armored out of anyone’s brow. It was the outcome of a long
process that went back to the end of the nineteenth century. Indeed, governments
1 Fernando Henrique Cardoso and Enzo Faletto, Dependencia y desarrollo en América Latina: Ensayos de interpretación sociológica (Mexico City: Siglo XXI Editores, 1969); Guillermo O’Donnell, Modernization and Bureaucratic-Authoritarianism: Studies in South American Politics (Berkeley: Institute for International Studies, University of California, 1979); Guillermo O’Donnell, Bureaucratic Authoritarianism: Argentina, 1966-73, in Comparative Perspective (Berkeley: University of California Press, 1988); Stephan Haggard, Pathways from the Periphery: The Politics of Growth in Newly Industrializing Countries (Ithaca: Cornell University Press, 1990).
4
followed policies designed to subsidize and protect industry in the decades after 1950
precisely because industrialists and industrial workers had been protected since the 1890s
and therefore constituted effective protectionist lobbies.
Industrial Development Amidst Export-Led Growth, 1890-1930
There had been, at least since the mid-nineteenth century, precocious attempts at
industrial development in a number of Latin American countries. Nevertheless, the
available quantitative evidence indicates that whatever industry had been founded grew at
a very modest pace. Per capita incomes were too low, and markets were too isolated by
high transport costs, to support modern manufacturing.2
The pace of industrial growth accelerated rapidly in the 1890s. Circa 1914, the
larger countries of the region— particularly Brazil, Mexico, Chile, and Argentina—
boasted sizable manufacturing sectors, which produced a broad range of consumer non-
durables (particularly beer, cigarettes, soap, matches, hats, paper, footwear, and cotton
cloth). In some cases, domestic firms had also moved into the production of intermediate
inputs (basic chemicals, glass bottles), construction goods (particularly cement, wood
working, explosives, and bricks), and metal working, including the production of iron and
steel structural shapes, steel rails, and the fabrication of agricultural implements and parts
for railroad repair.
2 See, for example, Stanley Stein, The Brazilian Cotton Manufacture: Textile Enterprise in an Underdeveloped Area, 1850-1950 (Cambridge: Harvard University Press, 1957); Stephen Haber, “Assessing the Obstacles to Industrial Development: The Mexican Economy ,” Journal of Latin American Studies, 24:1 (1992), pp. 1-32; Armando Razo and Stephen Haber, "The Rate of Growth of Productivity in Mexico, 1850-1933: Evidence from the Cotton Textile Industry," Journal of Latin American Studies, 30:3 (1998), pp. 481-517; Fernando Rocchi, “Building a Nation, Building a Market: Industrial Growth and the Domestic Economy in Turn-of-the-Century Argentina,” Ph. D. Dissertation, University of California, Santa Barbara, 1997.

5
The impetus for industrial development came from the expansion of foreign trade.
Driving the growth of foreign trade were two factors. The first was that most Latin
American countries were on the silver standard, and silver fell in value relative to gold in
the last two decades of the nineteenth century. Most Latin American countries therefore
saw their currencies depreciate in real terms relative to the gold-backed currencies of the
economies of the North Atlantic. As international trade theory would predict, real
exchange rate depreciation resulted in the expansion of the tradables sectors at the
expense of non-tradables. Second, the late nineteenth century also saw a dramatic
decline in the international costs of transport, as steel-hulled steamships came to replace
wood and sail.3
Real exchange rate depreciation and falling costs of maritime transport kick-
started Latin American economic growth. Latin American countries could now produce
and ship goods at a price low enough to be competitive in the United States and Western
Europe. These exports included minerals (particularly copper and lead), industrial fibers
(cotton, wool, jute, and sisal), staple agricultural goods (primarily beef and wheat), and
non-staple agricultural commodities (the most important of which were coffee, bananas,
and sugar). The result was a wave of foreign direct investment in precisely those sectors.
In order for these investments to bear fruit, however, there had to be a means to move
commodities from their point of production to the ports or, in the case of Mexico, to the
U.S. border. Trade therefore gave rise to the construction of railroad networks (also
3 Kevin O’Rourke and Jeffrey Williamson, Globalization and History: The Evolution of a Nineteenth Century Atlantic Economy (Cambridge Mass: MIT Press, 1999).
6
financed by foreign investment) that crisscrossed Latin America, linking major cities and
integrating markets.4
The growth of the export sector, the concomitant growth of railway networks, and
implicit trade protection created by depreciating real exchange rates created the
conditions conducive to industrial development. First, there came into existence a wage
earning population of ranch hands, miners, plantation workers, stevedores, and railway
men that generated considerable demand for consumer goods. Second, this growing
population of working class consumers was not made up of isolated pockets of workers
toiling away in enclaves: they were part of a national market that was linked by railways.
In fact, as William Summerhill has shown for Brazil and Sandra Kuntz-Ficker has shown
for Mexico, most of the commodities carried by Latin American railways were destined
for domestic (not international) markets.5 Third, the railroads themselves were consumers
of manufactures, most particularly pig iron and steel ingots for railroad repair shops, and,
in the Mexican case, steel rails and wheels. Finally, the growth of the export sector
fueled the growth of urban centers, which created demand for construction goods such as
cement, wood products, and iron and steel structural shapes.
4 William Summerhill, "Transport Improvements and Economic Growth in Brazil and Mexico," in Stephen Haber (ed.), How Latin America Fell Behind: Essays on the Economic Histories of Brazil and Mexico, 1800-1914 (Stanford: Stanford University Press, 1997), pp. 93-117; and Order Against Progress: Government, Foreign Investment, and Railroads in Brazil, 1854-1913 (Stanford: Stanford University Press, 2003); Sandra Kuntz Ficker, Empresa extranjera y mercado interno: el Ferrocarril Central Mexicano, 1880-1907 (Mexico City: El Colegio de México, 1995); Sandra Kuntz Ficker and Paolo Riguzzi eds., Ferrocarriles y vida económica en México, 1850-1950: del surgimiento tardío al decaimiento precoz (Mexico: Colegio Mexiquense, 1996); John H. Coatsworth, Growth Against Development: The Economic Impact of Railroads in Porfirian Mexico (Dekalb, Illinois: Northern Illinois University Press, 1981). 5 William Summerhill, "Transport Improvements and Economic Growth in Brazil and Mexico," in Stephen Haber (ed.), How Latin America Fell Behind: Essays on the Economic Histories of Brazil and Mexico, 1800-1914 (Stanford: Stanford University Press, 1997), pp. 93-117; William Summerhill, Order Against Progress: Government, Foreign Investment, and Railroads in Brazil, 1854-1913 (Stanford: Stanford University Press, 2003), chap 6; Sandra Kuntz Ficker, Empresa extranjera y mercado interno: el Ferrocarril Central Mexicano, 1880-1907 (Mexico City: El Colegio de México, 1995).
7
Latin America’s merchants, who earlier had been importing manufactured goods,
quickly realized the potential created by growing markets and implicit trade protection.
They soon began to erect textile mills, beer breweries, cigarette factories, soap works,
and other manufacturing enterprises. The production of consumer goods, in turn,
produced demand for intermediate inputs, such as glass bottles, paper, and basic
chemicals. Almost immediately, Latin America’s nascent industrialists began to pressure
their governments for high tariffs on the final goods they produced (in order to further
protect them from foreign competition) and for low or zero tariffs on the capital and
intermediate goods they needed in order to ramp up production.
This process of industrial development as a consequence of the growth of the
export sector has been most intensively studied in the case of Mexico. Prior to the 1880s
Mexican manufacturing was hampered by low per capita incomes and by the lack of long
distance transport. Beginning in the 1880s, and then accelerating in the 1890s, “export led
growth” removed these obstacles to industrial development. As a consequence, industry
expanded at a dramatic pace.6
A description of the rapid growth and transformation of the cotton textile industry
gives a sense of the process. Circa 1888 the Mexican cotton textile industry was small,
much of it still operated on water power, and was characterized by a slow rate of
6 For a detailed discussion, see Stephen Haber, Industry and Underdevelopment: The Industrialization of Mexico, 1890-1940 (Stanford: Stanford University Press, 1989); Stephen Haber, “Assessing the Obstacles to Industrial Development: The Mexican Economy ,” Journal of Latin American Studies, 24:1 (1992), pp. 1-32; Mario Cerutti,, Burguesía, Capitales, e Industria en el Norte de México (Monterrey, Mexico: Universidad Autónoma de Nuevo León, 1992); Dawn Keremetsis, La industria textil mexicana en el Siglo XIX (Mexico City: Secretaría de Educación Pública, 1973); Carlos Marichal and Mario Cerutti eds., Historia de las grandes empresas en México, 1850-1930 (Mexico: Universidad Autónoma de Nuevo León and Fondo de Cultura Económica, 1997); Aurora Gómez Galvarriato, "The Impact of Revolution: Business and Labor in the Mexican Textile Industry, Orizaba, Veracruz, 1900-1930" (Ph.D. Dissertation, Harvard University, 1999).
8
productivity growth. In the next decade, the industry more than doubled in size. By
1911, the industry had grown an additional 50 percent. (See table 1) The quantitative
expansion of the textile industry was accompanied by a qualitative change in the methods
of production. Mexico’s mills now employed high-velocity, electric-powered looms and
spindles, which were a far cry from the old water, steam, horse, or human-powered
machinery. The new enterprises also operated on a tremendous scale, employing
hundreds of workers and thousands of machines. Indeed, Mexico’s leading firms were
not simply large relative to the small, Mexican market, they employed thousands of
workers and were enormous even by U.S. standards. Indeed, as table 2 demonstrates, they
had succeeded in pushing foreign produced textiles out of the market.
Equally dramatic transformations took place in other manufacturing industries.
Mexico’s first integrated steel mill (Fundidora Monterrey) was founded in 1900. Its
American-designed blast furnace, Bessemer converters, and rolling mills allowed it to
rapidly establish a domestic monopoly in the production of structural shapes, rails, and
other products. (See Table 3). In the paper industry, one giant, vertically-integrated firm
brought in high speed, Swiss-made machinery with a capacity three times that of all its
competitors combined, bought out its actual and potential rivals, and established a
national monopoly in the market for newsprint and other low value-to-bulk paper
products. In the cigarette industry, two giant firms, employing automated cigarette
rolling machines and thousands of workers, pushed out the hundreds of artisan shops that
had characterized the tobacco industry, controlling over 60 percent of the market by
1910. A sense of how quickly the industry consolidated can be seen in table 4. From
1899 to 1911, output doubled, while the number of firms fell by half. In beer brewing, a

9
domestic industry was created almost overnight, with local monopolies established in
virtually every major city by the turn of the century. These breweries forced imported
beer from the market, as can be seen in table 5. One of the industry’s leading firms (the
Cervecería Cuauhtémoc) soon spun off a glass bottle making company (Vidriera
Monterrey) that quickly established itself as a domestic glass monopoly that persisted
until the 1990s. A similar situation developed in the cement industry. Until the turn of
the century, Mexico produced no cement at all. As table 6 shows, by 1911, there were
three firms in operation with a combined capacity of 150,000 metric tons per year. In
soap and glycerin, Mexico’s hundreds of artisan producers were forced out of business by
the Compañía Industrial Jabonera de la Laguna— one of the four largest soap factories in
the world. La Laguna later turned its expertise in basic chemicals toward the
establishment of a spin-off firm, the Compañía Nacional Mexicana de Dinamita y
Explosivos, which monopolized the production and distribution of dynamite.7 A similar
process took place in shoe and boot manufacturing, where large scale factories
(particularly those of United Shoe and Leather) began to replace the artisan shops that
had dominated leather working in the 19th century.
Brazil underwent a very similar process of industrial development during the
period 1890-1914. As was the case in Mexico, the development of industry was strongly
linked to the growth of the export sector. In fact, the areas that industrialized the first and
the fastest were exactly those that were most clearly tied to the so-called export
economy— namely the coffee growing states of Sao Paulo, Rio de Janeiro, and Minas
7 Stephen Haber, Armando Razo, and Noel Maurer, The Politics of Property Rights: Political Instability, Credible Commitments, and Economic Growth in Mexico, 1876-1929 (Cambridge University Press, 2003), chapter five.
10
Gerais. As was also the case in Mexico, Brazil’s railroads, which putatively were created
in order to move exports to ports, actually played a major role in integrating markets,
thereby allowing domestic manufacturing firms to take advantage of economies of scale
in production. The end result was that Brazil industrialized at a rapid pace in the two
decades prior to World War One.
Brazil’s early industrial development was strongly weighted toward the
production of consumer non-durables. Cotton textiles, wool textiles, leather working,
hat-making, paper making, and beer brewing all grew rapidly at the turn of the century.
The available estimates indicate that on the eve of World War I, domestic production of
consumer goods accounted for 80 percent of total domestic consumption.8 This is not to
say, however, that these consumer goods industries were not soon followed by
intermediate goods producers, particularly jute sack manufacturing (an adjunct to the
coffee industry) wheat milling, and glass bottle blowing. There were also some capital
goods producers, including shipbuilding and machinery industries of modest scale.
These metal working industries required, of course, a source of pig iron and steel ingots.
Thus, beginning in the late 1880s, Brazilian foundries started to import modern blast
furnaces, so that by 1900, Brazil was already producing some 2,000 tons of pig iron per
year, which increased roughly seven-fold by 1914.9
8 Bill Albert, South America and the First World War : The Impact of the War on Brazil, Argentina, Peru, and Chile (New York: Cambridge University Press, 1988), p. 186. 9 Bill Albert, South America and the First World War : The Impact of the War on Brazil, Argentina, Peru, and Chile (New York: Cambridge University Press, 1988), p. 186. For a discussion of individual industries, see Wilson Suzigan, Indústria Brasileira: Origem e Desenvolvimento (Editora Brasiliense, 1986), pp. 108-115; Werner Baer, The Development of the Brazilian Steel Industry (Nashville, Tenn: Vanderbilt University Press, 1969); Stanley Stein, The Brazilian Cotton Manufacture: Textile Enterprise in an Underdeveloped Area, 1850-1950 (Cambridge: Harvard University Press, 1957); Nathaniel H. Leff, The Brazilian Capital Goods Industry, 1929-1964 (Cambridge, Mass., Harvard University Press, 1968); Warren Dean, The Industrialization of Sao Paulo, 1880-1945 (Austin: University of Texas Press, 1969).
11
Brazil’s largest industry, and its most intensively studied, was cotton textile
manufacturing. Circa 1890 Brazil had a miniscule textile industry, small in size even by
the standards of Mexico. By 1905, it had the largest cotton textile industry in Latin
America. Its textile industry continued to grow at a dramatic clip to 1914, when it was
roughly double the size of Mexico’s textile industry. (See table 1). Nevertheless, in both
the Mexican and the Brazilian cases, the domestic cotton textile industries had pushed
aside imported cloth, with the exception of the market for finely woven products.
Argentina underwent a similar process of industrial development during the
period 1890-1914. The expansion of the export economy and the construction of
railroads created a growing market for all manner of consumer goods. Local
entrepreneurs (many of whom began as merchants) quickly erected manufacturing plants
to satisfy that growing demand.
One of the myths of early Argentine industrialization is that, with the exception of
meat-packing, firms were of very small size, and resembled artisan shops more than
modern factories. Like most myths, this one has some basis in fact. First, there is no
doubt that Argentina had a very large and concentrated meat packing industry. Second, it
is also true that the average size of Argentine manufacturing firms circa 1913 was less
than 8 workers. (See Table 7).
The problem with this view, however, is that the average size of firms is a very
misleading measure of industrial development or of the presence of large firms in the
process of industrialization. In 1964, for example, 40 percent of Argentina’s
manufacturing workers were employed by firms of more than 200 workers. These large
12
firms accounted for only 0.6 percent of all firms, and they produced 42 percent of all
output. Obviously, large-scale firms played a major role in Argentine industry. The
average size of manufacturing firms, however, was only 7.2 workers— a lower number
than in 1913. (See Table 7). What was true in 1964 was also true at the turn of the
century. The average firm was of very small size, but that does not mean that a large
proportion of industrial production did not take place in large, mechanized, and modern
factories. As Fernando Rocchi and Yovanna Pineda have demonstrated, large scale
factories characterized the beer, glass, tobacco products, soap, chemical, footwear, match,
paper, wool textile, cotton hosiery, cement, hat, food-processing, and metal-working
industries.10 In short, Argentine manufacturing looked a lot like manufacturing in
Mexico and Brazil: industries that could not take advantage of economies of scale in
production or distribution were made up of hundreds of very small workshops; while
industries that could take advantage of economies of scale were characterized by a small
number of extremely large firms.
The Argentine beer industry provides an example of the rapid growth of large-
scale manufacturing. Rising incomes, increasing population, and market integration
during the so-called period of export-led growth produced a dramatic increase in the
demand for beer. Beer consumption grew eight-fold from 13 to 109 million liters
between 1891 and 1913. Two giant firms, Quilmes and Biekert, each producing tens of
10 Fernando Rocchi, “Building a Nation, Building a Market: Industrial Growth and the Domestic Economy in Turn-of-the-Century Argentina,” Ph. D. Dissertation, University of California, Santa Barbara, 1997), pp. 40, 86, 95, 100, 108, 109, 113, 119; Paul H. Lewis, The Crisis of Argentine Capitalism (Chapel Hill: University of North Carolina Press, 1990), pp. 298-99; Yovanna Pineda, “The Firm in Early Argentine Industrialization, 1890-1930: A Study of Fifty-Five Joint Stock Companies’ Owners, Finance Sources, Productivity, and Profits.” Ph.D. Dissertation, University of California Los Angeles, 2002.
13
millions of liters of beer annually, quickly emerged and dominated the industry. Circa
1911, these two firms accounted for 67 percent of domestic beer production.11
A similar process occurred in the cigarette industry. Cigarettes had traditionally
been rolled by hand in artisan workshops or non-mechanized factories, and were of
irregular quality. The dramatic expansion of the Argentine economy during the late
1880s and early 1890s increased the demand for cigarettes, thereby allowing firms to
adopt technologies that permitted them to capture scale economies. As early as 1889 the
first Bonsack automatic cigarette rolling machine was introduced. The spread of
mechanized technology quickly drove small firms out of business. Within a decade,
cigarette production was concentrated in a single conglomerate, the Compañía Nacional
de Tobacos, which employed 2,800 workers and had a capacity of 400,000 cigarettes per
day.12
Argentina did not develop a cotton textile industry of the size and complexity of
those found in Brazil and Mexico. With a few notable exceptions, such as the giant
Compañía Dell’Acqua (which produced 1.5 million meters of cloth per year), most cotton
factories in Argentina imported yarn which they then knit into hosiery. Argentina’s
cotton knitwear factories, however, operated on a tremendous scale. The rapid expansion
of the industry can be seen by the dramatic increase in the volume of yarn imported,
11 Fernando Rocchi, “Building a Nation, Building a Market: Industrial Growth and the Domestic Economy in Turn-of-the-Century Argentina,” Ph. D. Dissertation, University of California, Santa Barbara, 1997), pp. 40, 144, 412. 12 Fernando Rocchi, “Building a Nation, Building a Market: Industrial Growth and the Domestic Economy in Turn-of-the-Century Argentina,” (Ph. D. Dissertation, University of California, Santa Barbara, 1997), pp. 43-44, 87, 113; Yovanna Pineda, “The Firm in Early Argentine Industrialization, 1890-1930: A Study of Fifty-Five Joint Stock Companies’ Owners, Finance Sources, Productivity, and Profits” (Ph.D. Dissertation, University of California Los Angeles, 2002), pp. 46-48.

14
which grew 16-fold between 1893 and 1904, from 298,392 kilos to 4,759,000 kilos. Circa
1908, domestic production of all cotton goods was valued at 17 million pesos, 22 percent
of total consumption.13
Overall, the growth of Argentine industry during the belle époque was dramatic.
Circa 1869 Argentina had virtually no manufacturing industry to speak of. By 1895, it
had 24,114 firms employing almost 175,000 workers. By 1913, the number of firms had
doubled (to 48,779), the number of workers had grown by 135 percent (to 410,221), and
the value of total fixed capital quintupled (to 1.8 billion pesos).14 (See Table 2). By this
point, Argentine not only boasted a wide range of consumer goods industries, but also
had a number of intermediate goods manufacturers, most particularly glass, cement, and
metal working. As a consequence, Argentina manufacturers began to push foreign made
products out of the market. As table 8 shows, domestic producers accounted for 90
percent of food, beverages, and tobacco output, 75 percent of paper and cardboard, 61
percent of wood products, 55 percent of chemicals, and 45 percent of textiles and
clothing from 1900 to 1904.
Chile underwent a similar process of industrial development. As Muñoz Gomá
and Kirsch have demonstrated, by 1914 much of Chilean industry was characterized by
large-scale producers employing mechanized techniques of production.15 In fact, Chile
13 Fernando Rocchi, “Building a Nation, Building a Market: Industrial Growth and the Domestic Economy in Turn-of-the-Century Argentina,” (Ph. D. Dissertation, University of California, Santa Barbara, 1997), pp. 50, 57, 95; Yovanna Pineda, “The Firm in Early Argentine Industrialization, 1890-1930: A Study of Fifty-Five Joint Stock Companies’ Owners, Finance Sources, Productivity, and Profits” (Ph.D. Dissertation, University of California Los Angeles, 2002), p. 15. 14 Paul H. Lewis, The Crisis of Argentine Capitalism (Chapel Hill: University of North Carolina Press, 1990), p. 31. 15 Henry Kirsch, Industrial Development in a Traditional Society: The Conflict of Entrepreneurship and Modernization in Chile (Gainesville: University Press of Florida, 1977); Oscar Muñoz Gomá, Crecimiento industrial de Chile, 1914-1965 (Santiago: Universidad de Chile, 1968).
15
had a nascent capital goods industry that was tied, in particular, to the production of
railway cars. The same firm that pioneered this industry later moved on to shipbuilding
and other metal working industries. In addition, Chile had roughly the same mix of
consumer goods industries found in Argentina: beer, shoes, paper, and cigarettes. It also
produced some intermediate goods (basic chemicals, glass) and construction goods.
Indeed, it had a large and thriving cement industry.16
Latin American industry circa 1890-1914 may have been modern in the sense that
it used mechanized production technologies and in the sense that it operated on a
tremendous scale. It was not modern, however, in the sense that it could compete
effectively against producers in the United States and Great Britain. This had two
ramifications. First, it meant that, with the exception of Argentine meat packing and
wool washing, virtually none of Latin America’s manufactured goods were exported,
even to other Latin American markets. Second, it meant that virtually none of it would
have existed had it not been for tariff protection.
As Coatsworth and Williamson have shown, the larger economies of Latin
America had the highest tariffs in the world prior to the World War I. Import tariffs in
Latin America were, on average, five times higher than those of the industrialized
16 Bill Albert, South America and the First World War : The Impact of the War on Brazil, Argentina, Peru, and Chile (New York: Cambridge University Press, 1988), pp. 200-202; Henry Kirsch, Industrial Development in a Traditional Society: The Conflict of Entrepreneurship and Modernization in Chile (Gainesville: University Press of Florida, 1977); Gabriel Palma, “From an Export-led to an Import-substituting Economy: Chile 1914-39,” in Rosemary Thorp ed., An Economic History of Latin America, Volume 2, Latin America in the 1930s: the Role of the Periphery in World Crisis (London: Palgrave, 2000), pp. 44-45.
16
countries of Western Europe. They were an order of magnitude higher than those of East
Asian countries.17
In no other Latin American country have tariffs and tariff policies been as
intensively studied as in the case of Mexico. Beginning in 1891, the Mexican
government honed the tariff system with an eye toward protecting domestic
manufacturers and maximizing government revenues. On the one hand, the government
drove down the tariffs on manufactured goods that Mexico did not produce— the goal
being to reduce the costs facing the users of those goods and to increase the government’s
revenues from import taxes. On the other hand, the government drove up the tariffs on
goods produced by Mexico’s new and rapidly growing industries, the goal being to
protect firms from international competition. As table 9 shows, tariff rates on a select
group of products were extraordinarily high: 52 to 76 percent for bottled beer, 55 to 87
percent for common cloth, and 49 to 127 percent for paper, to cite but a few. Over the
course of the 1890’s the level of tariff protection declined because the tariff was specific,
not ad valorum, and the peso was depreciating against gold-backed currencies. Declines
in nominal tariffs, however, were more than mitigated by the fact that the peso was
depreciating in real terms— which provided implicit protection. Given the government’s
commitment to protecting specific industries, when Mexico switched to the gold standard
in 1905, it revised its tariff schedules upwards, so as to insure that favored industries
would continue to be protected.18
17 John H. Coatsworth and Jeffrey G. Williamson, “The Roots of Latin American Protectionism: Looking before the Great Depression,” National Bureau of Economic Research Working Paper 8999; Michael Clemens and Jeffrey G. Williamson, “Closed Jaguar, Open Dragon: Comparing Tariffs in Latin America and Asia before World War II,” National Bureau of Economic Research Working Paper 9401. 18 Edward Beatty, Institutions and Investment: The Political Basis of Industrialization in Mexico Before 1911 (Stanford University Press, 2001), chapters three and four; Sandra Kuntz Ficker, “Institutional Change and Foreign Trade in Mexico, 1870-1911,” in Jeffrey L. Bortz and Stephen Haber eds., The
17
Not only were average tariffs high, they were structured so as to provide effective
protection: duties on final manufactured goods were high while duties on the inputs to
produce those final goods were low or zero. Trade protection in steel illustrates the case
clearly. In 1909 the tariff on steel products produced by Mexico’s sole integrated steel
manufacturer, Fundidora Monterrey, was 43.7 percent. The tariff on products that
Fundidora Monterrey did not produce was roughly half that: 22.9 percent. The tariff on
the imported inputs that Fundidora Monterrey consumed was 3.4 percent.19 This was true
in the textile industry as well. The tariff on imported cloth tended to be twice that of the
tariff on imported raw cotton. The result was an effective rate of protection that varied
from 39 to 78 percent.20 As a consequence, effective rates of protection were quite high.
As table 9 shows, many of Mexico’s new industries had rates of protection in excess of
100 percent. Examples include beer, cotton cloth, paper, pig iron, and steel rails.
There was also nothing “liberal” about Argentine trade policy. Díaz Alejandro’s
estimates of the level and structure of protection from 1906 to 1940 demonstrate that
Argentine policy makers quite consciously erected protectionist barriers during the first
Mexican Economy, 1870-1930: Essays on the Economic History of Institutions, Revolution, and Growth (Stanford University Press, 2002); Edward Beatty, “Commercial Policy in Porfirian Mexico: The Structure of Protection,” in Jeffrey L. Bortz and Stephen Haber eds., The Mexican Economy, 1870-1930: Essays on the Economic History of Institutions, Revolution, and Growth (Stanford University Press, 2002); Graciela Marquez Colin, “The Political Economy of Mexican Protectionism, 1868-1911 (Ph.D. Dissertation, Harvard University, 2002); Aurora Gómez Galvarriato, "The Impact of Revolution: Business and Labor in the Mexican Textile Industry, Orizaba, Veracruz, 1900-1930" (Ph.D. Dissertation, Harvard University, 1999). 19 Aurora Gómez Galvarriato, "El desempeño de la Fundidora de Hierro y Acero de Monterrey durante el Porfiriato. Acerca de los obstáculos a la industrialización en México." In Mario Cerutti and Carlos Marichal (eds.), Historia de las grandes empresas en México, 1850-1930 (Mexico: Universidad Autónoma de Nuevo León and Fondo de Cultura Económica, 1997), p. 216. 20 Aurora Gómez Galvarriato, "The Impact of Revolution: Business and Labor in the Mexican Textile Industry, Orizaba, Veracruz, 1900-1930" (Ph.D. Dissertation, Harvard University, 1999)., p. 604.
18
decade of the twentieth century, and then maintained them over subsequent decades.21
As table 10 demonstrates, tariffs on dutiable goods average 30 percent from 1905 to
1909, and 26 percent from 1910 to 1914. Customs duties on manufactured goods ranged
between 25 and 50 percent from 1905 to 1924. Some products, such as burlap sacks,
beer, and soap enjoyed tariffs above 50 percent. Moreover, the evidence indicates a
cascading tariff structure that provided high levels of effective protection: machinery and
raw materials could be imported duty free, while final products entered under high
duties.22 The evidence is also unambiguous that there was an organized industrial lobby,
the Argentine Industrial Union (founded in 1887) that primarily represented large
manufacturers, pushed for protection, and donated funds to the campaigns of politicians
who backed protectionist policies. As a consequence, there was a protectionist coalition
in the Argentine congress that log-rolled specific tariff increases for a wide variety of
industries.23
Lederman’s work on Chile indicates that its policy-makers began to shift to
protectionism in 1897, under pressure from an organized lobbying group, the Sociedad de
Fomento Fabril (which had been founded in 1883). His research also demonstrates that
the overall pattern for Chile was for increased protection for domestic industries from
about 1910 to 1950. Indeed, by the early 1920s Chile’s manufacturers were no longer
21 Carlos F. Díaz Alejandro, Essays on the Economic History of the Argentine Republic (New Haven: Yale University Press, 1970), chap. 5. 22 Yovanna Pineda, “The Firm in Early Argentine Industrialization, 1890-1930: A Study of Fifty-Five Joint Stock Companies’ Owners, Finance Sources, Productivity, and Profits” (Ph.D. Dissertation, University of California Los Angeles, 2002), p. 20. 23 Fernando Rocchi, “Building a Nation, Building a Market: Industrial Growth and the Domestic Economy in Turn-of-the-Century Argentina,” (Ph. D. Dissertation, University of California, Santa Barbara, 1997), pp. 54, 72, 100, 140, 330, 336, 337, 404; Yovanna Pineda, “The Firm in Early Argentine Industrialization, 1890-1930: A Study of Fifty-Five Joint Stock Companies’ Owners, Finance Sources, Productivity, and Profits” (Ph.D. Dissertation, University of California Los Angeles, 2002), p. 108.
19
just demanding (and obtaining) protective tariffs, they actively lobbied for government
subsidies to establish a range of new industries.24
The history of Brazilian trade protection conforms to the pattern in Mexico,
Argentina, and Chile. Manufacturers lobbied for tariff protection on an industry-by-
industry basis, and congress granted them tariffs sufficiently high to drive foreign goods
from the market. One industry that has been studied in considerable detail is cotton
textiles. Beginning in the late 1880s, the government began to push up the tariff on
finished cotton cloth, at that same time that it reduced tariffs on raw materials and
eliminated the tariffs on cotton textile machinery. In other words, it introduced a
cascading tariff structure that allowed for effective protection. As occurred in Mexico,
inflation in the 1890s eroded the tariff (tariffs were specific, not ad valorum), but the real
depreciation of the exchange rate compensated for the reduction in the tariff. Between
1898 and 1905 the depreciation of the real exchange rate was reversed— the milreis
appreciated. As a result, the government increased nominal tariffs. Calculated as ad
valorum equivalents, Brazilian textile tariffs increased from 22.4 percent in 1895 to 49.7
percent in 1906.25
The evidence about Brazil’s industrial tariffs, generally speaking, conforms to
what we know about cotton textiles. If we employ the simple metric of dividing import
duties by the value of imports— a procedure that underestimates protection, because
capital goods and raw materials tended to enter the country duty free— the average tariff
rate was 28 percent in 1898, 39 percent in 1901, and 53 percent in 1906. As a
24 Daniel Lederman, The Political Economy of Protection: Theory and the Chilean Experience (Stanford: Stanford University Press, 2005). 25 Wilson Suzigan, Indústria Brasileira: Origem e Desenvolvimento (Editora Brasiliense, 1986), pp. 143-45.

20
consequence, in 1914 a U.S. Department of Commerce agent concluded that Brazil had
the highest tariffs of any country in the Western Hemisphere.26
Industrial development requires, of course, more than protective tariffs. It also
requires the ability to develop or adapt technology, and it requires the ability to mobilize
capital in order to purchase the capital goods that are the embodiment of that technology.
That is, unless there is a financial system that connects those who have liquid wealth with
those who can employ it in productive investments, the growth of industry can be no
faster than that permitted by the reinvestment of profits.
A detailed discussion of the political economy of financial system development
across Latin America would take us well beyond the space and thematic constraints of
this paper. We can offer nothing more than a brief summary of a rapidly growing
literature. In broad strokes, there are five major requirements for an efficient financial
system: sound public finances; a stable currency; a banking system; a central bank; and
well developed securities markets. Some Latin American countries, at some points in
time, managed to have some of these features. For example, Mexico in the late
nineteenth century had a stable currency, a private banking system, and sound public
finances, but it had miniscule securities markets and it lacked a central bank.27 Similarly,
26 Steven Topik, The Political Economy of the Brazilian State, 1889-1930 (Austin: University of Texas Press, 1987), pp. 141, 145. 27 Noel Maurer, "Banking Regulation and Banking Performance in Porfirian Mexico." In Jeffrey L. Bortz and Stephen H. Haber (eds.), The Mexican Economy, 1870-1930: Essays on the Economic History of Institutions, Revolution, and Growth. Stanford, CA: Stanford University Press, 2002); Noel Maurer, The Power and the Money: The Mexican Financial System, 1876-1928. Stanford, CA: Stanford University Press, 2002); Noel Maurer, "Banks and Entrepreneurs in Porfirian Mexico: Inside Exploitation or Sound Business Strategy?" Journal of Latin American Studies, 31 (1999), pp. 331-361; Noel Maurer and Stephen Haber, "Institutional Change and Economic Growth: Banks, Financial Markets, and Mexican Industrialization," In Jeffrey L. Bortz and Stephen H. Haber (eds.), The Mexican Economy, 1870-1930: Essays on the Economic History of Institutions, Revolution, and Growth (Stanford, CA: Stanford University Press, 2002); Stephen Haber, “Banks, Financial Markets, and Industrial Development: Lessons from the Economic Histories of Brazil and Mexico,” in José Antonio Gonzalez, Vittorio Corbo, Anne O. Krueger, and Aaron Tornell eds., Macroeconomic Reform in Latin America: The Second Stage (University

21
during the period 1890-1914, Brazil had well-developed securities markets, but it did not
have any of the other requisites of an efficient financial system. This allowed a boom in
industrial development financed by the sale of securities, but this system broke down in
the long run because the lack of sound public finances produced an inflationary spiral that
undermined the stock and bond markets.28 Argentina, for its part, had virtually none of
the requisites of a sound financial system. Rather, in the years prior to 1914 it essentially
free rode on the British financial system.29 On the whole, Latin American countries
tended to be under-banked and tended to have very underdeveloped securities markets.
Manufacturers therefore tended to be liquidity constrained, which had negative effects on
the extensive growth of industry, the adoption of new technologies, and, hence, on
productivity growth.
This is not to say that industrial firms could never call on domestic securities
markets or banks to finance investment. The large, mechanized firms that dominated
product markets in most countries tended to be able to obtain working capital from banks
of Chicago Press, 2003); Carlos Marichal, "El nacimiento de la banca mexicana en el contexto latinoamericano: problemas de periodización" in Leonor Ludlow and Carlos Marichal (eds.), La banca en México, 1820-1920 (México: Instituto Mora El Colegio de Michoacán El Colegio de México Instituto de Investigaciones Históricas-UNAM, 1998). 28 Anne Hanley, Capital Markets in the Coffee Economy: Financial Institutions and Economic Change in Sao Paulo, Brazil, 1850-1905 (Ph.D. Dissertation, Stanford University, 1995); Gail Triner, Banking and Economic Development : Brazil, 1889-1930 (New York: Palgrave, 2000); Stephen Haber, “Banks, Financial Markets, and Industrial Development: Lessons from the Economic Histories of Brazil and Mexico,” in José Antonio Gonzalez, Vittorio Corbo, Anne O.Krueger, and Aaron Tornell eds., Macroeconomic Reform in Latin America: The Second Stage (University of Chicago Press, 2003).
29 Lance E. Davis and Robert E. Gallman, Evolving Financial Markets and International Capital Flows: Britain, the Americas, and Australia, 1865-1914 (Cambridge: Cambridge University Press, 2001), chapter six; Andrés Regalsky, “Banking, Trade, and the Rise of Capitalism in Argentina, 1850-1930,” in Alice Teichova, Ginette Kurgan-Van Hentenryk, and Dieter Ziegler eds., Banking, Trade, and Industry, Europe, America, and Asia from the Thirteenth to the Twentieth Century (Cambridge: Cambridge University Press, 1997).

22
to which they were connected by overlapping boards of directors.30 Some of them were
also able to mobilize long-term investment capital by selling equity or bonded debt on
organized exchanges. This was particularly the case in Brazil during the period 1890-
1914, when the securities markets flourished.31 It is to say, however, that as a general rule
there was differential access to capital: only a limited number of entrepreneurs,
particularly those who were well-known merchant-financiers, were able to make use of
the financial system to mobilize capital, while everyone else was starved for funds.
Differential access to capital explains, in large part, the tendency of Latin American
industry toward high levels of concentration, even in industries that were characterized
by modest returns to scale technologies: capital market imperfections essentially
operated as a barrier to entry.32
Nevertheless, by 1913-14 the largest countries in the region had already built
substantial industrial sectors. Though the estimates are rough, the available estimates
30 Noel Maurer and Stephen Haber, "Institutional Change and Economic Growth: Banks, Financial Markets, and Mexican Industrialization," In Jeffrey L. Bortz and Stephen H. Haber (eds.), The Mexican Economy, 1870-1930: Essays on the Economic History of Institutions, Revolution, and Growth (Stanford, CA: Stanford University Press, 2002); Yovanna Pineda, “The Firm in Early Argentine Industrialization, 1890-1930: A Study of Fifty-Five Joint Stock Companies’ Owners, Finance Sources, Productivity, and Profits” (Ph.D. Dissertation, University of California Los Angeles, 2002), chaps. 2, 3. 31 Stephen Haber, "The Efficiency Consequences of Institutional Change: Financial Market Regulation and Industrial Productivity Growth in Brazil, 1866-1934." In John H. Coatsworth and Alan M. Taylor eds., Latin America and the World Economy Since 1800 (Harvard University David Rockefeller Center for Latin American Studies/Harvard University Press, 1998), pp. 275-322; Raghuram G. Rajan and Luigi Zingales, “The Great Reversals: The Politics of Financial Development in the Twentieth Century.” Journal of Financial Economics, forthcoming; Aldo Musacchio, “Ordem (na corte) e Progresso: O Poder Judiciário e o mercado financeiro na transformação econômica republicana” Acervo: Revista do Arquivo Nacional, Rio de Janeiro, November 2002.
32 Stephen Haber, “Banks, Financial Markets, and Industrial Development: Lessons from the Economic Histories of Brazil and Mexico,” in José Antonio Gonzalez, Vittorio Corbo, Anne O.Krueger, and Aaron Tornell eds., Macroeconomic Reform in Latin America: The Second Stage (University of Chicago Press, 2003). Yovanna Pineda, “The Firm in Early Argentine Industrialization, 1890-1930: A Study of Fifty-Five Joint Stock Companies’ Owners, Finance Sources, Productivity, and Profits” (Ph.D. Dissertation, University of California Los Angeles, 2002), chap. 3.
23
indicate that manufacturing accounted for 19.4 percent of total value added in Brazil,
16.6 percent in Argentina, 14.5 percent in Chile, and 12.3 percent in Mexico.33
From World War One to the Great Depression
The interruption of international capital and product markets with the onset of
World War I did not produce a major disruption in Latin America’s industrial
development. On the one hand, Latin American industry was helped by the fact that the
European economies had turned to war production. Thus, even those industries that
lacked the political clout to obtain tariff protection during the 1890-1914 period now
obtained implicit protection as foreign produced consumer goods disappeared from the
market. On the other hand, Latin American industry was hurt by the war in two senses.
First, Latin American economic growth prior to 1914 had been financed in large part by
foreign capital inflows— particularly from Great Britain. These flows dried up in 1914,
and with their disappearance came the stalling of the overall process of growth. Second,
Latin American industry tended to import most of its capital and intermediate goods from
the advanced industrial economies of the North Atlantic. With the war, these inputs
became extremely difficult to obtain. To a degree, domestic producers moved into the
production of some of these goods. Until the United States entered the war, some inputs
could also be obtained there. Nevertheless, spare parts for machines (as well as new
machinery), coal, and chemicals (used for tanning, explosive manufacturing, and textile
dyeing and finishing) were all hard to come by. The end result was that Latin American
industry continued to grow, but at a modest pace until the war’s end.
33 Brazilian data from Bill Albert, South America and the First World War : The Impact of the War on Brazil, Argentina, Peru, and Chile (New York: Cambridge University Press, 1988), p. 185. Data for other countries from Victor Bulmer-Thomas, The Economic History of Latin America Since Independence (Cambridge: Cambridge University Press, 1994), p. 137.

24
The slowdown in industrial development during 1914-1918 can be clearly seen in
the Brazilian case, where we have excellent serial data. Table 1 presents data on the size
of Brazil’s cotton textile industry. From 1907 to 1914, the textile industry, measured in
spindlage, doubled in size. From 1914 to 1921 the industry grew not at all. It then
resumed growing after 1921, roughly increasing in size by fifty percent by the end of the
decade. A skeptical reader might argue that this pattern is peculiar to the cotton textile
industry. That argument does not stand up, however, to data assembled by Wilson
Suzigan on the real value of machinery imports to Brazil. Note that the data set measures
flows, not stocks. Also note that Brazil produced virtually no industrial machinery during
the period in question: virtually everything was imported from the United States, the
United Kingdom, France, and Germany. The data set, presented in Table 11, is thus an
excellent estimator of new spending on capital equipment by manufacturing firms. The
data are unambiguous: the war produced a dramatic contraction in new investment. In
1914, total machinery imports were only 41 percent of their 1913 level. From 1915 to
1918, machinery imports oscillated between 12 and 17 percent of their 1913 levels.
An even more skeptical reader might argue that the contraction in new spending
on capital equipment does not mean that Brazilian industry did not earn windfall profits
during the war— profits that could be reinvested later, once it was possible to import
capital equipment. In table 12, I test this hypothesis directly by presenting estimates of
the profitability of Brazilian cotton textile manufacturing. I present four different
measures of profits, each one capturing different concepts of what profits are and who
receives them: the nominal rate of return on owner’s equity; the real rate of return on
owner’s equity; the real market rate of return to stockholders; and the real market rate of
25
return to stock and bondholders.34 The sampling technique employed was to gather
observations on all cotton textile firms listed on the Sao Paulo and Rio de Janeiro stock
markets, and to then construct a Divisia (shifting weight) Index. The smallest number of
firms in any year was 30. The largest number of firms was 66.
The results are clear: there were no windfall profits during the war. The real rate
of return on owner’s equity fell during 1914-1918 to an annual average of 4.3 percent,
compared to 4.9 percent for the period 1900-1913. The decline in market rates of return
was even more severe: real financial returns to stockholders fell from 7.2 percent to
negative 5.2 percent. A stockholder who bought a portfolio of cotton textile stocks at the
end of 1914, reinvested all dividends, and rebalanced his portfolio every year, would
have lost 25 percent of his investment by the end of 1918. An investor who took the
more conservative approach of buying a weighted portfolio of textile stocks and bonds,
who reinvested all dividends, and who rebalanced his portfolio every year would have
done somewhat better, but he would still have lost money. The real financial returns to
such an investor would have been negative 1.7 percent per year from 1914 to 1918,
compared to 10.3 percent from 1900 to 1913.
34 The first two measures (the nominal and real rate of return on owner’s equity) treat profits as the book value of income owned by shareholders divided by the book value of capital owned by shareholders. Income is calculated as dividends plus directors fees plus changes in reserve accounts. Capital is measured as the value of reserve accounts plus the par value of outstanding shares. The only difference in the two measures is that the first is unadjusted for inflation, while the second adjusts both income and changes to the value of reserve accounts in the owner’s equity calculation, for inflation. The second two measures (real financial returns to stockholders, and real financial returns to stock and bondholders) treat profits as the market value of financial returns to stockholders or to stock and bondholders divided by the market value of those investments. Both are adjusted for inflation. In calculating financial profits to shareholders, income is measured as changes in the real market value of stock plus real dividends, and capital is measured as the real market value of stock. In calculating financial profits to stock and bondholders, we assume that investors hold a portfolio of stocks and bonds (weighted by their market capitalization).
26
The available evidence indicates that Argentina had an experience similar to that
of Brazil. Barbero and Rocchi’s estimates indicate that industrial output stagnated from
1914 to 1918. The lack of imported raw materials and intermediate goods strangled most
Argentine manufacturing firms. Only those firms that had sufficient capacity, and that
employed domestic raw materials— such as the wool textile industry— benefited from the
war.35 Not surprisingly, urban unemployment increased from 6.7 percent in 1913, to 13.7
percent in 1914, and to 19.4 percent in 1917.36 We also know that there was a sharp
increase in the number of business failures.37
We do not, as yet, have the kinds of systematic data sets for Chile that we do for
Argentina and Brazil. Nevertheless, Bill Albert’s careful (and critical) evaluation of the
secondary literatures indicates that Chile’s experience were not dissimilar from those of
its neighbors. Industrial output, investment, and employment fell during the early years
of the war, and then slowly recovered its 1913 levels.38
One implication that emerges from the evidence about Brazil, Argentina, and
Chile is that Mexico did not forego an opportunity for rapid industrial expansion because
of the Mexican Revolution of 1910-20. The detailed analysis of the Mexican case by
Haber, Razo, and Maurer clearly indicates that industrial output and investment
35 María Inés Barbero and Fernando Rocchi, “Industry,” in Gerardo della Paolera and Alan M. Taylor, A New Economic History of Argentina (Cambridge: Cambridge University Press, 2003), pp. 261, 265. 36 Yovanna Pineda, “The Firm in Early Argentine Industrialization, 1890-1930: A Study of Fifty-Five Joint Stock Companies’ Owners, Finance Sources, Productivity, and Profits” (Ph.D. Dissertation, University of California Los Angeles, 2002), p. 39. 37 Paul H. Lewis, The Crisis of Argentine Capitalism (Chapel Hill: University of North Carolina Press, 1990), p. 35. 38 Bill Albert, South America and the First World War : The Impact of the War on Brazil, Argentina, Peru, and Chile (New York: Cambridge University Press, 1988), pp. 202-210.
27
contracted sharply in Mexico during the years of civil war (1913-1917).39 Their analysis
also indicates little in the way of the destruction of physical plant, as well as a swift
recovery of output and investment as soon as the civil war ended. In fact, data on the
importation of industrial machinery to Mexico (Table 13) demonstrate more or less the
same pattern as do the data on Brazil (Table 11): a severe contraction in 1914-1917,
followed by a dramatic recovery. The implication is that even had there been no
revolution to interrupt factor and product markets, Mexican output and investment would
have been depressed because of the shortage of raw materials, machines, and spare parts.
With the end of hostilities in 1918, the same process that had permitted the
expansion of industry prior to 1914 began anew. Great Britain was no longer the
dominant consumer of Latin American export goods, the dominant source of foreign
capital flows, and the dominant source of machinery and equipment. The United States
had taken over all of those roles. From the point of view of industrial development,
however, this change made little difference: foreign investment and foreign markets
drove an overall growth process, one of whose outcomes was the rapid expansion of
domestic manufacturing industry.
Brazil provides a relevant (and intensively studied) case in point. As table 1
indicates, its cotton textile industry, whose growth had stalled from 1914 to 1921, grew
by 66 percent from 1921 to 1927. By this point, with 2.7 million spindles in operation, it
dwarfed the cotton textile industry of any other Latin American country. New
manufacturing investment was not just confined to cotton textiles. As table 11 indicates,
39 Stephen Haber, Armando Razo, and Noel Maurer, The Politics of Property Rights: Political Instability, Credible Commitments, and Economic Growth in Mexico, 1876-1929 (Cambridge University Press, 2003), chapter five.
28
roughly 75 percent of new machinery imports during the 1920s were in industries other
than textiles. Moreover, during the 1920s the average annual flow of industrial machine
imports was 44 percent higher than it had been from 1900 to 1913. Output increased
with the growth of new investment. The available estimates indicate that between 1920
and 1928, total industrial output grew anywhere from 28 percent (the Villela-Suzigan
estimates) to 57 percent (the Haddad estimates).40
The increase in investment and output was, in part, the consequence of
investments in established lines of manufacturing, such as textiles, beverages, hats, and
footwear. The growth of investment and production, however, went far beyond
established industries, and even included the production of some intermediate and capital
goods. These new industries included chemicals, iron and steel, gas appliances, cement,
electrical hardware, rayon textiles, tobacco products, tires, and machinery of various
types, including electric motors, sugar processing equipment, and textile spinning and
weaving machines.41 Many of the machinery manufacturers had started out as repair
shops, and had moved into machine fabrication during and after World War One. Some
of them, however, were subsidiaries of U.S. and European firms that were now beginning
to open factories abroad. These included General Electric, RCA, IBM, Ericsson, Philips,
40 Flavio Rabelo Versiani, “Before the Depression: Brazilian Industry in the 1920s,” in Rosemary Thorp ed., An Economic History of Latin America, Volume 2, Latin America in the 1930s: the Role of the Periphery in World Crisis (London: Palgrave, 2000), p. 145. 41 Flavio Rabelo Versiani, “Before the Depression: Brazilian Industry in the 1920s,” in Rosemary Thorp ed., An Economic History of Latin America, Volume 2, Latin America in the 1930s: the Role of the Periphery in World Crisis (London: Palgrave, 2000), pp. 145-47, 155.
29
and Standard Electric. In addition, during the 1920s, foreign companies— particularly
Ford and General Motors— erected automobile assembly plants in Brazil.42
The 1920s, in particular, saw the expansion of the Brazilian steel industry, with
the entry of the first modern firms into production. As table 14 demonstrates, circa 1920,
Brazilian producers had already pushed foreign-made pig iron out of the market. By the
end of the 1920s, they had driven foreign-made steel ingots out as well, and had begun to
compete with foreign made rolled steel products. By 1940, they had captured one-third
even of this fast-growing market.
Mexico’s experience during the 1920s was similar to that of Brazil. Firm and
industry level data from the cotton textile, beer, steel, cement, cigarette, and dynamite
industries all point in the same direction: there was substantial new investment in plant
and equipment from 1918 through the late 1920s.43 Data on the export of industrial
machinery from the United States and Great Britain to Mexico provide independent
verification of the data from individual industries. As table 13 indicates, during the
1920s industrial machinery exports to Mexico were anywhere from twice (in the case of
textile machines) to six times (manufacturing machines other than textiles) what they had
been during the period 1900-1910. In part, the growth of investment took place in
domestic firms that had been established before 1910. In part, there was also the
founding of new firms that manufactured products that previously had been imported,
such as cotton knitwear and rayon cloth. Finally, the growth of investment also included
42 Flavio Rabelo Versiani, “Before the Depression: Brazilian Industry in the 1920s,” in Rosemary Thorp ed., An Economic History of Latin America, Volume 2, Latin America in the 1930s: the Role of the Periphery in World Crisis (London: Palgrave, 2000), p. 156. 43 Stephen Haber, Armando Razo, and Noel Maurer, The Politics of Property Rights: Political Instability, Credible Commitments, and Economic Growth in Mexico, 1876-1929 (Cambridge University Press, 2003), chapter five.
30
the establishment of subsidiaries of foreign corporations. These included the British-
American Tobacco Company, the International Match Company, the Dupont de Nemours
Company, the Palmolive Company, and the Ford Motor Company.44
As investment climbed, so did output. The data sets put together by Haber, Razo,
and Maurer on the steel, cement, cigarette, beer, cotton textile, and dynamite industries
all point in the same direction: sustained and dramatic growth from 1918 through the
1920s. In all six industries, national firms satisfied all of Mexican demand, pushing
imports out of the market. Data on small scale manufacturing, such as hats, shoes and
boots, and the confection of clothing, cannot be retrieved directly. Data is available,
however, on one of the most important inputs into all of these industries: electric power
consumption in Mexico City for commercial purposes. To the degree that this proxies
output in small scale industries (the data exclude power generated for the water, tramway,
or public lighting systems), the evidence is unambiguous: as table 16 demonstrates,
power consumption increased by 60 percent from 1910 to 1920, and then doubled from
1920 to 1927.45
Data on Chilean industrial investment and production tell much the same story.
Palma’s estimates of Chilean manufacturing output not only indicate that production
increased during the 1920’s, but that Chilean industrialists were diversifying beyond the
production of consumer non-durables. Total manufacturing output grew 24 percent
44 Stephen Haber, Armando Razo, and Noel Maurer, The Politics of Property Rights: Political Instability, Credible Commitments, and Economic Growth in Mexico, 1876-1929 (Cambridge University Press, 2003), chapter five. 45 Stephen Haber, Armando Razo, and Noel Maurer, The Politics of Property Rights: Political Instability, Credible Commitments, and Economic Growth in Mexico, 1876-1929 (Cambridge University Press, 2003), chapter five.
31
between 1918 and 1925. Even more striking, the share of consumer durable,
intermediate, and capital goods in total output increased from 18 percent to 24 percent.
The rate of growth of total manufacturing output slowed during the latter half of the
1920s, but the diversification into more complex goods continued. By 1929, 29 percent
of Chilean industrial production was made up of consumer durables, intermediate, and
capital goods. The two fastest growing industries were chemicals (whose output nearly
doubled from 1918 to 1929) and metal machinery and transport equipment (whose output
nearly tripled during the same period).46
Argentina’s experience parallels that of Chile. Argentine industry continued to
expand in the 1920s, but at a slower pace than it had prior to 1914. At the same time,
industrial production began to shift away from beverages and foodstuffs, and toward
chemicals, metal products, and textiles. Circa 1914, chemicals and oils accounted for
only 3 percent of output. By 1935, they were ten percent. Over the same period, metals
and machinery jumped from 5 percent of industrial output to 14 percent, while textiles
grew from 11 percent to 21 percent.47 As a consequence, by 1929 Argentine
manufacturers had largely pushed foreign produced paper, chemicals, textiles, and other
products out of the market. They had even made inroads in the production of machinery
and metal working. (See table 8).
46 Gabriel Palma, “From an Export-led to an Import-substituting Economy: Chile 1914-39,” in Rosemary Thorp ed., An Economic History of Latin America, Volume 2, Latin America in the 1930s: the Role of the Periphery in World Crisis (London: Palgrave, 2000), pp. 51-53. 47 María Inés Barbero and Fernando Rocchi, “Industry,” in Gerardo della Paolera and Alan M. Taylor, A New Economic History of Argentina (Cambridge: Cambridge University Press, 2003), pp. 272-73.
32
Industrial Development During the Great Depression
The growth of manufacturing industry after 1930 was, therefore, a broadening and
elaboration of a process that had been going on for quite some time. Moreover, just as
was the case during the 1890-1930 period, the post-1930 period was also characterized by
ad hoc policy responses to changes in the economic environment. Politicians,
businessmen, and organized labor responded to events as they were overtaken by them.
The result was tariff protection, multiple exchange rate systems, quantitative restrictions
on imports, government-owned industrial development banks, parastate enterprises, and a
style of industrial development that was decidedly inward-looking, technologically
backward, and inefficient. It should be kept in mind, however, that these were the ex-
post outcomes of an ad hoc process, rather than the result of carefully thought-out plans
or “growth strategies.”
The Great Depression hit Latin America hard and early. Well before Wall
Street’s Black Friday, the prices of most Latin American exports had been steadily
falling. With the contraction of the U.S. and European economies during 1930-32, export
prices, as well as export volumes, went into free fall. The result was a dramatic
contraction of Latin American export earnings. In Mexico, to cite a relevant example,
total export earnings in 1932 were only one-third their 1928 level.48 Chile, to cite another
example, was even harder hit: its export earnings in 1932 were only one-sixth their 1929
level.49
48 Stephen Haber, Industry and Underdevelopment: The Industrialization of Mexico, 1890-1940 (Stanford: Stanford University Press, 1989), p. 153. 49 Gabriel Palma, “From an Export-led to an Import-substituting Economy: Chile 1914-39,” in Rosemary Thorp ed., An Economic History of Latin America, Volume 2, Latin America in the 1930s: the Role of the Periphery in World Crisis (London: Palgrave, 2000), p. 55.
33
In the short run, the collapse in exports caused a dramatic contraction of the
manufacturing sector. Consider, for example, the case of Mexico. Cárdenas’ estimates of
total industrial output indicate a decline of 31 percent from 1929 to 1932.50 Data from
individual industries provides independent confirmation of these aggregate estimates:
steel output fell by 67 percent, beer by 41 percent, cotton textiles by 22 percent, cement
by 13 percent, and cigarettes by eight percent. In industries where there had been
substantial investment in new plant and equipment in the 1920s the results were
catastrophic. In the cigarette industry, for example, the leading firm (a subsidiary of the
British American Tobacco Company) was able to operate at only 37 percent of capacity.
The cement industry (where capacity had close to doubled in the late 1920s) was even
more hard hit: it operated at only 34 percent of capacity in 1932.51 As sales collapsed, so
too did the financial statements and share prices of manufacturing firms. Estimates by
Haber of real financial returns indicates that an investor who purchased a portfolio of
common stock in Mexico’s largest, publicly traded manufacturing companies would have
sustained a loss of 7.8 percent per year from 1926 to 1932.52
The experiences of other Latin American countries mirror that of Mexico. From
1929 to 1932 total manufacturing output fell by 22 percent in Chile and by seven percent
50 Enrique Cárdenas, “The Process of Accelerated Industrialization in Mexico, 1929-1982,” in Enrique Cárdenas, José Antonio Ocampo, and Rosemary Thorp eds., An Economic History of Twentieth Century Latin America, Volume III: Industrialization and the State in Latin America, The Postwar Years (London: Palgrave, 2000), p. 179). 51 Stephen Haber, Industry and Underdevelopment: The Industrialization of Mexico, 1890-1940 (Stanford: Stanford University Press, 1989), pp. 158, 163, 165. 52 Stephen Haber, Industry and Underdevelopment: The Industrialization of Mexico, 1890-1940 (Stanford: Stanford University Press, 1989), p. 169.
34
in Brazil.53 The latter figure is almost certainly a gross underestimate.54 Much as
happened in Mexico, the profitability of manufacturing firms fell sharply. Our index of
real rates of return on owner’s equity in the Brazilian cotton textile industry indicates that
firms, on average, lost money in 1929 and 1930, and barely managed to turn a profit in
1931. (See table 12).
In the medium term, however, the depression created conditions that were
favorable to industrial development. The response of governments around the world
during the depression was to abandon the gold standard. In the context of a dramatic
decline in Latin American exports, the resulting system of freely floating exchange rates
produced dramatic currency devaluations. These devaluations did not produce
concomitant jumps in domestic inflation. The result was that virtually every Latin
American country saw its currency devalued in real terms during the 1930s.
53 Flavio Rabelo Versiani, “Before the Depression: Brazilian Industry in the 1920s,” in Rosemary Thorp ed., An Economic History of Latin America, Volume 2, Latin America in the 1930s: the Role of the Periphery in World Crisis (London: Palgrave, 2000), p. 159; Gabriel Palma, “From an Export-led to an Import-substituting Economy: Chile 1914-39,” in Rosemary Thorp ed., An Economic History of Latin America, Volume 2, Latin America in the 1930s: the Role of the Periphery in World Crisis (London: Palgrave, 2000), p. 60. 54 Data from individual manufacturing industries indicates that the seven percent decline is a gross underestimate. Output fell by 23 percent in beverages, 24 percent in shoes and boots, 58 percent in hats, and 29 percent in furniture. (Flavio Rabelo Versiani, “Before the Depression: Brazilian Industry in the 1920s,” in Rosemary Thorp ed., An Economic History of Latin America, Volume 2, Latin America in the 1930s: the Role of the Periphery in World Crisis (London: Palgrave, 2000), p. 159). The reason for the discrepancy between individual industries and the aggregate series likely resides in the fact that the latter are strongly influenced by cotton textiles (the largest industry in Brazil). As I have shown elsewhere, the standard IBGE series on textile output seriously understate the dimensions of the downturn in that industry. The reason is that the textile “output” series are, in fact, series on textile sales. Sales actually fell less far than output, because manufacturers applied steep discounts in order to move unsold textiles, which had been accumulating since the late 1920s, out of their warehouses. Textile output did, in fact, decline dramatically— by some 39 percent from 1927 to 1930— but this decline is not picked up in the standard series. See Stephen Haber, "Business Enterprise and the Great Depression in Brazil: A Study of Profits and Losses in Textile Manufacturing," Business History Review 66 (Summer 1992), pp. 335-363.
35
The result was the rapid growth in manufacturing output. Output growth was not
only high compared to the rest of the world (in the U.S. and Canada, industrial growth
was near zero during the 1930s), but was also high compared to the rate of growth of
Latin America’s other economic sectors.55 In Brazil, for example, manufacturing output
increased by 82 percent from 1928 to 1939. Solis’ estimates for Mexico indicate that total
manufacturing output in 1939 was roughly double that in 1925, with most of the growth
coming after 1934.56 The story was much the same in Chile: total manufacturing output
grew by 30 percent from 1929 to 1939, at the same time that GDP growth was flat for the
economy in general.57 Argentine data tell much the same story. Total manufacturing
output grew by 3.4 percent per year from 1925-29 to 1937-39.58 The result was that by
1939 manufacturing accounted for 16.5 percent of Latin America’s total GDP.59
In some industries, particularly those associated with construction or metal-
working, output growth during the 1930s was staggering. In the cement industry, for
example, between the late 1920s and the late 1930s cement production grew more than
55 Carlos F. Díaz Alejandro, “Latin America in the 1930s,” in Rosemary Thorp ed., An Economic History of Latin America, Volume 2, Latin America in the 1930s: the Role of the Periphery in World Crisis (London: Palgrave, 2000), p. 34. 56 E.V.K. Fitzgerald, “Restructuring through the Depression: The State and Capital Accumulation in Mexico, 1925-1940,” in Rosemary Thorp ed., An Economic History of Latin America, Volume 2, Latin America in the 1930s: the Role of the Periphery in World Crisis (London: Palgrave, 2000), p. 241. 57 Gabriel Palma, “From an Export-led to an Import-substituting Economy: Chile 1914-39,” in Rosemary Thorp ed., An Economic History of Latin America, Volume 2, Latin America in the 1930s: the Role of the Periphery in World Crisis (London: Palgrave, 2000), p. 60. 58 Carlos Díaz Alejandro, Essays on the Economic History of the Argentine Republic (New Haven: Yale University Press, 1970), p. 220. 59 Enrique Cárdenas, José Antonio Ocampo, and Rosemary Thorp, “Introduction,” in Enrique Cárdenas, José Antonio Ocampo, and Rosemary Thorp eds., An Economic History of Twentieth Century Latin America, Volume III: Industrialization and the State in Latin America, The Postwar Years (London: Palgrave, 2000), p. 17.
36
14-fold in Colombia, six-fold in Brazil, four-fold in Argentina, and two-fold in Mexico.60
The result was that by the end of the 1930s, domestic cement production pushed imported
cement completely out of the market. A similar process occurred in the Brazilian steel
industry, where, from 1929 to 1939, the output of steel ingots increased more than four –
fold (to 114 thousand tons) and the output of rolled steel products increased three-fold (to
101 thousand tons).61 (See table 14). Thus, even before the founding of the much-
vaunted Volta Redonda works in the 1940s, Brazil was already the largest steel producer
in Latin America, dwarfing even Mexico’s well established industry by a factor of
three.62 It had also pushed foreign produced steel ingots from the market, and had
captured 31percent of the domestic market for rolled shapes.63
Much of the increase in output during the 1930s was accomplished by running
capacity that had been installed in earlier decades on an intensive basis.64 Suzigan’s
estimates of the importation of manufacturing machinery to Brazil, for example, indicate
that flows of new machinery were 11 percent lower in real terms during the ten year
period 1930-39 than they had been during 1920-29, and were no higher than they had
60 Carlos F. Díaz Alejandro, “Latin America in the 1930s,” in Rosemary Thorp ed., An Economic History of Latin America, Volume 2, Latin America in the 1930s: the Role of the Periphery in World Crisis (London: Palgrave, 2000), p. 35; Stephen Haber, Industry and Underdevelopment: The Industrialization of Mexico, 1890-1940 (Stanford: Stanford University Press, 1989), p. 169. 61 Werner Baer, The Development of the Brazilian Steel Industry (Nashville, Tenn: Vanderbilt University Press, 1969), p. 61. 62 Mexico data from Stephen Haber, Industry and Underdevelopment: The Industrialization of Mexico, 1890-1940 (Stanford: Stanford University Press, 1989), p. 177. 63 Werner Baer, The Development of the Brazilian Steel Industry (Nashville, Tenn: Vanderbilt University Press, 1969), p. 61. 64Carlos F. Díaz Alejandro, “Latin America in the 1930s,” in Rosemary Thorp ed., An Economic History of Latin America, Volume 2, Latin America in the 1930s: the Role of the Periphery in World Crisis (London: Palgrave, 2000), p. 36.
37
been during the ten years prior to World War One. (See table 11). In the steel industry,
which witnessed impressive output growth in the 1930s, virtually all of the output in
1939 was produced by firms that had been founded during the 1920s.65 Data from
Mexico indicate much the same pattern. The flow of new manufacturing machinery
during 1930-35 was roughly half of what it had been from 1920 to 1929. Even in 1935,
when the output recovery was in full swing, the flow of new manufacturing machinery
was only a fifth of what it had been during the latter part of the 1920s (see table 13). The
data on Argentina's industrial plant yield similar results. In 1935, 78 percent of industrial
output was produced by firms that had been founded before 1930.66 Similar data for
1946 indicate that there was not a tremendous amount of investment in the period after
1935. As late as 1946, 61 percent of industrial output was produced by firms that had
been founded before 1930. (See table 17). In some industries, firms that pre-dated the
1930s accounted for the vast majority of total production in the late 1940s. As table 18
demonstrates, firms founded before 1931 accounted for 97 percent of tobacco production
in 1948. The ratio was 85 percent in gas and electricity, 74 percent in petroleum refining,
72 percent in food and beverages, 60 percent in paper, 60 percent in vehicles, and 57
percent in metals and chemicals.
This is not to argue that there were no new firms founded and no new industries
developed during the 1930s. There were individual industries that underwent substantial
capacity growth in the 1930s. One such case was the Brazilian metal-working and
65 Calculated from data in Werner Baer, The Development of the Brazilian Steel Industry (Nashville, Tenn: Vanderbilt University Press, 1969), p. 65. 66 Jorge Katz and Bernardo Kosacoff, “Import-Substituting Industrialization in Argentina, 1940-1980: Its Achievements and Shortcomings,” in Enrique Cárdenas, José Antonio Ocampo, and Rosemary Thorp eds., An Economic History of Twentieth Century Latin America, Volume III: Industrialization and the State in Latin America, The Postwar Years (London: Palgrave, 2000), p. 282.
38
machinery industry, in which many new firms established. These firms produced
agricultural machinery, textile spinning and weaving machinery, wood-working
machinery, refrigeration equipment, boilers, elevators, and printing equipment, along
with a host of other products.67 These new industries included consumer goods as well.
In Mexico, for example, literally hundreds of small firms sprang up during the latter part
of the 1930s, producing goods such as silk and rayon flat crepes, cotton knitwear, rayon
knitwear, and hosiery.68 Data from Chile indicate that a similar process took place:
thousands of firms with workforces from 5 to 100 were founded between 1927 and
1937.69 The Argentine data on industrial production in 1946, presented in table 17, tell
the same story. There were lots of new firms founded from 1931 to 1946 (they accounted
for 62 percent of firms operating in 1946). These firms only accounted, however, for 37
percent of output. If we take the ratio of firms to output for the periods before and after
1931, we generate a rather striking result: firms founded during 1931-46 were roughly
one-third the size of firms founded before 1931.
All of this is to say that one the eve of World War II, Latin America was already
highly industrialized. The Argentine data on the market shares of domestic producers of
basic manufactured goods perhaps capture the general situation. Circa 1939, domestic
producers had pushed imported products out of the market for food and beverages,
tobacco products, clothing, construction materials (stone, glass, ceramics) and rubber
67 Wilson Suzigan, Indústria Brasileira: Origem e Desenvolvimento (Editora Brasiliense, 1986), p. 281. 68 Stephen Haber, Industry and Underdevelopment: The Industrialization of Mexico, 1890-1940 (Stanford: Stanford University Press, 1989), p. 186. 69 Gabriel Palma, “From an Export-led to an Import-substituting Economy: Chile 1914-39,” in Rosemary Thorp ed., An Economic History of Latin America, Volume 2, Latin America in the 1930s: the Role of the Periphery in World Crisis (London: Palgrave, 2000), p. 60.
39
tires. Domestic producers had also taken more than half the market in industries such as
metal working, chemicals, machinery and vehicles, textiles, paper, and wood products.
(See table 8).
The political process by which tariff protection had been awarded to favored
manufacturers during the years before 1914 continued throughout the 1920s, and then
accelerated in the 1930s. In Chile, for example, there were multiple revisions of the
tariffs after 1914, including major increases in 1916 and 1921. The latter increased tariffs
by 50 percent, and established special taxes of 100 percent on certain goods. (Lederman
2005: 61) The 1928 tariff revision went even farther: it not only increased in the number
of goods subject to import duties, it also gave the president the right to raise tariffs on any
product without the need to consult congress. Not surprisingly, within two years,
President Ibañez had used this provision to increase import taxes on 440 different
customs classifications. On average, tariffs increased by 71 percent from 1928 to 1930,
and covered 73 percent of imports. The Chilean government increased tariffs again in
1931. In 1933, President Alessandri put through an across the board tariff increase of 50
percent. A year later, he replaced that increase with a tariff surcharge of 100 percent,
which was further increased in 1935 to 300 percent.70
The history of Mexican tariff setting is much the same. Mexico, as we discussed
earlier, had been extremely protectionist during the Díaz dictatorship. During the 1910-
20 Revolution, the Mexican government had tried to lower tariff rates, and had achieved
some success. Near as they can be measured, tariffs in 1920 were at roughly half their
70 Gabriel Palma, “From an Export-led to an Import-substituting Economy: Chile 1914-39,” in Rosemary Thorp ed., An Economic History of Latin America, Volume 2, Latin America in the 1930s: the Role of the Periphery in World Crisis (London: Palgrave, 2000), pp. 48, 58.
40
1910 level.71 Under intense pressure from manufacturers (and from Mexico’s politically
powerful labor federation— the Confederación Obrera Regional de Mexico) in the mid-
1920s textile tariffs climbed back to their Porfirian levels. Aurora Gómez-Galvarriato’s
careful estimates indicate that the effective rate of protection for common cotton cloth
was 38 percent in 1923, 46 percent in 1927, and 345 percent in 1930. Tariffs on fine
weave goods rose even faster: the effective rate of protection was 53 percent in 1923, 65
percent in 1927, and 397 percent in 1930.72 These results are consistent with those
obtained by Graciela Márquez for a broader range of goods. Her estimates indicate that
for consumer goods as a whole (not including foodstuffs) the average nominal tariff in
1924 was 38 percent. In 1930, the average tariff on that same group of products had
increased to 47 percent. In some individual product lines the average tariff had increased
even more dramatically. In textiles, for example, the tariff increased from 45 to 59
percent. In manufactured clothing, the tariff increased from 43 to 69 percent. Moreover,
in intermediate goods, the average tariff (36 percent in 1930) was lower than in non-
agricultural consumer goods (47 percent in 1930), suggesting a cascading tariff
structure.73 Márquez’ estimates of intermediate goods tariffs, it should be pointed out, are
71 For the coefficient of protection before and after the revolution see: Daniel Cosio Villegas, La cuestión arancelaria en México. (Mexico City: Universidad Nacional Autónoma de México, 1989), p. 58. Aurora Gómez Galvarriato’s estimates for the cotton textile industry indicate the same magnitude of change. See her, "The Impact of Revolution: Business and Labor in the Mexican Textile Industry, Orizaba, Veracruz, 1900-1930" (Ph.D. Dissertation, Harvard University, 1999), pp. 604-08. For a discussion of the political battles surrounding the tariff in 1920 see, María del Carmen Collado Herrera, Empresarios y políticos, entre la Restauración y la Revolución 1920-1924. Mexico City: Instituto Nacional de Estudios Históricos de la Revolución Mexicana, 1996), p. 208. 72 Aurora Gómez Galvarriato, "The Impact of Revolution: Business and Labor in the Mexican Textile Industry, Orizaba, Veracruz, 1900-1930" (Ph.D. Dissertation, Harvard University, 1999), pp. 604-08. 73 Graciela Márquez Colin, "Protección y cambio institucional: la política arancelaria del Porfiriato a la Gran Depresión. (Working Paper, El Colegio de México, Centro de Investigaciones Económicas, Mexico City, 2001).
41
most likely upward biased, because they are strongly driven by chemicals and iron and
steel products— industries that existed in Mexico and that demanded protection from
foreign competition. A sample drawn on intermediate goods that were not manufactured
domestically would probably indicate even lower tariffs on intermediate goods. In short,
the evidence indicates that the same trend that we saw in textiles— of increasing rates of
effective protection— almost certainly held across manufacturing as a whole.
The evidence on other Latin American countries, while less plentiful, runs in the
same direction as that for Chile and Mexico. In Brazil, for example, the evidence
regarding cotton textiles indicates that tariffs fell during World War I (when industry
received implicit protection from the war), but then were raised by the government in the
1920s. Circa 1928, the tariff on common cotton cloth was 100 percent. Tariffs on capital
and intermediate goods were high as well, although they were not at the astronomical
level of textiles. This suggests a cascading tariff structure, and thus positive effective
rates of protection.74 In some countries, governments began to substitute quantitative
restrictions for tariffs, essentially not letting in foreign produced goods at any price. This
was the case, for example, in Argentina, where the government successively revised
tariffs upwards, devalued the currency, and introduced quantitative restrictions on
imports.75
74 Marcelo de P. Abreu, Alfonso S. Bevilaqua, and Demosthenes M. Pinho, “Import Substitution and Growth in Brazil, 1890s-1970s,” in Enrique Cárdenas, José Antonio Ocampo, and Rosemary Thorp eds., An Economic History of Twentieth Century Latin America, Volume III: Industrialization and the State in Latin America, The Postwar Years (London: Palgrave, 2000), p. 157. 75 Jorge Katz and Bernardo Kosacoff, “Import-Substituting Industrialization in Argentina, 1940-1980: Its Achievements and Shortcomings,” in Enrique Cárdenas, José Antonio Ocampo, and Rosemary Thorp eds., An Economic History of Twentieth Century Latin America, Volume III: Industrialization and the State in Latin America, The Postwar Years (London: Palgrave, 2000), p. 283.

42
The broad range of tariff and non-tariff barriers to trade that governments put into
place in the 1930s were not conceived by policy makers as permanent. Rather, they were
ad hoc responses to short-term crises. If fact, from the point of view of governments,
tariff and non-tariff barriers made a great deal of economic sense— without even
considering the political benefits of protecting domestic manufacturing. The collapse of
export revenues meant that governments faced balance of payments problems. Negative
trade balances could not be offset by positive balances on the capital account, because
sources of foreign lending and foreign direct investment had largely dried up during the
depression. Thus, governments needed to find ways to stop hemorrhaging foreign
exchange to pay for imports— tariffs and quantitative restrictions were the obvious
instruments to bring about this result.76
Post-1940 Industrial Development
In the ensuing decades, the ad-hoc protectionist policies of the 1890s through the
1930s were deepened, broadened, given intellectual justification by development
economists,77 and made into quasi-permanent features of the region’s political economy.
The reasons were several fold: implicit protection from World War II; chronic shortages
of foreign exchange; and the political power of organized industrialists and organized
industrial workers. Let us take up each of these in turn.
76 Enrique Cárdenas, José Antonio Ocampo, and Rosemary Thorp, “Introduction,” in Enrique Cárdenas, José Antonio Ocampo, and Rosemary Thorp eds., An Economic History of Twentieth Century Latin America, Volume III: Industrialization and the State in Latin America, The Postwar Years (London: Palgrave, 2000), p. 10. 77 For a discussion of how development economists came to embrace protectionism in developing countries, see Anne O. Krueger, “Trade Policy and Economic Development: How We Learn,” American Economic Review 87:1 (March 1997), pp. 1-22.
43
As we have already seen, the experience with implicit protection via exchange
rate depreciation during the early 1930s was soon followed in many countries by explicit
protection in the form of tariff increases and quantitative restrictions on imports. Because
tariffs in most countries were specific, not ad valorum, one would expect domestic price
inflation to have gradually eaten away at the protection afforded by these tariffs. That did
not occur, however, because the protectionist 1930s were followed by another long
period of implicit protection— this one provided by World War II.
The specific effects of the war cut two ways. On the one hand, the war meant that
manufacturers of consumer goods were protected from foreign imports. On the other
hand, the war also meant that they had difficulty obtaining imported machinery, spare
parts, and intermediate inputs. During World War I, the latter effect had dominated the
former, and accounts, in part, for the sluggish performance of industry during 1914-18.
By the 1940s, however, the situation was different: Latin America had substantially
greater industrial capacity than had been the case in 1914. Moreover, most of the larger
countries also had metal-working industries that were capable of repairing, if not
copying, manufacturing machinery. This was particularly the case in Argentina and
Brazil, where machine repair and fabrication had been taking place since the 1920s.
There had also been the development of some intermediate goods industries during the
1920s— particularly basic chemicals.
The result was that it was possible to run a good deal, although certainly not all,
of the already installed plant and equipment around the clock, even if it was not possible
to import new capital equipment. This appears to have been particularly true in the
Mexican case, where as Clark Reynolds has shown, most output growth in the 1940s
44
came from running capacity installed in the decades before World War II. 78 It was also
true in Argentina, where the ability to run existing plant intensively allowed
manufacturers to grab market share from imports. In textiles, for example, by 1946-49,
domestic manufacturers had increased their market share to 85 percent (compared to 56
percent in 1937-39). Over the same period, domestic producers increased their market
shares in paper making (from 60 percent in 1937-39 to 70 percent in 1946-49), electrical
machinery (from 44 percent to 78 percent), and chemicals (from 60 to 81 percent). (See
Table 8) Regardless of the intensity with which firms ran old factories during World War
II, the end result was the same: there was lots of time— roughly the 15 years from the
onset of the Great Depression to the end of World War II — for Latin American
manufacturers to become very accustomed to captive domestic markets.
Manufacturers were not the only group that had come to view trade protection—
either implicit or explicit— as a given: Latin America’s politically powerful industrial
workers had as well. In part the growing influence of labor was a function of numbers:
there were plain and simply more miners, stevedores, railway-men, and factory workers
in the 1930s than there had been in 1900. In equal part, however, workers had, by the
1930s, become increasingly well organized. In some countries, Mexico being perhaps the
archetypal case, they had begun to fuse unions together into national labor federations
that were affiliated with political parties. The economic crisis of the early 1930s had
brought down many of the governments of the inter-war period, or had thrust those
78 Clark W. Reynolds, The Mexican Economy: Twentieth Century Structure and Growth (Yale University Press, 1970), pp. 161-68. Enrique Cárdenas notes that Mexico was somewhat unique among Latin American countries during World War II in that it was able to export a good deal of its output. His calculations indicate that 79 percent of the increase in output during the war can be attributed to exports. Enrique Cárdenas, “The Process of Accelerated Industrialization in Mexico, 1929-1982,” in Enrique Cárdenas, José Antonio Ocampo, and Rosemary Thorp eds., An Economic History of Twentieth Century
45
governments into crisis. The response, not just in Latin America but around the world,
was that politicians had to search for groups that could be part of new coalitions. Given
the fact that unions had quantitatively large memberships, were able to mobilize
supporters and coordinate their actions, and often had leaderships who were not
ideologically opposed to capitalism, they were natural coalition partners for the
governments that came to power in the 1930s and 1940s. That is, Latin America’s
“populist” governments, which historians often identify with particular political leaders
such as Getulio Vargas, Juan Perón, and Lazaro Cárdenas, were the product of a more
fundamental and larger political process by which some organized subset of the working
class traded its political support for job security and upward mobility for its membership
alone.
Once organized labor had been brought into the governing coalitions of most
countries, its leadership quickly became strong advocates of trade protection. This is not
to say that the relationship between labor unions and manufacturers was not acrimonious,
conflictive, and adversarial. It was deeply so. It is to say, however, that both groups saw
it in their interest to defend the protection that afforded them stable jobs, stable profits,
and (for union leaders) a stable flow of revenues from their rank and file. In fact, the
informal coalitions that came to exist between organized labor and organized
industrialists were so powerful that even the military governments of the 1960s and
1970s— with the notable exception of Chile’s Pinochet government— did not attempt to
tinker with protectionism in any serious manner.
Latin America, Volume III: Industrialization and the State in Latin America, The Postwar Years (London: Palgrave, 2000), pp. 184-85.
46
One might consider it odd that even right wing, military governments were so
easily swayed by protectionist lobbying from industrialists and (left-leaning) labor
unions, until you consider that the incentives of governments, regardless of their
ideological stripe, were also aligned with trade protection. Latin American governments
during the post-war period were confronted by chronic balance of payments problems.
On the one hand, Latin American countries were losing market share to other developing
countries in their major mineral and agricultural exports. Some sense of this can be
gleaned from the following four data points: in 1946, Latin America accounted for 13.5
percent of world exports; by 1955 that figure stood at 8.9 percent, by 1965 at 6.2 percent,
and by 1975 at 4.4 percent.79 On the other hand, Latin America could not substitute net
capital inflows for decreasing export revenues. Prior to 1914, trade deficits were
financed by positive balances on the capital account— as a result of foreign direct
investment and foreign loans. In the post-war period, those sources of finance were no
longer as freely available. The extent to which capital flows decreased can be seen in
table 19. Circa 1914, foreign direct investment in the larger countries of the region was a
large multiple of their gross domestic products: FDI was 2.6 times GDP in Argentina,
2.96 times in Brazil, 1.63 times in Chile, and 1.83 times in Mexico. By 1929, these
ratios, as well as those for smaller economies, had fallen substantially: FDI in these
economies was now roughly equal to GDP. The ratios decreased even further during the
1930s, and then collapsed almost completely thereafter. Circa 1950, foreign direct
investment was only a small fraction of GDP: 0.12 in Argentina, 0.18 in Brazil, 0.49 in
Chile, and 0.17 in Mexico. It then stayed at that level until the 1970s.
79 Alan M. Taylor, “On the Costs of Inward-Looking Development: Price Distortions, Growth, and Divergence in Latin America,” Journal of Economic History 58 (March 1998), pp. 1-28.
47
The upshot was that Latin American governments had to find ways to either
increase exports or decrease imports. Given the political costs associated with each
option, governments tended to chose the latter: Boosting exports typically requires the
politically unpopular step of a major currency devaluation; decreasing imports simply
requires a tariff. In addition, there were time-horizon considerations: increasing exports
takes years; decreasing imports can be done overnight. This was even true of military
governments, which one might assume to operate with longer time horizons. In
Argentina, for example, the military government of Martínez de Hoz tried to lower tariffs
and eliminate non-tariff barriers when it came to power in the spring of 1976. In the
short run it was successful, driving down average tariffs from 94 percent when it came to
power, to 53 percent before the year was out. It also eliminated quotas and other non-
tariff restrictions. In the next several years, it pushed tariffs down even further, reaching
26 percent in 1979, with an announced goal of 15 percent for 1981. It could not stay the
course, however. By 1980, Argentina was running current account deficits, as imported
goods flooded the market. Investors came to believe that the government would have to
devalue, in order to check the tide of imports. The result was capital flight. Part of the
response was predictable: the government was forced to devalue the currency. Part of the
response was somewhat less predictable: the government completely reversed course on
trade liberalization; it returned to protectionism, and embraced high tariffs, quantitative
restrictions on imports, and exchange controls.80
80 Jorge Katz and Bernardo Kosacoff, “Import-Substituting Industrialization in Argentina, 1940-1980: Its Achievements and Shortcomings,” in Enrique Cárdenas, José Antonio Ocampo, and Rosemary Thorp eds., An Economic History of Twentieth Century Latin America, Volume III: Industrialization and the State in Latin America, The Postwar Years (London: Palgrave, 2000), p. 301.
48
The conjuncture of political and economic constraints meant that once Latin
American governments put protective tariffs or non-tariff barriers into place, they did not
subsequently remove them. As one author has put it: protectionism was not a time-bound
process, instead every ad hoc protectionist policy became a “permanent conquest.”81 The
result was that the ad hoc policies of the 1940s and 1950s became enshrined until the
economic collapse of the 1980s. Just how protectionist the Latin American economies
were can be gleaned from Table 20, on nominal rates of protection, circa 1960. There are
two striking patterns to the data. First, import tariffs on manufactures were
astronomically high relative to those of the European Economic Community. In
consumer goods, tariffs were almost always in excess of 100 percent and were as high as
328 percent. Second, the lower tariffs on capital goods, semi-manufactures, and
industrial raw materials, while still high by EEC standards, were significantly lower than
the tariffs on consumer goods. The implication is that effective rates of protection were
also extremely high. Joel Bergsman’s detailed study of Brazilian effective rates of
protection bears this out. In 1967, after a reform that drastically lowered tariffs, the
average effective rate of protection on Brazilian manufactures was 117 percent.82 The
available evidence for other countries runs in the same direction: circa 1960, the effective
rate of protection on consumer durable goods was 285 percent in Brazil, 123 percent in
81 Enrique Cárdenas, José Antonio Ocampo, and Rosemary Thorp, “Introduction,” in Enrique Cárdenas, José Antonio Ocampo, and Rosemary Thorp eds., An Economic History of Twentieth Century Latin America, Volume III: Industrialization and the State in Latin America, The Postwar Years (London: Palgrave, 2000), p. 16. 82 Joel Bergsman, “A Política Comercial no Pós-Guerra,” in Flavio Rabelo Versiani and José Roberto Mendonca de Barros, Formaçao Econômica do Brasil: A Experiência da Industrializaçao (Sao Paulo: Ediciones Saraiva, 1977), p. 396.
49
Chile, and 85 percent in Mexico.83 The available data on Argentina tell the same story:
the average effective rate of protection in 1969 was 97 percent.84
In addition to tariff walls, virtually every Latin American country also had
quantitative restrictions on imports. These required importers to obtain permits from the
government, in addition to paying the tariff, in order to bring a particular product or input
into the country. From the point of view of governments, such permit systems were
advantageous because permits could be used as patronage to maintain the loyalty of the
individuals who were doing the importing. Like most protectionist polices, these began
on an ad hoc, temporary basis. Consider, for example, the Mexican experience. Facing
enormous pressure on its trade account, the Mexican government imposed quantitative
restrictions on imports in 1947. At first, the restrictions only applied to “luxury goods,”
but a year later the Ministry of the National Economy was given the authority to increase
the range of restricted goods— the only requirement being that it had to first consult with
the Secretary of the Treasury to assess the impact of the restriction on government
revenues. As a practical matter, this meant that manufacturers could lobby the executive
branch of government, which could then, without the need to seek legislative approval,
restrict the importation of competing products. During the 1950’s, these mechanisms
were used to obtain quotas on a wide variety of domestically produced goods. As soon as
a new industry appeared, the government provided it with import quotas.85 By 1956, 28
83 Alan M. Taylor, “On the Costs of Inward-Looking Development: Price Distortions, Growth, and Divergence in Latin America,” Journal of Economic History 58 (March 1998), pp. 1-28. 84 Julio Berlinski, “International Trade and Commercial Policy,” in Gerardo della Paolera and Alan M. Taylor, A New Economic History of Argentina (Cambridge: Cambridge University Press, 2003), p. 214. 85 Enrique Cárdenas, “The Process of Accelerated Industrialization in Mexico, 1929-1982,” in Enrique Cárdenas, José Antonio Ocampo, and Rosemary Thorp eds., An Economic History of Twentieth Century Latin America, Volume III: Industrialization and the State in Latin America, The Postwar Years (London:
50
percent of imports were limited by a system of import permits. The proportion of
restricted goods grew to 65 percent in 1965, and to 74 percent in 1974.86 Similar
quantitative restrictions, with similarly ad hoc decree mechanisms, were created in
Argentina and Chile.87
A third protectionist instrument that governments had at their disposal was the use
of multiple exchange rates. Manufacturers could import necessary capital goods at special
exchange rates that lowered the domestic currency cost of imported machinery and other
inputs, but foreign-produced manufactured goods had to come into the country subject to
an entirely different exchange rate that made competing imports look extremely
expensive in local currency terms. Governments had similar latitude in determining the
exchange rate for exports. In fact, governments used “exchange rate management” in any
number of ways, depending on their goals at the moment: If they wanted to help
exporters compete in foreign markets, they granted them a favorable exchange rate; If
they wanted to tax exports in order to subsidize industry, then the government granted
exporters an unfavorable exchange rate— and kept the difference between the
Palgrave, 2000), p. 187. For detailed discussions of protectionism in the Mexican case see: Robert Bruce Wallace, Adriaan Ten Kate, Antonie Waarts, and Maria Delfina Ramírez de Wallace, La política de protección en el desarrollo económico de México (Mexico: Fondo de Cultura Económico, 1979); and Timothy King, Mexico : Industrialization and Trade Policies Since 1940 (London and, New York: Oxford University Press, 1970). 86 Robert Bruce Wallace, Adriaan Ten Kate, Antonie Waarts, and Maria Delfina Ramírez de Wallace, La política de protección en el desarrollo económico de México (Mexico: Fondo de Cultura Económico, 1979), p. 94. 87 Ricardo French Davis, Oscar Muñoz, José Miguel Benevente, and Gustavo Crespi, “The Industrialization of Chile during Protectionism, 1940-1982,” in Enrique Cárdenas, José Antonio Ocampo, and Rosemary Thorp eds., An Economic History of Twentieth Century Latin America, Volume III: Industrialization and the State in Latin America, The Postwar Years (London: Palgrave, 2000), pp. 130-31; Julio Berlinski, “International Trade and Commercial Policy,” in Gerardo della Paolera and Alan M. Taylor, A New Economic History of Argentina (Cambridge: Cambridge University Press, 2003), p. 213; Carlos Díaz Alejandro, Essays on the Economic History of the Argentine Republic (New Haven: Yale University Press, 1970), p. 261.
51
international market-determined rate and the official exchange rate. In short, multiple
exchange rate systems amounted to a set of complicated implicit taxes and implicit
subsidies.
Once governments went down the road of “exchange rate management” there was
no end. In Chile, to cite a notorious example, in 1952 there was a system of five multiple
exchange rates, and three “free” exchange rates, as well as various combinations of both.
The government board (CONDECOR) that oversaw this system, not only had the
authority to determine exchange rates, it also had the power to ban outright specific
imports or exports.88 Argentina had a similar system of multiple exchange rates that were
designed to subsidize industry by implicitly taxing agricultural exports. This was the
Instituto Argentino para la Promoción de Intercambio (the Argentine Institute for the
Promotion of Trade, IAPI), which was created in 1946. IAPI was anything but an export
promotion institution. Instead the Argentine government nationalized all foreign trade,
forcing it through IAPI. IAPI then taxed exporters and subsidized industrialists via a
system of multiple exchange rates.89 The use of multiple exchange rates, unlike tariffs
and quantitative restrictions, waxed and waned. They were particularly popular in the
1940s and 1950s. Their use, under IMF pressure, subsided during the 1960s. In the late
1970s and 1980s, however, they made a comeback because they allowed governments to
88 Ricardo French Davis, Oscar Muñoz, José Miguel Benevente, and Gustavo Crespi, “The Industrialization of Chile during Protectionism, 1940-1982,” in Enrique Cárdenas, José Antonio Ocampo, and Rosemary Thorp eds., An Economic History of Twentieth Century Latin America, Volume III: Industrialization and the State in Latin America, The Postwar Years (London: Palgrave, 2000), p. 130. 89 Jorge Katz and Bernardo Kosacoff, “Import-Substituting Industrialization in Argentina, 1940-1980: Its Achievements and Shortcomings,” in Enrique Cárdenas, José Antonio Ocampo, and Rosemary Thorp eds., An Economic History of Twentieth Century Latin America, Volume III: Industrialization and the State in Latin America, The Postwar Years (London: Palgrave, 2000), p. 286.
52
foment exports (and earn foreign exchange) without having to suffer the political
consequences of major currency devaluation.
In the medium term, these policies spurred industrial development. In the three
decades that followed World War II, Latin American GDP grew 5.6 percent per annum.
Manufacturing outgrew the rest of the economy, increasing by 6.8 percent per year.
Manufacturing as a share of total Latin American GDP therefore rose from 19 percent in
1945 to 26 percent in 1974— about the same share as in the United States.90
The growth of Latin American manufacturing during the post-war period was
largely accomplished by the growth of firms that produced consumer-durables, such as
household appliances and, most particularly, automobiles. This period also saw the
flourishing of industries that produced construction goods, most notably steel, cement,
and flat-rolled glass, in order to meet the demand of the region’s rapidly growing cities.
By the 1970s, the range of industrial production expanded even further, including basic
petrochemicals, diesel trucks, and aluminum. Some countries, most notably Brazil and
Argentina, even developed (with considerable government support) sizable armaments
industries that produced low-cost, low tech aircraft, armored vehicles, and light weapons.
This required, of course, the development of their machine tool and other capital goods
industries.
It is not clear, however, that the increase in the size of Latin American industry
necessarily translated into an increase in the productivity of Latin American industry.
Clark Reynold’s estimates for Mexico, for example, indicate that productivity growth in
90 Data from Enrique Cárdenas, José Antonio Ocampo, and Rosemary Thorp, “Introduction,” in Enrique Cárdenas, José Antonio Ocampo, and Rosemary Thorp eds., An Economic History of Twentieth Century Latin America, Volume III: Industrialization and the State in Latin America, The Postwar Years (London: Palgrave, 2000), p. 16.
53
manufacturing during the period after 1940 was quite modest. Mexican industrial output
increased at the rate of 8 percent per year from 1940 to 1950 and 7.3 percent per year
from 1950 to 1960. But, the percentage of that output increase that was not accounted for
by the growth of capital and labor was only 0.2 percent per year from 1940 to 1950 and
0.7 percent per year from 1950 to 1960.91 Díaz Alejandro’s estimates for Argentina point
in the same direction. Except for tobacco, where productivity doubled from 1937-39 to
1959-62, labor productivity in the rest of Argentine industry stagnated. (See table 21).
The whole point of protectionism was to create distortions that favored
manufacturers over other economic sectors. These distortionary policies— tariffs,
quantitative restrictions, and multiple exchange rates— generated, however, unintended
and perverse consequences. Governments tended to respond to these perverse outcomes
with another round of ad hoc policies, which, in turn, gave rise to other unintended and
perverse outcomes. Let us examine these briefly.
One of the outcomes of protectionism was that it exacerbated Latin America’s
balance of payments problem, rather than solving it. Governments embraced quantitative
import restrictions and tariffs in the late 1940s because of the rapid dwindling of their
foreign exchange reserves. In the short run, the strategy worked. Nobody had thought,
however, about the consequences of the growth of consumer goods industries in the
context of societies that had historically invested little in education and had little in the
way of the social overhead capital. It soon became obvious that most capital goods— and
in many industries a good deal of the intermediate goods— were going to have to be
91 Clark W. Reynolds, The Mexican Economy: Twentieth Century Structure and Growth (New Haven: Yale University Press, 1970), p. 166. Barbero and Rocchi obtain similar results for Argentina from 1935 to
54
imported. In the medium and long terms, this created, perversely, tremendous pressures
on the balance of payments.
One solution to this problem was yet more trade protection— now on intermediate
and some capital goods. These steps, of course, lowered the effective rate of protection
on consumer goods. As a consequence, consumer goods manufacturers tended to fight
against protection for capital goods industries.92 Thus, it was necessary for policy makers
to increase nominal rates of protection or increase quantitative restrictions on imports for
consumer goods industries as well.
A second solution to the balance of payments problem was to increase export
earnings. The only readily available mechanism to do that was to increase traditional
exports— mineral and agricultural products. This meant that industrial development
required the promotion of exports. In the long run, these might have been generated by
exporting manufactured goods. In the short run, however, that was not an option— and
the short run was the time horizon that mattered to governments. Once governments
committed to short-run, ad hoc solutions to the balance of payments problem, the long
run solution of creating manufacturing industries that were capable of exporting became
less and less obtainable. The result was a set of policies that in the aggregate worked
against one another: trade protection for consumer goods producers; trade protection for
intermediate and capital goods producers; preferential exchange rates for the importers of
capital goods; and preferential exchange rates for the exporters of agricultural and
mineral products.
1954. María Inés Barbero and Fernando Rocchi, “Industry,” in Gerardo della Paolera and Alan M. Taylor, A New Economic History of Argentina (Cambridge: Cambridge University Press, 2003), p. 274. 92 Carlos Díaz Alejandro, Essays on the Economic History of the Argentine Republic (New Haven: Yale University Press, 1970), p. 259.

55
A second perverse consequence of protectionism was that it transferred rents from
domestic consumers to multinational companies (MNCs). One of the features of trade
protection is that it tends to be non-excludable: all producers are protected by the tariff
wall. The response of foreign firms to protectionism was, therefore, to jump over the
tariff wall by erecting local plants. This was a process that had begun in the 1920s, with
the arrival of automobile assembly operations in Argentina, Brazil, and Mexico. By the
1950s, it was in full swing. Data from Argentina provides some sense of the overall
process. Circa 1950 foreign direct investment (FDI) accounted for only 3 percent of total
manufacturing investment. By the end of the decade, it accounted for almost 20 percent.
Well over half of this investment was in the automobile industry.93 The rest clustered in
chemicals, farm machinery, electric motors, rubber, pharmaceuticals, plastics, and
synthetic fibers. In fact, the only heavy industries not dominated by MNCs were steel
and paper.94 Data on MNC investment in Mexico yield similar— if more muted—
results. As of 1959, 47 percent of U.S. FDI in Mexico was in manufacturing. In fact,
virtually all of the growth of U.S. FDI in Mexico between 1950 and 1959 was in the
manufacturing sector. The result was that in 1959 U.S. investors held claims on eight
percent of total Mexican manufacturing investment.95
93 Jorge Katz and Bernardo Kosacoff, “Import-Substituting Industrialization in Argentina, 1940-1980: Its Achievements and Shortcomings,” in Enrique Cárdenas, José Antonio Ocampo, and Rosemary Thorp eds., An Economic History of Twentieth Century Latin America, Volume III: Industrialization and the State in Latin America, The Postwar Years (London: Palgrave, 2000), p. 298-99. 94 Paul H. Lewis, The Crisis of Argentine Capitalism (Chapel Hill: University of North Carolina Press, 1990), p. 299. 95 Clark W. Reynolds, The Mexican Economy: Twentieth Century Structure and Growth (New Haven: Yale University Press, 1970), pp. 190-91.
56
MNC investment tended to cluster in particular industries where the advantages of
foreign firms— their access to overseas capital markets and their knowledge of particular
technologies— outweighed the advantages of domestic firms— their knowledge of local
markets and their political connections. Not surprisingly, the end result, after a period of
intense competition, was segmented markets: MNCs tended to completely dominate
particular lines of manufacturing (automobiles, tires, office equipment, consumer
electronics, pharmaceuticals), while being almost completely absent in others (textiles,
clothing, leather goods, steel, cement, glass, household appliances).
Trade protection created a third set of unforeseen problems. Industrial technology
tended to be designed for large and deep markets, such as those of Western Europe and
the United States. Latin America’s markets tended, however, to be small and shallow.
This meant that Latin American manufacturing companies— including the MNCs— were
going to be inefficient producers. Either they could employ technologies that were less
efficient than the world standard, or they could employ the most efficient technologies
but operate them at far less than capacity. Many producers chose the first option,
purchasing second-hand machinery and outmoded product designs. Others chose the
second option, employing world class facilities that they operated at far less than the
minimum efficient scale of production. Both choices implied that Latin American firms
produced at a higher cost than those elsewhere. The latter choice also implied that the
structure of the market would be characterized by monopoly or oligopoly. The net result
of both sets of choices was that consumers paid higher prices for manufactured products
than they would have under free trade.
57
One of the reasons for the presence of MNCs in much of heavy industry was the
lack of adequate banking systems and securities markets to mobilize domestic capital.
The lack of adequate financial systems had plagued Latin American industry since the
pre-1914 period. Over time, as the scale and cost of industrial technology increased,
these problems grew increasingly severe. Though there was a good deal of variation from
country to country, the basic pattern was that Latin American countries tended to be
under-banked and tended to have small and thin securities markets.96 Under-banking
tended to be a product of explicit government policies designed to repress financial
development as a means of subsidizing the fisc (banks could only obtain charters from
central governments, central governments kept the number of charters low and required
high reserve ratios, and then required banks to hold much of their reserves in the form of
government bonds).97 Thin securities markets tended to be a product of the fact that
bondholders had little protection in the case of bankruptcy, and that there was little in the
way of external auditing of public companies in Latin America until the late 1970s—
when the largest firms started borrowing money from foreign banks, who demanded
audited financial statements. Until that point, stockholders had little to go in making
investment decisions other than the firm’s past record of dividend payments and the
reputation of the firm’s principals. On top of this, high inflation, particularly in the
Brazilian and Argentine cases, but elsewhere as well, made the evaluation of a firm’s
96 For a detailed study of the Mexican case: see, Gustavo del Angel, “Paradoxes of Financial Development: The Construction of the Mexican Banking System, 1941-1982” (Ph.D. Dissertation, Stanford University, 2002). For a general discussion of the thinness of Latin American Financial Systems see: Ross Levine, “Bank-Based or Market Based Financial Systems: Which is Better,” Journal of Financial Intermediation 11 2002), pp. 1-30. 97 For a discussion of financial repression see: Ronald McKinnon, Money and Capital in Economic Development (Washington, D.C.: Brookings Institution, 1973).
58
financial statements difficult, even had there been other protections for shareholders. Not
surprisingly, very few firms could actually sell shares to the public.
Latin American governments could have addressed these problems by rewriting
securities laws, by creating a stable macroeconomic environment, by making it easier to
obtain a bank charter, and by reducing reserve requirements for banks. Those choices,
however, all came with short run political costs, which public officials did not want to
bear. Governments therefore addressed the problem of inadequate financial
intermediation by creating intermediaries of their own, which took the form of
government-owned industrial finance banks. The first of these was Chile’s Instituto de
Crédito Industrial, established in 1928 (later enlarged into the Corporación de Fomento
de la Producción in 1939). Mexico soon followed suit with the creation of Nacional
Financiera in 1934. Virtually every other country with substantial industry soon created
similar banks, such as Argentina’s Banco de Crédito Industrial (founded in 1944), and
Brazil’s Banco Nacional de Desenvolvimento Econômico (founded in 1952).
These government banks were supposed to lend to small and medium sized firms.
As a practical matter, however, they tended not to do so. The political pressure to lend to
large firms, which tended to have large, unionized, and politically organized labor forces,
simply outweighed whatever original mandate the banks may have had. This was
particularly the case in Mexico, but was true in other countries as well.98 As Noemi
98 Enrique Cárdenas, “The Process of Accelerated Industrialization in Mexico, 1929-1982,” in Enrique Cárdenas, José Antonio Ocampo, and Rosemary Thorp eds., An Economic History of Twentieth Century Latin America, Volume III: Industrialization and the State in Latin America, The Postwar Years (London: Palgrave, 2000), p. 190.
59
Girbal Blacha’s work on Argentina’s Banco de Crédito Industrial and Banco Nacional
makes clear, virtually all the bank’s capital was allocated to large firms.99
Latin America’s industrial development banks did more, however, than make
loans. They also took equity stakes in firms. In theory, this is not necessarily a bad thing
to do. The problem was that, in practice, they tended to invest a disproportionate share of
their resources in large firms that lost money. In Mexico, for example, Nacional
Financiera typically took a minority shareholder position in companies to which it was
also making loans. If the firm performed well, Nacional Financiera’s stake would, over
time, become purely nominal. If the firm performed badly, however, Nacional Financiera
typically bought out the other shareholders. From the point of view of the government,
many of these enterprises were simply too big to fail, or had unionized workforces who
were politically crucial. This policy of bail outs not only prevented the bank from
deploying its capital more effectively elsewhere, it also encouraged moral hazard:
knowing that they would be bailed out, manufacturers undertook enterprises of doubtful
profitability. 100
The relentless logic of subsidies ultimately produced government ownership of a
wide range of manufacturing industries, financed of course through government
development banks. Government ownership tended to cluster in the production of so-
called strategic goods, such as steel, basic petrochemicals, and fertilizers. Government
ownership in these industries was rationalized on the basis that these were high risk,
99 Noemi Girbal-Blacha, “Viejos actores, nuevas functiones: Bancos y crédito al la producción e la Argentina, 1946-1955.” Paper presented at the XIII Congreso de la Asociación Internacional de Historia Económica (Buenos Aires). 100 Enrique Cárdenas, “The Process of Accelerated Industrialization in Mexico, 1929-1982,” in Enrique Cárdenas, José Antonio Ocampo, and Rosemary Thorp eds., An Economic History of Twentieth Century
60
capital intensive industries characterized by large minimum efficient scales of production
and capital indivisibilities. While this is true, it was also the case that these firms tended
to produce inputs for other industries. Given the fact that there were no private
shareholders, the prices of the firms’ outputs were determined on political grounds:
government-owned firms wound up charging below market prices. In other words,
taxpayers subsidized the privately-owned enterprises that purchased the steel, electricity,
chemicals, and other inputs produced by so-called parastate firms.
By the late 1960s and early 1970s, it was becoming increasingly clear that
protectionism and “state-led development” had created endless distortions. Consumers
paid high prices for badly made goods. Entrepreneurs found it difficult to evaluate
projects and make investment decisions, because so much of their calculus turned on
political, rather than market, signals. Governments were providing increasingly larger
subsidies, via the exchange rate system, government banks, and parastate firms— and the
benefits of many of those subsidies were being captured by foreign-owned manufacturing
firms.
By the 1970s, Latin America’s governments were faced with a set of hard
decisions: end subsidies and market distortions by opening up to foreign trade, or take
advantage of the boom in international capital markets in order to subsidize a system that
had run into decreasing marginal returns. With the notable exception of Chile,
governments throughout Latin America, “democratic” and authoritarian alike, opted to
buy time by borrowing abroad. The outcome of that experience is well known: the debt
crisis of the 1980s not only produced an economic and social disaster, it brought about a
Latin America, Volume III: Industrialization and the State in Latin America, The Postwar Years (London: Palgrave, 2000), p. 195.
61
dissolution of the political coalitions that had supported protectionism and subsidization
since the 1890s. The result was the end of trade protection, the privatization of
government-owned firms, and the shifting of Latin American manufacturing increasingly
toward export markets.
Conclusions:
Beginning in the 1890s the largest economies of Latin America conducted a 100-
year experiment in which they built tremendous manufacturing sectors behind barriers to
trade. This experiment was not carried out because public officials were ideologically
committed to industrialization or because of economic theories that challenged free trade.
Indeed, the growth of large scale manufacturing industry pre-dated structuralist theories
by 60 years. Rather, Latin America’s industrialization was kick started by an endogenous
process of economic development whose roots were found in the growth of the so-called
export economy. Once industrialists got a foothold they lost no time in seeking tariff
protection. Governments granted this protection because it came at virtually no political
cost: the one class that stood to lose from trade protection, consumers, had no political
voice. The result was that by 1914 all of the larger countries of Latin America had
become increasingly protectionist, and were undergoing a rapid process of industrial
growth.
The next six decades brought (long) periods of prosperity and (short) periods of
morbidity. Over the long term, however, industry outgrew the rest of the economy. Circa
1975, when this style of industrial development had reached its zenith, the manufacturing
sector’s share of Latin American GDP was comparable to that in the United States.
62
Over time, governments played increasingly larger roles in the process of
industrial growth. They devised increasingly complicated systems designed to
simultaneously tax imported manufactures and subsidize the cost of imported inputs to
the production of those goods. They also became financiers, partners, and even direct
owners of manufacturing firms.
This does not mean, however, that Latin American post-1950 industrial
development was “state led” or that it was somehow fundamentally different from the
industrial growth of the pre-1950 period. The process of Latin American industrial
development was always ad hoc. Governments did not grant trade protection because
they were committed to a particular vision of industrial development. They did it
because they were rewarding politically powerful constituents, some of whom were
industrialists and some of whom were industrial unions. They also did it because balance
of payments crises often presented them with difficult political choices: suffer the
negative fallout of devaluation (whose effects are obvious and immediate), or impose
restraints on trade (whose effects are more difficult to detect, and understand, for the
average voter). Similarly, governments did not create industrial finance banks and buy
equity in manufacturing firms because they had some ideological commitment to
government ownership. They did it because government financial policies repressed the
development of banking systems and securities markets that could mobilize adequate
capital for industrial development. Charting a different course in terms of financial
market regulation would have come at sizable short-run political and economic costs:
governments would have had to adhere to stable fiscal policies, create independent
central banks, and undo the segmented monopolies and oligopolies that characterized
63
Latin American banking. Governments therefore chose the second-best solution of
government financing of private firms. Once this started, however, government loans
became like trade protection: it was a permanent prize to be captured. Finally,
governments did not become direct owners of manufacturing firms because public
officials were convinced of the superiority of state ownership. They did it because many
private firms, especially ones that the government had lent money to, were simply too big
to fail. In short, governments increasingly intervened in support of industry because it
was in the self interest of industrialists, industrial unions, and public officials to do so.
This was an outcome of the ad hoc nature of Latin American industrial development, not
the product of carefully thought out plans or strategies. This was as true of Latin
America’s industrial development from 1890 to 1950 as it was from 1950 to 1980.
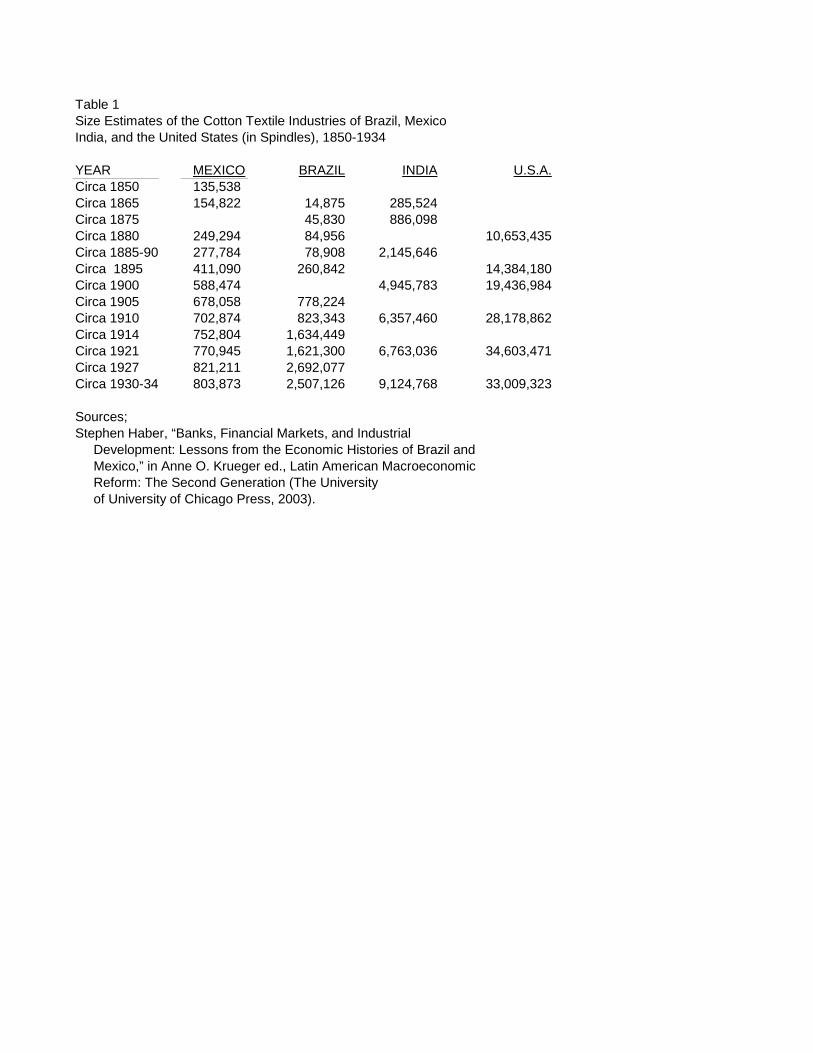
Table 1Size Estimates of the Cotton Textile Industries of Brazil, MexicoIndia, and the United States (in Spindles), 1850-1934
YEAR MEXICO BRAZIL INDIA U.S.A.Circa 1850 135,538 Circa 1865 154,822 14,875 285,524Circa 1875 45,830 886,098Circa 1880 249,294 84,956 10,653,435Circa 1885-90 277,784 78,908 2,145,646Circa 1895 411,090 260,842 14,384,180Circa 1900 588,474 4,945,783 19,436,984Circa 1905 678,058 778,224Circa 1910 702,874 823,343 6,357,460 28,178,862Circa 1914 752,804 1,634,449Circa 1921 770,945 1,621,300 6,763,036 34,603,471Circa 1927 821,211 2,692,077Circa 1930-34 803,873 2,507,126 9,124,768 33,009,323
Sources;Stephen Haber, “Banks, Financial Markets, and Industrial Development: Lessons from the Economic Histories of Brazil and Mexico,” in Anne O. Krueger ed., Latin American Macroeconomic Reform: The Second Generation (The University of University of Chicago Press, 2003).
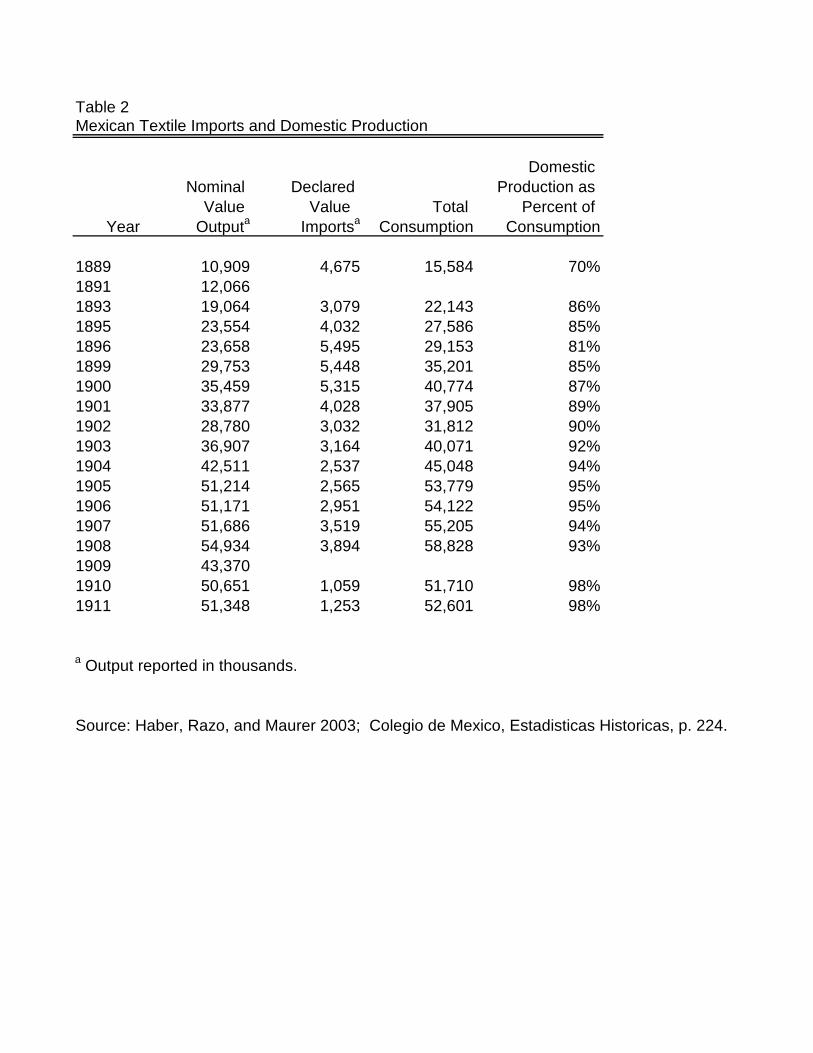
Table 2Mexican Textile Imports and Domestic Production
DomesticNominal Declared Production as
Value Value Total Percent ofYear Outputa Importsa Consumption Consumption
1889 10,909 4,675 15,584 70%1891 12,0661893 19,064 3,079 22,143 86%1895 23,554 4,032 27,586 85%1896 23,658 5,495 29,153 81%1899 29,753 5,448 35,201 85%1900 35,459 5,315 40,774 87%1901 33,877 4,028 37,905 89%1902 28,780 3,032 31,812 90%1903 36,907 3,164 40,071 92%1904 42,511 2,537 45,048 94%1905 51,214 2,565 53,779 95%1906 51,171 2,951 54,122 95%1907 51,686 3,519 55,205 94%1908 54,934 3,894 58,828 93%1909 43,3701910 50,651 1,059 51,710 98%1911 51,348 1,253 52,601 98%
a Output reported in thousands.
Source: Haber, Razo, and Maurer 2003; Colegio de Mexico, Estadisticas Historicas, p. 224.
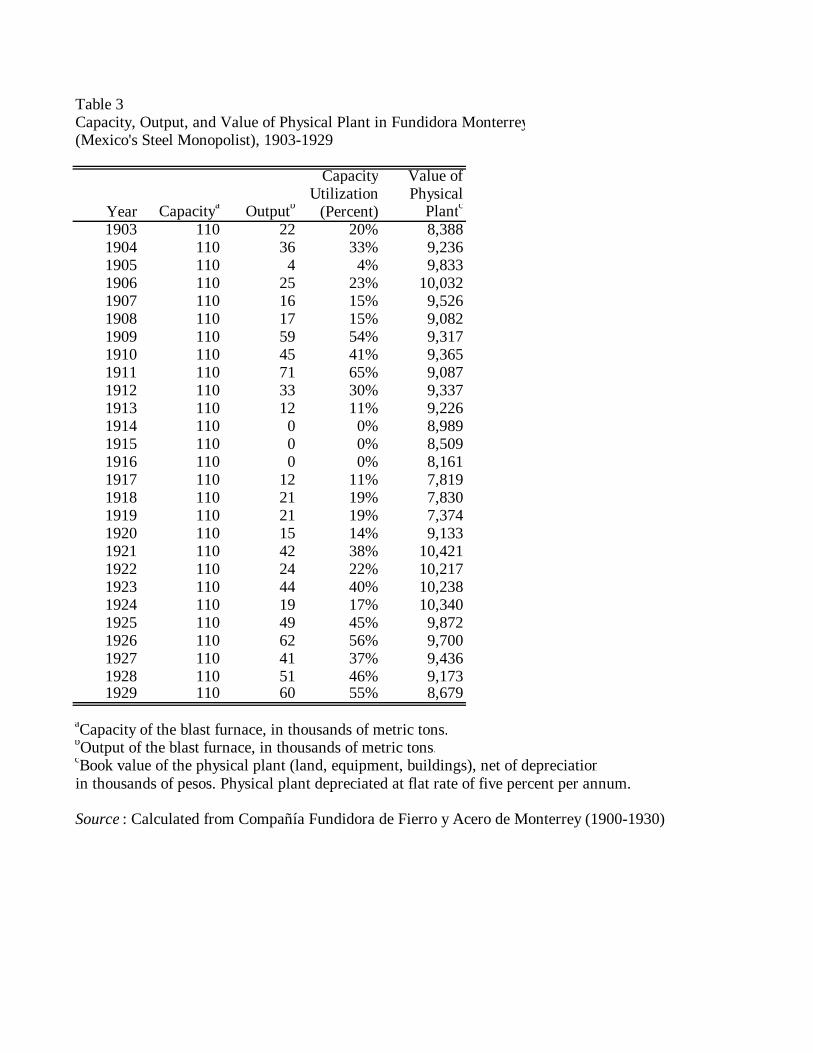
Table 3Capacity, Output, and Value of Physical Plant in Fundidora Monterrey(Mexico's Steel Monopolist), 1903-1929
Capacity Value of Utilization Physical
Year Capacitya Outputb (Percent) Plantc
1903 110 22 20% 8,3881904 110 36 33% 9,2361905 110 4 4% 9,8331906 110 25 23% 10,0321907 110 16 15% 9,5261908 110 17 15% 9,0821909 110 59 54% 9,3171910 110 45 41% 9,3651911 110 71 65% 9,0871912 110 33 30% 9,3371913 110 12 11% 9,2261914 110 0 0% 8,9891915 110 0 0% 8,5091916 110 0 0% 8,1611917 110 12 11% 7,8191918 110 21 19% 7,8301919 110 21 19% 7,3741920 110 15 14% 9,1331921 110 42 38% 10,4211922 110 24 22% 10,2171923 110 44 40% 10,2381924 110 19 17% 10,3401925 110 49 45% 9,8721926 110 62 56% 9,7001927 110 41 37% 9,4361928 110 51 46% 9,1731929 110 60 55% 8,679
aCapacity of the blast furnace, in thousands of metric tons.bOutput of the blast furnace, in thousands of metric tons.cBook value of the physical plant (land, equipment, buildings), net of depreciationin thousands of pesos. Physical plant depreciated at flat rate of five percent per annum.
Source : Calculated from Compañía Fundidora de Fierro y Acero de Monterrey (1900-1930).
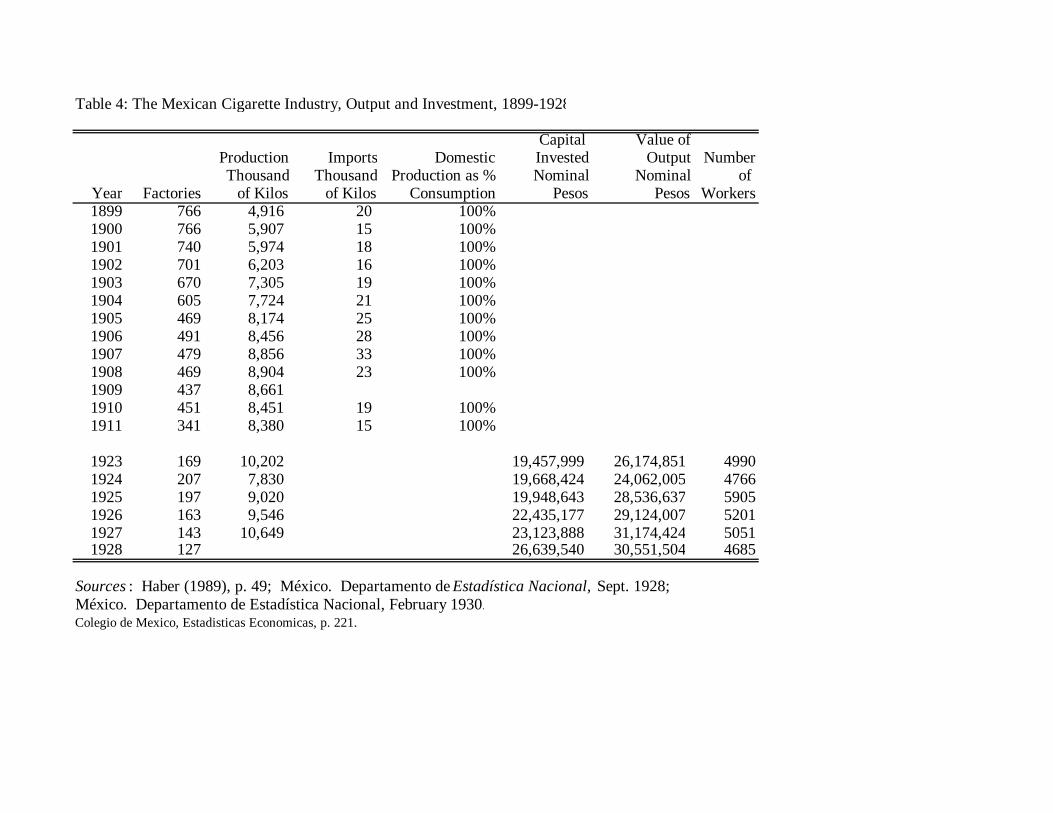
Table 4: The Mexican Cigarette Industry, Output and Investment, 1899-1928
Capital Value ofProduction Imports Domestic Invested Output NumberThousand Thousand Production as % Nominal Nominal of
Year Factories of Kilos of Kilos Consumption Pesos Pesos Workers1899 766 4,916 20 100%1900 766 5,907 15 100%1901 740 5,974 18 100%1902 701 6,203 16 100%1903 670 7,305 19 100%1904 605 7,724 21 100%1905 469 8,174 25 100%1906 491 8,456 28 100%1907 479 8,856 33 100%1908 469 8,904 23 100%1909 437 8,661 1910 451 8,451 19 100%1911 341 8,380 15 100%
1923 169 10,202 19,457,999 26,174,851 49901924 207 7,830 19,668,424 24,062,005 47661925 197 9,020 19,948,643 28,536,637 59051926 163 9,546 22,435,177 29,124,007 52011927 143 10,649 23,123,888 31,174,424 50511928 127 26,639,540 30,551,504 4685
Sources : Haber (1989), p. 49; México. Departamento de Estadística Nacional, Sept. 1928; México. Departamento de Estadística Nacional, February 1930.Colegio de Mexico, Estadisticas Economicas, p. 221.

Table 5Bottled Beer Production and Consumption in Mexico, 1891-1910
Beer Beer Total Cerveceria Estimated Imports Imports Imports Imports Imports Cuahtemoc National as % of as % of Barrelled Bottled Production Production Cuahtemoc National
Year 1000 KG 1000 KG 1000 KG 1000 KG 1000 KG Plus Imports Consumption
1888 309 1,885 2,194 1889 270 2,693 2,963 189018911892 339 1,991 2,330 1893 240 1,019 1,259 1894 273 906 1,179 1895 214 991 1,205 1896 166 895 1,061 1897 99 573 672 1898 222 531 753 1899 344 491 835 1900 473 579 1,052 4,866 17,379 18% 6%1901 497 704 1,201 4,685 16,732 20% 7%1902 448 644 1,092 5,581 19,932 16% 5%1903 419 778 1,197 5,925 21,161 17% 5%1904 454 691 1,145 6,865 24,518 14% 4%1905 59 641 700 8,884 31,729 7% 2%1906 109 716 825 13,344 47,657 6% 2%1907 96 678 774 14,005 50,018 5% 2%1908 11,183 39,939 1909 29 518 547 11,582 41,364 5% 1%1910 29 531 560 13,275 47,411 4% 1%
1. Cuahtemoc production converted from liters to kilosat one kilo per liter.
Source: Haber, Razo, and Maurer 2003, p. 163;Colegio de Mexico, Estadisticas Economicas, p. 207-08.
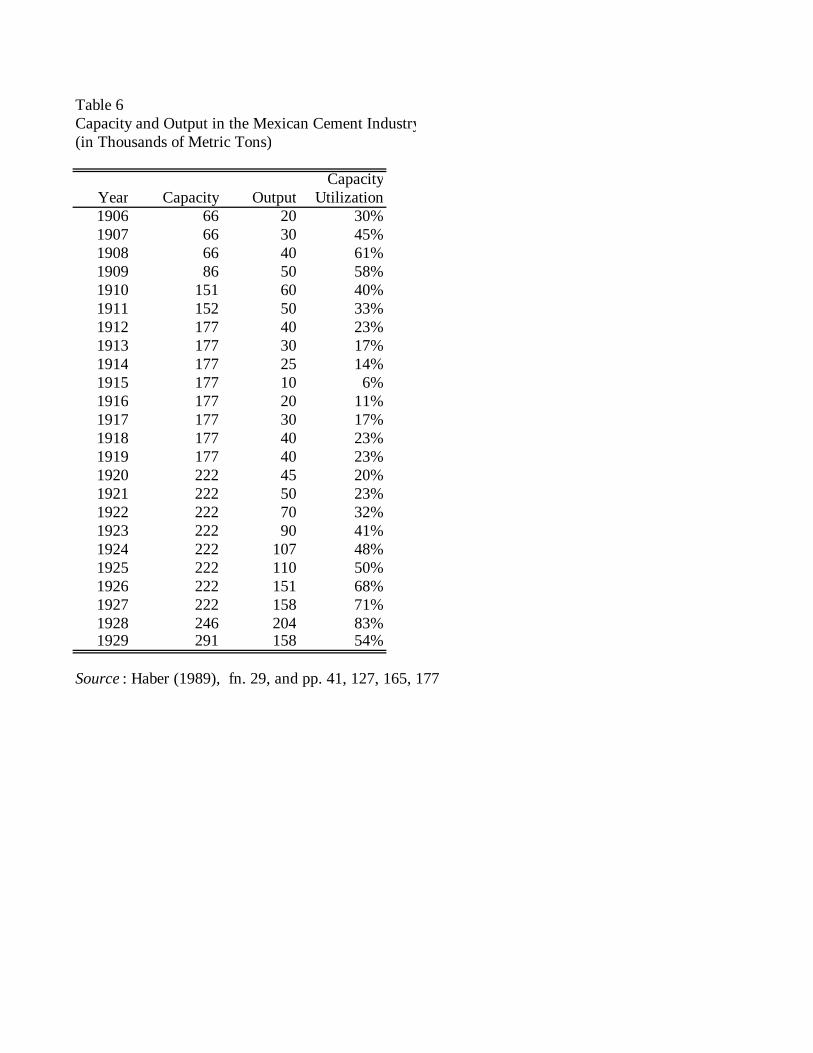
Table 6Capacity and Output in the Mexican Cement Industry(in Thousands of Metric Tons)
CapacityYear Capacity Output Utilization1906 66 20 30%1907 66 30 45%1908 66 40 61%1909 86 50 58%1910 151 60 40%1911 152 50 33%1912 177 40 23%1913 177 30 17%1914 177 25 14%1915 177 10 6%1916 177 20 11%1917 177 30 17%1918 177 40 23%1919 177 40 23%1920 222 45 20%1921 222 50 23%1922 222 70 32%1923 222 90 41%1924 222 107 48%1925 222 110 50%1926 222 151 68%1927 222 158 71%1928 246 204 83%1929 291 158 54%
Source : Haber (1989), fn. 29, and pp. 41, 127, 165, 177.
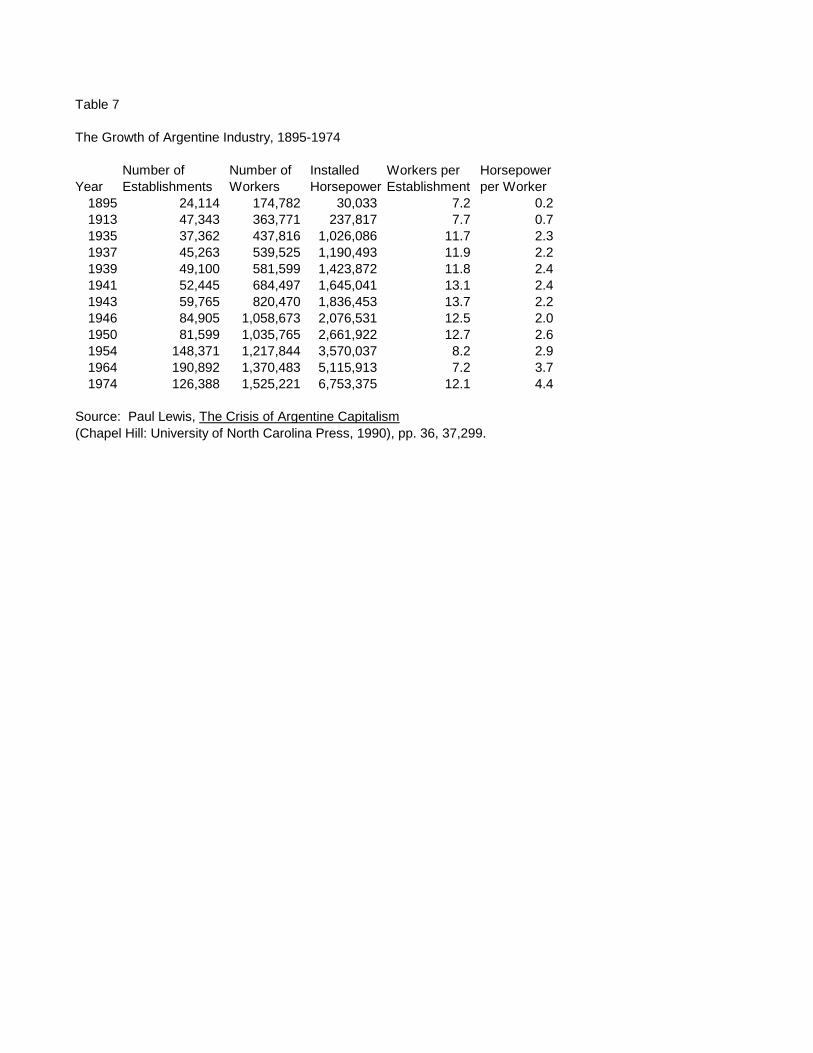
Table 7
The Growth of Argentine Industry, 1895-1974
Number of Number of Installed Workers per HorsepowerYear Establishments Workers Horsepower Establishment per Worker
1895 24,114 174,782 30,033 7.2 0.2 1913 47,343 363,771 237,817 7.7 0.7 1935 37,362 437,816 1,026,086 11.7 2.3 1937 45,263 539,525 1,190,493 11.9 2.2 1939 49,100 581,599 1,423,872 11.8 2.4 1941 52,445 684,497 1,645,041 13.1 2.4 1943 59,765 820,470 1,836,453 13.7 2.2 1946 84,905 1,058,673 2,076,531 12.5 2.0 1950 81,599 1,035,765 2,661,922 12.7 2.6 1954 148,371 1,217,844 3,570,037 8.2 2.9 1964 190,892 1,370,483 5,115,913 7.2 3.7 1974 126,388 1,525,221 6,753,375 12.1 4.4
Source: Paul Lewis, The Crisis of Argentine Capitalism(Chapel Hill: University of North Carolina Press, 1990), pp. 36, 37,299.
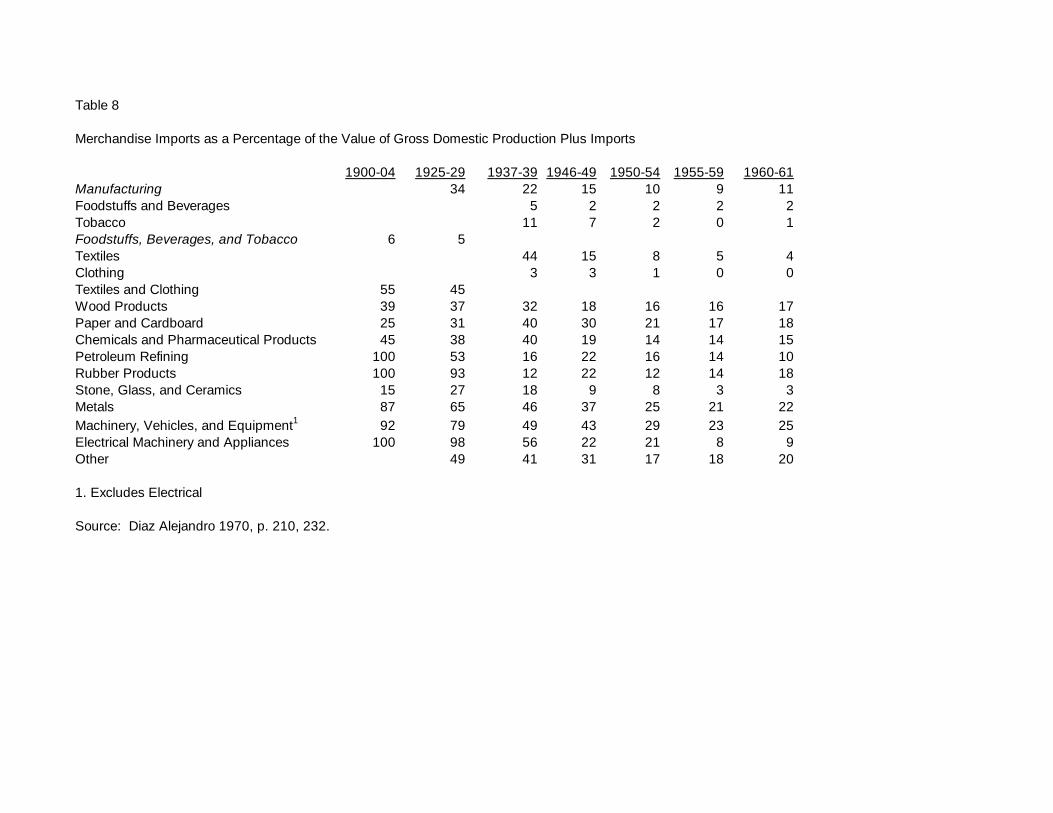
Table 8
Merchandise Imports as a Percentage of the Value of Gross Domestic Production Plus Imports
1900-04 1925-29 1937-39 1946-49 1950-54 1955-59 1960-61Manufacturing 34 22 15 10 9 11Foodstuffs and Beverages 5 2 2 2 2Tobacco 11 7 2 0 1Foodstuffs, Beverages, and Tobacco 6 5Textiles 44 15 8 5 4Clothing 3 3 1 0 0Textiles and Clothing 55 45Wood Products 39 37 32 18 16 16 17Paper and Cardboard 25 31 40 30 21 17 18Chemicals and Pharmaceutical Products 45 38 40 19 14 14 15Petroleum Refining 100 53 16 22 16 14 10Rubber Products 100 93 12 22 12 14 18Stone, Glass, and Ceramics 15 27 18 9 8 3 3Metals 87 65 46 37 25 21 22Machinery, Vehicles, and Equipment1 92 79 49 43 29 23 25Electrical Machinery and Appliances 100 98 56 22 21 8 9Other 49 41 31 17 18 20
1. Excludes Electrical
Source: Diaz Alejandro 1970, p. 210, 232.
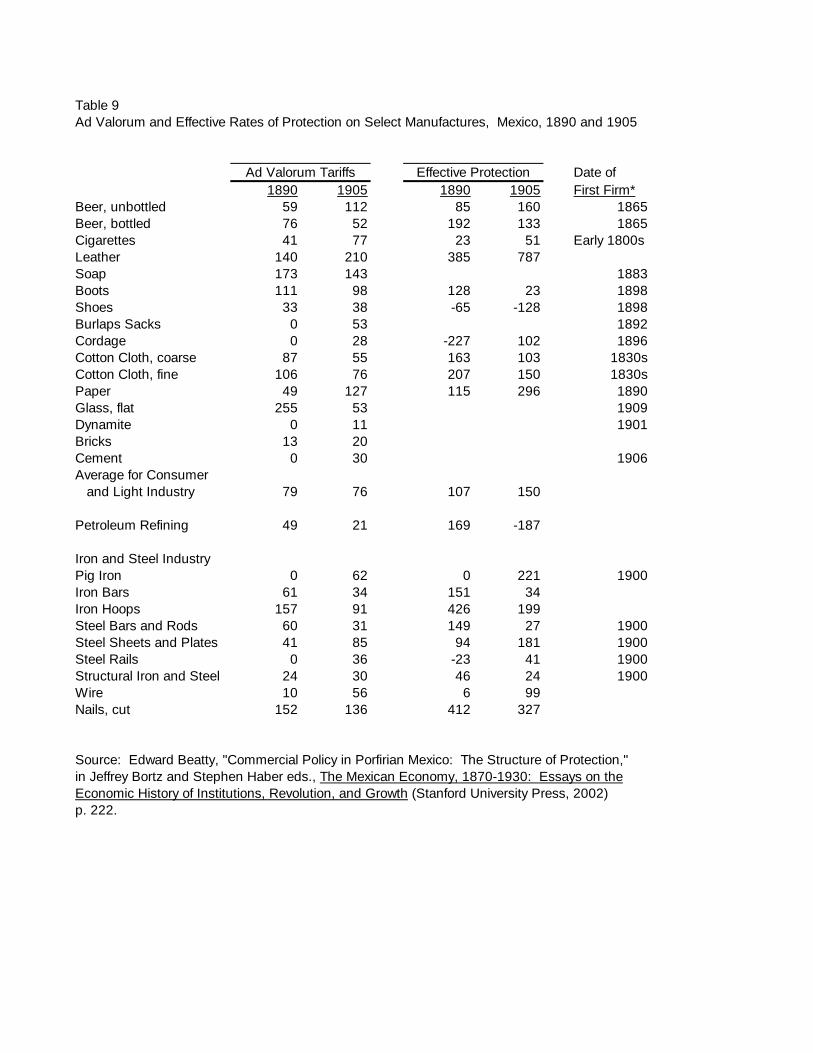
Table 9Ad Valorum and Effective Rates of Protection on Select Manufactures, Mexico, 1890 and 1905
Date of1890 1905 1890 1905 First Firm*
Beer, unbottled 59 112 85 160 1865Beer, bottled 76 52 192 133 1865Cigarettes 41 77 23 51 Early 1800sLeather 140 210 385 787Soap 173 143 1883Boots 111 98 128 23 1898Shoes 33 38 -65 -128 1898Burlaps Sacks 0 53 1892Cordage 0 28 -227 102 1896Cotton Cloth, coarse 87 55 163 103 1830sCotton Cloth, fine 106 76 207 150 1830sPaper 49 127 115 296 1890Glass, flat 255 53 1909Dynamite 0 11 1901Bricks 13 20Cement 0 30 1906Average for Consumer and Light Industry 79 76 107 150
Petroleum Refining 49 21 169 -187
Iron and Steel IndustryPig Iron 0 62 0 221 1900Iron Bars 61 34 151 34Iron Hoops 157 91 426 199Steel Bars and Rods 60 31 149 27 1900Steel Sheets and Plates 41 85 94 181 1900Steel Rails 0 36 -23 41 1900Structural Iron and Steel 24 30 46 24 1900Wire 10 56 6 99Nails, cut 152 136 412 327
Source: Edward Beatty, "Commercial Policy in Porfirian Mexico: The Structure of Protection,"in Jeffrey Bortz and Stephen Haber eds., The Mexican Economy, 1870-1930: Essays on theEconomic History of Institutions, Revolution, and Growth (Stanford University Press, 2002)p. 222.
Ad Valorum Tariffs Effective Protection
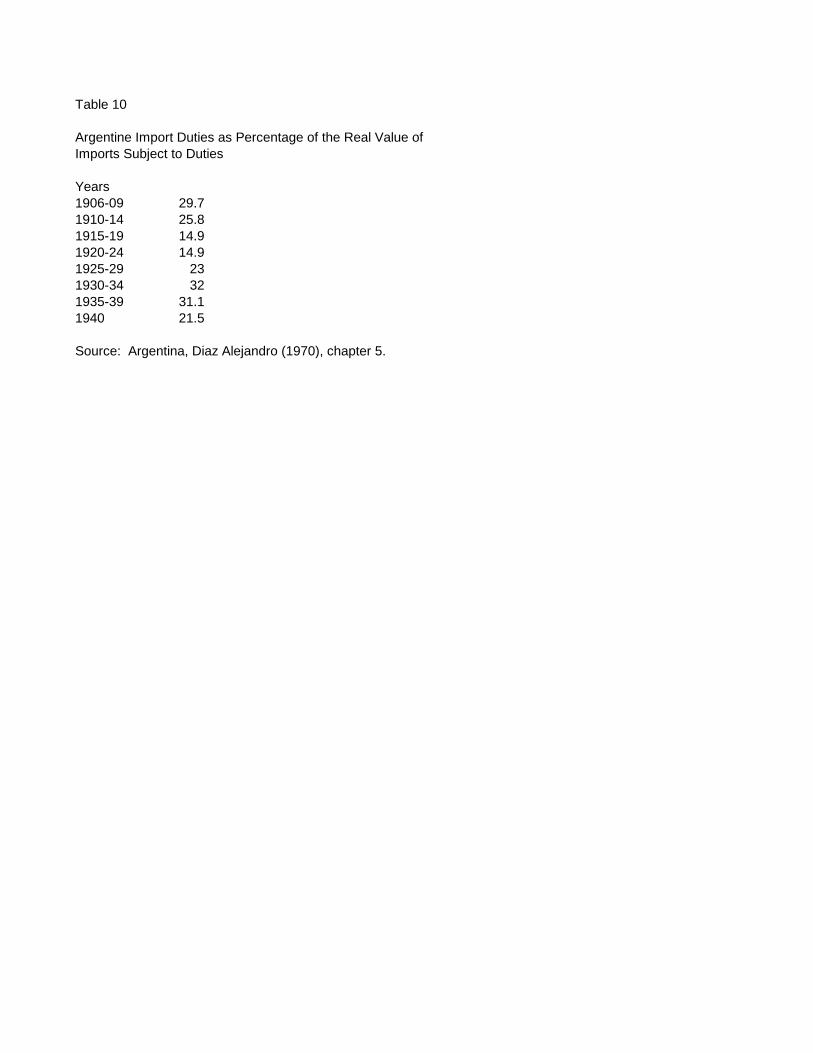
Table 10
Argentine Import Duties as Percentage of the Real Value ofImports Subject to Duties
Years1906-09 29.71910-14 25.81915-19 14.91920-24 14.91925-29 231930-34 321935-39 31.11940 21.5
Source: Argentina, Diaz Alejandro (1970), chapter 5.
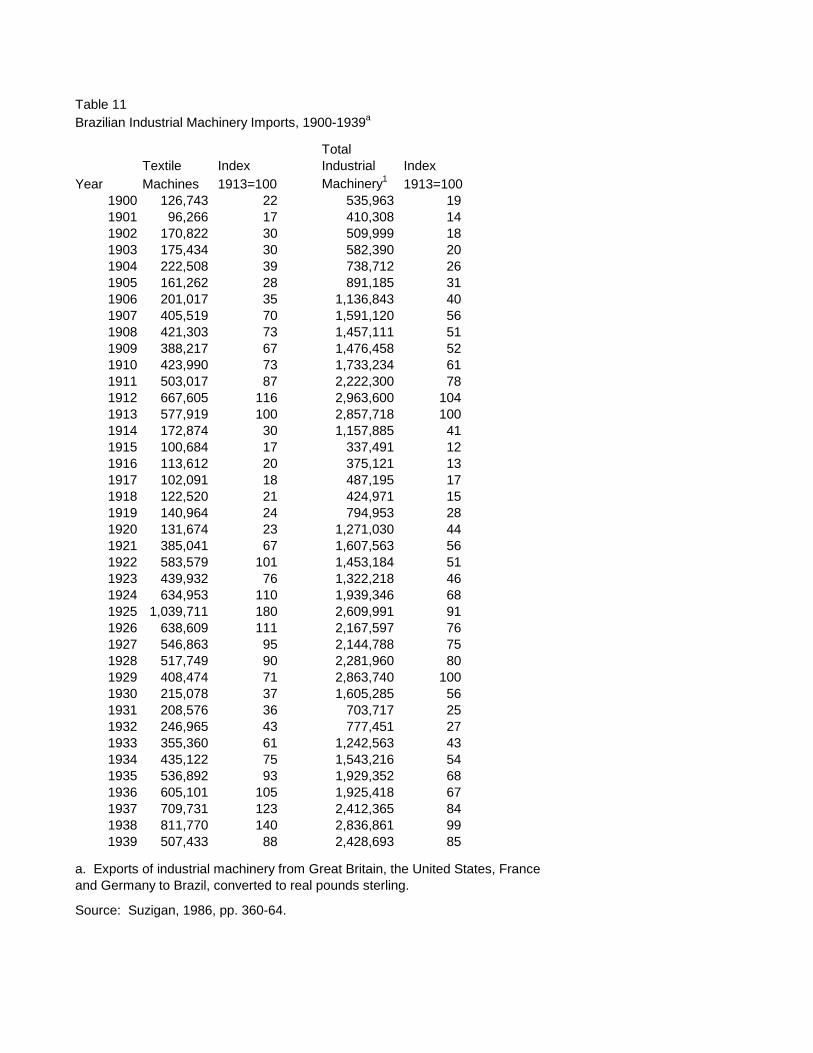
Table 11Brazilian Industrial Machinery Imports, 1900-1939a
TotalTextile Index Industrial Index
Year Machines 1913=100 Machinery1 1913=1001900 126,743 22 535,963 19 1901 96,266 17 410,308 14 1902 170,822 30 509,999 18 1903 175,434 30 582,390 20 1904 222,508 39 738,712 26 1905 161,262 28 891,185 31 1906 201,017 35 1,136,843 40 1907 405,519 70 1,591,120 56 1908 421,303 73 1,457,111 51 1909 388,217 67 1,476,458 52 1910 423,990 73 1,733,234 61 1911 503,017 87 2,222,300 78 1912 667,605 116 2,963,600 104 1913 577,919 100 2,857,718 100 1914 172,874 30 1,157,885 41 1915 100,684 17 337,491 12 1916 113,612 20 375,121 13 1917 102,091 18 487,195 17 1918 122,520 21 424,971 15 1919 140,964 24 794,953 28 1920 131,674 23 1,271,030 44 1921 385,041 67 1,607,563 56 1922 583,579 101 1,453,184 51 1923 439,932 76 1,322,218 46 1924 634,953 110 1,939,346 68 1925 1,039,711 180 2,609,991 91 1926 638,609 111 2,167,597 76 1927 546,863 95 2,144,788 75 1928 517,749 90 2,281,960 80 1929 408,474 71 2,863,740 100 1930 215,078 37 1,605,285 56 1931 208,576 36 703,717 25 1932 246,965 43 777,451 27 1933 355,360 61 1,242,563 43 1934 435,122 75 1,543,216 54 1935 536,892 93 1,929,352 68 1936 605,101 105 1,925,418 67 1937 709,731 123 2,412,365 84 1938 811,770 140 2,836,861 99 1939 507,433 88 2,428,693 85
a. Exports of industrial machinery from Great Britain, the United States, Franceand Germany to Brazil, converted to real pounds sterling.
Source: Suzigan, 1986, pp. 360-64.
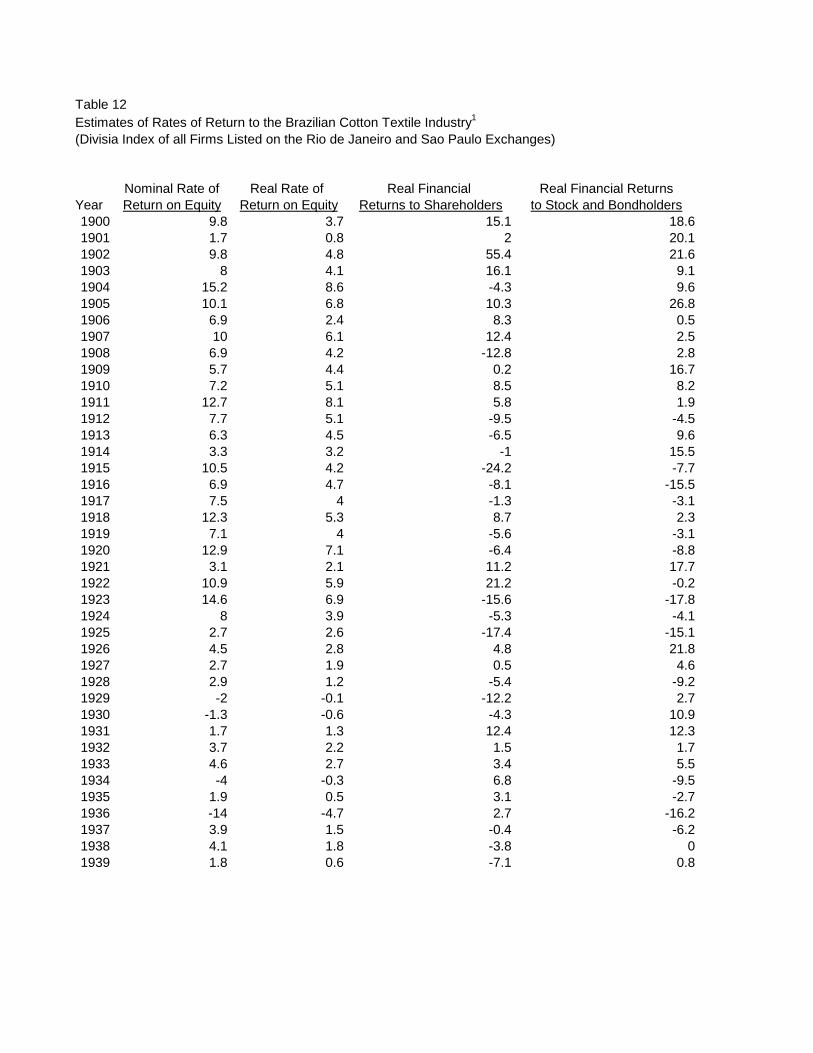
Table 12Estimates of Rates of Return to the Brazilian Cotton Textile Industry1
(Divisia Index of all Firms Listed on the Rio de Janeiro and Sao Paulo Exchanges)
Nominal Rate of Real Rate of Real Financial Real Financial ReturnsYear Return on Equity Return on Equity Returns to Shareholders to Stock and Bondholders1900 9.8 3.7 15.1 18.61901 1.7 0.8 2 20.11902 9.8 4.8 55.4 21.61903 8 4.1 16.1 9.11904 15.2 8.6 -4.3 9.61905 10.1 6.8 10.3 26.81906 6.9 2.4 8.3 0.51907 10 6.1 12.4 2.51908 6.9 4.2 -12.8 2.81909 5.7 4.4 0.2 16.71910 7.2 5.1 8.5 8.21911 12.7 8.1 5.8 1.91912 7.7 5.1 -9.5 -4.51913 6.3 4.5 -6.5 9.61914 3.3 3.2 -1 15.51915 10.5 4.2 -24.2 -7.71916 6.9 4.7 -8.1 -15.51917 7.5 4 -1.3 -3.11918 12.3 5.3 8.7 2.31919 7.1 4 -5.6 -3.11920 12.9 7.1 -6.4 -8.81921 3.1 2.1 11.2 17.71922 10.9 5.9 21.2 -0.21923 14.6 6.9 -15.6 -17.81924 8 3.9 -5.3 -4.11925 2.7 2.6 -17.4 -15.11926 4.5 2.8 4.8 21.81927 2.7 1.9 0.5 4.61928 2.9 1.2 -5.4 -9.21929 -2 -0.1 -12.2 2.71930 -1.3 -0.6 -4.3 10.91931 1.7 1.3 12.4 12.31932 3.7 2.2 1.5 1.71933 4.6 2.7 3.4 5.51934 -4 -0.3 6.8 -9.51935 1.9 0.5 3.1 -2.71936 -14 -4.7 2.7 -16.21937 3.9 1.5 -0.4 -6.21938 4.1 1.8 -3.8 01939 1.8 0.6 -7.1 0.8
Table 12 Continued
1. The nominal and real rate of return on owner’s equity treat profits as the book value of income owned by shareholders divided by the book value of capital owned by shareholders. Income is calculated as dividends plus directors fees plus changes in reserve accounts. Capital is measured as the value of reserve accounts plus the par value of outstanding shares. Real financial returns to stockholders and real financial returns to stock and bondholders treat profits as the market value of financial returns to stockholders or to stock and bondholders divided by the market value of those investments. In calculating financial profits to shareholders, income is measured as changes in the real market value of stock plus real dividends, and capital is measured as the real market value of stock. In calculating financial profits to stock and bondholders, we assume that investors hold a portfolio of stocks and bonds (weighted by their market capitalization).
Sources: Calculated from data in Jornal do Commercio and O Estado de Sao Paulo.
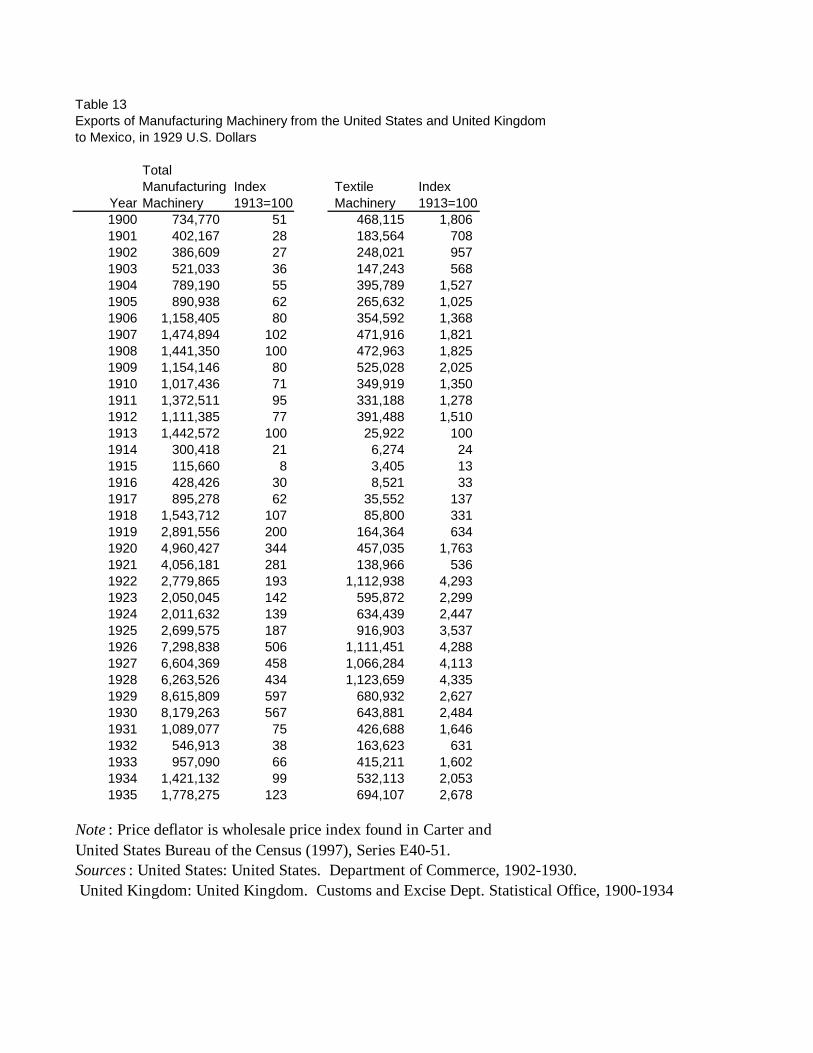
Table 13Exports of Manufacturing Machinery from the United States and United Kingdomto Mexico, in 1929 U.S. Dollars
TotalManufacturing Index Textile Index
Year Machinery 1913=100 Machinery 1913=1001900 734,770 51 468,115 1,806 1901 402,167 28 183,564 708 1902 386,609 27 248,021 957 1903 521,033 36 147,243 568 1904 789,190 55 395,789 1,527 1905 890,938 62 265,632 1,025 1906 1,158,405 80 354,592 1,368 1907 1,474,894 102 471,916 1,821 1908 1,441,350 100 472,963 1,825 1909 1,154,146 80 525,028 2,025 1910 1,017,436 71 349,919 1,350 1911 1,372,511 95 331,188 1,278 1912 1,111,385 77 391,488 1,510 1913 1,442,572 100 25,922 100 1914 300,418 21 6,274 24 1915 115,660 8 3,405 13 1916 428,426 30 8,521 33 1917 895,278 62 35,552 137 1918 1,543,712 107 85,800 331 1919 2,891,556 200 164,364 634 1920 4,960,427 344 457,035 1,763 1921 4,056,181 281 138,966 536 1922 2,779,865 193 1,112,938 4,293 1923 2,050,045 142 595,872 2,299 1924 2,011,632 139 634,439 2,447 1925 2,699,575 187 916,903 3,537 1926 7,298,838 506 1,111,451 4,288 1927 6,604,369 458 1,066,284 4,113 1928 6,263,526 434 1,123,659 4,335 1929 8,615,809 597 680,932 2,627 1930 8,179,263 567 643,881 2,484 1931 1,089,077 75 426,688 1,646 1932 546,913 38 163,623 631 1933 957,090 66 415,211 1,602 1934 1,421,132 99 532,113 2,053 1935 1,778,275 123 694,107 2,678
Note : Price deflator is wholesale price index found in Carter andUnited States Bureau of the Census (1997), Series E40-51.Sources : United States: United States. Department of Commerce, 1902-1930. United Kingdom: United Kingdom. Customs and Excise Dept. Statistical Office, 1900-1934

Table 14Domestic Output as Percent ot Total Consumption, Brazilian Steel Industry
As % of As % of As % ofYear Tons Consumption Tons Consumption Tons Consumption1920 14,065 67 0 01921 17,747 94 0 01922 17,783 85 0 01923 25,187 83 0 01924 25,035 60 4,492 38 01925 30,046 72 7,559 54 283 01926 21,299 57 9,875 62 10,501 41927 15,353 87 8,205 56 16,638 41928 25,761 91 21,390 74 26,227 51929 33,707 88 26,842 75 29,898 61930 35,505 95 20,985 85 25,895 101931 28,114 98 23,130 93 18,892 131932 28,809 97 34,192 94 29,547 181933 46,774 98 53,567 95 42,369 151934 58,559 99 61,675 94 48,699 141935 64,082 99 64,231 93 52,358 151936 78,419 98 73,667 92 62,946 161937 98,101 99 76,430 89 71,419 141938 122,352 99 92,420 91 85,666 241939 160,016 100 114,095 94 100,996 241940 185,570 100 141,201 96 135,293 31
Source: Baer (1969), p. 61.
Pig Iron Production Steel Ingot Production Rolled Steel Products

Table 15Output and Consumption of Dynamite, Mexico, 1918-1929
Output Consumption ProductionThousands of Thousands as Percent
Year Kilograms of Kilograms of Consumption1918 301,644 285,519 106%1919 776,223 585,711 133%1920 646,698 741,114 87%1921 706,709 565,004 125%1922 571,604 647,242 88%1923 586,573 633,362 93%1924 535,747 721,428 74%1925 1,221,870 1,202,653 102%1926 1,424,524 1,463,975 97%1927 3,182,704 3,072,732 104%1928 4,766,470 4,671,643 102%1929 5,759,625 5,620,138 102%
Source: Haber, Razo, and Maurer 2003.

Table 16Power Generated by the Mexican Light and Power Company for Commercial Purposes
(in Thousands of Kilowatt Hours)
Thousands of IndexYear Kilowatt Hours (1910=100)1907 45,779 801908 44,061 771909 47,074 821910 57,112 1001911 59,244 1041912 67,565 1181913 62,117 1091914 56,274 991915 39,096 681916 42,888 751917 67,062 1171918 72,901 1281919 82,212 1441920 91,145 1601921 88,379 1551922 103,111 1811923 113,704 1991924 125,424 2201925 144,230 2531926 166,483 2921927 178,089 312
aDoes not include municipal lighting.Source: Haber, Razo, and Maurer (2003).
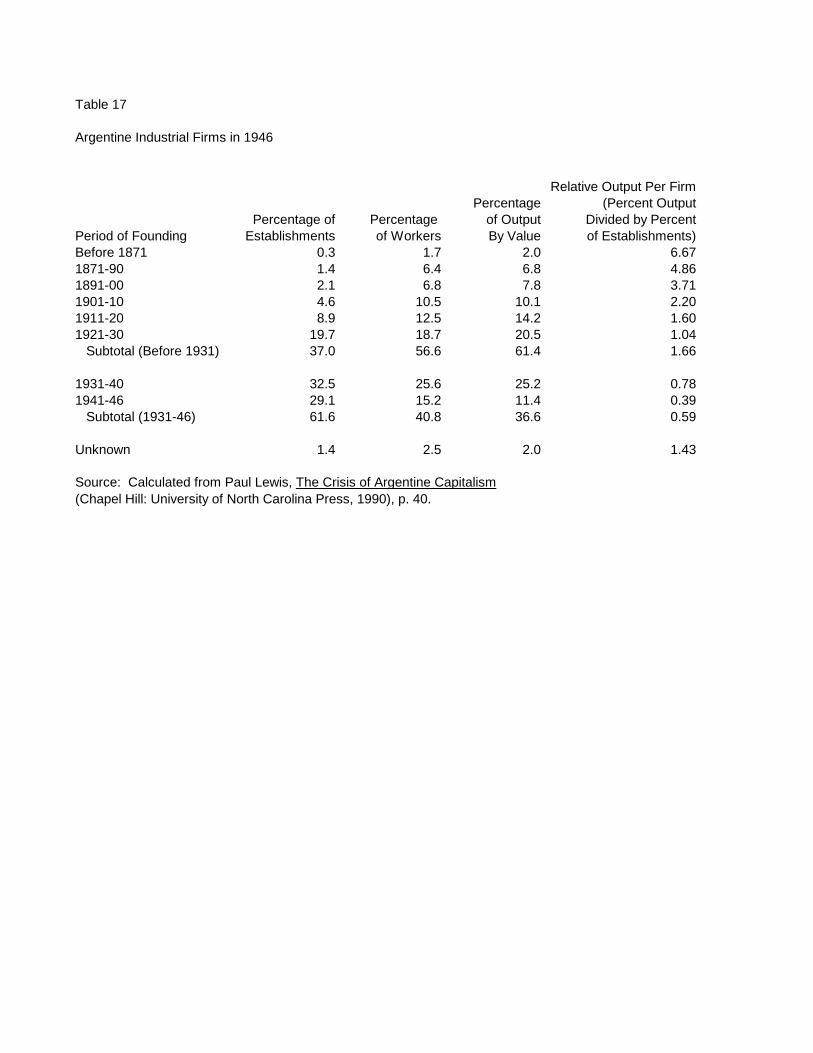
Table 17
Argentine Industrial Firms in 1946
Relative Output Per FirmPercentage (Percent Output
Percentage of Percentage of Output Divided by PercentPeriod of Founding Establishments of Workers By Value of Establishments)Before 1871 0.3 1.7 2.0 6.671871-90 1.4 6.4 6.8 4.861891-00 2.1 6.8 7.8 3.711901-10 4.6 10.5 10.1 2.201911-20 8.9 12.5 14.2 1.601921-30 19.7 18.7 20.5 1.04 Subtotal (Before 1931) 37.0 56.6 61.4 1.66
1931-40 32.5 25.6 25.2 0.781941-46 29.1 15.2 11.4 0.39 Subtotal (1931-46) 61.6 40.8 36.6 0.59
Unknown 1.4 2.5 2.0 1.43
Source: Calculated from Paul Lewis, The Crisis of Argentine Capitalism(Chapel Hill: University of North Carolina Press, 1990), p. 40.
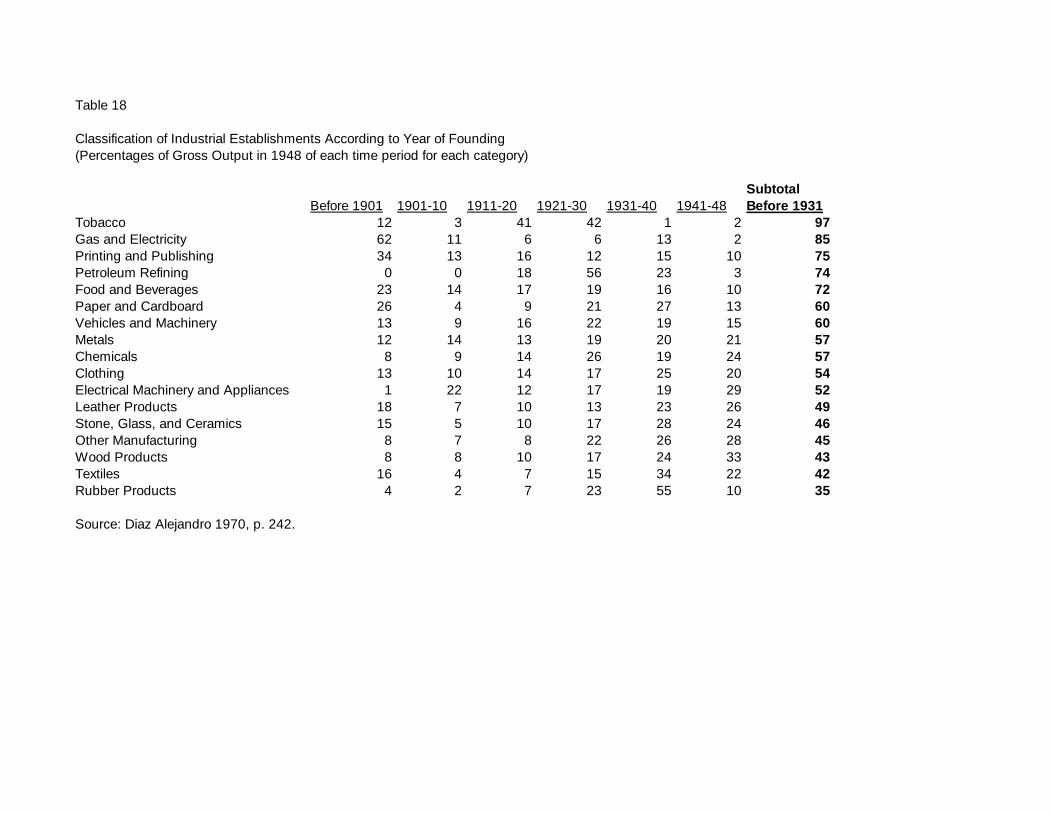
Table 18
Classification of Industrial Establishments According to Year of Founding(Percentages of Gross Output in 1948 of each time period for each category)
SubtotalBefore 1901 1901-10 1911-20 1921-30 1931-40 1941-48 Before 1931
Tobacco 12 3 41 42 1 2 97Gas and Electricity 62 11 6 6 13 2 85Printing and Publishing 34 13 16 12 15 10 75Petroleum Refining 0 0 18 56 23 3 74Food and Beverages 23 14 17 19 16 10 72Paper and Cardboard 26 4 9 21 27 13 60Vehicles and Machinery 13 9 16 22 19 15 60Metals 12 14 13 19 20 21 57Chemicals 8 9 14 26 19 24 57Clothing 13 10 14 17 25 20 54Electrical Machinery and Appliances 1 22 12 17 19 29 52Leather Products 18 7 10 13 23 26 49Stone, Glass, and Ceramics 15 5 10 17 28 24 46Other Manufacturing 8 7 8 22 26 28 45Wood Products 8 8 10 17 24 33 43Textiles 16 4 7 15 34 22 42Rubber Products 4 2 7 23 55 10 35
Source: Diaz Alejandro 1970, p. 242.
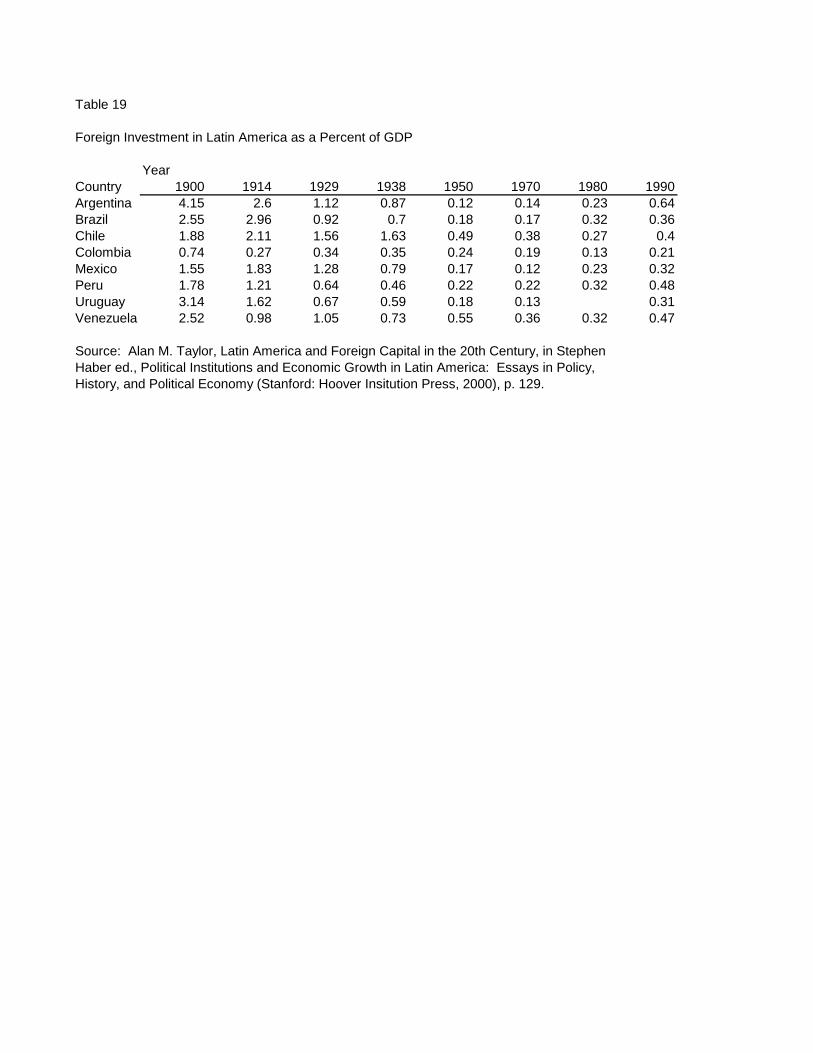
Table 19
Foreign Investment in Latin America as a Percent of GDP
YearCountry 1900 1914 1929 1938 1950 1970 1980 1990Argentina 4.15 2.6 1.12 0.87 0.12 0.14 0.23 0.64Brazil 2.55 2.96 0.92 0.7 0.18 0.17 0.32 0.36Chile 1.88 2.11 1.56 1.63 0.49 0.38 0.27 0.4Colombia 0.74 0.27 0.34 0.35 0.24 0.19 0.13 0.21Mexico 1.55 1.83 1.28 0.79 0.17 0.12 0.23 0.32Peru 1.78 1.21 0.64 0.46 0.22 0.22 0.32 0.48Uruguay 3.14 1.62 0.67 0.59 0.18 0.13 0.31Venezuela 2.52 0.98 1.05 0.73 0.55 0.36 0.32 0.47
Source: Alan M. Taylor, Latin America and Foreign Capital in the 20th Century, in StephenHaber ed., Political Institutions and Economic Growth in Latin America: Essays in Policy,History, and Political Economy (Stanford: Hoover Insitution Press, 2000), p. 129.
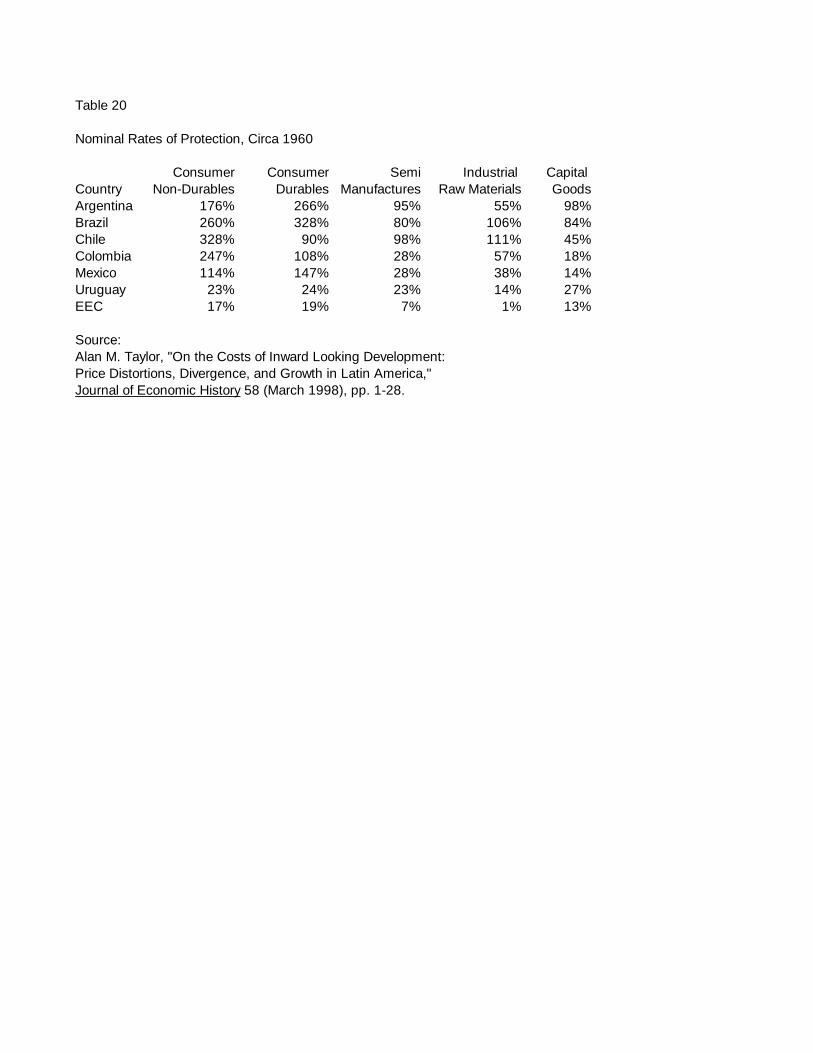
Table 20
Nominal Rates of Protection, Circa 1960
Consumer Consumer Semi Industrial Capital Country Non-Durables Durables Manufactures Raw Materials GoodsArgentina 176% 266% 95% 55% 98%Brazil 260% 328% 80% 106% 84%Chile 328% 90% 98% 111% 45%Colombia 247% 108% 28% 57% 18%Mexico 114% 147% 28% 38% 14%Uruguay 23% 24% 23% 14% 27%EEC 17% 19% 7% 1% 13%
Source:Alan M. Taylor, "On the Costs of Inward Looking Development: Price Distortions, Divergence, and Growth in Latin America," Journal of Economic History 58 (March 1998), pp. 1-28.

Table 21
Indices of Gross Output per Employed Worker in Traditional Branchesof Argentine Manufacturing (includes owners and family members)
Foodstuffs & Wood Leather All Year Beverages Tobacco Textiles Clothing Products Products Manufacturing
1937 117 90 99 138 161 86 1231939 121 99 103 137 140 108 1251943 100 100 100 100 100 100 1001946 86 111 108 100 109 88 931950 102 128 92 144 145 92 1181957 121 182 86 122 170 86 146
Source: Diaz Alejandro 1970.


![05 razo[1]](https://img.pdfslide.net/doc/110x75/55a404cf1a28ab16068b46c0/05-razo1.jpg)