Embed Size (px)
Citation preview

Startel Soft Switch Dashboard
User’s Guide

While every attempt is made to ensure both accuracy and completeness of information included in this document, errors can occur, and updates or improvements may be implemented without notice. For these reasons, Startel cannot accept responsibility for the complete accuracy of this data.
Microsoft, Windows, Windows 7, Windows XP Professional, Windows 2008 Server, SQL Server 2008, Microsoft Internet Information Ser-vices (IIS) are copyrights, trademarks, or registered trademarks of Microsoft Corporation.
All other brand and product names are trademarks or registered trademarks of their respective holders.
Part Number: 15-1545-078
© Copyright 2013 by Startel Corporation
The information contained herein is proprietary to, and considered a trade secret of, Startel Corporation, and shall not be reproduced, transmitted, transcribed, or stored in any retrieval system in any form or by any means, electronic, mechanical, magnetic, optical, chemi-cal, manual, or otherwise, without the express written permission of Startel Corporation, 16 Goodyear, Bldg. B # 125, Irvine, California 92618, U.S.A.
Revision Date: October 22, 2013
Table of Contents
Startel Soft Switch Dashboard ............................................................................ 5
Startel Soft Switch Dashboard System Requirements........................................ 6
What is the Startel Soft Switch Dashboard? ....................................................... 7
Logging into the Dashboard................................................................................ 8
Understanding the Dashboard Window .............................................................. 9
Graph Bars ................................................................................................... 10
Avg and Peak Bar Colors & Threshold Values .........................................10
Changing the Dashboard Display Mode....................................................... 11
The “Switch Traffic” Display Panel ............................................................... 12
The System Graph ...................................................................................13
Viewing Graph Details ..............................................................................13
The “Agent Activity” Display Panel ............................................................... 15
Using “Right Click” Column Options .........................................................16
Filtering in the Agent Activity Panel ..........................................................16
Using the Dashboard Feature Bar .................................................................... 18
Managing Dashboard Profiles........................................................................... 20
What is a Dashboard Profile?....................................................................... 21
Saving Changes to a Dashboard Profile ...................................................... 21
Saving Changes as a New Dashboard Profile ............................................. 22
Opening a Different Dashboard Profile......................................................... 22
Using Features in the Profiles Dialog Box .................................................... 23
3

Startel Soft Switch Dashboard User’s Guide
Editing Dashboard Group Parameters .....................................................26
Exiting the Dashboard....................................................................................... 28
Index ................................................................................................................. 29
4
Startel Soft Switch Dashboard
This document provides you with basic information on how to use the Startel Soft Switch Dashboard.
Sections include:
Startel Soft Switch Dashboard System Requirements (page 6)
What is the Startel Soft Switch Dashboard? (page 7)
Logging into the Dashboard (page 8)
Understanding the Dashboard Window (page 9)
Using the Dashboard Feature Bar (page 18)
Managing Dashboard Profiles (page 20)
Exiting the Dashboard (page 28)
5
Startel Soft Switch Dashboard User’s Guide
STARTEL SOFT SWITCH DASHBOARD SYSTEM REQUIREMENTS Startel Soft Switch 1.0.5, build 1016 or higher
VManager version 0.1.29 or higher
Startel CMC 11.1 or higher
Internet Browser (Mozilla Firefox; Google Chrome; Internet Explorer 9.0 or higher)
Dashboard Web Server Requirements: IIS 7
NET framework version 4 (such as asp.net v4.0 or asp.net v4.0 Classic) as application pool
Windows 2008 or higher
NOTE: In the interest of reducing UDP traffic on your network, Startel recommends that the “Disable SAM Broadcast” option be selected for agents in the Agent Maintenance Options element.
6
Startel Soft Switch Dashboard User’s Guide
WHAT IS THE STARTEL SOFT SWITCH DASHBOARD?The Startel Soft Switch Dashboard is a web-based application that allows you to monitor and assess Startel Soft Switch activity and agent call/workstation activity in real time.
Using “the Dashboard,” it’s possible to see and quickly evaluate call status and statistics not only for your site, but for call queues and individual agents.
At a glance, the Dashboard answers questions like:
How many callers are speaking to agents?
How many callers are on Hold?
What is the average length of time callers have been waiting to speak to an agent?
How long has a particular agent been speaking to a caller?
How does one group of agents compare to another group of agents?
When you view the Startel Soft Switch Dashboard, it displays Startel activity based on parameters that are defined by Startel technicians upon installation. But you can change these parameters any time you like.
In this manual, you will learn how to both interpret Dashboard data, and customize Dashboard parameters.
7
Startel Soft Switch Dashboard User’s Guide
LOGGING INTO THE DASHBOARDYou will access the Startel Soft Switch Dashboard using a URL provided to you by a Startel technician, or site administrator.
To log into the Dashboard, you need a Username and Password. If you have not been provided with a Username and Password, contact your site administrator.
Follow these steps to login to the Startel Soft Switch Dashboard:
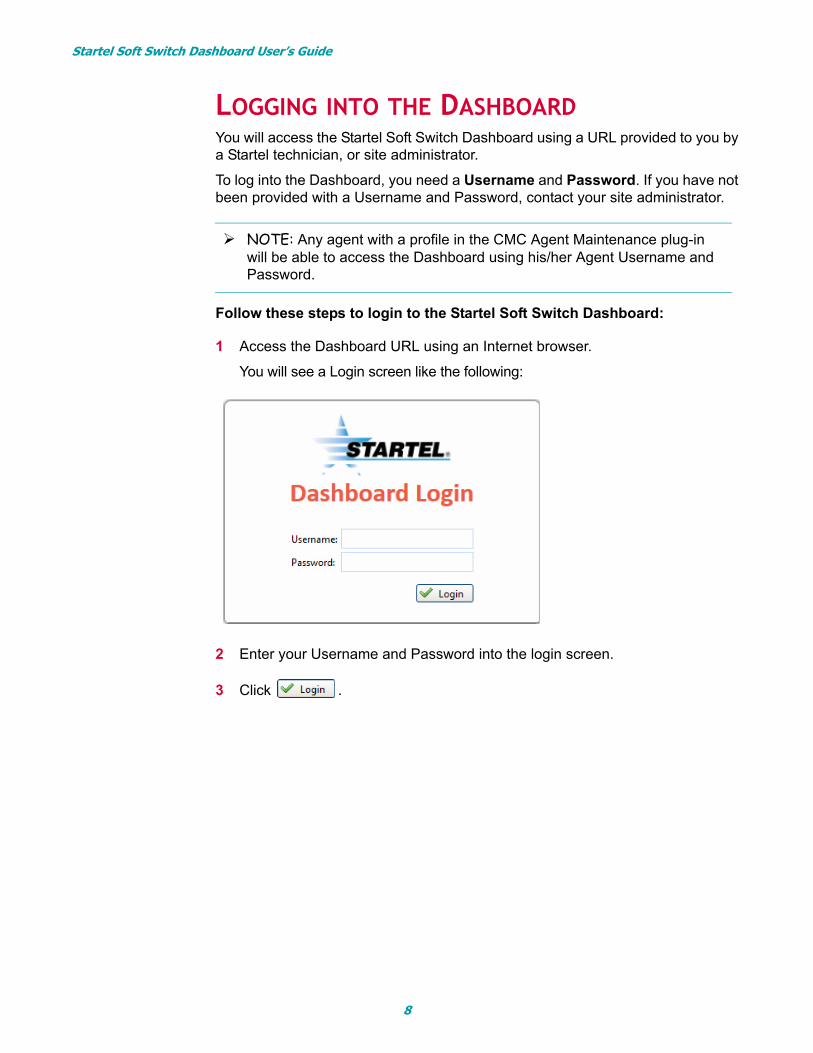
1 Access the Dashboard URL using an Internet browser.
You will see a Login screen like the following:
2 Enter your Username and Password into the login screen.
3 Click .
NOTE: Any agent with a profile in the CMC Agent Maintenance plug-in will be able to access the Dashboard using his/her Agent Username and Password.
8
Startel Soft Switch Dashboard User’s Guide
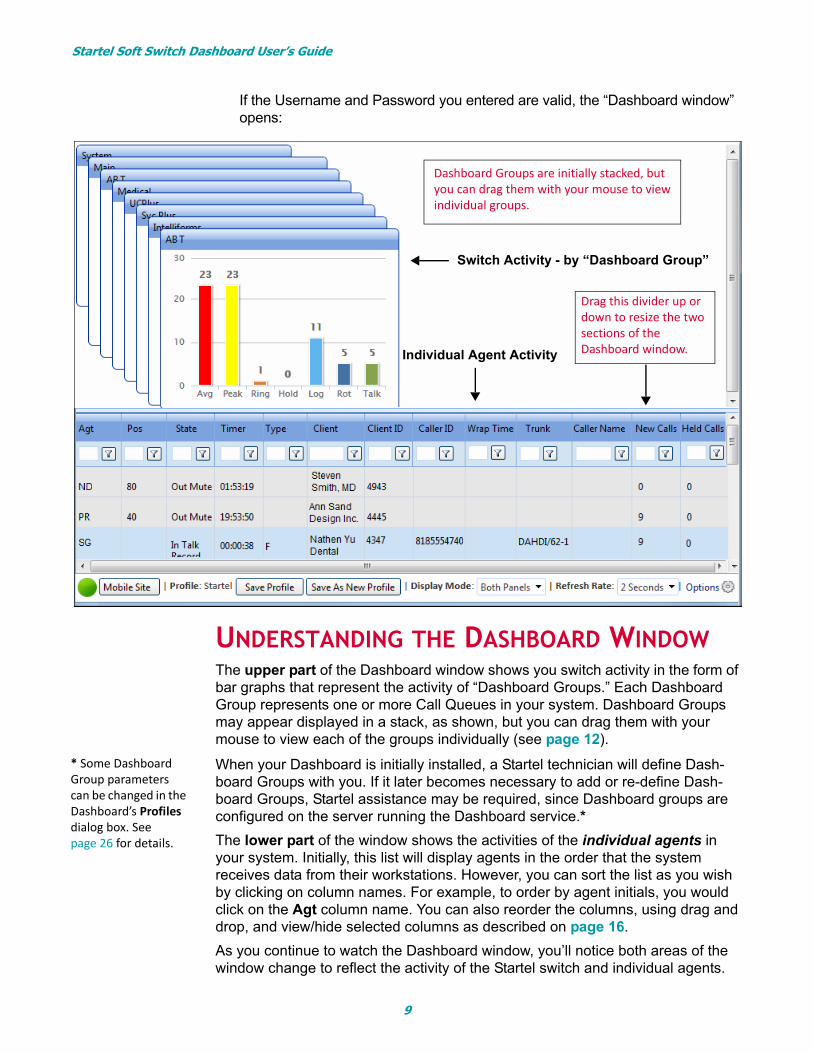
If the Username and Password you entered are valid, the “Dashboard window” opens:
UNDERSTANDING THE DASHBOARD WINDOWThe upper part of the Dashboard window shows you switch activity in the form of bar graphs that represent the activity of “Dashboard Groups.” Each Dashboard Group represents one or more Call Queues in your system. Dashboard Groups may appear displayed in a stack, as shown, but you can drag them with your mouse to view each of the groups individually (see page 12).
When your Dashboard is initially installed, a Startel technician will define Dash-board Groups with you. If it later becomes necessary to add or re-define Dash-board Groups, Startel assistance may be required, since Dashboard groups are configured on the server running the Dashboard service.*
The lower part of the window shows the activities of the individual agents in your system. Initially, this list will display agents in the order that the system receives data from their workstations. However, you can sort the list as you wish by clicking on column names. For example, to order by agent initials, you would click on the Agt column name. You can also reorder the columns, using drag and drop, and view/hide selected columns as described on page 16.
As you continue to watch the Dashboard window, you’ll notice both areas of the window change to reflect the activity of the Startel switch and individual agents.
Switch Activity - by “Dashboard Group”
Individual Agent Activity
Dashboard Groups are initially stacked, but you can drag them with your mouse to view individual groups.
Drag this divider up or down to resize the two sections of the Dashboard window.
* Some Dashboard Group parameters can be changed in the Dashboard’s Profiles dialog box. See page 26 for details.
9
Startel Soft Switch Dashboard User’s Guide
Graph Bars
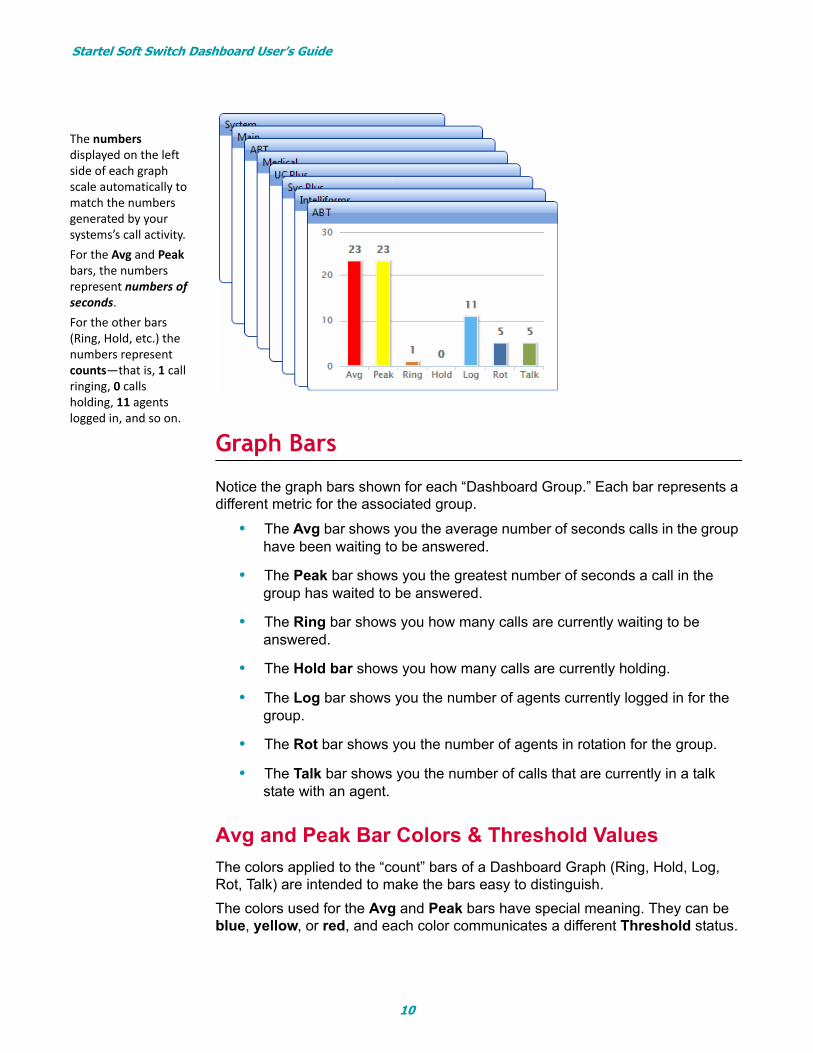
Notice the graph bars shown for each “Dashboard Group.” Each bar represents a different metric for the associated group.
• The Avg bar shows you the average number of seconds calls in the group have been waiting to be answered.
• The Peak bar shows you the greatest number of seconds a call in the group has waited to be answered.
• The Ring bar shows you how many calls are currently waiting to be answered.
• The Hold bar shows you how many calls are currently holding.
• The Log bar shows you the number of agents currently logged in for the group.
• The Rot bar shows you the number of agents in rotation for the group.
• The Talk bar shows you the number of calls that are currently in a talk state with an agent.
Avg and Peak Bar Colors & Threshold Values
The colors applied to the “count” bars of a Dashboard Graph (Ring, Hold, Log, Rot, Talk) are intended to make the bars easy to distinguish.
The colors used for the Avg and Peak bars have special meaning. They can be blue, yellow, or red, and each color communicates a different Threshold status.
The numbers displayed on the left side of each graph scale automatically to match the numbers generated by your systems’s call activity.For the Avg and Peak bars, the numbers represent numbers of seconds.For the other bars (Ring, Hold, etc.) the numbers represent counts—that is, 1 call ringing, 0 calls holding, 11 agents logged in, and so on.
10
Startel Soft Switch Dashboard User’s Guide
Though you can configure the Threshold times that trigger the colors, the colors have the same basic meaning in all systems.
• Red—which triggers when the second Threshold has been reached—indicates that maximum acceptable service times have been exceeded.
• Yellow—which triggers when the first Threshold has been reached—indicates that maximum acceptable service times are close to being exceeded.
• Blue—which appears when no Threshold has been reached—indicates that service levels are within the desired range.
Changing the Dashboard Display Mode
By default, the Startel Soft Switch Dashboard opens with a double Display Mode that shows switch activity in an upper panel, and agent activity in a lower panel.
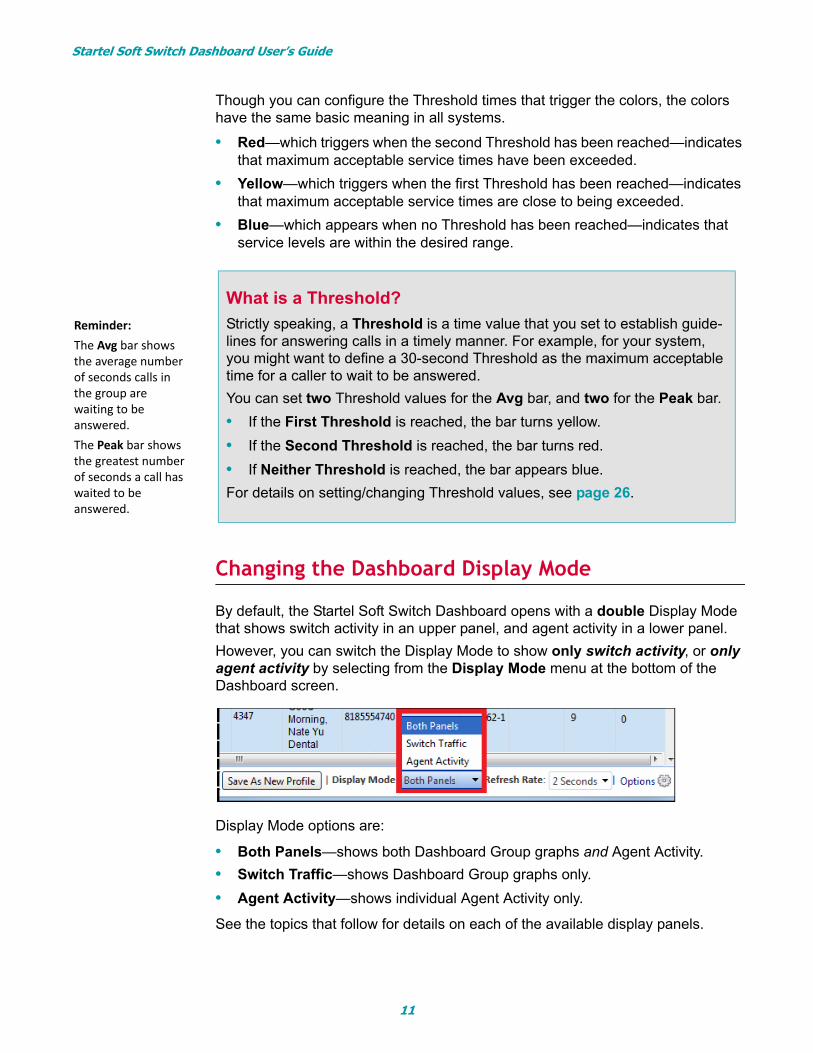
However, you can switch the Display Mode to show only switch activity, or only agent activity by selecting from the Display Mode menu at the bottom of the Dashboard screen.
Display Mode options are:
• Both Panels—shows both Dashboard Group graphs and Agent Activity.
• Switch Traffic—shows Dashboard Group graphs only.
• Agent Activity—shows individual Agent Activity only.
See the topics that follow for details on each of the available display panels.
What is a Threshold?
Strictly speaking, a Threshold is a time value that you set to establish guide-lines for answering calls in a timely manner. For example, for your system, you might want to define a 30-second Threshold as the maximum acceptable time for a caller to wait to be answered.
You can set two Threshold values for the Avg bar, and two for the Peak bar.
• If the First Threshold is reached, the bar turns yellow.
• If the Second Threshold is reached, the bar turns red.
• If Neither Threshold is reached, the bar appears blue.
For details on setting/changing Threshold values, see page 26.
Reminder: The Avg bar shows the average number of seconds calls in the group are waiting to be answered. The Peak bar shows the greatest number of seconds a call has waited to be answered.
11
Startel Soft Switch Dashboard User’s Guide
The “Switch Traffic” Display Panel
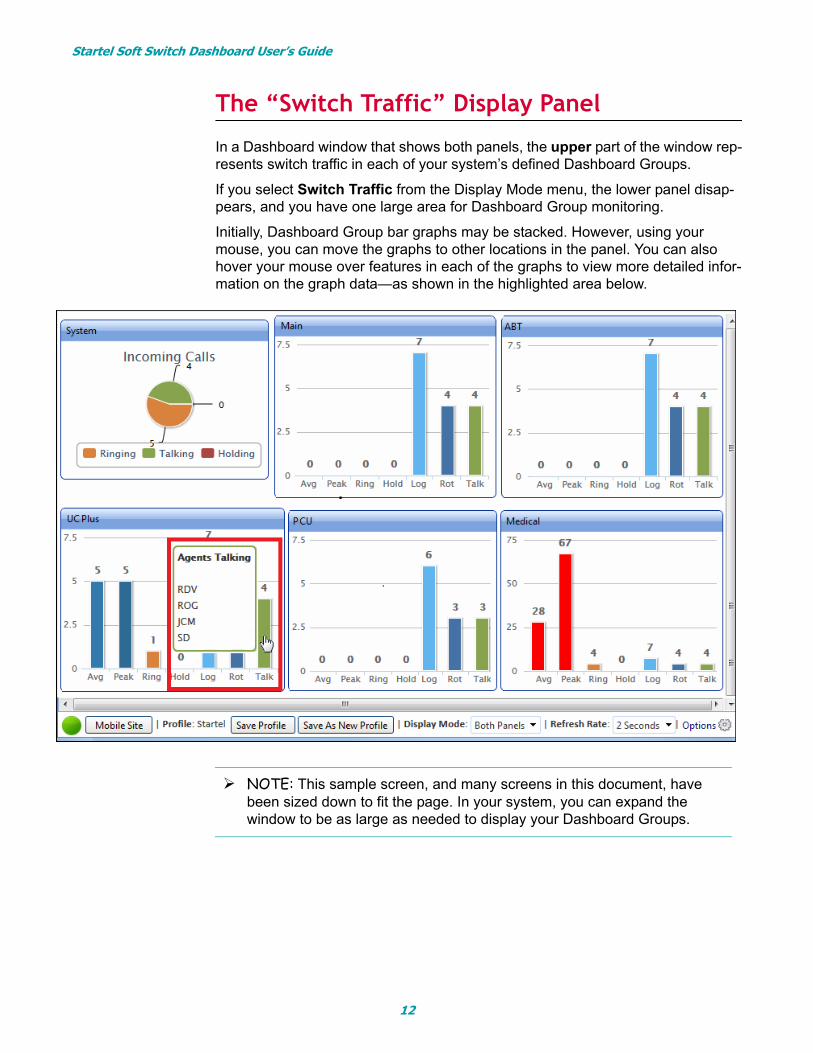
In a Dashboard window that shows both panels, the upper part of the window rep-resents switch traffic in each of your system’s defined Dashboard Groups.
If you select Switch Traffic from the Display Mode menu, the lower panel disap-pears, and you have one large area for Dashboard Group monitoring.
Initially, Dashboard Group bar graphs may be stacked. However, using your mouse, you can move the graphs to other locations in the panel. You can also hover your mouse over features in each of the graphs to view more detailed infor-mation on the graph data—as shown in the highlighted area below.
NOTE: This sample screen, and many screens in this document, have been sized down to fit the page. In your system, you can expand the window to be as large as needed to display your Dashboard Groups.
12
Startel Soft Switch Dashboard User’s Guide
The System Graph
Viewing Graph Details
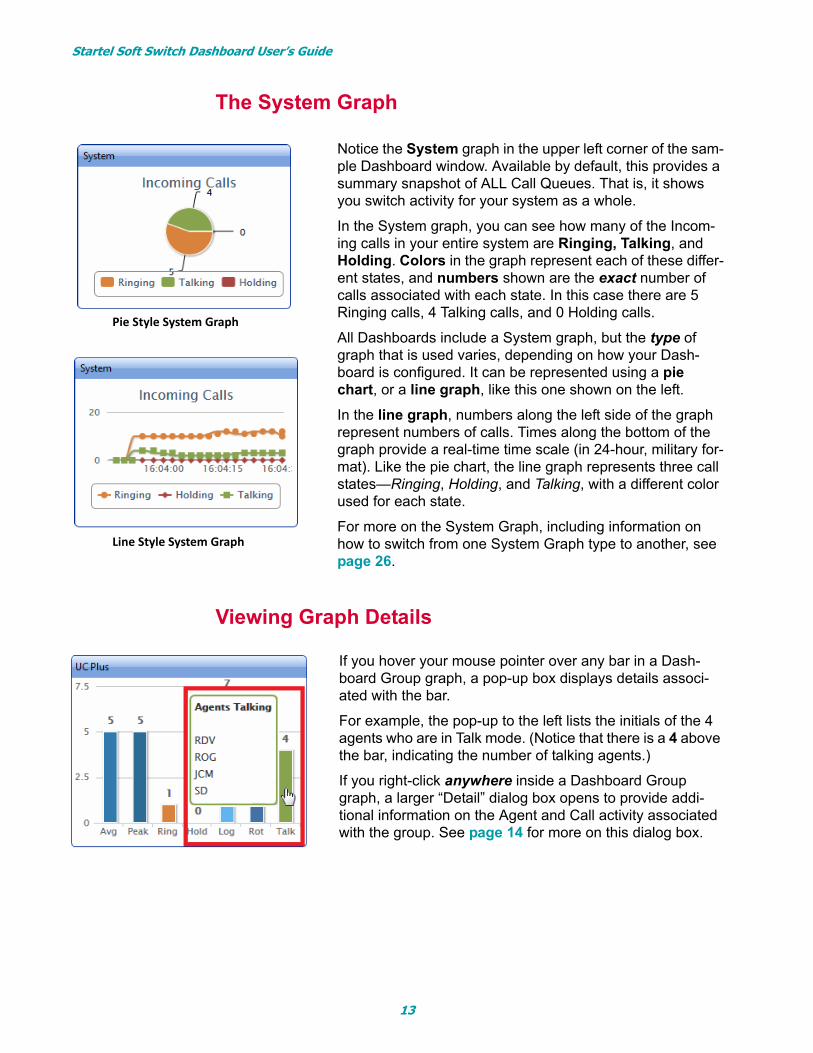
Notice the System graph in the upper left corner of the sam-ple Dashboard window. Available by default, this provides a summary snapshot of ALL Call Queues. That is, it shows you switch activity for your system as a whole.
In the System graph, you can see how many of the Incom-ing calls in your entire system are Ringing, Talking, and Holding. Colors in the graph represent each of these differ-ent states, and numbers shown are the exact number of calls associated with each state. In this case there are 5 Ringing calls, 4 Talking calls, and 0 Holding calls.
All Dashboards include a System graph, but the type of graph that is used varies, depending on how your Dash-board is configured. It can be represented using a pie chart, or a line graph, like this one shown on the left.
In the line graph, numbers along the left side of the graph represent numbers of calls. Times along the bottom of the graph provide a real-time time scale (in 24-hour, military for-mat). Like the pie chart, the line graph represents three call states—Ringing, Holding, and Talking, with a different color used for each state.
For more on the System Graph, including information on how to switch from one System Graph type to another, see page 26.
Pie Style System Graph
Line Style System Graph
If you hover your mouse pointer over any bar in a Dash-board Group graph, a pop-up box displays details associ-ated with the bar.
For example, the pop-up to the left lists the initials of the 4 agents who are in Talk mode. (Notice that there is a 4 above the bar, indicating the number of talking agents.)
If you right-click anywhere inside a Dashboard Group graph, a larger “Detail” dialog box opens to provide addi-tional information on the Agent and Call activity associated with the group. See page 14 for more on this dialog box.
13
Startel Soft Switch Dashboard User’s Guide
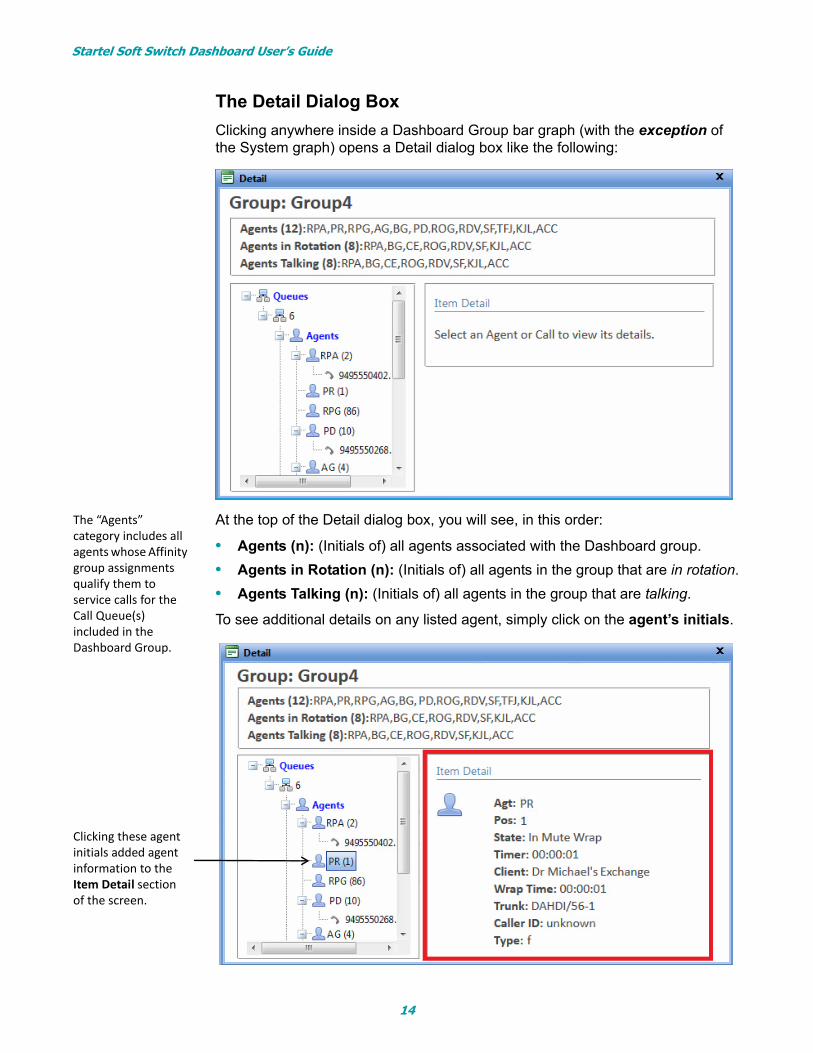
The Detail Dialog Box
Clicking anywhere inside a Dashboard Group bar graph (with the exception of the System graph) opens a Detail dialog box like the following:
At the top of the Detail dialog box, you will see, in this order:
• Agents (n): (Initials of) all agents associated with the Dashboard group.
• Agents in Rotation (n): (Initials of) all agents in the group that are in rotation.
• Agents Talking (n): (Initials of) all agents in the group that are talking.
To see additional details on any listed agent, simply click on the agent’s initials.
The “Agents” category includes all agents whose Affinity group assignments qualify them to service calls for the Call Queue(s) included in the Dashboard Group.
Clicking these agent initials added agent information to the Item Detail section of the screen.
14
Startel Soft Switch Dashboard User’s Guide
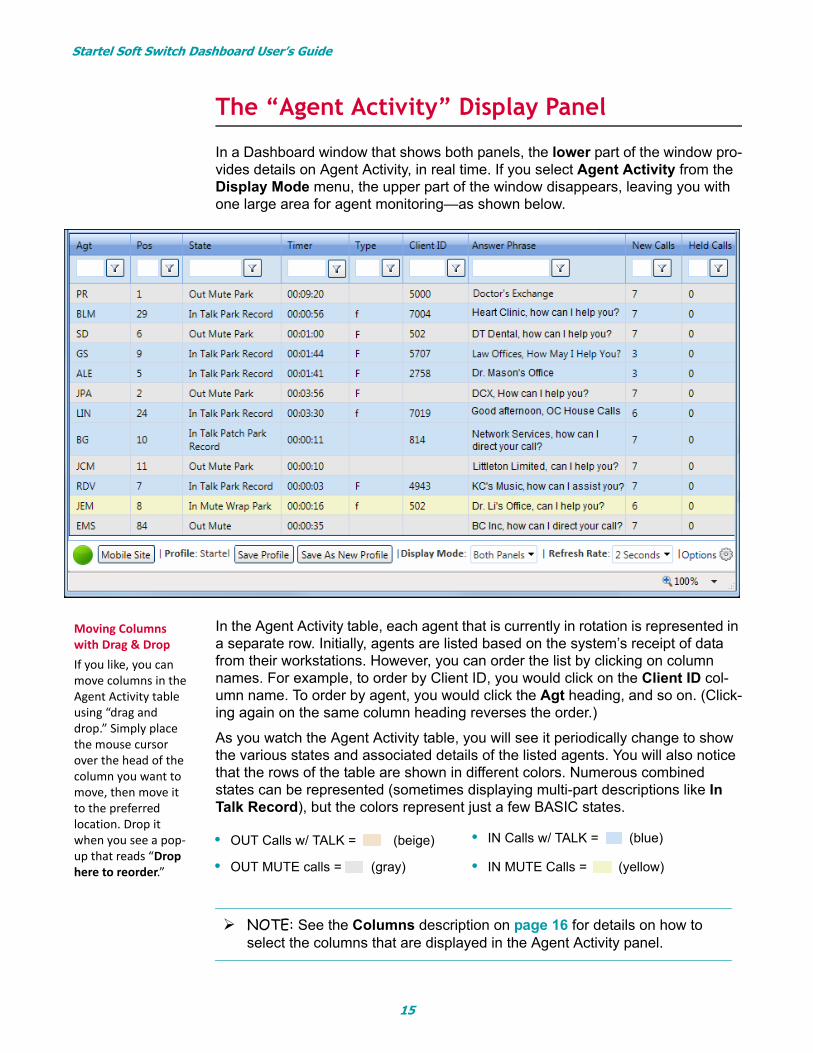
The “Agent Activity” Display Panel
In a Dashboard window that shows both panels, the lower part of the window pro-vides details on Agent Activity, in real time. If you select Agent Activity from the Display Mode menu, the upper part of the window disappears, leaving you with one large area for agent monitoring—as shown below.
In the Agent Activity table, each agent that is currently in rotation is represented in a separate row. Initially, agents are listed based on the system’s receipt of data from their workstations. However, you can order the list by clicking on column names. For example, to order by Client ID, you would click on the Client ID col-umn name. To order by agent, you would click the Agt heading, and so on. (Click-ing again on the same column heading reverses the order.)
As you watch the Agent Activity table, you will see it periodically change to show the various states and associated details of the listed agents. You will also notice that the rows of the table are shown in different colors. Numerous combined states can be represented (sometimes displaying multi-part descriptions like In Talk Record), but the colors represent just a few BASIC states.
• OUT Calls w/ TALK = (beige) • IN Calls w/ TALK = (blue)
• OUT MUTE calls = (gray) • IN MUTE Calls = (yellow)
NOTE: See the Columns description on page 16 for details on how to select the columns that are displayed in the Agent Activity panel.
Moving Columns with Drag & DropIf you like, you can move columns in the Agent Activity table using “drag and drop.” Simply place the mouse cursor over the head of the column you want to move, then move it to the preferred location. Drop it when you see a pop-up that reads “Drop here to reorder.”
15
Startel Soft Switch Dashboard User’s Guide
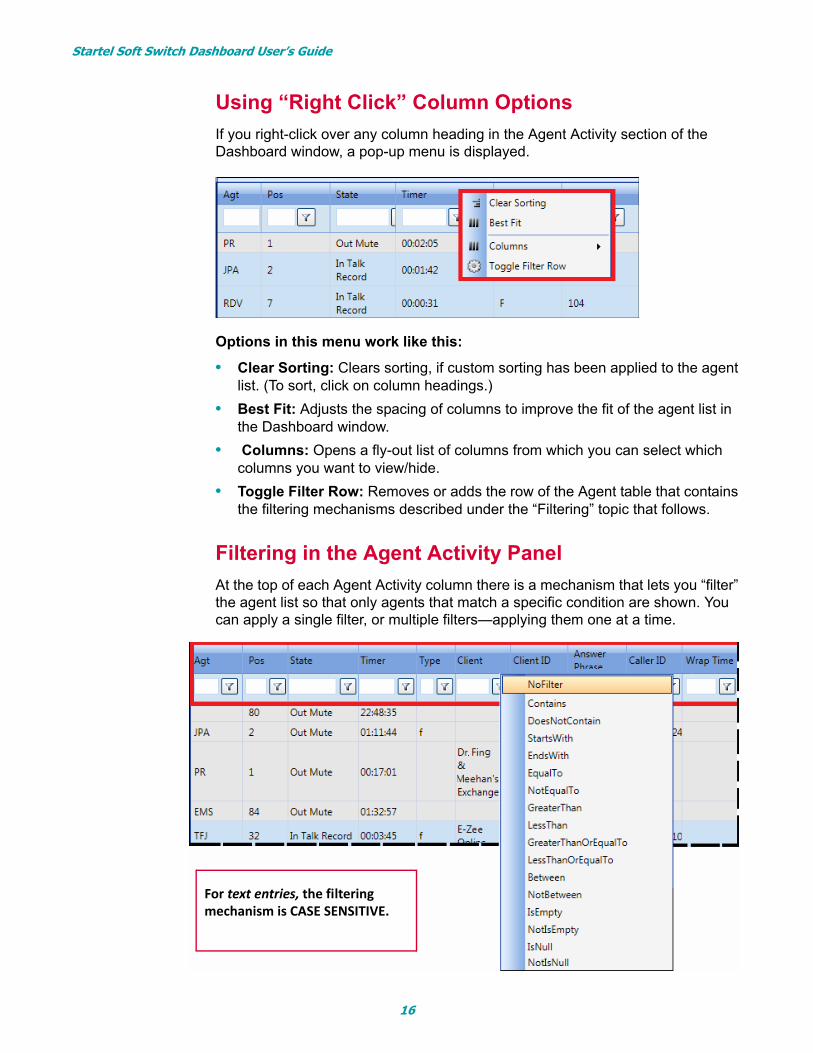
Using “Right Click” Column Options
If you right-click over any column heading in the Agent Activity section of the Dashboard window, a pop-up menu is displayed.
Options in this menu work like this:
• Clear Sorting: Clears sorting, if custom sorting has been applied to the agent list. (To sort, click on column headings.)
• Best Fit: Adjusts the spacing of columns to improve the fit of the agent list in the Dashboard window.
• Columns: Opens a fly-out list of columns from which you can select which columns you want to view/hide.
• Toggle Filter Row: Removes or adds the row of the Agent table that contains the filtering mechanisms described under the “Filtering” topic that follows.
Filtering in the Agent Activity Panel
At the top of each Agent Activity column there is a mechanism that lets you “filter” the agent list so that only agents that match a specific condition are shown. You can apply a single filter, or multiple filters—applying them one at a time.
For text entries, the filtering mechanism is CASE SENSITIVE.
16
Startel Soft Switch Dashboard User’s Guide
Using Agent Activity filters, you can do things like:
• Show only agents handling calls for clients that start with P.
• Show only agents handling calls for clients that start P with Timer values of greater than two minutes.
• Show only agents who are in the Out Mute state.
• Show only agents who are in the Out Mute state with Position numbers larger than 20.
....and so on.
Follow these steps to filter the agent list:
1 In the input field above the column by which you want to filter, enter the string for the filter you want to define. (For example, if you want to define a filter that selects agents whose initials start with T, enter T in the input field—and please note that letter case counts.)
2 Click the icon associated with the column by which you want to filter. Then select the appropriate filter option. (For example, choose Starts With if you want to define a filter that selects agents whose initials start with T.)
As soon as you select from the Filter menu, the list adjusts to reflect the filter.
3 If you want to apply an additional filter to the displayed list, repeat steps 1 and 2—then repeat the steps again if you want to apply another filter. And so on.
4 If you want to clear any filter, click the icon and select No Filter.
NOTES:
When you save a Dashboard Profile, filters are saved as part of the profile.
To toggle the row containing the filter feature on and off, right click over any column heading and select Toggle Filter Row from the pop-up menu.
17
Startel Soft Switch Dashboard User’s Guide
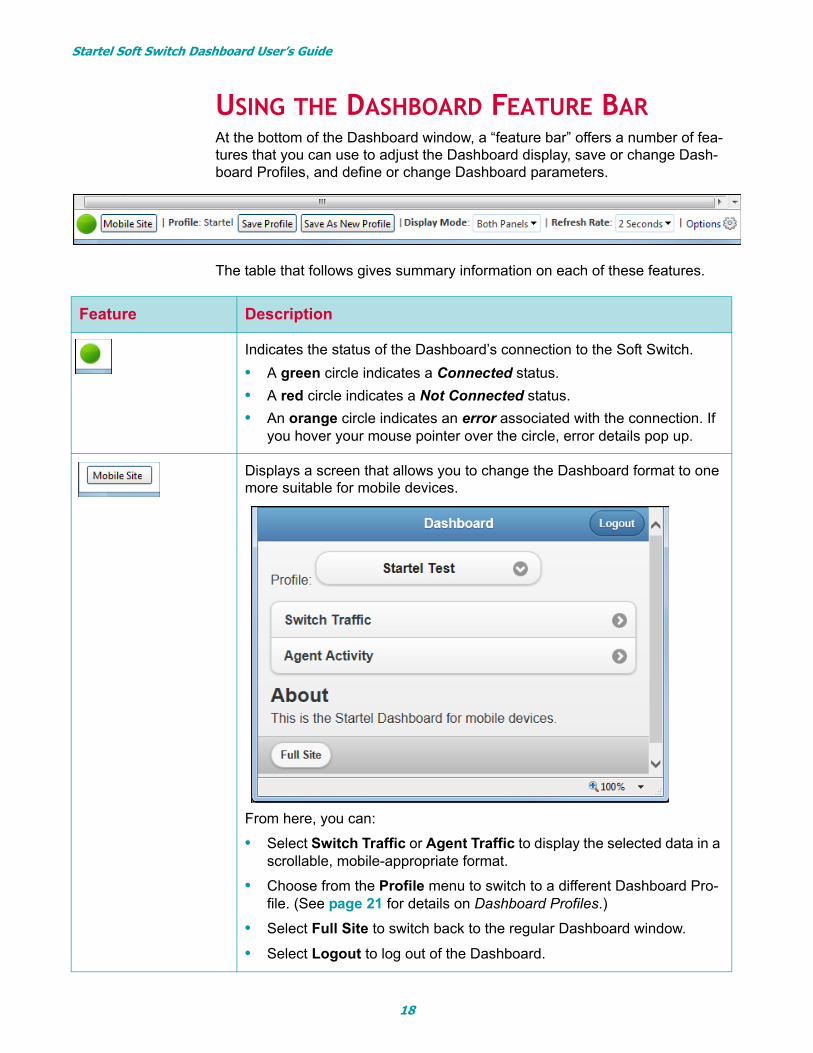
USING THE DASHBOARD FEATURE BARAt the bottom of the Dashboard window, a “feature bar” offers a number of fea-tures that you can use to adjust the Dashboard display, save or change Dash-board Profiles, and define or change Dashboard parameters.
The table that follows gives summary information on each of these features.
Feature Description
Indicates the status of the Dashboard’s connection to the Soft Switch.
• A green circle indicates a Connected status.
• A red circle indicates a Not Connected status.
• An orange circle indicates an error associated with the connection. If you hover your mouse pointer over the circle, error details pop up.
Displays a screen that allows you to change the Dashboard format to one more suitable for mobile devices.
From here, you can:
• Select Switch Traffic or Agent Traffic to display the selected data in a scrollable, mobile-appropriate format.
• Choose from the Profile menu to switch to a different Dashboard Pro-file. (See page 21 for details on Dashboard Profiles.)
• Select Full Site to switch back to the regular Dashboard window.
• Select Logout to log out of the Dashboard.
18
Startel Soft Switch Dashboard User’s Guide
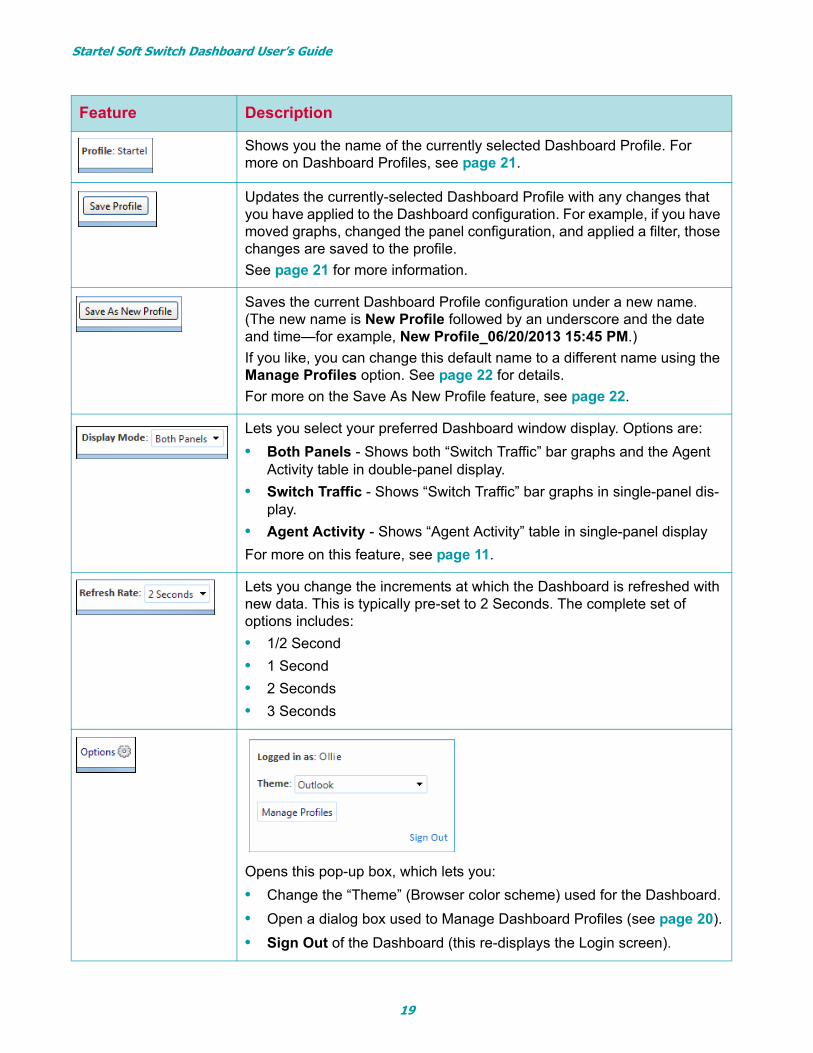
Shows you the name of the currently selected Dashboard Profile. For more on Dashboard Profiles, see page 21.
Updates the currently-selected Dashboard Profile with any changes that you have applied to the Dashboard configuration. For example, if you have moved graphs, changed the panel configuration, and applied a filter, those changes are saved to the profile.
See page 21 for more information.
Saves the current Dashboard Profile configuration under a new name. (The new name is New Profile followed by an underscore and the date and time—for example, New Profile_06/20/2013 15:45 PM.)
If you like, you can change this default name to a different name using the Manage Profiles option. See page 22 for details.
For more on the Save As New Profile feature, see page 22.
Lets you select your preferred Dashboard window display. Options are:
• Both Panels - Shows both “Switch Traffic” bar graphs and the Agent Activity table in double-panel display.
• Switch Traffic - Shows “Switch Traffic” bar graphs in single-panel dis-play.
• Agent Activity - Shows “Agent Activity” table in single-panel display
For more on this feature, see page 11.
Lets you change the increments at which the Dashboard is refreshed with new data. This is typically pre-set to 2 Seconds. The complete set of options includes:
• 1/2 Second
• 1 Second
• 2 Seconds
• 3 Seconds
Opens this pop-up box, which lets you:
• Change the “Theme” (Browser color scheme) used for the Dashboard.
• Open a dialog box used to Manage Dashboard Profiles (see page 20).
• Sign Out of the Dashboard (this re-displays the Login screen).
Feature Description
19
Startel Soft Switch Dashboard User’s Guide
MANAGING DASHBOARD PROFILES
For more on Dashboard Profiles, and for instructions on how to use each of the features in the Profiles dialog box, see the following topics:
What is a Dashboard Profile? (page 21)
Saving Changes to a Dashboard Profile (page 21)
Saving Changes as a New Dashboard Profile (page 22)
Opening a Different Dashboard Profile (page 22)
Using Features in the Profiles Dialog Box (page 22)
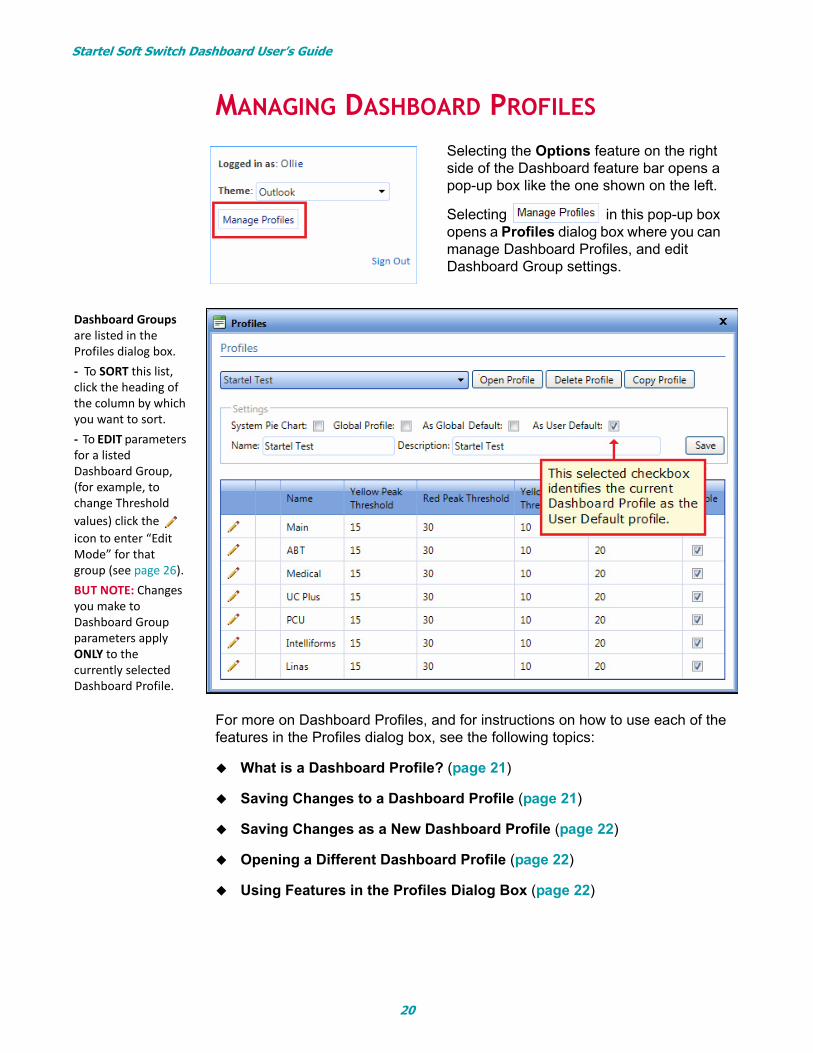
Selecting the Options feature on the right side of the Dashboard feature bar opens a pop-up box like the one shown on the left.
Selecting in this pop-up box opens a Profiles dialog box where you can manage Dashboard Profiles, and edit Dashboard Group settings.
Dashboard Groups are listed in the Profiles dialog box. - To SORT this list, click the heading of the column by which you want to sort.- To EDIT parameters for a listed Dashboard Group, (for example, to change Threshold values) click the icon to enter “Edit Mode” for that group (see page 26). BUT NOTE: Changes you make to Dashboard Group parameters apply ONLY to the currently selected Dashboard Profile.
20
Startel Soft Switch Dashboard User’s Guide
Saving Changes to a Dashboard Profile
Any time you make changes to the Dashboard window configuration—for example, if you move bar graphs around, or filter the Agent Activity list, or switch the Display Mode setting—you have the option of saving those changes to the currently selected Dashboard Profile.
To Save Dashboard window configuration changes to the current Dash-board Profile:
1 Make changes to the Dashboard window configuration as desired.
2 Click on the Dashboard feature bar.
The next time you log in and open the selected Dashboard Profile, the Dashboard window configuration that you saved is used automatically.
What is a Dashboard Profile?A Dashboard Profile is simply a view of the Dashboard that you can save, name, and then re-use.
For example, you may want to define a Dashboard Profile that displays only the Switch Traffic panel, with the bar graphs displayed in a particular way. Or, you may want to apply filters to the Agent Activity section of the Dashboard, and then save the filtered profile.Or, you may want to save a Dashboard Pro-file that hides all but just a few Agent Activity columns.
In short, a Dashboard Profile is a reusable snapshot of a Dashboard configu-ration. But please note: A Dashboard Profile saves only the configuration, not the data. That is, each time you open a Dashboard Profile, the data that appears in the Dashboard is current data, happening in real time.
When your Dashboard is initially set up for you by Startel, a default Dashboard Profile is defined for you. (It may be a User Default Profile, or a Global Default Profile, as described on page 24). This is the profile that will open automati-cally each time you log in to the application. However, you can, if you like, define a different configuration as the default profile. You can also define as many additional profiles as you like, and delete, edit, and copy profiles, as necessary.
MORE INFORMATION: See "Using Features in the Profiles Dialog Box" on page 23 for details
on how to make other types of changes to a Dashboard Profile.
21
Startel Soft Switch Dashboard User’s Guide
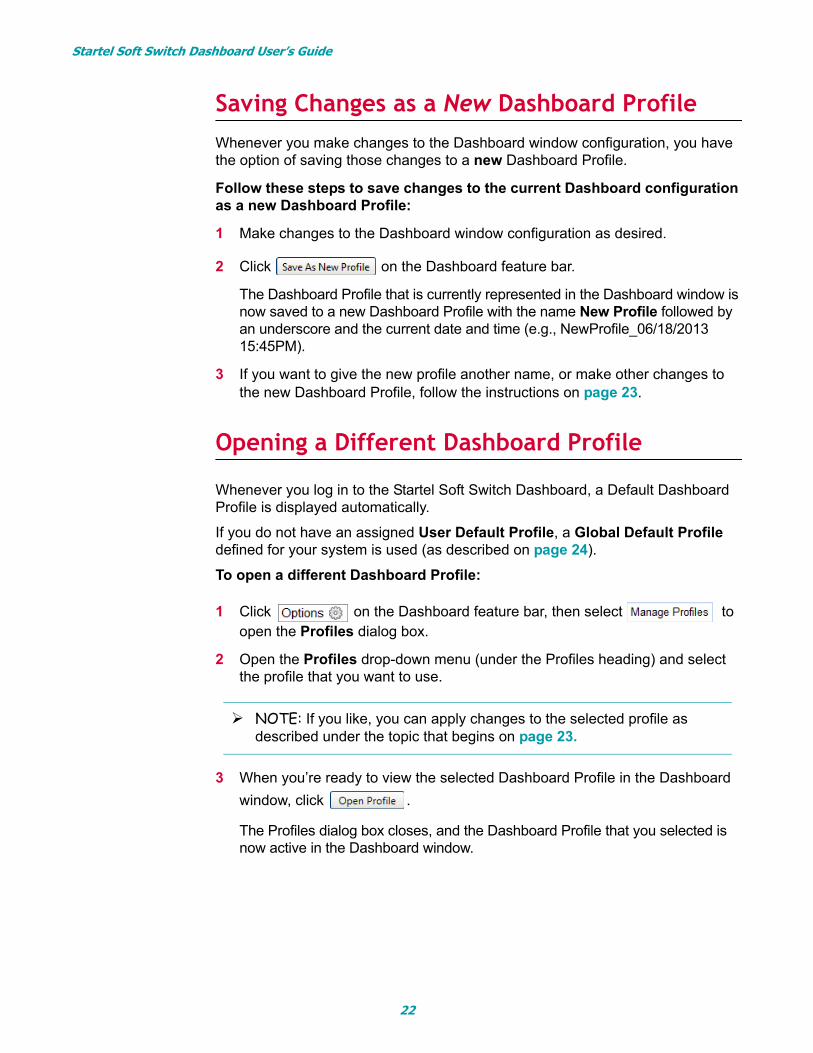
Saving Changes as a New Dashboard Profile
Whenever you make changes to the Dashboard window configuration, you have the option of saving those changes to a new Dashboard Profile.
Follow these steps to save changes to the current Dashboard configuration as a new Dashboard Profile:
1 Make changes to the Dashboard window configuration as desired.
2 Click on the Dashboard feature bar.
The Dashboard Profile that is currently represented in the Dashboard window is now saved to a new Dashboard Profile with the name New Profile followed by an underscore and the current date and time (e.g., NewProfile_06/18/2013 15:45PM).
3 If you want to give the new profile another name, or make other changes to the new Dashboard Profile, follow the instructions on page 23.
Opening a Different Dashboard Profile
Whenever you log in to the Startel Soft Switch Dashboard, a Default Dashboard Profile is displayed automatically.
If you do not have an assigned User Default Profile, a Global Default Profile defined for your system is used (as described on page 24).
To open a different Dashboard Profile:
1 Click on the Dashboard feature bar, then select to open the Profiles dialog box.
2 Open the Profiles drop-down menu (under the Profiles heading) and select the profile that you want to use.
3 When you’re ready to view the selected Dashboard Profile in the Dashboard
window, click .
The Profiles dialog box closes, and the Dashboard Profile that you selected is now active in the Dashboard window.
NOTE: If you like, you can apply changes to the selected profile as described under the topic that begins on page 23.
22
Startel Soft Switch Dashboard User’s Guide
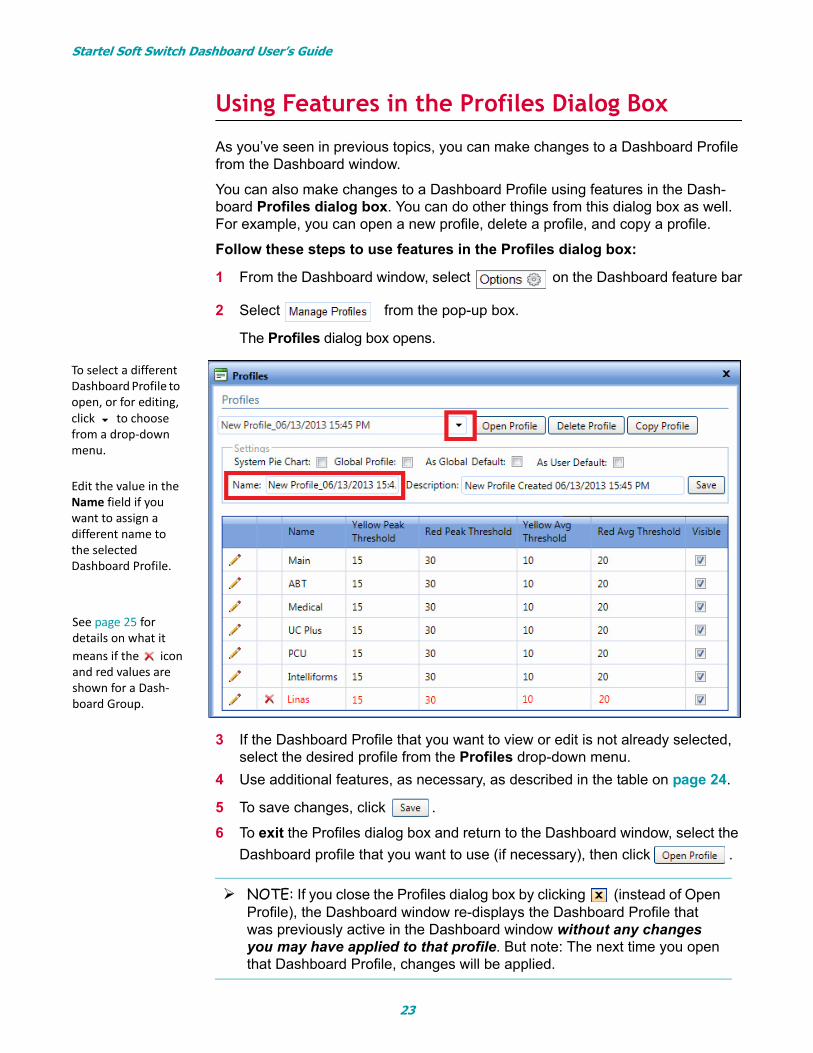
Using Features in the Profiles Dialog Box
As you’ve seen in previous topics, you can make changes to a Dashboard Profile from the Dashboard window.
You can also make changes to a Dashboard Profile using features in the Dash-board Profiles dialog box. You can do other things from this dialog box as well. For example, you can open a new profile, delete a profile, and copy a profile.
Follow these steps to use features in the Profiles dialog box:
1 From the Dashboard window, select on the Dashboard feature bar
2 Select from the pop-up box.
The Profiles dialog box opens.
3 If the Dashboard Profile that you want to view or edit is not already selected, select the desired profile from the Profiles drop-down menu.
4 Use additional features, as necessary, as described in the table on page 24.
5 To save changes, click .
6 To exit the Profiles dialog box and return to the Dashboard window, select the
Dashboard profile that you want to use (if necessary), then click .
NOTE: If you close the Profiles dialog box by clicking (instead of Open Profile), the Dashboard window re-displays the Dashboard Profile that was previously active in the Dashboard window without any changes you may have applied to that profile. But note: The next time you open that Dashboard Profile, changes will be applied.
To select a different Dashboard Profile to open, or for editing, click to choose from a drop-down menu.
Edit the value in the Name field if you want to assign a different name to the selected Dashboard Profile.
See page 25 for details on what it means if the icon and red values are shown for a Dash-board Group.
23
Startel Soft Switch Dashboard User’s Guide
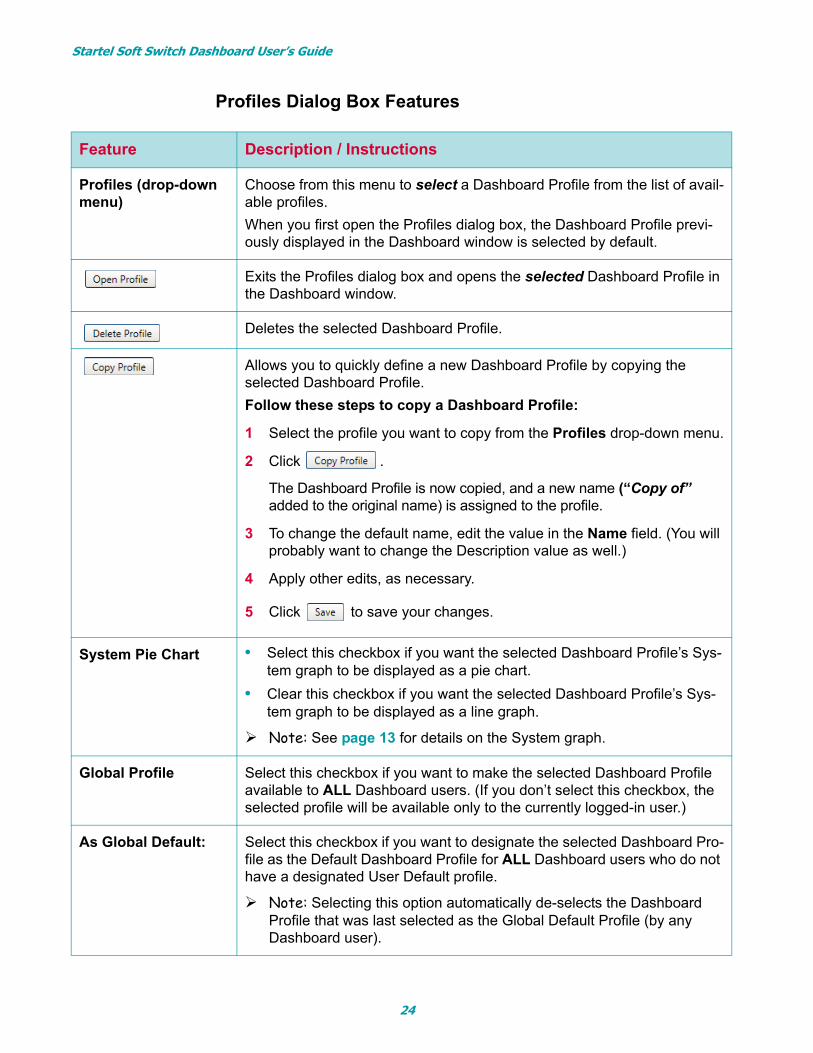
Profiles Dialog Box Features
Feature Description / Instructions
Profiles (drop-down menu)
Choose from this menu to select a Dashboard Profile from the list of avail-able profiles.
When you first open the Profiles dialog box, the Dashboard Profile previ-ously displayed in the Dashboard window is selected by default.
Exits the Profiles dialog box and opens the selected Dashboard Profile in the Dashboard window.
Deletes the selected Dashboard Profile.
Allows you to quickly define a new Dashboard Profile by copying the selected Dashboard Profile.
Follow these steps to copy a Dashboard Profile:
1 Select the profile you want to copy from the Profiles drop-down menu.
2 Click .
The Dashboard Profile is now copied, and a new name (“Copy of” added to the original name) is assigned to the profile.
3 To change the default name, edit the value in the Name field. (You will probably want to change the Description value as well.)
4 Apply other edits, as necessary.
5 Click to save your changes.
System Pie Chart • Select this checkbox if you want the selected Dashboard Profile’s Sys-tem graph to be displayed as a pie chart.
• Clear this checkbox if you want the selected Dashboard Profile’s Sys-tem graph to be displayed as a line graph.
Note: See page 13 for details on the System graph.
Global Profile Select this checkbox if you want to make the selected Dashboard Profile available to ALL Dashboard users. (If you don’t select this checkbox, the selected profile will be available only to the currently logged-in user.)
As Global Default: Select this checkbox if you want to designate the selected Dashboard Pro-file as the Default Dashboard Profile for ALL Dashboard users who do not have a designated User Default profile.
Note: Selecting this option automatically de-selects the Dashboard Profile that was last selected as the Global Default Profile (by any Dashboard user).
24
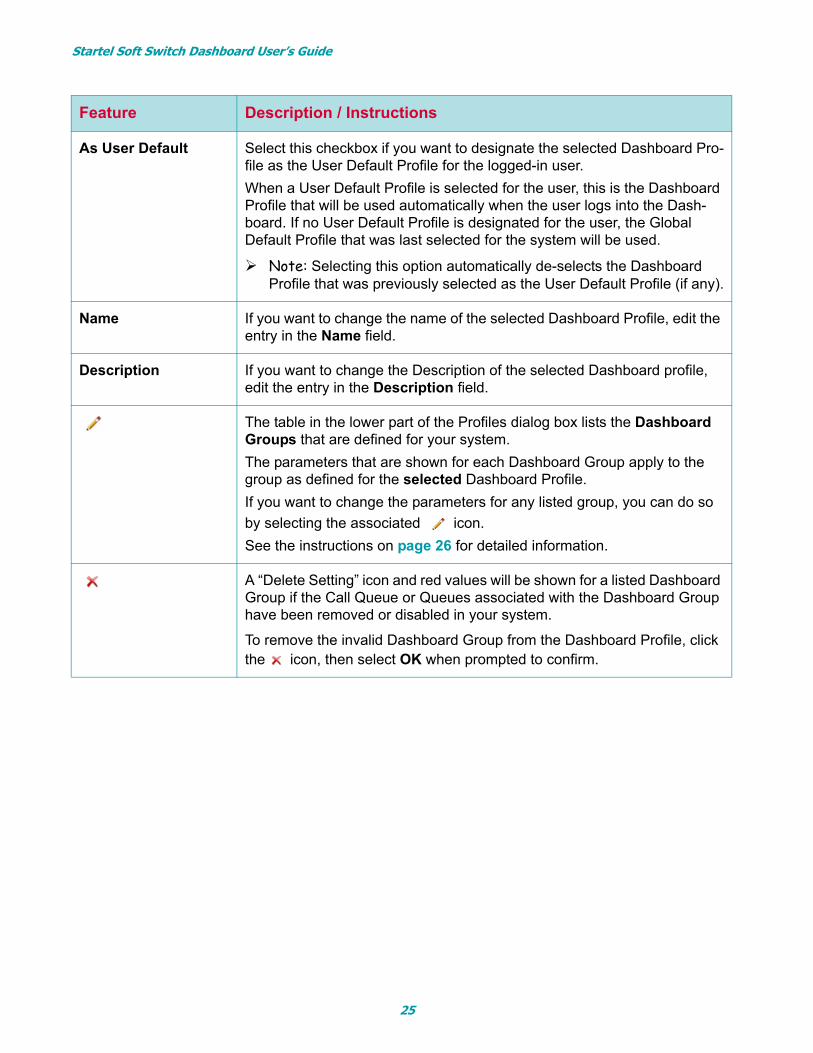
Startel Soft Switch Dashboard User’s Guide
As User Default Select this checkbox if you want to designate the selected Dashboard Pro-file as the User Default Profile for the logged-in user.
When a User Default Profile is selected for the user, this is the Dashboard Profile that will be used automatically when the user logs into the Dash-board. If no User Default Profile is designated for the user, the Global Default Profile that was last selected for the system will be used.
Note: Selecting this option automatically de-selects the Dashboard Profile that was previously selected as the User Default Profile (if any).
Name If you want to change the name of the selected Dashboard Profile, edit the entry in the Name field.
Description If you want to change the Description of the selected Dashboard profile, edit the entry in the Description field.
The table in the lower part of the Profiles dialog box lists the Dashboard Groups that are defined for your system.
The parameters that are shown for each Dashboard Group apply to the group as defined for the selected Dashboard Profile.
If you want to change the parameters for any listed group, you can do so
by selecting the associated icon.
See the instructions on page 26 for detailed information.
A “Delete Setting” icon and red values will be shown for a listed Dashboard Group if the Call Queue or Queues associated with the Dashboard Group have been removed or disabled in your system.
To remove the invalid Dashboard Group from the Dashboard Profile, click the icon, then select OK when prompted to confirm.
Feature Description / Instructions
25
Startel Soft Switch Dashboard User’s Guide
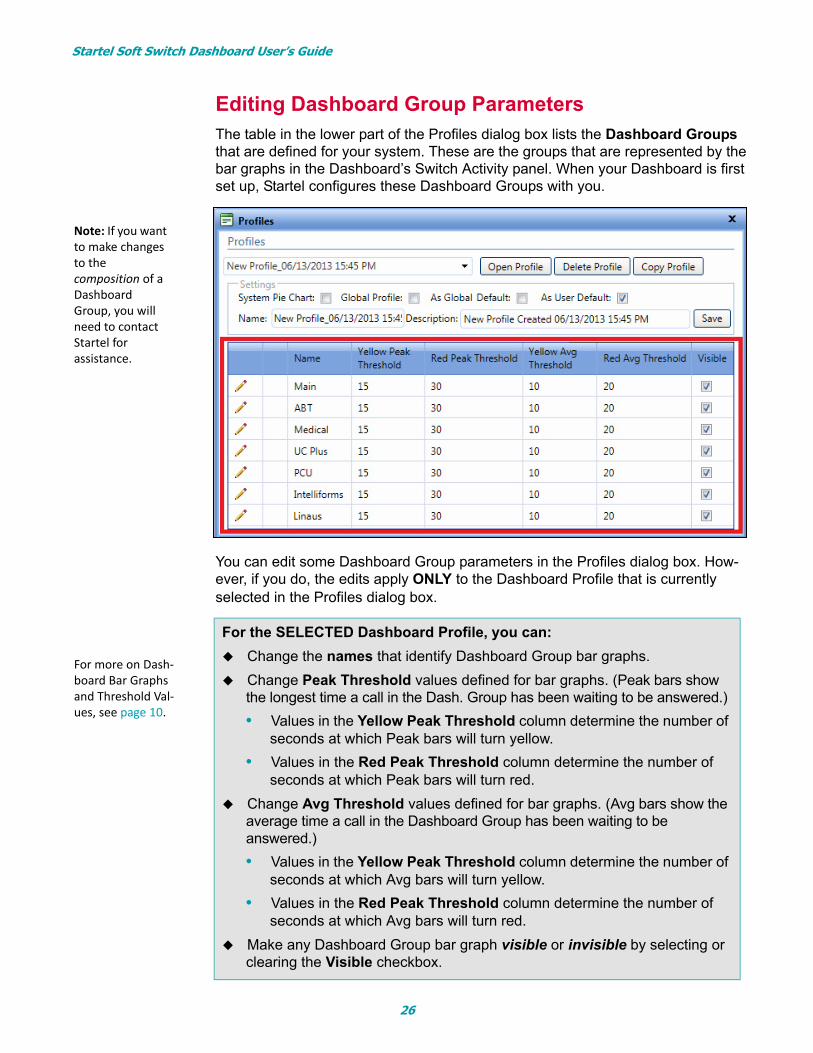
Editing Dashboard Group ParametersThe table in the lower part of the Profiles dialog box lists the Dashboard Groups that are defined for your system. These are the groups that are represented by the bar graphs in the Dashboard’s Switch Activity panel. When your Dashboard is first set up, Startel configures these Dashboard Groups with you.
You can edit some Dashboard Group parameters in the Profiles dialog box. How-ever, if you do, the edits apply ONLY to the Dashboard Profile that is currently selected in the Profiles dialog box.
For the SELECTED Dashboard Profile, you can:
Change the names that identify Dashboard Group bar graphs.
Change Peak Threshold values defined for bar graphs. (Peak bars show the longest time a call in the Dash. Group has been waiting to be answered.)
• Values in the Yellow Peak Threshold column determine the number of seconds at which Peak bars will turn yellow.
• Values in the Red Peak Threshold column determine the number of seconds at which Peak bars will turn red.
Change Avg Threshold values defined for bar graphs. (Avg bars show the average time a call in the Dashboard Group has been waiting to be answered.)
• Values in the Yellow Peak Threshold column determine the number of seconds at which Avg bars will turn yellow.
• Values in the Red Peak Threshold column determine the number of seconds at which Avg bars will turn red.
Make any Dashboard Group bar graph visible or invisible by selecting or clearing the Visible checkbox.
For more on Dash-board Bar Graphs and Threshold Val-ues, see page 10.
Note: If you want to make changes to the composition of a Dashboard Group, you will need to contact Startel for assistance.
26
Startel Soft Switch Dashboard User’s Guide
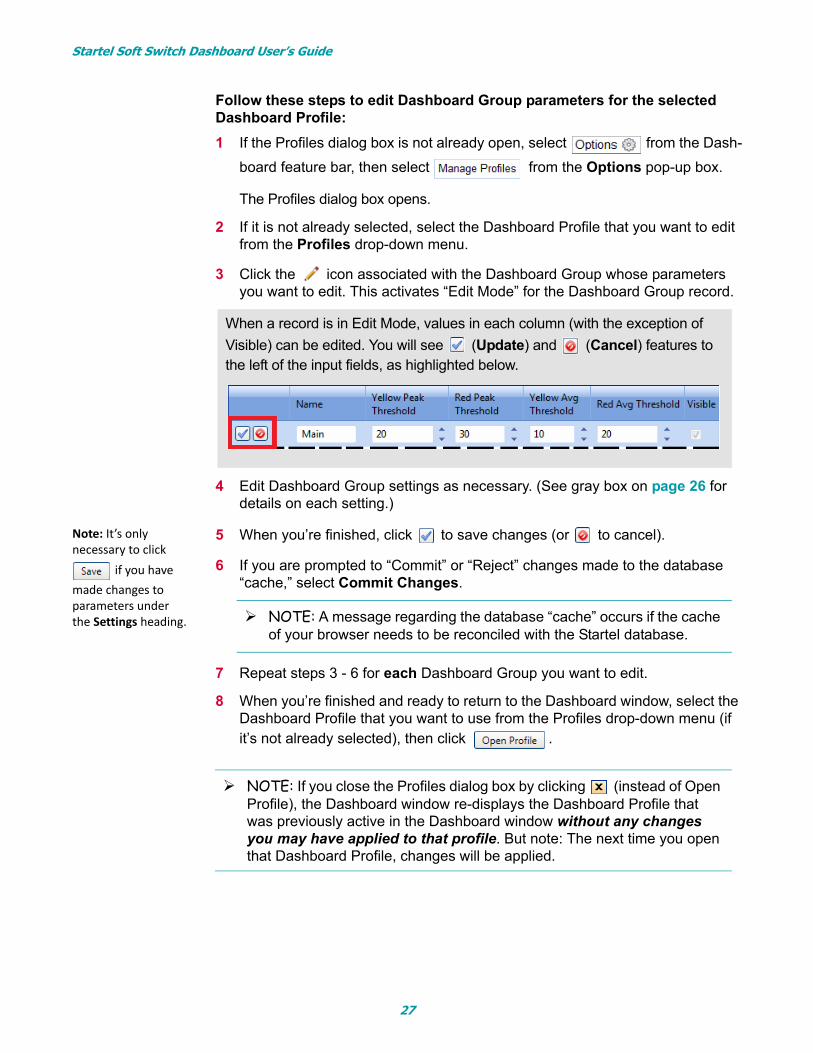
Follow these steps to edit Dashboard Group parameters for the selected Dashboard Profile:
1 If the Profiles dialog box is not already open, select from the Dash-
board feature bar, then select from the Options pop-up box.
The Profiles dialog box opens.
2 If it is not already selected, select the Dashboard Profile that you want to edit from the Profiles drop-down menu.
3 Click the icon associated with the Dashboard Group whose parameters you want to edit. This activates “Edit Mode” for the Dashboard Group record.
4 Edit Dashboard Group settings as necessary. (See gray box on page 26 for details on each setting.)
5 When you’re finished, click to save changes (or to cancel).
6 If you are prompted to “Commit” or “Reject” changes made to the database “cache,” select Commit Changes.
7 Repeat steps 3 - 6 for each Dashboard Group you want to edit.
8 When you’re finished and ready to return to the Dashboard window, select the Dashboard Profile that you want to use from the Profiles drop-down menu (if it’s not already selected), then click .
When a record is in Edit Mode, values in each column (with the exception of
Visible) can be edited. You will see (Update) and (Cancel) features to the left of the input fields, as highlighted below.
NOTE: A message regarding the database “cache” occurs if the cache of your browser needs to be reconciled with the Startel database.
NOTE: If you close the Profiles dialog box by clicking (instead of Open Profile), the Dashboard window re-displays the Dashboard Profile that was previously active in the Dashboard window without any changes you may have applied to that profile. But note: The next time you open that Dashboard Profile, changes will be applied.
Note: It’s only necessary to click
if you have made changes to parameters under the Settings heading.
27

Startel Soft Switch Dashboard User’s Guide
EXITING THE DASHBOARDThere are two ways to exit the Startel Soft Switch Dashboard:
To exit but re-display the Dashboard Login screen, click on the Dashboard feature bar. Then select Sigh Out in the pop-up box.
To exit without returning to the Login screen, simply click at the upper-right corner of the Dashboard window.
28
Startel Soft Switch Dashboard User’s Guide Index
IndexAAgent Activity columns
adjusting width 16selecting to view/hide 15
Agent Activity Display Mode option 19
Agent Activity panel 15clearing sorting 16filtering 16meaning of colors in 15moving columns with drag & drop 15
sorting 16toggling Filter row 16
As Global Default checkbox 24As User Default checkbox 25Avg bar 10, 11Avg bar colors & Threshold
values 10
Bbar graphs
and Detail dialog box 14numbers in 10Threshold colors 11viewing graph details 13
beige items in Agent Activity panel 15
Best Fit option in Agent Activity panel 16
blue items in Agent Activity panel 15
Both Panels Display Mode option 19
Ccache changes
Commit Changes and Reject Changes options 27
changing the Dashboard Display Mode 11
circle on Dashboard feature bar 18
Clear Sorting option in Agent Activity panel 16
Columns option in Agent Activity panel 16
Copy Profile button 24
copying a Dashboard Profile 24
DDashboard Agent Activity
panel 15Dashboard Display Mode
changing 11options 19
Dashboard feature barDisplay Mode 19green circle 18Mobile Site 18Options 19orange circle 18Profile 19red circle 18Refresh Rate 19Save As New Profile 19Save Profile 19
Dashboard Group graph bars 10
Dashboard Groups 9definition 9editing 26
Dashboard Groups table in Profiles dialog box 20
Dashboard Login screen 8Dashboard Mobile Site
display 18Dashboard Profile 21
copying 24deleting 24Global Default Profile 24opening 22, 24saving changes to 21saving changes to a new Dashboard Profile 22
User Default Profile 25Dashboard System
Requirements 6Dashboard window 9Dashboard window
explained 9Delete Profile button 24Delete Setting icon 25deleting a Dashboard
Profile 24Detail dialog box 14
Disable SAM Broadcast option in Agent Maintenance 6
Display Mode options 19
Eediting Dashboard Group
parameters 26exiting Dashboard 28exiting Profiles dialog box 28
Ffiltering Agent Activity list 16First Threshold 11
GGlobal Profile checkbox 24gray items in Agent Activity
panel 15
Hhiding Agent Activity
columns 15Hold bar 10
Llaunching the Dashboard
application 8Line Style System graph 13Log bar 10logging in to the Dashboard 8logging out of Dashboard 18
MMobile Site 18
OOpen Profile button 24opening a different Dashboard
Profile 22Options pop-up box
Manager Profiles option 19Sign Out option 19Theme option 19
PPeak bar 10, 11
29
Startel Soft Switch Dashboard User’s Guide Index
Peak bar colors & Threshold values 10
pencil icon 25Pie Style System graph 13procedures
copying a Dashboard Profile 28
editing Dashboard Group parameters 26
exiting the Dashboard 28exiting the Profiles dialog box 28
filtering in the Agent Activity panel 16
logging in to the Dashboard 8
managing Dashboard Profiles 20
opening a different Dashboard Profile 22
saving changes to a Dashboard Profile 21
saving changes to a new Dashboard Profile 22
using the Profiles dialog box 22
Profiles dialog box 23Delete Setting icon 25exiting 28pencil icon 25settings in 23
Profiles dialog box features 24
RRefresh Rate parameter 19Ring bar 10Rot bar 10
Ssample screen down-sizing 12Save Profile button 19saving changes to a
Dashboard Profile 21saving changes to a new
Dashboard Profile 22Second Threshold 11Sign Out 19signing out of the
Dashboard 19sorting Agent Activity
columns 16Startel Soft Switch Dashboard
exiting 28introduction to 7
logging in 8logging out 18what is it? 7
Switch ActivitySystem Graph options 13
Switch Traffic Display Mode option 19
System graphoptions 13
System graph options 13System Pie Chart checkbox 24System Requirements 6
TTalk bar 10Threshold
defined 11Threshold colors 11Toggle Filter Row option in
Agent Activity panel 16
Uunderstanding Dashboard
window 9using the Dashboard Feature
bar 18
Vviewing graph details 13
WWhat is a Dashboard
Profile? 21
Yyellow items in Agent Activity
panel 15
30


![Voltage mode control of soft-switched single switch ... · achieving ZVS and ZCS [28]. Quasi resonant converters [29] employ a single switch and provide soft switching condition without](https://img.pdfslide.net/doc/110x75/5e31277ee80634229e625f9c/voltage-mode-control-of-soft-switched-single-switch-achieving-zvs-and-zcs-28.jpg)