Embed Size (px)
Citation preview
State Employees’
Retirement System of
Illinois
Comprehensive Annual Financial Report
for the Fiscal Years Ended June 30, 2015 and 2014
A Pension Trust Fund of the State of Illinois

State Employees’ Retirement System of Illinois2101 South Veterans Parkway, P. O. Box 19255Springfield, Illinois 62794-9255Phone 217-785-7444 • Fax 217-785-7019Internet: http://www.srs.illinois.govEmail: [email protected]
Mission Statement
To provide an orderly means whereby aged or disabled employees may retire from active service, without hardship or prejudice, and to enable them to accumulate reserves for themselves and their dependents for
old age, disability, death and termination of employment, thus affecting the economy and efficiency in the administration of State government.
Fiscal Year 2015 Highlights
88,581 Total Membership 63,273 Active Contributing Members Net Position–Restricted $15,258,866,572 for Pensions, fair value Contributions $266,139,156 Participants $1,804,319,356 Employer
$681,377,052 Investment Income 4.79% Investment Return
Benefit Recipients 54,802 Retirement Annuities 10,889 Survivors’ Annuities 2,263 Disability Benefi ts
$2,034,858,435 Benefi ts Paid
$43,267,055,628 Total Pension Liability $15,258,866,572 Fiduciary Net Position $28,088,189,056 Net Pension Liability
35.27% Funded Ratio

1
STATE EMPLOYEES’ RETIREMENT SYSTEM OF ILLINOIS
A Pension Trust Fund of the State of Illinois
COMPREHENSIVE ANNUAL FINANCIAL REPORTFOR THE FISCAL YEARS ENDED JUNE 30, 2015 AND 2014
STATE EMPLOYEES’ RETIREMENT SYSTEM OF ILLINOIS
2101 South Veterans ParkwayP. O. Box 19255 Springfield, Illinois 62794-9255
Prepared by the Accounting Division
Printed by Authority of the State of Illinois
Printed on Recycled Paper

2
TABLE OF CONTENTS
INTRODUCTORY SECTION ........................................ 3 Letter of Transmittal ........................................................... 4 Board of Trustees and Administrative Staff .........................7 Certificate of Achievement for Excellence in Financial Reporting .........................................................8
FINANCIAL SECTION....................................................9 Independent Auditor’s Report ......................................10 Management’s Discussion and Analysis .......................12 Basic Financial Statements: Statements of Fiduciary Net Position............................15 Statements of Changes in Fiduciary Net Position ........16 Notes to Financial Statements ......................................17
Required Supplementary Information: Schedule of Changes in the State’s Net Pension Liability and Related Ratios ......................................38 Schedule of Investment Returns ...................................38 Schedule of State Contributions ...................................39 Notes to Schedule of State Contributions ....................39
Supplementary Financial Information: Summary of Revenues by Source ................................ 40 Summary Schedule of Cash Receipts and Disbursements .................................................. 40 Schedule of Payments to Consultants and Advisors ....................................................................41
INVESTMENT SECTION ..............................................43 Investment Report ...................................................... 44 Investment Policy and Asset Allocation ........................ 44 Investment Portfolio Summary .....................................45 Additional Investment Information .............................. 46 Management Expenses ................................................. 46 Analysis of Investment Performance ............................ 46
ACTUARIAL SECTION .................................................49 Actuary’s Certification Letter ........................................50 Introduction ..................................................................52 Actuarial Cost Method and Summary of Major Actuarial Assumptions ............................................. 53 Summary of and Changes to the Plan Provisions ........ 54
Short-Term Solvency Test..............................................54 Valuation Results ...........................................................55 Computed Actuarial Values (in thousands of dollars)....55 Reconciliation of Unfunded Actuarial Liability ............. 56 Summary of Accrued and Unfunded Accrued Liabilities (Analysis of Funding) ................................57 Schedule of Active Member Valuation Data .................57 Schedule of Retirants Added To & Removed From Rolls ................................................................. 58 Schedule of Survivors’ Annuitants Added to and Removed From Rolls ................................................. 58 Schedule of Disability Recipients Added to and Removed From Rolls ................................................. 58 STATISTICAL SECTION .................................................59 Asset Balances ............................................................... 60 Liabilities and Reserve Balances ................................... 60 Changes in Fiduciary Net Position ................................61 Total Membership - Coordinated/Noncoordinated ................................. 62 Active Membership - Coordinated/Noncoordinated ................................. 62 Active Memebership - Tier Breakout ............................ 62 Number of Recurring Benefit Payments/ Termination Refunds ................................................. 63 Retirement Annuities - Average Monthly Benefit for Current Year Retirees by Type .............................. 64 Retirement Annuities - Current Age of Active Recipients ................................................................. 64 Retirement Annuities - Average Service (in months) for Current Year Retirees at Effective Date of Benefit .................................................................. 64 Annuitants by Benefit Range (Monthly) ...................... 65 Widow’s and Survivors’ by Benefit Range (Monthly) ................................................................. 65 Occupational and Non-Occupational (Incl. Temp.) Disabilities by Benefit Range (Monthly) .................. 65 Active Retirees by State ................................................. 65 Average Benefit Payments ............................................ 66
PLAN SUMMARY AND LEGISLATIVE SECTION ...........67
State Employees’ Retirement System

3
INTRODUCTORY SECTION
State Employees’ Retirement System

4
December 21, 2015
The Board of Trustees and MembersState Employees’ Retirement System of IllinoisSpringfield, IL 62794
Dear Board and Members:
The comprehensive annual financial report (CAFR) of the State Employees’ Retirement System of Illinois (System) as of and for the fiscal year ended June 30, 2015 is hereby submitted. Responsibility for both the accuracy of the data and the completeness and fairness of the presentation, including all disclosures, rests with the System.
To the best of our knowledge and belief, the enclosed data are accurate in all material respects and are reported in a manner designed to present fairly the financial position and results of operations of the various funds of the System. All disclosures neces-sary to enable the reader to gain an understanding of the System’s financial activities have been included.
Generally accepted accounting principles require that management provide a narrative introduction, over-view, and analysis to accompany the basic financial statements in the form of Management’s Discussion and Analysis (MD&A). This letter of transmittal is designed to complement MD&A and should be read in conjunction with it. The System’s MD&A can be found immediately following the report of the inde-pendent auditors.
The report consists of six sections:
1. The Introductory Section contains this letter of transmittal and the identification of the administra-tive organization and the Certificate of Achievement for Excellence in Financial Reporting;
2. The Financial Section contains management’s dis-cussion and analysis, the report of the Independent Auditors, the financial statements of the System, and certain required and other supplementary financial information;
3. The Investment Section contains a summary of the System’s investment management approach and selected summary tables, including investment performance;
4. The Actuarial Section contains an Actuary’s Certi-fication Letter and the results of the annual actuarial valuation;
5. The Statistical Section contains significant statisti-cal data;
6. The Plan Summary and Legislative Section con-tains a summary of the System’s plan provisions and current legislative changes.
Generally accepted accounting principles require that the financial reporting entity include:1. the primary government; 2. organizations for which the primary govern- ment is financially accountable; and3. other organizations for which the nature and significance of their relationship with the primary government are such that exclusion would cause the reporting entity’s financial statements to be misleading or incomplete.
Based on the criteria of the Governmental Account-ing Standards Board Statement No. 61, there are no other state agencies, boards or commissions, or other organizations required to be combined with the System. The System is considered to be part of the State of Illinois financial reporting entity, and is to be combined and included in the State of Illinois’ comprehensive annual financial report.
Although the State Employees’ Retirement System, Judges’ Retirement System and General Assembly Re-tirement System share a common administration, they are separate entities for legal and financial reporting purposes. Therefore, the financial statements of the State Employees’ Retirement System do not include plan net position information nor the changes in plan net position of the General Assembly Retirement System or Judges’ Retirement System.
PLAN HISTORY & SERVICES PROVIDEDThe System is the administrator of a single-employer public employee retirement system established to pro-vide pension benefits for State of Illinois employees. The System also administers widows and survivors benefits as well as the state’s occupational and non-occupational disability programs.
L E T T E R O F T R A N S M I T T A L
• State Employees’ Retirement System of Illinois • General Assembly Retirement System• Judges’ Retirement System of Illinois
STATE RETIREMENT SYSTEMS
2101 South Veterans Parkway, P.O. Box 19255, Spr ingf ield, IL 62794-9255 217-785-7444
State Employees’ Retirement System

5
The System was established January 1, 1944 and 17,237 state employees became members on that date. As of June 30, 1944, the plan net position of the System amounted to $1,255,778. The fair value of fiduciary net position at the end of the fiscal year June 30, 2015 is approximately $15.3 billion, and there are 63,273 active members.
INVESTMENTSThe System’s investments are managed by the Illinois State Board of Investment (ISBI) pursuant to Chapter 40, Article 5/22A of the Illinois Compiled Statues, using the “prudent person rule”.
This rule states that fiduciaries shall discharge their duties solely in the interest of the fund participants and beneficiaries and with the degree of diligence, care and skill which prudent men and women would ordinarily exercise under similar circumstances in a like position.
The ISBI maintains a wide diversification of invest-ments within this fund which is intended to reduce overall risk and increase returns. As further detailed in the Investment Section, the ISBI Commingled Fund had a gain of 4.7%, net of expenses, for the fiscal year ended June 30, 2015. Information regarding the Schedule of Fees and Commissions paid is included in the ISBI annual report.
FUNDINGFunding is the process of specifically allocating monies for current and future use. Proper funding includes an actuarial review of the fund balances to ensure that funds will be available for current and future benefit payments. The greater the level of funding, the larger the ratio of accumulated assets to the actuarial accrued liability and the greater the level of investment potential.
The funding plan for the System, enacted in 1994 with subsequent modifications, requires that state contributions be paid to the System so that by the end of fiscal year 2045, the ratio of the actuarial value of assets to the actuarial accrued liability will be 90%. For fiscal years 2011 through 2045, the required state contributions are to be computed as a level percent-age of participant payroll.
For fiscal years up through 2010, the required state contributions, except for fiscal years 2006 and 2007, were to be increased incrementally as a percentage of the participant payroll so that by fiscal year 2011 the state is contributing at the required level con-
tribution rate to achieve the financing objective by the end of fiscal year 2045. For fiscal years 2015 and 2014, the state contributed the appropriate amount as required by law. The funding legislation also provides for the establish-ment of a continuing appropriation of the required state contributions to the System. This has, in effect, removed the appropriation of these funds from the annual budgetary process.
The actuarial determined liability of the System using the State’s projected unit credit actuarial cost method for funding purposes at June 30, 2015, amounted to $40.7 billion. The actuarial value of assets amounted to $14.7 billion resulting in an unfunded accrued actuarial liability of $26.0 billion as of the same date. The actuarial determined liability, actuarial value of assets, and unfunded accrued actuarial liability of the System as presented above and in the Actu-arial Section of this report using the state’s funding method does not conform with GASB Statement No. 67 and therefore, the amounts presented above and in the Actuarial Section of this report differ from the amounts presented for financial reporting purposes in the Financial section of this report. A detailed discus-sion of funding is provided in the Actuarial Section of this report.
MAJOR EVENTS/INITIATIVESThe IT operational plan for FY15 included: Modern-ization/Re-engineering which included, New Active member statements, New Retiree/Survivor State-ments, New General Statements, and Active Mem-ber Web System; Upgraded SRSCentral databases to SQL Server 2012 with encryption, VoIP Phone system Upgrade; Office 2013 Upgrade; New Wireless LAN System, Full Disaster Recovery Planning and Testing.
New IT Project for FY16 include: Conversion of main-frame IMS active member services to new SRSCen-tral system; New Active Member Statements; Im-plement new benefit setup and pension calculations in new system; Implement Disability Setup, Finish Account/Cash Receipts in SRSCentral; Office 2016 Upgrade; Upgrade Windows Servers to 2012. Com-plete Full Disaster Recovery Planning and Testing.
ACCOUNTING SYSTEM & INTERNAL CONTROLThis report has been prepared to conform with the principles of governmental accounting and reporting pronounced by the Governmental Accounting Stan
L E T T E R O F T R A N S M I T T A L
State Employees’ Retirement System

6
The Certificate of Achievement is a prestigious na-tional award recognizing excellence in the prepara-tion of state and local government financial reports.
To be awarded a Certificate of Achievement, a gov-ernmental unit must publish an easily readable and efficiently organized CAFR, whose contents meet or exceed program standards. This report must satisfy both generally accepted accounting principles and applicable legal requirements.
A Certificate of Achievement is valid for a period of one year only. The State Employees’ Retirement Sys-tem of Illinois has received a Certificate of Achieve-ment for the past twenty-nine consecutive years (fiscal years ended June 30, 1986 through June 30, 2014).
We believe our current report continues to conform to the Certificate of Achievement program requirements, and we are submitting it to the GFOA to determine its eligibility for another certificate.
ACKNOWLEDGMENTS & COMMENTSThe preparation of this report reflects the combined efforts of the System’s staff under the direction of the Board of Trustees. It is intended to provide com-plete and reliable information as a basis for making management decisions, as a means of determining compliance with legal provisions, and for determining responsible stewardship for the assets contributed by the members in the State of Illinois. On behalf of the Board of Trustees, we would like to express our appreciation to the staff and professional consultants who worked so effectively to ensure the successful operation of the System.
Respectfully submitted,
L E T T E R O F T R A N S M I T T A L
dards Board and the American Institute of Certified Public Accountants.
The accrual basis of accounting is used to record the financial transactions and activities of the System. Revenues are recognized in the accounting period in which they are earned, without regard to the date of collection, and expenses are recognized when the corresponding liabilities are incurred, regardless of when payment is made.
The System also uses the State of Illinois, Statewide Accounting Management System (SAMS) as a basis for the preparation of the financial statements. In developing the System’s accounting system, consider-ation is given to the adequacy of internal accounting controls. These controls are designed to provide rea-sonable assurance regarding the safekeeping of assets and the reliability of financial records. The concept of reasonable assurance recognizes that the cost of a control should not exceed the benefits likely to be derived and that the valuation of costs and benefits requires estimates and judgements by management. Constant effort is directed by the System at improving this level to assure the participants of a financially sound retirement system.
PROFESSIONAL SERVICESIndependent consultants are retained by the Board of Trustees to perform professional services that are essential to the effective and efficient operation of the System. Actuarial services are provided by Gabriel, Roeder, Smith & Co., Chicago, Illinois.
The annual financial audit of the System was con-ducted by the accounting firm of BKD, LLP, under the direction of the Auditor General of the State of Illinois. In addition to the annual financial audit, a compliance attestation examination is also performed by the auditors.
The purpose of the compliance attestation examina-tion was to determine whether the System obligated, expended, received and used public funds of the state in accordance with the purpose for which such funds have been authorized by law. The System’s investment function is managed by the Illinois State Board of Investment.
CERTIFICATE OF ACHIEVEMENTThe Government Finance Officers Association of the United States and Canada (GFOA) awarded a Certificate of Achievement for Excellence in Financial Reporting to the State Employees’ Retirement System of Illinois for its comprehensive annual financial re-port for the fiscal year ended June 30, 2014.
Timothy B. Blair Executive Secretary
Alan T. Fowler, C.P.A.Chief Fiscal Officer
State Employees’ Retirement System

7
Management Group
Accounting & Social Security Alan T. Fowler Administrative Services David L. O’Brien Claims/Benefits Kathy Yemm Chief Information Officer Gerry G. Mitchell Information Technology Kevin Rademacher Field Services David F. Thompson Human Resources Kelley Gray Service & Refunds Joseph S. Maggio Internal Auditor Casey Evans
Advisors, Auditors & Administrators
Consulting Actuary Gabriel, Roeder, Smith & Company Chicago, Illinois
External Auditor BKD, LLP Decatur, Illinois Investments Illinois State Board of Investment Chicago, Illinois
BOARD OF TRUSTEES
A D M I N I S T R A T I O N
VacantElected Employee
Leslie Geissler MungerChairperson
Yasmin Bates-BrownAppointed by Governor
Danny SilverthornAppointed by Governor
Harold W. Sullivan Jr.Appointed by Governor
Renee FriedmanAppointed by Governor
Thomas AllisonAppointed by Governor
David MorrisElected Employee
Patricia OusleyElected Employee
Alan LatozaElected Annuitant
Robert FiersteinElected Employee
Shirley ByrdElected Annuitant
* John Aguilar was appointed a trustee by the Governor effective 5/26/2015 (No Picture available)
State Employees’ Retirement System
8
C E R T I F I C A T E O F A C H I E V E M E N T
State Employees’ Retirement System

9
FINANCIAL SECTION
State Employees’ Retirement System

10
I N D E P E N D E N T A U D I T O R ‘ S R E P O R T
State Employees’ Retirement System
11
I N D E P E N D E N T A U D I T O R ‘ S R E P O R T
State Employees’ Retirement System

12
M A N A G E M E N T ‘ S D I S C U S S I O N A N D A N A L Y S I S
This financial
report is
designed to
provide a
general overview
of the State
Employees’
Retirement
System’s
finances for all
those with an
interest
in the System’s
finances.
This section presents management’s discussion and analysis of the financial position and performance of the State Employees’ Retirement Systems of Illinois (System) for the years ended June 30, 2015 and June 30, 2014. It is presented as a narrative overview and analysis. Readers are encouraged to consider the information presented here in conjunction with the Letter of Transmittal included in the Introductory Section, of the Comprehensive Annual Financial Report.
The System is a defined benefit, single-employer public employee retirement system. It provides ser vices to approximately 63,300 active state employees and 68,000 benefit recipients. Throughout this discussion and analysis units of measure (i.e. billions, millions, thousands) are approximate, being rounded up or down to the nearest tenth of the respective unit value.
OVERVIEW OF THE FINANCIAL STATEMENTSThis discussion and analysis is intended to serve as an introduction to the System’s financial reporting which is comprised of the following components:
1. Basic Financial Statements. For the fiscal years ended June 30, 2015 and June 30, 2014, basic financial statements are presented for the System. This infor-mation presents the fiduciary net position restricted for pensions for the System as of June 30, 2015 and 2014. This financial information also summarizes the changes in fiduciary net position restricted for pen-sions for the year then ended.
2. Notes to the Financial Statements. The notes to the Financial Statements provide additional informa-tion that is essential to achieve a full understanding of the data provided in the basic financial statements.
3. Required Supplementary Information. The re-quired supplementary information consists of three schedules and related notes concerning actuarial information, funded status, investment returns and actuarially determined contributions.
4. Other Supplementary Schedules. Other schedules include more detailed information pertaining to the System, including schedules of revenues by source, cash receipts and disbursements, and payments to consultants.
FINANCIAL HIGHLIGHTS• The fiduciary net position increased by $677.3 million and $2.2 billion during fiscal years 2015 and 2014, respectively. The change was primarily due to an increase of $680.8 million and $2.1 billion (excluding securities lending collateral), in the System’s invest-ments for fiscal years 2015 and 2014. • The System was actuarially funded at 35.3% as of June 30, 2015, compared to 35.0% as of June 30, 2014. • The overall rate of return for the Illinois State Board of Investment (ISBI) Commingled Fund was 4.7% for fiscal year 2015, compared to 17.9% for fiscal year 2014. The System’s annual money weighted rate of return on its investment in the ISBI Commingled Fund was 4.79% for fiscal year 2015 compared to
17.9% for fiscal year 2014.
ADDITIONS TO FIDUCIARY NET POSITIONAdditions to Fiduciary Net Position in-clude employer and participant contribu-tions and net income from investment activities. Participant contributions were approximately $266 million and $269 mil-lion for the years ended June 30, 2015 and June 30, 2014, respectively. Participant contribution rates are set by statute as a percentage of gross salary. Employer contributions increased to approximately $1,804 million in 2015 from $1,699 mil-lion in 2014.
FIDUCIARY NET POSITION The condensed Statements of Fiduciary Net Position reflect the resources available to pay benefits to members, including retirees and beneficiaries, at the end of the years reported. A summary of the System’s Fiduciary Net Position is presented below.
Condensed Statements of Fiduciary Net Position(in millions)
Increase/(Decrease) As of June 30 2014 to 2013 to 2015 2014 2013 2015 2014
Cash $ 170.6 $ 200.8 $ 146.4 $ (30.2) $ 54.4 Receivables 128.8 101.4 145.4 27.4 (44.0) Investments, at fair value * 15,032.0 14,370.5 12,289.6 661.5 2,080.9 Capital Assets, net 5.3 4.1 2.8 1.2 1.3 Total assets 15,336.7 14,676.8 12,584.2 659.9 2,092.6 Liabilities * 77.8 95.2 183.9 (17.4) (88.7) Total fiduciary net position $ 15,258.9 $ 14,581.6 $ 12,400.3 $ 677.3 $ 2,181.3
* Including securities lending collateral
State Employees’ Retirement System

13
M A N A G E M E N T ‘ S D I S C U S S I O N A N D A N A L Y S I S
DEDUCTIONS FROM FIDUCIARY NET POSITIONDeductions from Fiduciary Net Position are primar-ily benefit payments. During 2015 and 2014, the System paid out approximately $2,058.0 million and $1,940.1 million, respectively, in benefits and refunds, an increase of approximately 6%. These higher payments were mainly due to a scheduled 3% increase in retirement and other benefit payments, and a 2% increase in beneficiaries. The administra-tive costs of the System represented approximately 1% of total deductions in both 2015 and 2014.
FUNDED RATIOThe funded ratio of the plan measures the ratio of the fiduciary net position against actuarially deter-mined liabilities and is one indicator of the fiscal strength of a pension fund’s ability to meet obli-gations to its members. An annual actuarial valua-tion is performed. The most recent available valu-ation showed the funded status of the System was 35.27% on June 30, 2015 compared to 34.98% on June 30, 2014. The amount by which actuarially determined liabilities exceeded the fiduciary net position was $28.0 billion at June 30, 2015 com-pared to $27.1 billion at June 30, 2014.
INVESTMENTSInvestments of the System are combined in a com-mingled investment pool with the Judges’ Retirement System, the General Assembly Retirement System and one other State agency. The investments of this other state agency are immaterial to the total commingled investment pool. Each participating entity owns an equity position in the pool and receives proportionate investment income from the pool in accordance with respective ownership percentage. Investment gains or losses are reported in the Statement of Changes in Net Position of each retirement system.
The net investment gain for the System totaled ap-proximately $681.4 million during fiscal year 2015, versus a net investment gain of $2,169.3 million dur-ing fiscal year 2014, resulting in returns of 4.7% and 17.9%, respectively. For the three, five, and ten year period ended June 30, 2015, the ISBI Commingled Fund earned a compounded rate of return of 12.1%, 11.4%, and 6.2%, respectively.
The ISBI is exposed to general market risk. This general market risk is reflected in asset valuations fluctuating with market volatility. Any impact from market volatility on the ISBI’s investment portfolio depends in large measure on how deep the market downturn is, how long it lasts, and how it fits within fiscal year reporting periods. The resulting market risk and associated realized and unrealized gains and losses could significantly impact the ISBI’s financial condition.
CHANGES IN FIDUCIARY NET POSITION
The condensed Statements of Changes in Fiduciary Net Position reflect the changes in the resources available to pay benefits to members, including retirees and beneficiaries.
Condensed Statements of Changes in Fiduciary Net Position(In millions)
Increase/(Decrease) For the Year Ended June 30 2014 to 2013 to 2015 2014 2013 2015 2014Additions Participant contributions $ 266.1 $ 269.2 $ 248.2 $ (3.1) $ 21.0 Employer contributions 1,804.3 1,699.5 1,531.9 104.8 167.6 Investment income/(loss) 681.4 2,169.3 1,501.2 (1,487.9) 668.1 Total additions/(deductions) 2,751.8 4,138.0 3,281.3 (1,386.2) 856.7Deductions Benefits 2,034.9 1,917.0 1,800.0 117.9 117.0 Refunds 23.1 23.1 24.3 - (1.2) Administrative expenses 16.5 16.6 17.4 (0.1) (.8) Total deductions 2,074.5 1,956.7 1,841.7 117.8 115.0 Net increase/(decrease) in fiduciary net position $ 677.3 $ 2,181.3 $ 1,439.6 $ (1,504.0)$ 741.7
Questions concerning any of the informa-tion provided in this report or requests for ad-ditional financial information should be ad-dressed to the State Employees’ Retirement Sys-tem of Illinois, Accounting Divi-sion, 2101 S. Veterans Park-way, P. O. Box 19255, Spring-field, Illinois 62794
State Employees’ Retirement System

14
M A N A G E M E N T ‘ S D I S C U S S I O N A N D A N A L Y S I S
LEGISLATIVEPublic Act 98-0599 (“The Act”) was signed by the Gover-nor on December 5, 2013. The Act amended the Illinois Pension Code, and was effective June 1, 2014. The Act applied to all active, inactive and retired Tier 1 members. Tier 2 members were not affected.
The Act’s goal was to stabilize retirement system finances and eliminate the retirement system’s unfunded liability by 2045. The Act reduced the annual pension adjust-ments for current and future retirees and required the skipping of a certain number of the annual pension adjustments for future annuitants retiring on or after July 1, 2014.
The number of annual adjustments to be skipped was based on the future retiree’s age at the time the Act became effective. In addition, the Act capped the pen-sionable salary amount and increased the retirement age on a graduated scale and created a new defined
contribution plan. The Act reduced the employee con-tribution toward retirement benefits by one percentage point. It provided a funding guarantee requiring the State to make the applicable employer contributions.
On January 2, 2014, a lawsuit was filed in Circuit Court which challenged the constitutionality of the new pen-sion law. A court injunction was also issued in May 2014 to delay the implementation of the new pension law.
On November 21, 2014, the Circuit Court ruled that Public Act 98-0599 was unconstitutional and void in its entirety. The State filed an appeal of the ruling directly to the Supreme Court.
The Attorney General requested an expedited sched-ule for the state’s appeal to the Illinois Supreme Court and the Court established that schedule. On March 11, 2015 oral arguments were presented to the Supreme Court.
On May 8, 2015 the Illinois Supreme Court affirmed the Sangamon County Circuit Court decision that this new pension law was unconstitutional and void and unenforceable in its entirety.
State Employees’ Retirement System

15
STATE EMPLOYEES’ RETIREMENT SYSTEM OF ILLINOIS
Statements of Fiduciary Net PositionJune 30, 2015 and 2014
2015 2014Assets
Cash $ 170,646,589 $ 200,752,173
Receivables: Contributions: Participants 14,152,324 17,207,484 Employing state agencies 109,810,082 79,511,794 Other accounts 4,784,680 4,682,423 Total Receivables 128,747,086 101,401,701
Investments - held in the Illinois State Board of Investment Commingled Fund at fair value 14,967,254,053 14,286,499,013Securities lending collateral with State Treasurer 64,779,000 84,013,000
Capital Assets, net 5,272,553 4,122,801 Total Assets 15,336,699,281 14,676,788,688
Liabilities
Benefits payable 5,847,397 5,106,425Refunds payable 1,055,043 674,361Administrative expenses payable 2,171,343 1,714,067Participants’ deferred service credit accounts 266,753 118,146Due to the State of Illinois 3,713,173 3,596,448Securities lending collateral 64,779,000 84,013,000 Total Liabilities 77,832,709 95,222,447
Net position-restricted for pensions $ 15,258,866,572 $ 14,581,566,241 See accompanying notes to financial statements.
F I N A N C I A L S T A T E M E N T S
State Employees’ Retirement System

16
F I N A N C I A L S T A T E M E N T S
STATE EMPLOYEES’ RETIREMENT SYSTEMOF ILLINOIS
Statements of Changes in Fiduciary Net Positionfor the Years Ended June 30, 2015 and 2014
2015 2014Additions:
Contributions:
Participants $ 266,139,156 $ 269,232,241
Employing state agencies and appropriations 1,804,319,356 1,699,447,826
Total Contributions 2,070,458,512 1,968,680,067
Investment income:
Net appreciation in fair value of investments 240,297,223 1,809,958,589
Interest and dividends 480,283,398 396,793,756
Less investment expense, other than from securities lending (42,184,943) (40,473,085)
Net income from investing, other than from securities lending 678,395,678 2,166,279,260
Net income from securities lending 2,981,374 3,066,998
Net investment income 681,377,052 2,169,346,258
Total Additions 2,751,835,564 4,138,026,325
Deductions:
Benefits:
Retirement annuities 1,833,999,371 1,720,825,103
Survivor annuities 121,930,337 114,177,228
Disability benefits 63,929,747 64,782,236
Lump sum benefits 14,998,980 17,278,072
Total Benefits 2,034,858,435 1,917,062,639
Refunds (including transfers to reciprocating systems) 23,128,975 23,082,814 Administrative 16,547,823 16,615,105Total Deductions 2,074,535,233 1,956,760,558
Net Increase/(Decrease) 677,300,331 2,181,265,767
Net position restricted for pensions
Beginning of year 14,581,566,241 12,400,300,474
End of year $ 15,258,866,572 $ 14,581,566,241
See accompanying notes to financial statements.
State Employees’ Retirement System

17
F I N A N C I A L S T A T E M E N T S
STATE EMPLOYEES’ RETIREMENT SYSTEM OF ILLINOIS
Notes to Financial Statements June 30, 2015 and 2014
1. Reporting EntityGenerally accepted accounting principles require that the financial reporting entity include: 1) the primary government; 2) organizations for which the primary government is financially accountable; and 3) other organizations for which the nature and significance of their relationship with the primary government are such that exclusion would cause the reporting entity’s financial statement to be misleading or in-complete.
The State Employees’ Retirement System of Illinois (System) is administered by a Board of Trustees consisting of thirteen persons, which includes: a. the Comptroller, who shall be the Chairperson; b. six persons appointed by the Governor with the advice and consent of the Senate who may not be members of the system or hold an elective State office and
who shall serve for a term of 5 years, except that the terms of the initial appointees under the amendatory Act of the 96th General Assembly shall be as follows: 3 for a term of 3 years and 3 for a term of 5 years; c. four active participants of the System having at least 8 years of creditable service, to be elected from the contributing members of the System by the contribut-ing members; and d. two annuitants of the System who have been annuitants for at least one full year, to be elected from and by the annuitants of the System.
Based on the criteria of the Governmental Account-ing Standards Board Statement No. 61, there are no other state agencies, boards or commissions, or other organizations required to be combined with the Sys-tem. However, the System is considered to be part of the State of Illinois financial reporting entity, and
is to be combined and included in the State of Illinois’ comprehensive annual financial report.
Pursuant to federal tax laws and regulations governing the ad-ministration of public employee pension plans, the System has established a separate fund for the sole purpose of disbursing benefits in accordance with Section 415 of the Internal Revenue Code. For fiscal year 2015 and 2014, receipts were approximately $451,500 and $156,700, respectively. For fiscal year 2015 and 2014, disbursements were approximately $340,900 and $147,300, respectively.
Due to the immaterial nature of the separate fund, these receipts and disbursements have been included in the financial statements of the System.
At June 30, 2015 and 2014, the number of participating state agencies, boards and commissions totaled: 2015 2014State agencies 40 40State boards and commissions 42 43TOTAL 82 83 At June 30, 2015 and 2014, SERS membership consisted of:
Retirees and beneficiaries currently receiving benefits: Retirement annuities 54,802 53,478 Survivors’ annuities 10,889 10,819 Disability benefits 2,263 2,312 TOTAL 67,954 66,609Inactive employees entitled to benefits, but not yet receiving them 4,180 4,178TOTAL 72,134 70,787
Current Employees: Vested: Coordinated with Social Security 38,214 39,744 Noncoordinated 1,635 1,580 Nonvested: Coordinated with Social Security 22,706 20,443 Noncoordinated 718 1,077TOTAL 63,273 62,844
Operation of the System and the direction of its policies are the responsibility of the Board of Trustees of the System.
State Employees’ Retirement System

18
F I N A N C I A L S T A T E M E N T S
2. Plan DescriptionThe System is the administrator of a single-employer, defined benefit public employee retirement system (PERS) established and administered by the State of Illinois to provide pension benefits for its employees. The plan is comprised of two tiers of contribution requirements and benefit levels. The provisions below apply to both Tier 1 & 2 employees, except where noted. A summary of the plan provisions pertaining to eligibility and membership, contributions, and benefits are displayed in the table below:
a. Eligibility and Membership
Generally, anyone entering state service, except those in positions subject to membership in certain other state sponsored retirement systems, persons employed after June 30, 1979 as public service employment program participants under the Federal CETA program, and other exceptions as indicated in state law, become members of the System immediately.
Employees appointed by the Governor and requiring confirmation by the State of Illinois Senate may elect to become members of the System.
b. Employee Contributions
Participating members contribute specified percentages of their salaries for retirement annuities and sur-vivors’ annuities in accordance with Chapter 40, Section 5/14-133 of the Illinois Compiled Statutes (ILCS).
Contributions are excluded from gross income for Federal and State income tax purposes. The total contribution rate is 4% if the member is covered by Social Security and 8% if the member is not covered. Certain employment categories which are eligible for benefits under alternative formulas contribute at the rate of 8 1/2% or 12 1/2 % depending upon whether or not the employee is covered by Social Security. Participants’ contributions are fully refundable, without interest, upon withdrawal from state employment.
Tier 1 Tier 2
No annual compensation limit on contributions. Beginning on or after January 1, 2011, annual com-pensation on which contributions are taken cannot exceed $106,800. This amount increases annually by 3% or one-half of the Consumer Price Index, which-ever is less. The salary limits for calendar years 2015 and 2014 are $111,572 and $110,631, respectively.
c. Employer Contributions
The State of Illinois is obligated to make payment for the required departmental employer contributions, all allowances, annuities, any benefits granted under Chapter 40, Article 5/14 of the ILCS and all admin-istrative expenses of the System to the extent specified in the ILCS. State law provides that the employer contribution rate be determined based upon the results of each annual actuarial valuation.
d. Retirement Annuity BenefitsThe System is governed by Chapter 40, Article 5/14 of the ILCS. Vesting and benefit provisions of the System are defined in the ILCS. The retirement annuity is based on the member’s final average compensa-tion and the number of years of service credit that have been established. The retirement benefit formula available to general state employees is 1.67% for each year of covered service and 2.2% for each year of noncovered service. Alternative formula employees have a formula of 2.5% for covered service and 3.0% for noncovered service.
The maximum retirement annuity payable is 75% of final average compensation for regular employees and 80% for alternative formula employees. The minimum retirement annuity payable is $15.00 for each year of covered employment and $25.00 for each year of noncovered employment.
State Employees’ Retirement System

19
F I N A N C I A L S T A T E M E N T S
Regular Formula Tier 1 Regular Formula Tier 2
A member must have a minimum of eight years of service credit and may retire at:
• Age 60, with 8 years of service credit.
• Any age, when the member’s age (years & whole months) plus years of service credit (years & whole months) equal 85 years (1,020 months) (Rule of 85) with eight years of credited service.
• Between ages 55-60 with 25-30 years of service credit (reduced 1/2 of 1% for each month under age 60).
The retirement benefit is based on final average com-pensation and credited service. Final average compen-sation is the 48 highest consecutive months of service
within the last 120 months of service.
Under the Rule of 85, a member is eligible for the first 3% increase on January 1 following the first full year of retirement, even if the member is not age 60. If the member retires at age 60 or older, he/she will receive a 3% pension increase every year on January 1, following the first full year of retirement.
If the member retires before age 60 with a reduced retirement benefit, he/she will receive a 3% pension increase every January 1 after the member turns age 60 and has been retired at least one full year. These pension increases are not limited by the 75% maximum.
Members eligible for the alternative formula may retire at age 50 with 25 years of service credit, or at age 55 with 20 years of service credit.
Final average compensation is figured one of three ways:
• The average of the highest 48 consecutive months over the last 120 months of service (for members in service prior to January 1, 1998).
• Average of last 48 months of service.
• Final rate of pay: cannot exceed the average of the last 24 months of pay by 115%.
Alternative formula retirees receive their first 3% pen-sion increase on January 1 following the first full year of retirement after age 55. These increases are not limited by the 80% maximum.
A member must have a minimum of 10 years of cred-ited service and may retire at:
• Age 67, with 10 years of credited service.
• Between ages 62-67 with 10 years of credited service (reduced 1/2 of 1% for each month under age 67).
The retirement benefit is based on final average com-pensation and credited service. For regular formula employees, final average compensation is the average of the 96 highest consecutive months of service within the last 120 months of service. The retirement benefit is calculated on a maximum salary of $106,800. This amount increases annually by 3% or one-half of the Consumer Price Index, whichever is less.
If the member retires at age 67 or older, he/she will receive a pension increase of 3% or one-half of the Consumer Price Index for the preceding calendar year, whichever is less, every year on January 1, follow-ing the first full year of retirement. The salary limits for calendar years 2015 and 2014 are $111,572 and $110,631, respectively. If the member retires before age 67 with a reduced retirement benefit, he/she will receive a pension in-crease of 3% or one-half of the Consumer Price Index for the preceding calendar year, whichever is less, every January 1 after the member turns age 67 and has been retired at least one full year. These pension increases are not limited by the 75% maximum.
Members eligible for the alternative formula may retire at age 60 with 20 years of service.
Final average compensation is the average monthly salary during the 96 highest consecutive months of ser-vice within the last 120 months. The retirement benefit is calculated on a maximum salary of $106,800. This amount increases annually by 3% or one-half of the Consumer Price Index, whichever is less. The salary limits for calendar years 2015 and 2014 are $111,572 and $110,631, respectively.
Alternative formula retirees receive their first pension increase of 3% or one-half of the Consumer Price In-dex for the preceding calendar year, whichever is less, following the first full year of retirement after age 60. These increases are not limited by the 80% maximum.
Alternative Formula Tier 1 Alternative Formula Tier 2
State Employees’ Retirement System

20
F I N A N C I A L S T A T E M E N T S
e. Disability & Death BenefitsOccupational and nonoccupational (including tem-porary) disability benefits are available through the System. To be eligible for nonoccupational (includ-ing temporary) disability benefits, an employee must have at least eighteen months of credited service with the System.
The nonoccupational (including temporary) disability benefit is equal to 50% of the monthly rate of compen-sation of the employee on the date of removal from the payroll. Occupational disability benefits are provided when the member becomes disabled as a direct result
Tier 1 Tier 2
For disability benefits, final average compensation is the rate of pay on the date of the disability, or the 48 highest consecutive months of service within the last 10 years, whichever is greater.
For disability benefits, final average compensation is the rate of pay on the date of the disability, or the 96 highest consecutive months of service within the last 10 years, whichever is greater. The disability benefit is calculated on a maximum salary of $106,800. The salary limits for calendar years 2015 and 2014 are $111,572 and $110,631, respectively.
3. Summary of Significant Accounting Policies & Plan Asset Mattersa. Basis of AccountingThe financial transactions of the System are main-tained and these financial statements have been prepared using the accrual basis of accounting in conformity with generally accepted accounting principles. Employee and employer contributions are recognized as revenues when due pursuant to statutory requirements.
Benefits and refunds are recognized as expenses when due and payable in accordance with the terms of the plan.
b. CashThe System retains all of its available cash in a com-mingled investment pool managed by the Treasurer of the State of Illinois (Treasurer). All deposits are fully collateralized by the Treasurer.
“Available cash” is determined to be that amount which is required for the current operating expendi-tures of the System. The excess of available cash is transferred to the Illinois State Board of Investment (ISBI) for purposes of long-term investment for the System.
c. Implementation of New Accounting StandardsGASB Statement No. 65, “Items Previously Reported as Assets and Liabilities”, establishes accounting and financial reporting standards that reclassify and recognize, as deferred outflows of resources
or deferred inflows of resources, certain items that were previously reported as assets and liabilities. The Statement also provides other financial report-ing guidance related to the impact of the financial statement elements deferred outflows of resources and deferred inflows of resources, such as changes in the determination of the major fund calculations and limiting the use of the term “deferred” in finan-cial statement presentations. The System implement-ed this Statement for the year ended June 30, 2014. Adoption of GASB Statement No. 65 had no effect on the System’s financial statements.
GASB Statement No. 67, “Financial Reporting for Pen-sion Plans, an amendment of GASB Statement No. 25”, was established to provide improved financial report-ing by state and local governmental pension plans. The scope of the Statement addresses accounting and financial reporting for the activities of pension plans that are administered through trusts or equivalent ar-rangements. For defined benefit pension plans, the Statement establishes standards of financial reporting for separately issued financial reports and specifies the required approach to measuring the pension liability for benefits provided through the pension plan. The System implemented this Statement for the year ended June 30, 2014. Adoption of GASB Statement No. 67 had no effect on the System’s fiduciary net position but changed the approach for measuring the pension lia-bility and required certain changes to note disclosures and required supplementary information.
of injuries or diseases arising out of and in the course of state employment. The monthly benefit is equal to 75% of the monthly rate of compensation on the date of removal from the payroll. This benefit amount is reduced by Workers’ Compensation or payments under the Occupational Diseases Act.
Occupational and nonoccupational death benefits are also available through the System. Certain nonoc-cupational death benefits vest after eighteen months of credited service. Occupational death benefits are provided from the date of employment.
State Employees’ Retirement System

21
F I N A N C I A L S T A T E M E N T S
e. Actuarial Experience ReviewIn accordance with Illinois Compiled Statutes, an ac-tuarial experience review is to be performed at least once every five years to determine the adequacy of actuarial assumptions regarding the mortality, retire-ment, disability, employment, turnover, interest and earnable compensation of the members and benefi-ciaries of the System. An experience review was last performed as of June 30, 2013 resulting in the adop-tion of new assumptions as of June 30, 2014.
f. Administrative ExpensesExpenses related to the administration of the Sys-tem are financed through investment earnings and employer retirement contributions. These expenses are budgeted and approved by the System’s Board of Trustees.
g. Risk ManagementThe System, as part of the primary government of the State, provides for risks of loss associated with workers’ compensation and general liability through the State’s self-insurance program. The System ob-tains commercial insurance for fidelity, surety, and property. There have been no commercial insurance claims in the past four fiscal years.
h. General LitigationThe System is subject to claims and lawsuits that arise primarily in the ordinary course of business. It is the opinion of management that the disposition or ulti-mate resolution of such claims and lawsuits will not have a material adverse effect on the plan net assets or the changes in plan net assets of the System.
i. Use of EstimatesIn preparing financial statements in conformity with U.S. generally accepted accounting principles, the System makes estimates and assumptions that af-fect the reported amounts of assets and liabilities and disclosures of contingent assets and liabilities at the date of the financial statements, as well as the reported amounts of revenue and expenses during the reporting period. Actual results could differ from those estimates and assumptions.
d. Methods Used to Value InvestmentsInvestments are managed by the ISBI pursuant to Chapter 40, Article 5/22A of the Illinois Compiled Statutes (ILCS) and are maintained in the ISBI Com-mingled Fund.
Investments owned are reported at fair value as follows: (1) U.S. Government and Agency, Foreign and Corporate Obligations, Convertible Bonds – prices quoted by a major dealer in such securities; (2) Common Stock and Equity Funds, Foreign Preferred Stock, Foreign Equity Securities, Forward Foreign Currency Contracts and Options: (a) Listed – closing prices as reported on the composite summary of national securities exchanges; (b) Over-the-counter – bid prices; (3) Money Market Instruments – average cost which approximates fair values; (4) Real Estate Investments – fair values based on audited financial statements of the funds and then adjusted by the ISBI and its investment managers for activity from audit date to fiscal year end; (5) Alternative Investments (Private Equity, Hedge Funds, Bank Loans, and Real Assets) - fair values based on audited financial statements of the funds and then adjusted by the ISBI and its investment managers for activity from audit date to fiscal year end; (6) Commingled Funds - fair values based on audited financial statements of the funds and then adjusted by the ISBI and its investment managers for activity from audit date to fiscal year end.
Units of the ISBI Commingled Fund are issued to the participating entities on the last day of the month based on the unit net asset value calculated as of that date. Net investment income of the ISBI Com-mingled Fund is allocated to each of the participat-ing entities on the last day of the month on the basis of percentage of accumulated units owned by the respective systems. Management expenses are deducted monthly from income before distribution.
The investment authority of the ISBI is provided in Chapter 40, Section 5/22A-112 of the ILCS. Such investment authority requires that all opportunities be undertaken with care, skill, prudence and dili-gence given prevailing circumstances that a prudent person acting in like capacity and experience would undertake.
State Employees’ Retirement System

22
F I N A N C I A L S T A T E M E N T S
Summary of the ISBI Fund’s investments at fair value by type June 30, 2015 June 30, 2014
U.S. govt. and agency obligations $ 907,835,826 $ 784,475,648Foreign obligations 892,854,266 832,282,402Corporate obligations 814,440,237 799,514,242Common stock & equity funds 4,748,492,740 4,553,283,316Commingled funds 770,805,046 733,010,980Foreign equity securities 2,379,999,098 2,346,503,129Foreign preferred stock 177,639 72,907Hedge funds 1,576,250,129 1,485,145,060Real estate funds 1,610,826,230 1,483,445,971Private equity 667,080,662 667,730,266Money market instruments 231,115,398 217,737,000Real assets 532,718,107 524,284,793Bank loans 697,836,613 689,256,558Foreign currency forward contracts 979,645 (637,600) Total investments $ 15,831,411,636 $ 15,116,104,672
Deposits Custodial credit risk for deposits is the risk that, in the event of a financial institution failure, the System’s and ISBI’s deposits may not be returned. All non-investment related bank balances at year-end are in-sured or collateralized with securities held by the Illinois State Treasurer or agents in the name of the State Treasurer. As of June 30, 2015 and 2014, the ISBI had non-investment related bank balances of $1,433,111 and $474,083, respective-ly. During fiscal year 2007, a Credit Risk Policy was implemented by the ISBI staff and formally adopted by the ISBI Board in July of 2007. The policy outlines the control procedures used to monitor cus-todial credit risk. These assets are under
the custody of State Street Bank and Trust Company and Deutsche Bank AG, NY Branch. State Street Bank and Trust Company has an AA- Long-term Deposit/Debt rat-ing by Standard & Poor’s and an Aa2 rating by Moody. Deutsche Bank AG has a BBB+ Long-term rating by Stan-dard & Poor’s and an A3 rating by Moody’s. Certain investments of the ISBI with maturities of 90 days or less would be considered cash equivalents; these consist of short-term investment funds and U.S. Treasury bills with maturities of 90 days or less, which are not sub-ject to the custodial credit risk. For financial statement presentation and investment purposes, the ISBI reports these types of cash equivalents as Money Market Instru-ments within their investments. As of June 30, 2015 and 2014, the ISBI had investment related bank balances of $13,575,431 and $8,923,164, respectively. These balanc-es include USD and foreign cash balances. As of January 1, 2013, cash held in the investment related bank ac-count is neither insured nor collateralized for amounts in excess of $250,000. At any given point and time, the foreign cash balances may be exposed to custodial cred-it risk.
Rate of Return For the fiscal years ended June 30, 2015 and 2014, the annual money-weighted rate of return on pension plan investments, net of pension plan investment expense, was 4.74 percent and 17.86 percent, respectively. The money-weighted rate of return expresses investment performance, net of investment expense, adjusted for the changing amounts actually invested.
4. Investments
State Employees’ Retirement System

23
F I N A N C I A L S T A T E M E N T S
Investment Commitments The ISBI’s real estate and private equity investment port-folios consist of passive interests in limited partnerships. The ISBI had outstanding commitments to these limited partnerships of approximately $460 million and $426 million as of June 30, 2015 and 2014, respectively. Also, at the end of fiscal years 2015 and 2014, the ISBI had outstanding commitments of $4 million and $61 million to separate real estate accounts, respectively. At the end of fiscal years 2015 and 2014, the ISBI had outstanding amounts of $153 million and $32 million committed to real assets, respectively. The ISBI would fund outstand-ing commitments by utilizing available cash and then selling liquid securities in the portfolio as necessary.
Investment LiquidityThe ISBI holds investments in hedge funds, real estate funds, private equity funds and real assets that are con-sidered illiquid by the very nature of the investment. Market risk exists with respect to these investments as the ISBI may not be able to exit from the investments during periods of significant market value declines.
Alternative InvestmentsThe ISBI’s investments in hedge funds are structured to achieve a diversified hedged equity fund-of-funds portfolio. Capital is allocated to a select group of hedge fund managers that invest predominately in equity se-curities, both long and short. The investments shall be managed with the intent of preserving capital in a de-clining market and in a rising market they will generate a smaller return than the overall equity market. These investments are redeemable once the underlying assets are liquidated.
The ISBI’s investments in Private Equity and Real Estate funds represent investment vehicles used for making in-vestments in various equity and debt securities accord-ing to the investment strategies as determined by the fund managers at the commencement of the fund.
Investment strategies of Private Equity funds include, but are not limited to, leveraged buyouts, venture capi-tal, growth capital and mezzanine capital.
Investment strategies of Real Estate investments include, but are not limited to, the purchase, development, own-ership, management, rental and/or sale of real estate for profit.
Certain real estate investments are leveraged whereby partnerships have been established to purchase prop-erties through a combination of contributions from the ISBI and through acquisition of debt. At June 30, 2015, real estate equities of approximately $1,611 million are reported at estimated fair value. Of this amount, $1,415 million is equity and $196 million is long term debt. At June 30, 2014, real estate equities of approximately $1,483 million are reported at estimated fair value. Of this amount, $1,288 million is equity and $195 million is long term debt.
Required repayment of real estate debt, which is non-recourse debt is as follows as of June 30, 2015 and 2014:
The ISBI’s investments in Real Assets represent pooled investment vehicles used to seek capital appreciation and current income by acquiring, holding, financing, refinancing and disposing of infrastructure investments and farmland assets. Real Assets include various public works (e.g. bridges, tunnels, toll roads, airports, public transportation and other public works) that are made typically as a part of a privatization initiative on the part of a government entity.
A Commingled fund is a kind of mutual fund or common trust fund which consists of multiple kinds of assets from several accounts combined together. ‘Commingling’ these separate assets mitigates risk for the trader through investment diversification and reduces the cost of man-aging each account separately. Commingled funds are also called “pooled funds” and “master trusts”.
Debt Maturities Year Ending June 30 2015 2014
2016 $ 27,418,790 $ 28,240,488 2017 56,584,691 57,416,040 2018 22,500,000 – 2019 44,355,719 – 2020–2024 45,057,515 88,046,051 2025–2026 – 21,321,503 $ 195,916,715 $ 195,024,082
State Employees’ Retirement System

24
F I N A N C I A L S T A T E M E N T S
Moody’s Quality Rating 2015 2014
U.S. Government and AAA $ 378,200,000 $ 425,527,082 Agency obligations AA 9,517,822 7,344,587 A – 12,943,001 Not Rated 520,118,004 338,660,978 Total U.S. govt. and agency obligations $ 907,835,826 $ 784,475,648 Foreign Obligations AAA $ 132,272,871 $ 141,563,493 AA 192,601,201 186,950,502 A 107,666,050 81,171,275 BAA 228,447,204 204,409,825 BA 44,533,922 36,645,027 B 51,489,197 41,169,215 Not rated 135,843,821 140,373,065 Total Foreign Obligations $ 892,854,266 $ 832,282,402
Corporate Obligations Bank and Finance AA $ 3,829,086 $ 2,957,585 A 42,709,447 50,029,728 BAA 73,781,060 82,453,817 BA 43,936,037 34,830,061 B 38,781,176 35,544,808 Not Rated 1,183 2,340,263 Total Bank and Finance $ 203,037,989 $ 208,156,262
Industrial AAA $ 1,112,464 $ – AA 14,086,661 10,224,115 A 19,011,440 21,987,306 BAA 36,578,192 44,506,699 BA 150,284,966 159,584,773 B 220,705,212 209,039,592 CAA 6,437,020 6,992,615 Not Rated 19,036,249 13,073,374 Total Industrial $ 467,252,204 $ 465,408,474 Other AAA $ 1,520,669 $ 1,521,596 A 7,734,927 7,995,874 BAA 15,470,896 19,568,129 BA 47,098,831 48,791,454 B 72,324,721 48,352,453 Not rated – (280,000) Total Other $ 144,150,044 $ 125,949,506
Total Corporate Obligations $ 814,440,237 $ 799,514,242
Money Market Not Rated $ 231,115,398 $ 217,737,000 Total Money Market $ 231,115,398 $ 217,737,000
Concentration of Credit Risk and Credit Risk for Investments The ISBI’s portfolio of investments is managed by professional investment management firms. These investment management firms are required to maintain diversified portfolios. Each investment manager must comply with risk management guidelines in-dividually assigned to them as part of their investment management agree-ment. The ISBI did not have any single issuer investment that exceeded 5% of the total net assets of the fund as of June 30, 2015 and 2014. The table to the right presents the quality ratings of debt securities held by the ISBI as of June 30, 2015 and 2014.
State Employees’ Retirement System

25
F I N A N C I A L S T A T E M E N T S
Custodial Credit Risk for Investments The custodial credit risk for investments is the risk that, in the event of the failure of the counterparty to a transaction, the ISBI will not be able to recover the value of investments or collateral securities that are in the possession of a counterparty. As of June 30, 2015 and 2014, there were no investments that were unin-sured and unregistered, securities held by the counter-party or by its trust department or agent but not in the ISBI’s name.
Interest Rate RiskThe ISBI manages its exposure to fair value losses arising from interest rate risk by diversifying the debt securities portfolio and maintaining the debt securities portfolio to an effective weighted duration between 80% and 120% of the benchmark index.
2015 2014
Effective Effective Weighted Weighted Duration DurationInvestment Type Fair Value Years Fair Value Years
U.S. Govt. and Agency Obligations U.S. Government $ 450,342,908 7.7 $ 380,521,606 6.7 Federal Agency 457,492,918 3.3 403,954,042 3.5Foreign Obligations 892,854,266 6.3 832,282,402 5.8Corporate Obligations Bank & Finance 203,037,989 5.5 208,156,262 5.8 Industrial 467,252,204 5.1 465,408,474 4.7 Other 144,150,044 4.6 125,949,506 4.6Total $ 2,615,130,329 $ 2,416,272,292
Duration is the measure of a debt investment’s expo-sure to fair value changes arising from changing interest rates. It uses the present value of cash flows, weighted for those cash flows as a percentage of the investment’s fair value. The effective duration measures the sensitiv-ity of market price to parallel shifts in the yield curve. As of June 30, 2015 and 2014, the ISBI benchmarked its debt security portfolio to Barclay’s Capital Intermediate U.S. Government/Credit Bond Index. At June 30, 2015 and 2014, the effective duration of the Barclay’s Capital Intermediate U.S. Government/Credit Bond Index was 5.6 years and 5.6 years, respectively. At the same point in time, the effective duration of the ISBI debt security portfolio at June 30, 2015 and 2014 was 5.7 years and 5.3 years, respectively. The table below shows the detail of the duration by investment type as of June 30, 2015 and 2014.
State Employees’ Retirement System

26
F I N A N C I A L S T A T E M E N T S
Foreign Currency RiskThe ISBI’s international portfolio is constructed on the principles of diversification, quality growth, and value. Risk of loss arises from changes in currency exchange rates. International managers may also engage in transactions to hedge currency at their discretion.
Certain investments held in infrastructure funds trade in a reported currency of Euro-based dollars valued at $52,895,123 and $61,343,167 as of June 30, 2015 and 2014, respectively. The table below presents the foreign currency risk by type of investment as of June 30, 2015 and 2014.
2015 2014 Foreign Equity Securities Foreign Foreign Equity Securities ForeignCurrency & Foreign Preferred Stock Obligations & Foreign Preferred Stock Obligations
Argentine Peso $ – $ 564,401 $ – $ –Australian Dollar 101,071,595 26,524,849 90,774,346 23,031,004 Brazilian Real 19,506,199 22,032,221 20,078,894 29,522,411Canadian Dollar 116,709,419 26,779,874 141,782,577 36,442,872Chilean Peso – 4,168,867 – 3,713,553Colombian Peso 377,334 15,312,245 – 15,223,691Czech Koruna 779,797 6,990,145 804,780 3,560,005Danish Krone 56,479,696 4,766,276 44,415,985 5,392,244Egyptian Pound 498,599 – 627,634 –English Pound Sterling 407,189,285 61,148,582 410,712,209 46,015,531Euro Currency 614,538,415 132,800,775 614,324,960 144,113,041Hong Kong Dollar 147,171,701 2,586,762 129,948,463 2,550,498Hungarian Forint 650,782 3,367,039 642,189 329,052Indonesian Rupian 2,672,277 14,066,740 2,609,187 12,085,949Israeli Shekel 2,693,371 4,780,588 2,886,339 4,040,894Japanese Yen 315,281,746 71,139,096 302,710,537 66,876,957Malaysian Ringgit 3,841,562 22,209,736 453,753 20,518,690Mexican Peso 7,344,176 48,063,655 11,149,254 41,011,377New Israeli Sheqel 1,226,963 – – –New Russian Ruble – 28,747,709 – 41,669,459New Zealand Dollar 4,165,766 2,597,322 3,297,560 2,365,325Nigerian Naira – – – 10,909,408Norwegian Krone 19,984,988 7,187,208 30,066,361 5,799,023Peruvian Nouveau Sol – 751,184 – 1,817,219Philippine Peso 1,551,135 724,551 – 755,069Polish Zloty 64,211 28,095,503 – 25,311,976Qatari Rial 458,487 – – –Singapore Dollar 26,658,642 5,534,326 34,481,140 5,121,850 South African Rand 19,045,501 25,092,609 14,851,595 23,599,596South Korean Won 73,721,461 24,800,431 72,778,832 21,003,245Swedish Krona 40,012,576 5,823,010 41,872,359 2,241,325Swiss Franc 241,987,995 13,799,902 219,282,841 12,141,173Thailand Baht 2,087,372 12,954,145 – 8,619,111Turkish Lira 101,877 30,121,571 – 18,968,168UAE Dirham 693,879 – – –Uruguayan Peso – 1,760,087 – 4,198,906Foreign investments denominated in U.S. Dollars 151,609,930 237,562,857 156,024,241 193,333,780 Total $ 2,380,176,737 $ 892,854,266 $ 2,346,576,036 $ 832,282,402
State Employees’ Retirement System

27
F I N A N C I A L S T A T E M E N T S
Securities Lending The ISBI participates in a securities lending program with Deutsche Bank AG, New York Branch who acts as securities lending agent. Prior to June 22, 2015 the ISBI participated in a Securities lending program with Credit Suisse AG, New York Branch, who acted as securities lending agent. Securities are loaned to brokers and, in return, the ISBI receives cash and non-cash collateral. All of the securities are eligible for the securities lending pro-gram. Collateral consists solely of cash and government securities having a fair value equal to or exceeding 102% of the value of the loaned securities (105% for non-U.S. securities). In the event of borrower default, Deutsche Bank AG, New York Branch provides the ISBI with coun-terparty default indemnification. Investments in the cash collateral account represent securities that were distrib-uted to the ISBI in connection with the in-kind redemp-tion of the ISBI’s ownership in the State Street Bank and Trust Company Quality Funds for Short-Term Investment (Quality D). Deutsche Bank is not responsible for any losses with regards to these legacy investments. This ar-rangement subjects the ISBI to credit risk as the credit quality of these investments may decline over time. The credit risk on the legacy investments is the risk of a pos-sible loss arising from the inability of a counterparty to meet its obligations. These losses could include the loss of principal, interest and/or decreased expected cash flows in any of the investments held in the ISBI’s cash collateral account. In the event a counterparty defaults on its obli-gations, the ISBI would need to credit the cash collateral account with the amount of the default to make the ac-count whole so that once loaned securities are returned, the cash pledged by borrowers can be returned to them. As of June 30, 2015 and 2014, the collateral received exceeded the fair value of the securities loaned. As of June 30, 2015 and 2014, there were outstanding loaned investment securities having fair values of $107,922,255 and $168,534,354, respectively against which collat-eral was received with a fair value of $110,826,173 and $182,644,281, respectively. Collateral received at June 30, 2015 and 2014 consisted of $32,006,788 and $61,409,324, respectively in cash and $78,819,385 and $121,234,957, respectively in government securities for which the ISBI does not have the ability to pledge or sell.
The cash collateral received is invested in a short-term instrument having a fair value of $30,394,702 and $60,114,354 as of June 30, 2015 and 2014, respectively. This investment pool had an average duration of 32.19 days and 23.86 days as of June 30, 2015 and 2014, re-spectively. Any decrease in the fair value of invested cash collateral is recorded by the ISBI as unrealized losses and reported as a component of the investment income/loss on the ISBI’s Statement of Changes in Net Position.
Cash and cash equivalents included in the System’s Statement of Fiduciary Net Position consist of deposits held in the State Treasury. The Illinois Office of the Trea-surer invests the deposits held and allocates investment income on a monthly basis.
The State Treasurer lends securities to broker-dealers and other entities for collateral that will be returned for the same securities in the future. The State Treasurer has, through a Securities Lending Agreement, authorized Deutsche Bank AG to lend the State Treasurer’s securities to broker–dealers and banks pursuant to a form of loan agreement.
During fiscal years 2015 and 2014, Deutsche Bank AG lent U.S. Treasury and U.S. Agency securities and re-ceived as collateral U.S. dollar denominated cash. Bor-rowers were required to deliver collateral for each loan equal to at least 100% of the aggregated fair value of the loaned securities. Loans are marked to market daily. If the fair value of collateral falls below 100%, the borrower must provide additional collateral to raise the fair value to 100%.
The State Treasurer did not impose any restrictions dur-ing fiscal years 2015 and 2014 on the amount of the loans available, eligible securities. In the event of bor-rower default, Deutsche Bank AG provides the State Treasurer with counterparty default indemnification. In addition, Deutsche Bank AG is obligated to indemnify the State Treasurer if the Deutsche Bank AG loses any securities, collateral or investments of the State Treasurer in Deutsche Bank AG’s custody. Moreover, there were no losses during fiscal years 2015 and 2014 resulting from a default of the borrowers or Deutsche Bank AG.
During fiscal years 2015 and 2014, the State Treasurer and the borrowers maintained the right to terminate all securities lending transactions on demand. The cash collateral received on each loan was invested in repur-chase agreements with approved counterparties col-lateralized with securities approved by Deutsche Bank AG and marked to market daily at no less than 102%. Because the loans are terminable at will, their duration did not generally match the duration of the investments made with the cash collateral. The State Treasurer had no credit risk as a result of its securities lending program as the collateral held exceeded the fair value of the secu-rities lent. The securities lending cash collateral received that was invested in repurchase agreements and the fair value of securities on loan for the State Treasurer as of June 30, 2015 were $4,007,450,625 and $3,980,606,070, respectively. The securities cash value collateral invested in repurchase agreements and the fair value of securi-
State Employees’ Retirement System

28
F I N A N C I A L S T A T E M E N T S
ties on loan for the State Treasurer as of June 30, 2014 were $5,758,768,925 and $5,727,657,697, respectively. The System’s portion of securities lending collateral that was invested in repurchase agreements as of June 30, 2015 and 2014 was $64,779,000 and $84,013,000, re-spectively.
Derivative Securities In fiscal year 2010, the ISBI implemented GASB State-ment No. 53 Accounting and Financial Reporting for Deriva-tive Instruments with respect to investments held in de-rivative securities. A derivative security is an investment whose payoff depends upon the value of other assets such as commodity prices, bond and stock prices, or a market index. The ISBI invests in derivative instruments including forward foreign currency contracts, futures, rights and warrants. The ISBI’s derivatives are consid-ered investment derivatives.
Foreign currency forward contracts (FX forwards) are used to protect against the currency risk in the ISBI’s for-eign equity portfolio. A foreign currency forward con-tract is an agreement to buy or sell a specific amount of a foreign currency at a specified delivery or matu-rity date for an agreed-upon price. Fluctuations in the market value of foreign currency forward contracts are marked to market on a daily basis. These investments are reported at fair value in the investment section of the ISBI’s Statement of Net Position. The gain or loss aris-ing from the difference between the original contracts and the closing of such contracts is recognized in the net increase/decrease in the fair value of investments in the ISBI’s Statement of Changes in Net Position. In May 2011, the ISBI removed language from the investment management agreements allowing managers to hedge foreign currencies and/or to hedge equity positions.
The ISBI’s investment managers use financial futures to replicate an underlying security they wish to hold (sell) in the portfolio. In certain instances, it may be benefi-cial to own a futures contract rather than the underlying security (arbitrage). Additionally, financial futures are used in the ISBI’s fixed income portfolio to adjust port-folio strategy and overall portfolio duration. A financial futures contract is an agreement to buy or sell a specific amount at a specified delivery or maturity date for an agreed-upon price. As the fair values of the futures con-tract vary from the original contract price, a gain or loss is recognized and paid to or received from the clearing-house. The gain or loss is recognized in the net increase/decrease in the fair value of investments in the ISBI’s Statement of Changes in Net Position. Financial futures represent an off-balance sheet obligation, as there are no balance sheet assets or liabilities associated with those contracts. The cash or securities to meet these ob-ligations are held in the ISBI’s investment portfolio.
The ISBI’s investment managers use options in an at-tempt to add value to the portfolio (collect premiums) or protect (hedge) a position in the portfolio. Financial options are an agreement that gives one party the right, but not the obligation, to buy or sell a specific amount of an asset for a specified price, called the strike price, on or before a specified expiration date. As a writer of financial options, the ISBI receives a premium at the outset of the agreement and bears the risk of an unfa-vorable change in the price of the financial instrument underlying the option. All written financial options are recognized as a liability in the ISBI’s Statement of Net Position. As a purchaser of financial options, the ISBI pays a premium at the outset of the agreement and the counterparty bears the risk of an unfavorable change in the price of the financial instrument underlying the option. The gain or loss associated with options is rec-ognized in the net increase/decrease in the fair value of investments in the ISBI’s Statement of Changes in Net Position.
Rights and warrants allow the ISBI’s investment manag-ers to replicate an underlying security they wish to hold (sell) in the portfolio. Rights and warrants provide the holder with the right, but not the obligation, to buy or sell a company’s stock at a predetermined price. Rights usually expire after a few weeks and warrants can expire from one to several years. Under certain circumstances, a type of warrant called Participatory Notes (P-Notes) are used in the portfolio by the ISBI’s investment man-agers that are not registered to trade in domestic Indian Capital Markets. P-Notes are issued by Indian-based brokerage firms against an underlying Indian security permitting holders to get a share in the income from the security. These investments are reported at fair value in the investment section of the ISBI’s Statement of Net Position within the common stock and foreign equity classifications. The gain or loss associated with rights and warrants is recognized in the net increase/decrease in the fair value of investments in the ISBI’s Statement of Changes in Net Position.
The fair values of the forward contracts are estimated based on the present value of their estimated future cash flows. Futures contracts are exchange traded instru-ments where the fair value is determined by the equi-librium between the forces of supply and demand. The fair value of a right or warrant closely tracks the intrinsic value of the underlying stock and can be determined ei-ther by formulaic methodology (most commonly Black-Scholes) or intrinsic value methodology.
State Employees’ Retirement System

29
F I N A N C I A L S T A T E M E N T S
Derivative transactions involve, to varying degrees, credit risk and market risk. Credit risk is the possibility that a loss may occur because a party to a transaction fails to perform according to terms. Derivatives which are exchange traded are not subject to credit risk. No derivatives held are subject to custodial credit risk. Mar-ket risk is the possibility that a change in interest (inter-est rate risk) or currency rates (foreign currency risk) will cause the value of a financial instrument to decrease or become more costly to settle. The market risk associated with derivatives, the prices of which are constantly fluc-
tuating, is regulated by imposing strict limits as to the types, amounts and degree of risk that investment man-agers may undertake. These limits are approved by the Board of Trustees and management of the ISBI and the risk positions of the investment managers are reviewed on a periodic basis to monitor compliance with the lim-its. As of June 30, 2015 and 2014, respectively, the ISBI held futures contracts whose underlying instruments were exposed to interest risk but there were no GASB 53 reportable elements. The ISBI has not adopted a formal policy specific to master netting arrangements.
The table below presents the investment derivative instruments aggregated by type that were held by the ISBI as of June 30, 2015 and 2014.
The table below shows the futures positions held by the ISBI as of June 30, 2015 and 2014.
Changes in Fair Value Fair Value at Year End Notional Amount Number of Shares 2015 2014 2015 2014 2015 2014
FX Forwards $ (1,677,653) $ (4,557,072) $ 979,645 $ (637,600) n/a n/a Futures n/a n/a n/a n/a 9,942,012 (19,492,453)Options (5,588) (9,152,466) - (2,635,570) - 3,450,575Rights (303,610) 687,576 36,595 21,258 1,943,891 32,233Warrants 154,914 43,476 300,696 145,805 74,061 77,375 $ (1,831,937) $ (12,978,487) $ 1,316,936 $ (3,106,107) 11,959,964 (15,932,270)
2015 2014 Number of Contract Number of Contract Contracts Principal* Contracts Principal*
Equity Futures Purchased 753 $78,343,610 984 $94,707,150
Fixed Income Futures Purchased 360 57,338,435 500 58,038,549
Fixed Income Futures Sold 366 49,307,563 519 90,728,863 * Contract principal amounts shown represent the market value of the underlying assets the contracts control. These are shown to present the volume of the transactions but do not reflect the extent to which positions may offset one another. These amounts do not represent the much smaller amounts potentially subject to risk. Contract principal values also do not represent actual recorded values reported in the ISBI’s Statement of Net Position.
State Employees’ Retirement System

30
F I N A N C I A L S T A T E M E N T S
The following table presents the fair value of derivative investments exposed to foreign currency risk as of June 30, 2015 and 2014:
2015 2014 Currency FX Forwards Rights Warrants Options FX Forwards Rights Warrants OptionsAustralian Dollar $ 1,906 $ - $ - $ - $ (10,223) – $ – $ –Brazilian Real 254,077 - - - (468,235) – – –Canadian Dollar (22,077) 140 - - 18,701 – – –Chilean Peso (200,371) - - - (2,651) – – –Columbian Peso 372,529 - - - (65,342) – – –Czech Koruna 14,308 - - - (3,596) – – –Danish Krone (1,024) - - - (2,479) – – –Egyptian Pound - - - - – – – –English Pound Sterling (8,411) - - - (15,658) – – –Euro Currency (6,986) 28,398 300,524 - (109,012) 8,011 140,436 –Hong Kong Dollar (61) - - - (455) – 4,326 –Hungarian Forint 71,267 - - - 3,661 – – –Indian Ruppe 51,803 - - - (40,098) – – –Indonesian Rupiah 11,571 - - - 6,912 – – –Israeli Shekel 1,008 - - - (1,833) – – –Japanese Yen 322,452 - - - 125,773 – – –Malaysian Ringgit 215,479 - - - (7,300) 11,665 – –Mexican Peso (48,321) - - - 4,770 – – –New Zealand Dollar - - - - 1,912 – – –Norwegian Krone (63) - - - (2,286) – – –Peruvian Nouveau Sol 7,789 - - - 3,634 – – –Polish Zloty (12,107) - - - 13,381 – – –Russian Ruble (402,898) - - - 72,949 – – –Singapore Dollar 15,482 - - - (3,924) – – –South African Rand 135,668 - - - (44,578) – – –South Korean Won 89,547 6,125 - - (20,558) – – –Swedish Krona (68,590) - - - 7,769 – – –Swiss Franc 16,063 - - - (65,602) – – –Taiwan Dollar - - - - 6,992 – – –Thailand Baht (4,634) - - - (944) – – –Turkish Lira 174,239 - - - (8,039) – – –Yuan Renminbi - - - - (31,241) – – –Investments denominated in U.S. dollars - 1,932 172 - – 1,582 1,043 (2,635,570)
$ 979,645 $ 36,595 $ 300,696 $ - $ (637,600) $ 21,258 $ 145,805 $ (2,635,570)
State Employees’ Retirement System

31
F I N A N C I A L S T A T E M E N T S
Other InformationThe System owns approximately 94% of the net position of the ISBI Commingled Fund as of June 30, 2015 and 2014. A schedule of investment expenses is included in the ISBI’s annual report.
For additional information on ISBI’s investments, please refer to their Annual Report as of June 30, 2015. A copy of the report can be obtained from the ISBI at 180 North LaSalle Street, Suite 2015, Chicago, Illinois 60601.
5. Funding - Statutory Contributions Required & Contributions MadeOn an annual basis, a valuation of the liabilities and reserves of the System is performed by the System’s actuarial consultants in order to determine the amount of contributions statutorily required from the State of Illinois. For fiscal year 2015 the actuary used the projected unit credit actuarial method for determining the proper employer contribution rate and amount.
For fiscal year 2015 the required employer contribu-tions was computed in accordance with the State’s funding plan. This funding legislation provides for a systematic 50 year funding plan with an ultimate goal to fund the cost of maintaining and administering the System at an actuarial funded ratio of 90%.
In addition, the funding plan provided for a 15 year phase-in period to allow the state to adapt to the increased financial commitment. Since the 15 year phase-in period ended June 30, 2010, the state’s contribution will remain at a level percentage of payroll for the next 35 years until the 90% funded level is achieved.
The total amount of statutorily required employer contributions, net of the debt service contributions, for fiscal year 2015 was $1,802,494,852. The total amount of employer contributions received from the State and other sources during fiscal year 2015 was $1,804,319,356.
The ISBI’s derivative investments in foreign currency forward contracts are held with counterparties. The credit ratings and net exposure as of June 30, 2015 and 2014 for the counterparties are as follows:
2015 2014
Moody’s Net Percentage of Net Pecentage ofRating Fair Value Exposure Net Exposure Fair Value Exposure Net Exposure
Aa3 $ 1,017,321 $ 1,017,321 52.82% $ 31,958 $ 31,958 5.47%Aa2 290,223 290,223 15.07% 135,731 135,731 23.22%Aa1 3,316 3,316 0.17% - - -%A3 288,895 288,895 15.00% - - -%A2 71,901 71,901 3.73% 291,685 291,685 49.89%A1 251,850 251,850 13.08% 2,450 2,450 0.42%Baa1 2,507 2,507 0.13% 16,943 16,943 2.90%Baa2 - - -% 105,781 105,781 18.10% $ 1,926,013 $ 1,926,013 100.00% $ 584,548 $ 584,548 100.00%
State Employees’ Retirement System
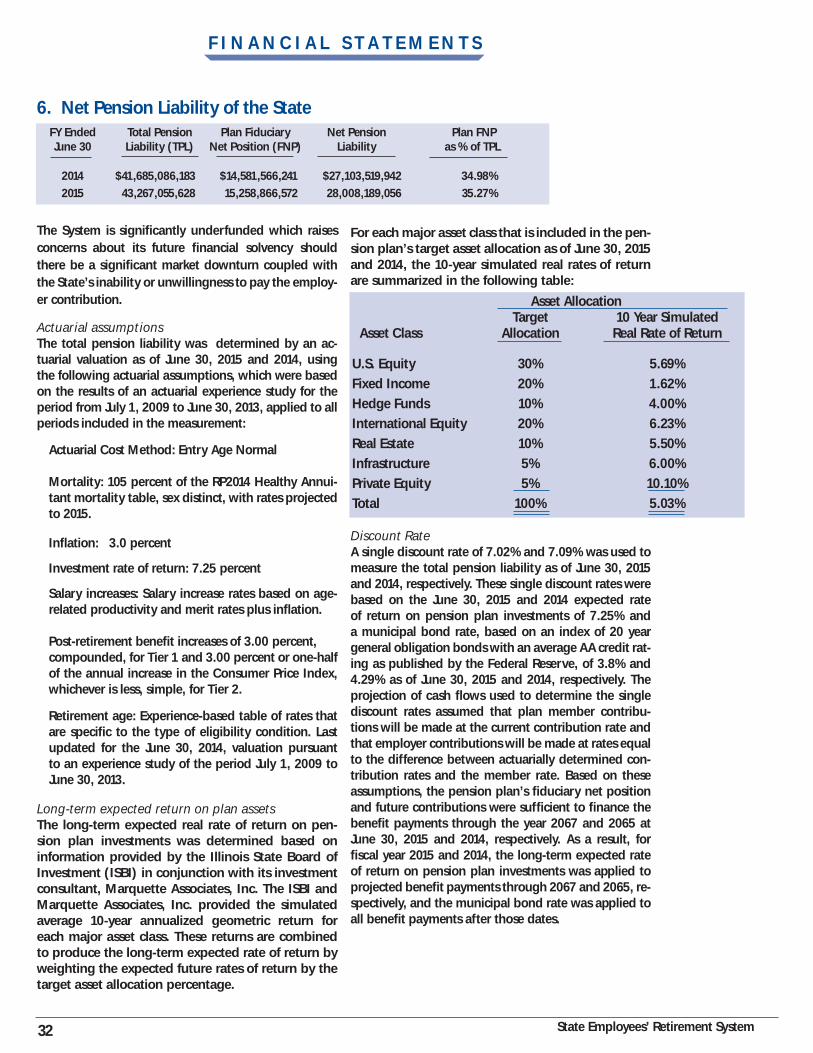
32
F I N A N C I A L S T A T E M E N T S
6. Net Pension Liability of the State
The System is significantly underfunded which raises concerns about its future financial solvency should there be a significant market downturn coupled with the State’s inability or unwillingness to pay the employ-er contribution. Actuarial assumptions The total pension liability was determined by an ac-tuarial valuation as of June 30, 2015 and 2014, using the following actuarial assumptions, which were based on the results of an actuarial experience study for the period from July 1, 2009 to June 30, 2013, applied to all periods included in the measurement:
Actuarial Cost Method: Entry Age Normal
Mortality: 105 percent of the RP2014 Healthy Annui-tant mortality table, sex distinct, with rates projected to 2015.
Inflation: 3.0 percent Investment rate of return: 7.25 percent Salary increases: Salary increase rates based on age-related productivity and merit rates plus inflation.
Post-retirement benefit increases of 3.00 percent, compounded, for Tier 1 and 3.00 percent or one-half of the annual increase in the Consumer Price Index, whichever is less, simple, for Tier 2. Retirement age: Experience-based table of rates that are specific to the type of eligibility condition. Last updated for the June 30, 2014, valuation pursuant to an experience study of the period July 1, 2009 to June 30, 2013.
Long-term expected return on plan assets The long-term expected real rate of return on pen-sion plan investments was determined based on information provided by the Illinois State Board of Investment (ISBI) in conjunction with its investment consultant, Marquette Associates, Inc. The ISBI and Marquette Associates, Inc. provided the simulated average 10-year annualized geometric return for each major asset class. These returns are combined to produce the long-term expected rate of return by weighting the expected future rates of return by the target asset allocation percentage.
For each major asset class that is included in the pen-sion plan’s target asset allocation as of June 30, 2015 and 2014, the 10-year simulated real rates of return are summarized in the following table:
Discount Rate A single discount rate of 7.02% and 7.09% was used to measure the total pension liability as of June 30, 2015 and 2014, respectively. These single discount rates were based on the June 30, 2015 and 2014 expected rate of return on pension plan investments of 7.25% and a municipal bond rate, based on an index of 20 year general obligation bonds with an average AA credit rat-ing as published by the Federal Reserve, of 3.8% and 4.29% as of June 30, 2015 and 2014, respectively. The projection of cash flows used to determine the single discount rates assumed that plan member contribu-tions will be made at the current contribution rate and that employer contributions will be made at rates equal to the difference between actuarially determined con-tribution rates and the member rate. Based on these assumptions, the pension plan’s fiduciary net position and future contributions were sufficient to finance the benefit payments through the year 2067 and 2065 at June 30, 2015 and 2014, respectively. As a result, for fiscal year 2015 and 2014, the long-term expected rate of return on pension plan investments was applied to projected benefit payments through 2067 and 2065, re-spectively, and the municipal bond rate was applied to all benefit payments after those dates.
Asset Allocation Target 10 Year Simulated Asset Class Allocation Real Rate of Return U.S. Equity 30% 5.69% Fixed Income 20% 1.62% Hedge Funds 10% 4.00% International Equity 20% 6.23% Real Estate 10% 5.50% Infrastructure 5% 6.00% Private Equity 5% 10.10% Total 100% 5.03%
FY Ended Total Pension Plan Fiduciary Net Pension Plan FNP June 30 Liability (TPL) Net Position (FNP) Liability as % of TPL 2014 $41,685,086,183 $14,581,566,241 $27,103,519,942 34.98%
2015 43,267,055,628 15,258,866,572 28,008,189,056 35.27%
State Employees’ Retirement System
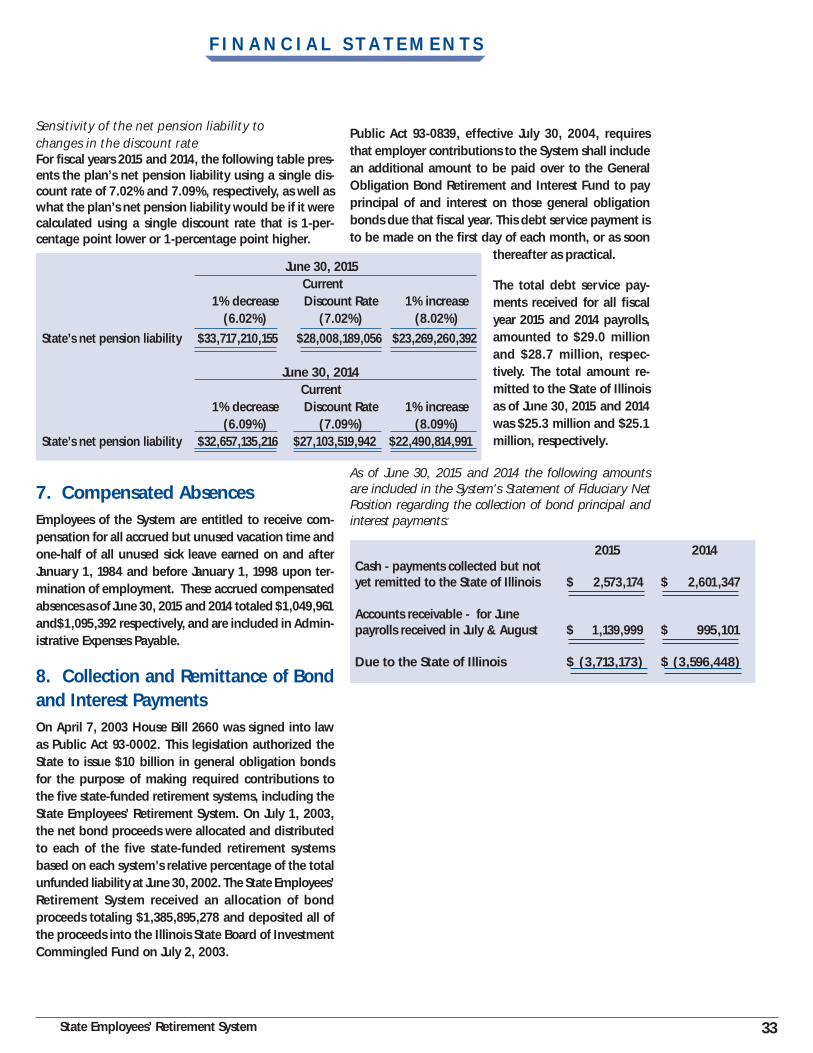
33
F I N A N C I A L S T A T E M E N T S
Sensitivity of the net pension liability to changes in the discount rate For fiscal years 2015 and 2014, the following table pres-ents the plan’s net pension liability using a single dis-count rate of 7.02% and 7.09%, respectively, as well as what the plan’s net pension liability would be if it were calculated using a single discount rate that is 1-per-centage point lower or 1-percentage point higher.
7. Compensated AbsencesEmployees of the System are entitled to receive com-pensation for all accrued but unused vacation time and one-half of all unused sick leave earned on and after January 1, 1984 and before January 1, 1998 upon ter-mination of employment. These accrued compensated absences as of June 30, 2015 and 2014 totaled $1,049,961 and$1,095,392 respectively, and are included in Admin-istrative Expenses Payable.
8. Collection and Remittance of Bond and Interest PaymentsOn April 7, 2003 House Bill 2660 was signed into law as Public Act 93-0002. This legislation authorized the State to issue $10 billion in general obligation bonds for the purpose of making required contributions to the five state-funded retirement systems, including the State Employees’ Retirement System. On July 1, 2003, the net bond proceeds were allocated and distributed to each of the five state-funded retirement systems based on each system’s relative percentage of the total unfunded liability at June 30, 2002. The State Employees’ Retirement System received an allocation of bond proceeds totaling $1,385,895,278 and deposited all of the proceeds into the Illinois State Board of Investment Commingled Fund on July 2, 2003.
2015 2014Cash - payments collected but not yet remitted to the State of Illinois $ 2,573,174 $ 2,601,347
Accounts receivable - for Junepayrolls received in July & August $ 1,139,999 $ 995,101
Due to the State of Illinois $ (3,713,173) $ (3,596,448)
As of June 30, 2015 and 2014 the following amounts are included in the System’s Statement of Fiduciary Net Position regarding the collection of bond principal and interest payments:
Public Act 93-0839, effective July 30, 2004, requires that employer contributions to the System shall include an additional amount to be paid over to the General Obligation Bond Retirement and Interest Fund to pay principal of and interest on those general obligation bonds due that fiscal year. This debt service payment is to be made on the first day of each month, or as soon
thereafter as practical.
The total debt service pay-ments received for all fiscal year 2015 and 2014 payrolls, amounted to $29.0 million and $28.7 million, respec-tively. The total amount re-mitted to the State of Illinois as of June 30, 2015 and 2014 was $25.3 million and $25.1 million, respectively.
June 30, 2015 Current 1% decrease Discount Rate 1% increase (6.02%) (7.02%) (8.02%)
State’s net pension liability $33,717,210,155 $28,008,189,056 $23,269,260,392
June 30, 2014 Current 1% decrease Discount Rate 1% increase (6.09%) (7.09%) (8.09%)State’s net pension liability $32,657,135,216 $27,103,519,942 $22,490,814,991
State Employees’ Retirement System

F I N A N C I A L S T A T E M E N T S
34
9. Capital AssetsCapital assets over $100 are capitalized at their cost at the time of ac-quisition. Depreciation is computed using the straight-l ine method over the estimated use-ful life of the asset. The estimated useful lives are as follows: (1) office furniture - 10 years, (2) equipment - 6 years, (3) automobiles and certain electronic data process-ing equipment - 3 years, and (4) building - 30 years. Land is carried at its original cost, includ-ing applicable legal fees, surveying costs, etc.
10. Administrative Expenses & Other Post-Em-ployment BenefitsExpenses related to the administration of the Sys-tem are financed through investment earnings and employer ret irement contributions. These ex-penses are budgeted and approved by the System’s Board of Trustees.
The System pays em-ployer retirement contributions based upon an actuarially determined percentage of its payroll. For fiscal years 2015, 2014, and 2013 the System’s contributions to SERS are shown in the table below:
This is a summary of changes in capital assets for 2015 and 2014:
2015 Beginning Ending Balance Additions Deletions BalanceAssetsLand $ 655,241 $ – $ – $ 655,241Land improvements 315,779 – – 315,779Building 3,751,521 126,540 (18,241) 3,859,820Equipment 2,588,280 100,972 (290,345) 2,398,907Capitalized software costs 1,191,125 1,560,316 – 2,751,441 TOTAL 8,501,946 1,787,828 (308,586) 9,981,188
Accumulated depreciation/amortization Land Improvements (8,753) (2,337) – (11,090) Building (2,651,089) (133,721) 18,241 (2,766,569) Equipment (1,659,747) (355,152) 281,051 (1,733,848) Capitalized software costs (59,556) (137,572) – (197,128) TOTAL (4,379,145) (628,782) 299,292 (4,708,635)Net capital assets 4,122,801 1,159,046 (9,294) 5,272,553
2014 Beginning Ending Balance Additions Deletions BalanceAssetsLand $ 655,241 $ – $ – $ 655,241Land improvements 315,779 – – 315,779Building 3,482,678 268,843 – 3,751,521Equipment 2,495,982 397,128 (304,830) 2,588,280Capitalized software costs – 1,191,125 – 1,191,125 TOTAL 6,949,680 1,857,096 (304,830) 8,501,946
Accumulated depreciation/amortization Land Improvements (6,417) (2,336) – (8,753) Building (2,532,929) (118,160) – (2,651,089) Equipment (1,617,670) (324,618) 282,541 (1,659,747) Capitalized software costs – (59,556) – (59,556) TOTAL (4,157,016) (504,670) 282,541 (4,379,145)Net capital assets 2,792,664 1,352,426 (22,289) 4,122,801
The State provides health, dental, vision, and life insurance benefits for retirees and their dependents in a program administered by the Department of Central Management Services. Substantially all State employees become eligible for post-employment benefits if they eventually become annuitants of one of the State sponsored pension plans. Health, dental, and vision benefits include basic ben-efits for annuitants and dependents under the State’s self-insurance plan and insurance contracts currently in force. Annuitants may be required to contribute towards health, dental, and vision benefits with the amount based on factors such as date of retirement, years of credited service with the State, whether the annuitant is covered by Medicare, and whether the
Fiscal Years 2015 2014 2013Employer Contribution rates 42.339 % 40.312 % 37.987 % General Staff $ 2,430,501 $ 2,309,371 $ 1,971,920 Information Technology Staff $ 1,008,883 $ 889,500 $ 718,451
The amounts shown reflect the required contributions for each fiscal year
State Employees’ Retirement System

F I N A N C I A L S T A T E M E N T S
35
annuitant has chosen a managed health care plan. Annuitants who retired prior to January 1, 1998, and who are vested in the State Employees’ Retirement System do not contribute towards health, dental, and vision benefits. For annuitants who retired on or after January 1, 1998, the annuitant’s contribution amount is reduced five percent for each year of cred-ited service with the State allowing those annuitants with twenty or more years of credited service to not have to contribute towards health, dental, and vi-sion benefits. Annuitants also receive life insurance coverage equal to the annual salary of the last day of employment until age 60, at which time the benefit becomes $5,000.
The State pays the System’s portion of employer costs for the benefits provided. The total cost of the State’s portion of health, dental, vision, and life insurance ben-efits of all members, including post-employment health, dental, vision, and life insurance benefits, is recognized
A summary of the administrative expenses of the System for fiscal years 2015 and 2014 are as follows:
2015 2014
Personal Services $ 5,733,871 $ 5,693,130Employee Retirement Pickup 38,302 32,985Retirement Contributions 2,430,501 2,309,371Social Security Contributions 425,569 420,389Group Insurance 1,467,163 1,505,367Contractual Services 1,812,450 2,068,488Travel 15,508 18,228Commodities 13,854 25,164Printing 53,187 43,569Electronic data processing 3,817,148 4,029,536Telecommunications 130,338 98,203 Automotive 7,259 7,788Depreciation/Amortization 628,781 504,671Other (net) (26,108) (141,784)Total $ 16,547,823 $ 16,615,105
as an expenditure by the State in the Illinois Compre-hensive Annual Financial Report. The State finances the costs on a pay-as-you-go basis. The total costs incurred for health, dental, vision, and life insurance benefits are not separated by department or component unit for annuitants and their dependents nor active employees and their dependents.
A summary of post-employment benefit provisions, changes in benefit provisions, employee eligibility requirements including eligibility for vesting, and the authority under which benefit provisions are established are included as an integral part of the financial state-ments of the Department of Central Management Ser-vices. A copy of the financial statements of the Depart-ment of Central Management Services may be obtained by writing to the Department of Central Management Services, Stratton Office Building, 401 South Spring Street, Springfield, Illinois, 62706.
State Employees’ Retirement System

F I N A N C I A L S T A T E M E N T S
36
11. Social Security Division - Administrative ExpensesThe Social Security Division of the State Employees’ Retirement System was created by 40 ILCS 5/21, to administer the state’s responsibilities under Title II Section 218 of the Federal Social Security Act and the master federal-state agreement.
The state’s responsibilities include extending Social Security coverage by agreement to any of the state’s
Administrative expenses for the Social Security Divisionare appropriated annually by the State Legislature
2015 2014Personal services $ 40,188 $ 70,574Retirement contributions – –Social Security contributions 2,904 5,261Contractual services 15,700 15,700Travel 1,015 993Commodities 100 –Electronic Data Processing 500 500Telecommunications 300 322Total $ 60,707 $ 93,350
retirement systems or units of local government re-questing social security or medicare only coverage for their members or employees.
In addition, the Social Security Division was respon-sible for collecting wage information and contribu-tion payments from covered retirement systems and units of local government on wages paid prior to January 1, 1987. Administrative expenses for the Social Security Division are appropriated annually by the State Legislature.
State Employees’ Retirement System

37
F I N A N C I A L S T A T E M E N T S
12. Reserve BalancesThe System maintains three reserve accounts. The reserves are defined as follows:
a. Participants’ contributions: Accounts for assets contributed by each participant
b. Interest accumulations: Accounts for interest credited to each participant’s account
c. Other future benefits: Accounts for all assets not otherwise specifically provided for in items (a) and (b) above.
State Employees’ Retirement System

R E Q U I R E D S U P P L E M E N T A R Y I N F O R M A T I O N
38
SCHEDULE OF CHANGES IN THE STATE’S NET PENSION LIABILITY AND RELATED RATIOSFiscal Years Ended June 30, 2015 and 2014
2015 2014Total pension liability Service Cost $ 847,997,030 $ 776,487,959 Interest 2,912,736,360 2,754,121,665 Difference between expected and actual experience (464,492,210) 150,997,067 Assumption changes 360,713,498 3,142,466,514 Benefit payments (2,034,858,435) (1,917,062,639) Refunds (23,128,975) (23,082,814)Administrative expense (16,547,823) (16,615,105)Net change in total pension liability 1,581,969,446 4,867,312,648
Total pension liability - beginning 41,685,086,183 36,817,773,535 Total pension liability - ending (a) $ 43,267,055,628 $ 41,685,086,183 Plan fiduciary net position Contributions - employer $ 1,804,319,356 $ 1,699,447,826Contributions - participant 266,139,156 269,232,241 Net investment income 681,377,052 2,169,346,258 Benefit payments (2,034,858,435) (1,917,062,639) Refunds (23,128,975) (23,082,814)Administrative expense (16,547,823) (16,615,105) Net change in plan fiduciary net position 677,300,331 2,181,265,767
Plan fiduciary net position - beginning 14,581,566,241 12,400,300,474 Plan fiduciary net position - ending (b) $ 15,258,866,572 $ 14,581,566,241 State’s net pension liability - ending (a)-(b) $ 28,008,189,056 $ 27,103,519,942 Plan fiduciary net position as a percentage of the total pension liability 35.27% 34.98% Covered-employee payroll $ 4,453,683,664 $ 4,416,152,691 State’s net pension liability as a percentage of covered employee payroll 628.88% 613.74%
SCHEDULE OF INVESTMENT RETURNS 2015 2014Annual money-weighted rate of return, net of investment expense 4.79% 17.9%
State Employees’ Retirement System

R E Q U I R E D S U P P L E M E N T A R Y I N F O R M A T I O N
39
SCHEDULE OF STATE CONTRIBUTIONS Contributions Actuarially Covered received as a Fiscal Year determined Contributions Contribution Employee percentage of covered Ended June 30 contribution received (deficiency) excess Payroll employee payroll 2014 $1,956,841,419 $1,699,447,826 $ (257,393,593) $4,416,152,691 38.48% 2015 2,045,354,223 1,804,319,356 (241,034,867) 4,453,683,664 40.51% Notes to Schedule of State Contributions Valuation Date: June 30, 2015 Notes Actuarially determined contribution rates are calculated as of June 30, which is 12 months prior to the beginning of the fiscal year in which the contribu- tions will be made. Methods and Assumptions Used to Determine Contribution Rates as of the Valuation Date: Actuarial Cost Method: Projected Unit Credit Amortization Method: Normal cost plus a level percentage of capped payroll amortization of the unfunded accrued liability. Remaining Amortization Period: 30 years, open Asset Valuation Method: 5 year smoothed market Inflation: 3.00 percent Salary Increases: Salary increase rates based on age-related productivity and merit rates plus inflation.
Post Retirement Benefits: Post-retirement benefit increases of 3.00 percent, compounded, for Tier 1 and 3.00 percent or one-half of the annual increase in the Consumer Price Index whichever is less, simple, for Tier 2. Investment Rate of Return: 7.25 percent. Retirement Age: Experience-based table of rates that are specific to the type of eligibility condition. Last updated for the June 30, 2014, valuation pursuant to an experience study of the period July 1, 2009 to June 30, 2013. Mortality: 105 percent of the RP2014 Healthy Annuitant table, sex distinct, with rates projected to 2015
State Employees’ Retirement System

40
S U P P L E M E N T A R Y F I N A N C I A L I N F O R M A T I O N
SUMMARY OF REVENUES BY SOURCE 2015 2014 Contributions: Participants: Participants $ 259,170,550 $ 262,956,736 Interest paid by participants 6,118,556 5,400,946 Repayment of refunds 850,050 874,559 Total participant contributions 266,139,156 269,232,241 Employer: General Revenue Fund 1,174,448,039 1,109,491,149 Employing state agencies and appropriations 628,671,697 588,885,637 Paid by participants 1,199,620 1,071,040 Total employer contributions 1,804,319,356 1,699,447,826 Total contributions 2,070,458,512 1,968,680,067 Investment income: Net appreciation in fair value of investments 240,297,223 1,809,958,589 Interest and dividends from investments 479,661,386 396,094,900 Interest earned on cash balances 622,012 698,856 Less investment expense, other than from securities lending (42,184,943) (40,473,085) Net income from investing, other than from securities lending 678,395,678 2,166,279,260 Net securities lending income 2,981,374 3,066,998
Net investment income 681,377,052 2,169,346,258 Total revenues $ 2,751,835,564 $ 4,138,026,325
SUMMARY SCHEDULE OF CASH RECEIPTS & DISBURSEMENTS
2015 2014 Cash balance, beginning of year $ 200,752,173 $ 146,354,061 Receipts: Participant contributions 257,823,268 254,736,762 Employer contributions (net of bond principal and interest transfers) 599,464,616 634,208,477 General Revenue Fund/Pension Contribution Fund 1,174,448,039 1,109,491,149 Transfers from Illinois State Board of Investment - 58,607,580 Interest income on cash balance 620,455 691,988 Claims receivable payments 6,172,253 6,211,988 Installment payments 3,258,283 3,348,080 Other 184,875 160,942 Total cash receipts 2,041,971,789 2,067,456,966
Disbursements: Annuity payments: Retirement annuities 1,834,093,147 1,721,627,471 Widow’s and Survivor’s annuities 122,024,991 114,389,148 Disability benefits 59,432,605 58,668,756 Lump Sum benefits 15,389,940 18,389,475 Refunds (including transfers to reciprocal systems) 23,720,496 23,458,470 Refund to the General Revenue Fund - 58,607,580 Administrative expenses 17,416,194 17,917,954 Total cash disbursements 2,072,077,373 2,013,058,854Cash balance, end of year $ 170,646,589 $ 200,752,173
State Employees’ Retirement System

41
SCHEDULE OF PAYMENTS TO CONSULTANTS & ADVISORS
2015 2014Legal Services $ 59,942 $ 57,230Actuarial Costs 164,202 320,135Audit Expense 69,120 62,695Physicians and Disability Inspections 233,432 211,521Financial Planning 48,619 49,827Management Consultants 807,832 807,225TOTAL $ 1,383,147 $ 1,508,633
S U P P L E M E N T A R Y F I N A N C I A L I N F O R M A T I O N
State Employees’ Retirement System

42
This page left intentionally blank
State Employees’ Retirement System

43
INVESTMENT SECTION
State Employees’ Retirement System

44
I N V E S T M E N T S E C T I O N
INVESTMENT REPORT By state law, the System’s investment function is man-aged by the Illinois State Board of Investment (ISBI). The ISBI was created in 1969 to provide a means of centralizing the investment management function for public employee pension funds and retirement systems operating in the state.
In addition to the assets of the State Employees’ Retire-ment System, the ISBI also manages the investment function for the Judges’ Retirement System, General As-sembly Retirement System, and one other state agency. All ISBI investments are accounted for in a commingled fund (ISBI Fund).
Units of the ISBI Commingled Fund are issued to the participating entities on the last day of the month based on the unit net asset value calculated as of that date. Net investment income of the ISBI Commingled Fund is allocated to each of the participating entities on the last day of the month on the basis of percentage of accumulated units owned by the respective systems. Management expenses are deducted monthly from income before distribution.
As of June 30, 2015 and 2014, the ISBI’s total net posi-tion under management, valued at market, amounted to $15.846 billion and $15.109 billion, respectively. Of the total market value of the net position under management, $14.967 billion or approximately 94% and $14.286 billion or approximately 94% represented assets of the State Employees’ Retirement System as of June 30, 2015 and 2014, respectively.
The investment authority of the ISBI is provided in Chapter 40, Section 5/22A of the Illinois Compiled Stat-utes (ILCS). Such investment authority requires that all opportunities be undertaken with care, skill, prudence and diligence given prevailing circumstances that a prudent person acting in like capacity and experience would undertake.
A summary of the portfolio’s largest holdings, as well as the complete listing of the ISBI portfolio, are included in the ISBI Annual Report. A schedule of fees and
commissions paid by brokerage firms and a listing of transactions executed, including transaction value, are also contained in the ISBI Annual Report. A copy of the ISBI Annual Report can be obtained from the ISBI at 180 North LaSalle Street, Suite 2015, Chicago, Illinois 60601 or by visiting the ISBI’s website at www.ISBI.Illinois.gov.
The following investment information and analysis has been prepared from information provided by the ISBI. Investment performance returns are prepared by State Street Bank. Investment activities are presented on a trade date basis and measurements are calculated using time weighted rates of return consistent with investment industry standards.
INVESTMENT POLICY ANDASSET ALLOCATIONThe ISBI operates under a strategic investment policy. The investment objective of the total portfolio is to maximize the rate of return on investments within a prudent level of risk. To achieve this objective, the ISBI invests in different types of assets and uses multiple managers to ensure diversification.
The investment policy of the ISBI establishes asset allo-cation targets and ranges for each asset class, selected to achieve overall risk and return objectives. This policy is implemented by allocations to investment managers with assignments to invest in specific asset classes, with defined security selection styles and methodologies.
Changes made to the portfolio during fiscal year 2015 and 2014 amounted to routine adjustments associated with the administration of an institutional portfolio – periodic rebalancing, funding of private equity and real estate commitments, selection of new limited part-nerships, and continual monitoring of the portfolio.
The portfolio is regularly adjusted to manage expo-sures and to closely track the asset allocation policy adopted by the ISBI Board. The asset allocation policy targets and actual allocations for fiscal years 2015 and 2014 are shown in the following table.
State Employees’ Retirement System

45
I N V E S T M E N T S E C T I O N
2015 2014 Fair Actual Policy Fair Actual Policy Value Asset Mix Target Value Asset Mix Target
U.S. equity U.S. equity hedge fundsInternational equityCommingled funds4 Fixed income1 Bank loans Real estate Private equity Real assets Cash3 Total
$ 4,748,492,740 30% 30% 1,576,250,129 10 10 2,380,176,737 15 20 770,805,046 5 - 2,615,130,329 17 16 697,836,613 4 4 1,610,826,230 10 10 667,080,662 4 5 532,718,107 3 5 246,576,957 2 -$ 15,845,893,550 100% 100%
$ 4,553,283,316 30% 30% 1,485,145,060 10 10 2,346,576,036 16 20 733,010,980 5 - 2,416,272,292 16 16 689,256,558 5 4 1,483,445,971 10 10 667,730,266 4 5 524,284,793 3 5 210,370,103 1 -$ 15,109,375,375 100% 100%
2
2
1 Maturities of one year or longer, including convertible bonds.2 Interests in limited partnerships and other entities which have limited liquidity.3 Includes money market instruments and other assets, less liabilities.4 Holdings include fixed income and equity investments.
INVESTMENT PORTFOLIO SUMMARY June 30, 2015 June 30, 2014
Investments, at fair value
U.S. Govt. and Agency Obligations $ 907,835,826 5.73% $ 784,475,648 5.19%
Foreign Obligations 892,854,266 5.63 832,282,402 5.51
Corporate Obligations 814,440,237 5.14 799,514,242 5.29
Common Stock & Equity Funds 4,748,492,740 29.97 4,553,283,316 30.13
Commingled Funds 770,805,046 4.86 733,010,980 4.85
Foreign Equity Securities 2,379,999,098 15.02 2,346,503,129 15.53
Foreign Preferred Stock 177,639 0.00 72,907 0.00
Hedge Funds 1,576,250,129 9.95 1,485,145,060 9.83
Real Estate Funds 1,610,826,230 10.17 1,483,445,971 9.82
Private Equity 667,080,662 4.21 667,730,266 4.42
Money Market Instruments 231,115,398 1.46 217,737,000 1.44
Real Assets 532,718,107 3.36 524,284,793 3.47
Bank Loans 697,836,613 4.40 689,256,558 4.56
Foreign Currency Forward Contracts 979,645 0.01 (637,600) 0.00
15,831,411,636 99.91 15,116,104,672 100.04
Other Assets, Less Liabilities 14,481,914 0.09 (6,729,297) (0.04)
Net Position, at Fair Value $ 15,845,893,550 100.00% $ 15,109,375,375 100.00%
INVESTMENT ASSET ALLOCATION
State Employees’ Retirement System

46
I N V E S T M E N T S E C T I O N
MANAGEMENT EXPENSESThe ISBI’s total expenses for fiscal year 2015, based on $15.8 billion in net position, were $44.6 million, com-pared to $42.8 million based on $15.1 billion in net position for fiscal year 2014. The resulting expense ra-tios (expenses divided by average fair value of assets) for fiscal year 2015 and fiscal year 2014 were 0.29% and 0.30%, respectively. As a result of the ISBI’s commit-ment to control costs, the investment management fees are typically in the bottom quartile of fees paid by
the ISBI’s peer group.
ANALYSIS OF INVESTMENT PERFORMANCEIn fiscal year 2015 and 2014, investors benefited from positive returns in U.S. equity, hedge funds, real es-tate, and private equity as measured by market indices. The ISBI’s total fund was up 4.7% for fiscal year 2015, net of all expenses. This follows positive net returns of 17.9%, 14.1%, 0.1%, and 21.7% for fiscal years 2014, 2013, 2012, and 2011, respectively.
The ISBI staff, as well as its retained consultants, ag-gressively monitors the totality of the portfolio.
The following table reflects the investment perfor-mance over the last five years as well as the three, five, and ten year average returns for all categories in addi-tion to their individual benchmarks.
ADDITIONAL INVESTMENT INFORMATION
The following table shows a comparison of ISBI investment operations of the System for fiscal years 2015 and 2014: Increase/(Decrease) 2015 2014 Amount Percentage Balance at beginning of year, at fair value $ 14,286,499,013 $ 12,176,459,191 $ 2,110,039,822 17.3%Cash transferred to (from) ISBI, net - (58,607,580) 58,607,580 100.0%Net ISBI investment revenue: Net appreciation in fair value of investments 240,297,223 1,809,958,589 (1,569,661,366) (86.7)% Interest and dividends 479,661,386 396,094,900 83,566,486 21.1%
Less investment expense, other than from securities lending (42,184,943) (40,473,085) (1,711,858) 4.2% Net income from investing, other than from securities lending 677,773,666 2,165,580,404 (1,487,806,738) (68.7)% Net securities lending income 2,981,374 3,066,998 (85,624) (2.8)% Net ISBI investment revenue 680,755,040 2,168,647,402 (1,487,892,362) (68.6)%
Balance at end of year, at fair value $ 14,967,254,053 $ 14,286,499,013 $ 680,755,040 4.8%
In addition, interest on the average balance in the System’s cash account in the State Treasury for FY2015 was $622,012 compared to $698,856 during FY2014.
State Employees’ Retirement System

47
I N V E S T M E N T S E C T I O N
2015 2014 2013 2012 2011 3 Years 5 Years 10 Years
Total Fund 4.7% 17.9% 14.1% 0.1% 21.7% 12.1% 11.4% 6.2%Composite Benchmark* 4.0 16.3 11.8 0.9 19.6 10.6 10.3 6.4Consumer Price Index 0.1 2.1 1.8 1.7 3.6 1.3 1.8 2.1 U.S. Equities 6.4 24.1 23.3 1.3 33.9 17.7 17.2 8.5Russell 3000 Index 7.3 25.2 21.5 3.8 32.4 17.7 17.5 8.2 Hedge Funds ** 6.0 15.0 12.6 (4.3) 12.7 11.1 8.6 N/AHFRX Equity Hedge 4.0 8.5 8.3 (10.7) 3.4 6.9 2.5 N/A International Equities (1.0) 23.8 16.8 (10.7) 32.7 12.7 11.1 7.3MSCI-ACWI ex US Index IMI Gross (4.6) 22.8 14.4 (14.4) 30.9 10.3 8.5 4.9 Fixed Income (1.4) 6.5 2.4 6.8 5.7 2.5 4.0 3.6Barclays Capital U.S. Universal Index 1.6 5.2 0.2 7.4 4.8 2.3 3.8 4.7 Real Estate 16.3 14.5 13.0 5.3 17.0 14.6 13.1 5.1NCREIF Real Estate Index 13.4 11.7 11.1 11.3 16.7 12.1 12.8 8.2
Private Equity 21.5 24.7 16.2 7.6 24.0 20.8 18.6 12.7
Note: Calculations are based on a time series of linked monthly returns (IRR), producing a time weighted effect.Total fund return is presented net of fees. All other return information is presented gross of fees
* Composite Benchmark:Effective 06/14: 30% Russell 3000; 20% MSCI-ACWI ex US IMI Gross; 25% Barclays Capital U.S. Universal; 10% NCREIF ODCE;
5% Custom Private Equity Benchmark which is based on preliminary data subject to change; 10% HFRI Fund of Funds Index. The Custom Private Equity benchmark is based on peer universe return data compiled and published by Cambridge Associates, LLC. The custom benchmark returns are calculated as pooled internal rates of return (IRR).
Effective 01/14: 30% Russell 3000; 20% MSCI-ACWI ex US; 25% Barclays Capital U.S. Universal; 10% NCREIF ODCE; 5% Venture Economics Pooled Average Periodic IRR which is based on preliminary data subject to revision on a quarterly basis; 10% HFRI Fund of Funds Index.
Effective 07/11: 30% Russell 3000; 20% MSCI-ACWI ex US; 25% Barclays Capital U.S. Universal; 10% NCREIF ODCE; 5% Venture Economics Pooled Average Periodic IRR which is based on preliminary data subject to revision on a quarterly basis; 10% HFRX Equity Hedged Index.
Effective 07/07: 30% Russell 3000; 20% MSCI-EAFE; 25% Lehman Universal; 10% NCREIF; 5% Venture Economics Pooled Aver-age Periodic IRR which is based on preliminary data subject to revision on a quarterly basis; 10% HFRX Equity Hedged Index.
Effective 03/06: 8% Russell Midcap Growth; 7% Russell 2000 Value; 5% Russell 1000 Growth; 15% Russell 1000 Value;10% S&P 500;3% S&P Dev. Ex-U.S.<$2B:7% MSCI-EAFE; 10% NCREIF; 5% Lehman High Yield;10% Lehman Aggre-gate;10% Lehman Int. Govt/Corp;10% NCREIF
Effective 12/03: 45% Wilshire 5000; 10% MSCI-EAFE; 25% Lehman Universal; 10% NCREIF; 5% Venture Economic All Private Eq-uity Index which is based on preliminary data subject to revision on a quarterly basis; 5% HFRX Equity Hedged Index.
**Hedge Funds: ISBI began investing in Hedge Funds in Fiscal 2007, therefore actual return information is not available prior to that period.
Effective 11/08, the Lehman Universal benchmark ceased to exist. Barclays Capital U.S. Universal is the bench-mark currently used by ISBI.
ANALYSIS OF INVESTMENT PERFORMANCE
State Employees’ Retirement System

48
I N V E S T M E N T S E C T I O N
This page left intentionally blank
State Employees’ Retirement System

49
ACTUARIAL SECTION
The schedules in this section of the report were prepared to support the actuarially de-termined contribution for fiscal year 2017 under the State of Illinois’ funding plan. The total actuarial liability, the actuarial value of assets, and unfunded accrued actuarial liability as presented in the Actuarial section of this report using the State’s funding method does not conform with GASB Statement No. 67 and therefore, the amounts
presented in the Actuarial section of this report differ from the amounts presented for financial reporting purposes in the financial section of this report.
State Employees’ Retirement System

50
A C T U A R Y ‘ S C E R T I F I C A T I O N L E T T E R
State Employees’ Retirement System

51
A C T U A R Y ‘ S C E R T I F I C A T I O N L E T T E R
State Employees’ Retirement System

52
INTRODUCTIONAnnually, the System’s actuarial consultant prepares a valuation of the liabilities and reserves of the System in order to make a determination of the amount of contributions required from the state. These results are then certified to the Board.
The Board, in turn, has the duty of certifying an employer contribution amount, required to be paid to the System by the state during the succeeding fiscal year.
The System receives contributions from several sources which can be considered as employer con-tributions, with the largest source being the regular state appropriation.
The employers’ contribution amount, together with members’ contributions, income from investments and any other income received by the System, shall be sufficient to meet the cost of maintaining and administering the System on a funded basis in ac-cordance with actuarial reserve requirements, pur-suant to Chapter 40, Section 5/14-131 of the Illinois Compiled Statutes.
The statutes define “actuarial reserves” as “An ac-cumulation of funds in advance of benefit payments which will be sufficient with respect to each member and his beneficiaries, if any, to pay the prescribed benefits, computed according to the actuarial tables, without further contributions by or on behalf of the member.”
In August, 1994, Senate Bill 533 was signed into law as Public Act 88-0593. This funding legislation, which became effective July 1, 1995, provides that:
• For fiscal years 1996 through 2010, the contribution to the System, as a percentage of the payroll, shall be increased in equal annual increments so that by fiscal year 2010 the contribution rate is at the same level as the contribution rate for fiscal years 2011 through 2045.
• For fiscal years 2011 through 2045, the minimum contribution to the System for each fiscal year shall be an amount determined to be sufficient to bring the total actuarial value of assets of the System up to 90% of the total actuarial liabilities of the System by the end of fiscal year 2045. In making these
determinations, the required contribution shall be calculated each year as a level percentage of payroll over the years remaining to and including fiscal year 2045 and shall be determined under the projected unit credit actuarial cost method.
• Beginning in fiscal year 2045, the minimum contribution to the System for each fiscal year shall be the amount needed to maintain the total actuarial value of assets of the System at 90% of the total actuarial liabilities of the System.
The funding legislation also provides for the establishment of a continuing appropriation of the required state contributions to the System. This has, in ef fect, removed the appropriation of these funds from the annual budgetary process.
In April, 2003, House Bill 2660 was signed into law as Public Act 93-0002. This legislation authorized the sale of $10 billion of General Obligation bonds for the purpose of making contributions to the five state-financed retirement systems. This legislation also modified the funding plan by mandating that, beginning in fiscal year 2005, the required state contribution for each fiscal year not exceed the state contributions that would have been required had the General Obligation bond program not been in effect, reduced by the total debt service for each year for the System’s portion of the General Obligation bond proceeds.
In June, 2005, Senate Bill 0027 was signed into law as Public Act 94-0004. This legislation further modified the funding plan by reducing the amount of required employer contributions for fiscal years 2006 and 2007 that would have otherwise been required under Public Act 88-0593, as modified by Public Act 93-0002. The required state contributions for fiscal years 2008 through 2010 were then to be increased incrementally as a percentage of the participant payroll so that by fiscal year 2011 the state would be contributing at the required level contribution rate to achieve the financing objective of a 90% funded status by the end of fiscal year 2045.
For fiscal years 2015 and 2014, the System received the actuarially determined employer contributions in accordance with the state’s funding plan described above.
A C T U A R I A L S E C T I O N
State Employees’ Retirement System

53
ACTUARIAL COST METHOD ANDSUMMARY OF MAJORACTUARIAL ASSUMPTIONS
The actuarial cost method used by the System for funding purposes that is statutorily required by the State of Illinois differs from the entry age actuarial cost method mandated by GASB Statement No. 67 that is used for financial reporting purposes. The System utilizes the projected unit credit actuarial cost method. Under this method, the actuarial liability is the actuarial present value or that portion of a participant’s projected benefit that is attributable to service to date on the basis of future compensation projected to retirement. For fiscal years 2015 and 2014, a projected unit credit normal cost method is used. Under this method, the projected pension at retirement age is first calculated and the value thereof at the indi-vidual member’s current or attained age is determined.
Certain assumptions used to determine the State’s required contribution under its statutory funding plan differ from assumptions used for financial reporting purposes that are mandated by GASB Statement No. 67. GASB Statement No. 67 mandates the use of a long-term blended rate of return that utilizes the System’s 7.25% expected rate of return until the projected fiduciary net position of the System is exhausted at which point a 20 year tax-exempt general obligation municipal bond rate is used (3.80% for fiscal year 2015) resulting in a long-term blended rate of return of 7.02% that differs from the System’s expected rate of return of 7.25% used for State funding purposes. The State uses an actuarial value of assets of $14,741,736,065 that recognizes gains and losses from investment returns in equal amounts over a five year period in its assumptions. GASB Statement No. 67 mandates the use of the market value of assets of $15,258,866,572 in its assumptions used for financial reporting purposes.
The normal cost for the member for the current year is equal to the value so determined divided by the mem-ber’s projected service at retirement. The normal cost for the plan for the year is the sum of the individual normal costs.
Actuarial gains and losses are recognized in the un-funded actuarial liability of the System. For purposes of determining future employer contributions, however, the actuarial gains and losses are amortized in accor-dance with the funding plan as previously described.
For ancillary benefits for active members, in particular disability benefits, death and survivor benefits, termi-
A C T U A R I A L S E C T I O N
Age Annual Increase 25 7.92% 30 6.45% 35 5.55% 40 5.22% 45 4.83% 50 4.51% 55 4.30% 60 4.10% 65 3.72% 70 3.50%
nation benefits, and the post-retirement increments, the same procedure as outlined above is followed.
A description of the actuarial assumptions utilized for FY2015 and FY2014 follows:
Dates of Adoption: The Projected Unit Credit Normal Cost Method was adopted June 30, 1989; the interest rate assump-tion was adopted June 30, 2010 and revised June 30, 2014; all other assumptions were adopted June 30, 2013.
Asset Valuation Method: The actuarial value of assets is equal to the fair value of assets adjusted for any actuarial gains or losses from investment return incurred in the fiscal year rec-ognized in equal amounts over the five year period following that fiscal year.
Interest: 7.25% per annum, compounded annually.
Mortality: Post-Retirement Mortality – 105 percent of the RP2014 Healthy Annuitant mortality table, sex distinct, with rates pro-jected to 2015. No adjustment is made for post-disabled mortality. While a fully generational mortality table was considered as part of the most recent experience study, the mortality table used is a static table and provides an estimated margin of 20 percent for future mortality improvement based on the experience study report of the State Employees’ Retirement System for the period from July 1, 2009 to June 30, 2013.Pre-Retirement Mortality, including terminated vested members prior to attaining age 50 – Based on 90% for males and 110% for females of the RP2014 Total Employee mortality table. Five percent of deaths among active employees are assumed to be in the performance of their duty.
Salary Increases: Illustrative rates of increase per individual employee per annum, compounded annually:
These increases include a component for inflation of 3.0% per annum.
State Employees’ Retirement System

54
Assets: Assets available for benefits are used as decribed in the Illinois Complied Statutes.
Expenses: As estimated and advised by SERS staff, based on current expenses and are expected to increase in relation to the projected capped payroll.
Marital Status: 85% of active male employees are assumed to be married, 65% of active females are as-sumed to be married. Actual marital status at benefit commencement is used for retirees.
A C T U A R I A L S E C T I O N
Spouse’s Age: The female spouse is assumed to be three years younger than the male spouse.
In addition to the above, other assumptions used include disability incidence, recovery from disability, mortality of disabled lives, remarriage rates, ages, and numbers of children and Social Security benefit levels.
Post-retirement Benefit Increases: Tier 1 - 3.0 percent annually, compounded. Tier 2 - 3.0 percent per year or one-half of the annual increase in the Consumer Price Index for the preceding year, whichever is less, on the original benefit.
Experience Review: Pursuant to state law, the System had the actuary perform this review for the five year period ended June 30, 2013.
NOTE: The actuarial assumptions have been recom-mended by the actuary, and adopted by the System’s Board of Trustees, at the dates indicated previously.
SUMMARY OF AND CHANGES TO THE PLAN PROVISIONSRefer to the Plan Summary and Legislative Section for a summary of the plan provisions and legislative amendments that were evaluated and considered by the actuary during the valuation process.
SHORT-TERM SOLVENCY TESTA short-term solvency test is one means of checking a system’s progress under its funding program. In a short-term solvency test, the plan’s present assets (primarily cash and investments) are compared with:
1. Active member contributions on deposit. 2. The liabilities for future benefits to present retired lives.
3. The liabilities for service already rendered by active members.
In a system that has been following level percent of payroll financing, the liabilities for service already rendered by active members (liability 3) should be partially covered by the remainder of present assets. If the system continues using level cost financing, the funded portion of liability 3 will increase over time, although it is very rare for a system to have its liability 3 fully funded.
Service-Based Withdrawal
General Alternative Formula Employees Employees
Service Years Male Females Males Females
0 .2300 .2300 .0325 .0600
1 .1200 .1200 .0325 .0450
5 .0425 .0475 .0175 .0300
10 .0250 .0250 .0150 .0200
15 .0150 .0150 .0100 .0150
20 .0150 .0100 .0100 .0150
25 .0150 .0100 .0100 .0150
30+ .0150 .0100 .0100 .0150
Retirement Rates: Listed below are representative sample rates of retirement that vary by age. The rates apply only to employees who have fulfilled the service requirement necessary for retirement at any given age:
Retirement Rates for Regular Formula Employees
Male Females
50 15.0% 25.0%
55 17.5 16.0
60 10.0 16.0
65 20.0 25.0
70 17.5 20.0
Retirement Rates for Alternative Formula Employees
Male Females
50 60.0% 40.0%
55 35.0% 30.0%
60 30.0% 30.0%
65 55.0% 40.0%
70 50.0% 60.0%
State Employees’ Retirement System

55
June 30, 2015 June 30, 2014Actuarial Liability For Annuitants: For Benefit Recipients: Retirement Annuities $ 24,324,233,100 $ 23,038,434,643 Survivor Annuities 1,345,213,022 1,268,546,160 Disability Annuities 482,628,902 480,134,486 Deferred: Retirement Annuities 9,138,712 7,713,098 Survivor Annuities 9,520,904 9,084,883TOTAL $26,170,734,640 $ 24,803,913,270 For Inactive Members: Eligible for Deferred Vested Pension Benefits 588,747,835 560,188,012 Eligible for Return of Contributions Only 36,698,493 32,863,103TOTAL $ 625,446,328 $ 593,051,115 For Active Members $ 13,947,229,249 $ 14,129,880,582Actuarial Present Value of Credited Projected Benefits $ 40,743,410,217 $ 39,526,844,967Actuarial Value of Assets 14,741,736,065 13,315,612,735Unfunded Actuarial Present Value of Credited Projected Benefits $ 26,001,674,152 $ 26,211,232,232
VALUATION RESULTS
A C T U A R I A L S E C T I O N
COMPUTED ACTUARIAL VALUES (in thousands of dollars)
Percentage of Current Active and Inactive Actuarial Actuarial Values Fiscal Member Retirees and Members, Employer Value of Covered by Net Year Contributions Beneficiaries Financed Portion Assets* Assets Available (1) (2) (3) (1) (2) (3) 2006 $1,819,899 $12,621,711 $6,432,932 $10,899,853 100.0% 71.9% 0.0% 2007 1,951,976 13,225,507 7,103,434 12,078,909 100.0 76.6 0.0 2008 2,070,553 14,047,703 7,723,024 10,995,366 100.0 63.5 0.0 2009 2,188,603 14,908,642 8,201,101 10,999,954 100.0 59.1 0.0 2010 2,284,078 16,962,553 10,062,833 10,961,540 100.0 51.2 0.0 2011 2,365,334 18,247,534 10,782,140 11,159,837 100.0 48.2 0.0 2012 2,332,853 20,424,898 10,333,435 11,477,264 100.0 44.8 0.0 2013 2,374,437 22,102,837 10,243,491 11,877,419 100.0 43.0 0.0 2014 2,426,821 24,803,913 12,296,111 13,315,613 100.0 43.9 0.0 2015 2,480,787 26,170,735 12,091,888 14,741,736 100.0 46.8 0.0
* For fiscal years prior to 2009, the actuarial value of assets was equal to the fair value of assets. Beginning in fiscal year 2009, the actuarial value of assets was equal to the fair value of assets adjusted for any actuarial gains or losses from investment return incurred in the fiscal year recognized in equal amounts over the five year period following that fiscal year.
State Employees’ Retirement System

56
A C T U A R I A L S E C T I O N
RECONCILIATION OF UNFUNDED ACTUARIAL LIABILITY
2015 2014 Unfunded Liability, Beginning of Fiscal Year $ 26,211,232,232 $ 22,843,345,661
Contributions Due Interest on the Unfunded Liability 1,900,314,337 1,770,359,289 Participants (includes Repayment of Refunds) 266,139,156 269,232,241 Total Normal Cost 686,207,638 551,051,796 Interest on Normal Cost 33,918,554 31,192,920 Total Due $ 2,886,579,685 $ 2,621,836,246
Contributions Paid Participants (includes Repayment of Refunds) $ 266,139,156 $ 269,232,241 Employing State Agencies and Appropriations 1,804,319,356 1,699,447,826 Interest on Contributions 73,740,951 74,862,947 Total Paid $ 2,144,199,463 $ 2,043,543,014 Increase in the Unfunded Liability $ 742,380,222 $ 578,293,232 Actuarial (Gains) Losses a. Salary Increases $ (289,320,641) $ 356,142,591 b. Investment Income (464,963,323) (505,321,103) c. Demographic (197,654,338) 23,508,555
Total Actuarial (Gain) $ (951,938,302) $ (125,669,957) Assumption Changes $ - $ 2,915,263,296
Total Increase(Decrease) in Actuarial Liability $ (209,558,080) $ 3,367,886,571
Unfunded Liability, End of Fiscal Year $ 26,001,674,152 $ 26,211,232,232
+
=+
State Employees’ Retirement System

57
SUMMARY OF ACCRUED AND UNFUNDED ACCRUED LIABILITIES (Analysis of Funding)In an inflationary economy, the value of the dollar decreases. This environment results in employees’ pay and retirement benefits increasing in dollar amounts resulting in unfunded accrued liabilities which in-crease in dollar amounts, all at a time when the actual substance of these items may be decreasing. Looking at just the dollar amounts of unfunded ac-crued liabilities can be misleading. The ratio of the
ACCRUED AND UNFUNDED ACCRUED LIABILITIES
(in thousands of dollars) Actuarial Net Position as a Total Unfunded Unfunded Actuarial Fiscal Total Actuarial Value of % of Actuarial Actuarial Member Liability as a % of Year Liability Assets* Liability Liability Payroll Member Payroll
2006 $20,874,542 $10,899,853 52.2% $9,974,689 $3,572,541 279.2% 2007 22,280,917 12,078,909 54.2 10,202,008 3,762,777 271.1 2008 23,841,280 10,995,366 46.1 12,845,914 3,967,704 323.8 2009 25,298,346 10,999,954 43.5 14,298,392 4,027,263 355.0 2010 29,309,464 10,961,540 37.4 18,347,924 4,119,361 445.4 2011 31,395,008 11,159,837 35.6 20,235,171 4,211,186 480.5 2012 33,091,186 11,477,264 34.7 21,613,922 4,329,084 499.3 2013 34,720,765 11,877,419 34.2 22,843,346 4,236,191 539.2 2014 39,526,845 13,315,613 33.7 26,211,232 4,416,153 593.5 2015 40,743,410 14,741,736 36.2 26,001,674 4,453,684 583.8
* For fiscal years prior to 2009, the actuarial value of assets was equal to the fair value of assets. Beginning in fiscal year 2009, the actu-arial value of assets was equal to the fair value of assets adjusted for any actuarial gains or losses from investment return incurred in the fiscal year recognized in equal amounts over the five year period following that fiscal year.
SCHEDULE OF ACTIVE MEMBER VALUATION DATA
Valuation Annual Annual % Increase Date Number Payroll Average Pay In Average Pay
6/30/06 68,075 $3,572,541,000 52,479 4.4% 6/30/07 67,699 3,762,777,000 55,581 5.9 6/30/08 66,237 3,967,704,000 59,902 7.8 6/30/09 65,599 4,027,263,000 61,392 2.5 6/30/10 64,143 4,119,360,892 64,222 4.6 6/30/11 66,363 4,211,186,269 63,457 (1.2) 6/30/12 62,732 4,329,083,716 69,009 8.7 6/30/13 61,545 4,236,191,257 68,831 (0.3) 6/30/14 62,844 4,416,152,691 70,272 2.1 6/30/15 63,273 4,453,683,664 70,388 0.2
A C T U A R I A L S E C T I O N
unfunded accrued liabilities to active employee pay-roll provides an index which clarifies understanding. The smaller the ratio of unfunded liabilities to active member payroll, the stronger the system.
Observation of this relative index over a period of years will give an indication of whether the system is becoming financially stronger or weaker.
State Employees’ Retirement System

58
AC TUARIAL SEC TION
SCHEDULE OF DISABILITY RECIPIENTSADDED TO AND REMOVED FROM ROLLS
Fiscal Beginning Ending Year Balance Additions (Removals) Balance
2006 2,138 2,129 (2,111) 2,156 2007 2,156 2,031 (1,975) 2,212 2008 2,212 2,078 (2,064) 2,226 2009 2,226 2,118 (2,047) 2,297 2010 2,297 2,236 (2,125) 2,408 2011 2,408 2,226 (2,278) 2,356 2012 2,356 1,884 (1,954) 2,286 2013 2,286 1,847 (1,746) 2,387 2014 2,387 1,698 (1,773) 2,312 2015 2,312 1,702 (1,751) 2,263
SCHEDULE OF SURVIVORS’ ANNUITANTS ADDED TO AND REMOVED FROM ROLLS
Fiscal Beginning Ending Year Balance Additions (Removals) Balance
2006 10,041 672 (677) 10,036 2007 10,036 677 (639) 10,074 2008 10,074 638 (608) 10,104 2009 10,104 713 (581) 10,236 2010 10,236 686 (597) 10,325 2011 10,325 715 (612) 10,428 2012 10,428 754 (680) 10,502 2013 10,502 752 (585) 10,669 2014 10,669 782 (632) 10,819 2015 10,819 771 (701) 10,889
SCHEDULE OF RETIRANTS ADDED TO AND REMOVED FROM ROLLS Fiscal Beginning Ending Year Balance Additions (Removals) Balance
2006 42,649 1,398 (1,371) 42,676 2007 42,676 1,685 (1,382) 42,979 2008 42,979 2,214 (1,412) 43,781 2009 43,781 2,046 (1,261) 44,566 2010 44,566 2,416 (1,323) 45,659 2011 45,659 2,753 (1,410) 47,002 2012 47,002 4,360 (1,362) 50,000 2013 50,000 3,099 (1,105) 51,994 2014 51,994 2,904 (1,420) 53,478 2015 53,478 2,805 (1,481) 54,802
State Employees’ Retirement System

59
STATISTICAL SECTION
State Employees’ Retirement System

60
S T A T I S T I C A L S E C T I O N
RESERVES Reserve For Reserve For Reserve For FY Ended Member Interest Future Total June 30 Liabilities Contributions Accumulations Operations Reserves Total
2006 $14,153,745 $1,819,898,559 $1,213,224,291 $7,866,730,215 $10,899,853,065 $10,914,006,810
2007 14,655,224 1,951,976,176 1,327,434,550 8,799,498,228 12,078,908,954 12,093,564,178
2008 16,317,228 2,070,552,633 1,425,558,357 7,499,255,495 10,995,366,485 11,011,683,713
2009 15,593,128 2,188,602,984 1,537,128,750 4,752,120,354 8,477,852,088 8,493,445,216
2010 33,412,667 2,284,078,225 1,639,304,137 5,278,448,293 9,201,830,655 9,235,243,322
2011 36,929,618 2,365,334,319 1,724,204,960 6,881,213,407 10,970,752,686 11,007,682,304
2012 85,440,952 2,332,852,502 1,685,093,457 6,942,741,865 10,960,687,824 11,046,128,776
2013 183,915,043 2,374,437,475 1,733,896,564 8,291,966,435 12,400,300,474 12,584,215,517
2014 95,222,447 2,426,821,370 1,781,416,644 10,373,328,227 14,581,566,241 14,676,788,688
2015 77,832,709 2,480,786,913 1,836,247,980 10,941,831,679 15,258,866,572 15,336,699,281
ASSET BALANCES Securities lending FY Ended collateral with Capital Assets, Net of June 30 Cash Receivables Investments State Treasurer Depreciation/Amortization Total
2006 $ 226,751,078 $ 29,505,581 $ 10,654,863,723 $ - $ 2,886,428 $ 10,914,006,810
2007 249,858,696 30,897,571 11,810,137,495 - 2,670,416 12,093,564,178
2008 306,528,043 48,461,473 10,653,973,521 - 2,720,676 11,011,683,713
2009 232,679,069 57,435,470 8,200,755,918 - 2,574,759 8,493,445,216
2010 49,912,665 39,333,474 9,120,601,694 22,587,000 2,808,489 9,235,243,322
2011 54,940,085 41,167,867 10,882,484,004 26,414,000 2,676,348 11,007,682,304
2012 133,959,043 160,807,074 10,675,772,261 72,867,000 2,723,398 11,046,128,776
2013 146,354,061 145,440,601 12,176,459,191 113,169,000 2,792,664 12,584,215,517
2014 200,752,173 101,401,701 14,286,499,013 84,013,000 4,122,801 14,676,788,688
2015 170,646,589 128,747,086 14,967,254,053 64,779,000 5,272,553 15,336,699,281
LIABILITIES AND RESERVE BALANCES
Statistical Contents
The tables in this section present detailed informa-tion on benefit payments and recipients, members and employer contributions and miscellaneous demographic information.
1. Financial Schedules: Pages 60-61These schedules present information about assets, liabilities, reserves and changes in fiduciary net position over a 10-year period.
2. Member & Benefit Analysis: Pages 62-63These schedules show a breakdown of the charac-teristics of active and total employees, as well as a display of the number of beneficiary recipients by type and termination refund.
3. Benefit Demographics: Pages 64-66These schedules provide an overview of the types of benefits provided based upon the benefit formula: demographics of age, type of benefit, months of service, range of benefits and location of retirees.
State Employees’ Retirement System

61
S T A T I S T I C A L S E C T I O N
Fisc
al Y
ear
20
06
2007
20
08
2009
20
10
2011
20
12
2013
20
14
2015
Addi
tions
Mem
ber c
ontri
butio
ns
$ 21
4,10
8,89
6 $
224,
722,
599
$ 24
9,95
5,20
8 $
242,
227,
432
$ 24
6,17
2,97
1 $
254,
201,
379
$ 25
9,12
2,88
1 $
248,
169,
706
$ 26
9,23
2,24
1 $
266,
139,
156
Empl
oyer
Con
tribu
tions
210,
499,
791
35
8,78
6,65
0
587,
732,
407
77
4,91
0,34
4
1,09
5,54
5,85
6
1,12
7,88
6,79
6
1,39
1,41
6,37
5
1,53
1,93
2,13
7
1,69
9,44
7,82
6
1,80
4,31
9,35
6
Net
inve
stm
ent i
ncom
e/(lo
ss)
1,
113,
231,
712
1,
779,
907,
177
(6
80,7
59,7
19)
(2
,208
,897
,635
)
799,
895,
861
1,
930,
208,
393
5,
975,
369
1,
501,
238,
191
2,
169,
346,
258
68
1,37
7,05
2
Tota
l add
ition
s to/
(ded
uctio
ns fr
om)
fid
ucia
ry n
et p
ositi
on
1,
537,
840,
399
2,
363,
416,
426
15
6,92
7,89
6
(1,1
91,7
59,8
59)
2,
141,
614,
688
3,
312,
296,
568
1,
656,
514,
625
3,
281,
340,
034
4,
138,
026,
325
2,
751,
835,
564
Ded
uctio
ns
Bene
fit P
aym
ents
:
Re
tirem
ent a
nnui
ties
98
5,50
3,02
3
1,03
0,28
4,94
2
1,08
9,74
3,63
2
1,16
4,45
4,55
7
1,23
7,11
8,00
8
1,32
9,15
5,99
1
1,45
4,91
0,15
8
1,61
4,59
6,77
0
1,72
0,82
5,10
3
1,83
3,99
9,37
1
Su
rviv
ors’
annu
ities
61,1
00,6
47
65
,215
,133
68
,770
,552
73,6
97,4
50
89
,516
,980
95,11
8,04
1
101,
136,
325
10
7,53
3,83
4
114,
177,
228
12
1,93
0,33
7
D
isabi
lity
40
,271
,558
43,0
53,14
8
43,0
86,0
65
46
,513
,406
48,3
12,6
29
53
,056
,325
56,0
98,8
69
59
,882
,478
64,7
82,2
36
63
,929
,747
Lu
mp-
sum
pay
men
ts
23
,710
,733
22,7
37,8
15
12
,515
,378
15,5
48,2
62
15
,693
,575
14,7
33,2
90
15
,228
,249
17,9
52,5
73
17
,278
,072
14,9
98,9
80
To
tal b
enef
it pa
ymen
ts
1,
110,
585,
961
1,
161,
291,
038
1,
214,
115,
627
1,
300,
213,
675
1,
390,
641,
192
1,
492,
063,
647
1,
627,
373,
601
1,
799,
965,
655
1,
917,
062,
639
2,
034,
858,
435
Refu
nds:
Te
rmin
atio
n
10,7
71,3
09
11
,016
,841
12,3
19,2
12
10
,262
,279
9,92
2,58
2
10,9
71,2
15
12
,241
,107
14,0
95,5
30
13
,931
,435
13,1
62,5
21
O
ther
2,63
8,73
9
3,24
5,03
1
4,49
8,22
1
4,59
7,20
8
5,35
1,59
2
26,6
04,7
14
11
,259
,218
10,1
94,8
72
9,
151,
379
9,
966,
454
To
tal r
efun
ds
13
,410
,048
14,2
61,8
72
16
,817
,433
14,8
59,4
87
15
,274
,174
37
,575
,929
23,5
00,3
25
24
,290
,402
23,0
82,8
14
23
,128
,975
Adm
inist
rativ
e ex
pens
es
8,
139,
278
8,
807,
627
9,
537,
305
10
,681
,376
11,7
20,7
55
13
,734
,961
15,7
05,5
61
17
,471
,327
16,61
5,10
5
16,5
47,8
23
Tota
l ded
uctio
ns fr
om n
et fi
ducia
ry p
ositi
on
1,13
2,13
5,28
7
1,18
4,36
0,53
7
1,24
0,47
0,36
5
1,32
5,75
4,53
8
1,41
7,63
6,12
1
1,54
3,37
4,53
7
1,66
6,57
9,48
7
1,84
1,72
7,38
4
1,95
6,76
0,55
8
2,07
4,53
5,23
3
Chan
ge in
fidu
ciar
y ne
t pos
ition
$
405,
705,
112
$
1,17
9,05
5,88
9
$ (1
,083
,542
,469
) $
(2,5
17,5
14,3
97)
$ 72
3,97
8,56
7 $
1,76
8,92
2,03
1 $
(10,
064,
862)
$
1,43
9,61
2,65
0 $
2,18
1,26
5,76
7 $
677,
300,
331
CH
ANG
ES IN
FID
UC
IARY
NET
PO
SITI
ON
State Employees’ Retirement System

62
TOTAL MEMBERSHIP - COORDINATED/NONCOORDINATED
COORDINATED NONCOORDINATED MEMBERS MEMBERS Total Total FY Ended Male Female Total June 30 Male Female Total Male Female Total Members Members Members
2006 44,656 41,657 86,313 2,586 548 3,134 47,242 42,205 89,447 2007 44,532 41,562 86,094 2,693 534 3,227 47,225 42,096 89,321 2008 43,359 41,094 84,453 2,668 504 3,172 46,027 41,598 87,625 2009 42,687 40,678 83,365 2,606 485 3,091 45,293 41,163 86,456 2010 41,835 39,838 81,673 2,512 470 2,982 44,347 40,308 84,655 2011 44,146 40,696 84,842 2,387 432 2,819 46,533 41,128 87,661 2012 43,364 39,325 82,689 2,298 386 2,684 45,662 39,711 85,373 2013 43,753 38,965 82,718 2,361 450 2,811 46,114 39,415 85,529 2014 44,296 39,724 84,020 2,414 589 3,003 46,710 40,313 87,023 2015 45,232 40,790 86,022 2,228 331 2,559 47,460 41,121 88,581
COORDINATED NONCOORDINATED MEMBERS MEMBERS Total Total Total Annual FY Ended Male Female Active Earnings June 30 Male Female Total Male Female Total Members Members Members Reported
2006 33,597 31,582 65,179 2,424 472 2,896 36,021 32,054 68,075 $3,572,541,000 2007 33,264 31,457 64,721 2,525 453 2,978 35,789 31,910 67,699 3,762,777,000 2008 32,420 30,998 63,418 2,408 411 2,819 34,828 31,409 66,237 3,967,704,000 2009 32,026 30,739 62,765 2,430 404 2,834 34,456 31,143 65,599 4,027,263,000 2010 31,363 30,077 61,440 2,325 378 2,703 33,688 30,455 64,143 4,119,360,892 2011 32,797 31,011 63,808 2,206 349 2,555 35,003 31,360 66,363 4,211,186,269 2012 31,073 29,252 60,325 2,102 305 2,407 33,175 29,557 62,732 4,329,083,716 2013 30,559 28,486 59,045 2,147 353 2,500 32,706 28,839 61,545 4,236,191,257 2014 30,843 29,344 60,187 2,185 472 2,657 33,028 29,816 62,844 4,416,152,691 2015 31,059 29,861 60,920 2,062 291 2,353 33,121 30,152 63,273 4,453,683,664
S T A T I S T I C A L S E C T I O N
ACTIVE MEMBERSHIP - COORDINATED/NONCOORDINATED
Active Membership - Tier Breakout
FY Ended Tier 1 Tier 2 Total Active June 30 Members 2011 63,838 2,525 66,363 2012 58,617 4,115 62,732 2013 55,271 6,274 61,545 2014 52,593 10,251 62,844 2015 49,433 13,840 63,273
State Employees’ Retirement System

63
NUMBER OF RECURRING BENEFIT PAYMENTS / TERMINATION REFUNDS
FY Ended Retirement Survivors’ Disability* Total Recurring Termination June 30 Annuities Annuities Benefits Benefit Payments Refunds 2006 42,676 10,036 2,156 54,868 1,903 2007 42,979 10,074 2,212 55,265 1,660 2008 43,781 10,104 2,226 56,111 1,598 2009 44,566 10,236 2,297 57,099 1,387 2010 45,659 10,325 2,408 58,392 1,420 2011 47,002 10,428 2,356 59,786 1,816 2012 50,000 10,502 2,286 62,788 1,964 2013 51,994 10,669 2,387 65,050 2,080 2014 53,478 10,819 2,312 66,609 2,467 2015 54,802 10,889 2,263 67,954 2,293
* Includes individuals receiving total temporary disability payments under the Workers’ Compensation Act.
S T A T I S T I C A L S E C T I O N
State Employees’ Retirement System

64
RETIREMENT ANNUITIESAverage Monthly Benefit For Current Year Retirees By Type
Fiscal Year Ending June 30
2015 2014 2013 2012 2011
Not Coordinated with Social Security $ 2,962.91 $ 2,929.30 $ 2,984.24 $ 3,099.80 $ 2,395.06
Coordinated with Social Security 2,478.98 2,498.95 2,502.20 2,383.31 2,115.89
Alternative Formula 8,039.86 8,472.02 8,048.51 8,032.75 7,681.97
Dept. of Corrections/DHS - Special Formula -
Not Coordinated with Social Security 2,445.56 5,309.68 4,704.16 5,642.02 3,914.46
Dept. of Corrections/DHS - Special Formula
Coordinated with Social Security 4,441.76 4,366.85 4,108.22 4,146.98 3,985.65
Air Pilots - Coordinated with Social Security 5,520.60 5,693.40 4,603.27 - -
TOTAL AVERAGE $ 3,117.25 $ 3,168.81 $ 3,033.63 $ 3,056.28 $ 2,852.56
Fiscal Year Ending June 30
Age 2015 2014 2013 2012 2011
Under 51 194 219 198 236 145
51-55 2,539 2,595 2,694 2,671 2,257
56-60 6,132 6,199 6,196 6,090 5,750
61-65 11,177 11,475 11,523 11,588 10,524
66-70 12,863 11,917 11,221 9,773 9,235
71-75 8,643 8,122 7,531 7,206 6,839
76-80 5,842 5,539 5,376 5,212 5,151
81-85 3,832 3,835 3,785 3,828 3,788
86-89 1,990 2,017 1,953 1,925 1,899
Over 89 1,590 1,560 1,517 1,471 1,414
Total 54,802 53,478 51,994 50,000 47,002
Average Age 69.41 69.27 69.16 69.17 69.46
RETIREMENT ANNUITIESAverage Service (in months) for Current Year Retirees at Effective Date of Benefit
Fiscal Year Ending June 30 2015 2014 2013 2012 2011 Not Coordinated with Social Security 422.10 375.36 411.16 445.08 392.09Coordinated with Social Security 302.83 309.08 320.71 320.56 306.13Alternative Formula 327.95 319.85 316.92 315.37 314.52Dept. of Corrections - Special Formula- Not Coordinated with Social Security 424.50 304.00 372.16 335.68 332.62Dept. of Corrections -Special Formula- Coordinated with Social Security 311.48 317.97 313.76 318.66 316.78Air Pilots - Coordinated with Social Security 300.50 297.25 307.50 – -
TOTAL AVERAGE 306.09 312.02 319.92 320.79 309.77
S T A T I S T I C A L S E C T I O N
RETIREMENT ANNUITIESCurrent Age of Active Recipients
State Employees’ Retirement System

65
Occupational and Annuitants Widow’s and Survivors’ Non-Occupational by Benefit Range by Benefit Range (Incl. Temp) Disabilities (Monthly) (Monthly) by Benefit Range (Monthly)
June 30, 2015 June 30, 2015 June 30, 2015 Benefit Cumulative % of Cumulative Benefit Cumulative % of Cumulative Benefit Cumulative % of Cumulative Range Total Total Total % of Total Range Total Total Total % of Total Range Total Total Total % of Total
$ 1-100 260 260 0.5 0.5 101-200 644 904 1.2 1.7 201-300 986 1,890 1.8 3.5 301-400 1,001 2,891 1.8 5.3 401-500 1,121 4,012 2.0 7.3 501-600 1,186 5,198 2.2 9.5 601-700 1,137 6,335 2.1 11.6 701-800 1,168 7,503 2.1 13.7 801-900 1,201 8,704 2.2 15.9 901-1000 1,181 9,885 2.2 18.1 1001-1100 1,145 11,030 2.1 20.2 1101-1200 1,196 12,226 2.2 22.4 1201-1300 1,185 13,411 2.2 24.6 1301-1400 1,184 14,595 2.2 26.8 1401-1500 1,219 15,814 2.2 29.0 1501-1600 1,135 16,949 2.1 31.1 1601-1700 1,125 18,074 2.1 33.2 1701-1800 1,120 19,194 2.0 35.2 1801-1900 1,062 20,256 1.9 37.1 1901-2000 1,074 21,330 2.0 39.1 2001-2500 5,336 26,666 9.7 48.8 2501-3000 5,106 31,772 9.3 58.1 3001-4000 9,204 40,976 16.8 74.9 4001-5000 6,777 47,753 12.4 87.3 5001-7500 5,609 53,362 10.2 97.5 over 7500 1,440 54,802 2.6 100.0
$ 1-100 104 104 1.0 1.0 101-200 396 500 3.6 4.6 201-300 684 1,184 6.3 10.9 301-400 693 1,877 6.4 17.3 401-500 1,187 3,064 10.9 28.2 501-600 1,181 4,245 10.8 39.0 601-700 1,124 5,369 10.3 49.3 701-800 746 6,115 6.9 56.2 801-900 567 6,682 5.2 61.4 901-1000 363 7,045 3.3 64.7 1001-1100 379 7,424 3.5 68.2 1101-1200 307 7,731 2.8 71.0 1201-1300 301 8,032 2.8 73.8 1301-1400 283 8,315 2.6 76.4 1401-1500 254 8,569 2.3 78.7 1501-1600 240 8,809 2.2 80.9 1601-1700 225 9,034 2.1 83.0 1701-1800 185 9,219 1.7 84.7 1801-1900 178 9,397 1.6 86.3 1901-2000 179 9,576 1.6 87.9 2001-2500 619 10,195 5.7 93.6 2501-3000 365 10,560 3.4 97.0 3001-4000 295 10,855 2.7 99.7 4001-5000 30 10,885 0.3 100.0 5001-7500 3 10,888 0.0 100.0 over 7500 1 10,889 0.0 100.0
$ 1-100 13 13 0.6 0.6 101-200 12 25 0.5 1.1 201-300 22 47 1.0 2.1 301-400 41 88 1.8 3.9 401-500 60 148 2.7 6.6 501-600 85 233 3.8 10.4 601-700 94 327 4.2 14.6 701-800 78 405 3.4 18.0 801-900 105 510 4.6 22.6 901-1000 85 595 3.8 26.4 1001-1100 77 672 3.4 29.8 1101-1200 65 737 2.9 32.7 1201-1300 45 782 2.0 34.7 1301-1400 67 849 3.0 37.7 1401-1500 56 905 2.5 40.2 1501-1600 50 955 2.2 42.4 1601-1700 42 997 1.9 44.3 1701-1800 55 1,052 2.4 46.7 1801-1900 57 1,109 2.5 49.2 1901-2000 56 1,165 2.5 51.7 2001-2500 293 1,458 12.9 64.6 2501-3000 307 1,765 13.6 78.2 3001-4000 368 2,133 16.3 94.5 4001-5000 105 2,238 4.6 99.1 5001-7500 25 2,263 1.1 100.0 over 7500 0 2,263 0.0 100.0
S T A T I S T I C A L S E C T I O N
RETIREES BY STATE
Montana 16Washington
80
Nevada225
North Dakota2 Minnesota
73Wisconsin
319
Iowa108
Missouri549
South Dakota13
Nebraska 18
Wyoming4
Idaho15
Utah21
Arizona557
Illinois48,228
Kansas 33
Oklahoma41
Arkansas181
California
239
Oregon45
Texas368
New Mexico60
Louisiana35
Alabama105
Georgia198
Maine10
New York25
Pennsylvania40
Michigan146
Ohio67
W. Virg
inia
9
North Carolina131
Virginia66
VT2 NH
8 Mass 26
CT 10
Rhode Island 0
Maryland27
Delaware1
NJ19
Washington D.C.
6
Alaska9
Hawaii14
SouthCarolina
102
Other Countries79
Colorado 137Kentucky 157
Indiana369
Mis
siss
ippi
115
Florida1,437
Tennessee 257
State Employees’ Retirement System

66
Average Benefit Payments Fiscal Years 2005 through 2014
Years Credited Service 0-5 5-10 10-15 15-20 20-25 25-30 30+Retirement Effective Dates
Period 7/1/05 to 6/30/06 Average monthly benefit $ - $ 536 $ 715 $ 1,090 $ 1,696 $ 2,893 $ 2,422 Average final average salary $ - $ 3,672 $ 3,614 $ 3,763 $ 4,169 $ 4,990 $ 4,769 Number of retired members - 69 148 160 215 356 450
Period 7/1/06 to 6/30/07 Average monthly benefit $ - $ 536 $ 728 $ 1,117 $ 1,875 $ 3,171 $ 2,736 Average final average salary $ - $ 3,531 $ 3,668 $ 3,820 $ 4,539 $ 5,248 $ 5,034 Number of retired members - 91 190 178 289 417 520
Period 7/1/07 to 6/30/08 Average monthly benefit $ - $ 565 $ 791 $ 1,370 $ 2,143 $ 3,336 $ 2,978 Average final average salary $ - $ 3,628 $ 3,879 $ 4,333 $ 4,642 $ 5,377 $ 5,311 Number of retired members - 96 165 238 423 604 688
Period 7/1/08 to 6/30/09 Average monthly benefit $ - $ 645 $ 835 $ 1,398 $ 2,343 $ 3,598 $ 3,051 Average final average salary $ - $ 4,308 $ 4,075 $ 4,360 $ 4,926 $ 5,783 $ 5,402 Number of retired members - 91 187 191 409 509 659
Period 7/1/09 to 6/30/10 Average monthly benefit $ - $ 587 $ 817 $ 1,437 $ 2,438 $ 3,687 $ 3,243 Average final average salary $ - $ 3,975 $ 4,046 $ 4,623 $ 5,193 $ 5,928 $ 5,537 Number of retired members - 101 188 233 555 617 722
Period 7/1/10 to 6/30/11 Average monthly benefit $ - $ 597 $ 852 $ 1,460 $ 2,591 $ 3,936 $ 3,273 Average final average salary $ - $ 4,089 $ 4,383 $ 4,894 $ 5,549 $ 6,502 $ 5,858 Number of retired members - 96 233 224 532 747 921
Period 7/1/11 to 6/30/12 Average monthly benefit $ – $ 740 $ 944 $ 1,401 $ 2,620 $ 3,989 $ 3,514Average final average salary $ – $ 4,939 $ 4,739 $ $4,788 $ 5,687 $ 6,491 $ 5,922Number of retired members – 104 268 328 843 1,226 1,591
Period 7/1/12 to 6/30/13Average monthly benefit $ – $ 670 $ 1,041 $ 1,568 $ 2,678 $ 3,845 $ 3,471Average final average salary $ – $ 4,852 $ 4,971 $ 5,285 $ 5,854 $ 6,641 $ 6,176 Number of retired members – 99 312 299 574 813 1,002
Period 7/1/13 to 6/30/14Average monthly benefit $ – $ 637 $ 1,130 $ 1,565 $ 2,870 $ 4,115 $ 3,873Average final average salary $ – $ 4,479 $ 5,322 $ 5,422 $ 6,114 $ 6,866 $ 6,580Number of retired members – 81 239 291 571 826 896
Period 7/1/14 to 6/30/15Average monthly benefit $ 0 $ 742 $ 1,114 $ 1,742 $ 2,769 $ 4,062 $ 3,902Average final average salary $ 0 $ 5,213 $ 5,391 $ 5,785 $ 6,173 $ 6,959 $ 6,751Number of retired members 0 88 260 310 541 785 821
S T A T I S T I C A L S E C T I O N
State Employees’ Retirement System

67
PLAN SUMMARY & LEGISLATIVE SECTION
State Employees’ Retirement System
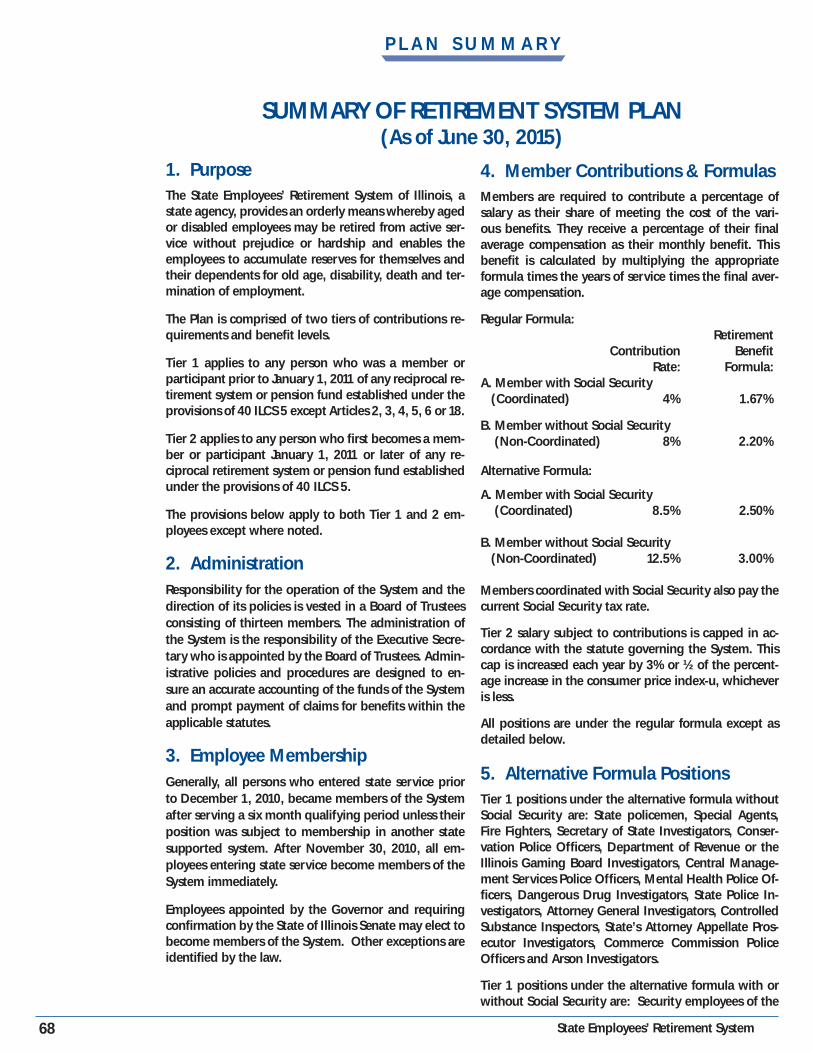
68
SUMMARY OF RETIREMENT SYSTEM PLAN(As of June 30, 2015)
1. PurposeThe State Employees’ Retirement System of Illinois, a state agency, provides an orderly means whereby aged or disabled employees may be retired from active ser-vice without prejudice or hardship and enables the employees to accumulate reserves for themselves and their dependents for old age, disability, death and ter-mination of employment.
The Plan is comprised of two tiers of contributions re-quirements and benefit levels.
Tier 1 applies to any person who was a member or participant prior to January 1, 2011 of any reciprocal re-tirement system or pension fund established under the provisions of 40 ILCS 5 except Articles 2, 3, 4, 5, 6 or 18.
Tier 2 applies to any person who first becomes a mem-ber or participant January 1, 2011 or later of any re-ciprocal retirement system or pension fund established under the provisions of 40 ILCS 5.
The provisions below apply to both Tier 1 and 2 em-ployees except where noted.
2. AdministrationResponsibility for the operation of the System and the direction of its policies is vested in a Board of Trustees consisting of thirteen members. The administration of the System is the responsibility of the Executive Secre-tary who is appointed by the Board of Trustees. Admin-istrative policies and procedures are designed to en-sure an accurate accounting of the funds of the System and prompt payment of claims for benefits within the applicable statutes.
3. Employee Membership Generally, all persons who entered state service prior to December 1, 2010, became members of the System after serving a six month qualifying period unless their position was subject to membership in another state supported system. After November 30, 2010, all em-ployees entering state service become members of the System immediately.
Employees appointed by the Governor and requiring confirmation by the State of Illinois Senate may elect to become members of the System. Other exceptions are identified by the law.
4. Member Contributions & FormulasMembers are required to contribute a percentage of salary as their share of meeting the cost of the vari-ous benefits. They receive a percentage of their final average compensation as their monthly benefit. This benefit is calculated by multiplying the appropriate formula times the years of service times the final aver-age compensation.
Regular Formula: Retirement Contribution Benefit Rate: Formula:A. Member with Social Security (Coordinated) 4% 1.67%
B. Member without Social Security (Non-Coordinated) 8% 2.20% Alternative Formula:
A. Member with Social Security (Coordinated) 8.5% 2.50%
B. Member without Social Security (Non-Coordinated) 12.5% 3.00% Members coordinated with Social Security also pay the current Social Security tax rate.
Tier 2 salary subject to contributions is capped in ac-cordance with the statute governing the System. This cap is increased each year by 3% or ½ of the percent-age increase in the consumer price index-u, whichever is less.
All positions are under the regular formula except as detailed below.
5. Alternative Formula PositionsTier 1 positions under the alternative formula without Social Security are: State policemen, Special Agents, Fire Fighters, Secretary of State Investigators, Conser-vation Police Officers, Department of Revenue or the Illinois Gaming Board Investigators, Central Manage-ment Services Police Officers, Mental Health Police Of-ficers, Dangerous Drug Investigators, State Police In-vestigators, Attorney General Investigators, Controlled Substance Inspectors, State’s Attorney Appellate Pros-ecutor Investigators, Commerce Commission Police Officers and Arson Investigators.
Tier 1 positions under the alternative formula with or without Social Security are: Security employees of the
P L A N S U M M A R Y
State Employees’ Retirement System
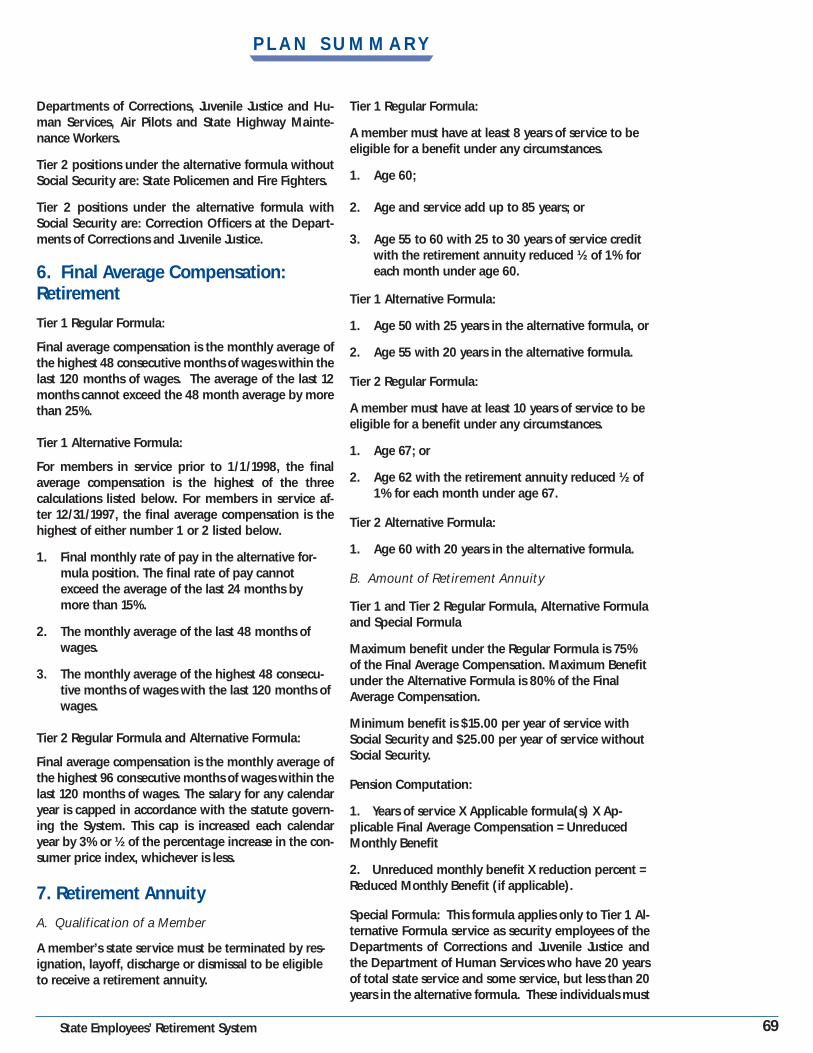
69
Departments of Corrections, Juvenile Justice and Hu-man Services, Air Pilots and State Highway Mainte-nance Workers.
Tier 2 positions under the alternative formula without Social Security are: State Policemen and Fire Fighters.
Tier 2 positions under the alternative formula with Social Security are: Correction Officers at the Depart-ments of Corrections and Juvenile Justice.
6. Final Average Compensation: Retirement
Tier 1 Regular Formula:
Final average compensation is the monthly average of the highest 48 consecutive months of wages within the last 120 months of wages. The average of the last 12 months cannot exceed the 48 month average by more than 25%.
Tier 1 Alternative Formula:
For members in service prior to 1/1/1998, the final average compensation is the highest of the three calculations listed below. For members in service af-ter 12/31/1997, the final average compensation is the highest of either number 1 or 2 listed below.
1. Final monthly rate of pay in the alternative for- mula position. The final rate of pay cannot exceed the average of the last 24 months by more than 15%.
2. The monthly average of the last 48 months of wages.
3. The monthly average of the highest 48 consecu- tive months of wages with the last 120 months of wages.
Tier 2 Regular Formula and Alternative Formula:
Final average compensation is the monthly average of the highest 96 consecutive months of wages within the last 120 months of wages. The salary for any calendar year is capped in accordance with the statute govern-ing the System. This cap is increased each calendar year by 3% or ½ of the percentage increase in the con-sumer price index, whichever is less.
7. Retirement Annuity
A. Qualification of a Member
A member’s state service must be terminated by res-ignation, layoff, discharge or dismissal to be eligible to receive a retirement annuity.
Tier 1 Regular Formula:
A member must have at least 8 years of service to be eligible for a benefit under any circumstances.
1. Age 60;
2. Age and service add up to 85 years; or
3. Age 55 to 60 with 25 to 30 years of service credit with the retirement annuity reduced ½ of 1% for each month under age 60.
Tier 1 Alternative Formula:
1. Age 50 with 25 years in the alternative formula, or
2. Age 55 with 20 years in the alternative formula.
Tier 2 Regular Formula:
A member must have at least 10 years of service to be eligible for a benefit under any circumstances.
1. Age 67; or
2. Age 62 with the retirement annuity reduced ½ of 1% for each month under age 67.
Tier 2 Alternative Formula:
1. Age 60 with 20 years in the alternative formula.
B. Amount of Retirement Annuity
Tier 1 and Tier 2 Regular Formula, Alternative Formula and Special Formula
Maximum benefit under the Regular Formula is 75% of the Final Average Compensation. Maximum Benefit under the Alternative Formula is 80% of the Final Average Compensation.
Minimum benefit is $15.00 per year of service with Social Security and $25.00 per year of service without Social Security.
Pension Computation:
1. Years of service X Applicable formula(s) X Ap-plicable Final Average Compensation = Unreduced Monthly Benefit
2. Unreduced monthly benefit X reduction percent = Reduced Monthly Benefit (if applicable).
Special Formula: This formula applies only to Tier 1 Al-ternative Formula service as security employees of the Departments of Corrections and Juvenile Justice and the Department of Human Services who have 20 years of total state service and some service, but less than 20 years in the alternative formula. These individuals must
P L A N S U M M A R Y
State Employees’ Retirement System

70
meet the eligibility requirements under the regular for-mula and they receive 2.5% or 3.0% on their alterna-tive formula service as security employees and 1.67% or 2.2% on their regular formula service.
Alternative formula refund: Members with alternative formula service who do not qualify for the alternative formula and choose to retire under the regular formula receive a refund of the difference in contributions be-tween the alternative formula and the regular formula.
Widow survivor refund: Members who retire and do not have anyone eligible for survivors’ benefits receive a refund of the contributions for the benefit. The con-tribution rate for the widow survivor benefit is ½ of 1% for members with Social Security and 1% for members without Social Security.
C. Optional Forms of Payment:
Reversionary Annuity: A member may elect to receive a smaller retirement annuity during his lifetime in or-der to provide a designated dependent with a lifetime income. That payment would be in addition to any other benefit payable by the system.
Level Income: A member who contributes to Social Se-curity as a state employee may elect to have their re-tirement annuity payments increased before the age at which the member can receive Social Security benefits and reduced after that age to provide a uniform re-tirement annuity income throughout their retired life. To be eligible for this election, the member must have established eligibility for a Social Security retirement annuity.
Social Security Offset Removal: A member with Social Security can elect to have their pension reduced by 3.825% so that the Social Security offset on survivor benefits in the law will not apply to their eligible sur-vivors.
A retiree who has made this election may only make an irrevocable revocation of the reduction of their re-tirement annuity if there is a change in marital status due to death or divorce. The retiree is not entitled to reimbursement of any benefit reduction prior to the revocation.
D. Annual Increase in Benefit:
Tier 1 Regular Formula: 3% compounded each year af-ter member has been on benefits for one full calendar year. If a member elects to take a reduced pension, they do not receive their first increase until January 1st after they turn 60 and have been on benefits for one full calendar year.Tier 1 Alternative Formula: 3% compounded each January 1st after member turns 55 and has been on benefits for a full calendar year.
Tier 2 Regular Formula: 3% or ½ of the percentage increase in the consumer price index-u, whichever is less, computed on the original benefit each January 1st after member is 67 and has been on benefits for a full calendar year.
Tier 2 Alternative Formula: 3% or ½ the percentage increase in the consumer price index-u, whichever is less, computed on the original benefit each January 1st after member is 60 and has been on benefits for a full calendar year.
8. Survivors’ AnnuityA. Qualifications of Survivor Tier 1 and Tier 2
If death occurs after termination of state service and the member was not receiving a retirement annuity, the Tier 1 member must have established at least 8 years of service credit and the Tier 2 member must have established at least 10 years of service credit.
An eligible spouse qualifies at age 50 or at any age if the spouse is caring for any unmarried children of the member under age 18 (age 22 if a full time student) or over 18 if mentally or physically disabled and unable to work; unmarried children under age 18 (age 22 if a full time student) if no spouse survives; or dependent par-ents at age 50 if neither an eligible spouse nor eligible children survive the member.
A spouse that is the sole nominated beneficiary and sole survivor may elect other death benefits as de-scribed in Number 11.
B. Final Average Compensation: Death
Tier 1
For a full time member, the final average compensa-tion is the higher of the monthly rate of compensation or the monthly average of the highest 48 consecutive months of wages within the last 120 months of wages. If a member has less than 48 months of service, the total wages are divided by the total months of service to arrive at the monthly average. If a member is part time, the monthly rate is equal to the wages received during the last month a member received a full month of service credit before death.
Tier 2
Final average compensation is the monthly average of the highest 96 months of wages within the last 120 months of wages. If a member has less than 96 months of service, the total wages are divided by the total months of service to arrive at the monthly average. The salary for any calendar year is capped in accordance with the statute governing the System. This cap is in-creased each calendar year by 3% or ½ of the percent-
P L A N S U M M A R Y
State Employees’ Retirement System
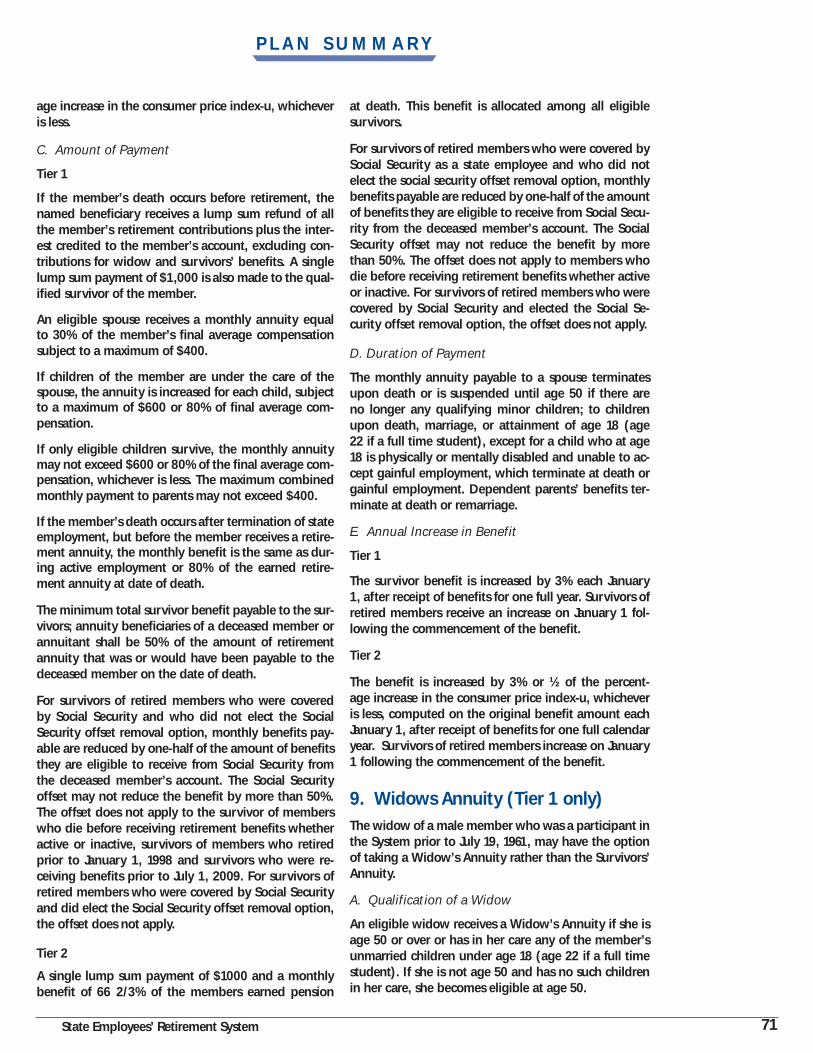
71
age increase in the consumer price index-u, whichever is less.
C. Amount of Payment
Tier 1
If the member’s death occurs before retirement, the named beneficiary receives a lump sum refund of all the member’s retirement contributions plus the inter-est credited to the member’s account, excluding con-tributions for widow and survivors’ benefits. A single lump sum payment of $1,000 is also made to the qual-ified survivor of the member.
An eligible spouse receives a monthly annuity equal to 30% of the member’s final average compensation subject to a maximum of $400.
If children of the member are under the care of the spouse, the annuity is increased for each child, subject to a maximum of $600 or 80% of final average com-pensation.
If only eligible children survive, the monthly annuity may not exceed $600 or 80% of the final average com-pensation, whichever is less. The maximum combined monthly payment to parents may not exceed $400.
If the member’s death occurs after termination of state employment, but before the member receives a retire-ment annuity, the monthly benefit is the same as dur-ing active employment or 80% of the earned retire-ment annuity at date of death.
The minimum total survivor benefit payable to the sur-vivors; annuity beneficiaries of a deceased member or annuitant shall be 50% of the amount of retirement annuity that was or would have been payable to the deceased member on the date of death.
For survivors of retired members who were covered by Social Security and who did not elect the Social Security offset removal option, monthly benefits pay-able are reduced by one-half of the amount of benefits they are eligible to receive from Social Security from the deceased member’s account. The Social Security offset may not reduce the benefit by more than 50%. The offset does not apply to the survivor of members who die before receiving retirement benefits whether active or inactive, survivors of members who retired prior to January 1, 1998 and survivors who were re-ceiving benefits prior to July 1, 2009. For survivors of retired members who were covered by Social Security and did elect the Social Security offset removal option, the offset does not apply.
Tier 2
A single lump sum payment of $1000 and a monthly benefit of 66 2/3% of the members earned pension
at death. This benefit is allocated among all eligible survivors.
For survivors of retired members who were covered by Social Security as a state employee and who did not elect the social security offset removal option, monthly benefits payable are reduced by one-half of the amount of benefits they are eligible to receive from Social Secu-rity from the deceased member’s account. The Social Security offset may not reduce the benefit by more than 50%. The offset does not apply to members who die before receiving retirement benefits whether active or inactive. For survivors of retired members who were covered by Social Security and elected the Social Se-curity offset removal option, the offset does not apply.
D. Duration of Payment
The monthly annuity payable to a spouse terminates upon death or is suspended until age 50 if there are no longer any qualifying minor children; to children upon death, marriage, or attainment of age 18 (age 22 if a full time student), except for a child who at age 18 is physically or mentally disabled and unable to ac-cept gainful employment, which terminate at death or gainful employment. Dependent parents’ benefits ter-minate at death or remarriage.
E. Annual Increase in Benefit
Tier 1
The survivor benefit is increased by 3% each January 1, after receipt of benefits for one full year. Survivors of retired members receive an increase on January 1 fol-lowing the commencement of the benefit.
Tier 2
The benefit is increased by 3% or ½ of the percent-age increase in the consumer price index-u, whichever is less, computed on the original benefit amount each January 1, after receipt of benefits for one full calendar year. Survivors of retired members increase on January 1 following the commencement of the benefit.
9. Widows Annuity (Tier 1 only)The widow of a male member who was a participant in the System prior to July 19, 1961, may have the option of taking a Widow’s Annuity rather than the Survivors’ Annuity.
A. Qualification of a Widow
An eligible widow receives a Widow’s Annuity if she is age 50 or over or has in her care any of the member’s unmarried children under age 18 (age 22 if a full time student). If she is not age 50 and has no such children in her care, she becomes eligible at age 50.
P L A N S U M M A R Y
State Employees’ Retirement System

72
B. Amount of Payment
The Widow’s Annuity consists of a lump sum payment of $500, plus a monthly annuity equal to 50% of the retirement annuity earned or received by the member at the date of death.
If the widow has in her care eligible children of the member, the monthly annuity is increased 5% because of each child, subject to a maximum payment equal to 66 2/3% of the earned retirement annuity.
Monthly benefits payable to a widow of a member who was covered by Social Security as a state em-ployee are reduced by one-half of the amount of ben-efits she is eligible to receive from Social Security as a widow. The Social Security offset may not reduce the benefit by more than 50%. The offset does not apply to the members who die before receiving retirement benefits whether active or inactive, widow of members who retired prior to 1/1/1998 and widows who were receiving benefits prior to July 1, 2009.
C. Duration of Payment
The monthly payment to the widow continues for her lifetime or is suspended until age 50 if there are no longer any qualifying minor children. If the amount of benefit was increased because of eligible children, it is adjusted downward as these children’s benefits are terminated due to death, marriage or attainment of age 18 (age 22 if a full time student).
D. Annual Increase in Benefit
The widow’s benefit is increased by 3% each January 1, after receipt of benefits for one full year. Widows of retired members receive the increase on January 1 fol-lowing the commencement of the benefit.
10. Occupational Death Benefit
A. Qualification of Survivors
If a member’s death results from a job related cause, the spouse may be eligible for an Occupational Death Benefit. If only unmarried children under age 18 (age 22 if a full time student) survive, they may be eligible for the benefit. If neither a spouse nor eligible children survive, a dependent father or mother may be eligible.
B. Amount of Payment
The nominated beneficiary receives a lump sum pay-ment consisting of all contributions made by the mem-ber plus the interest credited to the member’s account. A surviving spouse is entitled to a monthly benefit equal to 50% of the member’s final average compen-sation.
If children age 18 (age 22 if a full time student) also sur-vive, the annuity is increased by 15% of such average because of each child subject to a maximum of 75%. If no eligible spouse and children under age 18 (age 22 if a full time student) survive, each child receives a monthly allowance of 15% of the final average compen-sation. The combined payment to children may not ex-ceed 50% of the member’s final average compensation.
If there is no eligible spouse or eligible children, a ben-efit of 25% of final average compensation is payable to each surviving dependent parent for life.
In all cases, the monthly benefit is reduced by any pay-ments awarded under the Workers’ Compensation Act or Workers’ Occupational Diseases Act.
C. Duration of Payment
The monthly annuity payable to a spouse or a depen-dent parent terminates at death; to children at death, or attainment of age 18 (age 22 if a full time student), or marriage.
D. Annual Increase in Benefit
Tier 1
The Occupational Death Benefit is increased by 3% each January 1 following the first anniversary of the an-nuity.
Tier 2
The Occupational Death Benefit is increased by 3% or ½ of the percentage increase in the consumer price index-u, whichever is less, computed on the original benefit each January 1, following the first anniversary of the annuity.
11. Other Death BenefitsIf the beneficiary or beneficiaries of the member do not qualify for any of the previously described death ben-efits, one of the following benefits is payable.
A. Before Retirement
If a member’s death occurred while in state service, the benefit consists of:
1. A refund of all contributions plus the interest credited to the member’s account;
2. A payment equal to one month’s salary for each full year of service credit not to exceed six month’s salary.
If the member had terminated state service, but not yet qualified for a retirement annuity, the benefit con-sists of a refund of all the member’s contributions to
P L A N S U M M A R Y
State Employees’ Retirement System
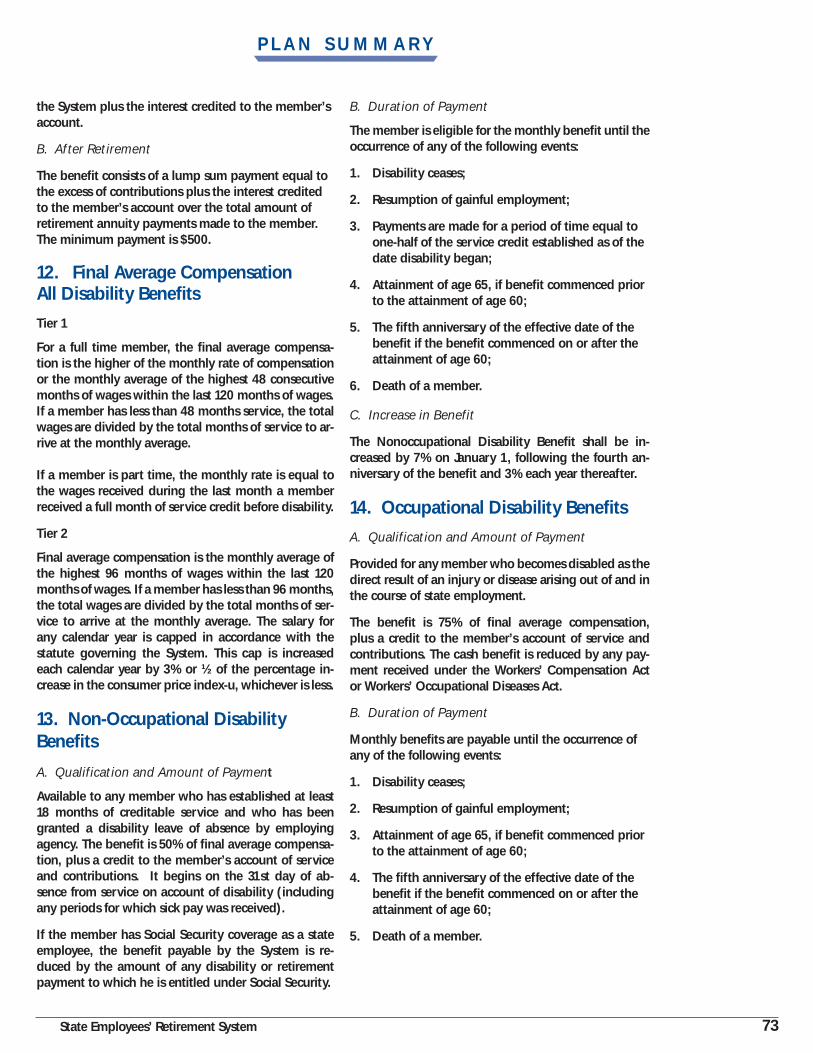
73
the System plus the interest credited to the member’s account.
B. After Retirement
The benefit consists of a lump sum payment equal to the excess of contributions plus the interest credited to the member’s account over the total amount of retirement annuity payments made to the member. The minimum payment is $500.
12. Final Average Compensation All Disability Benefits
Tier 1
For a full time member, the final average compensa-tion is the higher of the monthly rate of compensation or the monthly average of the highest 48 consecutive months of wages within the last 120 months of wages. If a member has less than 48 months service, the total wages are divided by the total months of service to ar-rive at the monthly average.
If a member is part time, the monthly rate is equal to the wages received during the last month a member received a full month of service credit before disability.
Tier 2
Final average compensation is the monthly average of the highest 96 months of wages within the last 120 months of wages. If a member has less than 96 months, the total wages are divided by the total months of ser-vice to arrive at the monthly average. The salary for any calendar year is capped in accordance with the statute governing the System. This cap is increased each calendar year by 3% or ½ of the percentage in-crease in the consumer price index-u, whichever is less.
13. Non-Occupational Disability Benefits
A. Qualification and Amount of Payment
Available to any member who has established at least 18 months of creditable service and who has been granted a disability leave of absence by employing agency. The benefit is 50% of final average compensa-tion, plus a credit to the member’s account of service and contributions. It begins on the 31st day of ab-sence from service on account of disability (including any periods for which sick pay was received).
If the member has Social Security coverage as a state employee, the benefit payable by the System is re-duced by the amount of any disability or retirement payment to which he is entitled under Social Security.
B. Duration of Payment
The member is eligible for the monthly benefit until the occurrence of any of the following events:
1. Disability ceases;
2. Resumption of gainful employment;
3. Payments are made for a period of time equal to one-half of the service credit established as of the date disability began;
4. Attainment of age 65, if benefit commenced prior to the attainment of age 60;
5. The fifth anniversary of the effective date of the benefit if the benefit commenced on or after the attainment of age 60;
6. Death of a member.
C. Increase in Benefit
The Nonoccupational Disability Benefit shall be in-creased by 7% on January 1, following the fourth an-niversary of the benefit and 3% each year thereafter.
14. Occupational Disability Benefits
A. Qualification and Amount of Payment
Provided for any member who becomes disabled as the direct result of an injury or disease arising out of and in the course of state employment.
The benefit is 75% of final average compensation, plus a credit to the member’s account of service and contributions. The cash benefit is reduced by any pay-ment received under the Workers’ Compensation Act or Workers’ Occupational Diseases Act.
B. Duration of Payment
Monthly benefits are payable until the occurrence of any of the following events:
1. Disability ceases;
2. Resumption of gainful employment;
3. Attainment of age 65, if benefit commenced prior to the attainment of age 60;
4. The fifth anniversary of the effective date of the benefit if the benefit commenced on or after the attainment of age 60;
5. Death of a member.
P L A N S U M M A R Y
State Employees’ Retirement System

74
C. Increase in Benefit
The Occupational Disability Benefit shall be increased by 7% on January 1, following the fourth anniversary of the benefit and 3% each year thereafter.
15. Temporary Disability Benefits
A. Qualification and Amount of Payment
Available to any member who becomes disabled, has established at least 18 months of creditable service, has been denied benefits under the Workers’ Compen-sation Act or the Workers’ Occupational Diseases Act, or had benefits terminated, and has filed an appeal with the Illinois Workers’ Compensation Commission. The benefit is 50% of final average compensation, plus a credit to the member’s account of service and con-tributions.
The benefit shall begin to accrue on the 31st day of absence from service and shall be payable upon the expiration of 31 days from the day the member last received compensation.
If the member has Social Security coverage as a state employee, the benefit payable to the System is re-duced by the amount of any disability or, if age 65, any retirement payment to which he is eligible under Social Security.
P L A N S U M M A R Y
B. Duration of Payment
The member is eligible for the monthly benefit until the occurrence of any of the following events:
1. Disability ceases;
2. Resumption of gainful employment;
3. Payments are made for a period of time equal to one-half of the service credit established as of the date disability began;
4. Attainment of age 65, if benefit commenced prior to the attainment ofage 60;
5. The fifth anniversary of the effective date of the benefit if the benefit commenced on or after the attainment of age 60;
6. Death of a member;
7. Benefits are paid or awarded under the Workers’ Compensation Act or the Workers’ Occupational Diseases Act.
16. Separation Benefits
Upon termination of state employment by resignation, discharge, dismissal or layoff, a member may obtain a refund of the contributions made to the System, ex-cluding interest. The member must be off the payroll for 14 days to be eligible for a refund. By accepting a refund, a member forfeits all accrued rights and ben-efits in the System for himself and his beneficiaries.
State Employees’ Retirement System

L E G I S L A T I V E S E C T I O N
75
LEGISLATIVE AMENDMENTS
Legislative amendments with an effective date dur-ing fiscal year 2015 having an impact on the System:
Senate Bill 3309 (P.A. 98-1117; effective August 26, 2014)1. States that, if the System mistakenly sets any benefit at an incorrect amount, the System shall re-calculate the benefit as soon as may be practicable after the mistake is discovered. If the benefit was mistakenly set too low, the System shall make a lump sum payment to the recipient of an amount equal to the difference between the benefits that should have been paid and those actually paid. If the benefit was mistakenly set too high, the System may recover the amount overpaid from the recipi-ent thereof, either directly or by deducting such amount from the remaining benefits payable to the recipient. However, if (a) the amount of the benefit was mistakenly set too high, and (b) the error was undiscovered for 3 years or longer, and (c) the error was not the result of incorrect information supplied by the affected member or beneficiary then, upon discovery of the mistake, the benefit shall be adjust-ed to the correct level but the recipient of the ben-efit need not repay to the System the excess amount received in error. This applies to all mistakes in ben-efit calculations that occur before, on, or after the effective date of this amendatory Act.2. Requires the adopted actuarial tables be used to determine the amount of all benefits payable by the System, including any optional forms of benefits.3. States that, upon plan termination, a partici-pant’s interest in the pension fund will be nonfor-feitable.
NEW LEGISLATION
Legislative amendments with an effective date sub-sequent to June 30, 2015 having an impact on the System:
House Bill 0422 (P.A. 99-0232; effective August 3, 2015)Requires the System to conduct an actuarial experi-ence study at least once every three (3) years.
State Employees’ Retirement System