Embed Size (px)
Citation preview
The Stateof BlackImmigrantspart i: A statistical Portrait of
Black Immigrants in the United States

2
3
METHODOLOGY 3
DEFINITIONS 3
currENT STaTE OF bLack IMMIGraNTS IN THE u.S. 3
I. SIzE aND GrOwTH OF bLack IMMIGraNT POPuLaTION 3
Size and Growth of the Overall PopulationPercentage of Black Population
Percentage of the Foreign-Born Population
II. cHaracTErISTIcS OF THE bLack IMMIGraNT POPuLaTION 3
Diversity Based on Country or Region of OriginLength of Residency in the U.S.
Geographic Dispersion in the U.S.
III. EDucaTIONaL backGrOuND 3
Iv. EcONOMIc SNaPSHOT 3
v. IMMIGraTION STaTuS aND MEaNS OF ENTrY 4 A. UnAUthorized PoPUlAtion
B. lAwfUl PermAnent resident And nAtUrAlized PoPUlAtionC. diversity visA
d. temPorAry ProteCted stAtUse. Aslyee or refUgee stAtUs
vI. accESS TO rELIEF FrOM DEPOrTaTION 6 A. disCretionAry relief or terminAtion in removAl
ProCeedings Relief and Termination Generally
Defensive Aslym Applications
b. Daca Eligibility, applications and GrantsEligibility
Approvals
contents

4 4
authorsJuliana Morgan-Trostle and Kexin Zheng are J.D. candidates at New York University School of Law and are the primary authors of this report. They conducted this work as student advocates New York University School of Law’s Immigrant Rights Clinic, under the supervision of Professor Alina Das. The views represented herein do not necessarily represent the views of New York University.
Carl Lipscombe is on the senior leadership team at the Black Alliance for Just Immigration (BAJI). Carl’s diverse experience working on behalf of marginalized communities includes stints as a labor and community organizer, public defender, and communications specialist for local, state, and national social justice organizations. Carl received a B.A. in Philosophy from Brooklyn College, studied Public Policy at New York University, and received a J.D. from Benjamin N. Cardozo School of Law.
acknowledgmentsThe authors are especially grateful to Eric Geng Zhou, Master student in Applied Quantitative Research at New York University, for his dedicated work analyzing the untabulated 2014 census data from American Community Survey and his skills in deciphering the information on Black immigrants in Stata and R programs.
The authors are grateful to Professor Alina Das of the Immigrant Rights Clinic for her guidance throughout the drafting of the report. Her wisdom and support motivated the authors through the most challenging parts of their research and writing.
5
aboutBlack Alliance for Just Immigration
The Black Alliance for Just Immigration (BAJI) is a racial justice and migrants’ rights organization that engages in education, advocacy, and cross-cultural alliance-building in order to end racism, mass criminalization, and economic disenfranchisement of African American and Black Immigrant communities. BAJI’s headquarters are in Brooklyn, NY with additional offices in Oakland, CA, Atlanta, GA, and Los Angeles, CA.
NYU School of Law Immigrant Rights Clinic
The Immigrant Rights Clinic is a leading institution in both local and national struggles for immigrant rights. Students engage in direct legal representation of immigrants and community organizations as well as in immigrant rights campaigns at the local, state and national levels. Students have direct responsibility for all aspects of their cases and projects and the opportunity to build their understanding of legal practice in the field of immigrant rights law and organizing.
6
methodology
This background report aims to provide basic descriptive statistics regarding Black or African American immigrants based on the American Community Survey (ACS), the 2014 Yearbook of Immigration Statistics published by the U.S. Department of Homeland Security (DHS), and immigration data available on the Transactional Records Access Clearinghouse (TRAC) website developed by Syracuse University.
ACS 2014 1-year Public Use Microdata Sample (PUMS) data was used to conduct the research on specific information of the immigrant communities in the U.S. and the untabulated data was downloaded from the U.S. Census Bureau website1 and then analyzed in Stata and R programs. Information about immigrants’ population, education, poverty rate, citizenship status, place of birth, geographic location and other demographics were analyzed. Since the PUMS data represents about 1% of the American population, results on the total population estimates were calculated by replicating the weight variable within the dataset, subject to standard errors of inferential statistics.2
Other conclusions on Black immigrants were analyzed based on the DHS Yearbook and TRAC data, which were both categorized by regions and/or nationalities. All data on Black immigrants from the DHS source was calculated based on immigrants from African and Caribbean countries. Since the data on immigration courts available on TRAC was obtained through a Freedom of Information Act (FOIA) request to the Executive Office for Immigration Review (EOIR) under the Department of Justice, the data was similarly organized by nationalities and the results on Black immigrants were calculated based on all African and Caribbean countries.
7
definitions
A-C
Affirmative AsylumThe process in which asylum-seekers in the U.S. voluntarily present themselves to the U.S. Government to ask for asylum. The affirmative application for asylum is made to the Asylum Office of the Citizenship and Immigration Services (CIS) division of the U.S. Department of Homeland Security (DHS).
African Countries
Includes Algeria, Angola, Benin, Botswana, Burkina Faso,
Burundi, Cabo Verde (Cape Verde), Cameroon, Central African Republic, Chad, Comoros (Comoros Islands), Congo, Cote d’Ivoire (Ivory Coast), Democratic Republic of the Congo, Djibouti, Egypt, Equatorial Guinea, Eritrea, Ethiopia, Gabon, Gambia, Ghana, Guinea, Guinea-
Bissau, Kenya, Lesotho, Liberia, Libya, Madagascar, Malawi, Mali, Mauritania, Mauritius, Morocco, Mozambique, Namibia, Niger, Nigeria, Réunion, Rwanda, Saint Helena, Sao Tome and Principe, Senegal, Seychelles, Sierra Leone, Somalia, South Africa, South Sudan, Sudan, Swaziland, Togo, Tunisia, Uganda, United Republic of Tanzania, Western Sahara, Zambia, and Zimbabwe.
Black Immigrants
black Immigrants, unless otherwise specified in this
report, refers to any person who was born outside the United States, Puerto Rico or other U.S. territories and whose country of origin is located in Africa or the Caribbean. Where Census data is available, the definition of “Black immigrant” is any person who was born outside
the United States, Puerto Rico or other U.S. territories and self-identified as “Black or African American alone” in 2000 and later U.S. Census Bureau surveys. Immigrant population estimates include all immigrants regardless of current citizenship or legal status.
Caribbean Countries
caribbean Countries include Anguilla, Antigua and Barbuda,
Aruba, Bahamas, Barbados, Bonaire, British Virgin Islands, Cayman Islands, Cuba, Dominica, Dominican Republic, Grenada, Guadeloupe, Haiti, Jamaica, Martinique, Montserrat, Saint Kitts and Nevis, Saint Lucia, Saint Vincent and the Grenadines, Trinidad and Tobago, and Turks and caicos Islands.
8
definitions
D-N
8
Defensive Asylum
Defensive Asylum refers to the process in which asylum-
seekers who are in removal proceedings before EOIR of the Department of Justice submit an application for asylum.
Deferred Action for Childhood Arrivals (DACA)
DACA s a U.S. immigration policy that allows certain
undocumented immigrants who entered the country before their 16th birthday and before June 2007 to receive a renewable two-year work permit and exemption from deportation. Diversity Visa
Diversity Visa
Diversity visa is a United States congressionally-mandated
lottery program for receiving a United States Permanent Resident Card. Each fiscal year, the Diversity Visa Program makes 55,000
immigrant visas available to people from countries that have low rates of immigration to the United States. Applicants who meet the eligibility requirements are entered into a random drawing.
Foreign-Born
Foreign-born refers to people in the U.S. born outside the
U.S., Puerto Rico or other U.S. territories. The terms “foreign-born” and “immigrant” are used interchangeably.
Immigration Court
Immigration court is an administrative court responsible
for adjudicating immigration cases in the U.S. Cases involve non-citizens who generally have been charged by DHS with being in violation of immigration law. The court is part of EOIR. Appeals of Immigration Judge decisions can be made to the Board of Immigration Appeals (BIA), which is also part of EOIR. Some BIA decisions can be appealed further, to the federal courts.
Immigration Judge
Immigration judge is an attorney appointed by the Attorney
General to act as an administrative judge within EOIR. Immigration Judges conduct formal court proceedings in determining whether an alien should be allowed to enter or remain in the U.S., in considering bond amounts in certain situations, and in considering various forms of relief from removal.
Lawful Permanent Resident
Lawful permanent residents (LPRs) are persons who have
been granted lawful permanent residence in the United States. They are also known as “green card” recipients.
Naturalizations
Naturalizations refers to the process by which immigrants
become U.S. citizens. To be
99
Relief Granted
relief granted refers to cases in which an Immigration Court
judge finds the original charges are sustained but finds provisions in the immigration law entitle the individual to relief from removal, allowing them to remain in this country.
Removal
removal refers to the expulsion of a person from the U.S. who
is not a U.S. citizen. The more common term is “deportation.” The process may be non-adversarial and led by an immigration officer, or it may involve an adversarial hearing before an Immigration Judge who also may determine whether any exceptions to deportation should be applied. An individual who is removed may have administrative or criminal consequences placed on subsequent re-entry.
Temporary Protection Status
Temporary Protection Status (TPS) is a temporary
immigration status granted to eligible nationals of certain countries (or parts of countries) who are already in the United States. The Secretary of Homeland Security may designate a foreign country for TPS due to conditions in the country that temporarily prevent the country’s nationals from returning safely, or in certain circumstances, where the country is unable to handle the return of its nationals adequately.
Termination (No Grounds for Removal)
Termination (no grounds for removal) refers to cases in
which an Immigration Court judge finds the charges against the individual are not sustained and terminates the case. Situations where the alien has established eligibility for naturalization can be grounds for termination.
naturalized under U.S. laws, a person generally must be 18 and older, have been a green card holder for at least five years and possess an acceptable background with regard to criminal and national security concerns.
Non-Citizen
Non-citizen refers to people born outside the U.S., Puerto Rico
or other U.S. territories, excluding people who are U.S. citizens.
Refugees and Asylees
refugees and asylees are persons who sought residence
in the United States in order to avoid persecution in their country of origin. Persons granted refugee status applied for admission while outside the United States. Persons granted asylum applied either at a port of entry or at some point after their entry into the United States.
N-T
10
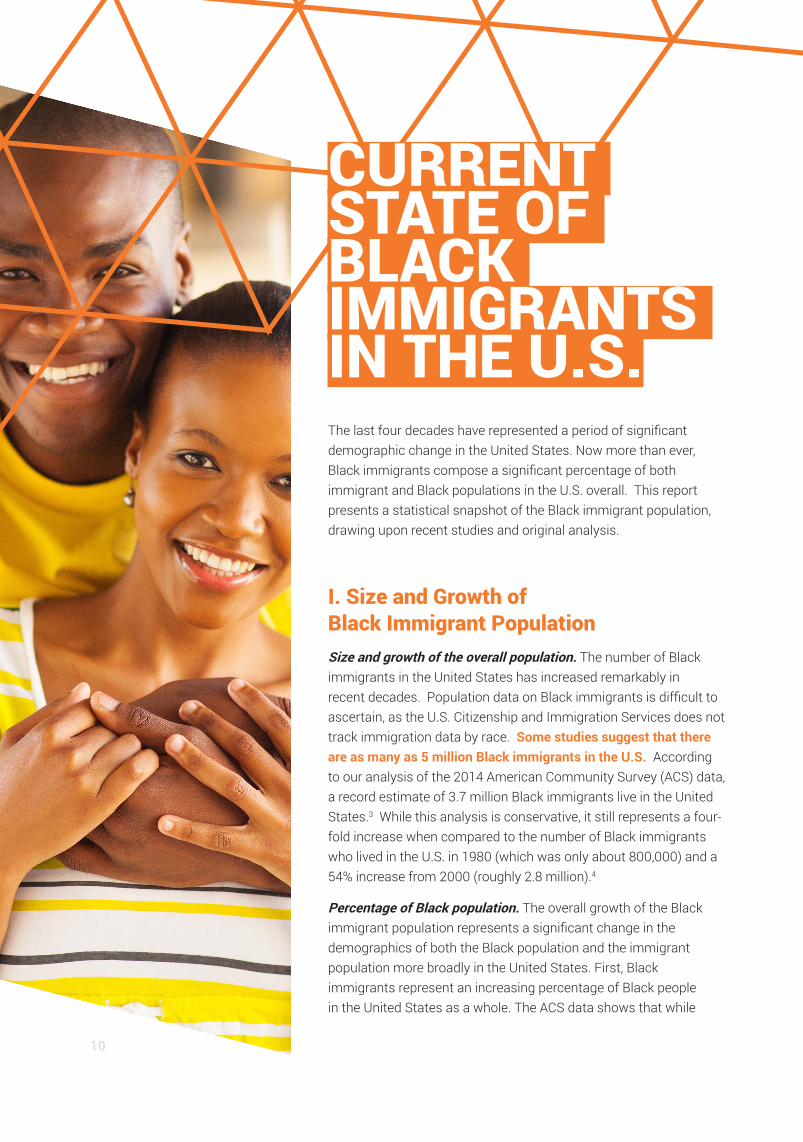
CURRENT STATE OF BLACK IMMIGRANTS IN THE U.S.The last four decades have represented a period of significant demographic change in the United States. Now more than ever, Black immigrants compose a significant percentage of both immigrant and Black populations in the U.S. overall. This report presents a statistical snapshot of the Black immigrant population, drawing upon recent studies and original analysis.
I. Size and Growth of Black Immigrant PopulationSize and growth of the overall population. The number of Black immigrants in the United States has increased remarkably in recent decades. Population data on Black immigrants is difficult to ascertain, as the U.S. Citizenship and Immigration Services does not track immigration data by race. Some studies suggest that there are as many as 5 million Black immigrants in the U.S. According to our analysis of the 2014 American Community Survey (ACS) data, a record estimate of 3.7 million Black immigrants live in the United States.3 While this analysis is conservative, it still represents a four-fold increase when compared to the number of Black immigrants who lived in the U.S. in 1980 (which was only about 800,000) and a 54% increase from 2000 (roughly 2.8 million).4
Percentage of Black population. The overall growth of the Black immigrant population represents a significant change in the demographics of both the Black population and the immigrant population more broadly in the United States. First, Black immigrants represent an increasing percentage of Black people in the United States as a whole. The ACS data shows that while
11
Black immigrants accounted for only 3.1% of the Black population in the U.S. in 1980,5 Black immigrants now account for nearly 10% of the nation’s Black population.6 This growth is particularly significant in states with the largest number of Black immigrants. For example in New York, Black immigrants make up almost 30% of the total Black population in the state, making it the top state for Black immigrants in the U.S. Florida seconds the list with over 20% of its Black population being foreign-born.7 The Census Bureau projects that by 2060, 16.5% of America’s Black population will be foreign-born.8
Percentage of the foreign-born population. Second, Black immigrants make up a significant portion of the overall immigrant and non-citizen population in the U.S. According to the 2014 one-year estimates from ACS, the estimated total of foreign-born population in the U.S. was 42 million, within which 8.7% were Black immigrants.9 In addition, about 22 million of the U.S. foreign-born population were non-citizens, among whom 7.2% were Black.10
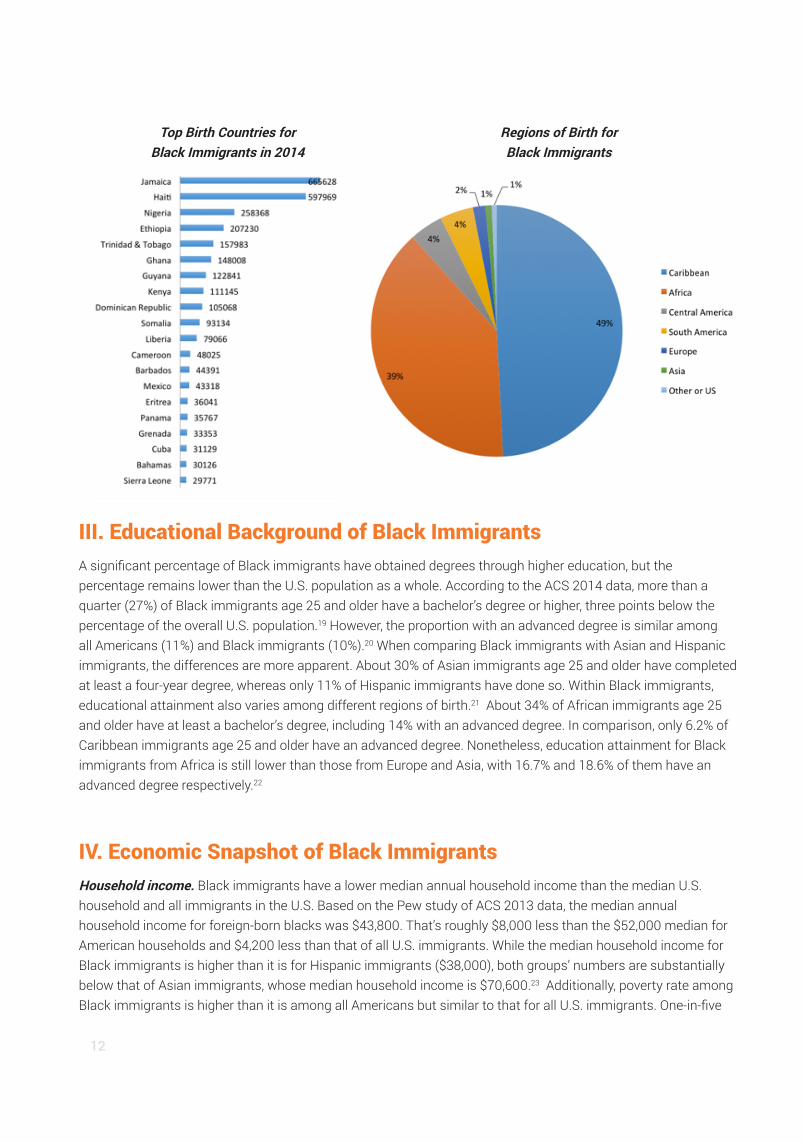
II. Characteristics of the Black Immigrant Population Diversity based on country or region of origin. While Black immigrants in the U.S. come from diverse backgrounds and regions of the world, immigrants from African and Caribbean countries comprise the majority of the foreign-born Black population. According to the 2014 ACS data, Jamaica was the top country of origin in 2014 with 665,628 Black immigrants in the U.S., accounting for 18% of the national total.11 Haiti seconds the list with 598,000 Black immigrants, making up 16% of the U.S. Black immigrant population.12
Although half of Black immigrants are from the Caribbean region alone, African immigrants drove much of the recent growth of the Black immigrant population and made up 39% of the total foreign-born Black population in 2014.13 The number of African immigrants in the U.S. increased 153%, from 574,000 in 2000 to 1.5 million in 2014, with Nigeria and Ethiopia as the two leading countries of origin.14
Besides African and Caribbean regions, an estimated 4% of Black immigrants are from South America, another 4% are from Central America, 2% are from Europe and 1% from Asia.15
Length of residency in the U.S. Black immigrants tend to have lived in the U.S. for long periods of time, although there are some regional differences in length of residency. As more African immigrants are recent arrivals, those from the Caribbean have generally lived in the U.S. longer. According to a Pew study of 2013 and prior ACS data, more than half (63%) of Black African immigrants arrived in the U.S. in 2000 or later, and more than one-third (36%) arrived in 2006 or later. By contrast, 42% of Caribbean immigrants arrived in the U.S. before 1990, while only 18% arrived in 2006 or later. Black immigrants from Jamaica, Haiti and the Dominican Republic increasingly began moving to the U.S. in the 1960s.16
Geographic dispersion in the U.S. The geographic dispersion of Black immigrants is highly concentrated. New York State is home to 846,730 (23%) Black immigrants, making it the top state of residence. Florida has the second largest foreign-born Black population (18%), followed by Texas (6%) and Maryland (6%).17 Some Black immigrant communities tend to cluster together around certain metropolitan areas. For example, according to the Pew study of 2013 ACS data, New York City is home to nearly 40% of all foreign-born black Jamaicans in the U.S.; Miami has the nation’s largest Haitian immigrant community; Washington D.C. has the largest Ethiopian immigrant community; and Somalian immigrants concentrate in metropolitan areas of Minnesota and Wisconsin.18
12
III. Educational Background of Black Immigrants A significant percentage of Black immigrants have obtained degrees through higher education, but the percentage remains lower than the U.S. population as a whole. According to the ACS 2014 data, more than a quarter (27%) of Black immigrants age 25 and older have a bachelor’s degree or higher, three points below the percentage of the overall U.S. population.19 However, the proportion with an advanced degree is similar among all Americans (11%) and Black immigrants (10%).20 When comparing Black immigrants with Asian and Hispanic immigrants, the differences are more apparent. About 30% of Asian immigrants age 25 and older have completed at least a four-year degree, whereas only 11% of Hispanic immigrants have done so. Within Black immigrants, educational attainment also varies among different regions of birth.21 About 34% of African immigrants age 25 and older have at least a bachelor’s degree, including 14% with an advanced degree. In comparison, only 6.2% of Caribbean immigrants age 25 and older have an advanced degree. Nonetheless, education attainment for Black immigrants from Africa is still lower than those from Europe and Asia, with 16.7% and 18.6% of them have an advanced degree respectively.22
IV. Economic Snapshot of Black Immigrants Household income. Black immigrants have a lower median annual household income than the median U.S. household and all immigrants in the U.S. Based on the Pew study of ACS 2013 data, the median annual household income for foreign-born blacks was $43,800. That’s roughly $8,000 less than the $52,000 median for American households and $4,200 less than that of all U.S. immigrants. While the median household income for Black immigrants is higher than it is for Hispanic immigrants ($38,000), both groups’ numbers are substantially below that of Asian immigrants, whose median household income is $70,600.23 Additionally, poverty rate among Black immigrants is higher than it is among all Americans but similar to that for all U.S. immigrants. One-in-five
Top Birth Countries for Black Immigrants in 2014
Regions of Birth for Black Immigrants
13
(20%) Black immigrants live below the poverty line, according to the Pew Research Center analysis of Census Bureau data, a rate that falls between that of Asian immigrants (13%) and Hispanic immigrants (24%).
Black women across the board earn lower wages than U.S.-born non-Hispanic white women.
According to a 2011 study by the Economic Policy Institute, Caribbean women earn 8.3% less than U.S. born non-Hispanic white women; African women earn 10.1% less. When we consider subsets of Black immigrants, the differences become even more dramatic.24 For example, Haitian women earn 18.6% less than U.S. born non-Hispanic white women.25
Similarly, Black immigrant men earn lower wages than U.S. born non-Hispanic white men. Caribbean men earn 20.7% less than U.S. born non-Hispanic white men and African men 34.7%.26 Notably, as of 2011 Black immigrant men also earned lower wages than African American males. While earnings for Caribbean men were just 1% less than those of African-Americans, African men earned nearly 15% less than US Born Black men.27
Black Immigrants in the Workforce. Black immigrants are more likely to participate in the labor force than the overall immigrant population. The Bureau of Labor Statistics reports that 70.8% of Black immigrants participate in the civilian labor force.28
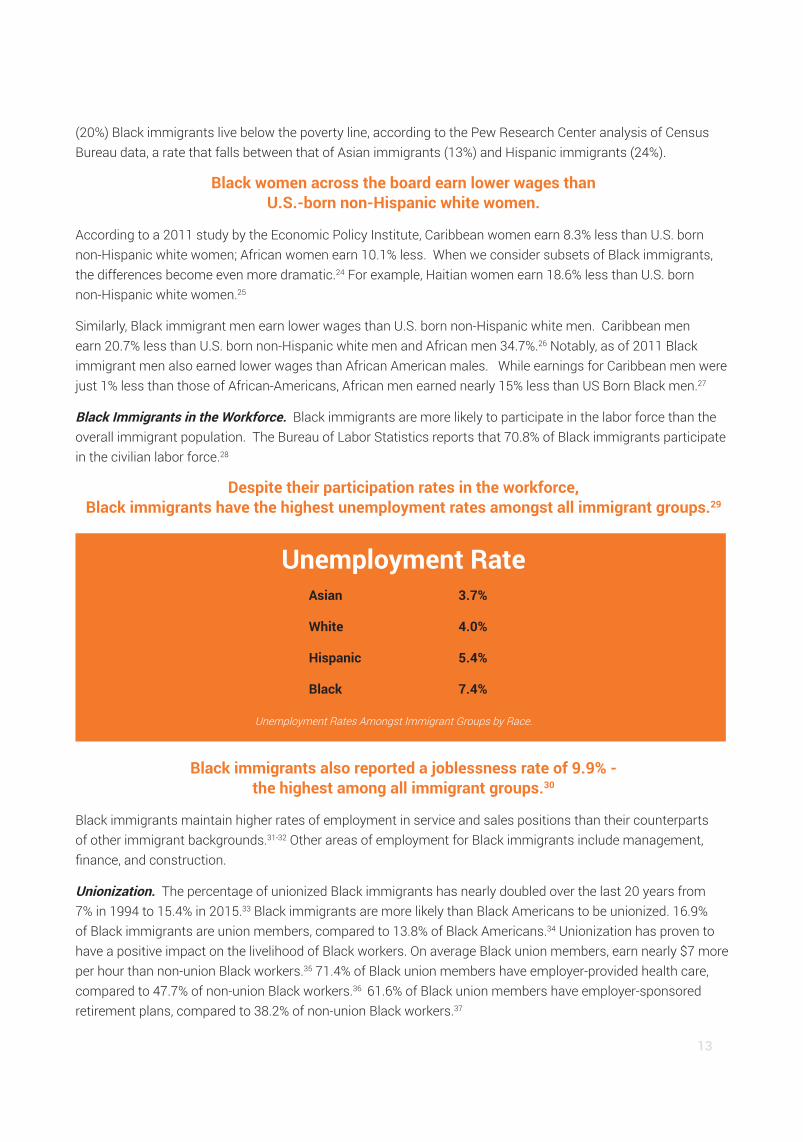
Despite their participation rates in the workforce, Black immigrants have the highest unemployment rates amongst all immigrant groups.29
Unemployment Rateasian 3.7%
White 4.0%
Hispanic 5.4%
Black 7.4%
Unemployment Rates Amongst Immigrant Groups by Race.
Black immigrants also reported a joblessness rate of 9.9% - the highest among all immigrant groups.30
Black immigrants maintain higher rates of employment in service and sales positions than their counterparts of other immigrant backgrounds.31-32 Other areas of employment for Black immigrants include management, finance, and construction.
Unionization. The percentage of unionized Black immigrants has nearly doubled over the last 20 years from 7% in 1994 to 15.4% in 2015.33 Black immigrants are more likely than Black Americans to be unionized. 16.9% of Black immigrants are union members, compared to 13.8% of Black Americans.34 Unionization has proven to have a positive impact on the livelihood of Black workers. On average Black union members, earn nearly $7 more per hour than non-union Black workers.35 71.4% of Black union members have employer-provided health care, compared to 47.7% of non-union Black workers.36 61.6% of Black union members have employer-sponsored retirement plans, compared to 38.2% of non-union Black workers.37
14
V. Immigration Status and Means of EntryThe majority of Black immigrants are living in the U.S. with formal immigration authorization. According to a Pew study, about 84% of the Black immigrant population are living in the U.S. with authorization.38 This section of the report presents details about Black immigrants by immigration status.
A. Undocumented Community Members
When compared with the overall share of undocumented immigrants in the country—about a quarter of the total immigrant population—Black immigrants are less likely to be in the U.S. unlawfully. An estimated 575,000 Black immigrants were living in the U.S. without authorization in 2013, according to the Pew Research Center study, making up 16% of all Black immigrations population. Among Black immigrants from the Caribbean, 16% are undocumented immigrants and as are 13% of Black immigrants from Africa.39 Despite the smaller percentage of unauthorized Black immigrants relative to the national share, the number of undocumented immigrants from Africa and the Caribbean is rising more quickly than the overall foreign-born Black population. Between 2000 and 2013, the total number of unauthorized African and Caribbean immigrant population climbed from 389,000 to 602,000, an increase of 162% (although the Caribbean immigrant population only contributed to 1% of the increase).40 During the same period, the total number of foreign-born Black immigrants increased by only 56%.
When compared with the increase of undocumented immigrant population from other regions of the world, African and Caribbean unauthorized immigrants are growing at a lower rate since 2000 than those from Central America (194% without Mexico) and Asia (202%), but faster than those from South America (39%) and Europe (62%).41
B. Lawful Permanent Resident and Naturalized Population
In FY 2014, according to the U.S. Department of Homeland Security yearbook, 232,290 Black immigrants in the U.S. obtained lawful permanent resident (LPR) status. They represented 23% of all individuals who became lawful permanent residents in FY 2014.42 The basis for obtaining lawful permanent resident status was diverse itself. Among the African and Caribbean immigrants who obtained LPR status, a majority of them were immediate relatives of U.S. citizens (36%) or otherwise family-sponsored (23%); 27.3% obtained their status through refugee and asylee adjustment; 10.2% were based on “diversity visas” (see below); and 2.7% were employment-based.43
A similar percentage of African and Caribbean immigrants were naturalized in 2014. According to the DHS statistics, out of the 653,416 persons naturalized, 145,530 or 22.3% were immigrants from African or Caribbean countries.44 The ACS data also show that the proportion of foreign-born Black immigrants who are naturalized U.S. citizens has increased from 44% in 2000 to 55% in 2014 (total number of Black naturalized citizens is about 2 million), a higher share than among immigrants in the U.S. (47%).47 Black immigrants from South America and the Caribbean have the highest citizenship rates among all Black immigrants, 67% and 61% respectively. About half of Black immigrants from Africa are U.S. citizens, possibly because they generally arrived more recently than other Black immigrants.46
15
C. Diversity Visas
Many Black immigrants, primarily from Africa, arrive through the “diversity visa,” a lottery system designed to increase immigration from underrepresented nations. The diversity immigrant category was added to the Immigration and Nationality Act (INA) by the Immigration Act of 1990 to stimulate “new seed” immigration.47 The yearly number of permanent resident “green cards” offered through the program is capped at 55,000, with 5,000 of those going to beneficiaries of the Nicaraguan Adjustment and Central American Relief Act (NACARA). Nonetheless, in FY 2005-2014, Africa saw an allotment of nearly 46% of all diversity visas. In contrast, only 0.02% of diversity visas were issued to Caribbean immigrants during the same period.48 As mentioned above, 10.2% of African and Caribbean immigrants gained LPR status in 2014 through this program. And between 2000 and 2013, about one-in-five sub-Saharan African immigrants who obtained LPR entered the country on a diversity visa, whereas a higher percentage of Caribbean immigrants entered through family-sponsored visa.49
The diversity visa is believed to have contributed to the high educational background of Black immigrants in the U.S. as applicants of the diversity visa program must have at least a high school degree or two year’s work experience in a career that requires vocational training. Many Sub-Saharan African immigrants have considerably more education: about 38% have a bachelor’s degree or higher, compared to 28% of the total U.S. foreign-born population and 30% of the U.S.-born population, according to the MPI.50
D. Temporary Protected Status
Temporary Protected Status (TPS) also contributed to more status granted to Black immigrants, especially nationals from several African countries. The U.S. Secretary of Homeland Security currently designates countries, which due to a temporary condition such as an ongoing armed conflict or an environmental disaster, are unsafe for their nationals to return from the U.S. The current list of 11 countries includes one Caribbean country, Haiti (designated with TPS, set to expire in July 2017 unless renewed), and six African countries, namely Guinea, Liberia, and Sierra Leone (designated with TPS in connection with Ebola, set to expire in May 2016 unless renewed), Sudan and South Sudan (TPS also set to expire in November 2017 unless renewed), and Somalia (TPS set to expire in March 2017 unless renewed).51
16
E. Asylee or Refugee Status
A significant percentage of Black immigrants arrived in the U.S. as refugees or asylees, primarily from Africa. Between 2000 and 2013, about three-in-ten (28%) Sub-Saharan African immigrants entered as refugees or asylees, compared to only 5% for Caribbean immigrants and 13% for the overall immigrant population.52 In 2014 alone, DHS documented 17,501 refugee arrivals from Africa and 4 from the Caribbean (all of whom were from Haiti), constituting 25% of the total 69,975 refugees arrived in the U.S.53 Immigrants who are physically present in the United States without a removal order, including arrivals at points of entry, may apply for affirmative asylum regardless of immigration status. In 2014, DHS granted 14,758 affirmative asylum applications, within which 33% were granted to Black immigrants (4,296 to African immigrants and 533 to Caribbean immigrants).54
VI. Access to Relief from DeportationA. Discretionary Relief or Termination in Removal Proceedings
Relief and termination generally. Immigrants who are charged with deportability or inadmissibility in removal proceedings in immigration court with the Executive Office for Immigration Review (EOIR) may request several forms of discretionary relief or termination of proceedings as defenses against deportation. A significant percentage of Black immigrants were granted such relief.55 While Black immigrants made up 5.5% of the cases completed in immigration courts in 2015, they made up 16.2% of all cases in which relief was granted by immigration courts across the U.S. Among all Black immigrants who were in removal proceedings, about 23% were granted relief in 2015, which was 13 points higher than the percentage of people in removal proceedings who were granted relief. In addition, Black immigrants made up 10.9% of all cases in which immigration courts terminated proceedings in 2015 because there were no grounds for removal.56 The percentage of Black immigrants whose case was terminated (24%) was 10 points higher than the percentage of termination among all people in removal proceedings in 2015.
Defensive asylum applications. While data is not disaggregated by all of the different forms of discretionary relief in removal proceedings, EOIR does track defensive asylum claims (asylum applications that are adjudicated by an immigration judge as part of removal proceedings). In 2014, EOIR received a total number of 41,920 defensive asylum applications, out of which 8.5% are from Black immigrants. For asylum granted by EOIR, Black immigrants make up 17.7% of the 8,775 total, and among those, virtually all grants went to African immigrants. 57
17
b. Daca Eligibility, applications and Grants
On June 15, 2012, the Obama Administration created a new policy calling for deferred action for certain undocumented young people who came to the U.S. as children. The program, called Deferred Action for Childhood Arrivals (DACA), does not provide lawful status but allows individuals who meet several criteria to apply deferral from removal for a period of two years, subject to renewal.58
Eligibility. Mexican immigrants made up an overwhelming majority of all DACA categories according to eligibility estimates by MPI and DHS application and approval data, including 65% of the immediately eligible candidates59 and 62% applications rates60 and 78% of DACA approvals.61 By stark contrast, according to MPI, African immigrants constituted only 3% (or about 36,000) of the population who were immediately eligible for DACA (total 1.2 million eligible), and Caribbean immigrants constituted 2% of the immediate eligible pool.62 The total percentage of African and Caribbean immigrants eligible for DACA corresponds exactly with their proportion within the unauthorized immigrant population.
Nonetheless, Mexican immigrants are over-represented among the DACA-eligible population (65% v. 56% of all unauthorized immigrants and just 29% of the total foreign-born population).
applications. USCIS generally reports quarterly data on the top 25 countries of origin of DACA applications. Since the program’s launch in August 2012 until the first quarterly report in 2016, among all African and Caribbean countries, only Jamaica, Nigeria, Trinidad and Tobago and the Dominican Republic have ever made the top 25 list for applications. Taken together, USCIS accepted a total number of 11,844 initial applications from these four countries, or 1.5% of the total initial applications accepted among the top 25 countries.63 (The top 25 countries represent approximately 96.5% of all initial DACA applications accepted.)
Approvals. Similarly, USCIS generally reports quarterly data on the top 25 countries of origin of DACA approvals. Since the program’s launch in August 2012 until the first quarterly report in 2016, among all African and Caribbean countries, only Jamaica, Nigeria, Trinidad and Tobago and the Dominican Republic have ever made the top 25 list for approvals. Up to the first quarter of 2016, Jamaican nationals had 5,302 total approvals, including both initial and renewal applications, or 84% of Jamaican nationals’ applications; Nigeria had 2,095 total approvals, or 88% of applications; Trinidad and Tobago had 4,077 total approvals, or 89% of applications; and the Dominican Republic had 4,580 total approvals, or 87% of applications. While approximately 87% of applications from these four countries were approved, about 91% of DACA applications from all of the top 25 countries tracked by USCIS were approved. (The approvals listed in the top 25 countries list represent 97% of the 1,198,605 approvals to date.)64
Although African and Caribbean immigrants constituted only a small percentage of the immediately eligible population for DACA, the rates of application accepted and status approved for Black immigrants are lower when compared to all top 25 countries listed by USCIS. While using the numbers of the four African and Caribbean countries that have appeared on the top 25 list may not be the most accurate calculation, all other countries of origin whose nationals have submitted a DACA request but do not appear on the list only make up less than 4% of the total.65 The authors have also submitted a FOIA application to USCIS requesting the full list of countries of origin, but final response has not been produced by the agency yet.
18
1. U.S. Census Bureau, American Community Survey, 2014 ACS 1-Year PUMS. http://factfinder.census.gov/bkmk/navigation/1.0/en/d_dataset:ACS_14_1YR/d_product_type:PUMS
2. More details on using the official weight of ACS can be found at https://usa.ipums.org/usa/repwt.shtml. Programming techniques are borrowed from https://www.bgsu.edu/content/dam/BGSU/college-of-arts-and-sciences/center-for-family-and-demographic-research/documents/Help%20Resources%20and%20Tools/Statistical%20Analysis/Working-with-the-American-Community-Survey-PUMS-Data-Understanding-and-Using-Replicate-Weights.pdf
3. IRC Analysis of U.S. Census Bureau, American Community Survey, 2014 ACS 1-Year PUMS. Data available for download at http://factfinder.census.gov/bkmk/navigation/1.0/en/d_dataset:ACS_14_1YR/d_product_type:PUMS
4. Monica Anderson, 6 key findings about black immigration to the U.S., Pew Research Center (Apr. 9, 2015), http://www.pewresearch.org/fact-tank/2015/04/09/6-key-findings-about-black-immigration/.
5. Monica Anderson, A Rising Share of the U.S. Black Population Is Foreign Born, Pew Research Center (Apr. 9, 2015), http://www.pewsocialtrends.org/2015/04/09/a-rising-share-of-the-u-s-black-population-is-foreign-born/.
6. IRC Analysis, supra note 3.7. Id.8. The U.S. Census Bureau projections for 2060 include only non-Hispanic foreign-born blacks. See Anna Brown, U.S. Immigrant Population Projected
to Rise, Even as Share Falls Among Hispanics, Asians, Pew Research Center (Mar. 9, 2015) http://www.pewresearch.org/fact-tank/2015/03/09/u-s-immigrant-population-projected-to-rise-even-as-share-falls-among-hispanics-asians/.
9. U.S. Census Bureau, American Community Survey, 2014 1-Year Estimates, Tables S0504.10. Id. at Tables S0201 and B05003B.11. IRC Analysis, supra note 3.12. Id.13. Id.14. Id.15. Id.16. Anderson, supra note 5.17. IRC Analysis, supra note 3.18. Anderson, supra note 5.19. IRC Analysis, supra note 3.20. Id.21. Id.22. Id.23. Anderson, supra note 5.24. Patrick L. Mason, Algernon Austin, The Low Wages of Black Immigrants: Wage Penalties for U.S. Born and Foreign Born Black Workers, Economic Policy
Institute (Feb. 25, 2011) http://www.epi.org/publication/the_low_wages_of_black_immigrants/25. Id.26. Id.27. Id.28. Bureau of Labor Statistics, Labor Force Characteristics of Foreign Born Workforce Summary, (May 19, 2016) http://www.bls.gov/news.release/forbrn.
nr0.htm.29. Id.30. Id.31. Jie Zong and Jeanne Batalova, Caribbean Immigrants in the United States, Migration Policy Institute (Sept. 14, 2016)32. Kristen McCabe, African Immigrants in the United States, Migration Policy Institute (July 21, 2011)33. Cherrie Bucknor, Black Workers, Unions, and Inequality, Center for Economic and Policy Research (Aug. 2016) http://cepr.net/publications/reports/
black-workers-unions-and-inequality34. Id.35. Id.36. Id.37. Id.38. Anderson, supra note 5.39. Id.40. Marc R. Rosenblum & Ariel G. Ruiz Soto, An Analysis of Unauthorized Immigrants in the United States by Country and Region of Birth, Migration Policy
Institute, 5 (Aug. 2015) http://www.migrationpolicy.org/research/analysis-unauthorized-immigrants-united-states-country-and-region-birth. 41. Id.42. U.S. Dep’t of Homeland Security, Office of Immigration Statistics, 2014 Yearbook of Immigration Statistics, Table 3 (Jun. 1, 2016) https://www.dhs.gov/
yearbook-immigration-statistics [hereinafter DHS Yearbook]. Since the federal agency data is only categorized by country of origin, rather than self-identified race, “Black immigrants” from these sources refer to any foreign-born person in the United States whose country of origin is located in Africa or the Caribbean.
43. Id.44. Id. at Table 21.45. IRC Analysis, supra note 3; U.S. Census Bureau, supra note 9.
ENDNOTES
19
46. IRC Analysis, supra note 3.47. Ruth Ellen Wasem, Diversity Immigrant Visa Lottery Issues, Congressional Research Service 7-5700, 1 (Apr. 1, 2011) http://fas.org/sgp/crs/misc/
R41747.pdf.48. U.S. Dep’t of State, Bureau of Consular Affairs, Report of the Visa Office 2014, Table VII Immigrant Number Use for Visa Issuances and Adjustments
of Status in the Diversity Immigrant Category Fiscal Years 2005-2014 (2014) https://travel.state.gov/content/dam/visas/Statistics/AnnualReports/FY2014AnnualReport/FY14AnnualReport-TableVII.pdf.
49. IRC Analysis, supra note 3.50. Jie Zong & Jeanne Batalova, Sub-Saharan African Immigrants in the United States, Migration Policy Institute (Oct. 30, 2014), http://www.
migrationpolicy.org/article/sub-saharan-african-immigrants-united-states#Educational%20and%20Professional.51. USCIS, Temporary Protected Status, Countries Currently Designated for TPS, https://www.uscis.gov/humanitarian/temporary-protected-status (last
visited Mar. 27, 2016).52. Anderson, supra note 5.53. DHS Yearbook, supra note 27, at Table 14.54. Id. at Table 17.55. Transactional Records Access Clearinghouse (TRAC), Immigration Court Processing Time by Outcome, FY 2015, http://trac.syr.edu/phptools/
immigration/court_backlog/court_proctime_outcome.php.56. Id.57. Exec. Office for Immigration Review, FY2010-FY2014 Asylum Statistics by Nationality (Mar. 2015) http://www.justice.gov/sites/default/files/eoir/
pages/attachments/2015/03/16/fy2010-fy2014-asylum-statistics-by-nationality.pdf. (Only 78 defensive asylum applications were granted to Caribbean immigrants.)
58. USCIS, Consideration of Deferred Action for Childhood Arrivals (DACA) https://www.uscis.gov/humanitarian/consideration-deferred-action-childhood-arrivals-daca (last updated Jan. 4, 2016).
59. Jeanne Batalova, Sarah Hooker & Randy Capps with James Bachmeier, DACA at the Two-Year Mark: A National and State Profile of Youth Eligible and Applying for Deferred Action, Migration Policy Institute, 15 (Aug. 2014) http://www.migrationpolicy.org/research/daca-two-year-mark-national-and-state-profile-youth-eligible-and-applying-deferred-action [hereinafter MPI DACA Report].
60. Id. at 13.61. USCIS, Characteristics of Individuals Requesting and Approved for Deferred Action for Childhood Arrivals (DACA) (Jul. 10, 2014), http://www.uscis.gov/
sites/default/files/USCIS/Humanitarian/Deferred%20Action%20for%20Childhood%20Arrivals/USCIS-DACA-Characteristics-Data-2014-7-10.pdf62. MPI DACA Report, supra note 36.63. USCIS, Deferred Action for Childhood Arrivals Process (Through Fiscal Year 2016, 1st Qtr), Data as of December 31, 2015, https://www.uscis.gov/
sites/default/files/USCIS/Resources/Reports%20and%20Studies/Immigration%20Forms%20Data/All%20Form%20Types/DACA/I821_daca_performancedata_fy2016_qtr1.pdf (published on Mar. 21, 2016) (Among the top 25 countries listed, total initial applications accepted were 775,916, total initial and renewal applications accepted were 1,268,507 and total applications approved were 1,159,722).
64. Id.65. Id.

[email protected] 347-410-5132 | www.blackalliance.org