Embed Size (px)
Citation preview
Presentation Date
November 7, 2013
State of Maine MSP Program IT Staff Augmentation
Maine FY2014 Q1 Period of July 1, 2013 to September 30, 2013
Agenda
Introductions
Program Overview, Benefits & Accomplishments
Program Initiatives & Activities
Business Intelligence & Analytics
Strategic Objectives, Enhancements & Opportunities
Service Level Agreement Overview
Additional Discussion Points
• Manager Survey
• Labor Market Trends & Rates
• Vendor Network Discussion
• Burndown Report Definition
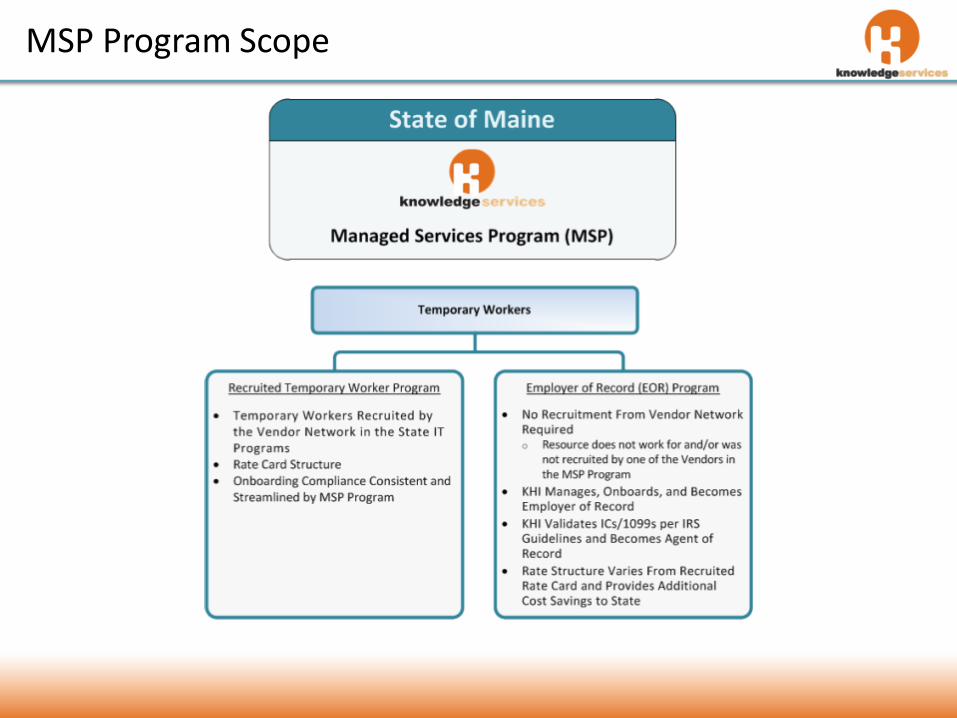
MSP Program Scope
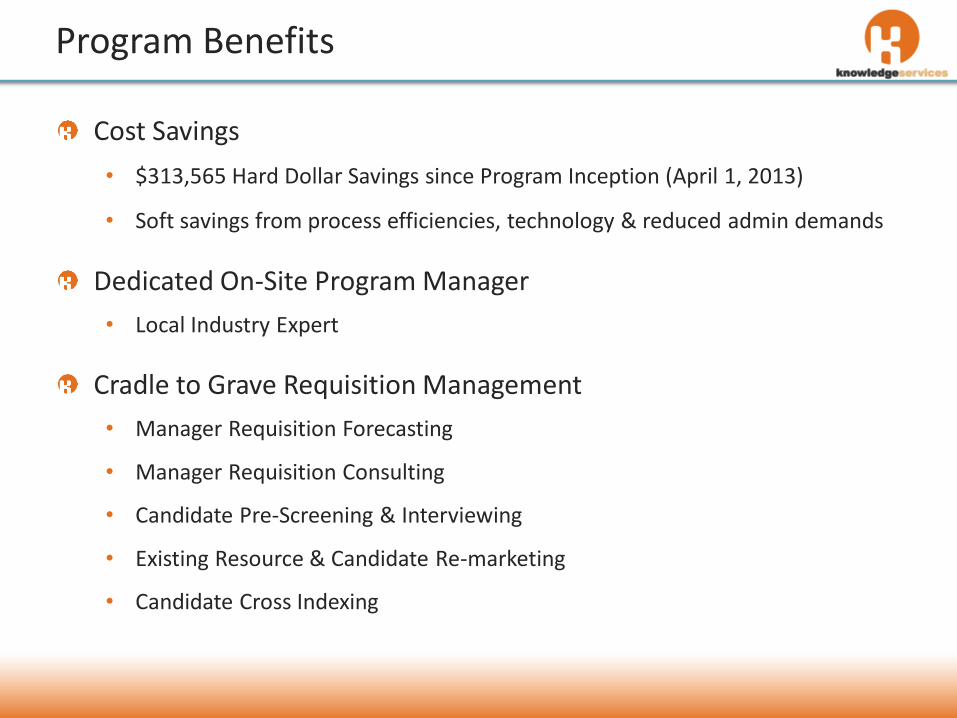
Program Benefits
Cost Savings
• $313,565 Hard Dollar Savings since Program Inception (April 1, 2013)
• Soft savings from process efficiencies, technology & reduced admin demands
Dedicated On-Site Program Manager
• Local Industry Expert
Cradle to Grave Requisition Management
• Manager Requisition Forecasting
• Manager Requisition Consulting
• Candidate Pre-Screening & Interviewing
• Existing Resource & Candidate Re-marketing
• Candidate Cross Indexing
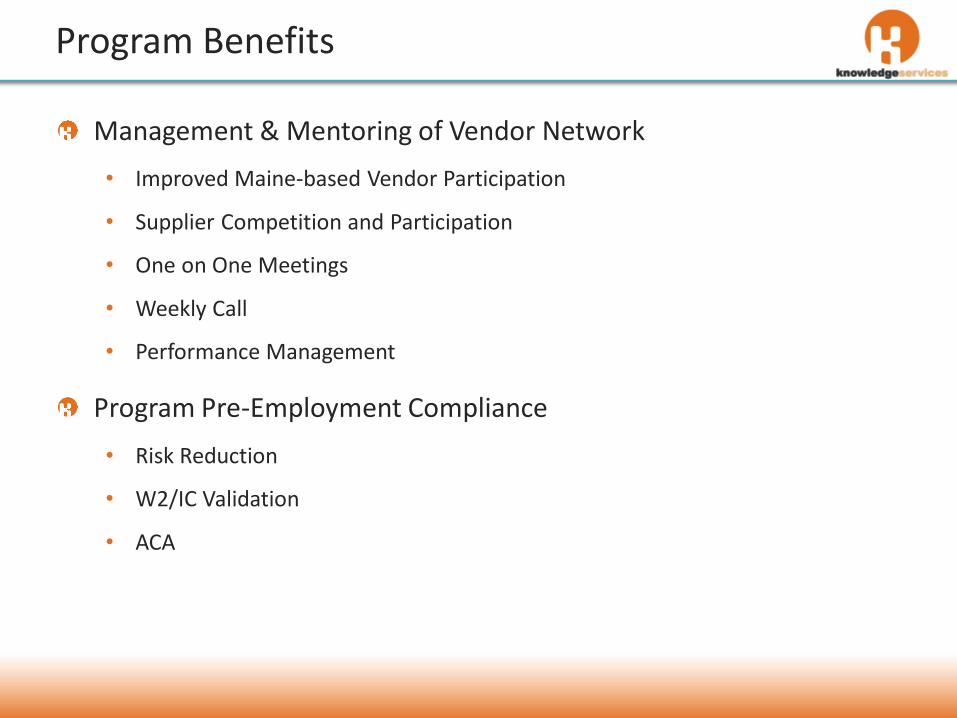
Program Benefits
Management & Mentoring of Vendor Network
• Improved Maine-based Vendor Participation
• Supplier Competition and Participation
• One on One Meetings
• Weekly Call
• Performance Management
Program Pre-Employment Compliance
• Risk Reduction
• W2/IC Validation
• ACA
Program Accomplishments FY2014 Q1
Maine Manager Portal Developed & Live
Vendor Portal Updated
Compiled ME Contractor Residence Data
Assist in Streamlining DO Process
Developed Requisition Timeline Tracking Report
Provided Vendors Spend by Title, Manager, Agency Report

Program Accomplishments FY2013 Q4
Successful Implementation Across All Agencies
• Transitioned without disruption
Decreased Incumbent Bill Rates While Keeping Vendors Whole
Developed Requisition Timeline Tracking Report
Improvement in Throughput Time from Inception
Program Invoicing Improvements
• Agency Specific Invoice Configuration
• Funding Sources including State & Federal by Resource
Implemented EOR (Employer of Record) Program
• For Maximized State Savings
Successful Fiscal Year End PO Transition
Ongoing MSP Program Initiatives & Activities
Develop and promote local Vendors and Candidates
Vendor Education and Open Position Status Calls
• Vendor and Manager Roundtables
Market Rate Analysis
• Position Description Development
Create Program Awareness for Inactive Agencies
• Manager Education and Training
Develop Reporting Needs per Agency
Weekly In-Person Meeting with High Volume Agencies
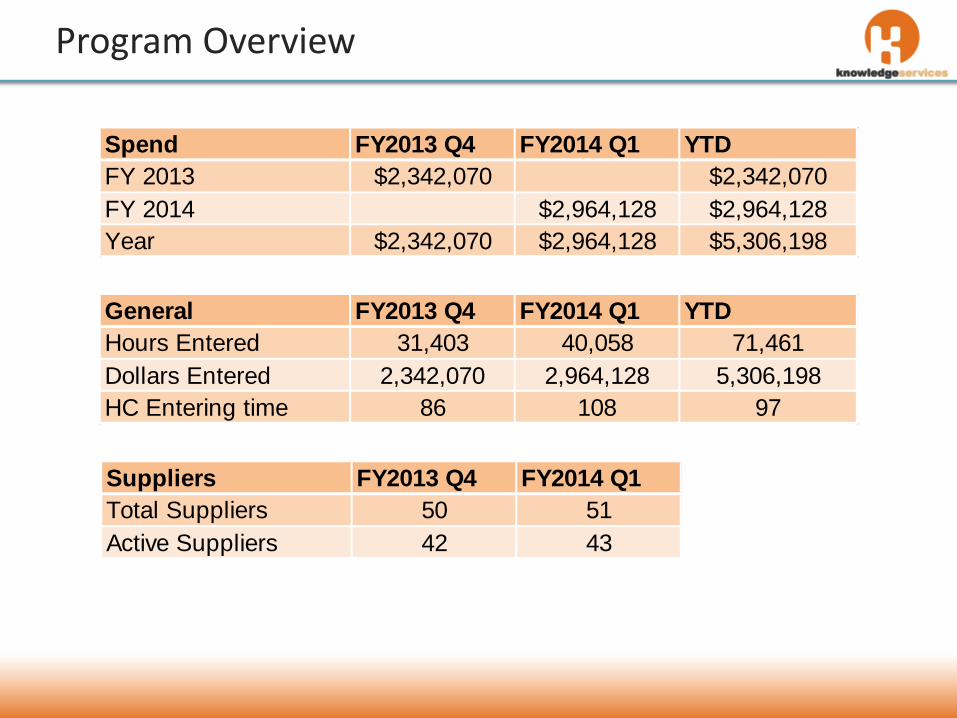
Program Overview
Spend FY2013 Q4 FY2014 Q1 YTD
FY 2013 $2,342,070 $2,342,070
FY 2014 $2,964,128 $2,964,128
Year $2,342,070 $2,964,128 $5,306,198
General FY2013 Q4 FY2014 Q1 YTD
Hours Entered 31,403 40,058 71,461
Dollars Entered 2,342,070 2,964,128 5,306,198
HC Entering time 86 108 97
Suppliers FY2013 Q4 FY2014 Q1
Total Suppliers 50 51
Active Suppliers 42 43
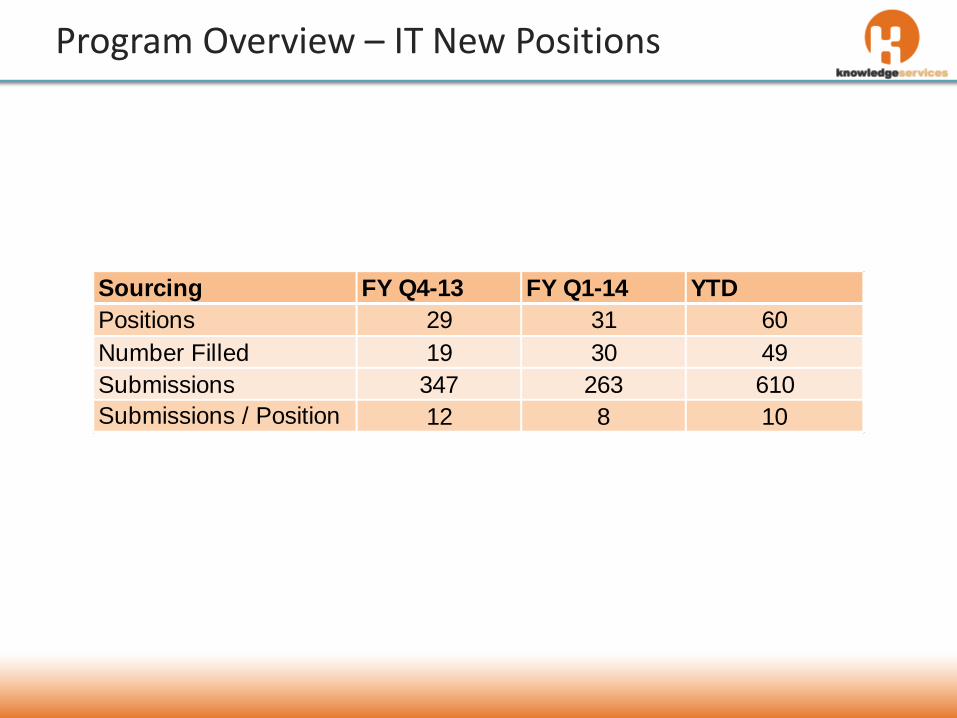
Program Overview – IT New Positions
Sourcing FY Q4-13 FY Q1-14 YTD
Positions 29 31 60
Number Filled 19 30 49
Submissions 347 263 610
Submissions / Position 12 8 10
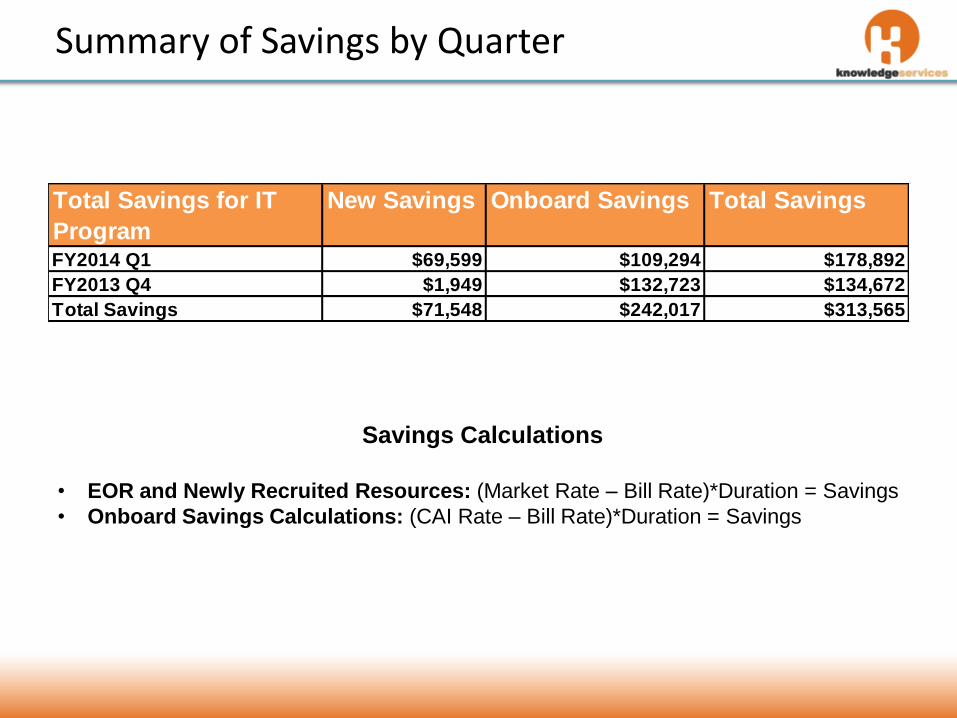
Summary of Savings by Quarter
Savings Calculations
• EOR and Newly Recruited Resources: (Market Rate – Bill Rate)*Duration = Savings
• Onboard Savings Calculations: (CAI Rate – Bill Rate)*Duration = Savings
Total Savings for IT
Program
New Savings Onboard Savings Total Savings
FY2014 Q1 $69,599 $109,294 $178,892
FY2013 Q4 $1,949 $132,723 $134,672
Total Savings $71,548 $242,017 $313,565
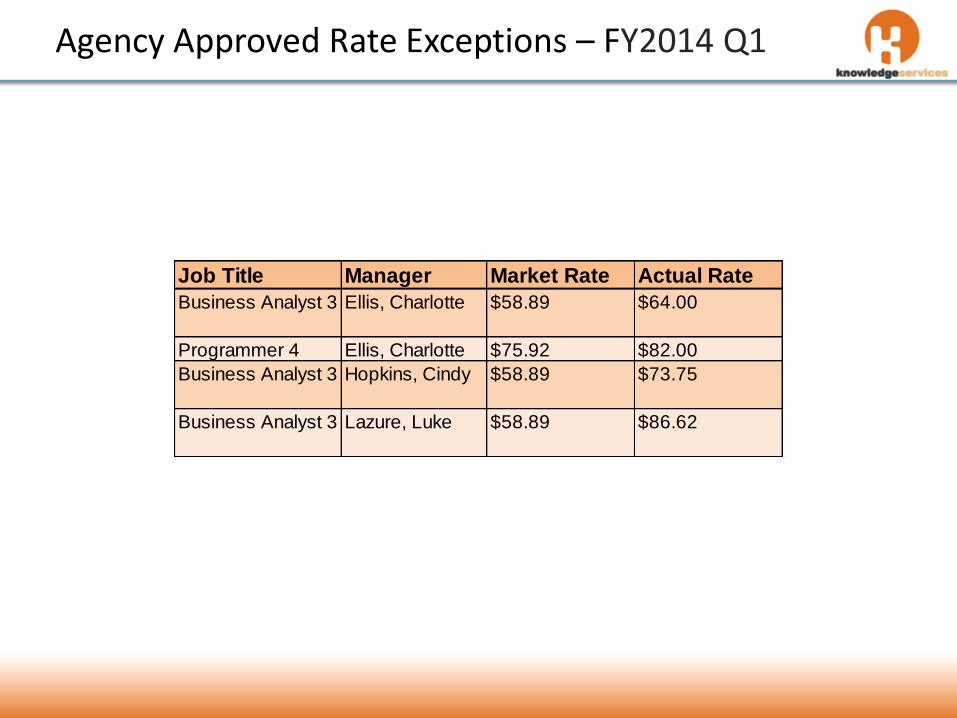
Agency Approved Rate Exceptions – FY2014 Q1
Job Title Manager Market Rate Actual Rate
Business Analyst 3 Ellis, Charlotte $58.89 $64.00
Programmer 4 Ellis, Charlotte $75.92 $82.00
Business Analyst 3 Hopkins, Cindy $58.89 $73.75
Business Analyst 3 Lazure, Luke $58.89 $86.62
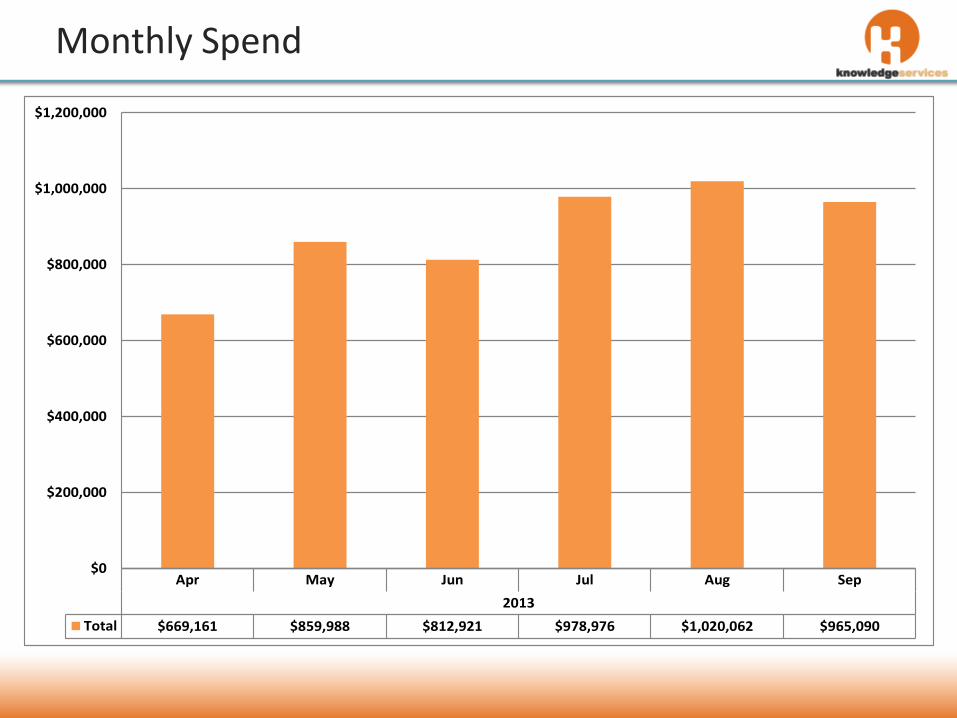
Monthly Spend
Apr May Jun Jul Aug Sep
2013
Total $669,161 $859,988 $812,921 $978,976 $1,020,062 $965,090
$0
$200,000
$400,000
$600,000
$800,000
$1,000,000
$1,200,000
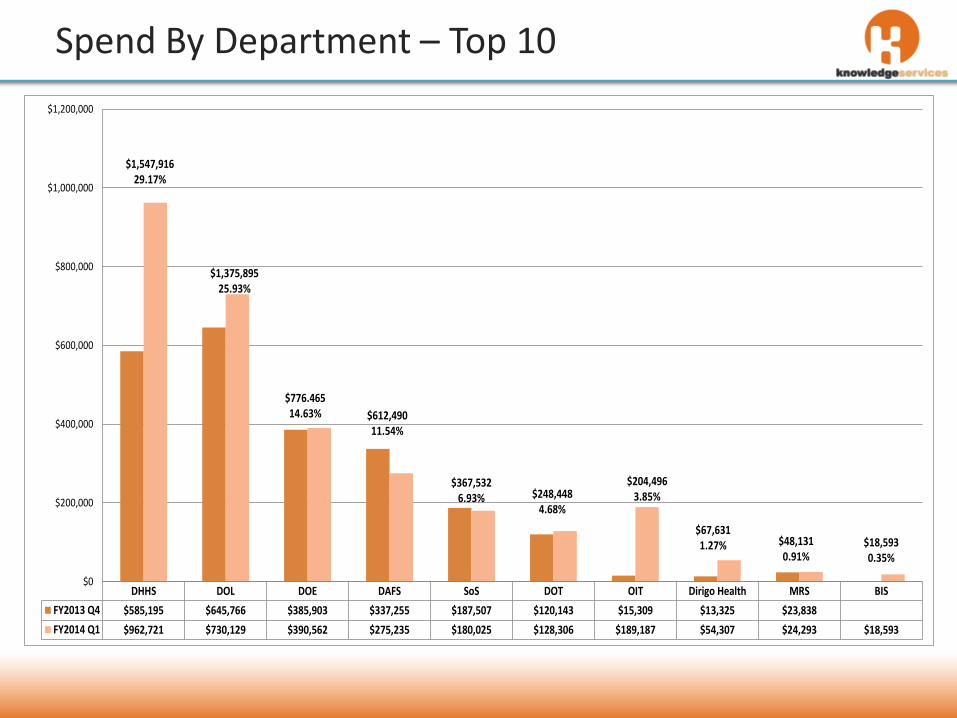
Spend By Department – Top 10
DHHS DOL DOE DAFS SoS DOT OIT Dirigo Health MRS BIS
FY2013 Q4 $585,195 $645,766 $385,903 $337,255 $187,507 $120,143 $15,309 $13,325 $23,838
FY2014 Q1 $962,721 $730,129 $390,562 $275,235 $180,025 $128,306 $189,187 $54,307 $24,293 $18,593
$1,547,91629.17%
$1,375,89525.93%
$776.46514.63% $612,490
11.54%
$367,5326.93% $248,448
4.68%
$204,4963.85%
$67,6311.27% $48,131
0.91%$18,5930.35%
$0
$200,000
$400,000
$600,000
$800,000
$1,000,000
$1,200,000
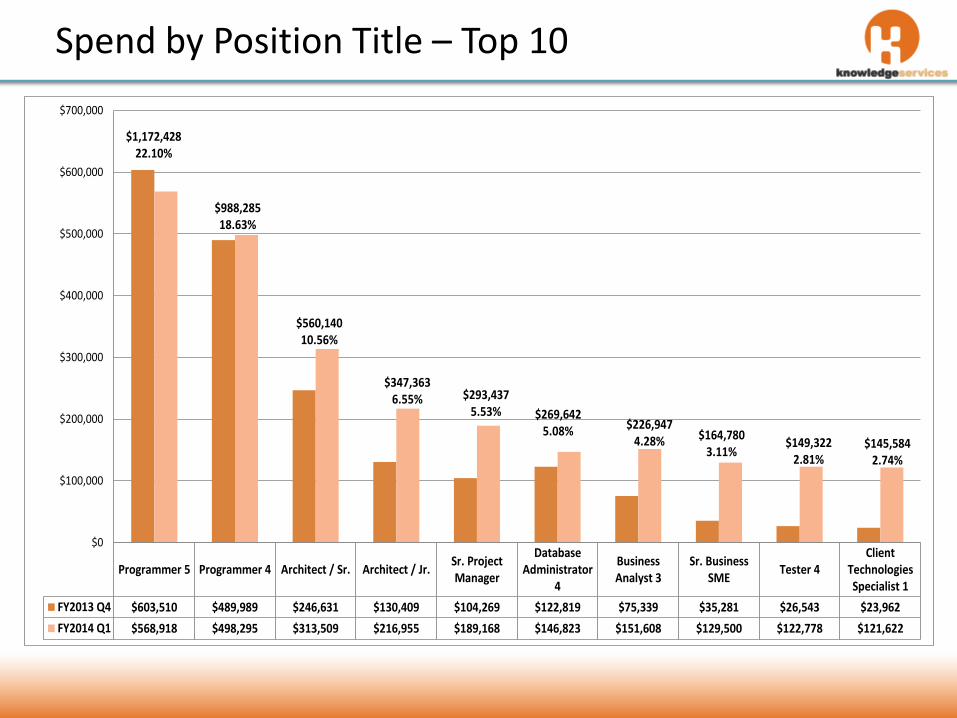
Spend by Position Title – Top 10
Programmer 5 Programmer 4 Architect / Sr. Architect / Jr.Sr. ProjectManager
DatabaseAdministrator
4
BusinessAnalyst 3
Sr. BusinessSME
Tester 4Client
TechnologiesSpecialist 1
FY2013 Q4 $603,510 $489,989 $246,631 $130,409 $104,269 $122,819 $75,339 $35,281 $26,543 $23,962
FY2014 Q1 $568,918 $498,295 $313,509 $216,955 $189,168 $146,823 $151,608 $129,500 $122,778 $121,622
$1,172,42822.10%
$988,28518.63%
$560,14010.56%
$347,3636.55% $293,437
5.53% $269,6425.08% $226,947
4.28% $164,7803.11%
$149,3222.81%
$145,5842.74%
$0
$100,000
$200,000
$300,000
$400,000
$500,000
$600,000
$700,000
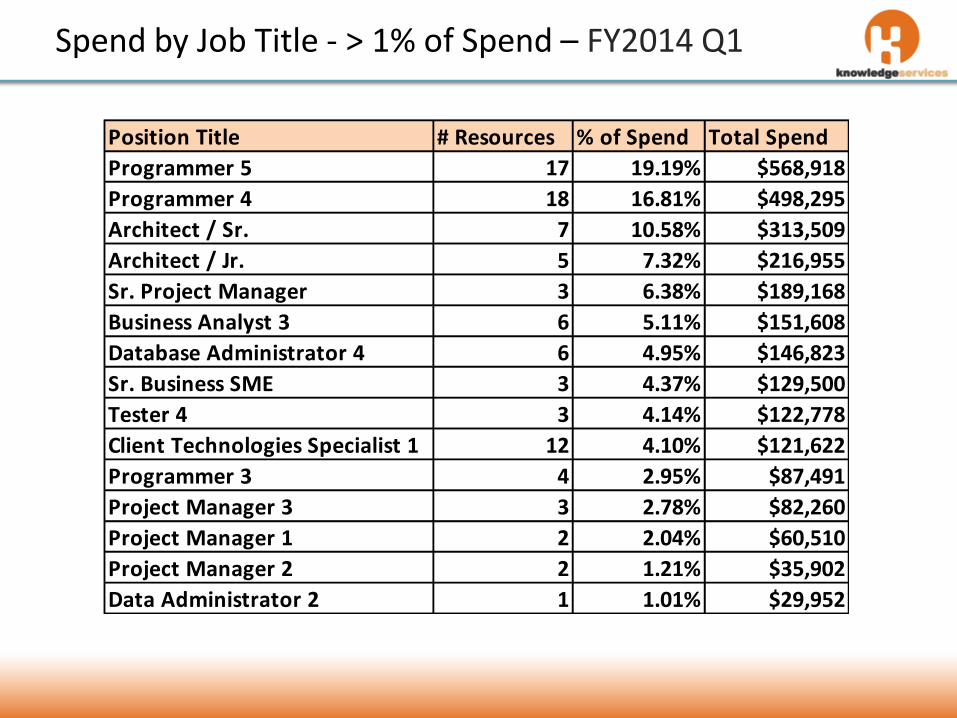
Spend by Job Title - > 1% of Spend – FY2014 Q1
Position Title # Resources % of Spend Total Spend
Programmer 5 17 19.19% $568,918
Programmer 4 18 16.81% $498,295
Architect / Sr. 7 10.58% $313,509
Architect / Jr. 5 7.32% $216,955
Sr. Project Manager 3 6.38% $189,168
Business Analyst 3 6 5.11% $151,608
Database Administrator 4 6 4.95% $146,823
Sr. Business SME 3 4.37% $129,500
Tester 4 3 4.14% $122,778
Client Technologies Specialist 1 12 4.10% $121,622
Programmer 3 4 2.95% $87,491
Project Manager 3 3 2.78% $82,260
Project Manager 1 2 2.04% $60,510
Project Manager 2 2 1.21% $35,902
Data Administrator 2 1 1.01% $29,952
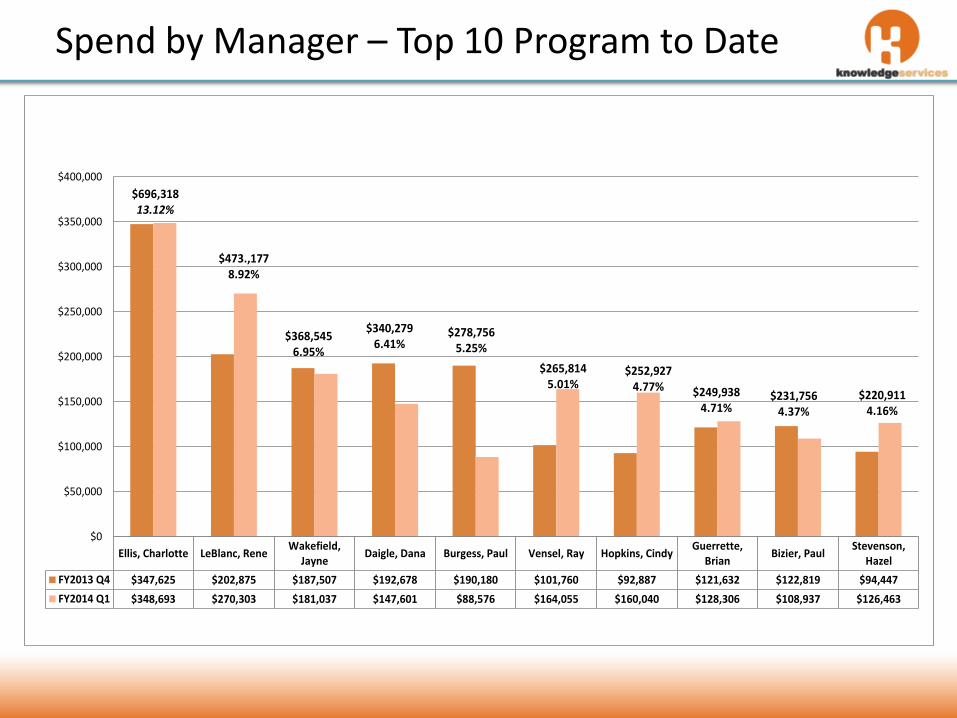
Spend by Manager – Top 10 Program to Date
Ellis, Charlotte LeBlanc, ReneWakefield,
JayneDaigle, Dana Burgess, Paul Vensel, Ray Hopkins, Cindy
Guerrette,Brian
Bizier, PaulStevenson,
Hazel
FY2013 Q4 $347,625 $202,875 $187,507 $192,678 $190,180 $101,760 $92,887 $121,632 $122,819 $94,447
FY2014 Q1 $348,693 $270,303 $181,037 $147,601 $88,576 $164,055 $160,040 $128,306 $108,937 $126,463
$696,31813.12%
$473.,1778.92%
$368,5456.95%
$340,2796.41%
$278,7565.25%
$265,8145.01%
$252,9274.77% $249,938
4.71%$231,756
4.37%
$220,9114.16%
$0
$50,000
$100,000
$150,000
$200,000
$250,000
$300,000
$350,000
$400,000
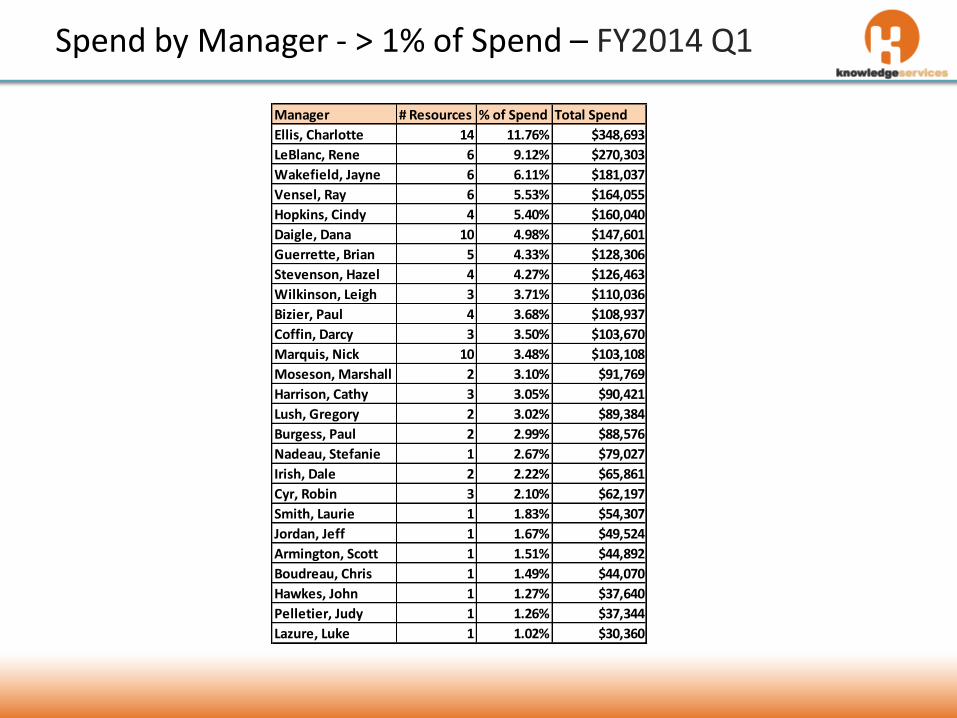
Spend by Manager - > 1% of Spend – FY2014 Q1
Manager # Resources % of Spend Total Spend
Ellis, Charlotte 14 11.76% $348,693
LeBlanc, Rene 6 9.12% $270,303
Wakefield, Jayne 6 6.11% $181,037
Vensel, Ray 6 5.53% $164,055
Hopkins, Cindy 4 5.40% $160,040
Daigle, Dana 10 4.98% $147,601
Guerrette, Brian 5 4.33% $128,306
Stevenson, Hazel 4 4.27% $126,463
Wilkinson, Leigh 3 3.71% $110,036
Bizier, Paul 4 3.68% $108,937
Coffin, Darcy 3 3.50% $103,670
Marquis, Nick 10 3.48% $103,108
Moseson, Marshall 2 3.10% $91,769
Harrison, Cathy 3 3.05% $90,421
Lush, Gregory 2 3.02% $89,384
Burgess, Paul 2 2.99% $88,576
Nadeau, Stefanie 1 2.67% $79,027
Irish, Dale 2 2.22% $65,861
Cyr, Robin 3 2.10% $62,197
Smith, Laurie 1 1.83% $54,307
Jordan, Jeff 1 1.67% $49,524
Armington, Scott 1 1.51% $44,892
Boudreau, Chris 1 1.49% $44,070
Hawkes, John 1 1.27% $37,640
Pelletier, Judy 1 1.26% $37,344
Lazure, Luke 1 1.02% $30,360
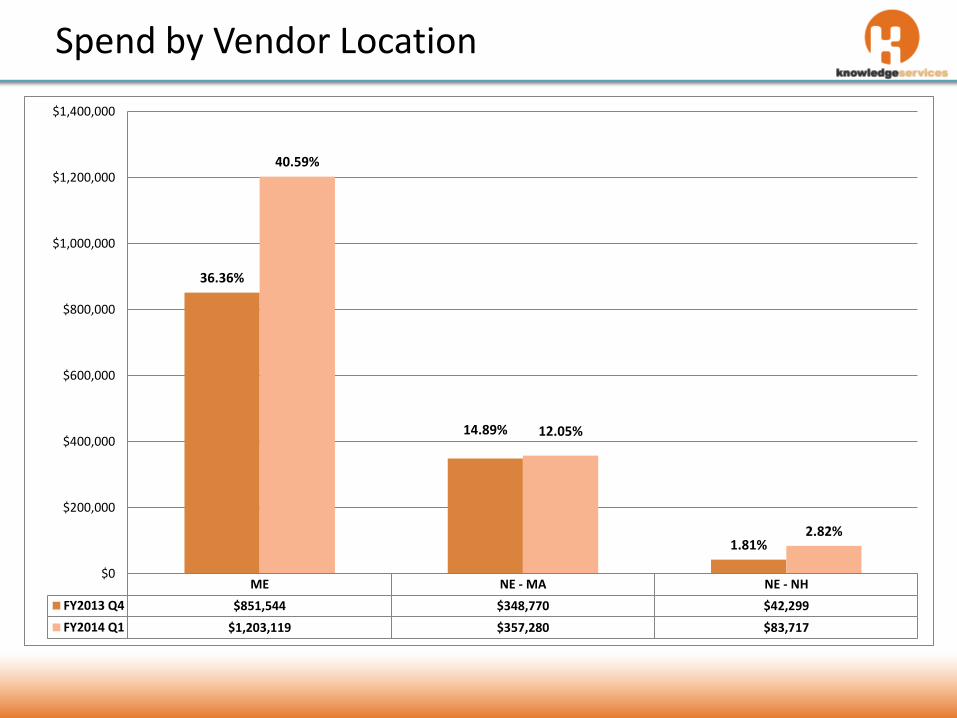
Spend by Vendor Location
ME NE - MA NE - NH
FY2013 Q4 $851,544 $348,770 $42,299
FY2014 Q1 $1,203,119 $357,280 $83,717
36.36%
14.89%
1.81%
40.59%
12.05%
2.82%
$0
$200,000
$400,000
$600,000
$800,000
$1,000,000
$1,200,000
$1,400,000

New Positions by Vendor Location
ME NE - NH NE - MA
FY2013 Q4 $19,947
FY2014 Q1 $606,029 $37,406 $34,225
23.26%
55.13%
3.40% 3.11%
$0
$100,000
$200,000
$300,000
$400,000
$500,000
$600,000
$700,000
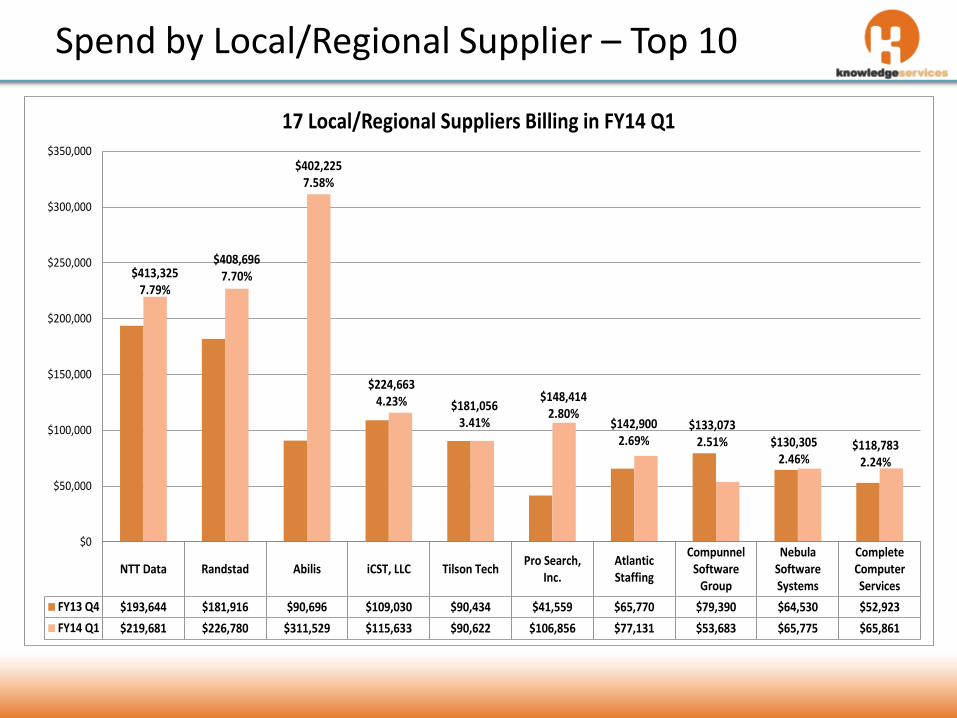
Spend by Local/Regional Supplier – Top 10
NTT Data Randstad Abilis iCST, LLC Tilson TechPro Search,
Inc.AtlanticStaffing
CompunnelSoftware
Group
NebulaSoftwareSystems
CompleteComputerServices
FY13 Q4 $193,644 $181,916 $90,696 $109,030 $90,434 $41,559 $65,770 $79,390 $64,530 $52,923
FY14 Q1 $219,681 $226,780 $311,529 $115,633 $90,622 $106,856 $77,131 $53,683 $65,775 $65,861
$413,3257.79%
$408,6967.70%
$402,2257.58%
$224,6634.23% $181,056
3.41%
$148,4142.80%
$142,9002.69%
$133,0732.51% $130,305
2.46%$118,783
2.24%
$0
$50,000
$100,000
$150,000
$200,000
$250,000
$300,000
$350,000
17 Local/Regional Suppliers Billing in FY14 Q1
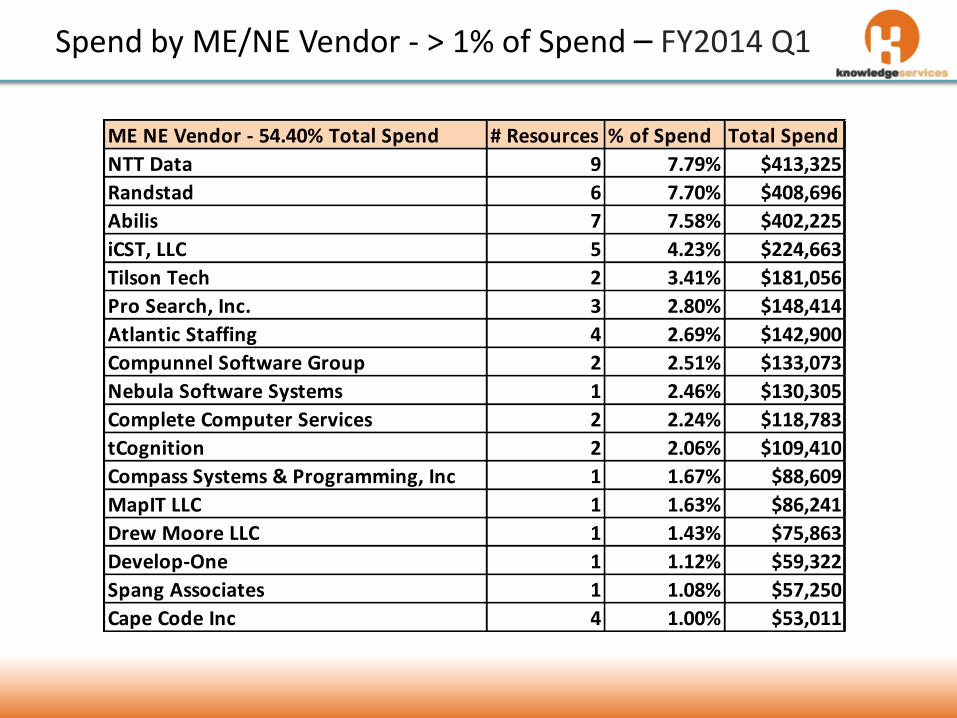
Spend by ME/NE Vendor - > 1% of Spend – FY2014 Q1
ME NE Vendor - 54.40% Total Spend # Resources % of Spend Total Spend
NTT Data 9 7.79% $413,325
Randstad 6 7.70% $408,696
Abilis 7 7.58% $402,225
iCST, LLC 5 4.23% $224,663
Tilson Tech 2 3.41% $181,056
Pro Search, Inc. 3 2.80% $148,414
Atlantic Staffing 4 2.69% $142,900
Compunnel Software Group 2 2.51% $133,073
Nebula Software Systems 1 2.46% $130,305
Complete Computer Services 2 2.24% $118,783
tCognition 2 2.06% $109,410
Compass Systems & Programming, Inc 1 1.67% $88,609
MapIT LLC 1 1.63% $86,241
Drew Moore LLC 1 1.43% $75,863
Develop-One 1 1.12% $59,322
Spang Associates 1 1.08% $57,250
Cape Code Inc 4 1.00% $53,011
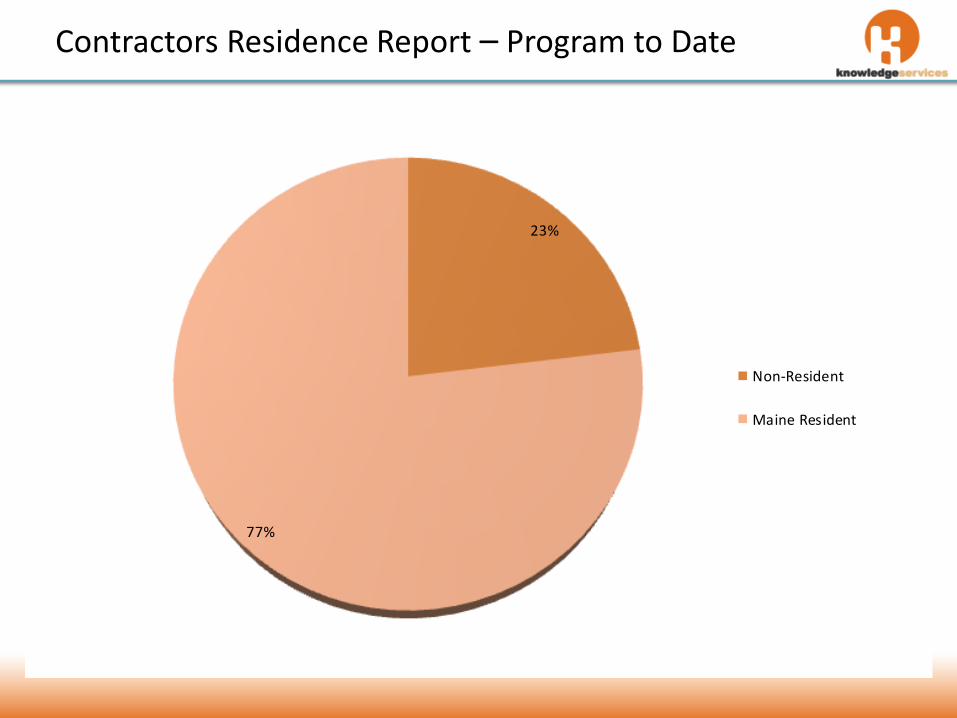
Contractors Residence Report – Program to Date
23%
77%
Non-Resident
Maine Resident
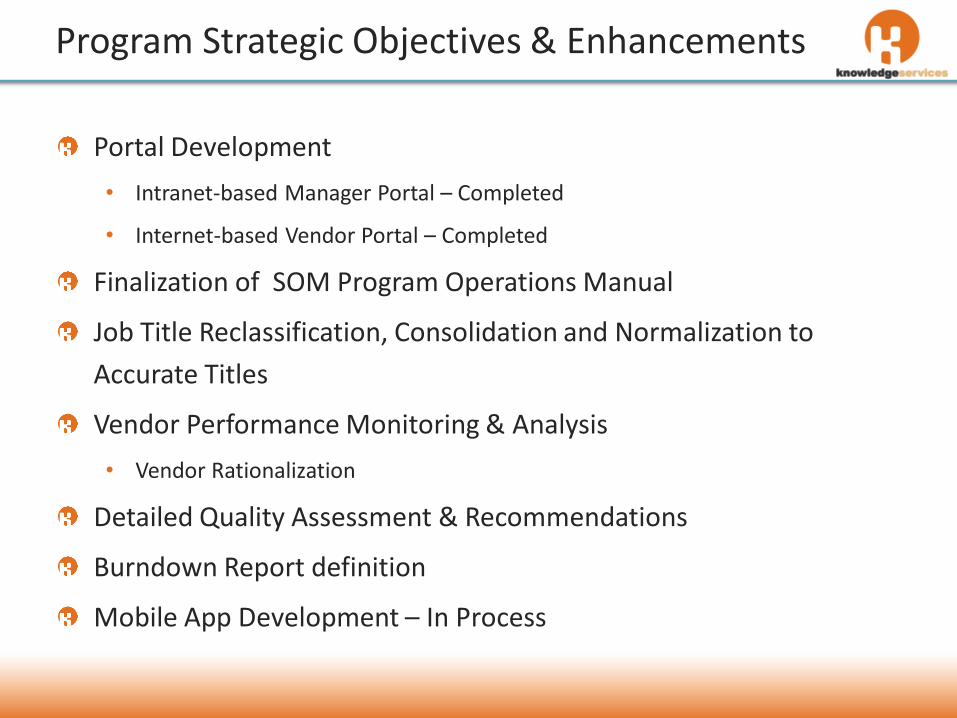
Program Strategic Objectives & Enhancements
Portal Development
• Intranet-based Manager Portal – Completed
• Internet-based Vendor Portal – Completed
Finalization of SOM Program Operations Manual
Job Title Reclassification, Consolidation and Normalization to
Accurate Titles
Vendor Performance Monitoring & Analysis
• Vendor Rationalization
Detailed Quality Assessment & Recommendations
Burndown Report definition
Mobile App Development – In Process
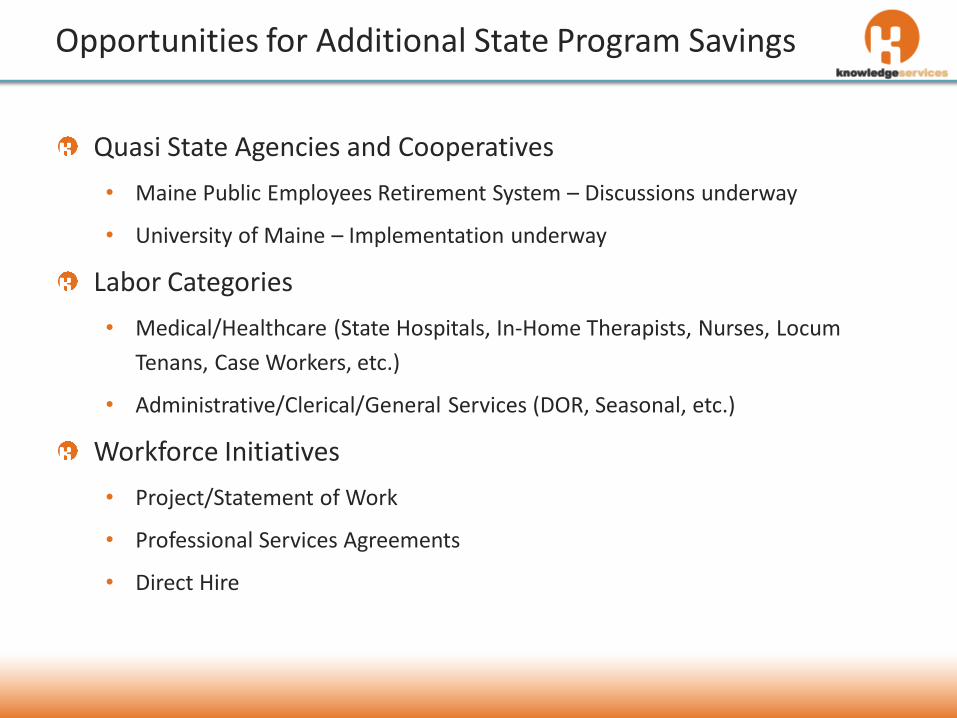
Opportunities for Additional State Program Savings
Quasi State Agencies and Cooperatives
• Maine Public Employees Retirement System – Discussions underway
• University of Maine – Implementation underway
Labor Categories
• Medical/Healthcare (State Hospitals, In-Home Therapists, Nurses, Locum
Tenans, Case Workers, etc.)
• Administrative/Clerical/General Services (DOR, Seasonal, etc.)
Workforce Initiatives
• Project/Statement of Work
• Professional Services Agreements
• Direct Hire
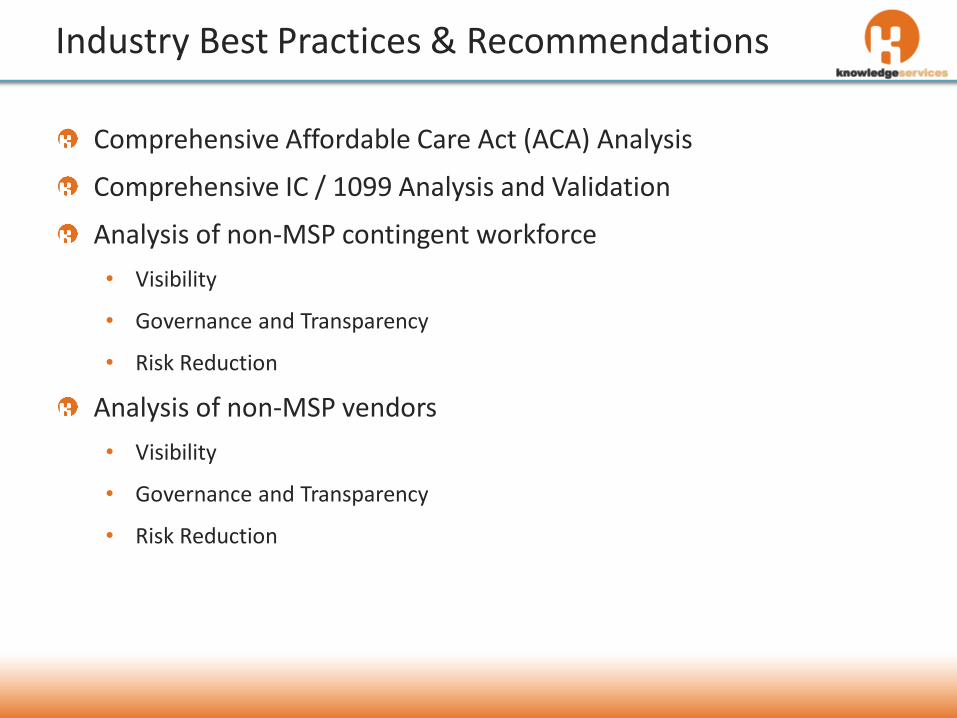
Industry Best Practices & Recommendations
Comprehensive Affordable Care Act (ACA) Analysis
Comprehensive IC / 1099 Analysis and Validation
Analysis of non-MSP contingent workforce
• Visibility
• Governance and Transparency
• Risk Reduction
Analysis of non-MSP vendors
• Visibility
• Governance and Transparency
• Risk Reduction
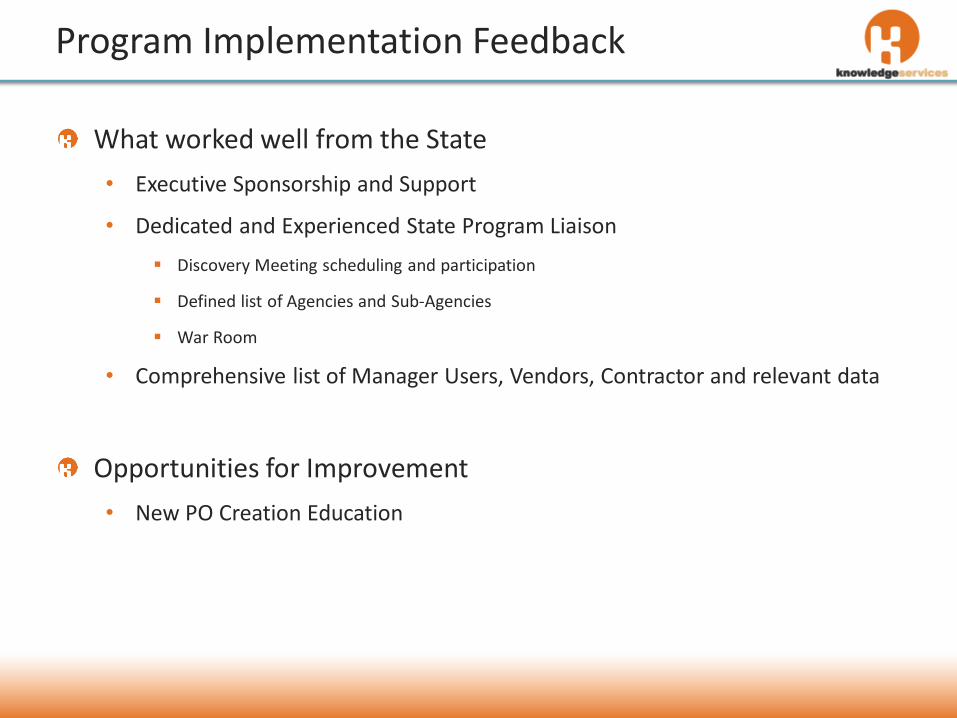
Program Implementation Feedback
What worked well from the State
• Executive Sponsorship and Support
• Dedicated and Experienced State Program Liaison
Discovery Meeting scheduling and participation
Defined list of Agencies and Sub-Agencies
War Room
• Comprehensive list of Manager Users, Vendors, Contractor and relevant data
Opportunities for Improvement
• New PO Creation Education

DISCUSSION AND QUESTIONS