Embed Size (px)
Citation preview

State-of-the-Art Islanding Detection and Decoupling Systems for Utility
and Industrial Power Systems
Krishnanjan Gubba Ravikumar, Ashish Upreti, and Adithiya Nagarajan Schweitzer Engineering Laboratories, Inc.
Presented at the 69th Annual Georgia Tech Protective Relaying Conference
Atlanta, Georgia April 29–May 1, 2015

1
State-of-the-Art Islanding Detection and Decoupling Systems for Utility and Industrial Power Systems
Krishnanjan Gubba Ravikumar, Ashish Upreti, and Adithiya Nagarajan, Schweitzer Engineering Laboratories, Inc.
Abstract—Islanding detection and decoupling needs are becoming a crucial part of power system operations due to the increasing penetration of distributed generation in utility power systems and the self-sustaining operational capabilities of industrial power systems. This paper presents a complete solution for determining a power system islanding condition using state-of-the-art technologies such as synchrophasors and microprocessor-based relays. This solution combines three independent schemes working together in a coordinated fashion to reliably detect an islanding condition under all power import and export scenarios with reliable detection speeds. The solution has been tested using real-time digital simulation in a closed-loop environment. The key objective of this solution is to provide the most reliable and affordable islanding detection and decoupling system (IDDS) to utility and industrial power systems for solving the critical challenges of today and tomorrow.
This paper presents the functionality, validation, and performance of the IDDS in a simulated model for a real-world application. The schemes are analyzed for speed and reliability in a wide variety of operating scenarios. The effectiveness of the overall solution has been tested in a controlled test environment as part of power management system functional testing for a 2 GW microgrid. This solution is currently in service.
I. INTRODUCTION Islanding detection and isolation from disturbances are the
first steps for enabling sustainable microgrids. When there is less than 10 MVA distributed generation, islanding detection is required by IEEE Standard 1547 to de-energize the distributed generator within 2 seconds for reasons such as personnel safety, power quality, and out-of-phase reclosing [1]. Some of these distributed generators are not only power electronics-based, but also synchronous machine-based and can sustain islands if provided with adequate controls and load-shedding and generation-shedding schemes [2] [3]. Decoupling schemes that detect disturbances in the grid and intentionally island the microgrid can sustain the microgrid operation while keeping the critical loads connected. This paper focuses on islanding detection and intentional decoupling schemes used to create a reliable and high-speed system for a microgrid that has an installed generation capacity of 2 GW.
II. ISLANDING DETECTION AND DECOUPLING SYSTEM (IDDS) In the context of this paper, it is important to define and
differentiate islanding detection and decoupling. An islanding detection scheme detects an islanding condition when the microgrid is disconnected from the utility power system.
A decoupling scheme detects disturbances in the utility power system and intentionally islands the microgrid. Disturbance detection settings for such intentional decoupling systems should be carefully set to avoid being too sensitive and to prevent nuisance tripping.
To sustain the operation of the microgrid and to prevent microgrid blackout, the microgrid load-shedding and/or generation-shedding scheme needs to be triggered following the islanding condition.
The IDDS in this application consists of three independent schemes operating in parallel.
A. Direct Transfer Trip (DTT) DTT is a communications-based transfer tripping scheme
widely used in protection systems. In this application, DTT is used to detect an islanding condition through direct isolation of the transmission line at the remote (utility) end via breaker status and initiate a load-shedding and/or generation-shedding scheme to sustain microgrid operation. The breaker status is supervised with open-phase detection (undercurrent element) to increase the security of the line-open detection. The transfer trip signal is sent over two completely separate physical communications media for redundancy using different protocols. The first communications method employs a proprietary high-speed peer-to-peer protocol that exchanges digital word bits. The second method uses the IEEE C37.118 synchrophasor protocol to send the digital bits. Fig. 1 shows the DTT scheme used to trigger the load-shedding and/or generation-shedding scheme.
Remote Open
DTTTransfer
Trip
IEEE C37.118 Communication
Serial Communication Channel
OK
Remote Open
Channel OK
Scheme Enabled
Fig. 1. DTT Scheme
B. Local-Area-Based Detection The local-area-based detection schemes are based on local
measurements. This paper discusses three elements that can detect islanding conditions as well as grid disturbances. These are all passive detection schemes that can be programmed into a microprocessor-based protective relay [4].

2
1) Underfrequency/Overfrequency (UF/OF) and Undervoltage/Overvoltage (UV/OV) Elements
Abnormal voltage and frequency detection with qualifying time delays allows for disturbance detection and successful islanding detection and decoupling. These elements should be carefully coordinated with existing protection systems to avoid false tripping during fault conditions.
Fig. 2 shows the overfrequency- and underfrequency-based scheme.
UF Threshold
PU
DO
UF Detect
PU
DO
Fault Block
OF Trip
UF Trip
Scheme Enabled
OF Detect–
+
–
+
OF Threshold
Measured Frequency
UV Supervision
–
Fig. 2. Overfrequency- and Underfrequency-Based Scheme
Fig. 3 shows the overvoltage- and undervoltage-based scheme.
UV Threshold
UV Detect
PU
DO
Fault Block
OV Trip
UV Trip
Scheme Enabled
OV Detect–
+
–
+
OV Threshold
Measured Voltage
PU
DO
Fig. 3. Overvoltage- and Undervoltage-Based Scheme
2) Rate of Change of Frequency (81R) Element The rate of change of frequency (ROCOF) element is
typically used to detect if the power system is accelerating or decelerating due to unbalance between load and generation. This rate above a certain threshold can be used to detect system disturbances and initiate a decoupling scheme based on an abnormal grid condition. The decoupling scheme can also be set to detect islanding conditions. Fig. 4 shows the logic diagram for the 81R element.
Scheme Enabled
PU
DO81R Trip
ThresholdFault Block
–
+
2.5 Hz Per Second
ABS (ROCOF)
Fig. 4. 81R Scheme
3) Fast Rate of Change of Frequency (81RF) Element The 81RF element provides a faster response compared
with the frequency (81O and 81U) and rate of change of frequency (81R) elements. The faster response times make the 81RF element suitable for detecting islanding and system disturbance conditions with critical time requirements.
Fig. 5 shows the 81RF characteristic. This element uses frequency deviation from nominal frequency (DF = FREQ – FNOM) and rate of change of frequency (DFDT/ROCOF) to detect islanding conditions. Under steady-state conditions, the operating point is close to the origin. During separation from the utility power system, depending on the frequency difference and the rate of change of frequency, the operating point enters the operating region of the characteristic. If the system is accelerating, the operating point enters Trip Region 1, and if the system is decelerating, the operating point enters Trip Region 2.
Trip Region 1
Trip Region 2
0.1
–0.2
–0.10.2
+81RFRP
+81RFDFP
–81RFRP
DFDT (Hz per second)
DF (FREQ – FNOM) (Hz)–81RFDFP
Fig. 5. 81RF Characteristic

3
PU
DO
FROCOF Trip
Scheme Enabled
DFDT
DF
Fault Block
Trip Region 1
Trip Region 2
0.1–0.2
–0.10.2
–81RFDFP
+81RFRP
+81RFDFP
–81RFRP
DFDT (Hz per second)
DF (FREQ – FNOM) (Hz)
Fig. 6. 81RF Fast Rate of Change of Frequency (FROCOF) Scheme
Signal Selection Enable Bit
Local Bus 1 V1 Angle
Local Bus 1 V1 Magnitude
Local Bus 2 V1 Angle
Local Bus 2 V1 Magnitude
Local Angle
Remote Bus 1 V1 Angle
Remote Bus 1 V1 Magnitude
Remote Bus 2 V1 Angle
Data Valid
Remote Angle
Angle Difference =ANG1 – ANG2
FOSPMDDelta Time =
FOSPMD[K] − FOSPMD[K – 1]
ANGLE DIFF
Slip DifferenceCalculation
= Delta Angle Difference/DELTA T
Acceleration Calculation =
Delta Slip Difference/DELTA T
ACCEL
Time Stamp
Calculated Acceleration
SLIP
Calculated Slip
DELTA T
Delta TimeRemote Bus 2 V1 Magnitude
Calculated Angle
Difference
Fig. 7. Overall Wide-Area-Based Islanding Detection Scheme
The element uses the settings 81RFDFP in Hz and 81RFRP in Hz per second to configure the characteristic. Fig. 6 shows the 81RF scheme using the characteristic. Blocking logic is used to restrain the element under fault conditions or other conditions where the frequency measurements are not reliable.
C. Wide-Area-Based Detection Synchrophasor technology allows for the implementation
of wide-area-based power system control schemes. In addition to requiring GPS time synchronization, these wide-area-based schemes can use various forms of communication (serial,
Ethernet, radio, and so on) for transferring time-synchronized phasor data. We focus on two wide-area schemes that compare local and remote synchrophasor measurements to detect islanding conditions [2]. Fig. 7 shows the parameters used from the local and remote relays for calculating the variables required for the wide-area-based schemes. The local positive-sequence voltage angle and remote voltage angle are measured and qualified before calculating the angle difference. This angle difference is further used to calculate the slip and acceleration in wide-area-based detection.

4
The change of angle difference (δk), with respect to time, defines the slip frequency (Sk), as shown in (1). The change of slip frequency, with respect to time, defines the acceleration between the two terminals (Ak), as shown in (2).
( )k k k –1MRATES
360= δ − δ (1)
k k k 1A (S S ) MRATE−= − (2)
where: Sk is the slip frequency at the k processing interval. Ak is the acceleration at the k processing interval. MRATE is the synchrophasor message rate.
1) Angle Difference-Based Scheme An angle difference-based wide-area scheme uses positive-
sequence voltage angles between two locations (local and remote) to determine islanding conditions. These two locations can be either ends of a transmission line or a microgrid point of common coupling (PCC) substation and a reference substation in the utility power system. The angle difference element operates if the phase angle difference between the positive-sequence voltage phasors at the two locations (local and remote) exceeds a programmable threshold for a specified duration. Fig. 8 shows the angle difference-based wide-area scheme.
ANGLE DIFF Threshold
PU ANGLE DIFF Trip
DO
ANGLE DIFF Detect
Fault Block
–
+ANGLE DIFF
Scheme Enabled
Fig. 8. Angle Difference-Based Wide-Area Scheme
2) Slip and Acceleration-Based Scheme The slip and acceleration-based scheme is very similar to
the 81RF characteristic. We use the slip acceleration characteristic shown in Fig. 9 to detect if the system is interconnected and if it is subjected to an oscillation.
Fig. 9 shows the logic for islanding detection based on this characteristic. When the system is interconnected, the operating point is at the origin of the slip acceleration characteristic. Once the systems separate, the operating point starts to move from the restrain region to the operate region. The unshaded area represents the thresholds that are selected for security. The logic declares an islanding condition and/or grid disturbance when the operating point stays in the operate region for a specified duration (PU) and initiates local breaker opening, which in turn triggers the appropriate load-shedding and/or generation-shedding scheme.
III. TEST SYSTEM AND IDDS IMPLEMENTATION This section describes the closed-loop simulation
environment, test power system, and IDDS implementation.
A. Simulation Environment The hardware-based Electromagnetic Transients Program
(EMTP) simulator used for this application is a fully digital power system simulator capable of continuous real-time operation. It performs electromagnetic power system transient simulations, with a typical simulation time step in the order of 50 microseconds, using a combination of custom software and hardware.
Scheme Enabled
Voltage Supervision
PUWA2 TripWA1 PU
DO OOST TripFault Block
Acceleration
Islanded (operate)
Slip Frequency
Connected (restrain)
Islanded (operate)
ACCEL
SLIP 0
0
Fig. 9. Slip and Acceleration-Based Wide-Area Scheme

5
The real-time EMTP simulator was specifically used to connect the IDDS in a closed loop with the power system model to emulate field testing. We created a power system model representing the microgrid and the utility power system. This model includes components of both the mechanical and electrical subsystems, such as governors, turbines, exciters, busbars, generators, inertia of loads and the lower-voltage network, nonlinear mechanical characteristics, electrical component impedances, and magnetic saturation of electrical components. This level of modeling provides an accurate depiction of frequency, voltage, current, turbine speed, generator rotor angles, and governor response characteristics for steady-state and dynamic studies.
B. Test Power System The microgrid facility tested comprises six 220 kV
substations and one 400 kV substation. All of these substations are connected through intertie lines and interconnecting transformers. The 220 kV substations serve several critical and noncritical load transformers, while the 400 kV substation connects to the utility grid through two parallel transmission lines.
With about 2 GW of installed generation capacity distributed across the 220 kV substations, the facility exports about 1 GW of power to the utility in addition to serving its own load. Fig. 10 shows a simplified diagram of the test system.
400 kV Transmission
Substation
400 kV Substation
220 kV Generation Substation
220 kV Load Substation220 kV
Load Substation
220 kV Load Substation
220 kV Generation Substation
Generation Substation
220 kV Load Substation
Utility
Microgrid
Fig. 10. Simplified Power System Overview
C. Islanding Detection and Decoupling System Fig. 11 shows the IDDS connections in the microgrid and
utility 400 kV substations. The islanding detection part of this system tracks any remote breaker open condition to immediately open the local breaker and trigger the generation-shedding and/or load-shedding system of the microgrid. The decoupling part is tasked with detecting any severe utility disturbances that require intentional islanding to save the microgrid from a blackout and to ensure continuity of microgrid operation. In the case of both islanding detection and decoupling, the local breaker opening triggers the microgrid generation-shedding and/or load-shedding systems to stabilize the frequency and voltage after disconnecting the microgrid from the utility power system.
Redundant microprocessor-based protective relays are installed at the local and remote ends of the 400 kV interconnected line for this application. Relays installed at the utility end of the 400 kV transmission line are used to provide necessary remote data to the local relay for making control decisions. The relays at the remote end are wired to the instrument transformers to measure current and voltage information on Transmission Lines 1 and 2. Additionally, the remote relays are configured to sense the remote breaker status. The breaker status and the current information are used by the remote relays for the DTT scheme, whereas the voltage magnitude and angle information are communicated via fiber-optic communications to the local relays for the wide-area scheme. Similarly, the local relays are also wired with current, voltage, and breaker information to assist with local- and wide-area schemes. In addition to the digital and analog inputs, the local relays are configured to perform tripping of microgrid side line breakers CB1 and CB2 during islanding detection and utility disturbance conditions.
All three of the previously mentioned schemes are used to detect and decouple the microgrid system from the utility grid. The communications for this microgrid use point-to-point fiber connections between the local and remote relays.
Fig. 12 and Fig. 13 show the local relay and remote relay front-panel configurations. These configurations indicate the protective relay targets and user control interface.

6
MA1
MA2
MA3
MB1
MB2
MB3
Grid
IRIG-B
400 kV GIS A
Line 1 CT Line 2 CT
VYVZIRIG-B
Remote Relay 1
IXIW
VZVY
Remote Relay 2
IWIX
Satellite Clock
400 kV GIS B
Utility Grid
IXVY
IWVZ
IXVY
IWVZLocal
Relay 1Local
Relay 2
IRIG-B IRIG-B
Satellite Clock
GIS A 400 kV
GIS B 400 kV
CB1 CB2
CB1-S1 CB2-S1
CB3
CB3-S2
CB2-S2CB1-S2
Line 1 Line 2
Microgrid 400 kV GIS
Closed
Open
CB3-S1
Fig. 11. IDDS Implementation

7
MANUAL ENABLE
SCHEME ENABLED
DTT TRIP
SLIP/ACCELERATION TRIP
81O TRIP
ENABLED
TRIP
TARGETRESET
RELAY ALARM
MB COMM ALARMSPHASOR COMM ALARM
81U TRIP
LOCAL TRIP
IRIG ALARM
1 STATE TRIP
81RF TRIP
59 TRIP
27 TRIP
C01 OPEN
DTT ENABLE
LOCAL ENABLE
WA ENABLE
SPARE
SPARE
SPARE
SPARE
ANGLE DIFFERENCE TRIP
Fig. 12. Local Relay Front Panel
SPARE
LINE 1 TOP BREAKER OPEN
LINE 2 TOP BREAKER OPEN
LINE 1 MIDDLE BREAKER OPEN
LINE 2 MIDDLE BREAKER OPEN
SPARE
ENABLED
TRIP
TARGETRESET
SPARE
SPARE
SPARE
SPARE
LINE 1 BOTTOM BREAKER OPEN
SPARE
LINE 2 BOTTOM BREAKER OPEN
IRIG ALARM
SPARE
SPARE
SPARE
SPARE
SPARE
SPARE
SPARE
SPARE
SPARE
SPARE
Fig. 13. Remote Relay Front Panel
IV. DYNAMIC SIMULATIONS Factory acceptance testing was performed prior to the
installation of the IDDS at the microgrid. We created an EMTP model of the power system to validate the functionality of the IDDS in terms of speed and reliability.
Several studies were done using the model, providing insight into microgrid operation, existing design vulnerabilities, and the system response for various contingency events. We conducted several tests on the system to determine the optimal thresholds for the IDDS. The real-time closed-loop testing approach also helped minimize IDDS commissioning time.
Fig. 14 shows the connection between the IDDS hardware and power system simulation hardware. Analog outputs from the real-time digital simulator include voltages and currents from the local and remote terminals of the 400 kV intertie. Digital outputs include the breaker statuses. We wired the relay (configured with IDDS) outputs indicating islanding and/or system disturbances to the real-time digital simulator to
disconnect the microgrid from the utility and initiate the generation-shedding scheme. The generation-shedding scheme was implemented in an external power management controller, which was also connected in a closed loop with the simulation hardware.
Simulation Hardware
Simulation I/O Cube
Simulation Software
IED and Visualization
Software
IDDS Relays
Digital Outputs
Analog Outputs
Local Computer
Digital Inputs
Power Management
Controller
Fig. 14. Real-Time Digital Simulation Interface With IDDS

8
TABLE I DECOUPLING TEST SIMULATED USING REAL-TIME DIGITAL SIMULATION (MICROGRID INTERCONNECTED WITH UTILITY GRID)
TABLE II ISLANDING DETECTION TESTS SIMULATED USING REAL-TIME DIGITAL SIMULATION
TABLE III FAULT TESTS SIMULATED USING REAL-TIME DIGITAL SIMULATION
The cases simulated are listed in Table I, Table II, and
Table III, along with their performance. We used the settings in Table IV to evaluate the performance of the IDDS.
TABLE IV SCHEME PARAMETERS
Scheme Setting Parameter
81RF 81RFRP 5 Hz per second
81RF 81RFDFP 1.5 Hz
81R (ROCOF) Threshold 2.5 Hz per second
Angle difference ANGLE DIFF threshold 7.5 degrees
Slip and acceleration Slip 1.5 Hz
Slip and acceleration Acceleration 2.5 Hz per second
All schemes Pickup timer 5 cycles
The 81R and 81RF settings were chosen based on data from disturbances that the microgrid experienced in the past. The angle difference threshold was chosen based on maximum power flow conditions across the utility tie during the worst-case condition of a single line in service, along with considering the angle difference transient response during normally cleared fault conditions.
The IDDS is disabled after the detection of a disturbance or islanding condition. It is reenabled after it confirms that the microgrid and the utility power system are back to normal operating conditions.
A. Case A Case A represents an internal disturbance within the
microgrid when the microgrid is interconnected to the utility network. When connected to the utility, a change in generation and/or load should not trigger the IDDS, and it should be able to ride through the event. In this case, a total generation of
Case Condition Desired Result Operation Detection Time Pass/Fail
A Internal disturbance (loss of 1,200 MW generation followed by load shedding) Ride through No operation NA Pass
B3 Utility frequency increase at the rate of 1.5 Hz per second while exporting 260 MW Decouple Local (81RF operation) 900 ms Pass
B4 Utility frequency increase at the rate of 2.5 Hz per second while exporting 800 MW Decouple Local (81R operation) 380 ms Pass
B5 Utility frequency decrease at the rate of 1.8 Hz per second while exporting 800 MW Decouple Local (81RF operation) 720 ms Pass
B6 Utility frequency increase at the rate of 0.6 Hz per second while exporting 800 MW Decouple Local (81RF operation) 1,380 ms Pass
Case Condition Desired Result Operation Detection Time Pass/Fail
C Utility breaker opening (protected by DTT) during 0 MW import and export condition Decouple DTT 50 ms Pass
D1 Utility breaker opening (unprotected by DTT) during 520 MW export condition (medium-export condition) Decouple Wide area (angle-based) 160 ms Pass
D2 Utility breaker opening (unprotected by DTT) during 70 MW export condition (low-export condition) Decouple Wide area (angle-based) 300 ms Pass
D3 Utility breaker opening (unprotected by DTT) during 0 MW import and export condition Decouple Wide area (angle-based) 500 ms Pass
Case Condition Desired Result Operation Detection Time Pass/Fail
E1 Single-phase fault and fault isolated by opening Line 1 Ride through No operation NA Pass
E2 Three-phase fault and fault isolated by opening Line 1 Ride through No operation NA Pass

9
1,200 MW was intentionally tripped, followed by load shedding. As expected, the IDDS did not operate. Fig. 15a shows that the operating quantity is in the restraint region of the 81RF element, and Fig. 15b shows that angle difference is within the preconfigured threshold of 7.5 degrees.
0.6
0.4
0.2
0
–0.2
–0.4
–0.6
–0.8–0.06 –0.04 –0.02 0 0.02 0.04 0.06
Frequency Difference (Hz)
Rat
e of
Cha
nge
of F
requ
ency
(H
z pe
r sec
ond)
Case A 81RF Element
–0.5
0
0.5
1
1.5
50 100 150 200 250 300 350
Case A Angle Difference Element
Samples (each equal to 20 milliseconds)
Ang
le D
iffer
ence
(deg
rees
)
(a)
(b)
Fig. 15. Case A
B. Cases B3 to B6 Cases B3 to B6 simulate frequency disturbances in the
utility power system when the microgrid is interconnected to the utility. For example, Case B3 simulates the utility frequency increasing at a rate of 1.5 Hz per second while the microgrid is exporting power to the utility. These cases represent fault conditions in the utility power system that fail to clear or sustain longer than expected. In these cases, the IDDS is designed to detect the disturbance and intentionally decouple from the utility to avoid a blackout condition in the microgrid. We configured the thresholds for the IDDS to reliably identify severe disturbances in the utility network in order to disconnect the microgrid.
Fig. 16 shows the operation of the local-area 81RF element for Cases B3, B5, and B6. It is important to note that for severe utility disturbances that have a rate of change of frequency higher than 2.5 Hz per second, the local-area 81R element is set to operate faster than the local-area 81RF element to quickly decouple and preserve microgrid system stability.
Fig. 17 shows the operation of the 81R element for Case B4, where the utility disturbance has a rate of change of frequency higher than 2.5 Hz per second. Severe disturbances resulted in faster detection and decoupling, as desired.
Start of Event
Positive ThresholdIDDS Trip
Negative ThresholdMicrogrid Frequency Returning to Stable Point After
IDDS Trip and Generation and Load Shedding
IDDS Trip
Negative ThresholdCase B3Case B5Case B6
Positive Threshold 81RF Element
X: –1.164Y: –1.803
X: 1.218Y: 1.456
X: 1.392Y: 0.3503
IDDS Trip
3
2
1
0
–1
–2
–1.5 –1 –0.5 0 0.5 1 1.5Frequency Difference (Hz)
Rat
e of
Cha
nge
of F
requ
ency
(Hz
per s
econ
d)
Fig. 16. Cases B3, B5, and B6

10
–0.5–1
0.5
0
1
1.5
2
2.5
3
200 300 400 500 600 700 800 900
Microgrid Frequency Returning to Stable Point After IDDS Trip and Local Generation and Load Shedding
Start of Event
IDDSTrip X: 269
Y: 2.717
Case B4 81R (ROCOF) ElementR
ate
of C
hang
e of
Fre
quen
cy
(Hz
per s
econ
d)
Samples (each equal to 20 milliseconds) Fig. 17. Case B4
C. Case C Case C represents a situation where an unintentional utility
side breaker opening creates a power system island for the microgrid during normal operating conditions. To accommodate this case, the IDDS is designed to detect the opening of the remote breaker using breaker status and a low-current condition to trip the local breaker. High-speed generation shedding and/or load shedding is triggered when the local breaker opens to preserve microgrid stability.
D. Cases D1 to D3 Similar to Case C, Cases D1 to D3 represent the
unintentional utility side remote breaker opening condition. In contrast to Case C, Cases D1 to D3 simulate an upstream breaker opening that creates an islanding condition. It is not
practical and very expensive to cover all of the utility breakers that can cause an island for a microgrid with a DTT scheme. In such cases, the IDDS uses the wide-area-based elements to reliably detect the islanding conditions. Even though some of the local-area-based elements can assist in the islanding detection cases, they cannot cover all of the scenarios and provide the required detection speed in addition to maintaining the scheme security and system reliability.
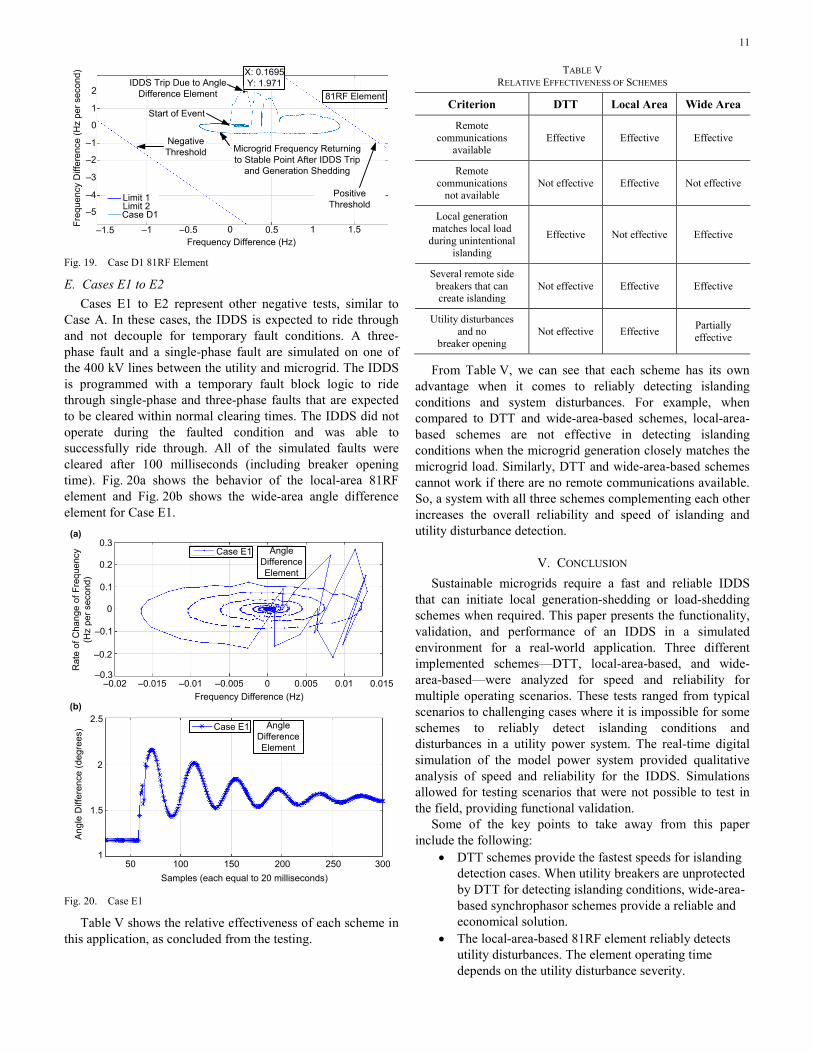
Fig. 18 shows the operation of the wide-area-based angle difference element for Cases D1, D2, and D3. Fig. 19 shows the operation of the 81RF element for Case D1, which has maximum power mismatch during pre-event conditions.
The angle difference element operated for each of the cases, and it is important to note that the greater the amount of power mismatch before the islanding, the faster the detection speed. Another important observation to make is, in Case D3, the real and reactive power exchange was set up to be very minimal (close to zero). During such conditions, the local-area-based schemes fail to detect an islanding condition because there is very minimal frequency or voltage excursion in the microgrid. In contrast, the synchrophasor-based wide-area scheme still detects the island and trips the local breaker. Also, Fig. 19 shows that the angle difference element operates faster than the 81RF element for the maximum power mismatch case (Case D1). Thus, wide-area detection schemes provide effective islanding detection capability, even during low-import and low-export conditions, for the microgrid power system.
Start of Event
X: 98Y: 0.0296
X: 106Y: 18.06
X: 113Y: 15.64
Threshold
Threshold
IDDS Trip
X: 123Y: –12.67
IDDS Trip
Case D1 (P ~ 520 MW)Case D2 (P ~ 70 MW)Case D3 (P ~ 0 MW)
85 90 95 100 105 110 115 120 125
–17.5
–15
–12.5
–10
–7.5
–5
–2.5
0
2.5
5
7.5
10
12.5
15
17.5
Samples (each equal to 20 milliseconds)
Ang
le D
iffer
ence
(deg
rees
)
IDDS Trip
Angle Difference Element
Fig. 18. Angle Difference Element for Cases D1, D2, and D3
11
–5
–4
–3
–2
–1
0
1
2
–1.5 –1 –0.5 0 0.5 1 1.5
Negative Threshold
Positive Threshold
IDDS Trip Due to Angle Difference Element
X: 0.1695Y: 1.971
Limit 1Limit 2Case D1
81RF Element
Frequency Difference (Hz)
Freq
uenc
y D
iffer
ence
(Hz
per s
econ
d)
Microgrid Frequency Returning to Stable Point After IDDS Trip
and Generation Shedding
Start of Event
Fig. 19. Case D1 81RF Element
E. Cases E1 to E2 Cases E1 to E2 represent other negative tests, similar to
Case A. In these cases, the IDDS is expected to ride through and not decouple for temporary fault conditions. A three-phase fault and a single-phase fault are simulated on one of the 400 kV lines between the utility and microgrid. The IDDS is programmed with a temporary fault block logic to ride through single-phase and three-phase faults that are expected to be cleared within normal clearing times. The IDDS did not operate during the faulted condition and was able to successfully ride through. All of the simulated faults were cleared after 100 milliseconds (including breaker opening time). Fig. 20a shows the behavior of the local-area 81RF element and Fig. 20b shows the wide-area angle difference element for Case E1.
0.3
0.2
0.1
0
–0.1
–0.2
–0.3–0.02 –0.015 –0.01 –0.005 0 0.005 0.01 0.015
Case E1 Angle Difference Element
Frequency Difference (Hz)
Rat
e of
Cha
nge
of F
requ
ency
(H
z pe
r sec
ond)
Angle Difference Element
Case E1
50 100 150 200 250 3001
1.5
2
2.5
Samples (each equal to 20 milliseconds)
Ang
le D
iffer
ence
(deg
rees
)
(a)
(b)
Fig. 20. Case E1
Table V shows the relative effectiveness of each scheme in this application, as concluded from the testing.
TABLE V RELATIVE EFFECTIVENESS OF SCHEMES
Criterion DTT Local Area Wide Area
Remote communications
available Effective Effective Effective
Remote communications
not available Not effective Effective Not effective
Local generation matches local load
during unintentional islanding
Effective Not effective Effective
Several remote side breakers that can create islanding
Not effective Effective Effective
Utility disturbances and no
breaker opening Not effective Effective Partially
effective
From Table V, we can see that each scheme has its own advantage when it comes to reliably detecting islanding conditions and system disturbances. For example, when compared to DTT and wide-area-based schemes, local-area-based schemes are not effective in detecting islanding conditions when the microgrid generation closely matches the microgrid load. Similarly, DTT and wide-area-based schemes cannot work if there are no remote communications available. So, a system with all three schemes complementing each other increases the overall reliability and speed of islanding and utility disturbance detection.
V. CONCLUSION Sustainable microgrids require a fast and reliable IDDS
that can initiate local generation-shedding or load-shedding schemes when required. This paper presents the functionality, validation, and performance of an IDDS in a simulated environment for a real-world application. Three different implemented schemes—DTT, local-area-based, and wide-area-based—were analyzed for speed and reliability for multiple operating scenarios. These tests ranged from typical scenarios to challenging cases where it is impossible for some schemes to reliably detect islanding conditions and disturbances in a utility power system. The real-time digital simulation of the model power system provided qualitative analysis of speed and reliability for the IDDS. Simulations allowed for testing scenarios that were not possible to test in the field, providing functional validation.
Some of the key points to take away from this paper include the following:
• DTT schemes provide the fastest speeds for islanding detection cases. When utility breakers are unprotected by DTT for detecting islanding conditions, wide-area-based synchrophasor schemes provide a reliable and economical solution.
• The local-area-based 81RF element reliably detects utility disturbances. The element operating time depends on the utility disturbance severity.

12
• Wide-area-based synchrophasor schemes reliably detect islanding conditions during very low power import and export conditions.
• Each scheme has individual advantages and disadvantages depending on the operating scenario of the microgrid system. But, combining all three of them in a single system provides a reliable solution to detect islanding and utility disturbances for all system conditions.
• IDDSs can be easily and economically implemented with industry-grade microprocessor-based relays using peer-to-peer communications.
VI. REFERENCES [1] IEEE Standard 1547, IEEE Standard for Interconnecting Distributed
Resources With Electric Power Systems. [2] M. Mills-Price, M. Scharf, S. Hummel, M. Ropp, D. Joshi, G. Zweigle,
K. Gubba Ravikumar, and B. Flerchinger, “Solar Generation Control With Time-Synchronized Phasors,” proceedings of the 64th Annual Conference for Protective Relay Engineers, College Station, TX, April 2011.
[3] J. Mulhausen, J. Schaefer, M. Mynam, A. Guzmán, and M. Donolo, “Anti-Islanding Today, Successful Islanding in the Future,” proceedings of the 63rd Annual Conference for Protective Relay Engineers, College Station, TX, April 2010.
[4] W. Xu, K. Mauch, and S. Martel, “An Assessment of Distributed Generation Islanding Detection Methods and Issues for Canada,” CANMET Energy Technology Centre – Varennes, Natural Resources Canada, July 2004.
VII. BIOGRAPHIES Krishnanjan Gubba Ravikumar received his M.S.E.E. degree from Mississippi State University and his B.S.E.E. from Anna University, India. He is presently working as a supervising engineer in the Schweitzer Engineering Laboratories, Inc. engineering services division, focusing on model power system development and testing for special protection systems. His areas of expertise include real-time modeling and simulation, synchrophasor applications, remedial action schemes, and power electronic applications. He has extensive knowledge of power system controls and renewable distributed generation. He is a member of the IEEE and the Eta Kappa Nu Honor Society.
Ashish Upreti is a protection engineer in the engineering services division at Schweitzer Engineering Laboratories, Inc. in Pullman, Washington. He received his B.S.E.E. and M.S.E.E. degrees from the University of Idaho. He is a registered member of the IEEE and has experience in the field of power system protection and automation, including power management schemes for large-scale industrial power plants.
Adithiya Nagarajan is a design engineer in the engineering services division at Schweitzer Engineering Laboratories, Inc. in Bangalore, India. He received his B.S.E.E. from Anna University and his M.S.E.E. from Arizona State University. He has experience in the field of power system protection and automation, including power management schemes for large-scale industrial power plants.
© 2015 by Schweitzer Engineering Laboratories, Inc. All rights reserved.
20150303 • TP6691-01