Embed Size (px)
Citation preview
State of the Practice on Data Access, Sharing, and Integration
PUBLICATION NO. FHWA-HRT-15-072 DECEMBER 2016
Research, Development, and TechnologyTurner-Fairbank Highway Research Center6300 Georgetown PikeMcLean, VA 22101-2296
FOREWORD
The effective analysis of transportation operations strategies for planning and investment decisions requires an accurate and complete understanding of transportation system performance obtained by integrating multiple sources of transportation data from multiple stakeholders. This report examines the state of the practice in data sharing and integration, specifically (1) current data sharing and integration practices among State and local agencies, (2) example data environments, (3) technical integration formats, and (4) business rules for integration and sharing.
The review was conducted at the outset of a Federal Highway Administration project to develop a prototype framework for sharing planning and operations data between State and local transportation agencies from multiple sources within a region. The results of the review were used to inform the development of the framework. Transportation operators, planners, and data professionals can use this report to enhance their data sharing and integration efforts by building on the experiences and effective practices of other agencies that are documented in this report.
Brian P. Cronin Director, Office of Operations Research and Development
Notice This document is disseminated under the sponsorship of the U.S. Department of Transportation in the interest of information exchange. The U.S. Government assumes no liability for the use of the information contained in this document. The U.S. Government does not endorse products or manufacturers. Trademarks or manufacturers’ names appear in this report only because they are considered essential to the objective of the document.
Quality Assurance Statement The Federal Highway Administration (FHWA) provides high-quality information to serve Government, industry, and the public in a manner that promotes public understanding. Standards and policies are used to ensure and maximize the quality, objectivity, utility, and integrity of its information. FHWA periodically reviews quality issues and adjusts its programs and processes to ensure continuous quality improvement.
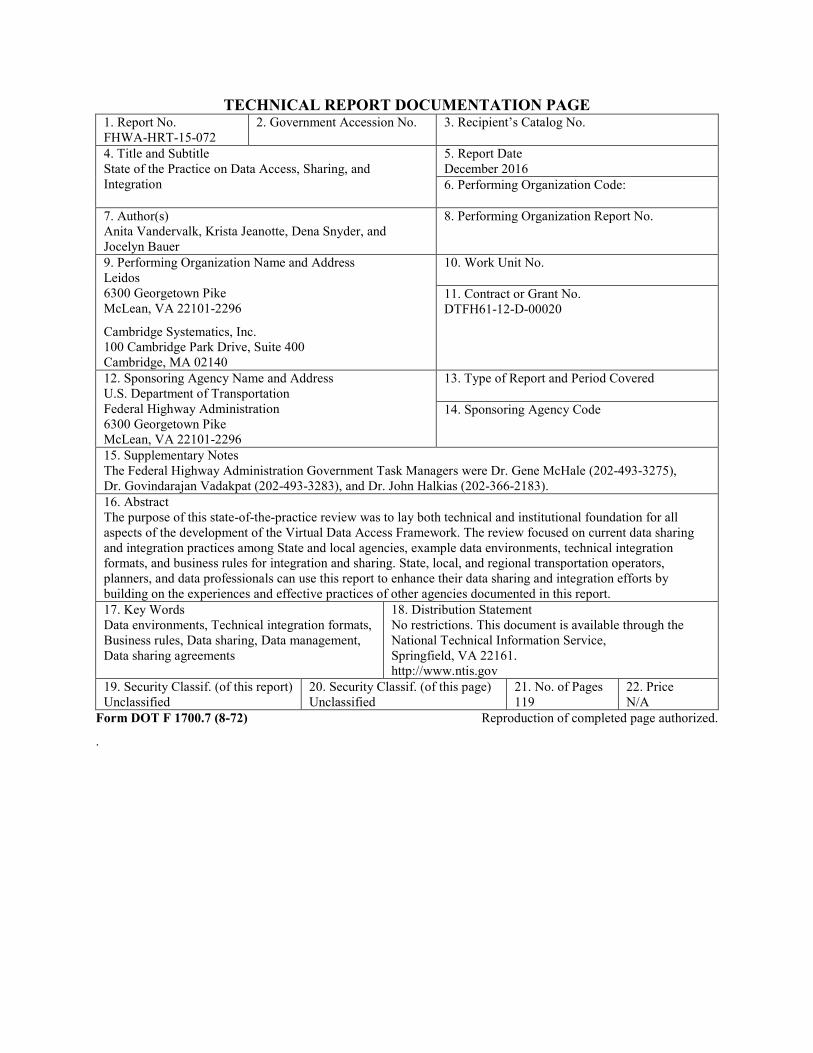
TECHNICAL REPORT DOCUMENTATION PAGE 1. Report No.FHWA-HRT-15-072
2. Government Accession No. 3. Recipient’s Catalog No.
4. Title and SubtitleState of the Practice on Data Access, Sharing, and Integration
5. Report DateDecember 2016 6. Performing Organization Code:
7. Author(s)Anita Vandervalk, Krista Jeanotte, Dena Snyder, and Jocelyn Bauer
8. Performing Organization Report No.
9. Performing Organization Name and AddressLeidos 6300 Georgetown Pike McLean, VA 22101-2296
Cambridge Systematics, Inc. 100 Cambridge Park Drive, Suite 400 Cambridge, MA 02140
10. Work Unit No.
11. Contract or Grant No.DTFH61-12-D-00020
12. Sponsoring Agency Name and AddressU.S. Department of Transportation Federal Highway Administration 6300 Georgetown Pike McLean, VA 22101-2296
13. Type of Report and Period Covered
14. Sponsoring Agency Code
15. Supplementary NotesThe Federal Highway Administration Government Task Managers were Dr. Gene McHale (202-493-3275), Dr. Govindarajan Vadakpat (202-493-3283), and Dr. John Halkias (202-366-2183). 16. AbstractThe purpose of this state-of-the-practice review was to lay both technical and institutional foundation for all aspects of the development of the Virtual Data Access Framework. The review focused on current data sharing and integration practices among State and local agencies, example data environments, technical integration formats, and business rules for integration and sharing. State, local, and regional transportation operators, planners, and data professionals can use this report to enhance their data sharing and integration efforts by building on the experiences and effective practices of other agencies documented in this report. 17. Key WordsData environments, Technical integration formats, Business rules, Data sharing, Data management, Data sharing agreements
18. Distribution StatementNo restrictions. This document is available through the National Technical Information Service, Springfield, VA 22161. http://www.ntis.gov
19. Security Classif. (of this report)Unclassified
20. Security Classif. (of this page)Unclassified
21. No. of Pages119
22. PriceN/A
Form DOT F 1700.7 (8-72) Reproduction of completed page authorized.
.
ii
iii
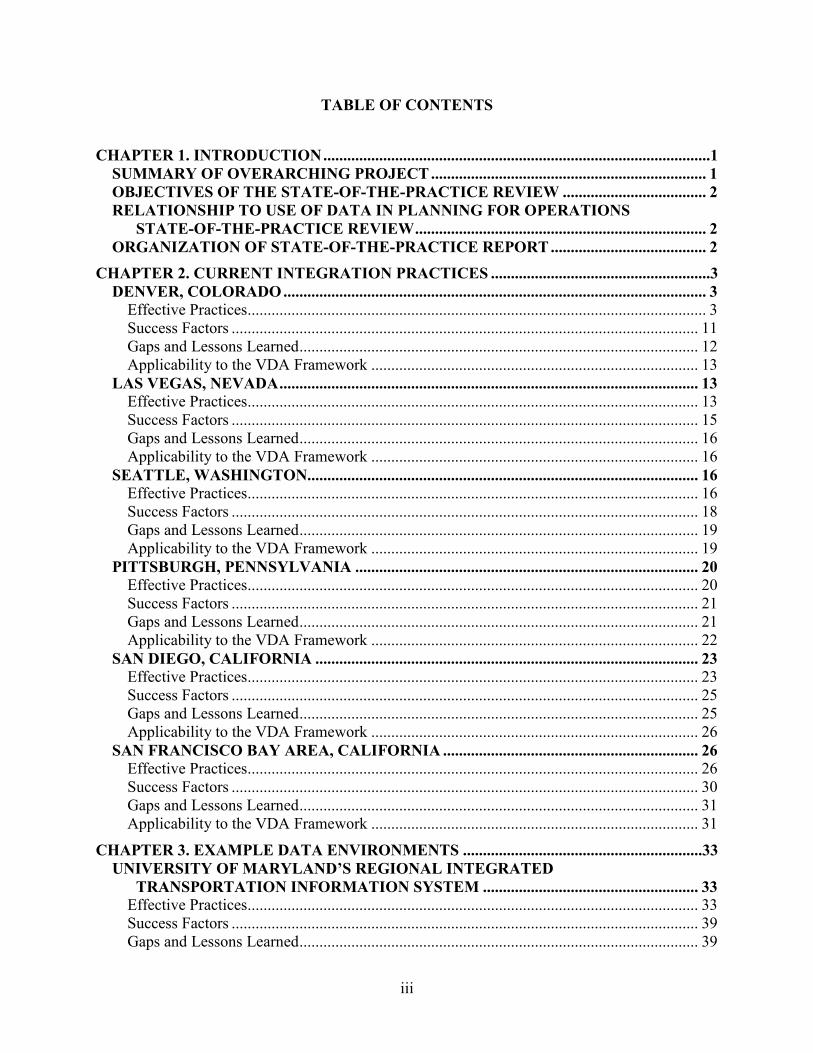
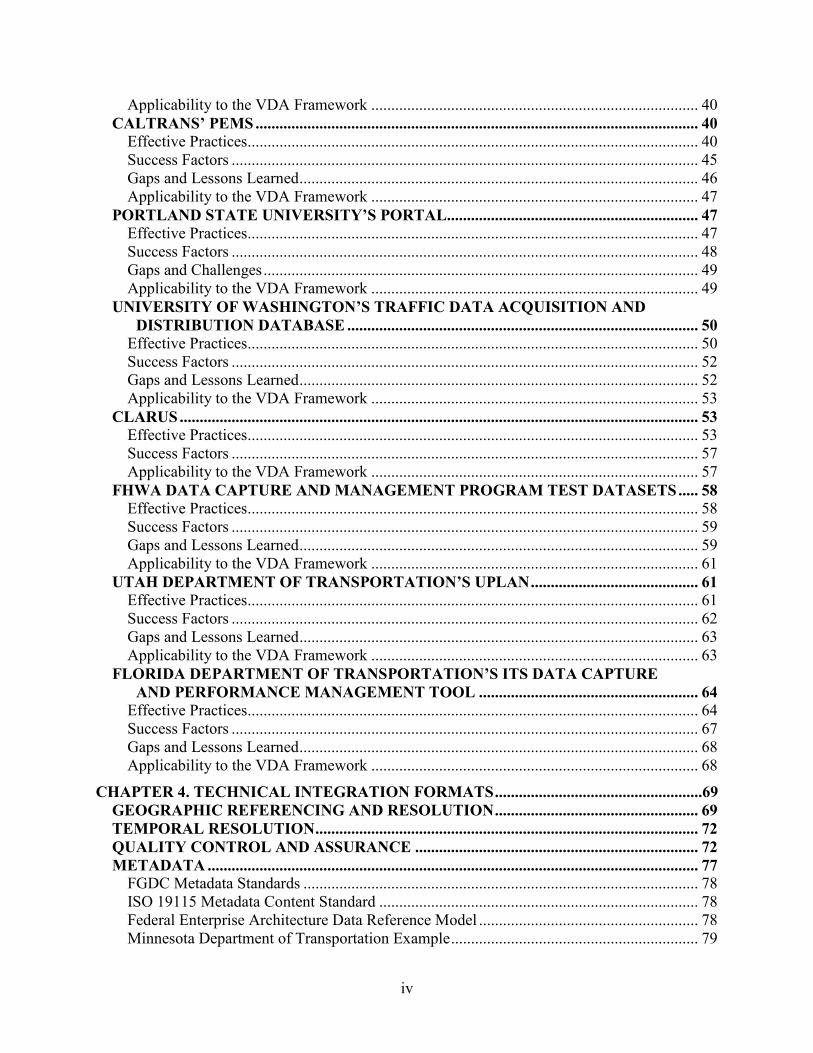
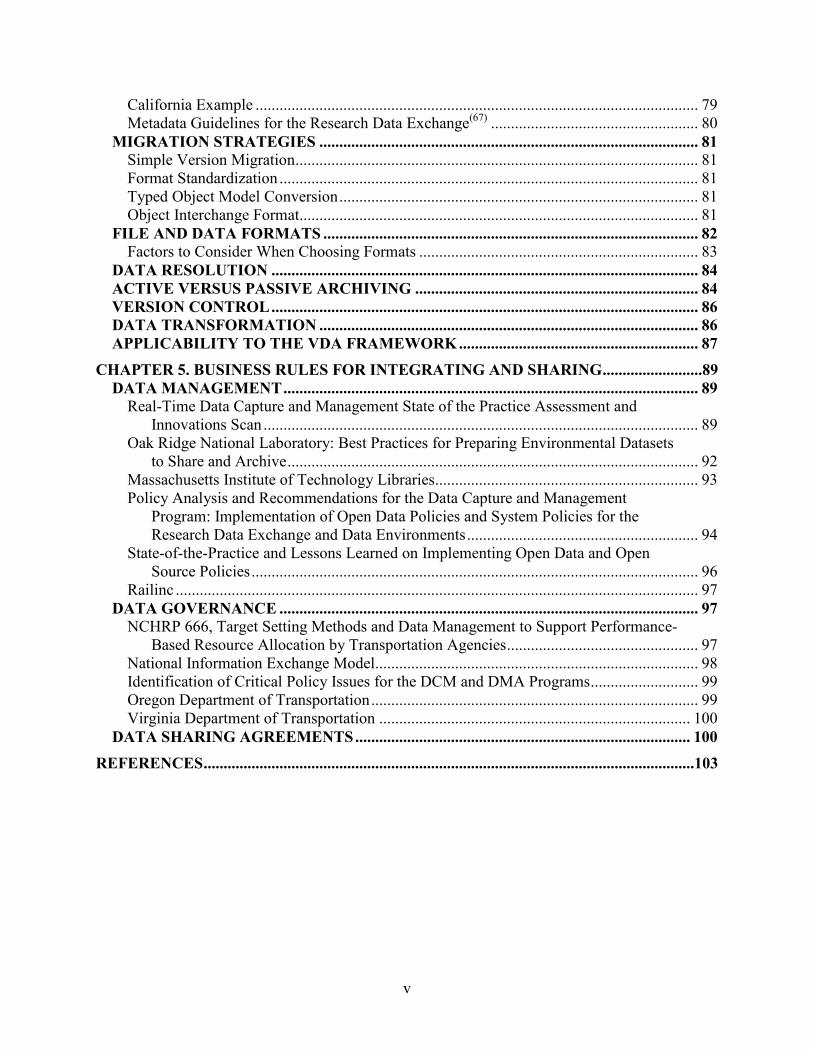
TABLE OF CONTENTS
CHAPTER 1. INTRODUCTION .................................................................................................1 SUMMARY OF OVERARCHING PROJECT ..................................................................... 1 OBJECTIVES OF THE STATE-OF-THE-PRACTICE REVIEW .................................... 2 RELATIONSHIP TO USE OF DATA IN PLANNING FOR OPERATIONS
STATE-OF-THE-PRACTICE REVIEW ......................................................................... 2 ORGANIZATION OF STATE-OF-THE-PRACTICE REPORT ....................................... 2
CHAPTER 2. CURRENT INTEGRATION PRACTICES .......................................................3 DENVER, COLORADO .......................................................................................................... 3
Effective Practices................................................................................................................... 3 Success Factors ..................................................................................................................... 11 Gaps and Lessons Learned .................................................................................................... 12 Applicability to the VDA Framework .................................................................................. 13
LAS VEGAS, NEVADA ......................................................................................................... 13 Effective Practices................................................................................................................. 13 Success Factors ..................................................................................................................... 15 Gaps and Lessons Learned .................................................................................................... 16 Applicability to the VDA Framework .................................................................................. 16
SEATTLE, WASHINGTON.................................................................................................. 16 Effective Practices................................................................................................................. 16 Success Factors ..................................................................................................................... 18 Gaps and Lessons Learned .................................................................................................... 19 Applicability to the VDA Framework .................................................................................. 19
PITTSBURGH, PENNSYLVANIA ...................................................................................... 20 Effective Practices................................................................................................................. 20 Success Factors ..................................................................................................................... 21 Gaps and Lessons Learned .................................................................................................... 21 Applicability to the VDA Framework .................................................................................. 22
SAN DIEGO, CALIFORNIA ................................................................................................ 23 Effective Practices................................................................................................................. 23 Success Factors ..................................................................................................................... 25 Gaps and Lessons Learned .................................................................................................... 25 Applicability to the VDA Framework .................................................................................. 26
SAN FRANCISCO BAY AREA, CALIFORNIA ................................................................ 26 Effective Practices................................................................................................................. 26 Success Factors ..................................................................................................................... 30 Gaps and Lessons Learned .................................................................................................... 31 Applicability to the VDA Framework .................................................................................. 31
CHAPTER 3. EXAMPLE DATA ENVIRONMENTS ............................................................33 UNIVERSITY OF MARYLAND’S REGIONAL INTEGRATED
TRANSPORTATION INFORMATION SYSTEM ...................................................... 33 Effective Practices................................................................................................................. 33 Success Factors ..................................................................................................................... 39 Gaps and Lessons Learned .................................................................................................... 39
iv
Applicability to the VDA Framework .................................................................................. 40 CALTRANS’ PEMS ............................................................................................................... 40
Effective Practices................................................................................................................. 40 Success Factors ..................................................................................................................... 45 Gaps and Lessons Learned .................................................................................................... 46 Applicability to the VDA Framework .................................................................................. 47
PORTLAND STATE UNIVERSITY’S PORTAL............................................................... 47 Effective Practices................................................................................................................. 47 Success Factors ..................................................................................................................... 48 Gaps and Challenges ............................................................................................................. 49 Applicability to the VDA Framework .................................................................................. 49
UNIVERSITY OF WASHINGTON’S TRAFFIC DATA ACQUISITION AND DISTRIBUTION DATABASE ........................................................................................ 50
Effective Practices................................................................................................................. 50 Success Factors ..................................................................................................................... 52 Gaps and Lessons Learned .................................................................................................... 52 Applicability to the VDA Framework .................................................................................. 53
CLARUS .................................................................................................................................. 53 Effective Practices................................................................................................................. 53 Success Factors ..................................................................................................................... 57 Applicability to the VDA Framework .................................................................................. 57
FHWA DATA CAPTURE AND MANAGEMENT PROGRAM TEST DATASETS ..... 58 Effective Practices................................................................................................................. 58 Success Factors ..................................................................................................................... 59 Gaps and Lessons Learned .................................................................................................... 59 Applicability to the VDA Framework .................................................................................. 61
UTAH DEPARTMENT OF TRANSPORTATION’S UPLAN .......................................... 61 Effective Practices................................................................................................................. 61 Success Factors ..................................................................................................................... 62 Gaps and Lessons Learned .................................................................................................... 63 Applicability to the VDA Framework .................................................................................. 63
FLORIDA DEPARTMENT OF TRANSPORTATION’S ITS DATA CAPTURE AND PERFORMANCE MANAGEMENT TOOL ....................................................... 64
Effective Practices................................................................................................................. 64 Success Factors ..................................................................................................................... 67 Gaps and Lessons Learned .................................................................................................... 68 Applicability to the VDA Framework .................................................................................. 68
CHAPTER 4. TECHNICAL INTEGRATION FORMATS ....................................................69 GEOGRAPHIC REFERENCING AND RESOLUTION ................................................... 69 TEMPORAL RESOLUTION ................................................................................................ 72 QUALITY CONTROL AND ASSURANCE ....................................................................... 72 METADATA ........................................................................................................................... 77
FGDC Metadata Standards ................................................................................................... 78 ISO 19115 Metadata Content Standard ................................................................................ 78 Federal Enterprise Architecture Data Reference Model ....................................................... 78 Minnesota Department of Transportation Example .............................................................. 79
v
California Example ............................................................................................................... 79 Metadata Guidelines for the Research Data Exchange(67) .................................................... 80
MIGRATION STRATEGIES ............................................................................................... 81 Simple Version Migration ..................................................................................................... 81 Format Standardization ......................................................................................................... 81 Typed Object Model Conversion .......................................................................................... 81 Object Interchange Format.................................................................................................... 81
FILE AND DATA FORMATS .............................................................................................. 82 Factors to Consider When Choosing Formats ...................................................................... 83
DATA RESOLUTION ........................................................................................................... 84 ACTIVE VERSUS PASSIVE ARCHIVING ....................................................................... 84 VERSION CONTROL ........................................................................................................... 86 DATA TRANSFORMATION ............................................................................................... 86 APPLICABILITY TO THE VDA FRAMEWORK ............................................................ 87
CHAPTER 5. BUSINESS RULES FOR INTEGRATING AND SHARING .........................89 DATA MANAGEMENT ........................................................................................................ 89
Real-Time Data Capture and Management State of the Practice Assessment and Innovations Scan ............................................................................................................. 89
Oak Ridge National Laboratory: Best Practices for Preparing Environmental Datasets to Share and Archive ....................................................................................................... 92
Massachusetts Institute of Technology Libraries.................................................................. 93 Policy Analysis and Recommendations for the Data Capture and Management
Program: Implementation of Open Data Policies and System Policies for the Research Data Exchange and Data Environments .......................................................... 94
State-of-the-Practice and Lessons Learned on Implementing Open Data and Open Source Policies ................................................................................................................ 96
Railinc ................................................................................................................................... 97 DATA GOVERNANCE ......................................................................................................... 97
NCHRP 666, Target Setting Methods and Data Management to Support Performance-Based Resource Allocation by Transportation Agencies ................................................ 97
National Information Exchange Model................................................................................. 98 Identification of Critical Policy Issues for the DCM and DMA Programs ........................... 99 Oregon Department of Transportation .................................................................................. 99 Virginia Department of Transportation .............................................................................. 100
DATA SHARING AGREEMENTS .................................................................................... 100
REFERENCES ...........................................................................................................................103
vi
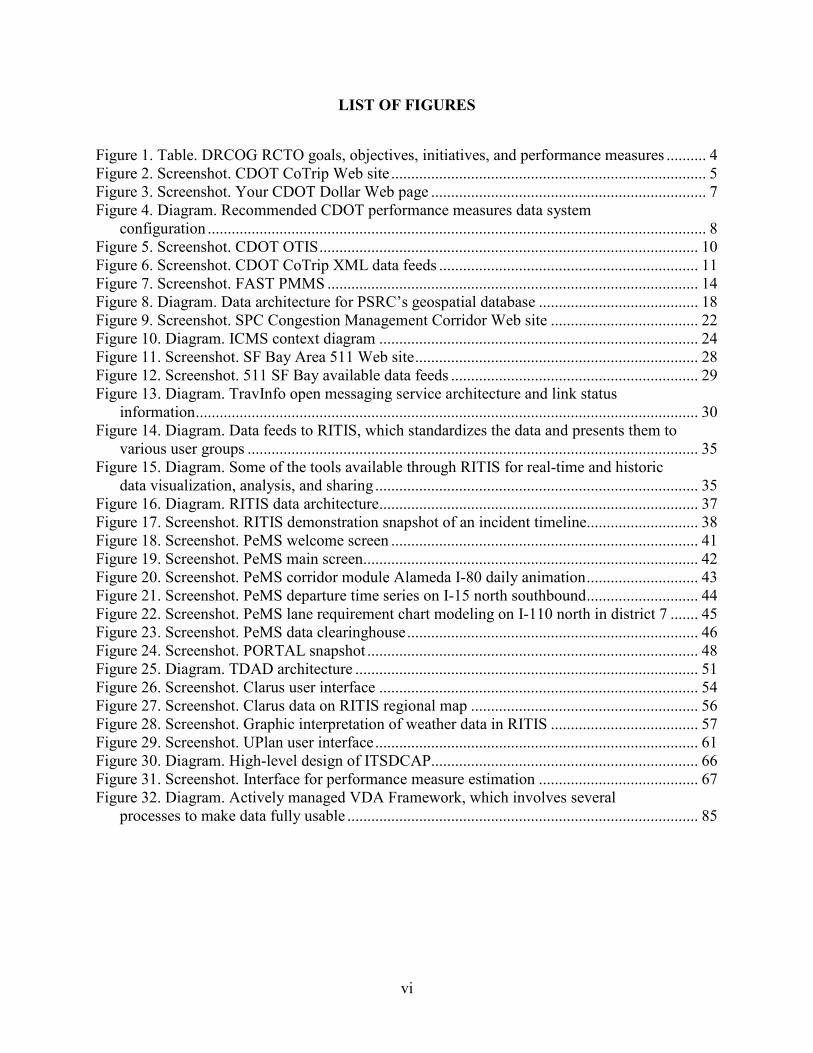
LIST OF FIGURES
Figure 1. Table. DRCOG RCTO goals, objectives, initiatives, and performance measures .......... 4 Figure 2. Screenshot. CDOT CoTrip Web site ............................................................................... 5 Figure 3. Screenshot. Your CDOT Dollar Web page ..................................................................... 7 Figure 4. Diagram. Recommended CDOT performance measures data system
configuration ............................................................................................................................. 8 Figure 5. Screenshot. CDOT OTIS ............................................................................................... 10 Figure 6. Screenshot. CDOT CoTrip XML data feeds ................................................................. 11 Figure 7. Screenshot. FAST PMMS ............................................................................................. 14 Figure 8. Diagram. Data architecture for PSRC’s geospatial database ........................................ 18 Figure 9. Screenshot. SPC Congestion Management Corridor Web site ..................................... 22 Figure 10. Diagram. ICMS context diagram ................................................................................ 24 Figure 11. Screenshot. SF Bay Area 511 Web site ....................................................................... 28 Figure 12. Screenshot. 511 SF Bay available data feeds .............................................................. 29 Figure 13. Diagram. TravInfo open messaging service architecture and link status
information .............................................................................................................................. 30 Figure 14. Diagram. Data feeds to RITIS, which standardizes the data and presents them to
various user groups ................................................................................................................. 35 Figure 15. Diagram. Some of the tools available through RITIS for real-time and historic
data visualization, analysis, and sharing ................................................................................. 35 Figure 16. Diagram. RITIS data architecture ................................................................................ 37 Figure 17. Screenshot. RITIS demonstration snapshot of an incident timeline............................ 38 Figure 18. Screenshot. PeMS welcome screen ............................................................................. 41 Figure 19. Screenshot. PeMS main screen.................................................................................... 42 Figure 20. Screenshot. PeMS corridor module Alameda I-80 daily animation ............................ 43 Figure 21. Screenshot. PeMS departure time series on I-15 north southbound ............................ 44 Figure 22. Screenshot. PeMS lane requirement chart modeling on I-110 north in district 7 ....... 45 Figure 23. Screenshot. PeMS data clearinghouse ......................................................................... 46 Figure 24. Screenshot. PORTAL snapshot ................................................................................... 48 Figure 25. Diagram. TDAD architecture ...................................................................................... 51 Figure 26. Screenshot. Clarus user interface ................................................................................ 54 Figure 27. Screenshot. Clarus data on RITIS regional map ......................................................... 56 Figure 28. Screenshot. Graphic interpretation of weather data in RITIS ..................................... 57 Figure 29. Screenshot. UPlan user interface ................................................................................. 61 Figure 30. Diagram. High-level design of ITSDCAP................................................................... 66 Figure 31. Screenshot. Interface for performance measure estimation ........................................ 67 Figure 32. Diagram. Actively managed VDA Framework, which involves several
processes to make data fully usable ........................................................................................ 85
vii
LIST OF TABLES
Table 1. Roles and responsibilities for DRCOG’s RCTO data warehouse and performance reporting initiative ..................................................................................................................... 6
Table 2. ICMS interfacing systems and owner agencies .............................................................. 25 Table 3. TDAD data elements ...................................................................................................... 52 Table 4. TDAD data fusion techniques......................................................................................... 52 Table 5. Types of data consumers and applications ..................................................................... 74 Table 6. Data quality targets ......................................................................................................... 75 Table 7. ISO 19115 core metadata elements ................................................................................ 78 Table 8. MnDOT metadata element schedule............................................................................... 79 Table 9. Example of matching temporal and spatial resolutions of data to applications .............. 84
viii
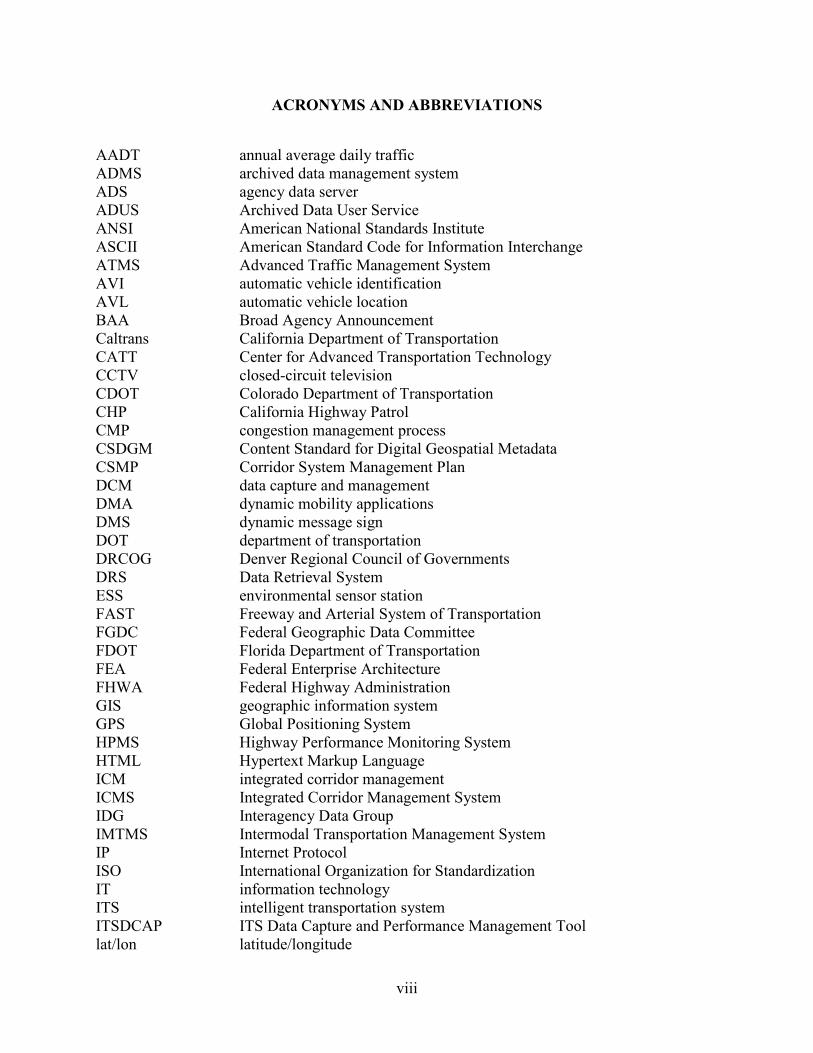
ACRONYMS AND ABBREVIATIONS
AADT annual average daily traffic ADMS archived data management system ADS agency data server ADUS Archived Data User Service ANSI American National Standards Institute ASCII American Standard Code for Information Interchange ATMS Advanced Traffic Management System AVI automatic vehicle identification AVL automatic vehicle location BAA Broad Agency Announcement Caltrans California Department of Transportation CATT Center for Advanced Transportation Technology CCTV closed-circuit television CDOT Colorado Department of Transportation CHP California Highway Patrol CMP congestion management process CSDGM Content Standard for Digital Geospatial Metadata CSMP Corridor System Management Plan DCM data capture and management DMA dynamic mobility applications DMS dynamic message sign DOT department of transportation DRCOG Denver Regional Council of Governments DRS Data Retrieval System ESS environmental sensor station FAST Freeway and Arterial System of Transportation FGDC Federal Geographic Data Committee FDOT Florida Department of Transportation FEA Federal Enterprise Architecture FHWA Federal Highway Administration GIS geographic information system GPS Global Positioning System HPMS Highway Performance Monitoring System HTML Hypertext Markup Language ICM integrated corridor management ICMS Integrated Corridor Management System IDG Interagency Data Group IMTMS Intermodal Transportation Management System IP Internet Protocol ISO International Organization for Standardization IT information technology ITS intelligent transportation system ITSDCAP ITS Data Capture and Performance Management Tool lat/lon latitude/longitude
ix
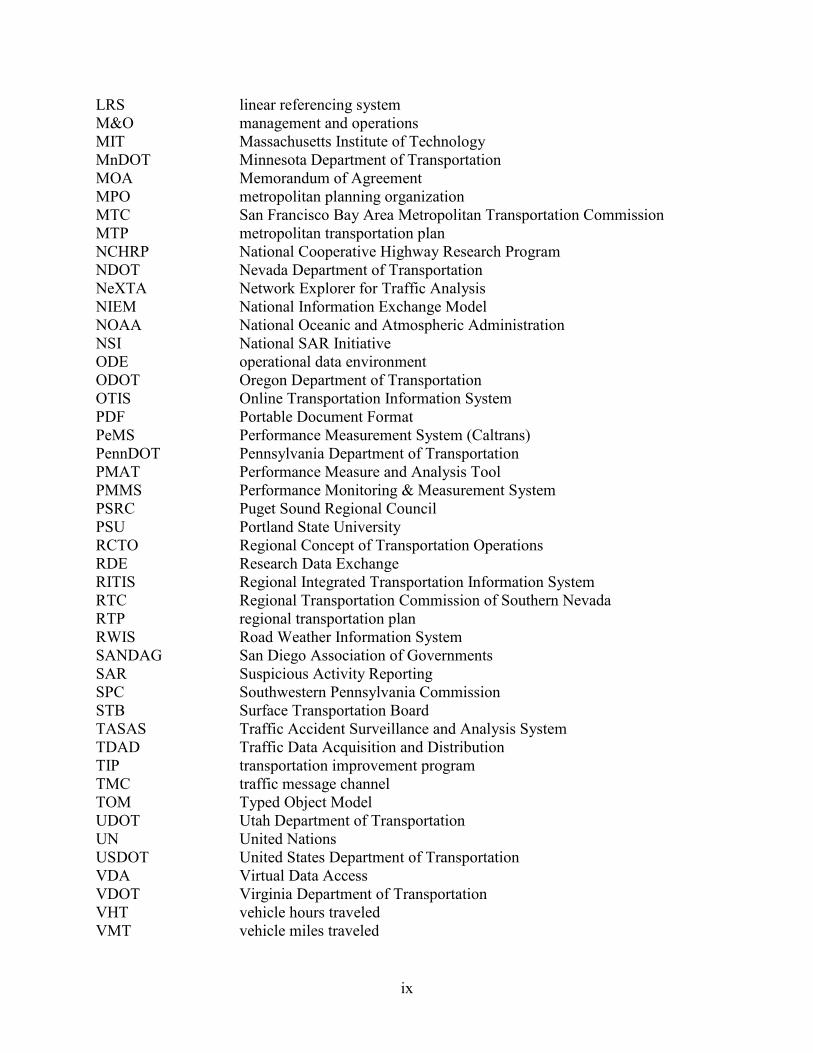
LRS linear referencing system M&O management and operations MIT Massachusetts Institute of Technology MnDOT Minnesota Department of Transportation MOA Memorandum of Agreement MPO metropolitan planning organization MTC San Francisco Bay Area Metropolitan Transportation Commission MTP metropolitan transportation plan NCHRP National Cooperative Highway Research Program NDOT Nevada Department of Transportation NeXTA Network Explorer for Traffic Analysis NIEM National Information Exchange Model NOAA National Oceanic and Atmospheric Administration NSI National SAR Initiative ODE operational data environment ODOT Oregon Department of Transportation OTIS Online Transportation Information System PDF Portable Document Format PeMS Performance Measurement System (Caltrans) PennDOT Pennsylvania Department of Transportation PMAT Performance Measure and Analysis Tool PMMS Performance Monitoring & Measurement System PSRC Puget Sound Regional Council PSU Portland State University RCTO Regional Concept of Transportation Operations RDE Research Data Exchange RITIS Regional Integrated Transportation Information System RTC Regional Transportation Commission of Southern Nevada RTP regional transportation plan RWIS Road Weather Information System SANDAG San Diego Association of Governments SAR Suspicious Activity Reporting SPC Southwestern Pennsylvania Commission STB Surface Transportation Board TASAS Traffic Accident Surveillance and Analysis System TDAD Traffic Data Acquisition and Distribution TIP transportation improvement program TMC traffic message channel TOM Typed Object Model UDOT Utah Department of Transportation UN United Nations USDOT United States Department of Transportation VDA Virtual Data Access VDOT Virginia Department of Transportation VHT vehicle hours traveled VMT vehicle miles traveled

x
WCO World Customs Organization WSDOT Washington State Department of Transportation XML eXtensible Markup Language
1
CHAPTER 1. INTRODUCTION
SUMMARY OF OVERARCHING PROJECT
In 2012, the Federal Highway Administration (FHWA) initiated a 3-year project entitled “Virtual Data Access (VDA) Framework” to develop a prototype framework for sharing planning and operations data between State and local transportation agencies from multiple sources within a region. The framework will bring together many types of transportation data to give planners and operators a multifaceted view of transportation performance both over time and by location. The purpose of the VDA Framework is to improve the breadth of available data and reduce the barriers to the use of those data so that transportation agencies across a region can advance their decisionmaking and performance reporting capabilities in the area of operations. Through greater access to data collected in a region, metropolitan planning organizations (MPOs) and State transportation departments will be better equipped to conduct performance management and performance-based planning and programming as emphasized in the Moving Ahead for Progress in the 21st Century Act.(1)
FHWA’s project focuses on using the VDA Framework to support planning for operations, including the use of data from the framework as input to planning for operations analysis and simulation tools. Planning for operations is a joint effort of planners and operators to integrate management and operations (M&O) strategies into the transportation planning process for the purpose of improving regional transportation system efficiency, reliability, and options. In addition, the data will be used to support reporting of operational performance measures.
The prototype framework will undergo a proof-of-concept test in the Kansas City region, where transportation operating and planning agencies have a high level of collaboration, a need for easily accessible integrated transportation operations data, and the capability to use those data for planning for operations. The framework is being developed in coordination with the proof-of-concept partners, the Mid-America Regional Council and Kansas City Scout, as well as other stakeholders from across the United States. To support the proof-of-concept test, the FHWA project team is developing a Performance Measurement and Analysis Tool (PMAT) that demonstrates one of the many options for using the integrated data from the VDA Framework. The PMAT will access public and private sources of data through the VDA Framework and calculate performance measures according to user-specified parameters. The performance measures will be displayed on a map of the region, in data tables, and in charts. The PMAT will be a map-based Web application that allows users to view travel time reliability and delay as well as traffic volume throughput on arterials and freeways and to extract calculated performance data in the form of geographic information system (GIS) shape files. In addition, users will be able to export the data to Network EXplorer for Traffic Analysis (NeXTA), an analysis, modeling, and simulation data hub that was developed by FHWA to support the exchange of data among multiple resolutions of analysis, modeling, and simulation tools. The data export from PMAT will support the analysis for operations strategies in a dynamic traffic assignment modeling tool as part of NeXTA.
2
The VDA Framework and PMAT are being developed using primarily open-source software and will be available to other regions to leverage. The results of the proof-of-concept test will be documented and shared as part of technology transfer webinars near the end of the project.
OBJECTIVES OF THE STATE-OF-THE-PRACTICE REVIEW
The purpose of this state-of-the-practice review was to lay both the technical and institutional foundation for all aspects of the VDA Framework. The review focused on current data-sharing and integration practices among State and local agencies, example data environments, technical integration formats, and business rules for integration and sharing. It will assist the project by establishing a basis of previous experiences that can be used in defining how the framework is designed in terms of data integration and sharing. The review will help in selecting the pilot areas to propose for the proof-of-concept tests of the VDA Framework.
RELATIONSHIP TO USE OF DATA IN PLANNING FOR OPERATIONS STATE-OF-THE-PRACTICE REVIEW
This report was developed in conjunction with the project’s state-of-the-practice review on the use of data for planning for operations. The planning for operations state-of-the-practice review identified the data used or needed to perform data-driven planning for operations activities and examined the planning for operations activities that currently use performance data. The planning for operations data review will be used to inform the framework design in terms of what data should serve as input to the framework to support planning for operations, whereas this report focuses on how agencies integrate and share that data from a technical and institutional perspective.
ORGANIZATION OF STATE-OF-THE-PRACTICE REPORT
This report examines current State and local agency practices with a focus on transportation planning and operations data. It examines the state of the practice in data sharing and integration, specifically (1) current data sharing and integration practices among State and local agencies, (2) example data environments, (3) technical integration formats, and (4) business rules for integration and sharing. For each of these topics, best practices, applicability to the data sharing framework, incorporation of functional requirements for existing systems, success factors, and gaps were investigated and documented.
3
CHAPTER 2. CURRENT INTEGRATION PRACTICES
This chapter identifies and discusses current State and local agency practices of collecting, sharing, integrating, and using transportation data across multiple organizations. The focus is transportation planning and operations data. To examine current practices, the study team conducted targeted outreach through the National Transportation Operations Coalition members via their e-newsletter and Transportation Research Board committees—such as the Regional Transportation Systems Management and Operations Committee—to ensure that all possible examples within the United States were captured. In addition, conversations were held with practitioners in several regions who were active in data integration and sharing to capture effective practices and obtain a better understanding of the qualifications of each region to be the potential subject of the proof-of-concept test.
DENVER, COLORADO
Effective Practices
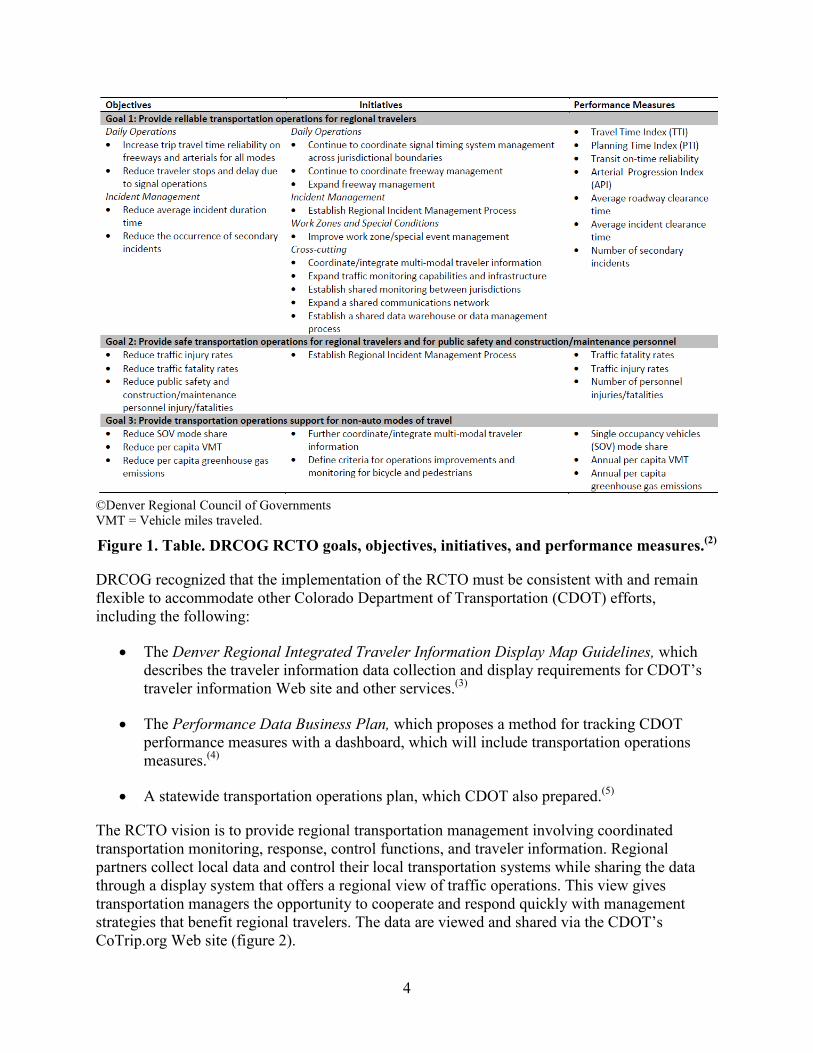
Regional Concept of Transportation Operations The Denver Regional Council of Governments (DRCOG) adopted the Regional Concept of Transportation Operations (RCTO), which describes a collaborative plan to improve operations performance across the region over the next 5 years.(2) This RCTO expands on the DRCOG Regional Transportation Operations Strategy—Action Plan. The RCTO presents a unified direction for transportation systems management and operations based on a holistic view of the whole region. It includes operations objectives and performance measures that can be used in the transportation planning process and specifies the roles and responsibilities of the partners in the collaborative effort. The goals, objectives, initiatives, and performance measures for the RCTO are presented in figure 1.
4
©Denver Regional Council of Governments VMT = Vehicle miles traveled.
Figure 1. Table. DRCOG RCTO goals, objectives, initiatives, and performance measures.(2)
DRCOG recognized that the implementation of the RCTO must be consistent with and remain flexible to accommodate other Colorado Department of Transportation (CDOT) efforts, including the following:
• The Denver Regional Integrated Traveler Information Display Map Guidelines, which describes the traveler information data collection and display requirements for CDOT’s traveler information Web site and other services.(3)
• The Performance Data Business Plan, which proposes a method for tracking CDOT performance measures with a dashboard, which will include transportation operations measures.(4)
• A statewide transportation operations plan, which CDOT also prepared.(5)
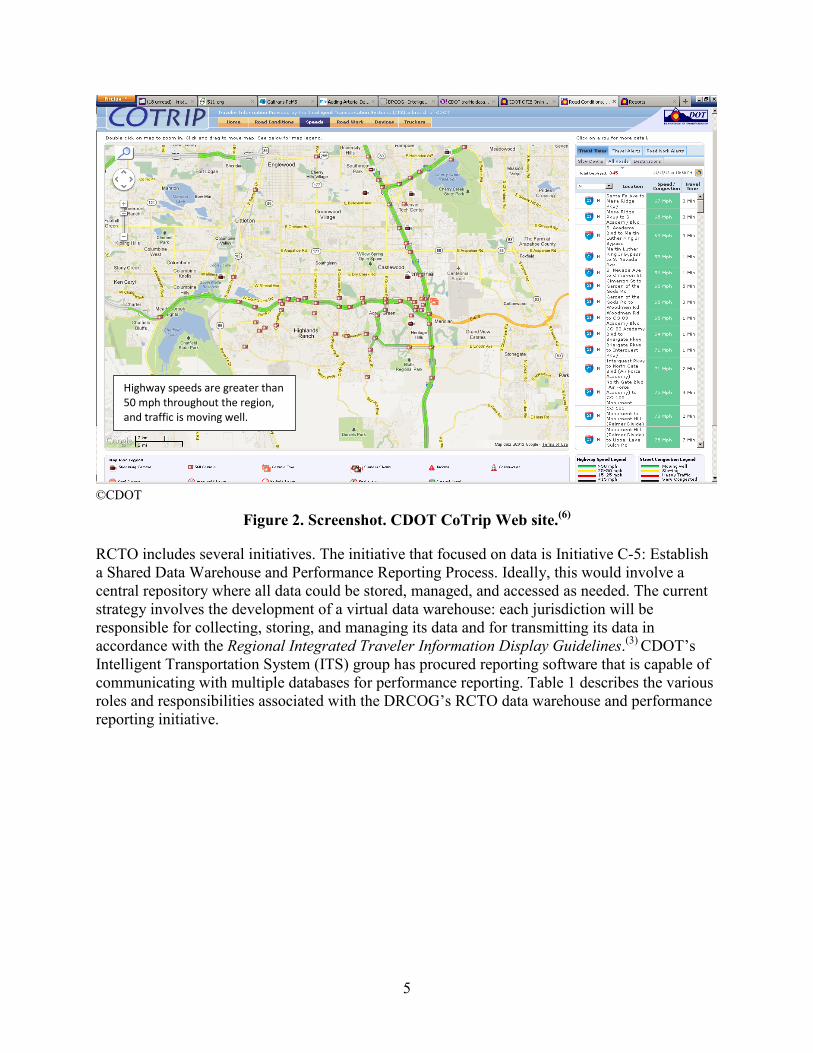
The RCTO vision is to provide regional transportation management involving coordinated transportation monitoring, response, control functions, and traveler information. Regional partners collect local data and control their local transportation systems while sharing the data through a display system that offers a regional view of traffic operations. This view gives transportation managers the opportunity to cooperate and respond quickly with management strategies that benefit regional travelers. The data are viewed and shared via the CDOT’s CoTrip.org Web site (figure 2).
5
©CDOT
Figure 2. Screenshot. CDOT CoTrip Web site.(6)
RCTO includes several initiatives. The initiative that focused on data is Initiative C-5: Establish a Shared Data Warehouse and Performance Reporting Process. Ideally, this would involve a central repository where all data could be stored, managed, and accessed as needed. The current strategy involves the development of a virtual data warehouse: each jurisdiction will be responsible for collecting, storing, and managing its data and for transmitting its data in accordance with the Regional Integrated Traveler Information Display Guidelines.(3) CDOT’s Intelligent Transportation System (ITS) group has procured reporting software that is capable of communicating with multiple databases for performance reporting. Table 1 describes the various roles and responsibilities associated with the DRCOG’s RCTO data warehouse and performance reporting initiative.
Highway speeds are greater than 50 mph throughout the region, and traffic is moving well.
6
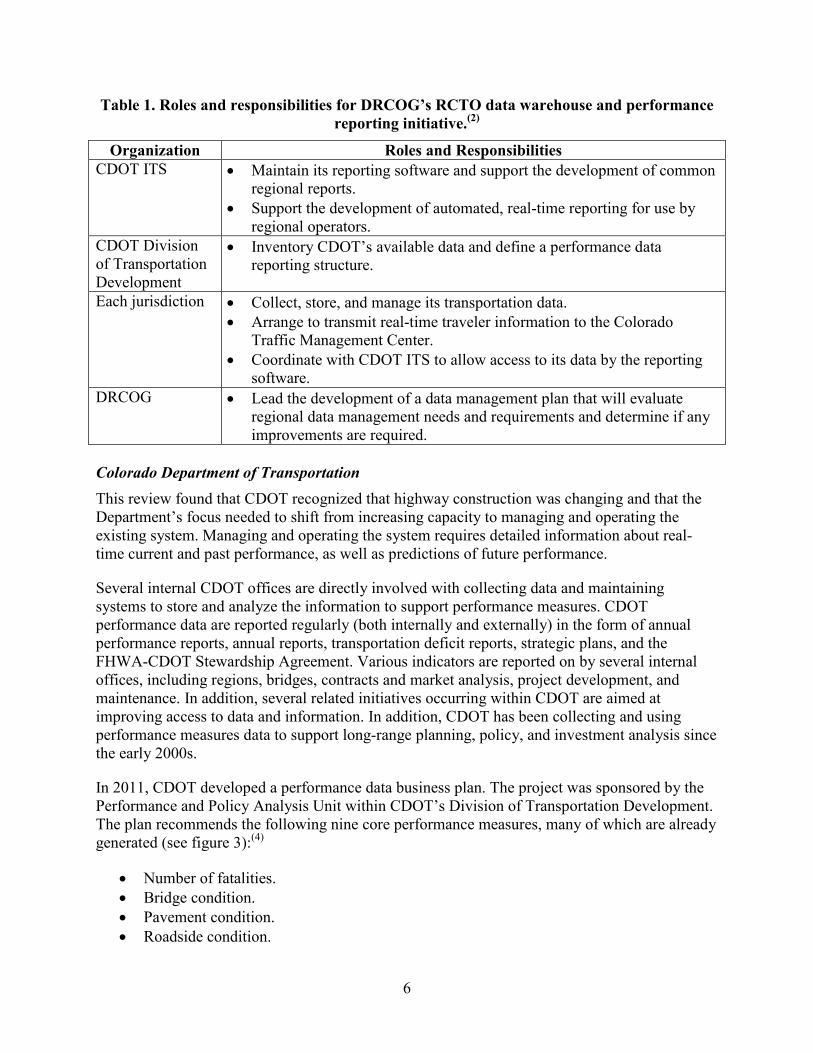
Table 1. Roles and responsibilities for DRCOG’s RCTO data warehouse and performance reporting initiative.(2)
Organization Roles and Responsibilities CDOT ITS • Maintain its reporting software and support the development of common
regional reports. • Support the development of automated, real-time reporting for use by
regional operators. CDOT Division of Transportation Development
• Inventory CDOT’s available data and define a performance data reporting structure.
Each jurisdiction • Collect, store, and manage its transportation data. • Arrange to transmit real-time traveler information to the Colorado
Traffic Management Center. • Coordinate with CDOT ITS to allow access to its data by the reporting
software. DRCOG • Lead the development of a data management plan that will evaluate
regional data management needs and requirements and determine if any improvements are required.
Colorado Department of Transportation This review found that CDOT recognized that highway construction was changing and that the Department’s focus needed to shift from increasing capacity to managing and operating the existing system. Managing and operating the system requires detailed information about real-time current and past performance, as well as predictions of future performance.
Several internal CDOT offices are directly involved with collecting data and maintaining systems to store and analyze the information to support performance measures. CDOT performance data are reported regularly (both internally and externally) in the form of annual performance reports, annual reports, transportation deficit reports, strategic plans, and the FHWA-CDOT Stewardship Agreement. Various indicators are reported on by several internal offices, including regions, bridges, contracts and market analysis, project development, and maintenance. In addition, several related initiatives occurring within CDOT are aimed at improving access to data and information. In addition, CDOT has been collecting and using performance measures data to support long-range planning, policy, and investment analysis since the early 2000s.
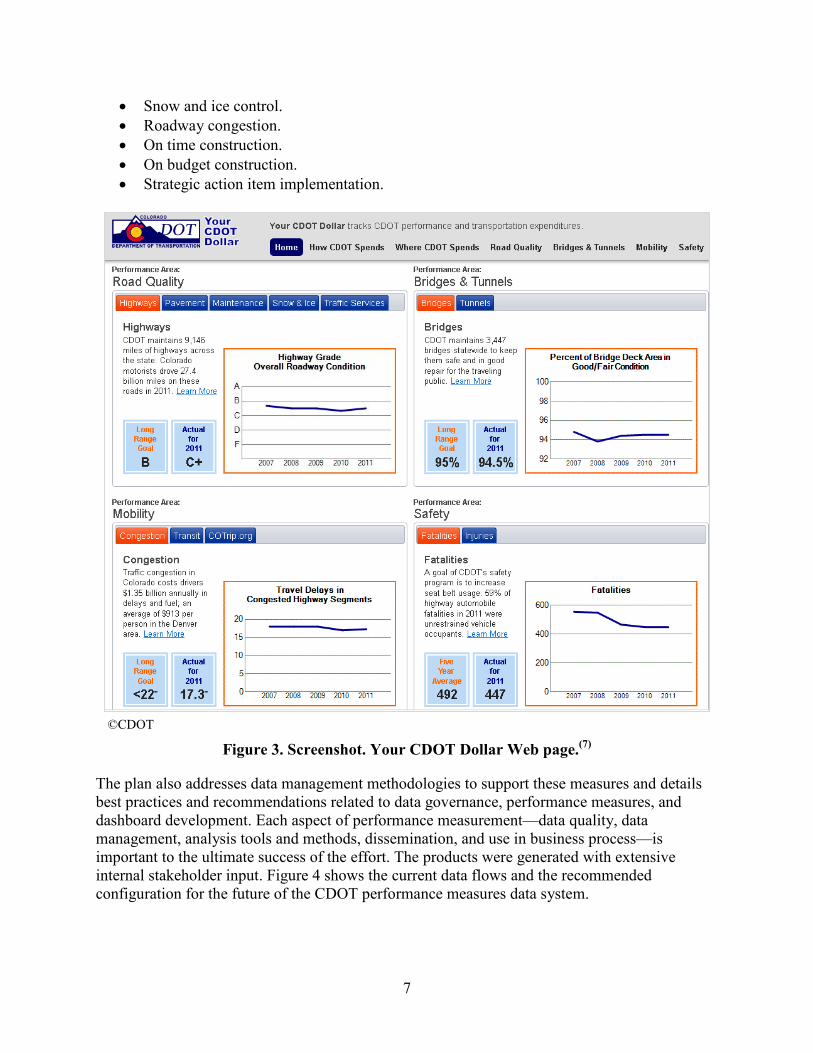
In 2011, CDOT developed a performance data business plan. The project was sponsored by the Performance and Policy Analysis Unit within CDOT’s Division of Transportation Development. The plan recommends the following nine core performance measures, many of which are already generated (see figure 3):(4)
• Number of fatalities. • Bridge condition. • Pavement condition. • Roadside condition.
7
• Snow and ice control. • Roadway congestion. • On time construction. • On budget construction. • Strategic action item implementation.
©CDOT
Figure 3. Screenshot. Your CDOT Dollar Web page.(7)
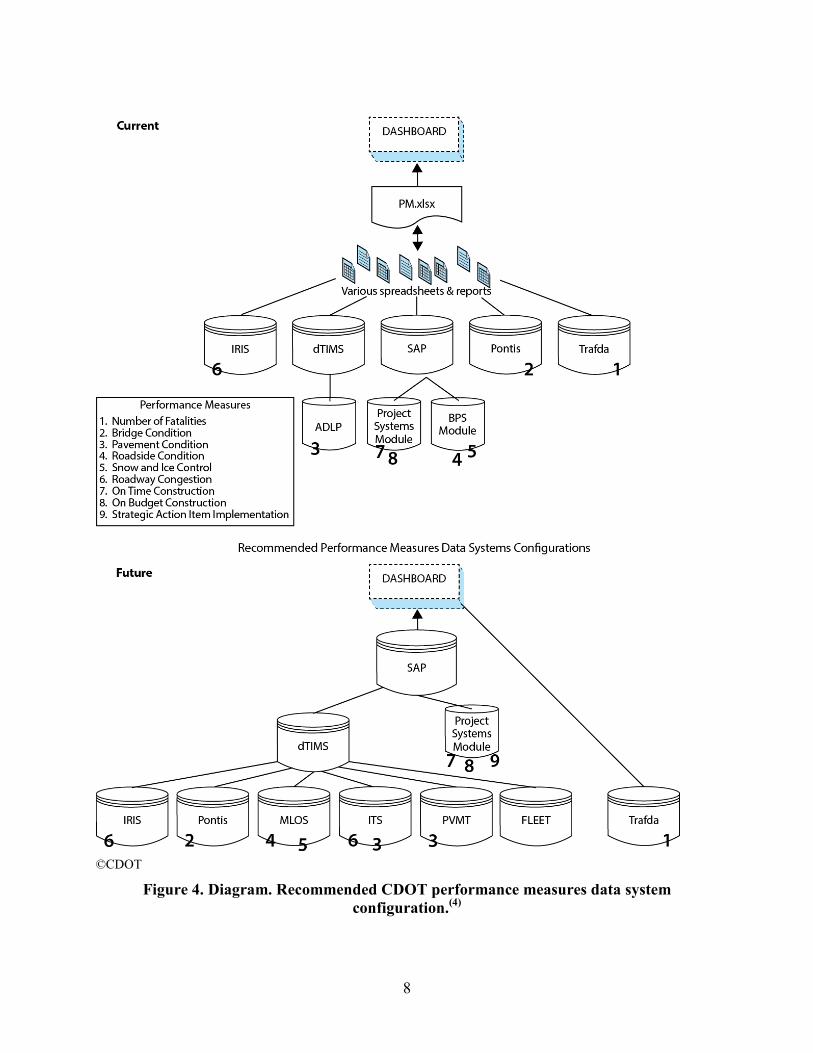
The plan also addresses data management methodologies to support these measures and details best practices and recommendations related to data governance, performance measures, and dashboard development. Each aspect of performance measurement—data quality, data management, analysis tools and methods, dissemination, and use in business process—is important to the ultimate success of the effort. The products were generated with extensive internal stakeholder input. Figure 4 shows the current data flows and the recommended configuration for the future of the CDOT performance measures data system.
8
©CDOT
Figure 4. Diagram. Recommended CDOT performance measures data system configuration.(4)
9
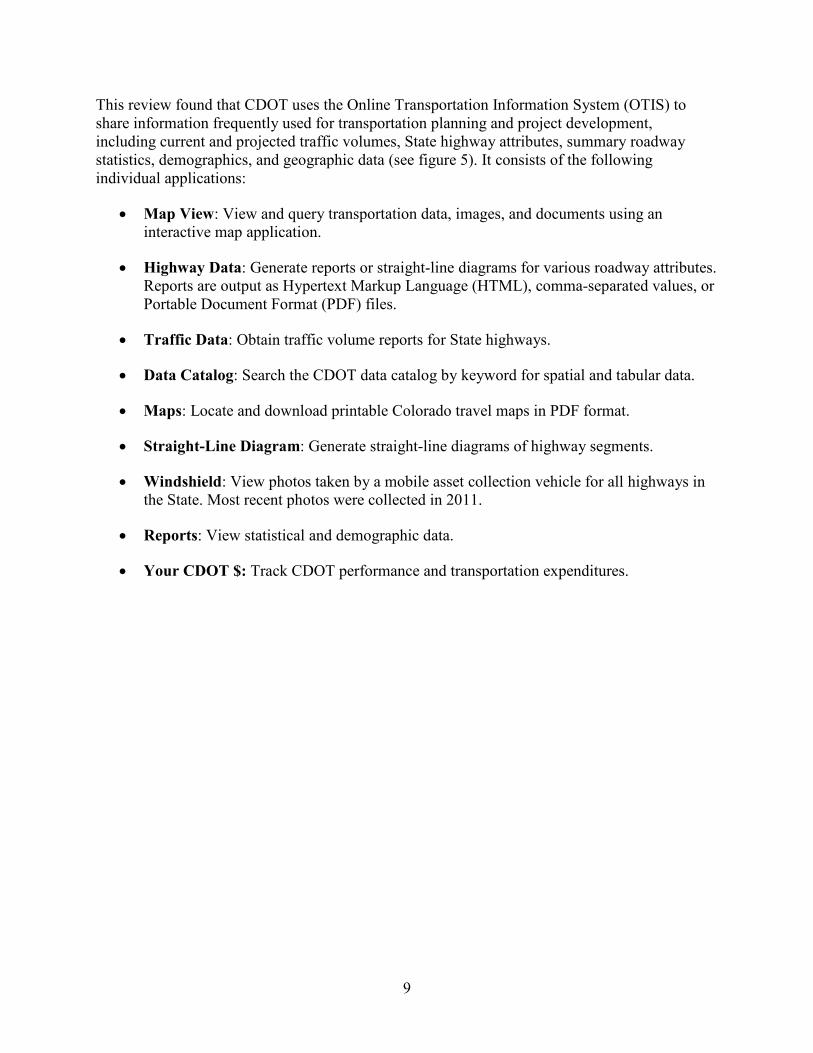
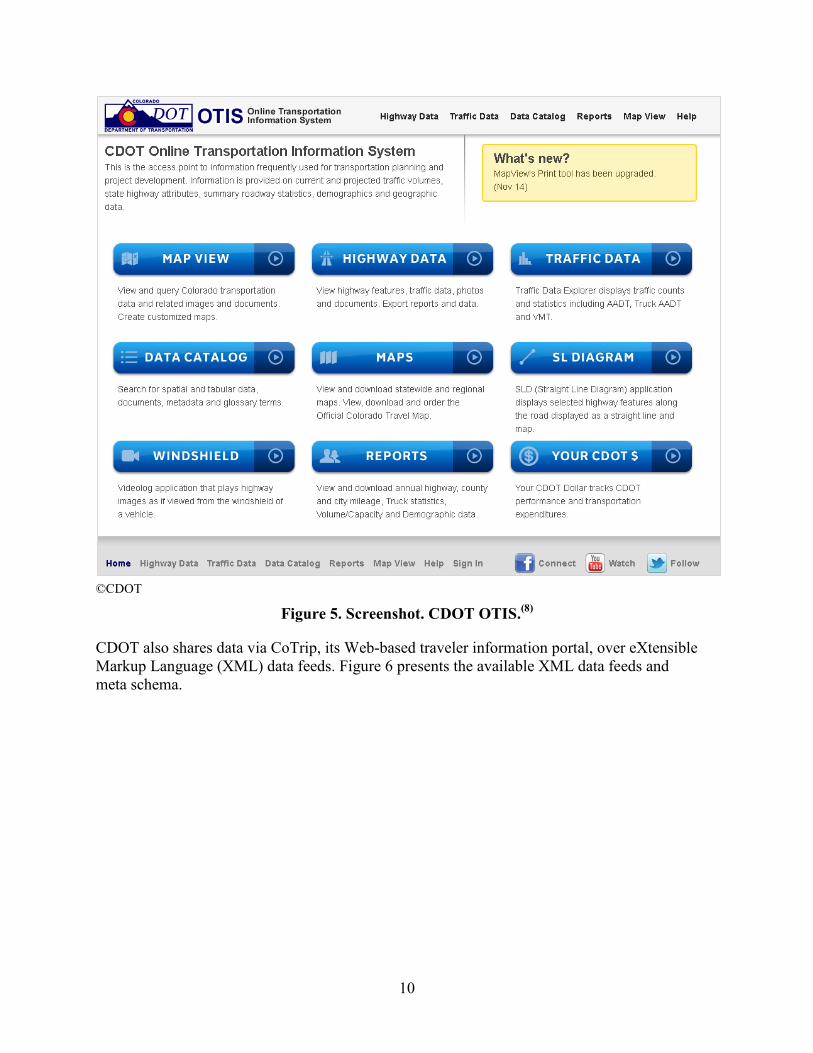
This review found that CDOT uses the Online Transportation Information System (OTIS) to share information frequently used for transportation planning and project development, including current and projected traffic volumes, State highway attributes, summary roadway statistics, demographics, and geographic data (see figure 5). It consists of the following individual applications:
• Map View: View and query transportation data, images, and documents using an interactive map application.
• Highway Data: Generate reports or straight-line diagrams for various roadway attributes. Reports are output as Hypertext Markup Language (HTML), comma-separated values, or Portable Document Format (PDF) files.
• Traffic Data: Obtain traffic volume reports for State highways.
• Data Catalog: Search the CDOT data catalog by keyword for spatial and tabular data.
• Maps: Locate and download printable Colorado travel maps in PDF format.
• Straight-Line Diagram: Generate straight-line diagrams of highway segments.
• Windshield: View photos taken by a mobile asset collection vehicle for all highways in the State. Most recent photos were collected in 2011.
• Reports: View statistical and demographic data.
• Your CDOT $: Track CDOT performance and transportation expenditures.
10
©CDOT
Figure 5. Screenshot. CDOT OTIS.(8)
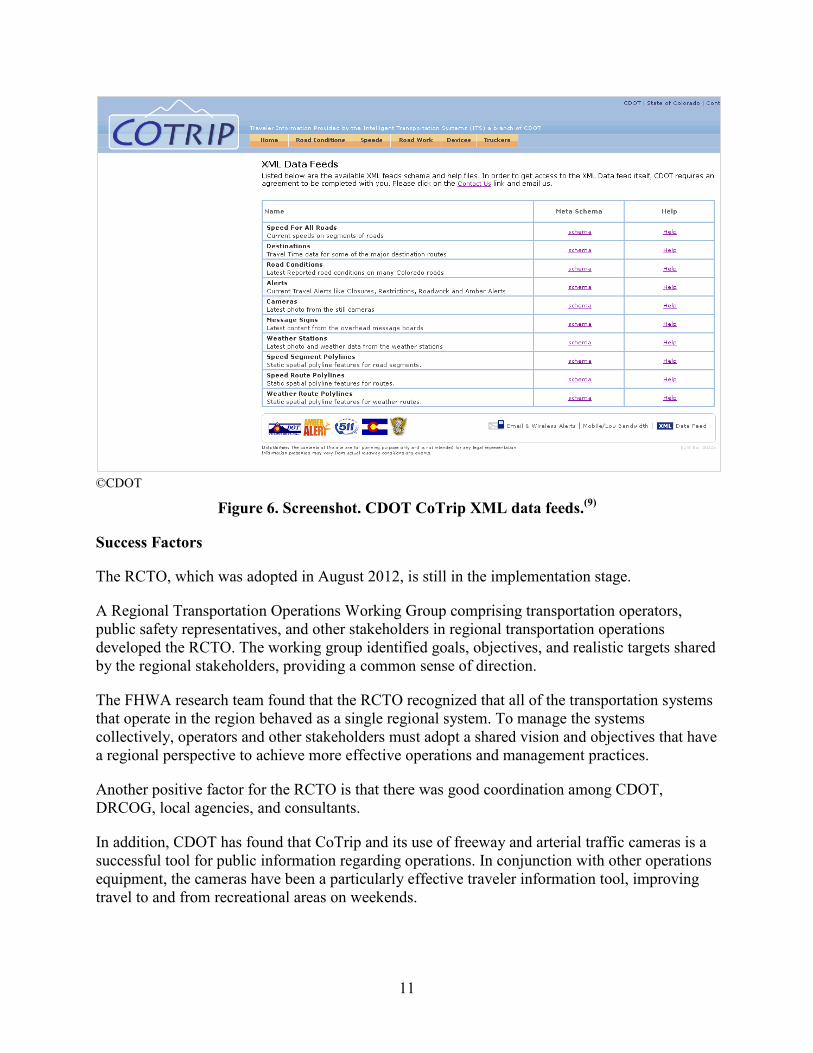
CDOT also shares data via CoTrip, its Web-based traveler information portal, over eXtensible Markup Language (XML) data feeds. Figure 6 presents the available XML data feeds and meta schema.
11
©CDOT
Figure 6. Screenshot. CDOT CoTrip XML data feeds.(9)
Success Factors
The RCTO, which was adopted in August 2012, is still in the implementation stage.
A Regional Transportation Operations Working Group comprising transportation operators, public safety representatives, and other stakeholders in regional transportation operations developed the RCTO. The working group identified goals, objectives, and realistic targets shared by the regional stakeholders, providing a common sense of direction.
The FHWA research team found that the RCTO recognized that all of the transportation systems that operate in the region behaved as a single regional system. To manage the systems collectively, operators and other stakeholders must adopt a shared vision and objectives that have a regional perspective to achieve more effective operations and management practices.
Another positive factor for the RCTO is that there was good coordination among CDOT, DRCOG, local agencies, and consultants.
In addition, CDOT has found that CoTrip and its use of freeway and arterial traffic cameras is a successful tool for public information regarding operations. In conjunction with other operations equipment, the cameras have been a particularly effective traveler information tool, improving travel to and from recreational areas on weekends.
12
Gaps and Lessons Learned
The Regional Transportation Operations Working Group established that the region lacked much of the data required to measure operations performance. In response, the RCTO specifically emphasizes collecting that data and establishing baselines.
Improved management of regional operations and collaboration in terms of infrastructure, staff, and data sharing is required.
Transportation systems operations data have many uses, including performance metrics for real-time operations and management, traveler information, and performance trends that assist operators and planners. To effectively use transportation data, all users must have access to it.
As part of the Strategic Highway Research Program 2 L05 case study effort, both the purchase of statewide private sector data and the development of a portable monitoring and detection system provided CDOT with useful sources of travel time reliability data and to fill data gaps in rural areas.
The CDOT Performance Data Business Plan: Final Report outlines CDOT’s strategy for improvement as follows:(4)
• Measure the right things, at a level of detail appropriate to their expected use.
• Take advantage of current technologies and tools for data collection, processing, and analysis.
• Make the best possible use of existing data and legacy systems.
• Enhance the tools over time to provide better decision support.
• Build the staff capability and commitment required to ensure quality information and analyses that are used to make decisions.
As part of another study on operations performance measures and planning trends, CDOT identified the following additional gaps:(10)
• Education and justification of operational strategies through performance results.
• Need for internal marketing of the availability of data and development of processes and tools for processing and sharing that data in a useful and usable way.
• Need to bridge the gap between ITS/operations (real time and short term) and planning (beyond the next year).
• More awareness, education, and methods to integrate operations into the planning process.
13
Applicability to the VDA Framework
The review found that CDOT, DRCOG, and other regional agencies in the Denver, CO, area were developing and implementing systems and processes for combining and sharing data from multi-agency/multijurisdictional sources to operate and manage the systems collectively.
LAS VEGAS, NEVADA
Effective Practices
The Las Vegas Freeway and Arterial System of Transportation (FAST) program has developed a data integration and archive platform and wants to share operations data broadly to support modeling. The review team found that FAST is one of the first truly integrated ITS organizations in the country, with the Regional Transportation Commission of Southern Nevada (RTC) acting as the official administrator. The Nevada Department of Transportation (NDOT) and the RTC are full-fledged funding partners, contributing to the operations and management of FAST. The Operations Management Committee—comprising representatives from the RTC; Clark County; NDOT; and the cities of Henderson, Las Vegas, and North Las Vegas—set the transportation strategies. The FAST system is composed of two major divisions: the Arterial Management Section and the Freeway Management Section.
FAST monitors and controls traffic. Traffic monitoring is accomplished using video image detection and inductive loop detection with visual verification through closed-circuit television (CCTV) cameras. Traffic signals, ramp meters, dynamic message signs (DMSs), and lane-use-control signals are used for traffic control.
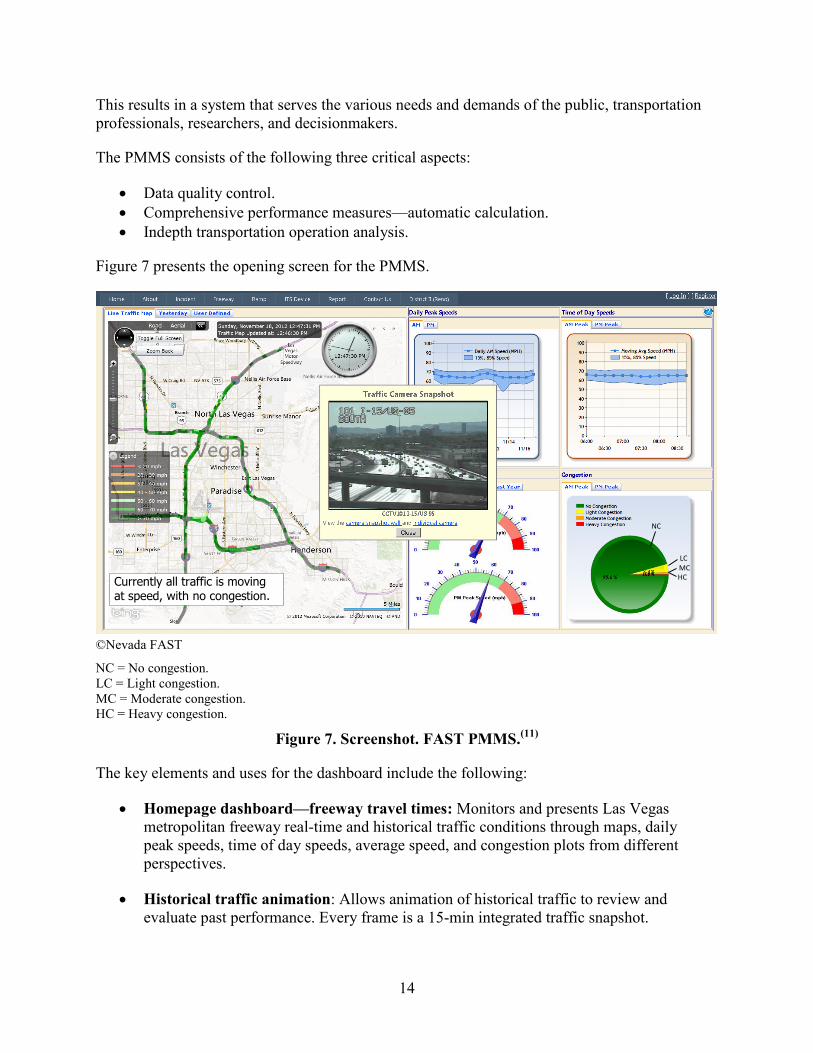
FAST implemented a performance dashboard and data archive to help monitor the system as well as report performance. This Performance Monitoring & Measurement System (PMMS) was developed and written by in-house RTC FAST staff. It consists of a Web-based user interface (i.e., the dashboard) and is open to interested parties and the public to obtain real-time and historical freeway network monitoring and performance information in a wide variety of user-selectable and user-customizable displays. PMMS compiles and processes the enormous storehouse of raw data automatically gathered by NDOT’s freeway ITS, Nevada Highway Patrol dispatchers’ incident-specific data points, and other information generated by FAST’s technicians. Through this data integration, PMMS does the following:
• Develops charts and graphs showing trends and report cards on freeway performance.
• Enables the user to quantitatively characterize the discrete traffic flows.
• Provides basic travel time-related information for the public.
• Computes the magnitude of traffic delays experienced for various alternative study scenarios.
• Is a source for meaningful transportation information.
14
This results in a system that serves the various needs and demands of the public, transportation professionals, researchers, and decisionmakers.
The PMMS consists of the following three critical aspects:
• Data quality control. • Comprehensive performance measures—automatic calculation. • Indepth transportation operation analysis.
Figure 7 presents the opening screen for the PMMS.
©Nevada FAST
NC = No congestion. LC = Light congestion. MC = Moderate congestion. HC = Heavy congestion.
Figure 7. Screenshot. FAST PMMS.(11)
The key elements and uses for the dashboard include the following:
• Homepage dashboard—freeway travel times: Monitors and presents Las Vegas metropolitan freeway real-time and historical traffic conditions through maps, daily peak speeds, time of day speeds, average speed, and congestion plots from different perspectives.
• Historical traffic animation: Allows animation of historical traffic to review and evaluate past performance. Every frame is a 15-min integrated traffic snapshot.
NC
LC MC HC Currently all traffic is moving
at speed, with no congestion.
15
• Corridor: Sets up a series of nodes and divides Las Vegas metropolitan freeways into corridors and sub-corridors, which helps travelers and professionals follow specific freeway segments.
• Field device: Includes NDOT- and FAST-implemented radar or loop detectors spaced at about .03-mi intervals along the urban freeway in the Las Vegas metropolitan area. Detection data available include traffic speed, volume, occupancy, and classified volumes by vehicle lengths, which are the major sources to monitor and evaluate freeway performance.
• Ramp meters: Includes NDOT and FAST installed and operated ramp meters at major interchange on ramps. Most are operating in traffic-responsive mode from 6 to 9 a.m. and 1:30 to 6:00 p.m. Ramp volumes are collected by video or loop detection around the stop bar.
• Historical incidents: Allows FAST Traffic Management Center operators to monitor and report incidents to the public. Traffic Management Center operators record which lanes are blocked, tow truck arrival time, and lane clearance time. This information is critical for traffic impact studies and incident clearance evaluation.(12)
Success Factors
The success of FAST is a direct function of the main objectives that FAST’s software designers used to guide the development of PMMS. These include the following:
• Provide a comprehensive performance measurement system, data quality control procedure, and archived data for State and local agencies.
• Provide the ability to monitor, track, and report freeway traffic congestion level and travel reliability trends on a regional scale using archived data.
• Support calibration and maintenance of the field ITS equipment to ensure complete, accurate, and confident analyses of raw data.
• Compile and processes raw data into understandable and meaningful information for use by different user groups.
• Improve the number, richness, and quality of traveler information services.
• Provide a tool that can quantitatively assess accidents, construction, and special events.
• Provide the ability to extract and identify congestion both temporally and/or spatially.
• Provide the ability to extract and characterize normal traffic flow for typical day groups (e.g., Monday through Thursday, Friday, weekends, and holidays).
• Enhance the visibility of roadway performance measures and reporting for the public, transportation professionals, and decisionmakers.
16
• Provide data support for continued deployment of ITS infrastructure throughout NDOT’s complete freeway traffic network in southern Nevada.
• Help in allocating resources and prioritizing implementation from an operation’s improvement perspective.
• Evaluate the effectiveness of a variety of operational strategies (both conceptual and post-implementation), thus improving their accountability to the public and decisionmakers, and helping to derive accurate and defensible benefit-cost ratios.
Gaps and Lessons Learned
It is a NDOT priority for all corridors in the Las Vegas valley and between Las Vegas and the Nevada/California State line to be equipped with full ITS deployments. RTC/FAST does not have a formal process to identify corridors for operations investments, established methods for selecting operations projects, or the use of data to support performance-based planning. Currently, NDOT relies on program staff knowledge of investment needs, such as knowing what ITS/operations equipment are needed on corridors and identified needs based on Traffic Management Center operator observations. These are gaps NDOT wants to fill over time or is addressing now as it continues to educate and share the information and data.
FAST program staff members have developed an operations project assessment process to assess implemented projects, trends, and incident situations using performance data and have started a quarterly report, now at the anecdotal level, to test different data, performance metrics, and formats. FAST plans to establish targets once the staff completes more data processing to form a system-level benchmark. Program staff members stated that they wanted to be realistic in setting the targets and try to improve those issue areas. FAST also anticipates using performance goals and targets to help determine staffing needs with their next contract with NDOT.
Applicability to the VDA Framework
FAST was one of the first truly integrated ITS organizations in the country, with data integrated and shared among RTC; NDOT; Clark County; the cities of Henderson, Las Vegas, and North Las Vegas; and the Nevada Highway Patrol. The FAST interactive dashboard was developed by in-house staff and is being maintained and improved continuously. It has many of the data elements and data processing capabilities useful in planning for operations and encourages the use of the data for a variety of purposes, such as input and validation for simulation and modeling tools.
SEATTLE, WASHINGTON
Effective Practices
A leader in planning for operations, the Puget Sound Regional Council (PSRC) spends a lot of resources on compiling and analyzing information about the transportation system, demographics, economy, and land use patterns. PSRC generally collates data from other agencies rather than collecting information itself. Many agencies in the region expend significant resources on collecting data, and much of those data contribute in some way to PSRC’s
17
Transportation 2040 Monitoring: Congestion and Mobility Report, which serves as an update of the region’s congestion management process (CMP).(13) PSRC uses the information in this report as a tool for monitoring system performance related to congestion and mobility. The report establishes a regional network of transportation facilities that will be monitored, including 12 regional subareas, called “SMART Corridors.” Existing condition data are provided for freight, transit, automobile, bicycle, and pedestrian facilities, as well as for safety and security issues and special needs transportation. It also includes pavement and bridge condition.
The Washington State Department of Transportation (WSDOT) supplies a large amount of information necessary to support the report, and it also collects some traffic count data through the Highway Performance Monitoring System (HPMS) on non-State routes. PSRC collates arterial traffic count data from 20 to 30 member jurisdictions. Regular outreach is performed to see where traffic counts are being collected and to obtain that data. The arterials identified by PSRC’s Regional Transportation Operations Committee are used to define the geographic foundation for the arterial count data obtained from member agencies. PSRC is working to coordinate this with the local data to identify gaps in arterial detection.
Beyond the data in the Transportation 2040 report, PSRC is actively pursuing additional data to support performance monitoring across the region. The council acquires data at the regional level, sub-area level, and SMART corridor level.(13)
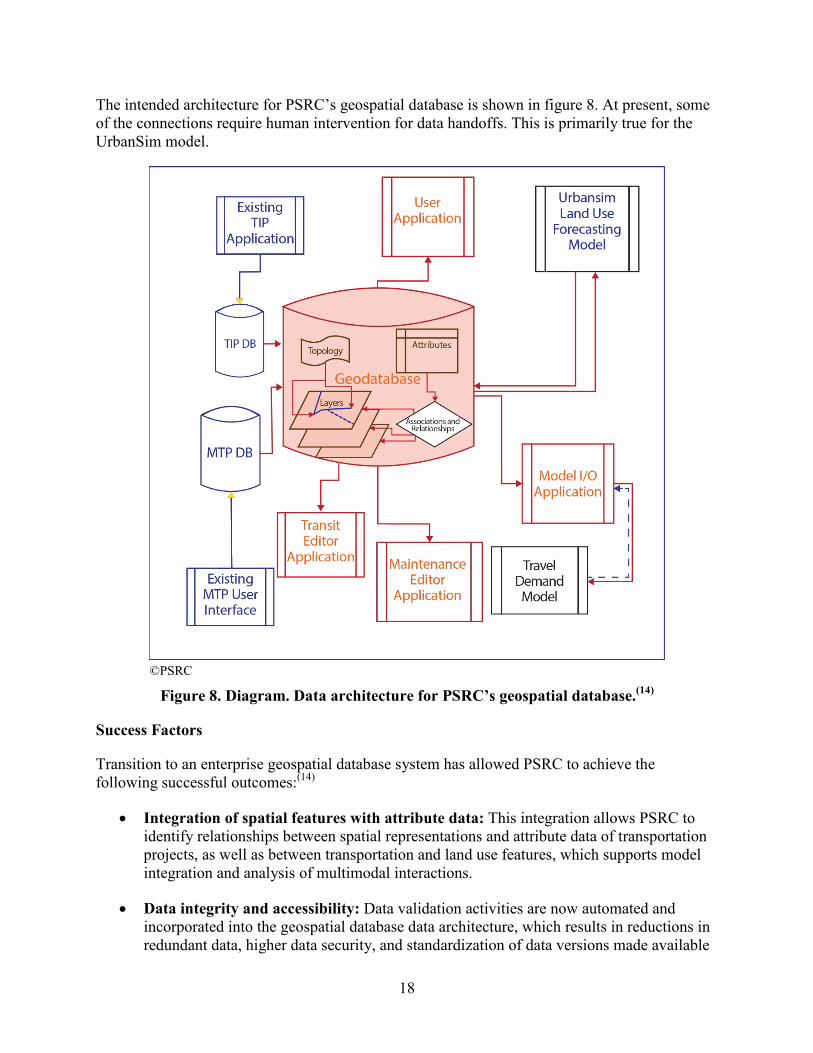
To support planning analyses, PSRC integrated its demographic, transportation demand, and land development modeling processes through implementation of a geospatial database data architecture. PSRC transitioned from a GIS based on proprietary spatial data “coverage” layers, in which attributes were accessed from separate databases maintained by several divisions within the agency, to a geospatial database data architecture in which spatial features and their attributes are maintained in indexed table records inside a single relational database management system. The PSRC regional integrated modeling system consists of the following elements:
• The geospatial database, which contains spatial data layers and feature and layer interaction relationships for the basic transportation network.
• The metropolitan transportation plan (MTP) database, which contains metropolitan transportation planning projects that may be included in Transportation 2040 or other plans.(13)
• The Transportation Improvement Program (TIP) database, which contains transportation improvement project applications competing for funding through the PSRC. While the TIP and MTP databases are maintained outside the geospatial database structure, the geospatial database maintains direct connection to them and accesses them as business tables.
• Several applications that are informed by the geospatial database, including the maintenance editor, transit editor, and model input/output application, which produces model network files from the geospatial database and user specification for direct integration into a travel demand model run.
18
The intended architecture for PSRC’s geospatial database is shown in figure 8. At present, some of the connections require human intervention for data handoffs. This is primarily true for the UrbanSim model.
©PSRC
Figure 8. Diagram. Data architecture for PSRC’s geospatial database.(14)
Success Factors
Transition to an enterprise geospatial database system has allowed PSRC to achieve the following successful outcomes:(14)
• Integration of spatial features with attribute data: This integration allows PSRC to identify relationships between spatial representations and attribute data of transportation projects, as well as between transportation and land use features, which supports model integration and analysis of multimodal interactions.
• Data integrity and accessibility: Data validation activities are now automated and incorporated into the geospatial database data architecture, which results in reductions in redundant data, higher data security, and standardization of data versions made available
19
to agency staff. The geospatial database serves as a central repository and robust platform for integrated data.
• Support for framework standards: Moving to an object-relational data model was necessary to adhere to new standards in the field of geospatial data management, which frequently require object-entity relationships. The framework standards will enhance data sharing among agencies in the Puget Sound region and potentially reduce data collection costs.
• Customization of data schema: PSRC business needs were evaluated through many use cases, which allowed PSRC to customize its data design to fit those needs.
• Maintenance and update enhancement: The enterprise geospatial database allows multi-user editing, which has been critical in developing the maintenance editor application and enhancing data integrity.
Gaps and Lessons Learned
PSRC has a cooperative data gathering and sharing environment, but the staff realized that they needed to take up the topic more formally with their member agencies. As a result, they created the Interagency Data Group (IDG), which focuses on advancing data sharing among transportation agencies in the region. The purpose of the group is to “coordinate and share, when possible, existing transportation system performance data, measures and indicators” to support improved multimodal and freight mobility analysis in the central Puget Sound region.(15) The IDG maintains the following data-sharing tools:
• A data catalog, which contains a description, contact information, and access instructions for congestion and mobility data resources in the region. The data catalog is in Microsoft® Excel spreadsheet format that includes the following types of data: traffic, economic, nonmotorized, freight, demographic, ferry, park and ride, transit, commute trip reduction, safety, road, parking, and vanpool. It was initially compiled from a survey of more than 400 transportation professionals throughout the Puget Sound region as well as internal resources, and it is updated as needed.
• A monthly trends report (http://www.psrc.org/data/trends), which frequently includes performance information on transportation system performance.(16)
Applicability to the VDA Framework
PSRC’s enterprise geospatial database provides a foundation for data integration and applications that bring data together in a user-friendly mapping interface. It also serves as a tool for data query, analysis, and editing. Issues and lessons learned regarding data migration, data conversion, legacy data issues, data development, and agencywide data integration are relevant to the development of the framework.
20
PITTSBURGH, PENNSYLVANIA
Effective Practices
The Southwestern Pennsylvania Commission (SPC) conducts an extensive data collection effort on a regular basis to support the analysis and evaluation of management and operations strategies as part of the CMP. To provide the necessary tools to assist with decisionmaking, SPC uses GIS tools and the ArcGIS™ Flex Viewer application to integrate various types of data into a common database and makes that database available online for use by staff, local governments, and planning partners. The following are examples of successful data integration efforts by SPC to support performance monitoring and data analysis for the CMP:
• SPC’s Traffic Signal Asset Management Database is updated as new signals are installed. It is being enhanced with detailed information from a catalog of scanned permit drawings. The Pennsylvania Department of Transportation (PennDOT) District Office can login to the online database to access map and data files to support projects and signal maintenance. PennDOT Central Office staff, other MPOs, and local governments also have access to the database.
• To support project evaluation and prioritization, detailed project information from the region’s TIP and long-range transportation and economic development plans is integrated with data from PennDOT’s Roadway Management System, Bridge Management System 2, and Crash Data Analysis Retrieval Tool. Projects are also compared against existing environmental features and conditions to support National Environmental Policy Act planning.(17) Projects are weighed against demographic and economic data to determine benefits as part of SPC’s environmental justice strategy.
• Traffic count data from the region’s HPMS, Traffic Monitoring System, and additional counts to aid SPC’s congestion management and traffic signal programs are mapped in GIS format. SPC has integrated count data with information from the Pennsylvania Department of Environmental Protection on the locations of permitted and drilled natural gas wells in the region to provide insight on change in vehicle traffic in these areas. SPC plans to make traffic count data available to staff, planning partners, and the general public via a Web-based database with mapping capabilities.
• Data on existing recreation and open-space areas are integrated with demographics for population centers to identify linkages between open spaces and the roads and trails that support bicycle and pedestrian movement. These data support identification of possible future projects for communities and transit providers.
• Data on population, housing, and employment characteristics within the local catchment areas of transit-oriented development in the region were evaluated for proximity to existing fixed transit routes, stops, and facilities, and the distances to park-and-ride lots and potential transfer points were calculated. This evaluation allows transit providers to evaluate future ridership while examining demographics to maintain compliance with Federal mandates and identifying potential projects for inclusion in SPC’s 2040 Transportation and Development Plan for Southwestern Pennsylvania.(18)
21
• SPC also maintains a geospatial catalog of the region’s built and natural infrastructure to support transportation and economic development projects and plans. For example, SPC is currently developing a comprehensive asset database of local bridges whose lengths range from 4 to 20 ft that are not included in the State’s inventory of bridges. SPC has located, inventoried, photographed, and digitized more than 2,600 bridges. Users can view bridge locations, their attributes, and photographs of each bridge via a Web-based map viewer.
Success Factors
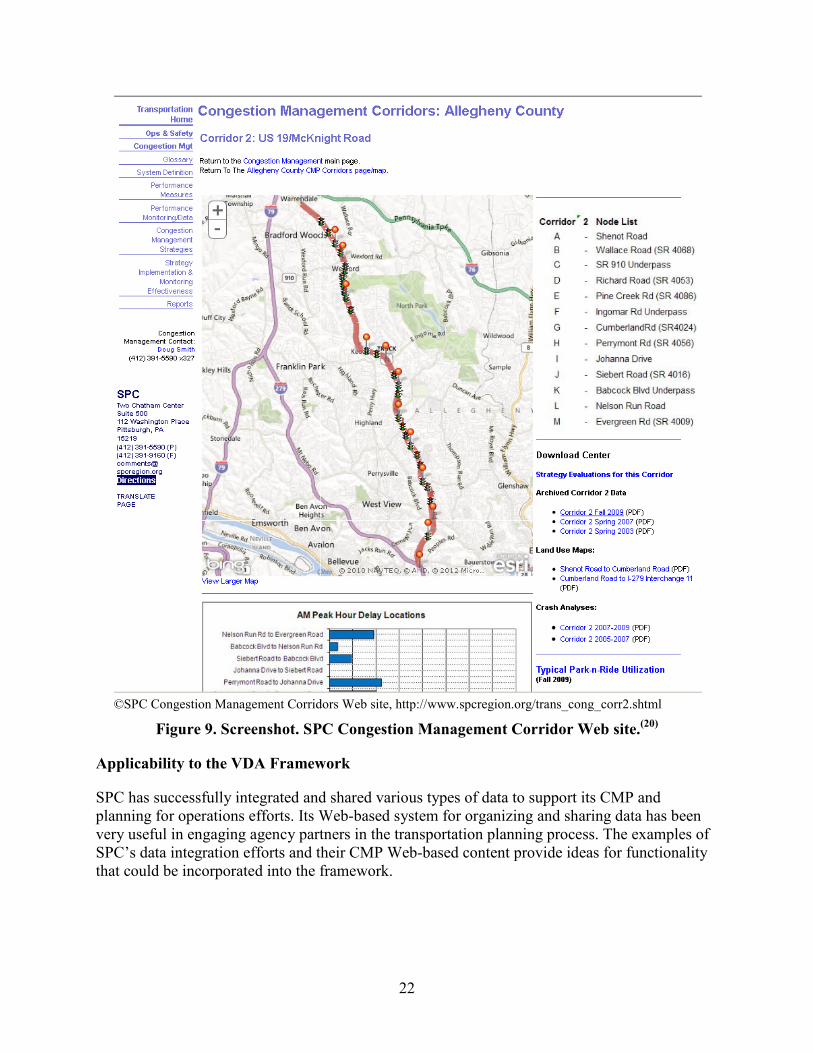
To promote data sharing, SPC makes all information related to the CMP available on its Web site, including a description of the CMP, description of the data collection process and performance measure calculation methods, current and archived data, maps for each CMP corridor, case studies of implemented strategies, and copies of the old paper-based CMP reports. As shown in figure 9, users can select individual CMP corridors to view a detailed map and performance measure results for travel time, speed, and delay. Links are provided to view congestion strategy evaluations for the corridor, archived data and maps from previous CMP reports, land use maps, historical crash information, typical park-and-ride utilization, PennDOT highway video log data, and private sector traffic data for the corridor.
SPC also maintains a data library where users can download data, maps, and other information pertaining to the southwestern Pennsylvania region. Specialized and custom data are also available through the online data store.
Gaps and Lessons Learned
A recent case study documented the following gaps and lessons learned for SPC:(19)
• One of SPC’s biggest challenges has been engaging outside partners in the CMP process. Many State and local government partners currently view the CMP as an obstacle to funding/implementing new projects, rather than a value-added service. SPC’s Web-based system has been partly successful in resolving this issue (e.g., the PennDOT traffic engineering staff often uses the CMP as a data reference).
• SPC staff members noted that there was currently a lack of available transit operations data from all 10 regional transit agencies. The commission is currently developing a regional transit smartcard program that may enable better collection and coordination of transit data in the future for use in the CMP.
• No simulation and analysis tools are currently used to evaluate M&O strategies. Rather, SPC uses field-collected data to evaluate the performance results of individual strategies following implementation, specifically through before and after studies.
22
©SPC Congestion Management Corridors Web site, http://www.spcregion.org/trans_cong_corr2.shtml
Figure 9. Screenshot. SPC Congestion Management Corridor Web site.(20)
Applicability to the VDA Framework
SPC has successfully integrated and shared various types of data to support its CMP and planning for operations efforts. Its Web-based system for organizing and sharing data has been very useful in engaging agency partners in the transportation planning process. The examples of SPC’s data integration efforts and their CMP Web-based content provide ideas for functionality that could be incorporated into the framework.
23
SAN DIEGO, CALIFORNIA
Effective Practices
The San Diego Association of Governments (SANDAG) has increasingly used archived data for planning purposes and worked closely with the California Department of Transportation (Caltrans), local cities, and the transit agencies. It has excellent models and arterial information because of integrated corridor management (ICM) and corridor system management plan projects. Much of the planning for operations and the associated data and analysis tools/methods are described in the companion report, Data Use in Planning for Operations: State of the Practice Review, and consequently that information is not repeated in detail here.(21)
The region has one model that all of the agencies use. SANDAG supports the State, county, cities, and other transportation agencies to add detail based on needs. Direct connections to the model are available to Caltrans so the agency can login remotely and run the model for its purposes. Cities and other interested parties can contract for analyses through the SANDAG service bureau. This provides consistency in the numbers, analysis approach, and results.
The regional arterial management system also uses the same software to enable multi-agency signal coordination. Using the same platform supports the entire region. If new TMSs come online, regional ITS architecture and standards are followed to ensure consistency and coordination.
The SANDAG Demographics and Other Data Web site allows interested parties to obtain a tremendous quantity of demographic, economic, land use, transportation, and criminal justice information about the San Diego region.(22) One element is the average daily traffic volumes count data. Each year, local jurisdictions and Caltrans collect traffic count data on significant roadways, State freeways, and highways, and SANDAG compiles this information to present average weekday traffic counts as two-way, 24-h volumes.
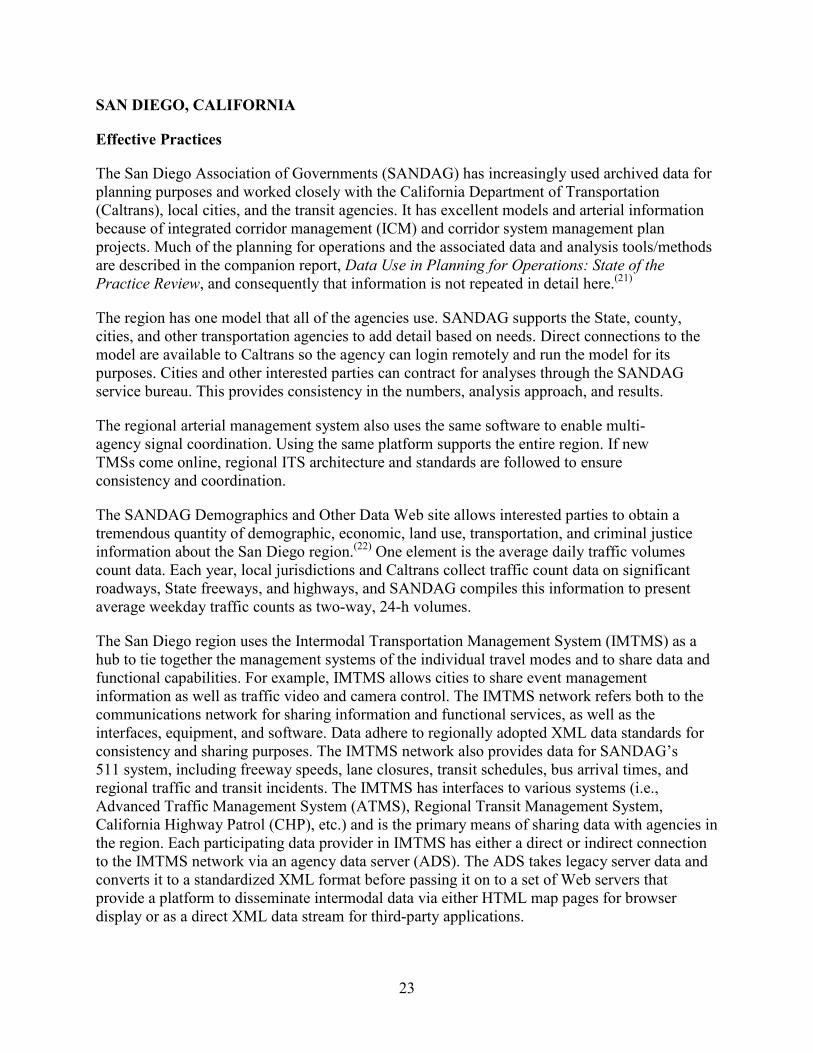
The San Diego region uses the Intermodal Transportation Management System (IMTMS) as a hub to tie together the management systems of the individual travel modes and to share data and functional capabilities. For example, IMTMS allows cities to share event management information as well as traffic video and camera control. The IMTMS network refers both to the communications network for sharing information and functional services, as well as the interfaces, equipment, and software. Data adhere to regionally adopted XML data standards for consistency and sharing purposes. The IMTMS network also provides data for SANDAG’s 511 system, including freeway speeds, lane closures, transit schedules, bus arrival times, and regional traffic and transit incidents. The IMTMS has interfaces to various systems (i.e., Advanced Traffic Management System (ATMS), Regional Transit Management System, California Highway Patrol (CHP), etc.) and is the primary means of sharing data with agencies in the region. Each participating data provider in IMTMS has either a direct or indirect connection to the IMTMS network via an agency data server (ADS). The ADS takes legacy server data and converts it to a standardized XML format before passing it on to a set of Web servers that provide a platform to disseminate intermodal data via either HTML map pages for browser display or as a direct XML data stream for third-party applications.
24
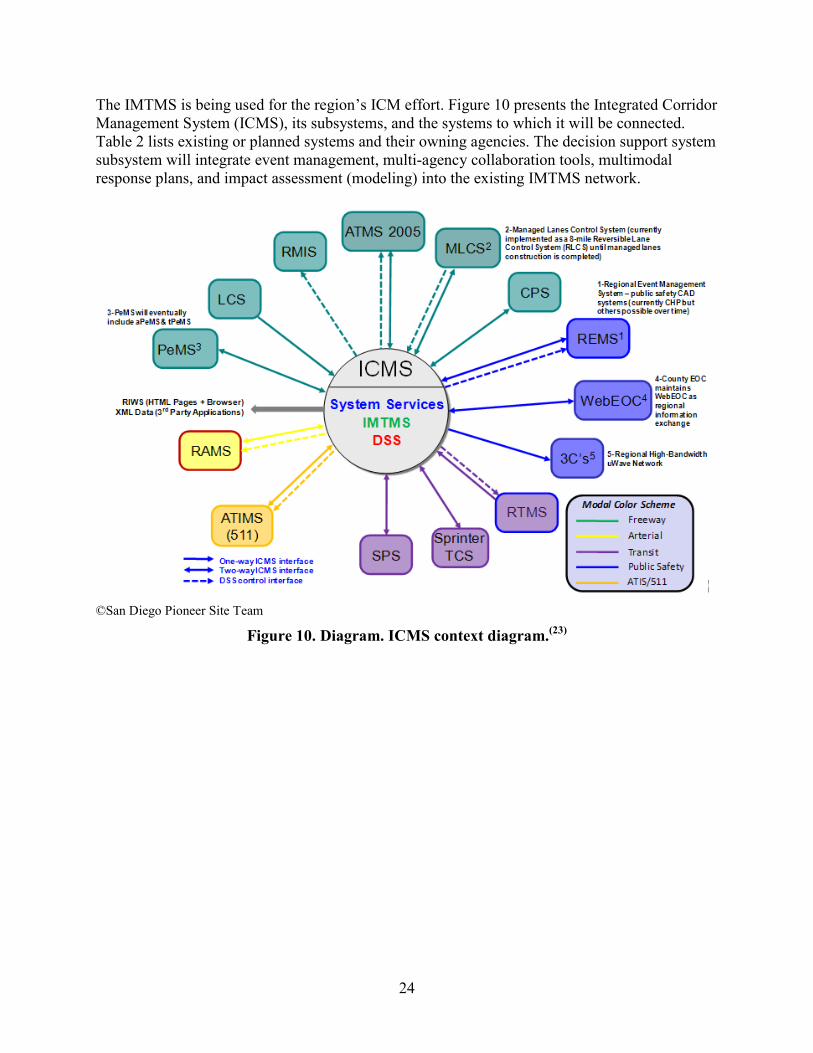
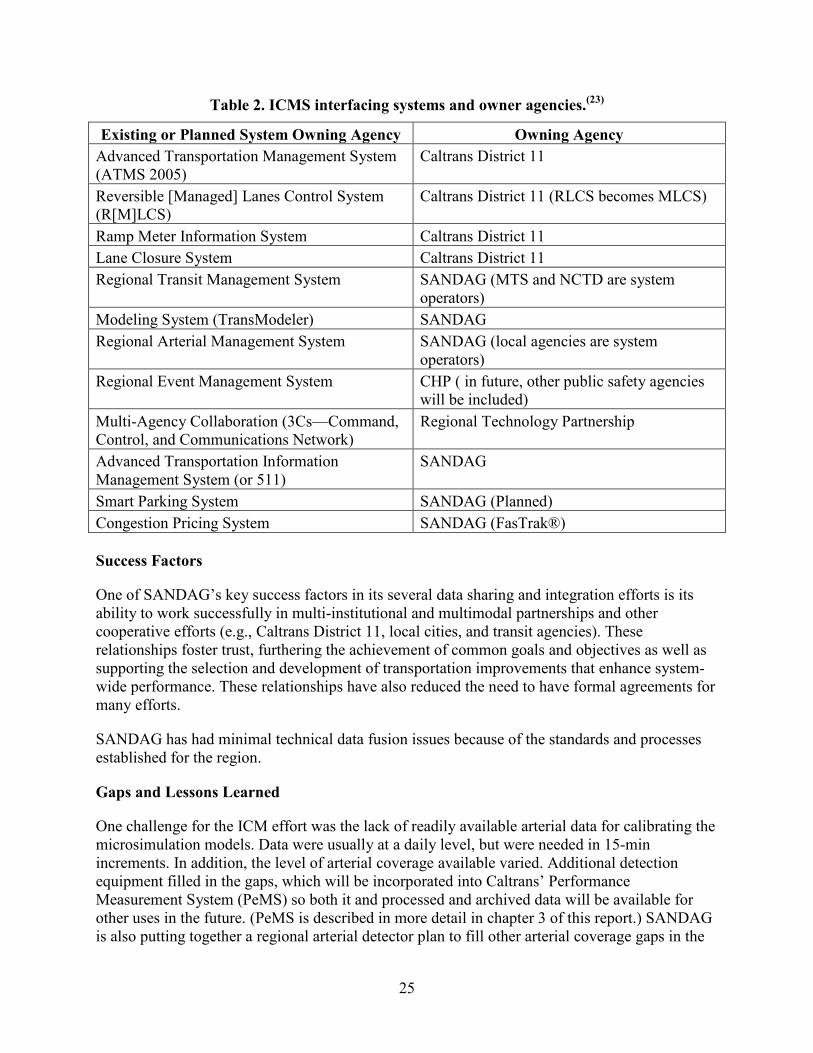
The IMTMS is being used for the region’s ICM effort. Figure 10 presents the Integrated Corridor Management System (ICMS), its subsystems, and the systems to which it will be connected. Table 2 lists existing or planned systems and their owning agencies. The decision support system subsystem will integrate event management, multi-agency collaboration tools, multimodal response plans, and impact assessment (modeling) into the existing IMTMS network.
©San Diego Pioneer Site Team
Figure 10. Diagram. ICMS context diagram.(23)
25
Table 2. ICMS interfacing systems and owner agencies.(23)
Existing or Planned System Owning Agency Owning Agency Advanced Transportation Management System (ATMS 2005)
Caltrans District 11
Reversible [Managed] Lanes Control System (R[M]LCS)
Caltrans District 11 (RLCS becomes MLCS)
Ramp Meter Information System Caltrans District 11 Lane Closure System Caltrans District 11 Regional Transit Management System SANDAG (MTS and NCTD are system
operators) Modeling System (TransModeler) SANDAG Regional Arterial Management System SANDAG (local agencies are system
operators) Regional Event Management System CHP ( in future, other public safety agencies
will be included) Multi-Agency Collaboration (3Cs—Command, Control, and Communications Network)
Regional Technology Partnership
Advanced Transportation Information Management System (or 511)
SANDAG
Smart Parking System SANDAG (Planned) Congestion Pricing System SANDAG (FasTrak®) Success Factors
One of SANDAG’s key success factors in its several data sharing and integration efforts is its ability to work successfully in multi-institutional and multimodal partnerships and other cooperative efforts (e.g., Caltrans District 11, local cities, and transit agencies). These relationships foster trust, furthering the achievement of common goals and objectives as well as supporting the selection and development of transportation improvements that enhance system-wide performance. These relationships have also reduced the need to have formal agreements for many efforts.
SANDAG has had minimal technical data fusion issues because of the standards and processes established for the region.
Gaps and Lessons Learned
One challenge for the ICM effort was the lack of readily available arterial data for calibrating the microsimulation models. Data were usually at a daily level, but were needed in 15-min increments. In addition, the level of arterial coverage available varied. Additional detection equipment filled in the gaps, which will be incorporated into Caltrans’ Performance Measurement System (PeMS) so both it and processed and archived data will be available for other uses in the future. (PeMS is described in more detail in chapter 3 of this report.) SANDAG is also putting together a regional arterial detector plan to fill other arterial coverage gaps in the
26
region. Another consideration explored by SANDAG was the use of third-party data. At the time of this review, no providers had been identified to meet SANDAG’s specific granularity needs for arterial operations and performance monitoring.
With respect to long-range planning, analysis is constrained by the need to be consistent with the capabilities of the regional travel demand model. SANDAG recognizes the challenges of demonstrating operations benefits at a regional level. It is developing an activity-based model in an effort to be able to better assess Transportation system management strategies in the future (e.g., signal coordination, active transportation management, automated vehicle location (AVL), etc.). SANDAG also recognizes the need to change its approach, as a planning agency, to how it uses traffic data to justify investments.
While a wealth of data are available for monitoring and reporting system performance from these ITSs, the results still require human review to determine whether the performance assessment is an accurate reflection of what the public experiences.
Applicability to the VDA Framework
Both SANDAG’s and its regional partner agencies’ prior and ongoing experiences with using and sharing data and systems could provide valuable insight into the VDA Framework from the perspective of multi-agency and jurisdictional data sharing, use of data for supporting model validation and calibration, and use of data for state of the region reporting, as well as aid in meeting standards, consistency, and collaboration goals.
SAN FRANCISCO BAY AREA, CALIFORNIA
Effective Practices
The San Francisco Bay Area Metropolitan Transportation Commission (MTC) has had considerable success in using data for planning for operations activities. Similar to SANDAG, MTC does the following:
• Uses PeMS data for a variety of purposes.
• Works with Caltrans to improve the PeMS data and use them for planning activities.
• Coordinates well with many of the other transportation agencies in the region for planning for operations (e.g., corridor system management plan, Freeway Performance Initiative program).
• Extensively uses traffic analysis tools and methods.
The Data Use in Planning for Operations State of the Practice report describes several of the tools and methods for data collection and analysis performed by MTC in support of its planning for operations activities, so those are described here.(21) In addition, PeMS is discussed in more detail in chapter 3 of this report. This best practices discussion for MTC focuses on the data sharing, integration, and practices for the MTC data portal and 511.
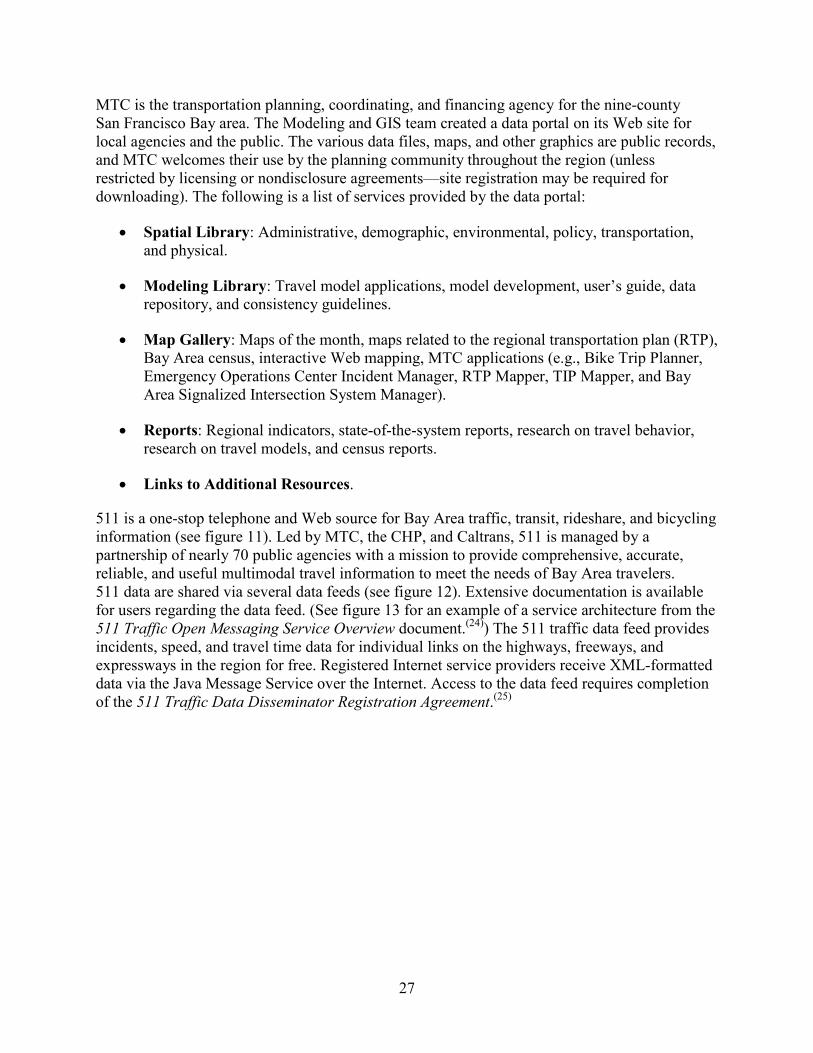
27
MTC is the transportation planning, coordinating, and financing agency for the nine-county San Francisco Bay area. The Modeling and GIS team created a data portal on its Web site for local agencies and the public. The various data files, maps, and other graphics are public records, and MTC welcomes their use by the planning community throughout the region (unless restricted by licensing or nondisclosure agreements—site registration may be required for downloading). The following is a list of services provided by the data portal:
• Spatial Library: Administrative, demographic, environmental, policy, transportation, and physical.
• Modeling Library: Travel model applications, model development, user’s guide, data repository, and consistency guidelines.
• Map Gallery: Maps of the month, maps related to the regional transportation plan (RTP), Bay Area census, interactive Web mapping, MTC applications (e.g., Bike Trip Planner, Emergency Operations Center Incident Manager, RTP Mapper, TIP Mapper, and Bay Area Signalized Intersection System Manager).
• Reports: Regional indicators, state-of-the-system reports, research on travel behavior, research on travel models, and census reports.
• Links to Additional Resources.
511 is a one-stop telephone and Web source for Bay Area traffic, transit, rideshare, and bicycling information (see figure 11). Led by MTC, the CHP, and Caltrans, 511 is managed by a partnership of nearly 70 public agencies with a mission to provide comprehensive, accurate, reliable, and useful multimodal travel information to meet the needs of Bay Area travelers. 511 data are shared via several data feeds (see figure 12). Extensive documentation is available for users regarding the data feed. (See figure 13 for an example of a service architecture from the 511 Traffic Open Messaging Service Overview document.(24)) The 511 traffic data feed provides incidents, speed, and travel time data for individual links on the highways, freeways, and expressways in the region for free. Registered Internet service providers receive XML-formatted data via the Java Message Service over the Internet. Access to the data feed requires completion of the 511 Traffic Data Disseminator Registration Agreement.(25)
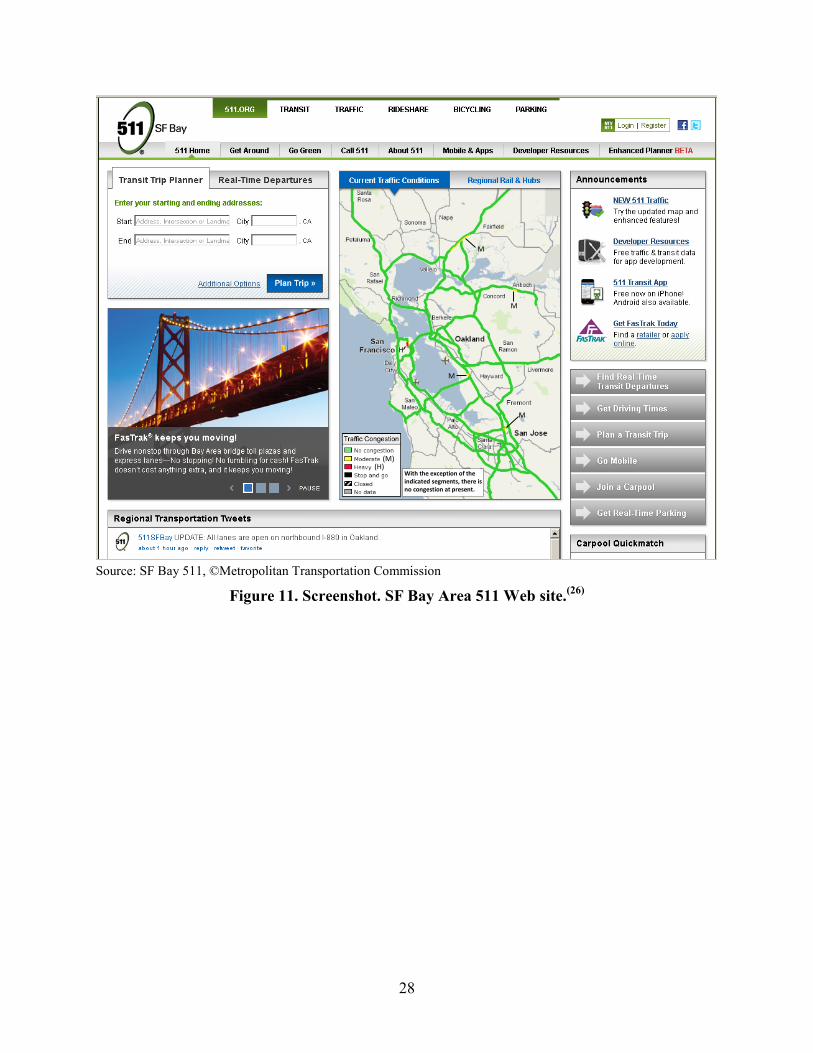
28
Source: SF Bay 511, ©Metropolitan Transportation Commission
Figure 11. Screenshot. SF Bay Area 511 Web site.(26)
H
M
M
M
M
(M) (H)
With the exception of the indicated segments, there is no congestion at present.
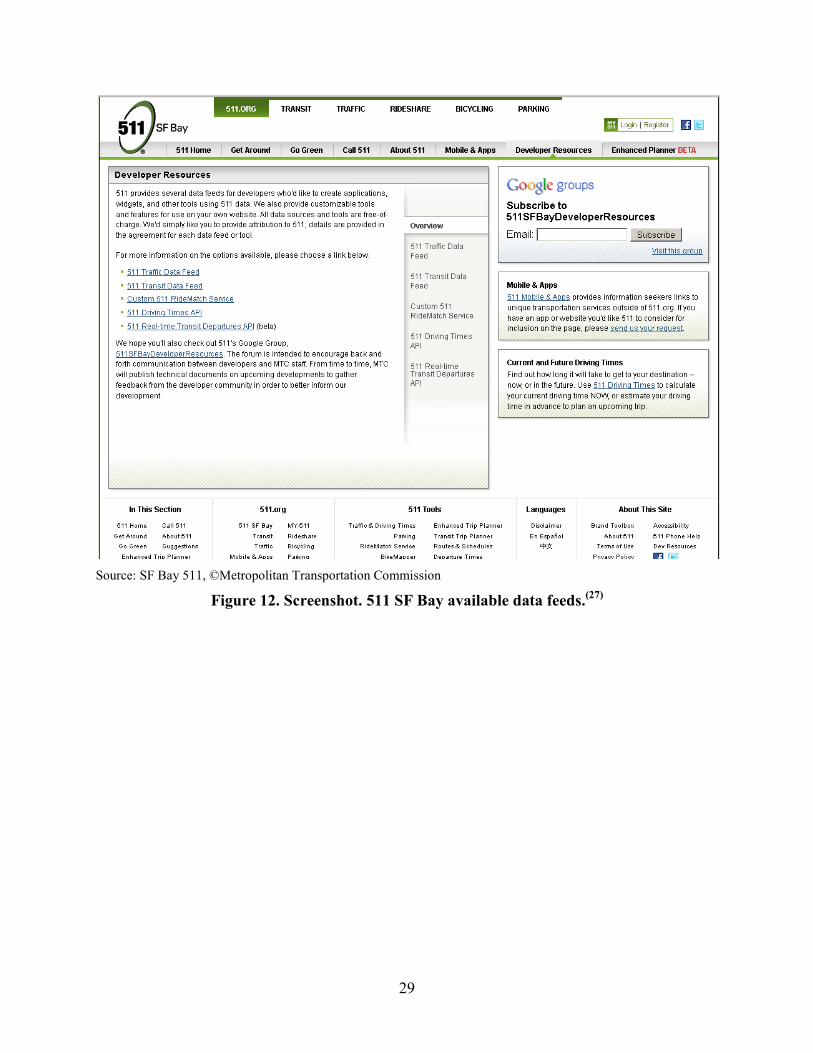
29
Source: SF Bay 511, ©Metropolitan Transportation Commission
Figure 12. Screenshot. 511 SF Bay available data feeds.(27)
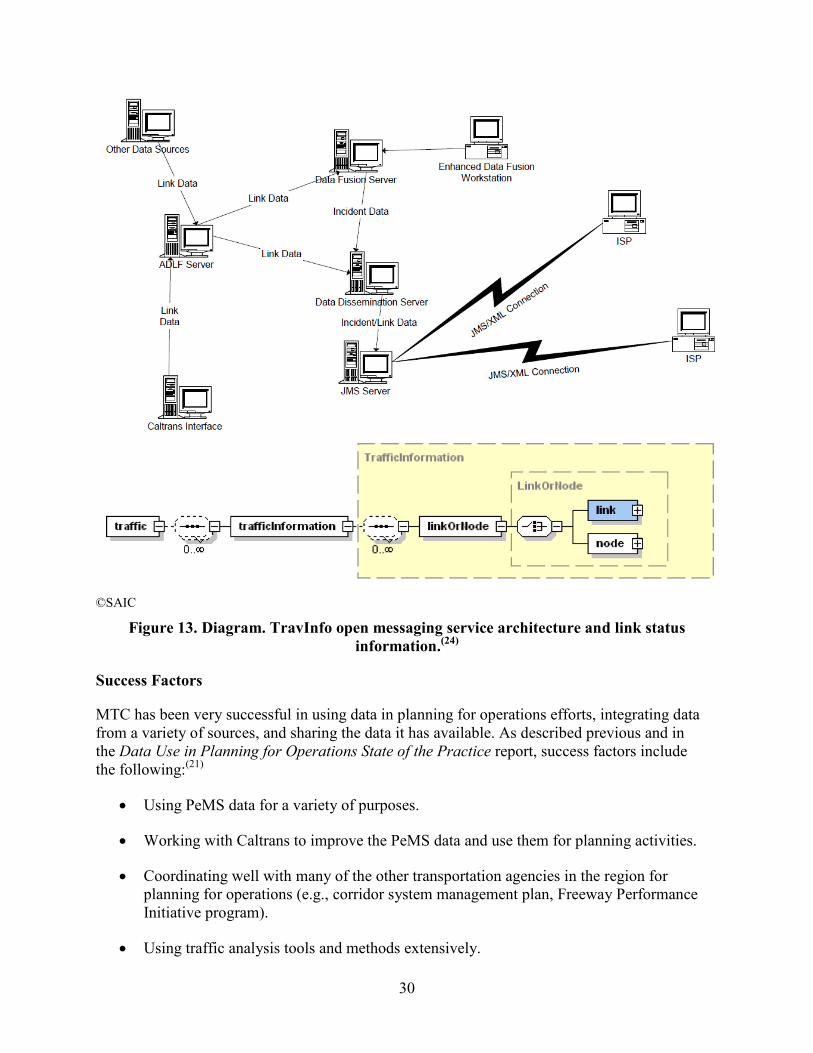
30
©SAIC
Figure 13. Diagram. TravInfo open messaging service architecture and link status information.(24)
Success Factors
MTC has been very successful in using data in planning for operations efforts, integrating data from a variety of sources, and sharing the data it has available. As described previous and in the Data Use in Planning for Operations State of the Practice report, success factors include the following:(21)
• Using PeMS data for a variety of purposes.
• Working with Caltrans to improve the PeMS data and use them for planning activities.
• Coordinating well with many of the other transportation agencies in the region for planning for operations (e.g., corridor system management plan, Freeway Performance Initiative program).
• Using traffic analysis tools and methods extensively.
31
Gaps and Lessons Learned
As mentioned in the Data Use in Planning for Operations State of the Practice report, some data barriers and gaps include the following:(21)
• Need to improve detector coverage to minimize detection gaps. • Need to enhance detector maintenance to improve detector health and confidence in the data. • Lack of data and performance on arterial facilities.
A gap identified by the operations staff at MTC was the desire to use archived data from a variety of sources to develop their annual State of the System Report. They have been exploring the use of archived data for regional congestion monitoring purposes instead of the floating car method because it is costly and usually provides only a few days’ worth of data. MTC recently decided to obtain third-party travel time and speed data to help fill gaps in the system to support its planning, operations, management, and reporting needs. It has also been promoting improvements to PeMS by enhancing its usability, data extraction, capability to analyze and quantify nonrecurrent congestion, and inclusion of arterial data. A challenge that it has had in using the PeMS data in particular is that the data are not in a usable format and are not processed to filter bad data (e.g., malfunctioning detectors, outliers, etc.). Unlike SANDAG, MTC does not have a data hub in place for compiling and processing the various traffic and asset data available.
Applicability to the VDA Framework
MTC’s prior and ongoing experiences could provide a variety of ideas for viable planning for operations activities at a regional level to test the VDA Framework.

33
CHAPTER 3. EXAMPLE DATA ENVIRONMENTS
This chapter provides a high-level review of successful data-sharing environments.
UNIVERSITY OF MARYLAND’S REGIONAL INTEGRATED TRANSPORTATION INFORMATION SYSTEM
Effective Practices
The Regional Integrated Transportation Information System (RITIS) is an automated data fusion and dissemination system for transportation-related data. RITIS was originally developed for the National Capital Region. As of 2015, the RITIS platform includes data from 26 State transportation departments and hundreds of agencies. Planning for RITIS began in 2002 with a grant from the Federal Government, and the system was developed in 2006 by the Center for Advanced Transportation Technology (CATT) Laboratory of the University of Maryland. Agency partners originally included the Metropolitan Washington Council of Governments, Maryland Department of Transportation (DOT), Virginia Department of Transportation (VDOT), District of Columbia DOT, Montgomery County Maryland Traffic Management Center, and the Washington Metropolitan Area Transit Authority. Current partners and the 5,000+ users of the system include the following:
• Transportation departments (Federal, State, and local). • Transit providers. • MPOs. • Emergency management agencies. • Federal Emergency Management Agency. • U.S. Army, Air Force, Navy, and Coast Guard. • U.S. Northern Command. • U.S. Secret Service. • U.S. Capitol & Park Police. • Fire and rescue. • Law enforcement (State and local). • U.S. Joint Forces Headquarters. • National Security Agency. • U.S. Office of Personnel Management. • Third-party travel information providers. • University researchers. • Consultants working on projects for the transportation departments. • Social Security Administration. • Pentagon Force Protection Agency. • Others.
34
RITIS has the following two primary capabilities that support data integration and sharing:
• Real-time information exchange: This component collects, filters, standardizes, and disseminates real-time data on transportation conditions in the region. Participating agencies maintain ownership and operation of its field devices for collecting real-time data feeds. Each agency sends its data to RITIS, which translates the disparate data feeds, linear reference systems, and communications protocols into industrywide standardized formats. Data are translated into standardized packets that are transmitted over the Internet to all participating agencies. Once they are received, the data can be integrated back into the receiving agencies’ traffic and incident management systems. Figure 14 shows an overview of the real-time information exchange. For agencies that do not have existing systems or are otherwise not interested in reintegrating data into their native systems, the RITIS platform also includes a Web site that allows users to view and interact with all of the real-time data.
• Archival and analysis of transportation-related data: RITIS archives all the real-time data feeds and makes them available to participating agencies to support operations, planning, research and development, and performance measurement generation. The archive component includes access to tools that allow users to download historical RITIS data, run reports, assess performance measures, and conduct analysis. These tools allow users to identify accident hot spots, prioritize projects, analyze congestion, perform after action reviews, and evaluate the effectiveness of transportation operations strategies. Data within the archive can also be downloaded or exported so that users can perform their own independent analysis. All data within RITIS are archived indefinitely.(28)
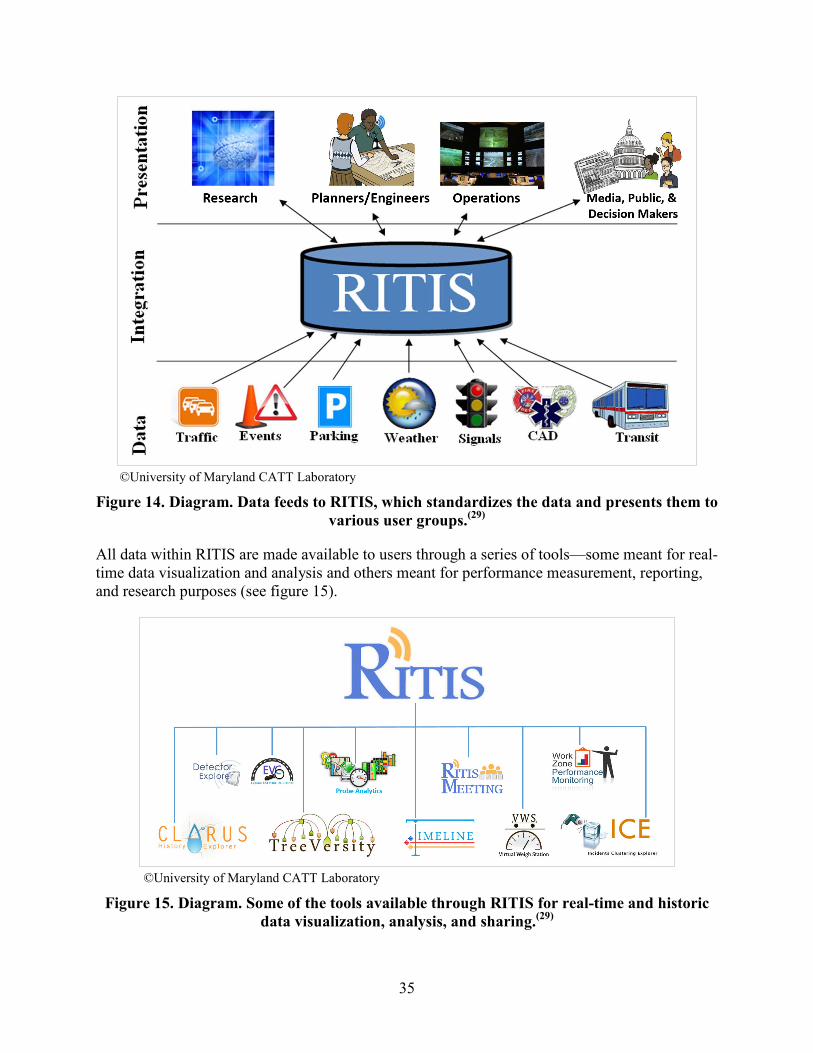
35
©University of Maryland CATT Laboratory
Figure 14. Diagram. Data feeds to RITIS, which standardizes the data and presents them to various user groups.(29)
All data within RITIS are made available to users through a series of tools—some meant for real-time data visualization and analysis and others meant for performance measurement, reporting, and research purposes (see figure 15).
©University of Maryland CATT Laboratory
Figure 15. Diagram. Some of the tools available through RITIS for real-time and historic data visualization, analysis, and sharing.(29)
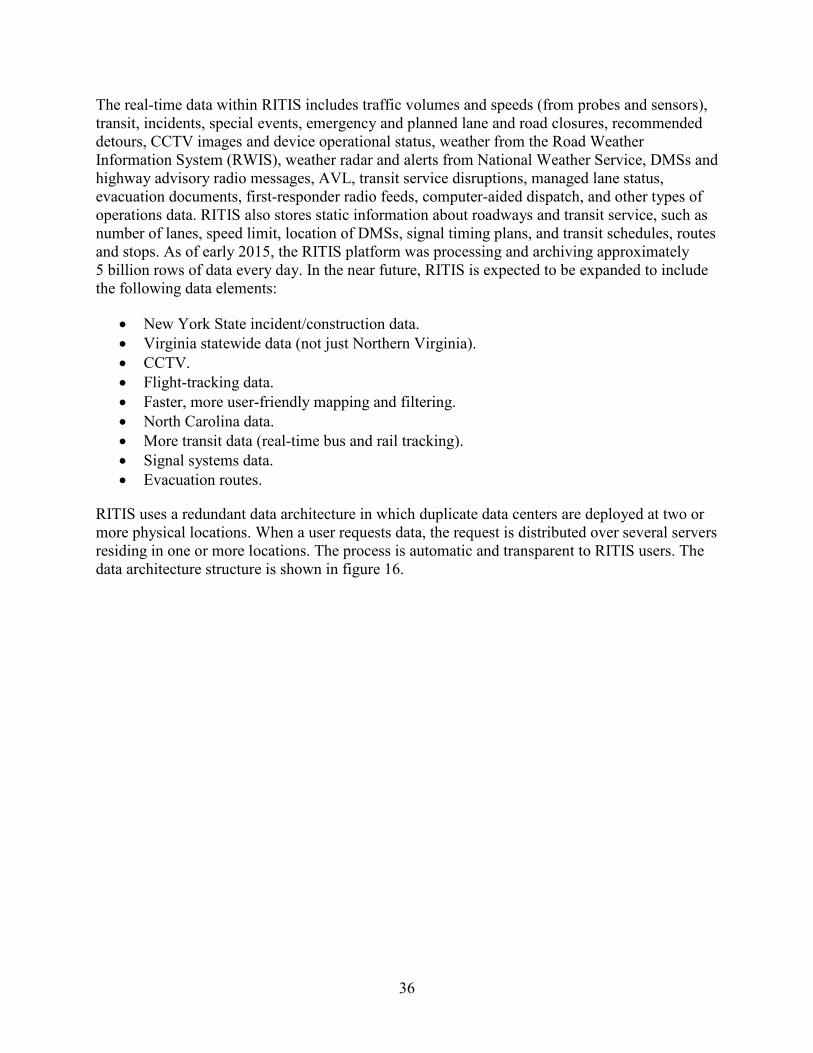
36
The real-time data within RITIS includes traffic volumes and speeds (from probes and sensors), transit, incidents, special events, emergency and planned lane and road closures, recommended detours, CCTV images and device operational status, weather from the Road Weather Information System (RWIS), weather radar and alerts from National Weather Service, DMSs and highway advisory radio messages, AVL, transit service disruptions, managed lane status, evacuation documents, first-responder radio feeds, computer-aided dispatch, and other types of operations data. RITIS also stores static information about roadways and transit service, such as number of lanes, speed limit, location of DMSs, signal timing plans, and transit schedules, routes and stops. As of early 2015, the RITIS platform was processing and archiving approximately 5 billion rows of data every day. In the near future, RITIS is expected to be expanded to include the following data elements:
• New York State incident/construction data. • Virginia statewide data (not just Northern Virginia). • CCTV. • Flight-tracking data. • Faster, more user-friendly mapping and filtering. • North Carolina data. • More transit data (real-time bus and rail tracking). • Signal systems data. • Evacuation routes.
RITIS uses a redundant data architecture in which duplicate data centers are deployed at two or more physical locations. When a user requests data, the request is distributed over several servers residing in one or more locations. The process is automatic and transparent to RITIS users. The data architecture structure is shown in figure 16.
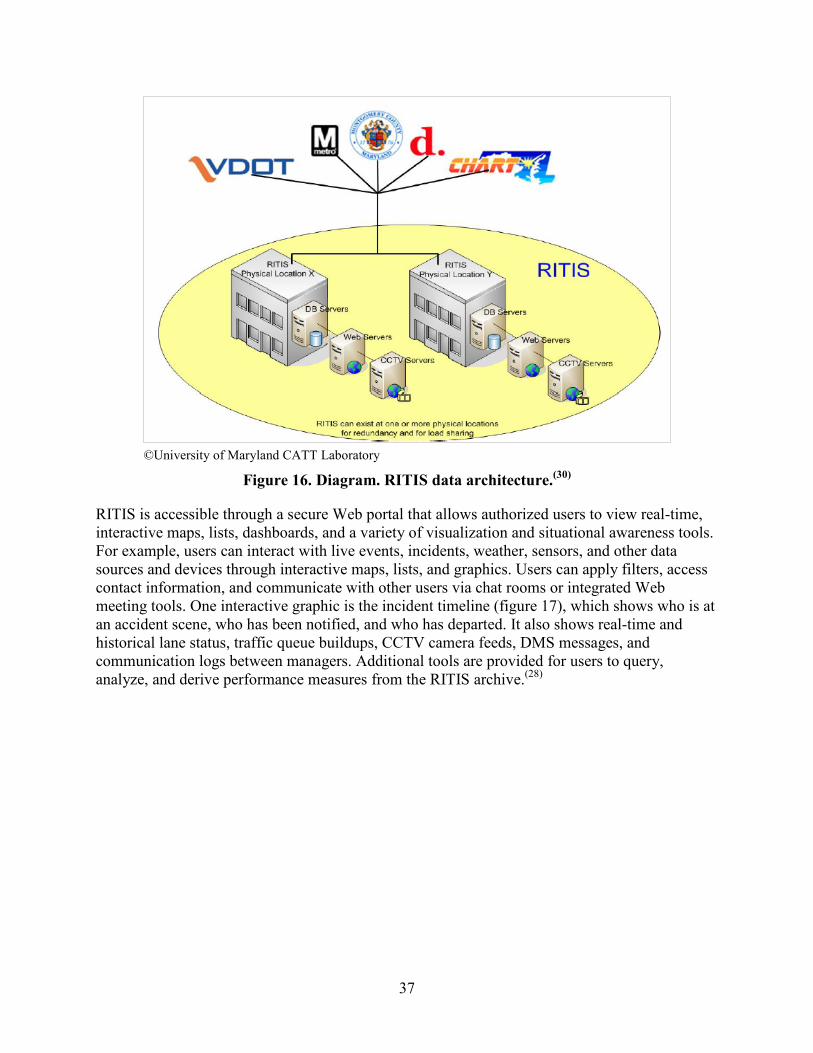
37
©University of Maryland CATT Laboratory
Figure 16. Diagram. RITIS data architecture.(30)
RITIS is accessible through a secure Web portal that allows authorized users to view real-time, interactive maps, lists, dashboards, and a variety of visualization and situational awareness tools. For example, users can interact with live events, incidents, weather, sensors, and other data sources and devices through interactive maps, lists, and graphics. Users can apply filters, access contact information, and communicate with other users via chat rooms or integrated Web meeting tools. One interactive graphic is the incident timeline (figure 17), which shows who is at an accident scene, who has been notified, and who has departed. It also shows real-time and historical lane status, traffic queue buildups, CCTV camera feeds, DMS messages, and communication logs between managers. Additional tools are provided for users to query, analyze, and derive performance measures from the RITIS archive.(28)
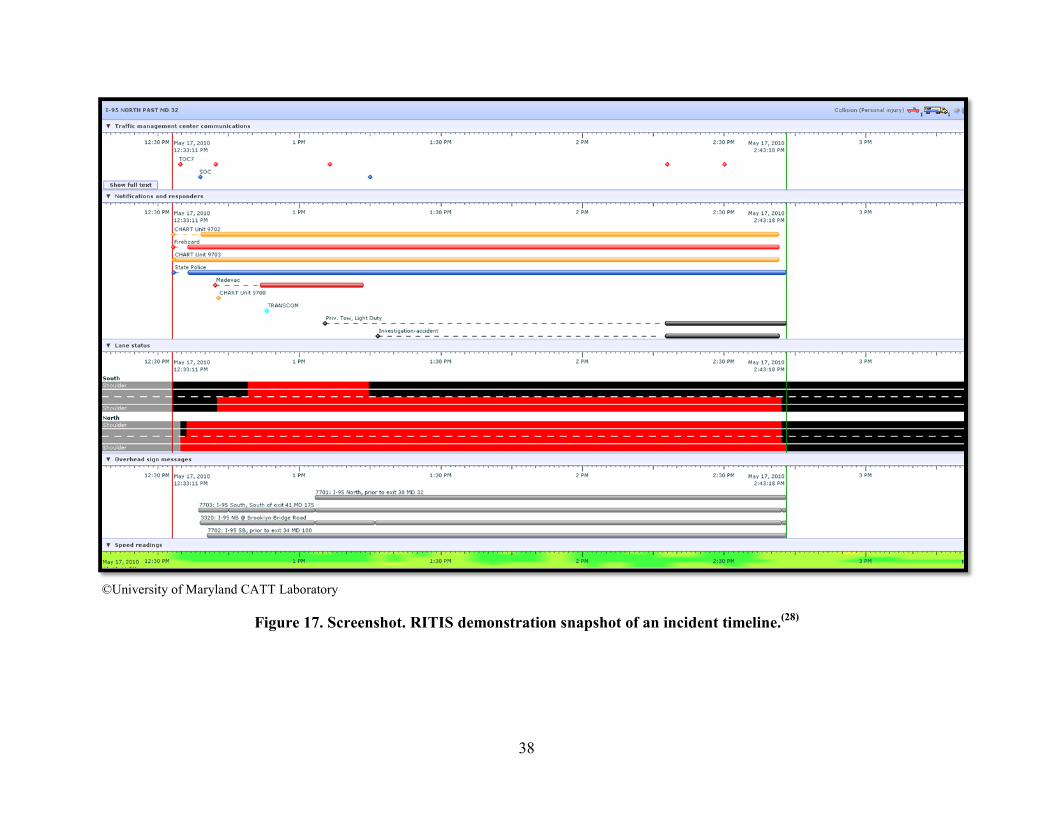
38
©University of Maryland CATT Laboratory
Figure 17. Screenshot. RITIS demonstration snapshot of an incident timeline.(28)
39
Success Factors
RITIS is a successful and growing system that has a large collection of meaningful regional transportation information to share in a single location.(31) By consolidating, disseminating, and archiving transportation-related data from various agencies in the Washington, DC, area, use of RITIS has resulted in the following successful outcomes:
• Regional data standardization, integration, and sharing to allow a comprehensive view of the region’s transit and transportation network in Virginia, Maryland, and the District of Columbia.
• Demonstration of data fusion and standardization and how this information can be used to support data collection, regional transportation systems management, regional traveler information dissemination, and systems evaluation.
• Adoption by the I-95 Corridor Coalition partners to power the transportation information applications. In addition to its information sharing features (congestion, incidents, speed, etc.), RITIS provides data visualization and analysis tools that help an agency identify problem areas. RITIS provides information access to a wide range of transportation organizations.
• One consolidated location for transportation systems data, information gathering, etc., which allows the agencies to better report their achievements to decisionmakers and the public.
• Overcoming of several obstacles common to enterprise projects, including convincing data owners to share information with project managers and each other; building easy-to-use tools for a wide audience to analyze and visualize data; and expanding the scale of the project from the Washington Beltway to the country. A major success factor in breaking down data silos and getting agencies to share their data has been demonstrating how valuable RITIS tools can be to them. During a major snow event in February 2010, RITIS had more than 600 visitors and logged 1.2 million hits from first responders, management, decisionmakers, politicians, and others seeking to find and share information.
Gaps and Lessons Learned
The following gaps and lessons learned have been documented:
• One of the benefits of RITIS is that it allows cross-agency and cross-modal coordination. Policies relating to this coordination must be established to avoid conflicting data, to support appropriate incident response, and to best manage incidents that cross jurisdictional and modal boundaries.
• Each agency’s existing system required some modification to view RITIS information within their native systems. This has required close coordination between RITIS developers and agency information technology (IT) staff to identify changes to data elements and systems to accommodate RITIS’ data fusion scheme. Agencies who have not wanted to address reintegration challenges have decided to use the RITIS Web site.
40
• Convincing agencies that there is benefit to sharing their data and making them visible to others outside of their own organization was a significant challenge. There seems to be a culture of fear within many organizations: fear of being judged and/or prosecuted for errors in their data or for perceptions of poor performance. RITIS developers had to expend a great deal of resources on education of agencies on their security protocols to convince them that their data would be safe. RITIS developers also found that the visualization tools were helpful in convincing agencies to want to share their information with the RITIS platform. Agencies wanted access to the data visualization tools, and they could not get access unless they decided to share their data. These and other issues have been documented in the National Cooperative Highway Research Program (NCHRP) report NCHRP Synthesis 460: Sharing Operations Data Among Agencies.(32)
• Some agencies have created complex legal documents that have to be signed before allowing access to the data. Out-of-state governmental agencies (such as other State and local transportation departments) often have concerns about signing these legal agreements because they may require the State to agree to the laws of another State.
Applicability to the VDA Framework
RITIS provides important lessons for the development of the VDA Framework, particularly in the area of interagency coordination and data sharing.
For additional information on the RITIS platform, see http://tinyurl.com/lu47c8s.(33)
CALTRANS’ PeMS
Effective Practices
Caltrans’ Freeway PeMS is a real-time archived data management system (ADMS) for transportation data from throughout the State. It collects raw detector data in real time, stores and processes these data, and provides a number of Web pages that offer analysis of the performance of the freeway system. Caltrans requires registration to the Web site, and all content can be accessed with the exception of some real-time maps and some pages that are only available to Caltrans employees (i.e., detailed Traffic Accident Surveillance and Analysis System (TASAS) accident analysis). Figure 18 and figure 19 present the PeMS welcome screen and the PeMS home screen, respectively.
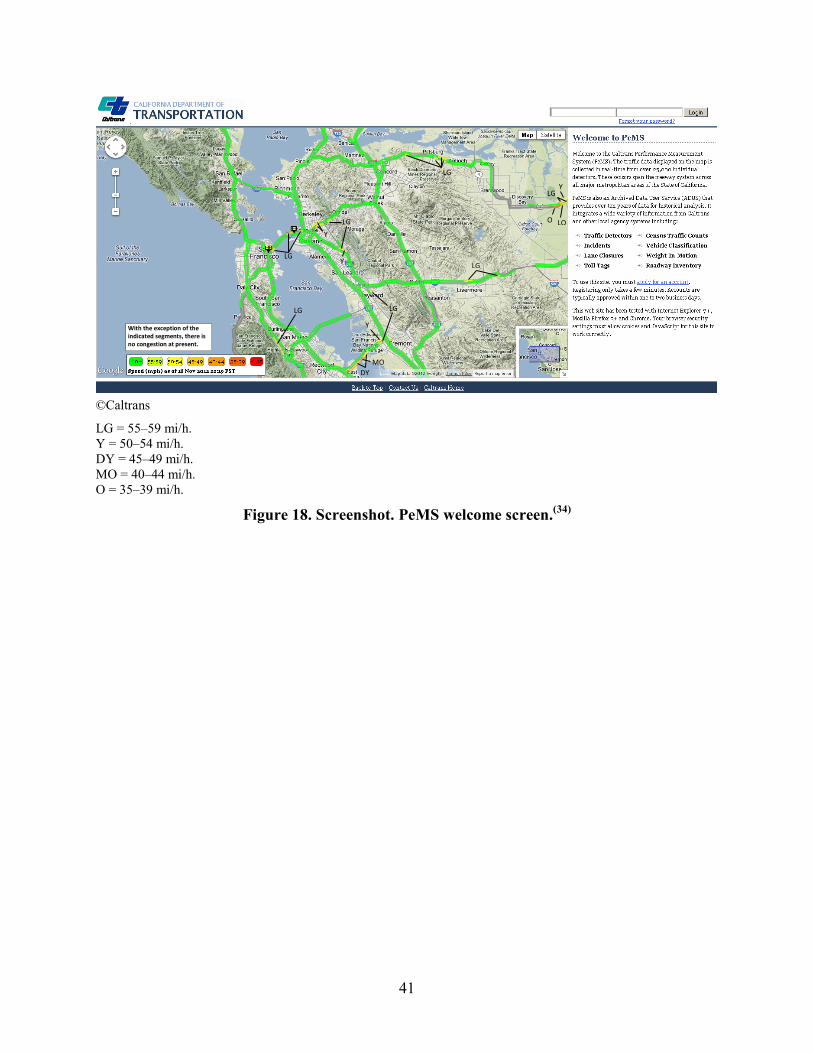
41
©Caltrans
LG = 55–59 mi/h. Y = 50–54 mi/h. DY = 45–49 mi/h. MO = 40–44 mi/h. O = 35–39 mi/h.
Figure 18. Screenshot. PeMS welcome screen.(34)
LG
Y
LO
DY MO
LG
LG
LG
O
With the exception of the indicated segments, there is no congestion at present.
LG
LG
LG
Y
Y
Y
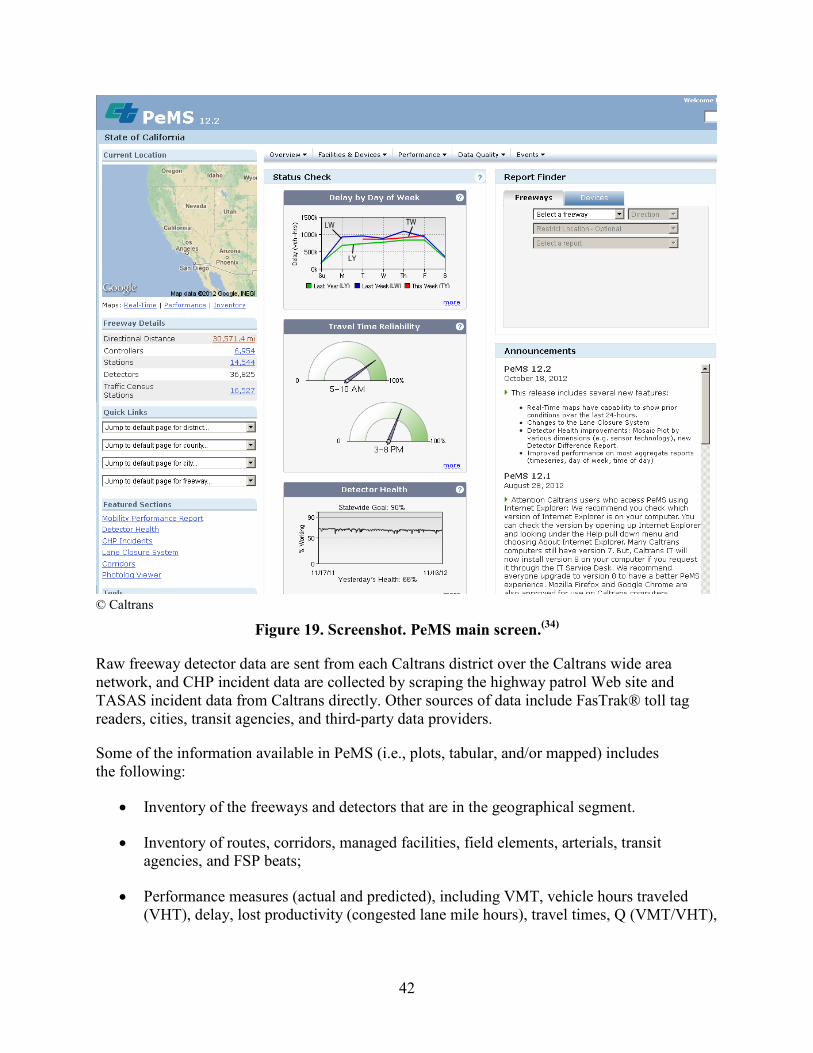
42
© Caltrans
Figure 19. Screenshot. PeMS main screen.(34)
Raw freeway detector data are sent from each Caltrans district over the Caltrans wide area network, and CHP incident data are collected by scraping the highway patrol Web site and TASAS incident data from Caltrans directly. Other sources of data include FasTrak® toll tag readers, cities, transit agencies, and third-party data providers.
Some of the information available in PeMS (i.e., plots, tabular, and/or mapped) includes the following:
• Inventory of the freeways and detectors that are in the geographical segment.
• Inventory of routes, corridors, managed facilities, field elements, arterials, transit agencies, and FSP beats;
• Performance measures (actual and predicted), including VMT, vehicle hours traveled (VHT), delay, lost productivity (congested lane mile hours), travel times, Q (VMT/VHT),
(LY) (LW) (TY)
LY
TW LW
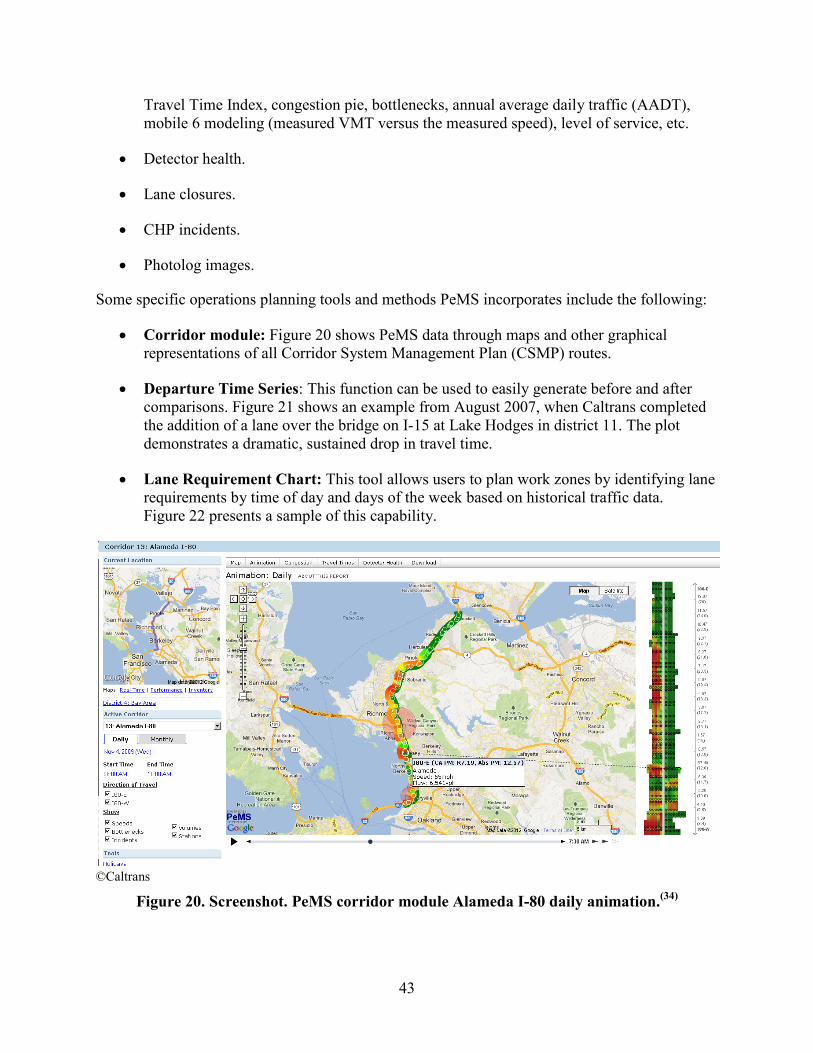
43
Travel Time Index, congestion pie, bottlenecks, annual average daily traffic (AADT), mobile 6 modeling (measured VMT versus the measured speed), level of service, etc.
• Detector health.
• Lane closures.
• CHP incidents.
• Photolog images.
Some specific operations planning tools and methods PeMS incorporates include the following:
• Corridor module: Figure 20 shows PeMS data through maps and other graphical representations of all Corridor System Management Plan (CSMP) routes.
• Departure Time Series: This function can be used to easily generate before and after comparisons. Figure 21 shows an example from August 2007, when Caltrans completed the addition of a lane over the bridge on I-15 at Lake Hodges in district 11. The plot demonstrates a dramatic, sustained drop in travel time.
• Lane Requirement Chart: This tool allows users to plan work zones by identifying lane requirements by time of day and days of the week based on historical traffic data. Figure 22 presents a sample of this capability.
©Caltrans
Figure 20. Screenshot. PeMS corridor module Alameda I-80 daily animation.(34)
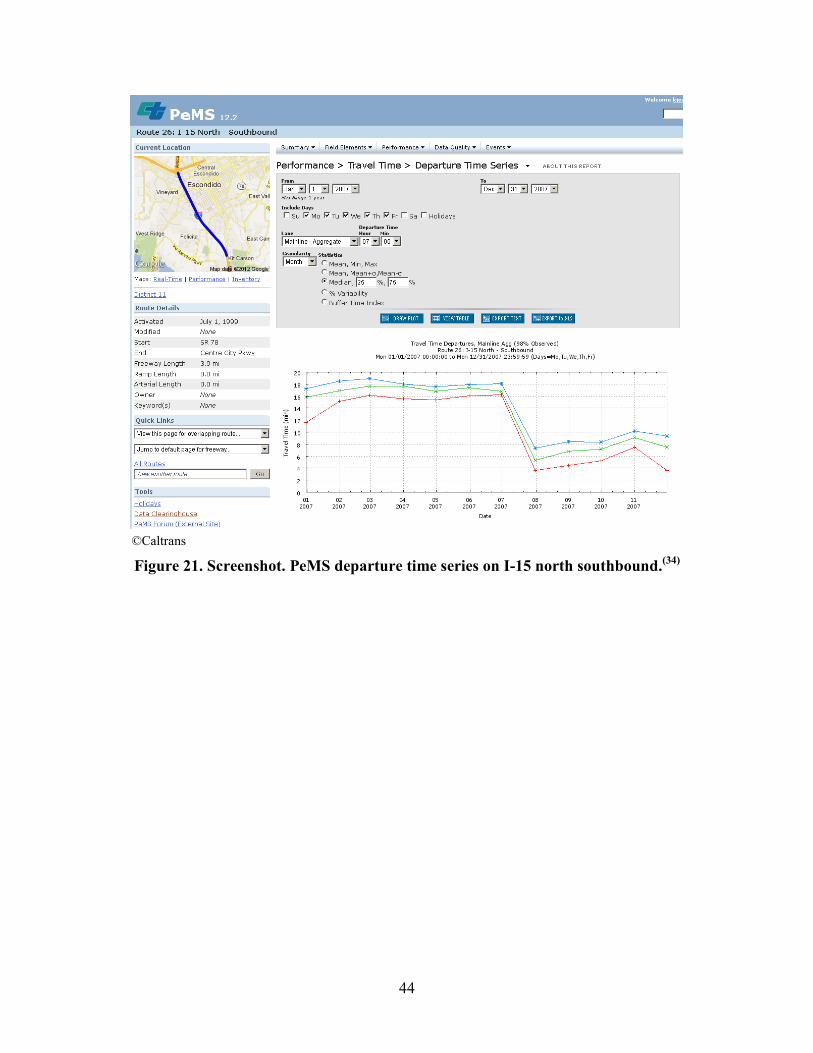
44
©Caltrans
Figure 21. Screenshot. PeMS departure time series on I-15 north southbound.(34)
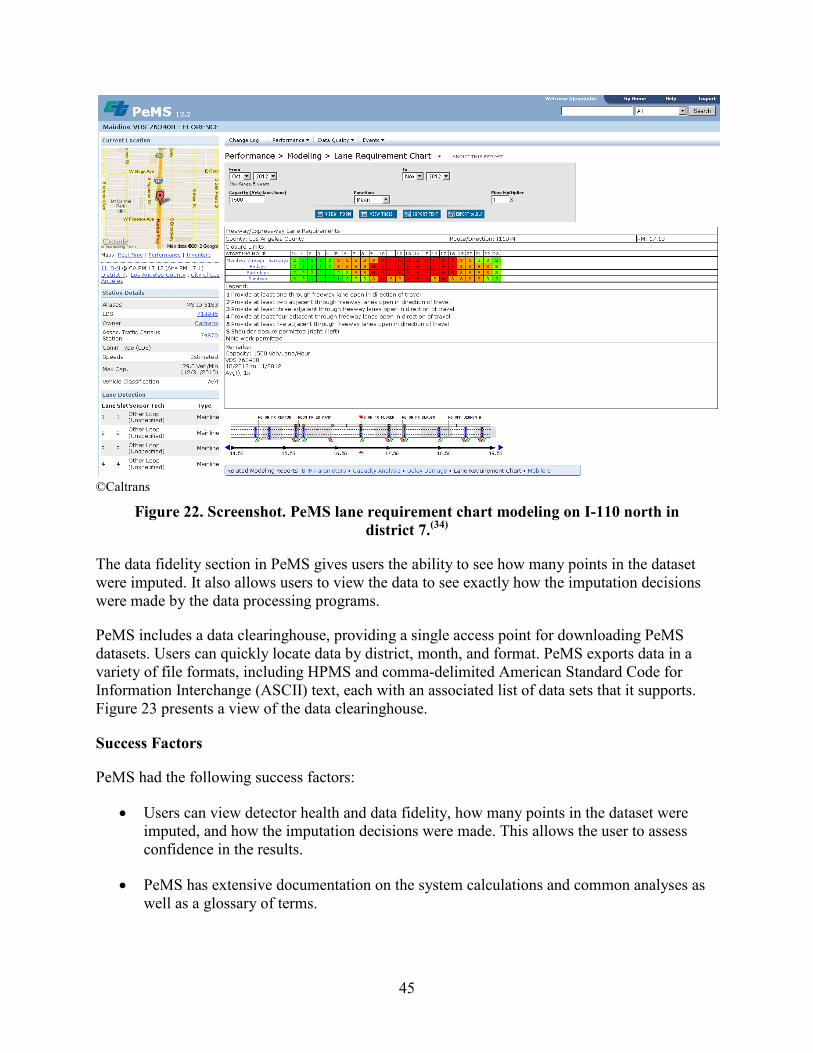
45
©Caltrans
Figure 22. Screenshot. PeMS lane requirement chart modeling on I-110 north in district 7.(34)
The data fidelity section in PeMS gives users the ability to see how many points in the dataset were imputed. It also allows users to view the data to see exactly how the imputation decisions were made by the data processing programs.
PeMS includes a data clearinghouse, providing a single access point for downloading PeMS datasets. Users can quickly locate data by district, month, and format. PeMS exports data in a variety of file formats, including HPMS and comma-delimited American Standard Code for Information Interchange (ASCII) text, each with an associated list of data sets that it supports. Figure 23 presents a view of the data clearinghouse.
Success Factors
PeMS had the following success factors:
• Users can view detector health and data fidelity, how many points in the dataset were imputed, and how the imputation decisions were made. This allows the user to assess confidence in the results.
• PeMS has extensive documentation on the system calculations and common analyses as well as a glossary of terms.
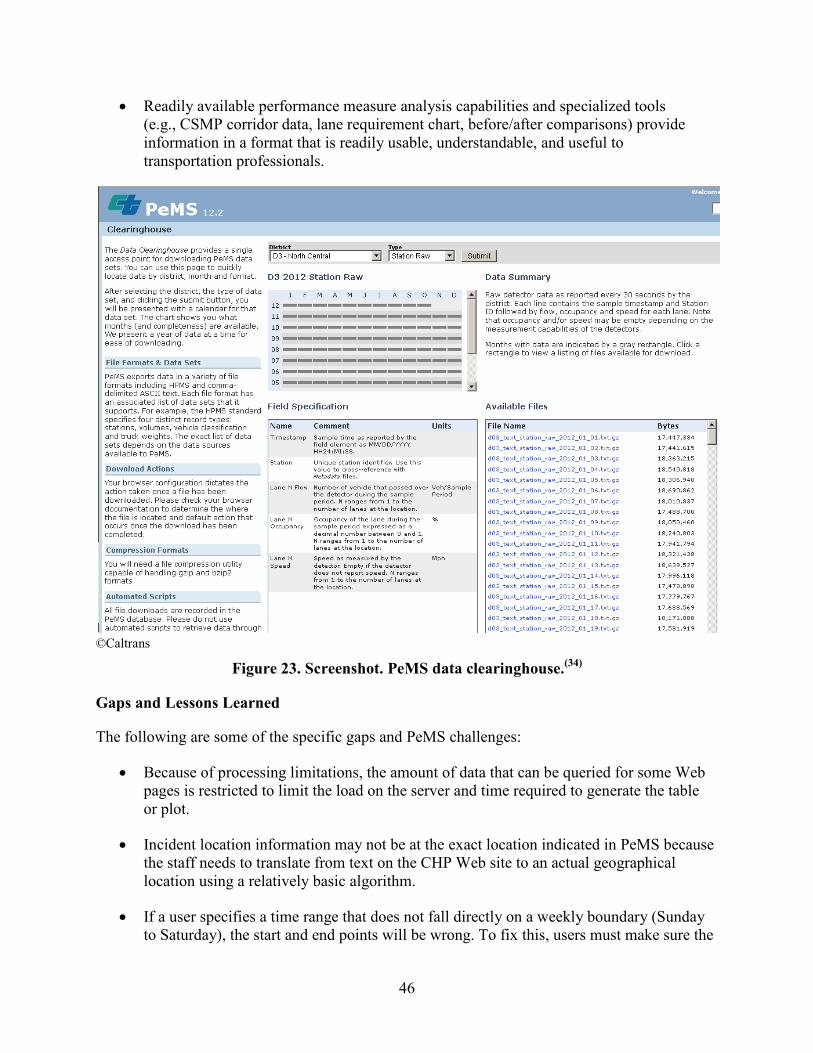
46
• Readily available performance measure analysis capabilities and specialized tools (e.g., CSMP corridor data, lane requirement chart, before/after comparisons) provide information in a format that is readily usable, understandable, and useful to transportation professionals.
©Caltrans
Figure 23. Screenshot. PeMS data clearinghouse.(34)
Gaps and Lessons Learned
The following are some of the specific gaps and PeMS challenges:
• Because of processing limitations, the amount of data that can be queried for some Web pages is restricted to limit the load on the server and time required to generate the table or plot.
• Incident location information may not be at the exact location indicated in PeMS because the staff needs to translate from text on the CHP Web site to an actual geographical location using a relatively basic algorithm.
• If a user specifies a time range that does not fall directly on a weekly boundary (Sunday to Saturday), the start and end points will be wrong. To fix this, users must make sure the
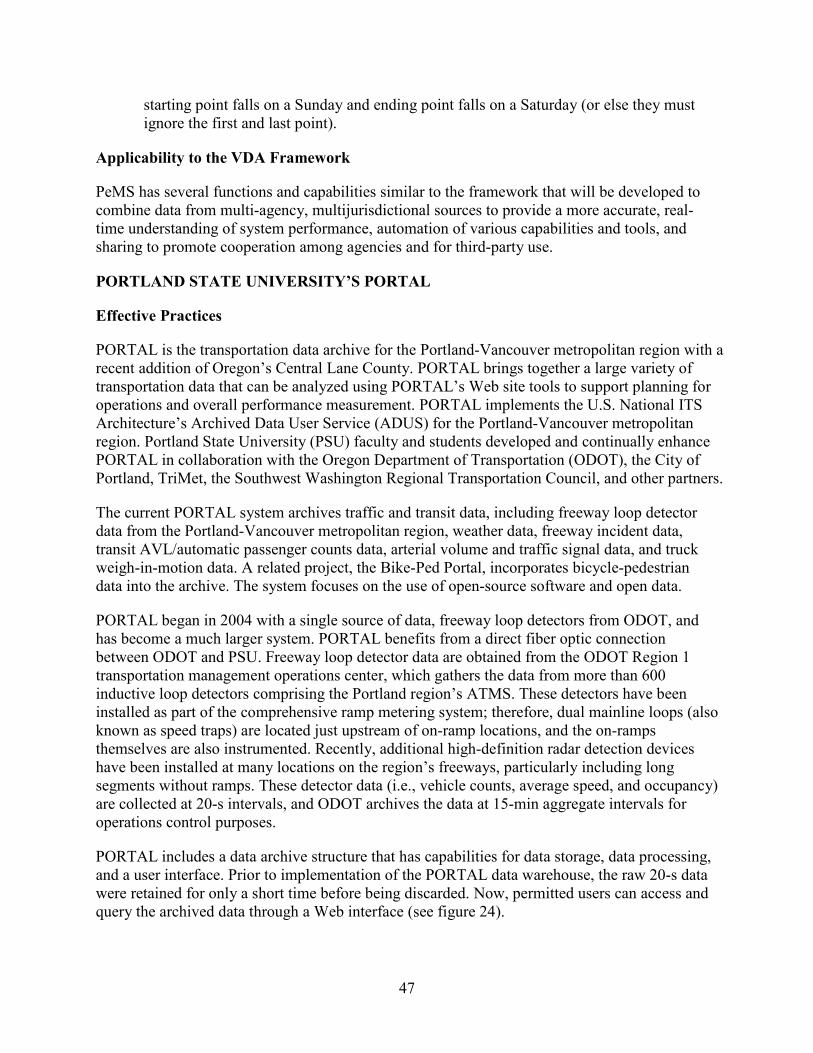
47
starting point falls on a Sunday and ending point falls on a Saturday (or else they must ignore the first and last point).
Applicability to the VDA Framework
PeMS has several functions and capabilities similar to the framework that will be developed to combine data from multi-agency, multijurisdictional sources to provide a more accurate, real-time understanding of system performance, automation of various capabilities and tools, and sharing to promote cooperation among agencies and for third-party use.
PORTLAND STATE UNIVERSITY’S PORTAL
Effective Practices
PORTAL is the transportation data archive for the Portland-Vancouver metropolitan region with a recent addition of Oregon’s Central Lane County. PORTAL brings together a large variety of transportation data that can be analyzed using PORTAL’s Web site tools to support planning for operations and overall performance measurement. PORTAL implements the U.S. National ITS Architecture’s Archived Data User Service (ADUS) for the Portland-Vancouver metropolitan region. Portland State University (PSU) faculty and students developed and continually enhance PORTAL in collaboration with the Oregon Department of Transportation (ODOT), the City of Portland, TriMet, the Southwest Washington Regional Transportation Council, and other partners.
The current PORTAL system archives traffic and transit data, including freeway loop detector data from the Portland-Vancouver metropolitan region, weather data, freeway incident data, transit AVL/automatic passenger counts data, arterial volume and traffic signal data, and truck weigh-in-motion data. A related project, the Bike-Ped Portal, incorporates bicycle-pedestrian data into the archive. The system focuses on the use of open-source software and open data.
PORTAL began in 2004 with a single source of data, freeway loop detectors from ODOT, and has become a much larger system. PORTAL benefits from a direct fiber optic connection between ODOT and PSU. Freeway loop detector data are obtained from the ODOT Region 1 transportation management operations center, which gathers the data from more than 600 inductive loop detectors comprising the Portland region’s ATMS. These detectors have been installed as part of the comprehensive ramp metering system; therefore, dual mainline loops (also known as speed traps) are located just upstream of on-ramp locations, and the on-ramps themselves are also instrumented. Recently, additional high-definition radar detection devices have been installed at many locations on the region’s freeways, particularly including long segments without ramps. These detector data (i.e., vehicle counts, average speed, and occupancy) are collected at 20-s intervals, and ODOT archives the data at 15-min aggregate intervals for operations control purposes.
PORTAL includes a data archive structure that has capabilities for data storage, data processing, and a user interface. Prior to implementation of the PORTAL data warehouse, the raw 20-s data were retained for only a short time before being discarded. Now, permitted users can access and query the archived data through a Web interface (see figure 24).
48
©PORTAL
Figure 24. Screenshot. PORTAL snapshot.(35)
Success Factors
PORTAL has resulted in the following successful outcomes:
• The archive implements a data warehousing strategy that retains large amounts of raw operational data for analysis and decisionmaking processes; these data are stored independently of their operational sources, allowing the execution of time-consuming queries with no impact on critical operational uses.
• To ensure successful data integration, detector locations within the database have been geocoded for interoperability with GISs.
• Data security is a key component of the data archive. A working copy of the database maintained on the primary server is replicated in a compressed format at a remote site. These daily backups ensure that the archive service can be rapidly returned to operation with no significant loss of data if a copy of the database is lost. Both the primary database server and the backup storage are located in climate-controlled machine rooms with uninterruptible power supplies and generator backup power, preventing data loss or gaps in data availability due to power outages. The working copy of the database is stored on a
49
redundant array of independent disks device, providing error detection, redundancy, and the ability to rebuild missing data upon device failures. Finally, hardware maintenance and security updates are provided for all computer systems by experienced systems administration personnel.
• Limited quality control procedures have been applied to identify and mark suspect or erroneous data. Work on additional data quality measures is in process.
• The data and performance measures in PORTAL have been used in the day-to-day management of the transportation system to identify congested areas and incidents and to dispatch incident response or emergency vehicles to the appropriate locations. The Portland region’s MPO has also successfully demonstrated how archived loop detector data can be used to improve travel demand forecasts for the Portland region.
Gaps and Challenges
The following are some of the specific gaps and PORTAL challenges:
• Geospatial referencing is a common and significant challenge for data integration. PORTAL requires inclusion of latitude and longitude in all data sources for output at minimum as a point-based display, but mismatched segments pose an ongoing challenge for numerous agencies.
• Although research institutions generally do not discard data, planning and operations agencies must define how much storage can realistically be useful and how to prioritize data archiving to optimize use of storage.
Applicability to the VDA Framework
In developing PORTAL, significant attention was devoted to ensuring that the archive adhered to the recommendations of the National ITS Architecture. The archive fulfills the following five distinct processing functions that are in accordance with the National ITS Architecture:
• Store data in the same format as received from ITS subsystems.
• Accommodate levels of aggregation and reduction of the data flows, depending on the type of data represented.
• Sample raw data flows for permanent storage in accordance with user specifications. Permanent storage of the sampled data should be either online, offline, or both.
• Apply quality control procedures to the data, including the flagging of suspect data and the editing of data.
• Distinguish among the following data types: unprocessed (raw), edited, aggregated, and transformed.
50
In Portland, there is also an emphasis on the development of a multimodal arterial performance measurement system. The steps for automating such a system within PORTAL are also applicable to the framework.
UNIVERSITY OF WASHINGTON’S TRAFFIC DATA ACQUISITION AND DISTRIBUTION DATABASE
Effective Practices
Funded by FHWA and WSDOT, the Traffic Data Acquisition and Distribution (TDAD) database was developed by the University of Washington to make the data from the WSDOT Traffic Management System available to researchers and planners. A report published in May 2002 presents a methodology that makes it possible “to create, encode, and decode a self-describing data stream” from a variety of sensors (including loops, probe vehicles, radar, and cameras) using the following elements:(36)
• Existing data description language standards. • Parsers to enforce language compliance. • Simple content language that flows from data description language. • Architecture-neutral encoders and decoders based on ASN.
TDAD began recording snapshots of data every 20 s in October 1998 and continued through 2007. These data can be queried by sensor type and location for a specified interval to produce a downloadable text file, which can be imported into external programs for additional analysis.(38) The TDAD system also houses a high-level application to analyze daily traffic counts, although data are only available through the system from 2003 through 2007. The TDAD architecture diagram is shown in figure 25.
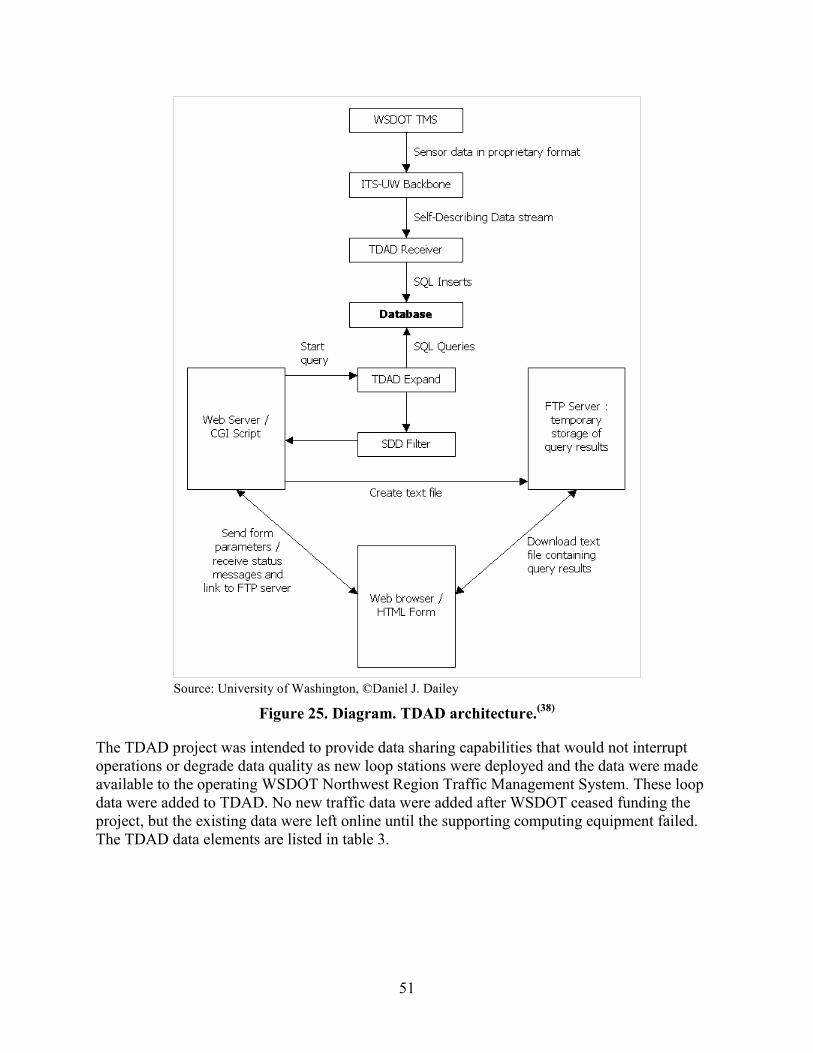
51
Source: University of Washington, ©Daniel J. Dailey
Figure 25. Diagram. TDAD architecture.(38)
The TDAD project was intended to provide data sharing capabilities that would not interrupt operations or degrade data quality as new loop stations were deployed and the data were made available to the operating WSDOT Northwest Region Traffic Management System. These loop data were added to TDAD. No new traffic data were added after WSDOT ceased funding the project, but the existing data were left online until the supporting computing equipment failed. The TDAD data elements are listed in table 3.
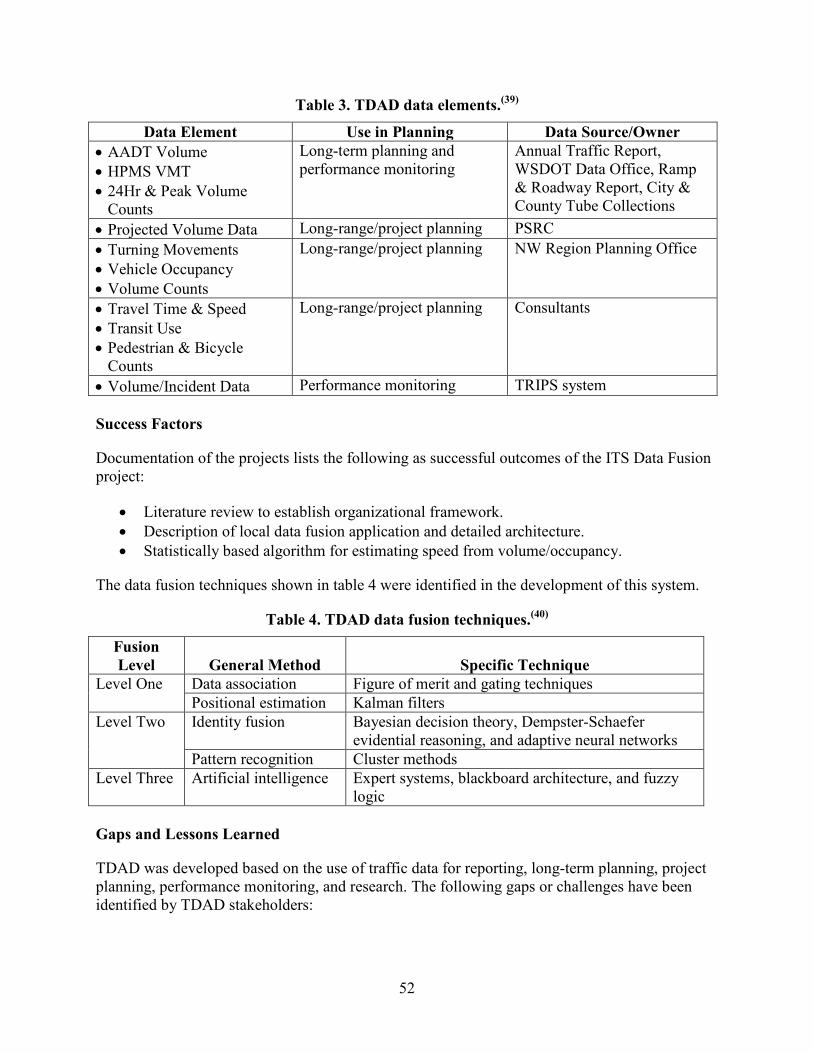
52
Table 3. TDAD data elements.(39)
Data Element Use in Planning Data Source/Owner • AADT Volume • HPMS VMT • 24Hr & Peak Volume
Counts
Long-term planning and performance monitoring
Annual Traffic Report, WSDOT Data Office, Ramp & Roadway Report, City & County Tube Collections
• Projected Volume Data Long-range/project planning PSRC • Turning Movements • Vehicle Occupancy • Volume Counts
Long-range/project planning NW Region Planning Office
• Travel Time & Speed • Transit Use • Pedestrian & Bicycle
Counts
Long-range/project planning Consultants
• Volume/Incident Data Performance monitoring TRIPS system Success Factors
Documentation of the projects lists the following as successful outcomes of the ITS Data Fusion project:
• Literature review to establish organizational framework. • Description of local data fusion application and detailed architecture. • Statistically based algorithm for estimating speed from volume/occupancy.
The data fusion techniques shown in table 4 were identified in the development of this system.
Table 4. TDAD data fusion techniques.(40)
Fusion Level General Method Specific Technique
Level One Data association Figure of merit and gating techniques Positional estimation Kalman filters
Level Two Identity fusion Bayesian decision theory, Dempster-Schaefer evidential reasoning, and adaptive neural networks
Pattern recognition Cluster methods Level Three Artificial intelligence Expert systems, blackboard architecture, and fuzzy
logic Gaps and Lessons Learned
TDAD was developed based on the use of traffic data for reporting, long-term planning, project planning, performance monitoring, and research. The following gaps or challenges have been identified by TDAD stakeholders:
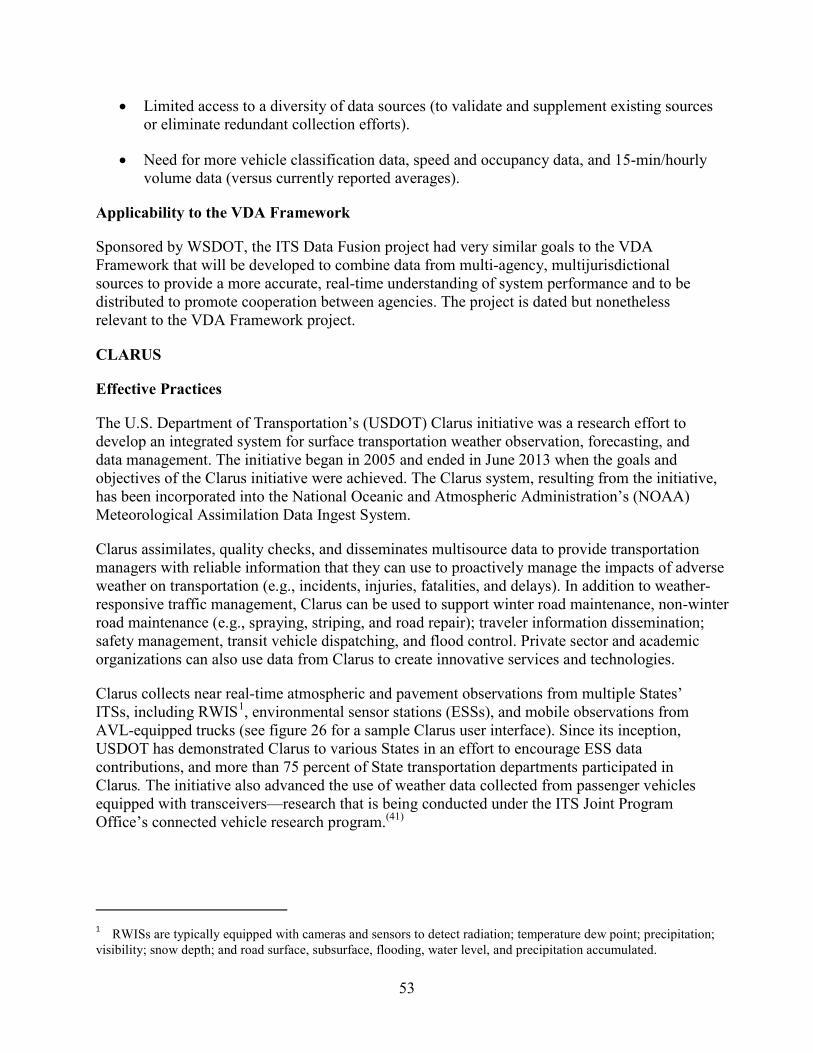
53
• Limited access to a diversity of data sources (to validate and supplement existing sources or eliminate redundant collection efforts).
• Need for more vehicle classification data, speed and occupancy data, and 15-min/hourly volume data (versus currently reported averages).
Applicability to the VDA Framework
Sponsored by WSDOT, the ITS Data Fusion project had very similar goals to the VDA Framework that will be developed to combine data from multi-agency, multijurisdictional sources to provide a more accurate, real-time understanding of system performance and to be distributed to promote cooperation between agencies. The project is dated but nonetheless relevant to the VDA Framework project.
CLARUS
Effective Practices
The U.S. Department of Transportation’s (USDOT) Clarus initiative was a research effort to develop an integrated system for surface transportation weather observation, forecasting, and data management. The initiative began in 2005 and ended in June 2013 when the goals and objectives of the Clarus initiative were achieved. The Clarus system, resulting from the initiative, has been incorporated into the National Oceanic and Atmospheric Administration’s (NOAA) Meteorological Assimilation Data Ingest System.
Clarus assimilates, quality checks, and disseminates multisource data to provide transportation managers with reliable information that they can use to proactively manage the impacts of adverse weather on transportation (e.g., incidents, injuries, fatalities, and delays). In addition to weather-responsive traffic management, Clarus can be used to support winter road maintenance, non-winter road maintenance (e.g., spraying, striping, and road repair); traveler information dissemination; safety management, transit vehicle dispatching, and flood control. Private sector and academic organizations can also use data from Clarus to create innovative services and technologies.
Clarus collects near real-time atmospheric and pavement observations from multiple States’ ITSs, including RWIS1, environmental sensor stations (ESSs), and mobile observations from AVL-equipped trucks (see figure 26 for a sample Clarus user interface). Since its inception, USDOT has demonstrated Clarus to various States in an effort to encourage ESS data contributions, and more than 75 percent of State transportation departments participated in Clarus. The initiative also advanced the use of weather data collected from passenger vehicles equipped with transceivers—research that is being conducted under the ITS Joint Program Office’s connected vehicle research program.(41)
1 RWISs are typically equipped with cameras and sensors to detect radiation; temperature dew point; precipitation; visibility; snow depth; and road surface, subsurface, flooding, water level, and precipitation accumulated.
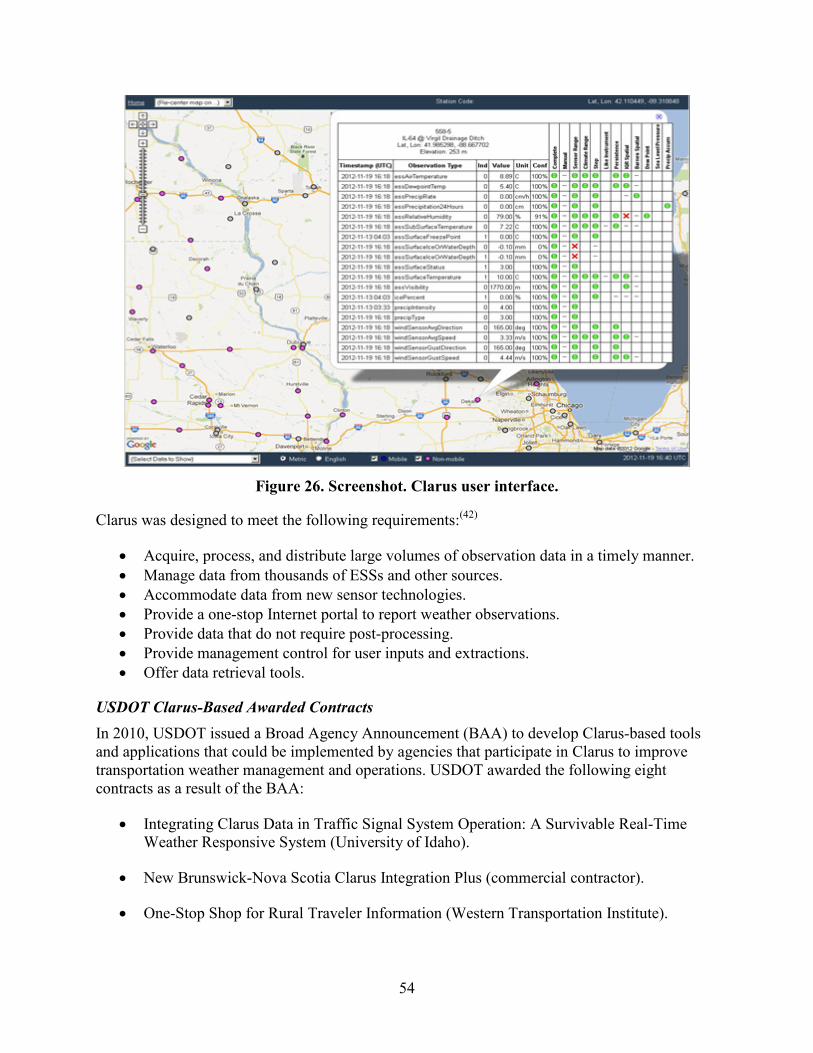
54
Figure 26. Screenshot. Clarus user interface.
Clarus was designed to meet the following requirements:(42)
• Acquire, process, and distribute large volumes of observation data in a timely manner. • Manage data from thousands of ESSs and other sources. • Accommodate data from new sensor technologies. • Provide a one-stop Internet portal to report weather observations. • Provide data that do not require post-processing. • Provide management control for user inputs and extractions. • Offer data retrieval tools.
USDOT Clarus-Based Awarded Contracts In 2010, USDOT issued a Broad Agency Announcement (BAA) to develop Clarus-based tools and applications that could be implemented by agencies that participate in Clarus to improve transportation weather management and operations. USDOT awarded the following eight contracts as a result of the BAA:
• Integrating Clarus Data in Traffic Signal System Operation: A Survivable Real-Time Weather Responsive System (University of Idaho).
• New Brunswick-Nova Scotia Clarus Integration Plus (commercial contractor).
• One-Stop Shop for Rural Traveler Information (Western Transportation Institute).
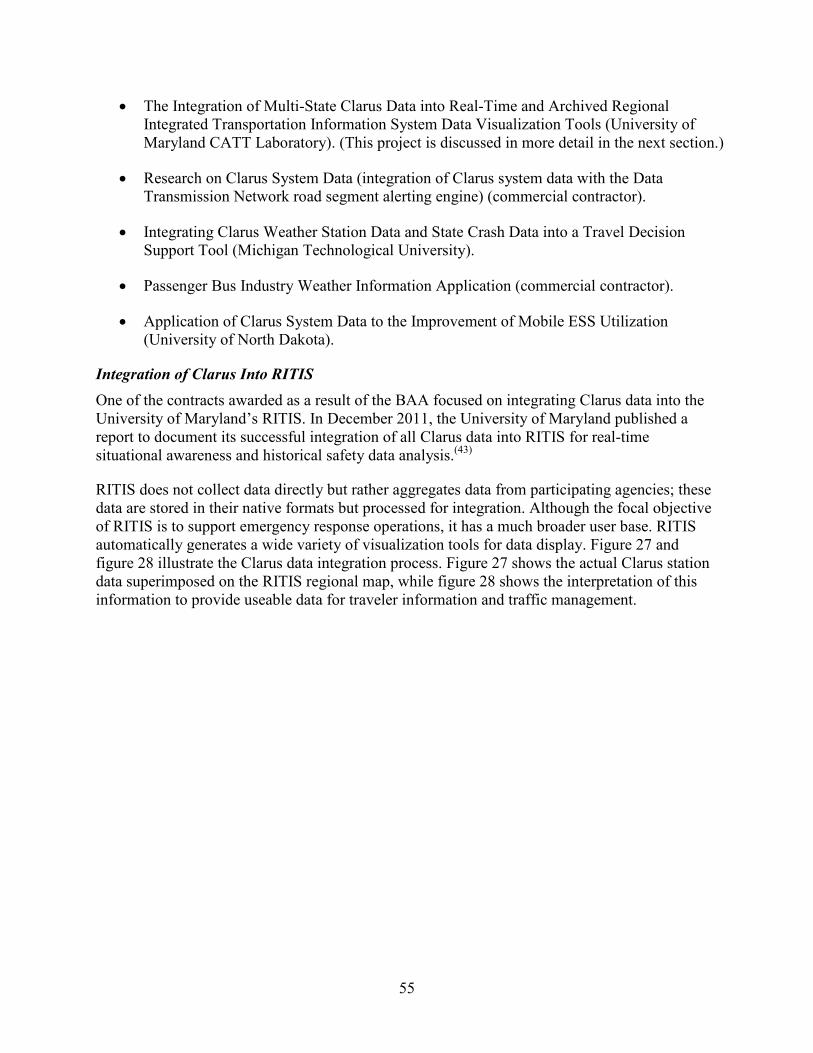
55
• The Integration of Multi-State Clarus Data into Real-Time and Archived Regional Integrated Transportation Information System Data Visualization Tools (University of Maryland CATT Laboratory). (This project is discussed in more detail in the next section.)
• Research on Clarus System Data (integration of Clarus system data with the Data Transmission Network road segment alerting engine) (commercial contractor).
• Integrating Clarus Weather Station Data and State Crash Data into a Travel Decision Support Tool (Michigan Technological University).
• Passenger Bus Industry Weather Information Application (commercial contractor).
• Application of Clarus System Data to the Improvement of Mobile ESS Utilization (University of North Dakota).
Integration of Clarus Into RITIS One of the contracts awarded as a result of the BAA focused on integrating Clarus data into the University of Maryland’s RITIS. In December 2011, the University of Maryland published a report to document its successful integration of all Clarus data into RITIS for real-time situational awareness and historical safety data analysis.(43)
RITIS does not collect data directly but rather aggregates data from participating agencies; these data are stored in their native formats but processed for integration. Although the focal objective of RITIS is to support emergency response operations, it has a much broader user base. RITIS automatically generates a wide variety of visualization tools for data display. Figure 27 and figure 28 illustrate the Clarus data integration process. Figure 27 shows the actual Clarus station data superimposed on the RITIS regional map, while figure 28 shows the interpretation of this information to provide useable data for traveler information and traffic management.
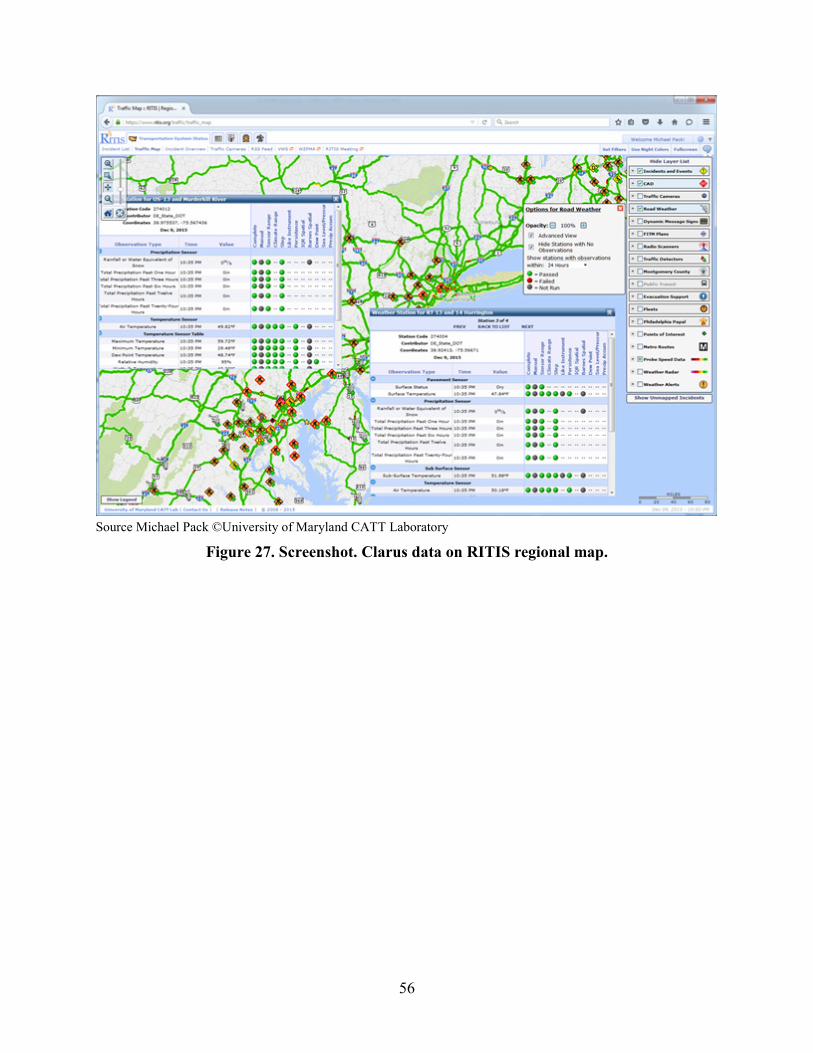
56
Source Michael Pack ©University of Maryland CATT Laboratory
Figure 27. Screenshot. Clarus data on RITIS regional map.
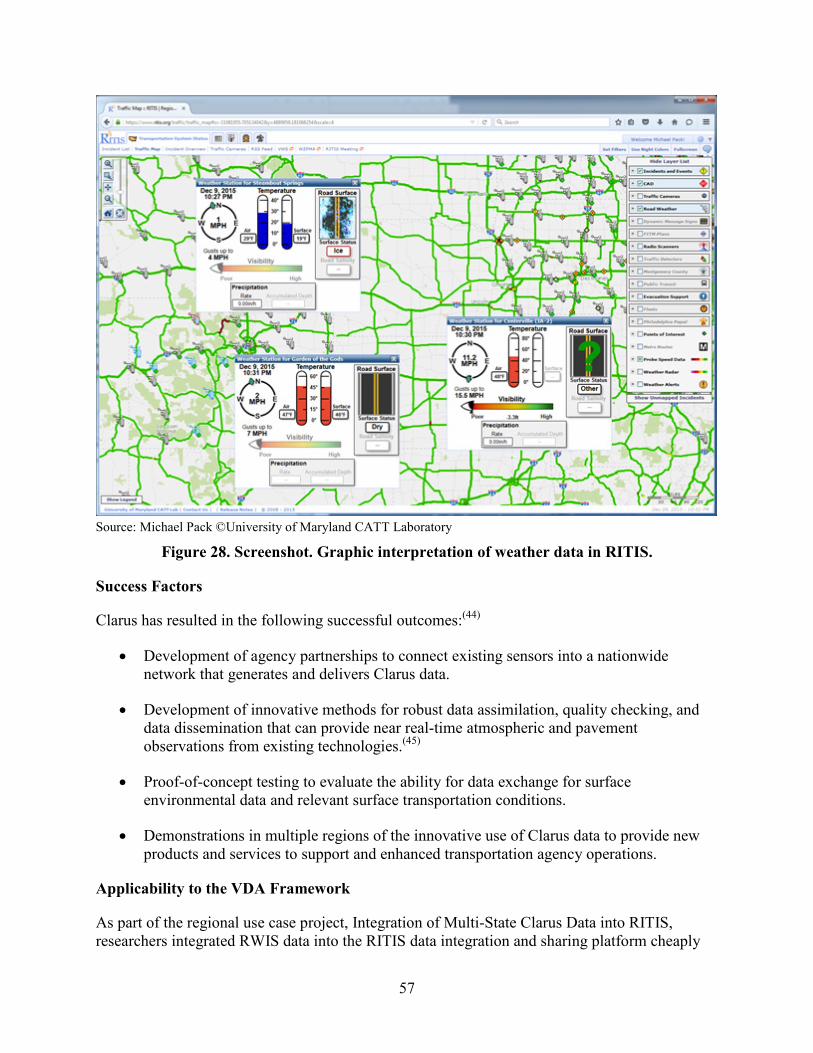
57
Source: Michael Pack ©University of Maryland CATT Laboratory
Figure 28. Screenshot. Graphic interpretation of weather data in RITIS.
Success Factors
Clarus has resulted in the following successful outcomes:(44)
• Development of agency partnerships to connect existing sensors into a nationwide network that generates and delivers Clarus data.
• Development of innovative methods for robust data assimilation, quality checking, and data dissemination that can provide near real-time atmospheric and pavement observations from existing technologies.(45)
• Proof-of-concept testing to evaluate the ability for data exchange for surface environmental data and relevant surface transportation conditions.
• Demonstrations in multiple regions of the innovative use of Clarus data to provide new products and services to support and enhanced transportation agency operations.
Applicability to the VDA Framework
As part of the regional use case project, Integration of Multi-State Clarus Data into RITIS, researchers integrated RWIS data into the RITIS data integration and sharing platform cheaply
58
and quickly as a result of Clarus data integration efforts. The VDA Framework should incorporate similar functionality and include visual analytics tools that allow users to explore the relationships between weather, speed, volume, and incident datasets.
FHWA DATA CAPTURE AND MANAGEMENT PROGRAM TEST DATASETS
Effective Practices
In 2011, the FHWA Real-Time Data Capture and Management (DCM) Program issued a request for procurement for well-documented, quality test datasets available from recent or ongoing operations, field tests, or simulations of emerging technologies that support mobility, environment, transit, freight, weather or other surface transportation research. The test datasets comprised observed data or a combination of observed, derived, and simulated data from the following regions:
• Pasadena, CA: The Pasadena test dataset covers the roadway network in and around Pasadena and includes data collected during September and October 2011. The dataset includes a variety of simulated, real-time, and forecast data. This includes network data (highway network file), demand data (trip tables), network performance data (link volumes, turn volumes, speeds and capacity), work zone data, weather data, CCTV camera data, and changeable message sign data. Data elements were directly collected and processed from these sources, although some data were generated by the Mygistics™ National Traffic Model, which processes live sensor data and fuses them with probe data (AirSage™ mobile telephone call and Internet Protocol (IP) detail records) to produce 15- and 30-min projections of traffic conditions.
• Seattle, WA: The University of Washington submitted a dataset for I-5 in Seattle that included freeway, arterial, freight, and transit data. Data sources included loop detectors, arterial data from automated license plate readers, Bluetooth® Media Control Access readers, traffic signal timing plans, and freight Global Positioning System (GPS) data. This dataset included 6 mo of data.
• Portland, OR: PSU submitted a multimodal dataset that included freeway, transit, and arterial (second-by-second data from signals) data. The test dataset included freeway data consisting of 2 months of data from dual-loop detectors deployed in the main line and on-ramps of I-205; incident data from the ODOT ATMS database and the planned event data from the ODOT Trip-Check Traveler Information Portal information Web site; weather data from NOAA and remote weather information system station data; arterial volume and occupancy data from four single-loop detectors on 82nd Avenue; signal phase and timing data for 32 signals along the 82d Avenue corridor; limited Bluetooth® travel time data; and transit data from Tri-Met, including schedule, stop event, and passenger counts for both bus and light rail. The data collection period for all datasets is September 15 through November 15, 2011.
• San Diego, CA: Berkeley Transportation Systems submitted a dataset that included 1 year of raw and cleaned data for more than 3,000 traffic detectors deployed along 1,250 lane-mi of I-5 in San Diego; cleaned and geographically referenced data for more
59
than 1,500 incidents and lane closures for two sections of I-5 that experienced the greatest number of incidents during 2010; complete trip (origin-to-destination) GPS “breadcrumbs” containing latitude and longitude, vehicle heading and speed data, and time for individual in-vehicle devices updated at 3-s intervals for 10,000 trips taken during 2010; and weather data from 7 weather stations in the San Diego area.
Success Factors
FHWA required the sites to perform the following data cleaning, integration, organization, and documentation activities:
• Clean up data to identify and correct errors, flag suspect data values, and identify periods of missing data.
• Remove personally identifiable information or sensitive personally identifiable information from datasets.
• Produce datasets that combine or integrate data from multiple source types (e.g., travelers, vehicles, and infrastructure), multiple source agencies (e.g., transportation departments, commercial freight companies, and transit agencies), or multiple modes (e.g., light vehicles, commercial vehicles, and transit vehicles).
• Provide documentation of the dataset contents and formats.
• Provide ASTM-compliant metadata describing data quality, relationship to other data, and information about where and when each value was captured.
The test datasets provide tangible and broadly accessible examples of data sharing and integration that resolved cross-cutting issues such as data integration formats, data standardization, data quality, and data sharing. Sites were required to meet open data principles that allow the Government to share the datasets and corresponding documentation with other researchers, connected vehicle application developers, and the general public under the terms of the Open Data Commons Attribution License. The test datasets and documentation are available through the Research Data Exchange Web site (https://www.its-rde.net).(46)
Gaps and Lessons Learned
The Pasadena, CA, project team documented the following key findings and lessons learned in compiling the Pasadena test dataset:(47)
• Supply of real-time input data: More fixed detector coverage, more probe vehicles, and more roadside infrastructure are needed. The project team must ensure data are synthesized, packaged, and delivered in time for consumption by downstream intelligence and analytics tools.
• Data standardization and open data structure: Some standards, protocols and open structure for traffic management and traveler information exist, such as Institute of Electrical and Electronic Engineers 1512, Family of Standards for Incident Management
60
Message Sets (https://www.standards.its.dot.gov/Factsheets/Factsheet/12).(48) However, this is not the case for all data feeds, and it was necessary to develop ad hoc importers for those feeds.
• The following components are necessary to support high-quality, high-resolution data for real-time traffic operations:
o Junction details: Providing junction details such as turn delay, capacities, and lane groupings required significant effort to manually code and synthesize geometric layout and signal control parameters from multiple data sources such as public agencies (e.g., City of Pasadena) and others (e.g., online Google Maps™ and Google Street View™).
o Traffic data feeding into the real-time model: The traffic forecast system accounted for the impacts of construction work zones, road closures, and incidents, but could not include adverse weather; this is because inadequate research was performed on modeling weather impacts on road capacity and speed. The researchers found that key parameters such as “number of lanes affected” were missing from coded incident reports, even though the information could be deduced from the incident description. Screening and filtering pre-steps are important for improving data quality.
o Geospatial referencing of event locations: The event data feeds (e.g., construction work zones, incidents) each used different referencing schemes, which had to be taken into account when developing the real-time traffic model. Incident data used latitude and longitude referencing and road name and cross street information, while construction work zones used linear referencing by milepost markers. The researchers found that latitude and longitude data were often inaccurate for geocoding to the network and that multiple referencing systems were needed for cross-checking. They suggested the need for a regional or national standard for geospatial referencing event data and location attributes.
• Development and maintenance of a real-time traffic modeling system requires the following:
o Highly efficient data integration: Many automated processes were required to replace time-consuming data collection and quality control work for all system components, including network supply (from navigation network), travel demand (from MobileODTM process) and traffic control (signal control and ramp meter from existing VISUM tools).
o Robust computing infrastructure: The data collection system resided on a Windows® 7 Professional Edition virtual machine, with the IP address being authenticated by the live data host servers (e.g., RITIS and Caltrans PeMS systems). Because the virtual machine is within a private cloud computing environment, researchers experienced system downtime during events such as power outages, abnormalities in IP address authentication, and in system time online synchronization.
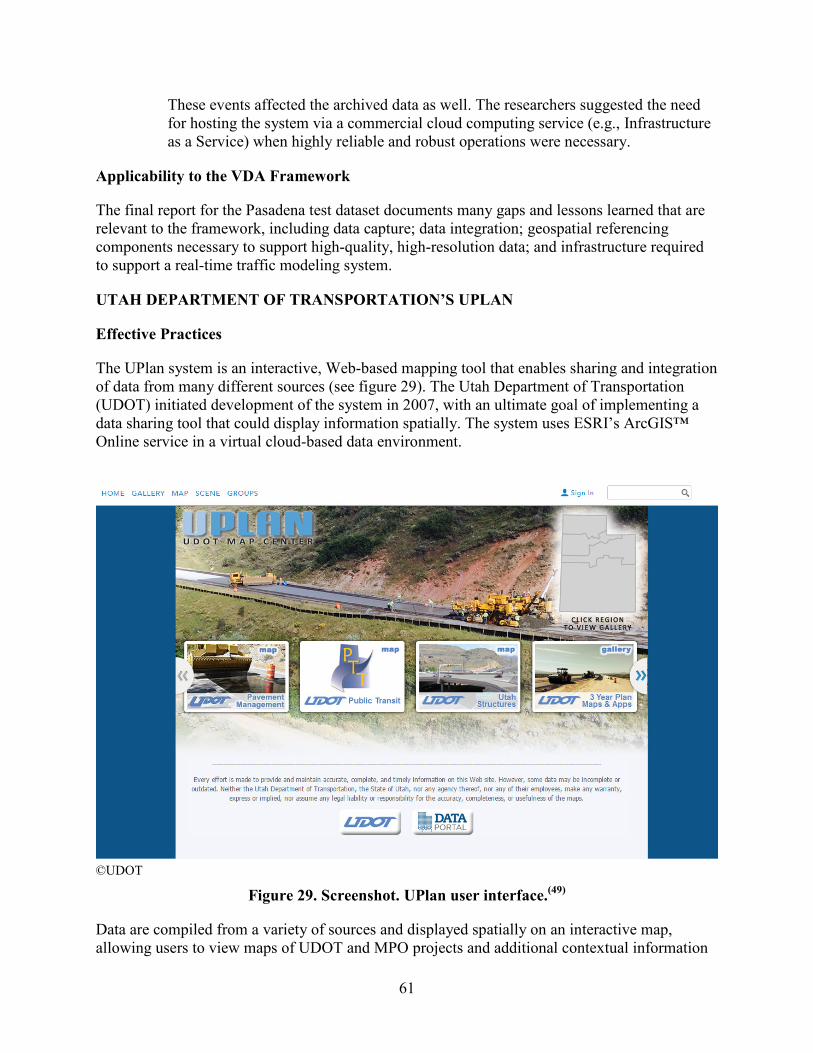
61
These events affected the archived data as well. The researchers suggested the need for hosting the system via a commercial cloud computing service (e.g., Infrastructure as a Service) when highly reliable and robust operations were necessary.
Applicability to the VDA Framework
The final report for the Pasadena test dataset documents many gaps and lessons learned that are relevant to the framework, including data capture; data integration; geospatial referencing components necessary to support high-quality, high-resolution data; and infrastructure required to support a real-time traffic modeling system.
UTAH DEPARTMENT OF TRANSPORTATION’S UPLAN
Effective Practices
The UPlan system is an interactive, Web-based mapping tool that enables sharing and integration of data from many different sources (see figure 29). The Utah Department of Transportation (UDOT) initiated development of the system in 2007, with an ultimate goal of implementing a data sharing tool that could display information spatially. The system uses ESRI’s ArcGIS™ Online service in a virtual cloud-based data environment.
©UDOT
Figure 29. Screenshot. UPlan user interface.(49)
Data are compiled from a variety of sources and displayed spatially on an interactive map, allowing users to view maps of UDOT and MPO projects and additional contextual information
62
in a project’s area. External agencies, such as MPOs and utility companies, have also contributed data to the site. Key features of UPlan include the following:
• Group creation and user management: Users can form groups both within an agency and with members of other agencies to share data and reports.
• Rapidly produced reports: Users can quickly generate reports to examine resource details, project impacts, and management or stewardship boundaries.
• Publicly viewable map presets: UPlan allows agencies to post and distribute publicly accessible maps with predetermined features and symbology. These maps can be easily updated to ensure consistent availability and sharing of information.
• Incorporation of server-based or local data into preset maps: Users can upload their own datasets or use publicly available Web server data available to overlay on an existing map.
• Utilization as a development tool: UPlan provides a platform for the development and testing of custom applications. For example, users can view future UDOT projects along with planned utility improvements to see potential conflicts, or they can display critical environmental attributes such as streams, wetlands, and rare plant habitat on top of planned roadway capacity projects for any location in Utah. UDOT also recently put a roadway design project in UPlan and added the electric utility data; State Historic Preservation Office historic and archeological data; UDOT’s safety, pavement, bridges, traffic, environmental, freight, and State Transportation Improvement Plan (historical and current information); and many other data sources.
In terms of recommended protocol and standards for data submittals, the system is flexible enough to accommodate a variety of schemas. UDOT has documented guidance for data management, as well as a user guide for the system.
Success Factors
UPlan has resulted in the following successful outcomes:(50,51)
• Allows agencies to share data in a common location while viewing and analyzing it for their own needs. This has enabled data silos to be combined and viewed together to allow for better collaboration among agencies.
• Provides an easy-to-use tool designed for a broader, nontechnical audience. It enables quick access to information and eliminates the need to go through three or four data silo owners.
• Improves and promotes partnering. UPlan has created new relationships and strengthened existing relationships with other State agencies, Federal agencies, MPOs, the Utah Transit Agency, local governments, utility companies, and among the many divisions within UDOT.
63
• Encourages broad participation in the transportation planning process because it presents data in an easy-to-understand format and allows participants to bring their own data to the table. It has also improved the ability to engage public comment and participation in the planning process.
• Created a catalyst for developing additional planning partnerships as a result of the discovery of data gaps. For example, mapping freight rail corridors and major activity centers has spurred dialogue to begin the planning process for a new freight railway.
• Allows UDOT to work with other States and organizations to help them implement their own versions of UPlan. There is a relatively low start-up cost ($1,000 to $2,000) for these States to share basic information. Some organizations are making it an enterprise system, while others are adding data as needed and leveraging all of the data in UPlan for their work.
Gaps and Lessons Learned
Several sources have documented the following gaps and lessons learned from UPlan:(51,52)
• UDOT initially hosted the system on its server, which required a significant amount of time and labor costs to maintain, manage, and upload datasets; modify access rights to the site; and maintain and update the system’s functionality. However, shifting the tool to a Web-based application eliminated many of these management and back-end challenges.
• With so much information coming into UPlan, UDOT is working to develop better ways to navigate the data and allow users to customize UPlan for their own dataset needs and with a look and feel specific to their organization.
• UDOT is continuing work to ensure data are displayed as accurately as possible while balancing data quality concerns of individual agencies.
• UDOT is testing the integration of performance measures into UPlan as part of a prototype project to display UDOT’s strategic goals and compare them with the goals of other partner agencies. UDOT’s strategic goals are zero crashes, injuries and fatalities; preserve infrastructure; and optimize mobility.(54) It has been able to use UPlan to display performance measures for asset management, safety, and capacity, and it is evaluating measures for efficiency.
Applicability to the VDA Framework
The UPlan system is an example of a successful virtual cloud based data environment that has enhanced data integration, data sharing, and transportation planning activities at UDOT. The success factors and lessons learned are all applicable to the framework.
64
FLORIDA DEPARTMENT OF TRANSPORTATION’S ITS DATA CAPTURE AND PERFORMANCE MANAGEMENT TOOL
Effective Practices
The ITS Data Capture and Performance Management Tool (ITSDCAP) was developed by the Florida Department of Transportation (FDOT) as a data environment to capture and fuse data from multiple sources to support applications such as performance measurement, transportation system modeling, assessment of ITS application benefits, and data mining and visualization techniques. The tool has recently been updated to become Web-based and is integrated with a real-time decision support environment also developed for FDOT. The tool includes the following functionality:(54)
• Data capture and fusion: Data capture and fusion come from multiple sources, including ITS. If the data come from a system that does not already check for data quality, the tool checks, filters, and repairs missing data by imputation to ensure data quality. Data fusion is accomplished through a common spatial and temporal referencing scheme.
• Performance measures: ITSDCAP uses performance measures to assess the performance of transportation systems, including mobility, reliability, safety, and environmental measures, as well as to produce performance dashboards.
• Decision support tools: A number of offline and real-time decision support tools that assess bottleneck breakdowns and event impacts have been incorporated in the tool.
• Data mining: Data mining techniques allow discovery of patterns and trends in condition data.
• ITS evaluation: These capabilities generate input parameters for the ITS Data Capture and Performance Management Tool to calculate ITS benefits and benefit/cost ratios at the planning level. In addition, the tool can perform before–after analysis for a number of ITS applications.
• Real-time data.
• Model support: Model support is used to generate input parameters for modeling efforts such as traffic demand forecasting, dynamic traffic assignment, analytical traffic analysis procedures, and simulation models. As part of an ongoing FDOT project on multiresolution simulation, utilities are being produced to link ITSDCAP-generated data to NeXTA.
• Map visualization: Maps of performance measures are used to better understand available data and calculated performance measure values.
ITSDCAP allows data capture and grouping from the following sources:
• SunGuide® ITS sensor data at 20-s aggregation level and lane-by-lane level.
• Statewide ITS data warehouse data at 5-min aggregation level.
65
• SunGuide® DMS activation data.
• SunGuide® incident management database.
• Florida Highway Patrol incident database.
• Private sector travel time data.
• Automatic vehicle identification (AVI) data (Bluetooth® and Wi-Fi).
• Inrix® data.
• Work zone/construction database.
• Number of 511 calls and Web site hits at an aggregation level of 15 min per corridor per county.
• Dynamic pricing on managed lanes and ramp metering data.
• FDOT Crash Analysis Reporting system.
• Police crash archives.
• Weather data from RWIS.
• FDOT statistics database.
A new FDOT project is investigating incorporating connected vehicle data into the tool. A high-level diagram of the ITSDCAP tool is shown in figure 30.
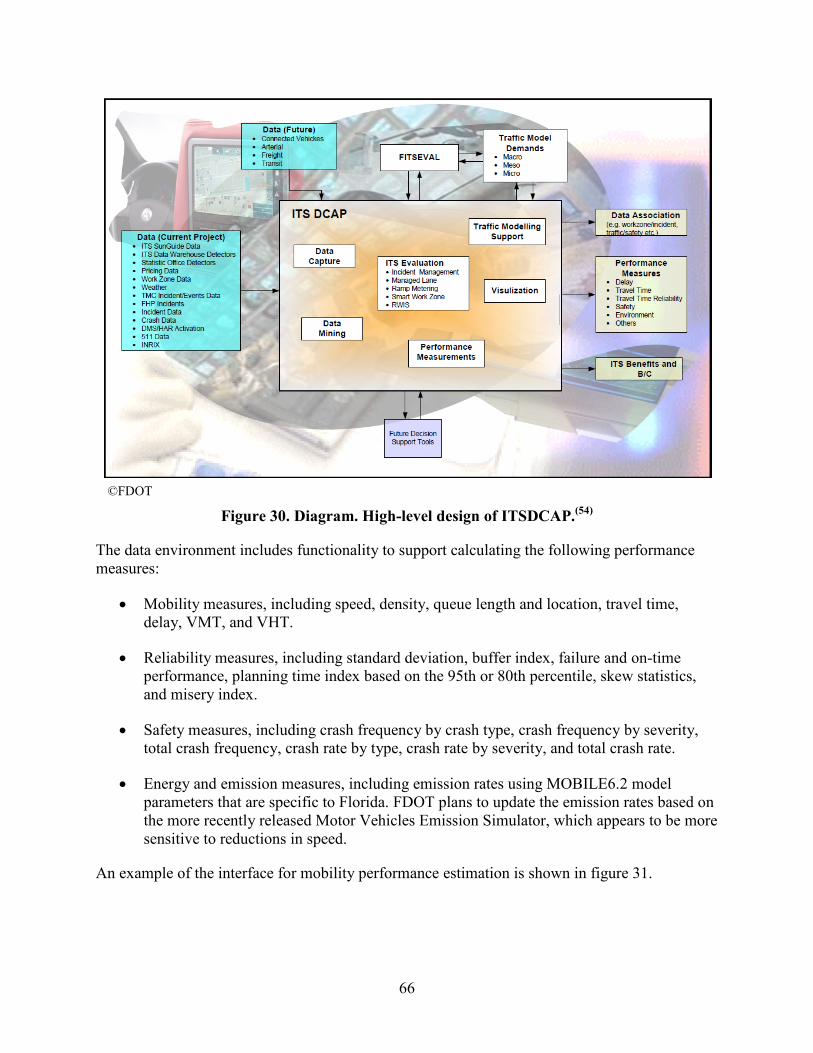
66
©FDOT
Figure 30. Diagram. High-level design of ITSDCAP.(54)
The data environment includes functionality to support calculating the following performance measures:
• Mobility measures, including speed, density, queue length and location, travel time, delay, VMT, and VHT.
• Reliability measures, including standard deviation, buffer index, failure and on-time performance, planning time index based on the 95th or 80th percentile, skew statistics, and misery index.
• Safety measures, including crash frequency by crash type, crash frequency by severity, total crash frequency, crash rate by type, crash rate by severity, and total crash rate.
• Energy and emission measures, including emission rates using MOBILE6.2 model parameters that are specific to Florida. FDOT plans to update the emission rates based on the more recently released Motor Vehicles Emission Simulator, which appears to be more sensitive to reductions in speed.
An example of the interface for mobility performance estimation is shown in figure 31.
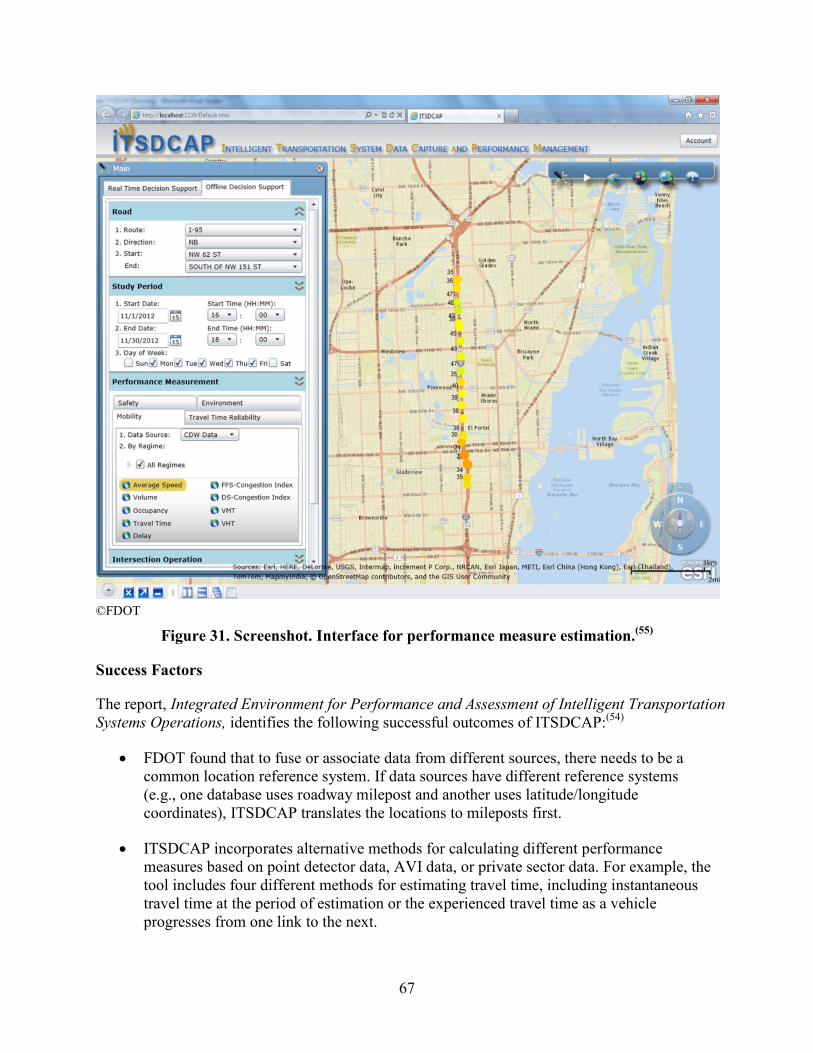
67
©FDOT
Figure 31. Screenshot. Interface for performance measure estimation.(55)
Success Factors
The report, Integrated Environment for Performance and Assessment of Intelligent Transportation Systems Operations, identifies the following successful outcomes of ITSDCAP:(54)
• FDOT found that to fuse or associate data from different sources, there needs to be a common location reference system. If data sources have different reference systems (e.g., one database uses roadway milepost and another uses latitude/longitude coordinates), ITSDCAP translates the locations to mileposts first.
• ITSDCAP incorporates alternative methods for calculating different performance measures based on point detector data, AVI data, or private sector data. For example, the tool includes four different methods for estimating travel time, including instantaneous travel time at the period of estimation or the experienced travel time as a vehicle progresses from one link to the next.
68
• Methods to evaluate benefits of freeway-related ITS implementations, including incident management, ramp metering, managed lanes, smart work zone, and road weather information system, were developed.
• Decision support tools based on data from different sources were developed. Other fused data can be output for analysis using external dining mining techniques.
Gaps and Lessons Learned
The data environment initially focused on freeway facilities, but FDOT is updating the system to include data from signalized arterials and connected vehicles. The tool has been converted to a Web-based tool that significantly improved its usability and accessibility. There are possibilities of the inclusion of transit and freight information in the tool.
Applicability to the VDA Framework
ITSDCAP has several functions and capabilities that are relevant to the framework, including the development of systems and processes for combining and sharing data from multiple data sources with different location referencing, quality, and aggregation levels; incorporation of alternative methods for calculating performance measures based on the data source (e.g., point-based detector data, AVI data, or private sector data); data mining and visualization capabilities; and adaptation of the tool to generate output for use in external ITS evaluation and modeling applications.
69
CHAPTER 4. TECHNICAL INTEGRATION FORMATS
GEOGRAPHIC REFERENCING AND RESOLUTION
Nearly all transportation data can be associated with a geographic location. Therefore, GIS technology, which allows data collected by different sources to be displayed together on a common map, is seen as a primary data integration tool. Most, if not all, of the examples cited in the previous chapter use GIS as the platform for integrating, analyzing, and visualizing transportation data based on locational proximity.
A key factor in determining how well transportation data can be integrated is the locational referencing method used to describe where each transportation data item is located. The following are the three principal locational referencing method typologies, with each typology having numerous variations:
• Geographic coordinates: Locations are defined by a pair of numbers that correspond to a unique point on the Earth’s surface. The most common coordinate system is latitude and longitude (lat/lon). Lat/lon is also the native coordinate system of the GPS, which is used extensively in surveying, vehicle navigation, vehicle tracking, and incident reporting (i.e., crash locations). However, other coordinate systems (e.g., State Plane) also exist and are still used by many transportation agencies as the primary referencing method for storing location information in various transportation databases. Fortunately, equations exist to translate between different coordinate systems, and most commercial GIS software platforms include these translation equations as part of their basic toolbox.
• Linear referencing: This method locates features, events, and changes in attributes along a roadway (or other transportation networks) by defining both a unique identifier for each route or road segment and a linear measurement along that route from a specified reference point to each feature of interest. The most common linear referencing methods used by transportation agencies are route milepoint, where all linear measurements are made from the start of the defined route, and reference point offset, where linear measurements are made relative to well-defined (usually visible) reference markers (e.g., an intersection, bridge, or milepost marker) along the defined route. Another form of linear referencing is street address ranges, where the street name corresponds to the unique route identifier, and each street address number represents a coarse linear measurement along the named street. Linear referencing is used extensively by State transportation agencies for collecting, storing, and reporting data on transportation infrastructure. Several different linear referencing systems (LRSs) may be in use within the same transportation agency to link to specific legacy databases (e.g., one LRS may be used to locate pavement conditions, while another may be used for locating roadway attributes such as number of lanes, shoulder width, or functional class). Most State transportation agencies spend significant GIS staff resources to maintain, update, and reconcile the locations of roadway data referenced using alternative LRSs. There are currently no national standards or even clear
70
guidelines for developing or updating various LRSs; each agency’s approach is unique, and translating between different systems must be handled on a case by case basis.
• Locational proxies: This method uses other geographic entities to specify an approximate location for a transportation feature or event. Typically, the locational proxy represents a predefined area (e.g., a county, incorporated place, highway maintenance district, or legislative district) that provides sufficient locational information for a specific application. Each area can be represented by a polygon feature in a GIS and is identified by a standard identification code (e.g., county Federal Information Processing Standard code). A type of locational proxy that is unique to traffic data reporting is the traffic message channel (TMC) code. The TMC code is a quasi-industry standard for identifying a section of highway for the purpose of locating and reporting real-time traffic volumes, travel times, or incident events between automated monitoring devices, traffic management centers, traffic reporters, and in-vehicle navigation systems. Each TMC code is a nine-character code that defines a physical section of road. On limited access divided highways, each directional travel way has its own code, and each section typically extends from interchange to interchange. Each interchange also has separate codes for each intersecting route in each direction. The TMC code provides a compact, efficient means of transmitting location data between automated devices, but to display the traffic information contained in the message, the TMC codes must be linked to a geospatial roadway database. Currently, only commercial navigation databases (e.g., NavTeq™, TomTom™, or Google™) have incorporated TMC codes as attributes in their roadway databases.
Another critical component needed for integrating transportation data using GIS technology is the geospatial database representing the physical roadway network itself. Typically, most roadway networks are depicted geospatially as linear features, where each line segment represents the approximate centerline of the roadway (or directional travel way for physically separated divided highways). The positional accuracy of the line representing the roadway centerline can vary significantly between different databases, although most State transportation agencies (and commercial navigation data developers) currently are maintaining roadway centerline databases that have positional accuracies ranging from 10 to 40 ft of ground truth. This level of positional accuracy is generally adequate for locating, displaying, and linking most transportation-related attributes, features, and events to the roadway centerline and through the roadway centerline to one another.
Roadway centerline databases also vary significantly with respect to which roads are included and what attribute data are included for each road segment. Historically, roadway databases developed by State transportation agencies include centerline geometry and attributes only for those roads that were specifically maintained by the State or that were required for Federal reporting purposes (e.g., HPMS). Relatively few State transportation agencies maintain a complete, integrated centerline database for all public roads, and none of them routinely update roadway attribute data on roads that are maintained by other agencies. Commercial navigation databases do include all public (and even some private) roads and update key roadway attributes needed for vehicle navigation and routing (e.g., one-way streets, vehicle restrictions, speeds, etc.) through a combination of primary data collection and data sharing with State and local government agencies, and even private freight transportation providers (e.g., UPS®, FedEx®).
71
To provide a common framework for integrating transportation data, the roadway centerline database must include certain specific attributes that facilitate translation between the various referencing methods described earlier in this section. To integrate State road inventory and condition data, the roadway centerline database must include, for each road segment feature, a route identifier and linear measures corresponding to the start and end points of the road segment along the specified route. If roadway attribute data are maintained using more than one LRS, similar attributes must be included for each LRS. To integrate traffic data that are geographically referenced using TMC codes, each road segment feature must also include the associated TMC code representing its location. While multiple road segments may share the same TMC code (e.g., a long stretch of highway between interchanges, or segments representing individual ramps within an interchange), road segments should be split wherever the TMC code changes.
Common geospatial editing and analysis functions can be used to link some data items to the roadway centerline database based on spatial proximity. For example, roadway data referenced using geographic coordinates can be “snapped” to the nearest point on the roadway centerline database. That point on the roadway centerline can be translated into a milepoint measure on a specific route, enabling its display and analysis together with other linear referenced attribute data. The critical assumption in using spatial proximity is that the positional accuracies of both the coordinate referenced data item and the roadway centerline alignment are close enough to ensure that any spatial search finds the correct match. As the relative positional accuracies of either spatial feature decline, the likelihood of matching the data item to the wrong roadway centerline increases, requiring additional validity checks, and more time to complete them.
Another consideration in using roadway centerline databases as the common framework for integrating transportation data is whether a centerline depiction provides sufficient feature resolution for its intended application. Typically, a roadway centerline database does not display or explicitly identify individual travel lanes unless they are physically separated by a median or other barrier. This means that information on events or incidents that affect one or more but not all lanes of a roadway (e.g., a crash or roadway construction that blocks the outside travel lane) cannot be explicitly displayed using just a roadway centerline network. There are methods available to graphically display roads with multiple concurrent lanes, but to accurately locate lane-level features and events requires additional locational attributes. For example, commercial navigation databases include lane-specific information using a standard lane identification convention (e.g., lanes are numbered consecutively, beginning with the inside travel lane (leftmost, in the direction of travel) as lane one, and proceeding outward). These conventions are used in RITIS to display detailed traffic volumes at the individual lane level.
Geospatial, a Web portal for sharing geographic information (http://www.data.gov/geospatial/) developed by the Federal Government in 2003, also faced many organizational issues.(56) Geospatial is a public gateway for improving access to geospatial information and data under the Geospatial e-government initiative. Geospatial’s Web portal unifies geospatial data found among 69 Federal and 79 State and local government clearinghouses by using behind-the-scenes search tools to find and display data. Geospatial orchestrates new practices for data-sharing and system interoperability by developing an open system standard that defines a Web-enabled geospatial architecture. Metadata describing the geospatial data on the clearinghouses follow a standard reporting framework to make the information accessible to the Geospatial search tools.

72
TEMPORAL RESOLUTION
The importance of temporal referencing and resolution for integrating transportation data depends heavily on the specific application and the data being integrated. Most of the roadway inventory data maintained by State transportation agencies is temporally stable and may be updated only once a year or at the conclusion of a specific highway maintenance or construction project.
By contrast, traffic conditions change continuously. The frequency with which traffic condition data are updated depends on the methods by which the data are collected and transmitted, how they are processed, and the purposes for which the data are being used. For example, traffic operations centers require near real-time streaming of actual traffic conditions (i.e., volumes, incident locations, etc.) to enable traffic managers to take tactical corrective actions and to see how traffic responds to those actions. Transportation planners, however, typically want traffic data that have been summarized over various time periods (e.g., by 5-min periods over a day, daily over a week or month, or simply AADT). Creating these summaries requires substantial data storage capacity; automated procedures to select, extract, process, and display data of interest; and updating procedures to add new data to the repository on a continuous basis.
Integration of geospatially referenced data having different temporal resolution requires the development of data aggregation and visualization procedures, in close coordination with the end users, for how (near) real-time data will be summarized and displayed. For example, some users may want to view a historical replay of traffic conditions at 5-min intervals for a specific day. Other users may want to produce graphs showing the average hourly weekday traffic volumes and variances along a specific roadway over the past year. Still other users may simply want to update the AADT data items for all roads based on traffic volumes collected over the past year.
To support these diverse user requirements, data storage formats need to be established that enable efficient selection, extraction, and summarization of individual traffic data records. At a minimum, the data formats should standardize both geospatial and temporal references. For geospatial referencing, either geographic coordinates or TMC codes should be sufficient, provided that TMC codes are attached to the geospatial roadway centerline database. For temporal referencing, standardized representation of dates (e.g., YYYYMMDD) and time (e.g., HHMMSS, 24-h clock) should be attached to each data record. If raw incoming data are not transmitted in the standardized format, they need to be converted as part of the extract, transform, and load procedure.
QUALITY CONTROL AND ASSURANCE
Quality control procedures are necessary if archived data are to be usable for a variety of applications. The quality of archived data from traffic operations systems has been influenced by the following two prevailing issues:
• The difficulty of maintaining extensive electronic field equipment (sensors and communication).
• Real-time traffic operations applications that have different data quality requirements than historical uses of archived operations data.
73
The result has been that some managers and users of data archived from traffic operations have wrestled with data quality problems. The following quality assurance strategies are the most important when using archived operations data:
• Improve data quality at the source (if possible) and avoid “scrap and rework.” • Apply business rules (quality checks) to automate the identification of invalid data. • Make data quality results available to data and information consumers. • Consider the development of data quality standards to ensure a base level of quality.
Traffic Data Quality Measurement is an excellent source for methods and tools that enable traffic data collectors and users to determine the quality of traffic data they are providing, sharing, and using.(57) The report presents a framework of methodologies for calculating the data quality metrics for different applications. The report also presents guidelines and standards for calculating data quality measures to address the following key traffic data quality issues: defining and measuring traffic data quality, quantitative and qualitative metrics of traffic data quality, acceptable levels of quality, and methodology for assessing traffic data quality.
The framework is developed based on the six recommended fundamental measures of traffic data quality defined as follows:(58)
• Accuracy: The measure or degree of agreement between a data value or set of values and a source assumed to be correct. It is also defined as a qualitative assessment of freedom from error, with a high accuracy assessment corresponding to a small likelihood of error.
• Completeness (also referred to as availability): The degree to which data values are present in the attributes (e.g., volume and speed are attributes of traffic) that require them. Completeness is typically described in terms of percentages or number of data values. It can refer to both the temporal and spatial aspect of data quality in the sense that completeness measures how much data are available compared with how much data should be available.
• Validity: The degree to which data values satisfy acceptance requirements of the validation criteria or fall within the respective domain of acceptable values. Data validity can be expressed in numerous ways. One common way is to indicate the percentage of data values that either pass or fail data validity checks.
• Timeliness: The degree to which data values or a set of values are provided at the time required or specified. Timeliness can be expressed in absolute or relative terms.
• Coverage: The degree to which data values in a sample accurately represent the whole of that which is to be measured. As with other measures, coverage can be expressed in absolute or relative units.
• Accessibility (also referred to as usability): The relative ease with which data can be retrieved and manipulated by data consumers to meet their needs. Accessibility can be expressed in qualitative or quantitative terms.
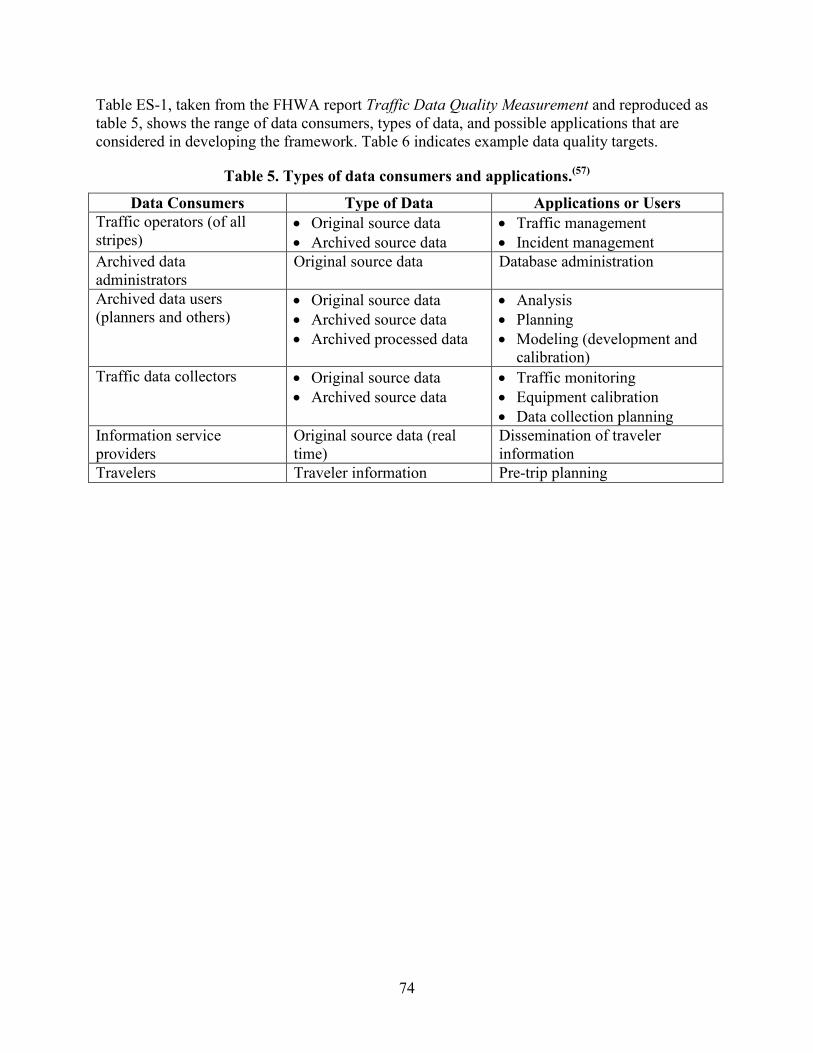
74
Table ES-1, taken from the FHWA report Traffic Data Quality Measurement and reproduced as table 5, shows the range of data consumers, types of data, and possible applications that are considered in developing the framework. Table 6 indicates example data quality targets.
Table 5. Types of data consumers and applications.(57)
Data Consumers Type of Data Applications or Users Traffic operators (of all stripes)
• Original source data • Archived source data
• Traffic management • Incident management
Archived data administrators
Original source data Database administration
Archived data users (planners and others)
• Original source data • Archived source data • Archived processed data
• Analysis • Planning • Modeling (development and
calibration) Traffic data collectors • Original source data
• Archived source data • Traffic monitoring • Equipment calibration • Data collection planning
Information service providers
Original source data (real time)
Dissemination of traveler information
Travelers Traveler information Pre-trip planning
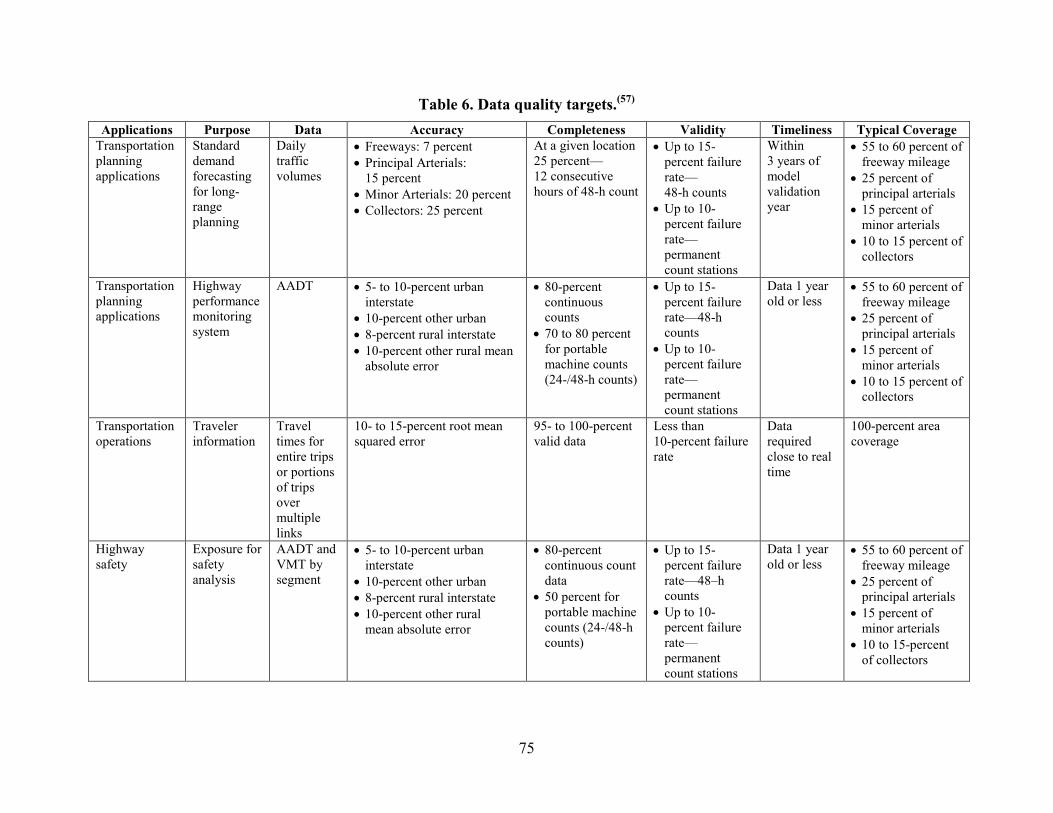
75
Table 6. Data quality targets.(57)
Applications Purpose Data Accuracy Completeness Validity Timeliness Typical Coverage Transportation planning applications
Standard demand forecasting for long-range planning
Daily traffic volumes
• Freeways: 7 percent • Principal Arterials:
15 percent • Minor Arterials: 20 percent • Collectors: 25 percent
At a given location 25 percent—12 consecutive hours of 48-h count
• Up to 15-percent failure rate— 48-h counts
• Up to 10-percent failure rate—permanent count stations
Within 3 years of model validation year
• 55 to 60 percent of freeway mileage
• 25 percent of principal arterials
• 15 percent of minor arterials
• 10 to 15 percent of collectors
Transportation planning applications
Highway performance monitoring system
AADT • 5- to 10-percent urban interstate
• 10-percent other urban • 8-percent rural interstate • 10-percent other rural mean
absolute error
• 80-percent continuous counts
• 70 to 80 percent for portable machine counts (24-/48-h counts)
• Up to 15-percent failure rate—48-h counts
• Up to 10-percent failure rate—permanent count stations
Data 1 year old or less
• 55 to 60 percent of freeway mileage
• 25 percent of principal arterials
• 15 percent of minor arterials
• 10 to 15 percent of collectors
Transportation operations
Traveler information
Travel times for entire trips or portions of trips over multiple links
10- to 15-percent root mean squared error
95- to 100-percent valid data
Less than 10-percent failure rate
Data required close to real time
100-percent area coverage
Highway safety
Exposure for safety analysis
AADT and VMT by segment
• 5- to 10-percent urban interstate
• 10-percent other urban • 8-percent rural interstate • 10-percent other rural
mean absolute error
• 80-percent continuous count data
• 50 percent for portable machine counts (24-/48-h counts)
• Up to 15-percent failure rate—48–h counts
• Up to 10-percent failure rate—permanent count stations
Data 1 year old or less
• 55 to 60 percent of freeway mileage
• 25 percent of principal arterials
• 15 percent of minor arterials
• 10 to 15-percent of collectors
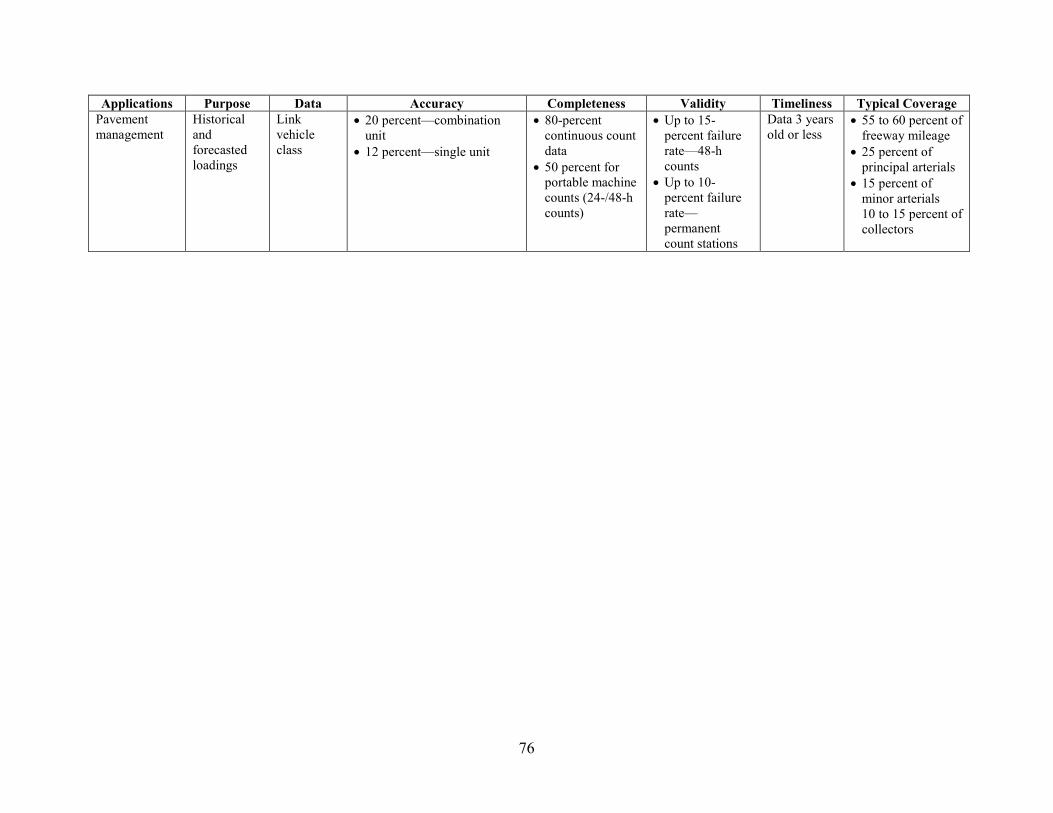
76
Applications Purpose Data Accuracy Completeness Validity Timeliness Typical Coverage Pavement management
Historical and forecasted loadings
Link vehicle class
• 20 percent—combination unit
• 12 percent—single unit
• 80-percent continuous count data
• 50 percent for portable machine counts (24-/48-h counts)
• Up to 15-percent failure rate—48-h counts
• Up to 10-percent failure rate—permanent count stations
Data 3 years old or less
• 55 to 60 percent of freeway mileage
• 25 percent of principal arterials
• 15 percent of minor arterials 10 to 15 percent of collectors
77
METADATA
Metadata are typically used to determine the availability of certain data, determine the fitness of data for an intended use, determine the means of accessing data, and enhance data analysis and interpretation by improved understanding of the data collection and processing procedures. Metadata provide the information necessary for data to be understood and interpreted by a wide range of users. Thus, metadata are particularly important when the data users are physically or administratively separated from the data producers. Metadata also reduce the workload associated with answering the same questions from different users about the origin, transformation, and character of the data. The use of metadata standards and formats helps to facilitate the understanding, characteristics, and usage of the data.(58)
ASTM has published metadata standards for ITS data in ASTM E2468-05, “Standard Practice for Metadata to Support Archived Data Management Systems.”(59) As stated on the ASTM Web site, “This standard is applicable to various types of operational data collected by ITSs and stored in an ADMS. Similarly, the standard can also be used with other types of historical traffic and transportation data collected and stored in an archived data management system.”(60)
This standard adopts the Federal Geographic Data Committee’s (FGDC) existing Content Standard for Digital Geospatial Metadata (FGDC-STD-001-1998) (with minimal changes) as the recommended metadata framework for ADMSs.(60) The FGDC metadata standard was chosen as the framework because of its relevance and established reputation among the spatial data community. A benefit of using the FGDC standard is the widespread availability of informational resources and software tools to create, validate, and manage metadata (see https://www.fgdc.gov/ metadata/index_html).(61)
Because the ASTM E2468-05 metadata standard is based on the FGDC standards for geographic metadata, the components of the nongeographic metadata structure, as provided in the following list, are the same except for those related to spatial data:
• Identification information. • Data quality information. • Entity and attribute information. • Distribution information. • Metadata reference information.
Additional metadata standards include the following:
• FGDC metadata standards.
• International Organization for Standardization (ISO) Standard 19115 (metadata content standard for describing geographic information).(62)
• Federal Enterprise Architecture (FEA) Data Reference Model (high-level reference model defining standardization areas for data description and discovery).
• FGDC tools, a variety of tools available based on the FGDC standards.
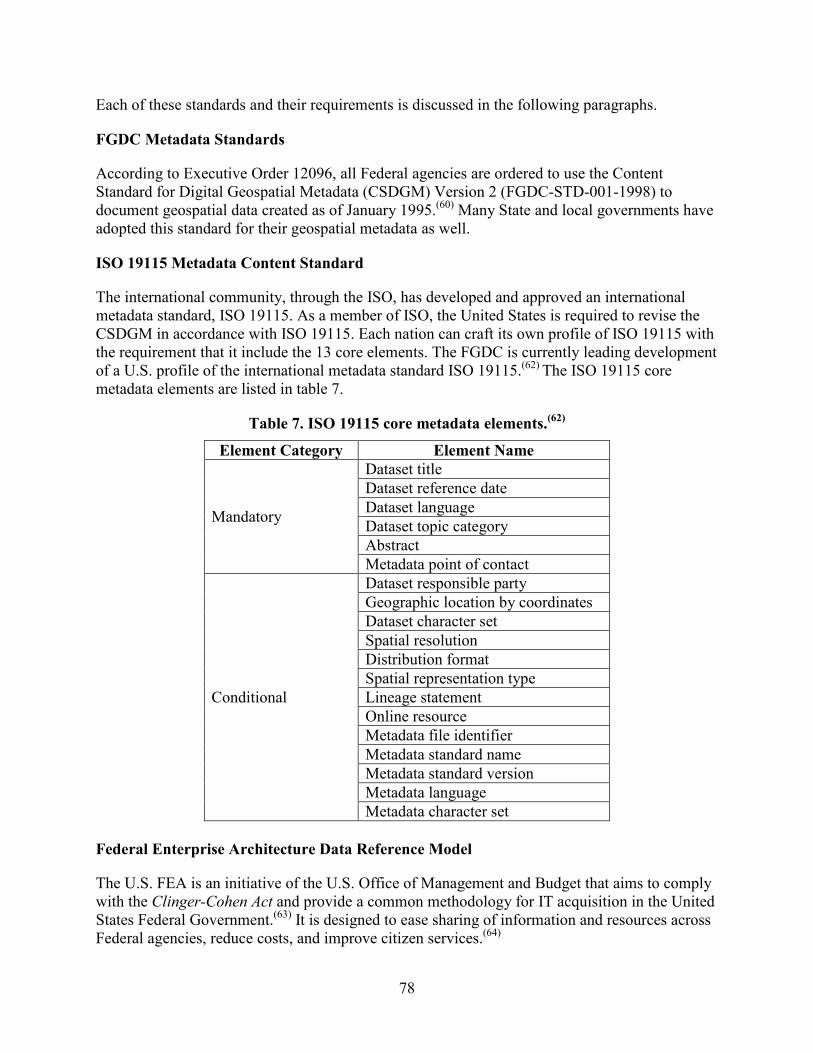
78
Each of these standards and their requirements is discussed in the following paragraphs.
FGDC Metadata Standards
According to Executive Order 12096, all Federal agencies are ordered to use the Content Standard for Digital Geospatial Metadata (CSDGM) Version 2 (FGDC-STD-001-1998) to document geospatial data created as of January 1995.(60) Many State and local governments have adopted this standard for their geospatial metadata as well.
ISO 19115 Metadata Content Standard
The international community, through the ISO, has developed and approved an international metadata standard, ISO 19115. As a member of ISO, the United States is required to revise the CSDGM in accordance with ISO 19115. Each nation can craft its own profile of ISO 19115 with the requirement that it include the 13 core elements. The FGDC is currently leading development of a U.S. profile of the international metadata standard ISO 19115.(62) The ISO 19115 core metadata elements are listed in table 7.
Table 7. ISO 19115 core metadata elements.(62)
Element Category Element Name
Mandatory
Dataset title Dataset reference date Dataset language Dataset topic category Abstract Metadata point of contact
Conditional
Dataset responsible party Geographic location by coordinates Dataset character set Spatial resolution Distribution format Spatial representation type Lineage statement Online resource Metadata file identifier Metadata standard name Metadata standard version Metadata language Metadata character set
Federal Enterprise Architecture Data Reference Model
The U.S. FEA is an initiative of the U.S. Office of Management and Budget that aims to comply with the Clinger-Cohen Act and provide a common methodology for IT acquisition in the United States Federal Government.(63) It is designed to ease sharing of information and resources across Federal agencies, reduce costs, and improve citizen services.(64)
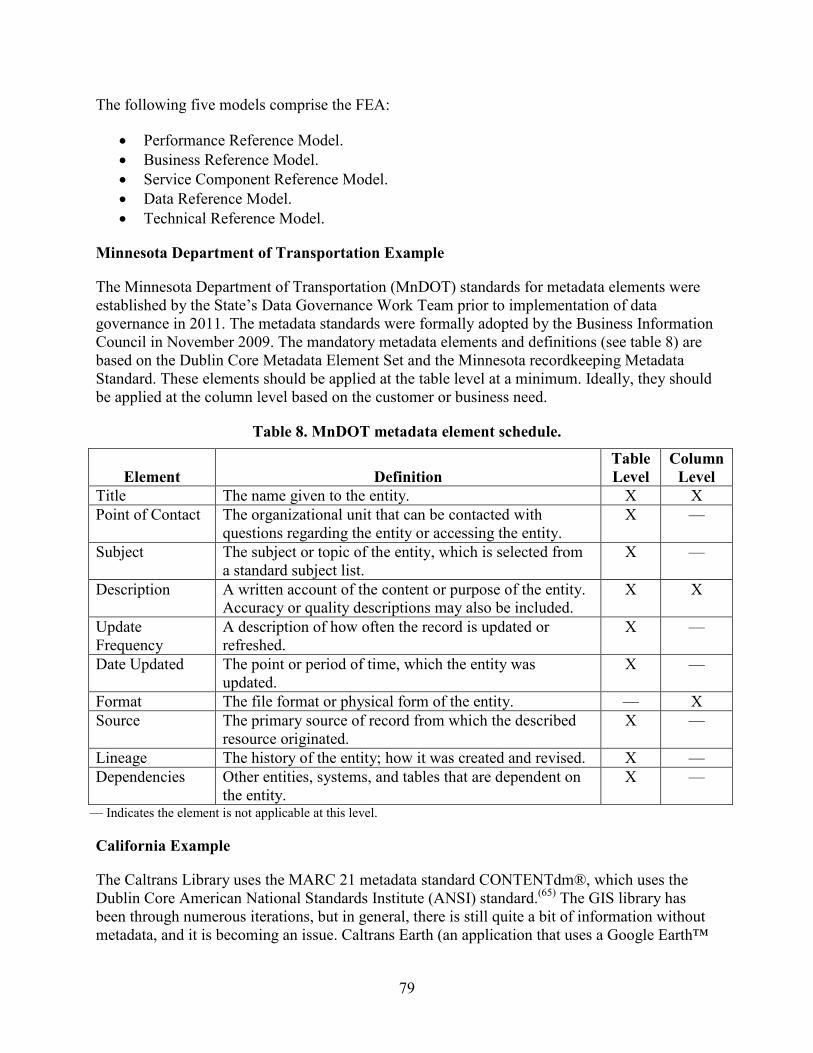
79
The following five models comprise the FEA:
• Performance Reference Model. • Business Reference Model. • Service Component Reference Model. • Data Reference Model. • Technical Reference Model.
Minnesota Department of Transportation Example
The Minnesota Department of Transportation (MnDOT) standards for metadata elements were established by the State’s Data Governance Work Team prior to implementation of data governance in 2011. The metadata standards were formally adopted by the Business Information Council in November 2009. The mandatory metadata elements and definitions (see table 8) are based on the Dublin Core Metadata Element Set and the Minnesota recordkeeping Metadata Standard. These elements should be applied at the table level at a minimum. Ideally, they should be applied at the column level based on the customer or business need.
Table 8. MnDOT metadata element schedule.
Element Definition Table Level
Column Level
Title The name given to the entity. X X Point of Contact The organizational unit that can be contacted with
questions regarding the entity or accessing the entity. X —
Subject The subject or topic of the entity, which is selected from a standard subject list.
X —
Description A written account of the content or purpose of the entity. Accuracy or quality descriptions may also be included.
X X
Update Frequency
A description of how often the record is updated or refreshed.
X —
Date Updated The point or period of time, which the entity was updated.
X —
Format The file format or physical form of the entity. — X Source The primary source of record from which the described
resource originated. X —
Lineage The history of the entity; how it was created and revised. X — Dependencies Other entities, systems, and tables that are dependent on
the entity. X —
— Indicates the element is not applicable at this level.
California Example
The Caltrans Library uses the MARC 21 metadata standard CONTENTdm®, which uses the Dublin Core American National Standards Institute (ANSI) standard.(65) The GIS library has been through numerous iterations, but in general, there is still quite a bit of information without metadata, and it is becoming an issue. Caltrans Earth (an application that uses a Google Earth™
80
plugin) will not allow data without metadata; ISO 19115 Geographic Information—Metadata is used.(62) The Data Retrieval System (DRS) requires some metadata and is system dependent. Each metadata item has core elements and some that are specific to category. The metadata for the DRS are established by the data administrator and the DRS Steering Committee, usually for search and retrieval purposes.(66)
Metadata Guidelines for the Research Data Exchange(67)
This document provides requirements for metadata that must be followed by registered users who submit data for the Research Data Exchange (RDE). In terms of standards, metadata must follow ASTM E2468-05, Standard Practice for Metadata to Support Archived Data Management Systems.(59) Metadata content includes seven main sections: identification information, data quality information, spatial data organization information, spatial reference information, entity and attribute information, distribution, and metadata reference information. The document also defines the following roles and responsibilities in metadata management:
• RDE Metadata Creator: These individuals include RDE users (both registered users and registered users with additional access), the portal content manager, data management system content manager, and data sources. For projects under USDOT procurement, the project team is required to create/update metadata along with the dataset used for or generated from the project. For projects no longer under USDOT procurement or for data from an external data management system, the data provider may volunteer to create/update metadata, or the RDE portal administrator may designate a portal content manager to be the metadata creator.
• RDE Metadata Manager: The RDE portal administrator acts as the RDE metadata manager. When a new dataset arrives, the metadata manager designates a metadata analyst from the RDE portal content managers to check the quality of the metadata. If the metadata conform to the standard and pass the quality assurance test, the metadata manager releases the dataset and metadata to the public through the RDE.
• RDE Metadata Analyst: The RDE portal content manager acts as the metadata analyst and is responsible for checking the quality of the metadata to determine whether they meet the metadata standard. If the metadata meet the standard, the metadata analyst performs the metadata quality assessment. The metadata are then passed back to the metadata manager.
• RDE Metadata User: These individuals include RDE registered users and registered users with additional access who use the metadata as the search criteria to find and use datasets. Metadata users report any inappropriate or irrelevant metadata issues to the metadata manager.
In summary, both the ASTM Standard Practice for Metadata to Support Archived Data Management Systems (E2468-05) and a modified Dublin Core3 as the metadata schema have widespread industry acceptance. Either one is recommended for the VDA Framework.(59)
81
MIGRATION STRATEGIES
Data migration approaches abandon the effort to keep old technology working or to create substitutes that emulate or imitate it. Instead, these approaches rely on changing the digital encoding of the objects to preserve them while making it possible to access those objects using state-of-the-art technology after the original hardware and software become obsolete.
The following subsections describe a variety of migration strategies described in NCHRP Report 754.(66)
Simple Version Migration
The most direct path for format migration, and one used very commonly, is simple version migration within the same family of products or data types. Successive versions of given formats, such as Corel WordPerfect®’s WPD or Microsoft® Excel’s XLS, define linear migration paths for files stored in those formats. Software vendors usually supply conversion routines that enable newer versions of their product to read older versions.
Format Standardization
An alternative to the uncertainties of version migration is format standardization, whereby a variety of data types are transformed to a single, standard type. For example, a textual document, such as a WordPerfect® document, could be reduced to plain ASCII. Obviously, there would be some loss if font, type size, and formatting were significant. However, this conversion is eminently practicable, and it would be appropriate in cases where the essential characteristics to be preserved are the textual content and the grammatical structure. Where typeface and font attributes are important, richer formats, such as PDF or Rich Text Format, could be adopted as standards.
Typed Object Model Conversion
Another approach to migrating data formats into the future is Typed Object Model (TOM) conversion. The TOM approach begins with the recognition that all digital data items are objects, that is, they have specified attributes, specified methods or operations, and specific semantics. All digital objects belong to one or another type of digital object, where “type” is defined by given values of attributes, methods, or semantics for that class of objects. A Microsoft® Word 6 document, for example, is a type of digital object defined by its logical encoding. An electronic mail message is a type of digital object defined, at the conceptual and logical levels, by essential data elements (e.g., To, From, Subject, or Date).
Object Interchange Format
Another approach enables migration through an object interchange format defined at the conceptual level. This type of approach is being widely adopted for e-commerce and e-government where participants in a process or activity have their own internal systems that cannot readily interact with systems in other organizations. Rather than trying to make the systems directly interoperable, developers are focusing on the information objects that need to be exchanged to do business or otherwise interact. These objects are formally specified according to essential characteristics at the conceptual level, and those specifications are articulated in logical models.
82
The logical models or schema define interchange formats. To collaborate or interact, the systems on each side of a transaction need to be able to export information in the interchange format and to import objects in this format from other systems. The XML family of standards has emerged as a major vehicle for exchange of digital information between and among different platforms.
FILE AND DATA FORMATS
This review identified the following data formats:
• TranXML.
• Traffic Management Data Dictionary.
• Data.gov.
• Geospatial reference frameworks (e.g., TMC codes).
• Apache Software Foundation Object-Oriented Data Technology.
• National Transportation Communications for Intelligent Transportation System Protocol.
• National Information Exchange Model (FHWA Office of Policy is currently examining this model as a possible standard).
• United Nations (UN) recommended UN/EDIFACT (which is the only international standard and is predominant outside North America as well throughout the life sciences and pharmaceutical industry).
• U.S. standard ANSI ASC X12 (X12) (predominant in North America).
• TRADACOMS standard developed by the Article Numbering Association (predominant in the United Kingdom’s retail industry).
• ODETTE standard used within the European automotive industry.
• ebXML, used by many Asian community systems.
• World Customs Organization (WCO) standards, such as the WCO data model.
• ASYCUDA.
ADUS of the National ITS Architecture standards for file and data formats are also important for consideration. ADUS is concerned with storing data generated from ITS, integrating it with other data, repackaging it, and making it accessible to a wide variety of stakeholders and applications.
NCHRP Report 754 noted that one of the challenges in developing transportation information best practices is assessing the risk that the file formats chosen to store data and information may become obsolete.(66) A file format is a particular way that information is encoded for storage in a
83
computer file. There are different kinds of formats for different kinds of information. To preserve content in digital form, data custodians must be able to distinguish between format refinements and variants, because those are significant to sustainability, functionality, or quality. However, this may be difficult because new formats are very complex, and there may be no obvious way to determine the format for a file; different formats are employed or favored in different stages of a content item’s lifecycle; and formats are often proprietary and may be limited to the creator’s available software package.
Factors to Consider When Choosing Formats
As stated in NCHRP Report 754, two types of factors come into play in choosing file formats for long-term needs: sustainability factors and quality and functionality factors.(66) Quality and functionality factors pertain to the ability of a format to represent the significant characteristics required or expected by current and future users of a given content item. These factors vary for particular genres or forms of expression. For example, significant characteristics of sound are different from those for still pictures, whether digital or not, and not all digital formats for images are appropriate for all genres of still pictures. The following seven factors influence the feasibility and cost of preserving content:(57)
• Disclosure: The degree to which complete specifications and tools for validating technical integrity exist and are accessible to those creating and sustaining digital content. However, what is most significant for sustainability is not approval by a recognized standards body, but the existence of (and preservation of) complete documentation.
• Adoption: The degree to which the format is already used by the primary creators, disseminators, or users of information resources. A format that is widely adopted is less likely to become obsolete rapidly, and tools for migration and emulation are more likely to emerge from industry without specific investment by archival institutions.
• Transparency: The degree to which the digital representation is open to direct analysis with basic tools, including human readability using a text-only editor. Digital formats in which the underlying information is represented simply and directly will be easier to migrate to new formats, more susceptible to digital archaeology, and allow easier development of rendering software.
• Self-documentation: Digital objects that contain basic descriptive metadata (the analog to the title page of a book) as well as technical and administrative metadata relating to creation and the early stages of the lifecycle will be easier to manage over the long term than data objects stored separately from the metadata needed to render or understand them.
• External dependencies: The degree to which a particular format depends on particular hardware, operating system, or software for rendering or use and the predicted complexity of dealing with those dependencies in future technical environments.
• Impact of patents: The degree to which the ability of archival institutions to sustain content in a format will be inhibited by patents.
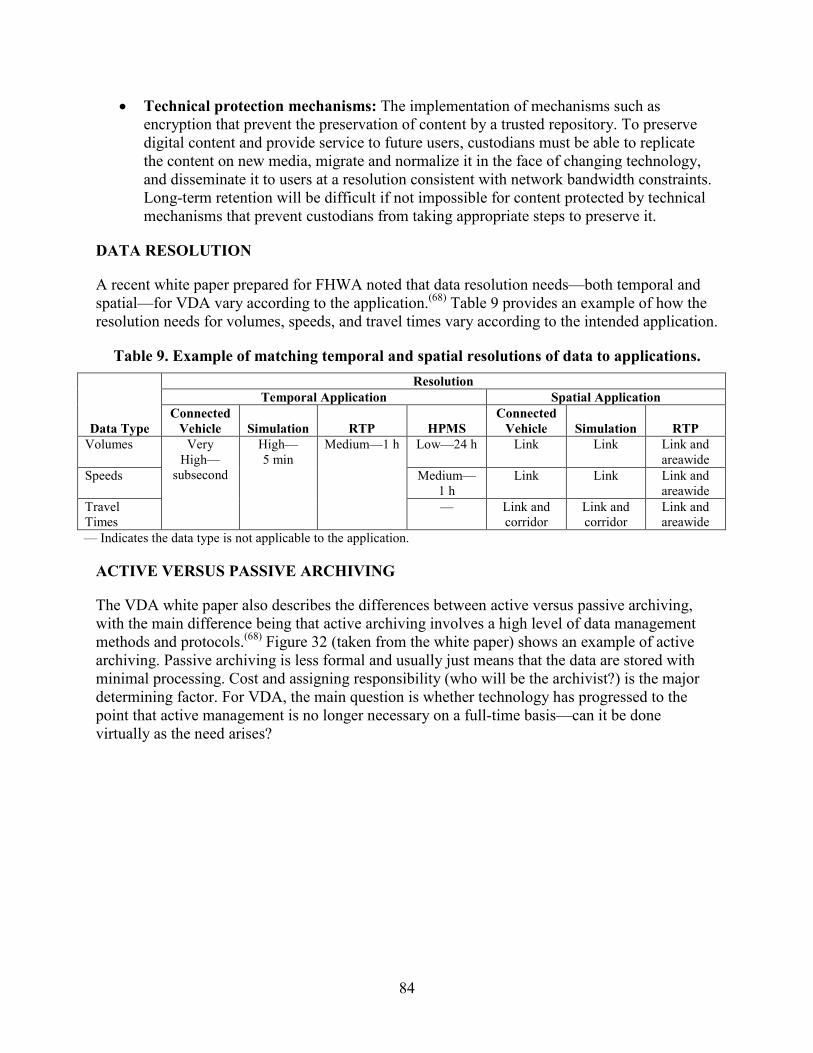
84
• Technical protection mechanisms: The implementation of mechanisms such as encryption that prevent the preservation of content by a trusted repository. To preserve digital content and provide service to future users, custodians must be able to replicate the content on new media, migrate and normalize it in the face of changing technology, and disseminate it to users at a resolution consistent with network bandwidth constraints. Long-term retention will be difficult if not impossible for content protected by technical mechanisms that prevent custodians from taking appropriate steps to preserve it.
DATA RESOLUTION
A recent white paper prepared for FHWA noted that data resolution needs—both temporal and spatial—for VDA vary according to the application.(68) Table 9 provides an example of how the resolution needs for volumes, speeds, and travel times vary according to the intended application.
Table 9. Example of matching temporal and spatial resolutions of data to applications.
Data Type
Resolution Temporal Application Spatial Application
Connected Vehicle Simulation RTP HPMS
Connected Vehicle Simulation RTP
Volumes Very High—
subsecond
High—5 min
Medium—1 h Low—24 h Link Link Link and areawide
Speeds Medium—1 h
Link Link Link and areawide
Travel Times
— Link and corridor
Link and corridor
Link and areawide
— Indicates the data type is not applicable to the application.
ACTIVE VERSUS PASSIVE ARCHIVING
The VDA white paper also describes the differences between active versus passive archiving, with the main difference being that active archiving involves a high level of data management methods and protocols.(68) Figure 32 (taken from the white paper) shows an example of active archiving. Passive archiving is less formal and usually just means that the data are stored with minimal processing. Cost and assigning responsibility (who will be the archivist?) is the major determining factor. For VDA, the main question is whether technology has progressed to the point that active management is no longer necessary on a full-time basis—can it be done virtually as the need arises?
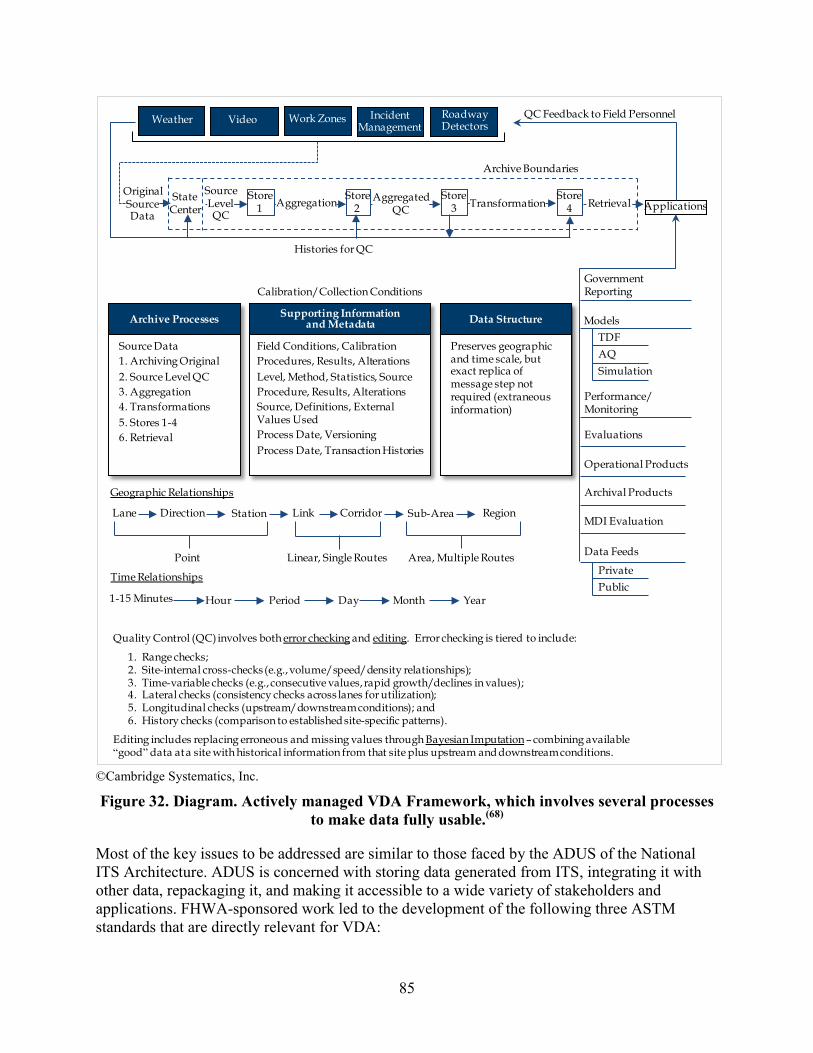
85
©Cambridge Systematics, Inc.
Figure 32. Diagram. Actively managed VDA Framework, which involves several processes to make data fully usable.(68)
Most of the key issues to be addressed are similar to those faced by the ADUS of the National ITS Architecture. ADUS is concerned with storing data generated from ITS, integrating it with other data, repackaging it, and making it accessible to a wide variety of stakeholders and applications. FHWA-sponsored work led to the development of the following three ASTM standards that are directly relevant for VDA:
Archive Processes
Source Data1. Archiving Original 2. Source Level QC3. Aggregation 4. Transformations5. Stores 1-46. Retrieval
VideoWeather Work Zones IncidentManagement
RoadwayDetectors
StateCenter
Store1
Store2
Archive Boundaries
Store3
QC Feedback to Field Personnel
Histories for QC
Applications
Government Reporting
Performance/Monitoring
Evaluations
Operational Products
Archival Products
MDI Evaluation
ModelsTDFAQSimulation
Data Feeds
PrivatePublic
Quality Control (QC) involves both error checking and editing. Error checking is tiered to include:
1. Range checks;2. Site-internal cross-checks (e.g., volume/speed/density relationships);3. Time-variable checks (e.g., consecutive values, rapid growth/declines in values);4. Lateral checks (consistency checks across lanes for utilization);5. Longitudinal checks (upstream/downstream conditions); and6. History checks (comparison to established site-specific patterns).
Editing includes replacing erroneous and missing values through Bayesian Imputation – combining available“good” data at a site with historical information from that site plus upstream and downstream conditions.
Geographic Relationships
Lane StationDirection Link Corridor Sub-Area Region
Point Linear, Single Routes Area, Multiple Routes
Time Relationships
1-15 Minutes PeriodHour Day Month Year
Store 4
Calibration/Collection Conditions
Source Level QC
Aggregation Transformation Retrieval
Supporting Information and Metadata
Field Conditions, CalibrationProcedures, Results, AlterationsLevel, Method, Statistics, SourceProcedure, Results, AlterationsSource, Definitions, External Values UsedProcess Date, VersioningProcess Date, Transaction Histories
Data Structure
Preserves geographic and time scale, but exact replica of message step not required (extraneous information)
OriginalSourceData
AggregatedQC
86
• ASTM E2259-03a, which covers the technical and institutional principles to be followed in developing an ADMS.(69)
• ASTM E2468-05, which developed a metadata standard for documenting an ADMS and associated data user’s guide.(59)
• ASTM E2665-08, which is a data dictionary for archiving ITS-generated traffic and travel activity data.(70)
Another excellent source is General Requirements for an Archived Data Management System, a report prepared by Cambridge Systematics, Inc., for FDOT District 4 in preparation for the development of a regional ADMS to store, integrate, and access the following types of data:(71)
• Probe data: ID, travel times, speeds, metadata, and validation data. • Agency detector data: ID, travel times, speeds, volumes, and metadata. • Agency incident data: location, timeline, severity, and response. • Agency work zone data: location, timeline, and lanes blocked. • Special event data: location, timeline, and affected roads. • 511 messages: location, message, and duration. • DMS messages: ID, message, and duration. • Weather data: ID, type, timeline, and severity.
The requirements cover types of queries (real-time queries and batch queries); user roles and rights (standard users, advanced users, and system administrators); accessing the system; creating, submitting, and retrieving query results; query and result file management; reports; data storage; data processing; data management and archiving; operational requirements (database, application, and networking environment); and nonfunctional requirements (look and feel, usability, documentation and online help, performance, portability, and security).
VERSION CONTROL
It is near certainty that various changes will be made to the calculation procedures related to data integration once reports have been publicly released, and the VDA white paper discusses the need for version control during the development of a performance monitoring program.(68) For example, consider the impacts that might occur when an improved travel time estimation algorithm is developed after several years of performance reports. The improved algorithm is more accurate, but it also estimates travel times that are consistently shorter. However, several years of performance reports have already been published that use the old algorithm, which produces longer travel times. Instead of simply overwriting the old statistics, they should be retained in the data management system as a previous version that has expired. The new statistics based on the improved algorithm would then be stored as the current version.
DATA TRANSFORMATION
The VDA white paper also provides guidance in data transformation, which is the act of changing data and is quite common in archiving real-time traffic data in a data archive.(68) As collected, real-time traffic data are highly detailed and are stored in a database designed to allow
87
quick access to current conditions. However, a data archive typically does not retain the original level of data, and the archive database must be designed for quick access to a wide range of historical conditions. Transformation can be as simple as aggregating data over time and space or as complicated as creating new metrics (e.g., travel-time based performance metrics from detector measurements). In all cases, alternative data processing procedures and assumptions can be used to arrive at the same result—the differences in these can lead to inconsistency in the final values. For example, the choice of free-flow speed or the length of a peak period will affect the final transformations. Again, the issue is whether agencies should be free to use whatever methods they choose (with adequate metadata documentation) or whether a standard set of procedures needs to be fostered.
APPLICABILITY TO THE VDA FRAMEWORK
All the examples, standards, and best practices described in this chapter will all be considered in the design and development of the VDA Framework.

89
CHAPTER 5. BUSINESS RULES FOR INTEGRATING AND SHARING
The challenges to accomplishing successful data integration are plentiful but generally fall into two categories—technical and institutional. The first key dimension centers on the technical challenges associated with data systems, including development and maintenance of hardware and software and the specifications for data collection, analysis, and archiving. These are discussed in chapter 3.
Institutional challenges may include centralized policymaking and decentralized execution of those policies; limited appreciation by decisionmakers of the role of data systems in supporting business operations; and lack of formal policies and standards to guide the collection, processing, and use of data within the organization. This chapter describes best practices that may be applied to the development and management of the VDA Framework.
Sources for this chapter include recent documents from the USDOT Real-Time Data Capture and Management State of the Practice Innovations Scan project; NCHRP Report 666, Target-Setting Methods and Data Management to Support Performance-Based Resource Allocation by Transportation Agencies, which addresses the importance of the data management and data governance function within the State transportation departments; NCHRP Report 754, Improving Management of Transportation Information; the USDOT Roadway Transportation Data Business Plan, and private industry.(72,66,73)
DATA MANAGEMENT
Real-Time Data Capture and Management State of the Practice Assessment and Innovations Scan(74)
The Real-Time Data Capture and Management State of the Practice Assessment and Innovations Scan addresses issues related to data capture, data management, archiving, and sharing collected data to encourage collaboration, research, and operational development and improvement.(74) The scan covers five industries: aviation, freight logistics, Internet search engines, rail transit systems, and transportation management systems.
The report includes the following recommendations identifying data management practices and considerations from the five aforementioned industries that are pertinent to the Saxton Data Sharing Framework (pages 2–4):(74)
• Manage the amount of data traffic: Too much or too little information can inhibit the ability to notice critical messages.
• Take a gradual approach: Start addressing the most critical needs first, making sure core competencies are developed as an initial step rather than attempting to implement everything at the same time.
• Devise a design that can be sized: A system should perform well in the real world rather than only in the context of a test setup. An effective way to achieve this is to bring technologies such as virtual warehousing and servers, clustered databases, and others.
90
• Control which data should be saved and which should not: For instance, if the purpose of the data collection is to analyze the performance of a particular intersection, there is no need to keep data about vehicles once they have passed through such an intersection.
• Give thoughtful consideration to letting a third party manage your data storage needs: While the cost of storing all traffic data may be high for a public-sector entity, it may be profitable for a specialized third party. The pros and cons of using a third party are as follows:
o Pros: It may significantly reduce the costs of data storage and make the data constantly available through a fast, user-friendly interface.
o Cons: Control of the organization’s data and its protection will be outside of the hands of the organization, including addressing the potential risk of hacking. If it is cloud-based, data access will depend on Internet access. Lastly, the organization’s data might be mined by others for usage patterns.
• Make certain there is a clear understanding regarding data ownership and usage rights from the onset: Specifically, address the following issues:
o Determine the responsible party or parties who pay for the collection, storage, and dissemination of the data. Determine who can sell the data and whether it is free for anyone to use if a public agency pays for and owns the data.
o Address privacy concerns. Identifying and tracking vehicles using various types of technology have already faced resistance in the public arena.
o Determine who can have access to the data and to what extent. Would, for instance, a subset of the data be enough for the user to accomplish his or her task? Having a third party manage the data could help address privacy concerns, because it could be in charge of collecting, aggregating, and anonymizing the data to guarantee that the data user did not infringe upon the privacy of citizens.
o Determine whether the data can be used for purposes other than those delineated in the original argument to collect the data. An important privacy concern is that observed data are used for law enforcement rather than simply monitoring mobility. For instance, GPS data could reveal which vehicles exceed the speed limit or which trucks have been on the road without a break for the driver.
• Aim for real time: Even if further processing is needed, providing a real-time, or near-real-time feed of collected data is an appealing feature for current and potential users of the system.
• Optimize your process flow through a set of filtering mechanisms: If certain algorithms are crucial to generate a desired output but have the risk of being overloaded with too much data, consider having intermediate algorithms that aggregate or prioritize
91
the data flow into the critical system. Thus, as soon as the critical system begins to be overloaded, these intermediate algorithms can help reduce its load.
The scan documented the following best practices for access, security, and privacy (page 5):(74)
• Generally, the holder of the data controls access to them. Within the transportation and logistics community, this access is carefully controlled.
• There are systems in place that ensure that data can be accessed only by the intended people and only to the degree that they need it. The type of data used by the transportation and logistics industry make it extremely sensitive, with disastrous consequences for business if accessed by persons with malicious intentions.
• Usually, data access is password-protected, and the following is true:
o Because data generated within the logistics systems are often financial, strong encryption is placed on such data when they are sent.
o However, several applications can retrieve aircraft and vessel tracking data, often with other identifying information. The security clearance or password protection to access data through these applications is often minimal.
• The protection of data sources is extremely important. In the search engine industry, it is so heavily protected that there is not even disclosure of how exactly it is protected.
The scan documented the following best practices for data storage and backup (page 6):(74)
• Frequent backups and off-site storage are typical.
• Preventative maintenance should be performed regularly.
• Careful consideration should be devoted to determining how much and for how long data should be stored. In aviation, for instance, data are kept for a relatively short timeframe because the need is for real-time rather than historical information. At the same time, data can be available for revision if there is an incident to investigate.
The scan documented the following best practices for operations and maintenance (page 6):(74)
• Deployment should be started on a reasonable scale, such as implementing in a small geographical area or using easily manageable data.
• Multiple servers should be used to distribute real-time loads. Several technologies enable this load distribution.
• It is important to give thoughtful consideration to determining the needed resolution or granularity of the data. This may vary depending on the context and use of the data. Specific examples include the following:
92
o In the logistics and retail industries, inventory data are refreshed every minute in several stores. Not only is this used to support restocking but also to monitor trends.
o In the search engine industry, data generally go through a 24-h refresh cycle, staying fixed between cycles.
o In the aviation field, data are mostly retrieved as fast as possible to enable incident prevention.
• It is necessary to determine what is critical to communicate and what is not. For instance, railroad and airline alert systems only collect the necessary data that can alert an operator of a particular problem.
The scan documented the following best practice for critical failures (page 7):(74)
• A common issue is that correcting a problem is often dependent on a single person, meaning its solution depends on the given person’s availability. It is therefore important to have staff available around the clock to solve potentially catastrophic failures. The higher labor cost is a necessary expense if the system needs to be highly available at all times.
Applicability to VDA Framework All of the data management practices and considerations described above are applicable to the VDA Framework.
Oak Ridge National Laboratory: Best Practices for Preparing Environmental Datasets to Share and Archive(75)
The Oak Ridge report discusses best data management practices that data collectors and providers should follow to improve the usability of their datasets.(75) The report focuses on the preparations for sharing of data, preservation of data, and archiving data. It identifies the following seven best practices for preparing environmental datasets to share:
• Define the contents of data files: Before making data accessible, it is important to make the data fully understandable by specifying units of measurement, definitions of codes or acronyms, and other descriptors.
• Use consistent data organization: Whether the data are provided in a matrix format or not, it is vital that there is consistency in the way all data are provided.
• Use consistent file structure and stable file formats for tabular and image data: Data collectors and/or disseminators should use a format that can be read in the future, regardless of any change of data usage or application.
• Assign descriptive file names: As a rule of thumb, file names should be reflective of their contents and be able to uniquely identify the file.
93
• Perform basic quality assurance: Before sharing the data, it is a good idea to conduct basic and scientific quality assurance of the data.
• Assign descriptive dataset titles: Titles of datasets should be as descriptive as possible, seeking to make them available for future use by users who may not have any familiarity with their context.
• Provide documentation: Like other best practices, providing user-friendly documentation is crucial to ensure that future users can access, understand, and use the data.
Each of these practices should be included in any comprehensive data management program.
Applicability to VDA Framework Each of the seven best practices listed in the previous section (or some form of several of these) could be included in a data catalog for the VDA Framework.
Massachusetts Institute of Technology Libraries
The following Data Management Checklist was designed as a data planning checklist by Massachusetts Institute of Technology (MIT) Libraries for data used in research projects. The checklist is part of a guide, Data Management and Publishing, available from MIT Libraries.(76)
The guide provides the following examples of the types of questions that should be addressed in developing the VDA Framework:(76)
• What types of data will be generated? Can they be reproducible? • What is the target audience of the data both now and in the future? • How long should the data be stored? • What is needed to generate, analyze, and visualize the data? • Are there security or privacy procedures one should follow? • Are there sharing requirements to which one is bound? • Has the appropriate documentation been provided for its usage? • What naming convention will be used for directories and files? • What file formats are needed? Will they remain easily accessible in the future? • What strategies are put in place for storage and backup? • Are there standards for sharing or integrating the data? • Is there someone in place to be in charge of managing the data?
Applicability to VDA Framework The questions listed in the previous section will help in developing a comprehensive, well-designed data management plan for the VDA Framework by documenting the following important components of a successful data management project:
94
• Policies and procedures for sharing data from the roadway travel mobility data programs.
• Roles/responsibilities of data collectors, data managers (data business owners, data stewards, and data custodians), and data users (data stakeholders and communities of interest).
• Data standards for collection and reporting of roadway travel mobility data programs.
• Technology (hardware/software) needed to sustain the VDA Framework.
Policy Analysis and Recommendations for the Data Capture and Management Program: Implementation of Open Data Policies and System Policies for the Research Data Exchange and Data Environments(77)
This report argues that development of the Internet has resulted in a significant global trend to adopt open data and open source policies. Several governmental bodies and not-for-profit organizations around the world are developing initiatives to channel this to harness their benefit. The document provides recommendations concerning emerging open data policies within a connected vehicle research program. It argues that within the transportation industry, an open data policy allows a transformation of the state of the practice by supporting the reuse of data in a collaborative and dynamic framework. Some of the main benefits are the following:
• Provides greater access to information from public-sector systems.
• Increases data sharing among organizations.
• Enables the emergence of high-fidelity real-time data sources that spur novel applications and greater efficiency.
To fulfill the promise of an open data policy, this must be readily accessible and cost effective but at the same time address security, privacy, liability, and quality concerns.
Beyond its open data policy recommendations, this report also outlines the following RDE system policies:
• Governance needs and options: RDE governance acts at the following two levels:
o Program-level governance should define the roles of the RDE stakeholders. At the same time this stakeholder group will establish policies and guidelines for RDE operations and the needed resources associated with them.
o RDE-level governance deals with user satisfaction, system performance, and risk mitigation. Its functions are concerned with implementation, management, and monitoring RDE operations. A cloud-based framework can leave privacy, security, and other risk mitigation to a managing third party while requiring the governmental body to maintain responsibility.
• Access policy options: These may range from very restrictive—such as allowing access through a secure vetting and authentication process each time a user attempts to access
95
the portal—to fairly open to anyone. The following considerations can help in determining the appropriate level of access:
o What information is needed from users to grant them access? How can the organization mitigate the risks posed under those settings?
o Are there different levels of access for different types of users?
o How will the RDE store and control the user data input?
• Data management policy options: The governance team should strive to ensure that the appropriate legal language and elements are part of a standard data usage agreement. This should be done in close coordination with the ITS legal team. Regarding the storage and archiving of data, this document recommends limiting storage within the RDE, given the sheer magnitude of the expected data. At the same time, however, each dataset is unique, and the program-level governance team and its legal advisers should collaborate to set the specific policies for each dataset.
• System policy options: This topic addresses the codes of conduct, their enforcement, accessibility and language, system availability and recovery, and policies on upgrades and maintenance. In the case of the RDE, for instance, the fact that it is a Federal project will require it to provide RDE datasets and supporting materials in a way that complies with the Americans with Disabilities Act.(78)
Applicability to VDA Framework The following conclusions are worth noting.
The VDA Framework should be implemented based on an open data policy. An open data policy is a viable option and is encouraged by the U.S. Government in general and is emerging as a trend with other governments around the Nation and around the world. The level of “openness” is highly dependent on some of the technical inputs—the accessibility of the RDE to public users; the critical and minimum characteristics of the data that will be captured, used, stored, and archived; and the risks/tradeoffs associated with the technical definition of what it means to be open. This report and other related mobility policy reports attempt to apply some definition to these open questions. The whole set of reports and definitions should be vetted by the technical team and stakeholders to ensure that the basis for recommending policies is solid.
The RDE system policies can be based on proven solutions; however, the federation policies require further analysis and development. The alternatives regarding the RDE architecture and set of technologies that are proposed for use in the construction and operation of the RDE appear synonymous with other portals in use with the Federal and State governments, academia, and industry. As a result, most of the RDE system policy can draw from existing models. The key differences, though, from a policy perspective include the wide-scale federation and the monitoring and enforcement of policies throughout such a dispersed system. Once decisions are made about the architecture and technologies, developing a set of alternative models of operation with supporting policies (also referred to as “scenarios”) are a useful next step to determine how the technical, policy, and institutional recommendations align.
96
State-of-the-Practice and Lessons Learned on Implementing Open Data and Open Source Policies(79)
The document State-of-the-Practice and Lessons Learned on Implementing Open Data and Open Source Policies recommends policies for the DCM and dynamic mobility applications (DMAs) programs. The recommended policies can be summarized as follows:(79)
• Data security: Security risks are generally well understood, and there is a set of regulations, policies, and standards in place that enables the development of robust security approaches. These must ensure security of datasets, data environments, and their corresponding hardware and software.
• Data privacy: There are two particularly sensitive privacy elements in the transportation industry, namely confidentiality and locational privacy. For these, there are not only policies but also technologies and technical security measures that mitigate the risks of exposure and protect the user data. What is known as Fair Information Practice Principles guide data privacy policies for the public sector enforced through Federal law and in the private sector enforced by the Federal Trade Commission’s Bureau of Consumer Protection. State-of-the-art privacy technologies generally seek to anonymize the identity of individuals through various mechanisms to protect those individuals from exposure of sensitive and private information about them.
• Intellectual property: Under U.S. law, any software development is considered intellectual property. It is important to acquire and maintain the right to put developed applications under open-source terms and develop comprehensive and effectively communicated intellectual property policy framework to set the rules that must followed regarding all aspects of intellectual property.
• Liability: Agencies involved in the DCM and DMA programs should make sure that clear limits to liability are set in place. Specifically, they should assess, determine, and clearly communicate what type of liability protection they are willing to offer users, as well as what circumstances fall outside of this protection.
• Governance: A thorough, well-documented policy for implementing data governance at the FHWA Office of Operations needs to clearly state the reasons for implementing data governance, which includes ensuring that existing DCM and DMA programs are managed in a way that provides continued support to the Office of Operations in meeting business needs. The policy also needs to identify the offices/persons responsible for overseeing data governance for the Office of Operations.
Applicability to VDA Framework It is recommended that the policies for metadata, data security, data privacy, intellectual property, liability, and governance be considered in the implementation of the VDA Framework.
97
Railinc
Railinc processes the Railroad Carload Waybill Sample data each year for the American Association of Railroads as required in statute by the Surface Transportation Board (STB) (which regulates freight railroads). For example, the States all receive annual updates to the Waybill but it is very strictly controlled by the STB. To use the data for studies, one needs to go through a formal approval process to gain access to the data. The data are proprietary and contain origin-destination, tonnage, miles, carrier, commodity (very detailed), and equipment (carload, intermodal). Each year, Railinc also publishes a public waybill sample. Vendors use the waybill sample (also with strict confidentiality) to produce Transearch and other datasets. FHWA uses it to produce the rail elements of the Freight Analysis Framework.
Applicability to VDA Framework The strict regulation of data may be a useful concept for the VDA Framework.
DATA GOVERNANCE
NCHRP 666, Target Setting Methods and Data Management to Support Performance-Based Resource Allocation by Transportation Agencies(72)
According to NCHRP 666, “Data governance is defined as the execution and enforcement of authority over the management of data assets and the performance of data functions.” (page II-31)(72)
From a practical standpoint, using a data governance model enables the development of standards, policies, and procedures at an enterprise level. A governance model can thus become a focal point where data collection, storage, and use for a particular project or initiative can be set and identified.
From a technical perspective, the use of a data governance framework makes the system more efficient by reducing the number of duplicate data systems, improving quality, and offering better and more coordinated data managing and coordination tools.
The following issues should be addressed in considering a data governance program:
• What rules are the program setting in place? This can include policies, requirements, standards, controls, and mechanisms to ensure accountability.
• What are the rules of engagement among the various stakeholders and how will these be enforced? Who will be in charge of enforcing said rules?
• What is the best process to follow to ensure that data governance creates value, restrains costs and complexity, and remains compliant with the game rules?
Several models are discussed in the report.
98
Applicability to VDA Framework A data governance approach needs to be applied to the VDA Framework.
National Information Exchange Model
The National Information Exchange Model (NIEM) is described as follows:(80)
[An] approach to driving standardized connections among and between governmental entities as well as with private sector and international partners which enable disparate systems to share, exchange, accept, and translate information….In Fiscal Year (FY) 2010, the Office of Management and Budget (OMB) provided guidance to all Federal Agencies to evaluate the adoption and use of NIEM as the basis for developing reference information exchanges to support specification and implementation of reusable cross-boundary services. (page 1)
The NIEM governance framework includes several entities that are similar to the recommended participants in the data governance framework for FHWA Office of Operations. These include an NIEM Executive Steering Council, NIEM Program Management Office, NIEM Communications and Outreach Committee (this would similar to the Communities of Interest), NIEM Technical Architecture Committee, and the NIEM Business Architecture Committee.
Some Federal agencies are addressing the challenge of implementing centralized governance, developing and implementing information exchange guidelines, creating collaborative sharing agreements, and developing enterprise data management maturity, all of which are identified as challenges in the Agency Information Exchange Functional Standards Evaluation report of June 11, 2010.(80) These agencies are committed to using the NIEM framework to facilitate the sharing and exchange of information across stakeholder groups (communities of interest). The following example is excerpted from the report:(80)
The U.S. Department of Transportation is committed to using NIEM to support a department-wide capability to manage and share Suspicious Activity Reporting (SAR) information. The value expected is DOT’s full participation in the Nationwide SAR Initiative (NSI), and ultimately to contribute in preventing another terrorist-type surprise attack on the nation. The information exchange at DOT is considered to be of high-value. Currently, DOT creates SAR information, and stores this information in five different databases. Participation in the NSI is a priority of the National Security Staff and as such is seen as a high impact exchange. (page 10)
Applicability to VDA Framework The use of NIEM or a similar framework supports the exchange of information across nonintegrated databases. It is worth considering for the VDA Framework.
99
Identification of Critical Policy Issues for the DCM and DMA Programs(81)
This document identifies the following critical policy issues related to governance of open data and open data environments that need to be addressed throughout the DCM Technical Program phases:
• Structure and authority: What form of governance structure(s) supports DCM data environments? Who will fulfill what roles and responsibilities in decisionmaking and dispute resolution? Who will make decisions for upgrading and maintaining the data environments? Who will make decisions about enforcement? What are the options regarding the level of ongoing Federal involvement and, for each option, what are the roles and responsibilities of Federal participants, and what are the associated costs? Can governance be implemented by the private sector or a hybrid of public- and private-sector stakeholders? Who currently has authority or is new authority needed?
• RDE Data Manager: What is the role of the RDE Data Manager, and are the appropriate policies defined to guide the Data Manager in operations, maintenance, and enforcement?
• Federation of data environments: What criteria should determine the appropriateness and eligibility of connecting external data environments with either the RDE or operational data environment (ODE)? What are the associated costs and responsibilities of establishing and maintaining a relationship—for both the RDE/ODE and the external environment? What policies/rules are needed for adding or removing these external environments? For removing datasets? How does federation support data ownership? Revenue generation from the data ownership? How does federation affect liability or raise security risks? What are mitigation strategies?
• Data sharing agreements: What are standard components of data sharing agreement documents? What are important considerations and lessons learned from other agencies in implementing data sharing agreements?
• Policy for maintenance: Who makes decisions about technology upgrades and flexibility of adding new technologies? Who manages the DCM system configuration?
Applicability to VDA Framework The policy issues identified and explored will be relevant to the VDA Framework.
Oregon Department of Transportation
ODOT developed a charter to establish the Transportation Community of Interest Data Council in 2006. The purpose of this council is to identify policy, standards, and processes that support the proper use, management, and maintenance of data assets.
ODOT has recognized the need for strong data governance to create and enforce data management standards. It has established a data management policy, which states the following:(73)
The Oregon Data Governance model also includes well-defined roles and responsibilities for Data Stewards, Data Custodians, and the various
100
Transportation Communities of Interest. The ODOT Data Governance structure also includes work groups, which were formed to provide work products used by the governance program including enterprise data management and reporting tools. (page 75)
Applicability to VDA Framework The ODOT data governance model provides an excellent template for defining the roles and responsibilities of all participants in a data governance framework, including the oversight council, communities of interest, data stewards, data business owners, etc. Many of these roles may also need to be defined for the VDA Framework.
Virginia Department of Transportation
In 2008, VDOT implemented a Data Business Plan for the System Operations Directorate to “provide a framework for making decisions about what data to acquire, how to get it, and how to make sure it is providing value commensurate with its cost.”(73) This plan defines a framework of stakeholders and their responsibilities to safely and efficiently manage the data system. This includes data stewards, coordinators, architects, and custodians, as well as business owners and communities of interest. It also defines the roles and interaction within and among data services, data products, applications, business processes, business areas, and business objectives.
Applicability to VDA Framework The principles associated with a data business plan are directly applicable to the VDA Framework, and the VDOT data business plan framework provides an example of a comprehensive governance structure.
DATA SHARING AGREEMENTS
Data sharing can be crucial in two ways. First, it reduces the need (and associated cost) to collect and manage the same data several times at several offices. Second, it minimizes the risk of giving different responses to the same question that is inherently present when there are several versions of a dataset held by different offices. Formal data sharing agreements are helpful to define how the data will be exchanged across different organizations. Examples can include agreements between Federal and local law enforcement organizations, or between a State transportation department and a department of highway safety and motor vehicles.
One common way to establish a formal data sharing agreement is through memoranda of agreement (MOA) or memoranda of understanding agreed upon by the sharing parties. An example of a MOA is one reached between the Metropolitan Washington Council of Governments and the GIS authorities in various Federal, State, regional, and local organizations with a stake or ownership of data around the Washington, DC, metropolitan area. This MOA, whose purpose was to allow sharing geospatial data among all these parties, included stakeholder responsibilities; the purpose, use, and distribution of the gathered data; liability and other legal agreements; and the terms and conditions of the agreement.(82)
Another example of a data sharing agreement—this time geared for safety matters—can be found in Alaska. The State’s Multi-Agency Justice Integration Consortium includes 20 different
101
agencies, such as the Department of Law and Criminal Division, Association of Police Chiefs, Division of Motor Vehicles, Health and Social Services, Department of Transportation, and Department of Public Safety—all of which were signatories of a MOA “to help agencies more efficiently share complete, accurate, timely information in order to enhance the performance of the criminal justice system as a whole.” Using an automated data collection system called the Traffic and Criminal Software System, this stakeholder group has streamlined the safety and law-enforcement process by making collision, arrest, incident, inspection, and GPS data available to the relevant authorities.(72)
The type of agreement may range from a voluntary collaboration with no binding obligations to one that has enforcement mechanisms. An example of the latter is the data sharing requirement present in the Metropolitan Transportation Commission of the Bay Area in California, which asks local jurisdictions to provide it with regular updates on pavement condition or face the consequence of not receiving Federal grant funds.
Just as external data sharing agreements are extremely valuable in optimizing processes and reducing costs, so is the internal data sharing within a given organization. Internal offices should therefore strive to make data collection and management as unified and streamlined as possible. For instance, within a State transportation department, the data needs for office of transportation statistics and those for the office of transportation safety might be very similar and the two could thus agree to unify their efforts.
Applicability to VDA Framework Formal data sharing agreements will be necessary in establishing relationships for data sharing for the VDA Framework.

103
REFERENCES
1. Federal Highway Administration. (2015) Moving Ahead for Progress in the 21st Century. Web site: http://www.fhwa.dot.gov/map21. Accessed December 4, 2015.
2. Denver Regional Council of Governments. (2012) DRCOG Regional Concept of Transportation Operations, Denver Regional Council of Governments, Denver, CO. Available online at http://www.drcog.org/documents/Final-Regional%20Concept%20of%20 Tranp%20Operations%2008-15-12.pdf. Accessed May 2, 2016.
3. Colorado Department of Transportation and Denver Regional Council of Governments. (2012) Denver Regional Integrated Traveler Information Display Map Guidelines, Colorado Department of Transportation, Denver, CO. Available online at http://www.cotrip.org/ content/itsplans/Denver%20Regional%20Integrated%20Traveler%20Information%20Display%20Map%20Guidelines_March%202012.pdf. Accessed May 2, 2016.
4. Cambridge Systematics, Inc. (2011) CDOT Performance Data Business Plan: Final Report, Colorado Department of Transportation, Denver, CO. Unpublished report.
5. Colorado Department of Transportation. (2014) Transportation Operations. Web site: http://coloradotransportationmatters. com/other-cdot-plans/operations/. Accessed December 4, 2015.
6. Colorado Department of Transportation. (2015) COTrip. Web site: http://www.cotrip.org/ home.htm. Accessed December 4, 2015.
7. Colorado Department of Transportation. (2015) Your CDOT Dollar. Web site: http://dtdapps.coloradodot.info/otis/YCD. Accessed December 4, 2015.
8. Colorado Department of Transportation. (2015) CDOT-OTIS Online Transportation Information System. Web site: http://dtdapps.coloradodot.info/otis. Accessed December 4, 2015.
9. Colorado Department of Transportation. (2015) XML Data Feeds. Web site: http://www.cotrip.org/xmlFeed.htm. Accessed December 4, 2015.
10. Cambridge Systematics, Inc. (2013) Performance Measures and Planning Trends, Report 62.35, Colorado Department of Transportation, Denver, CO.
11. Nevada Department of Transportation. (2015) FAST Dashboard. Web site: http://bugatti. nvfast.org/. Accessed December 4, 2015.
12. Nevada Department of Transportation. (2015) FAST Dashboard—Performance Monitoring and Measurement System. Web site: http://bugatti.nvfast.org/PMMS/Help/ Help_QuickOverview.aspx. Accessed November 18, 2012.
104
13. Puget Sound Regional Council. (2011) Transportation 2040 Monitoring: Congestion and Mobility Report. Puget Sound Regional Council, Seattle, WA. Available at http://www.psrc.org/assets/3544/ 1Final_CMP.pdf. Accessed May 2, 2016.
14. Puget Sound Regional Council. (2010) Analysis and Forecasting at PSRC. Puget Sound Regional Council, Seattle, WA. Available at http://www.psrc.org/assets/3393/ Geodatabase_White_Paper_2010_final.pdf. Accessed May 2, 2016.
15. Puget Sound Regional Council. (2012) Interagency Data Group. Web site: http://www.psrc.org/about/advisory/idg/. Accessed November 1, 2012.
16. Puget Sound Regional Council. (2016) Puget Sound Trends Index. Website: http://www.psrc.org/data/trends. Accessed May 27, 2016.
17. National Environmental Policy Act of 1969 (as amended 2000). (2000) Available at http://www.epw.senate.gov/nepa69.pdf. Accessed May 25, 2016.
18. Pennsylvania Department of Transportation. (2011) 2040 Transportation and Development Plan for Southwestern Pennsylvania. Web site: http://www.spcregion.org/proj/docs.shtml. Accessed December 4, 2015.
19. Federal Highway Administration. (2010) Congestion Management Process: A Case Study—Southwestern Pennsylvania Commission. U.S. Department of Transportation, Washington, DC. Available at http://www.fhwa.dot.gov/planning/congestion_management_process/ case_studies/spc.pdf.
20. Southwestern Pennsylvania Commission. (2015) Congestion Management Corridors: Allegheny County. Web site: http://www.spcregion.org/trans_cong_corr2.shtml. Accessed December 4, 2015.
21. Federal Highway Administration. (2016) Data Use in Planning for Operations: State of the Practice Report, Report No. FHWA-15-071, U.S. Department of Transportation, Washington, DC. Available at https://www.fhwa.dot.gov/publications/research/ operations/15071/index.cfm. Accessed May 2, 2016.
22. San Diego Association of Governments. (2015). Demographics and Other Data. Web site: http://sandag.org/index.asp?classid=26&fuseaction=home.classhome. Accessed December 4, 2015.
23. San Diego Pioneer Site Team. (2008) System Requirement Specifications for the I-15 Integrated Corridor Management System (ICMS) in San Diego, California, Report No. FHWA-JPO-08-044, Federal Highway Administration, Washington, DC. Available at http://ntl.bts.gov/lib/30000/30800/30840/sd_reqments.pdf. Accessed May 2, 2016.
24. SAIC. (2012) 511 Traffic Open Messaging Service Overview, Metropolitan Transportation Commission, Oakland, CA. Available at http://assets.511.org/pdf/TOMS_Overview_v3.0_ June2012.pdf. Accessed May 2, 2016.
105
25. Metropolitan Transportation Commission. (2010) 511 Traffic Data Disseminator Registration Agreement. Oakland, CA. Available at http://assets.511.org/pdf/511%20 Traffic%20Data%20Disseminator%20Agreement_Nov2010_FINAL.PDF. Accessed December 4, 2015.
26. Metropolitan Transportation Commission. (2015) 511 SF Bay—Home. Web site: http://511.org/. Accessed December 4, 2015.
27. Metropolitan Transportation Commission. (2015) 511 SF Bay—Developer Resources. Web site: http://511.org/developer-resources.asp. Accessed December 4, 2015.
28. University of Maryland, Center for Advanced Transportation Technology Laboratory (CATT Lab). (2012) RITIS CATT Lab. Web site: http://www.cattlab.umd.edu/?portfolio=ritis. Accessed November 2012.
29. Pack, M.L. (2015) RITIS Platform: Features & Applications Overview. CATT Lab, College Park, MD. Available at http://www.cattlab.umd.edu/files/RITIS%20Overview%20Book-2-2-15%20FINAL.pdf. Accessed May 2, 2016.
30. University of Maryland, (CATT Lab). (2005) Regional Integrated Transportation Information System (RITIS) Concept of Operations. Unpublished.
31. Meese, A. (2012) Update on Operations Planning at the National Capital Region Transportation Planning Board. Presented at the Association of Municipal Planning Organizations Operations Work Group, New York, NY. Available at http://www.ampo.org/ assets/1747_meeseintegratingoperation.pdf. Accessed May 2, 2016.
32. Pack, M. and Ivanov, N. (2014) NCHRP Synthesis 460: Sharing Operations Data Among Agencies: A Synthesis of Highway Practice, Transportation Research Board of the National Academies, Washington, DC. Available at http://onlinepubs.trb.org/onlinepubs/ nchrp/nchrp_syn_460.pdf. Accessed May 2, 2016.
33. University of Maryland CATT Lab. (2015) RITIS: Real-Time Data, Situational Awareness & Analytics Platform. University of Maryland, College Park, MD. Available at http://tinyurl.com/lu47c8s. Accessed May 27, 2016.
34. California Department of Transportation. (2014) Performance Measurement System (PeMS). Web site: http://pems.dot.ca.gov/. Accessed December 4, 2015.
35. PORTAL. (2012) Portland-Vancouver Systems Page. Web site: http://portal.its.pdx.edu/ Portal/index.php/systems. Accessed November 6, 2012.
36. Dailey, D.J. and Meyers, D. (1997) A Self Describing Data Transfer Methodology for ITS Applications. Institute of Electronics and Electrical Engineers Conference on Intelligent Transportation System, Boston, MA. Available at http://ieeexplore.ieee.org/xpl/ articleDetails.jsp?arnumber=660519&tag=1. Accessed May 2, 2016.
106
37. Intelligent Transportation Systems at University of Washington. (1999) Query the TDAD database. Web site: http://www.its.washington.edu/tdad/tdad_top.html. Accessed December 4, 2015.
38. University of Washington, Intelligent Transportation Systems Research Program. (2000) TDAD Traffic Data Acquisition and Distribution. Web site: http://www.its.washington.edu/ tdad/. Accessed December 15, 2015.
39. Washington Department of Transportation. (2002) Traffic Data Acquisition and Distribution (TDAD), Report No. WA-RD 484.1, Olympia, WA, p. 20. Available at http://www.wsdot.wa. gov/research/reports/fullreports/484.1.pdf. Accessed November 2012.
40. Washington Department of Transportation (1996) ITS Data Fusion, p. 9. Available at http://www.its.washington.edu/pubs/fusion_report.pdf. Accessed November 2012).
41. Pisano, P.A., Pol, J.S., Goodwin, L.C., and Stern, A.D. (2012) Using the Clarus System to Improve the Use of Mobile Data, Report No. FHWA‐JPO‐12‐076, Federal Highway Administration, Washington, DC. Available at http://ntl.bts.gov/lib/46000/46300/46328/ FHWA-JPO-12-076_FINAL_PKG.pdf. Accessed May 2, 2016.
42. Pisano, P.A., Pol, J.S., Goodwin, L.C., and Stern, A.D. (2005) Concept of Operations for Clarus—The Nationwide Surface Transportation Weather Observing and Forecasting System. Presented at the 85th Annual Meeting of the Transportation Research Board, Washington, DC. Available at http://www.ops.fhwa.dot.gov/weather/resources/ publications/clarustrb06/clarustrb06.pdf. Accessed May 2, 2016.
43. Pack, M.L. (2012) The Integration of Multi-State Clarus Data Into Real-Time and Archived RITIS Visualization Tools, Report No. FHWA-JPO-12-008, Federal Highway Administration, Washington, DC. Available at http://ntl.bts.gov/lib/45000/45500/45599/ FHWA-JPO-12-008_The_Integration_of_Multi-State_Clarus_Data_into_Data_ Visualization_Tools_Final_508.pdf. Accessed May 2, 2016.
44. Pisano, P.A. (2015) Clarus: Success Stories. Available at http://www.its.dot.gov/clarus/ index.htm. Accessed December 4, 2015.
45. Limber, M., Drobot, S., and Fowler, T. (2011) Clarus Quality Checking Algorithm Documentation Report, Report No. FHWA-JPO-11-075, Federal Highway Administration, Washington, DC. Available at http://ntl.bts.gov/lib/38000/38500/38545/ TOPR2_508_FHWA-JPO-11-075.pdf. Accessed May 2, 2016.
46. Federal Highway Administration. (2016) Research Data Exchange. Web site: https://www.its-rde.net. Accessed May 27, 2016.
47. Mygistics, Inc. and Booz Allen Hamilton Inc. (2012) Test Data Sets to Support Dynamic Mobility Applications Development: Final Report, Contract No. DTFH61-11-C-00038. Unpublished report prepared for the Federal Highway Administration.
107
48. Research and Innovative Technology Administration (2009) IEEE 1512—Family of Standards for Incident Management Message Sets. Fact Sheet. Research and Innovative Technology Administration,Washington, DC. Available at: https://www.standards.its. dot.gov/Factsheets/Factsheet/12. Accessed September 2, 2016.
49. Utah Department of Transportation. (2015) UPlan Map Center. Web site: http://uplan.maps.arcgis.com/home/index.html. Accessed December 4, 2015.
50. American Association of State Highway and Transportation Officials, Technology Implementation Group. (2011) Nomination of Technology Ready for Implementation. Nomination form. Washington, DC. Available at http://aii.transportation.org/Documents/ UPlan/uplan-nomination-form.pdf. Accessed May 2, 2016.
51. Higgins, C. (2011) UDOT Planning is in Step. Blog post: http://blog.udot.utah.gov/2011/ 08/udots-uplan-app-gets-achievement-award/. Accessed November 1, 2012.
52. Riffkin, M. (2010). Planning with UPlan. Presented at the 2010 Annual Intermountain ITE Meeting, Jackson, WY.
53. Utah Department of Transportation. (2014) Strategic Goals. Web site: http://www.udot.utah. gov/main/f?p=100:pg:0:::1:T,V:33,72786. Accessed December 4, 2015.
54. Hadi, M., Xiao, Y., Zhan, C., and Alvarez, P. (2012) Integrated Environment for Performance and Assessment of Intelligent Transportation Systems Operations, Office of Research and Development at the Florida Department of Transportation, Tallahassee, FL. Available at http://ntl.bts.gov/lib/45000/45900/45903/FDOT_BDK80_977-11_rpt.pdf. Accessed May 2, 2016.
55. Florida Department of Transportation. (Ongoing project) Decision Support Systems for Transportation System Management and Operations (TSM&O). Description available at http://trid.trb.org/view.aspx?id=1264373. Accessed May 2, 2016.
56. Data.Gov. (2016) Geospatial. Available at http://www.data.gov/geospatial. Accessed May 27, 2016.
57. Cambridge Systematics, Inc., Texas Transportation Institute, and Battelle Memorial Institute (2004). Traffic Data Quality Measurement, Federal Highway Administration, Office of Highway Policy Information, Washington, DC. Available at http://ntl.bts.gov/lib/jpodocs/ repts_te/14058.htm. Accessed May 2, 2016.
58. Alaska Department of Transportation and Public Facilities. (2009) Data Governance, Standards, and Knowledge Management. White paper. Alaska Department of Transportation, Juneau, AK.
59. ASTM International. (2012) Standard Practice for Metadata to Support Archived Data Management Systems. ASTM E2468-05(2012). ASTM International, West Conshohocken, PA. Available at www.astm.org. Accessed May 2, 2016.
108
60. Federal Geographic Data Committee. (2012) Geospatial Metadata Standards. Web site: http://www.fgdc.gov/metadata/geospatial-metadata-standards. Accessed November 1, 2012.
61. Federal Geographic Data Committee. (2016) Geospatial Metadata. Web site: https://www.fgdc.gov/metadata/index_html Accessed September 2, 2016.
62. International Organization for Standardization. (2003) ISO Standard 19115: 2003 (2014), “Geographic information—Metadata, International Organization for Standardization, Geneva, Switzerland. Available at http://www.iso.org/iso/home.html. Accessed May 12, 2015.
63. Clinger-Cohen Act of 1996. Public Law 104–106. Available at https://www.fismacenter. com/Clinger%20Cohen.pdf. Accessed May 27, 2016.
64. Federal Enterprise Architecture Program. (2005) The Data Reference Model Version 2.0, Washington, DC. Available at https://www.whitehouse.gov/sites/default/files/omb/assets/ egov_docs/DRM_2_0_Final.pdf. Accessed May 2, 2016.
65. Library of Congress, Network Development and MARC Standards Office. (2006) Frequently Asked Questions (FAQ). Web site: http://www.loc.gov/marc/faq.html. Accessed December 15, 2015.
66. Cambridge Systematics, Inc. (2013) NCHRP Report 754: Improving Management of Transportation Information, National Cooperative Highway Research Program, Washington, DC. Available at http://onlinepubs.trb. org/onlinepubs/nchrp/nchrp_rpt_754.pdf. Accessed May 2, 2016.
67. Jung, S., Glassco, R., and Wunderlich, K. (2011) Metadata Guidelines for the Research Data Exchange, Prepared for the U.S. Department of Transportation, Washington, DC.
68. Cambridge Systematics, Inc. (2011) Virtual Access of Transportation Data from Multiple Data Sources for Improved Decision-Making. White paper. Washington, DC.
69. ASTM International. (2011) Standard Guide for Archiving and Retrieving ITS-Generated Data. ASTM E2259-03a(2011). ASTM International, West Conshohocken, PA, Available at www.astm.org. Accessed May 2, 2016.
70. ASTM International. (2008) Standard Specification for Archiving ITS-Generated Traffic Monitoring Data. ASTM E2665-08, ASTM International, West Conshohocken, PA. Available at www.astm.org. Accessed May 2, 2016.
71. Cambridge Systematics, Inc. (2010) General Requirements for an Archived Data Management System. Prepared for Florida Department of Transportation. (Unpublished report prepared for the Florida Department of Transportation, District 4).
72. Cambridge Systematics, Inc., Boston Strategies International, Inc., Gordon Proctor and Associates, and M. Markow. (2010) NCHRP Report 666: Target-Setting Methods and Data Management to Support Performance-Based Resource Allocation by Transportation
109
Agencies. National Cooperative Highway Research Program, Washington, DC. Available at: http://www.trb.org/Publications/Blurbs/ 164178.aspx. Accessed May 2, 2016.
73. Vandervalk, A., Snyder, D., and Hajek, J. (2012) U.S. DOT Roadway Transportation Data Business Plan (Phase 1), Report No. FHWA-JPO-13-84, Federal Highway Administration, Washington, DC. Available at http://ntl.bts.gov/lib/48000/48500/48531/6E33210B.pdf. Accessed May 2, 2016.
74. SAIC (2011). Real-Time Data Capture and Management State of the Practice Assessment and Innovations Scan: Lessons from Scan of Current Practices. Report prepared for the Federal Highway Administration.
75. Hook, L.A., Vannan, S.K., Beaty, T.W., Cook, R.B., and Wilson, B.E. (2010) Best Practices for Preparing Environmental Data Sets to Share and Archive. Oakridge National Laboratory, Oakridge, TN. Available at http://daac.ornl.gov/PI/BestPractices-2010.pdf. Accessed May 2, 2016.
76. MIT Libraries, Data Management and Publishing. (2010) General Data Management Planning Checklist. Original 2010 link (http://libraries.mit.edu/guides/subjects/data-management/checklist.html) no longer available; current reproduction from secondary source available at http://guides.ucf.edu/data. Accessed May 2, 2016.
77. Brecher, A., Hassol, J., and Sloan, S. (2012) Policy Analysis and Recommendations for the DCM Research Data Exchange. Report No. FHWA-JPO-12-036, Federal Highway Administration, Washington, DC. Available at http://ntl.bts.gov/lib/47000/47200/47241/ FHWA-JPO-12-036_Final_Pkg.pdf. Accessed May 2, 2016.
78. Americans with Disabilities Act of 1990. Available at http://www.ada.gov/2010_regs.htm. Accessed May 27, 2016.
79. Brecher, A., Cuddy, M., Hassol, J., and Sloan, S. (2012) State-of-the-Practice and Lessons Learned on Implementing Open Data and Open Source Policies. Report No. FHWA-JPO-12-030, Federal Highway Administration, Washington, DC. Available at http://ntl.bts.gov/lib/ 47000/47200/47239/FHWA-JPO-12-030_Final_Pkg_v2.pdf. Accessed May 2, 2016.
80. Federal CIO Council. (2010) Agency Information Exchange Functional Standards Evaluation. Federal CIO Council, Washington, DC. Available at https://cio.gov/wp-content/uploads/downloads/2012/09/3.12.1-NIEM-Assessment-Report_Final_Master.pdf. Accessed May 2, 2016.
81. Bartinique, I., Hassol, J., Herring, D., Sheridan, A., Sloan, S., and Waldron, D. (2012) Identification of Critical Policy Issues for the Mobility Program. Report No. FHWA-JPO-12-035, Federal Highway Administration, Washington, DC. Available at http://ntl.bts.gov/lib/ 47000/47200/47240/ FHWA-JPO-12-035_Final_Pkg_v2.pdf. Accessed May 2, 2016.
82. Metropolitan Washington Council of Governments. (2006) Memorandum of Understanding for Initial MEDS. Available at https://www.mwcog.org/uploads/committee-documents/ vlpeXVY20060106132930.doc. Accessed May 2, 2016.


HRDO-30/12-16(WEB)E