Embed Size (px)
Citation preview

MIKE KRAUSE
Executive Director
BILL LEE
Governor
STATE OF TENNESSEE
HIGHER EDUCATION COMMISSION
9th Floor, 312 Rosa L. Parks Avenue
NASHVILLE, TENNESSEE 37243
(615) 741-3605
MEMORANDUM
To: Butch Eley, Commissioner
Department of Finance and Administration
From: Executive Director Mike Krause
Subject: FY2021-22 Higher Education Recommendations for State
Appropriations, Student Fees and Capital Projects
Date: November 19, 2020
The Tennessee Higher Education Commission, which met in regular session on
November 6, approved a request for 2021-22 higher education appropriations and
capital projects, as well as initial student fee guidance. The attachments to this
memorandum encompass the Commission’s recommendations and a summary of
their actions is below.
The overall recommendation for 2021-22 state appropriations for operation is
$1,760,211,000, which includes $36 million recurring to fund formula unit outcomes;
$8.9 million recurring to fund operational needs for our medical units; $8.6 million
recurring for strategic investments in those specialized units; and $9 million
recurring and $350,000 non-recurring to fund statewide system priorities. Per the
request of your office, a salary recommendation for higher education is not included
in this overall state appropriation recommendation.
Attachment II of the enclosed State Appropriation Recommendation document
details the distribution of the above funds by institution and agency. Per a provision
of the Complete College Tennessee Act (CCTA) of 2010, THEC is recommending state
appropriations for the community colleges as a sector. The institutional breakdown
included is meant for informational purposes only. Attachment III provides
additional information on the specialized units strategic initiatives and the statewide
system priorities.

Attachment IV of the enclosed State Appropriation Recommendation document
details the requested distribution for the 2.0 percent reduction for higher education.
The recommendations were formulated using the outcomes-based funding formula,
as called for by the CCTA. Attachment V of the enclosed State Appropriation
Recommendation document addresses funding scenarios for flat funding, $36
million, $59 million, and flat tuition.
In partnership with the above recommended appropriation increases, and in
accordance with the Focus on College and University Success (FOCUS) Act, the
Commission also approved initial guidance for undergraduate maintenance and
mandatory fee increases of zero to two percent at universities, community colleges
and TCATs. Binding recommendations will be made by the Commission in May once
the 2021-22 budget is set by the Legislature. The enclosed Student Fee
Recommendation document includes initial 2021-22 tuition and fee levels, along
with analysis tables.
The Capital Projects Recommendation enclosed document includes approved state
investment request for capital outlay projects of $480,282,000, comprising six
projects at the Locally Governed Institutions, three projects at the University of
Tennessee system, and two projects at Tennessee Board of Regents institutions. The
Commission also approved a capital maintenance request of $152,311,000 for 70
projects and one special initiative to continue to address immediate electrical
system needs at Tennessee State University. Finally, 18 institution revenue- and
TSSBA-funded projects totaling $276,750,000 are included for informational
purposes. Institutions may bring these projects forward to the State Building
Commission at any time in the next two years.
Thank you for your assistance and advice in formulating these recommendations,
and for your support in transmitting this information to the Governor and the
General Assembly.
Please do not hesitate to contact me with any questions or concerns.
cc: Randy Boyd
Flora Tydings
Glenda Glover
Sidney McPhee
Brian Noland
Phil Oldham
M. David Rudd
Dannelle Whiteside
Attachments enclosed

DATE: November 6, 2020
SUBJECT: 2021-22 Operating State Appropriation Recommendations
ACTION RECOMMENDED: Approval
BACKGROUND INFORMATION
The operating appropriation recommendations are informed by increased productivity in the outcomes-based funding formula, quality assurance points, inflationary factors, and changes to fixed costs. Per the Complete College Tennessee Act, the Tennessee Higher Education Commission (THEC) makes state appropriation recommendations in a lump-sum fashion for the community college sector. Outcomes-based formula calculations for individual community colleges are presented for informational purposes.
FORMULA UNIT RECOMMENDATION
For the 2021-22 fiscal year, THEC staff recommend a recurring increase of $36 million in state appropriations to recognize growth in outcomes productivity for universities, community colleges, and colleges of applied technology. At the request of the administration, this recurring recommendation does not include a salary component, allowing the administration to apply general government’s salary policy to higher education.
The outcomes-based funding formula utilizes a three-year average to determine growth in outcomes. The 2021-22 formula includes outcomes produced in 2017-18, 2018-19 and 2019-20. Institutions continue to show improvement in funding formula outcomes when comparing the most recent year of data used for the 2021-22 formula request to 2016-17, the data year dropped off with the movement to the new three-year average. Rooted in statewide implementation of the Tennessee Promise program, the community colleges produced nearly 11,500 associate degrees in 2019-20, compared to fewer than 10,000 in 2016-17. This represents a 16 percent increase from new-year to dropped-year of outcomes data. Community colleges awarded nearly 16,000 total credentials in 2019-20, a 12 percent increase since 2016-17. Universities continue to succeed in the model as well. In 2019-20, universities awarded over 22,500 bachelor’s degrees, a two percent increase from 2016-17.
Agenda Item: II.T E N N E S S E E
H I G H E R
E D U C A T I O N
C O M M I S S I O N

Additionally, the average graduation rate has increased significantly from 57.1 percent in 2016-17 to 61.8 percent in 2019-20.
Collaboration between institutions and the local community continue to help the state in its pursuit of Drive to 55; more students pursued a dual enrollment opportunity at a community college in 2019-20 than ever before, community colleges provided nearly 1 million hours of workforce training to local residents and businesses, universities generated over $360 million in research and public service expenditures, and, in the fifth year of inclusion in the formula, community colleges—in coordination with universities—awarded over 850 reverse transfer associate degrees. The Tennessee Colleges of Applied Technology continue to grow, serving over 21,000 students in Fall 2019—a six percent increase over the previous year. These institutions reported a completion rate of 82 percent and a job placement rate for graduates of 89 percent in 2018-19.
SPECIALIZED UNITS RECOMMENDATION
Along with the formula unit recommendation, staff recommend a funding increase of $8.9 million recurring for the specialized units—which include the medical colleges, agriculture research units, public service entities and statewide program initiatives. Funding increases for these units reflect annual growth in several cost drivers. These drivers exceed general inflation and include increases in costs due to maintenance, salaries and benefits, information technology systems, laboratory supplies, and scientific equipment. For example, Tennessee’s medical unit costs are driven by the need to provide students with current information and techniques that require updated medical technology and journal access. Tennessee’s agricultural centers have unique cost drivers related to equipment, farming machinery, crops, and livestock. Specialized units have not received general operating dollars to address these non-salary and benefit related cost increases since 2016-17. Operating fund recommendations for the formula and specialized units are detailed in Attachment II.
OTHER SPECIAL INITIATIVES
Staff also recommend $8.6 million in recurring funds for strategic investments in several specialized units. The specialized unit strategic initiatives include $6.6 million for the University of Tennessee Institute of Agriculture to address comparative salary inequities and to increase the number of extension county agents. Additionally, staff recommend $2 million for the TSU Cooperative Extension to sustain current extension operations in fifty counties in concert with federal and county support funds. Staff also recommend three statewide system priorities at the Tennessee Board of Regents, totaling $9.35 million. The first
2

investment of $5.9 million recurring would allow TBR to employ a sworn police officer at each TCAT campus and hire a Chief of Police at the system office to coordinate all safety and security functions for the Board. For a recurring investment of $2.7 million, the second statewide system priority would fund additional personnel at the TCATs, building student supports and expertise to better serve students through graduation and into the workforce. The final recommended strategic investment would provide $750,000 to support faculty as they create competency-based coursework, an approach to instruction that emphasizes mastery of material rather than seat time. Additional information on these initiatives can be found in Attachment III.
REDUCTION SCENARIO
Finally, the Department of Finance & Administration has requested that state agencies prepare the 2021-22 budget with a 2.0 percent reduction in state appropriations. Financial aid funding provided by TSAC and recurring funds for capital maintenance are exempt from these reduction scenarios. For higher education, a 2.0 reduction to the remaining units results in a reduction in state appropriations of $31.6 million. This distribution is detailed in Attachment IV.
RECOMMENDATION SUMMARY
The grand total recurring recommendation for all higher education operating appropriations for 2021-22 is $1.76 billion. This includes $1.2 billion to fund the formula units and Tennessee Colleges of Applied Technology, $484.1 million to fund the specialized units, and $80.0 million for strategic program investments. These recommendations total $62.8 million of new funds, an increase of 3.7 percent over 2020-21.
3

Academic Formula Units 2016-17 2017-18 2018-19 2019-20 2020-21LGI UniversitiesAustin Peay $40,378,500 $44,621,700 $47,857,100 $50,503,100 $51,097,700East Tennessee 55,362,800 61,099,800 65,770,700 70,579,000 71,656,300 Middle Tennessee 90,753,200 97,003,700 103,216,200 107,399,400 106,483,000 Tennessee State 33,717,900 36,757,500 39,402,300 41,795,200 41,365,200 Tennessee Tech 42,671,100 47,231,100 55,020,600 59,597,500 60,428,600 University of Memphis 102,440,600 110,827,200 117,771,000 123,370,700 123,734,100
Subtotal $365,324,100 $397,541,000 $429,037,900 $453,244,900 $454,764,900Community Colleges1
Chattanooga $29,315,200 $31,118,200 $31,863,600 $33,669,500 $33,084,400Cleveland 9,751,700 10,988,200 11,215,700 12,302,400 11,937,900 Columbia 13,970,500 15,026,400 15,821,100 16,836,200 17,615,800 Dyersburg 8,622,500 9,388,600 9,734,200 10,516,000 10,717,100 Jackson 12,395,800 13,561,500 14,266,600 15,102,200 14,879,600 Motlow 11,739,900 13,292,500 15,023,000 17,565,300 19,334,000 Nashville 17,756,500 20,259,300 22,228,600 23,374,700 22,732,000 Northeast 16,059,900 18,137,200 19,695,300 21,089,900 23,013,900 Pellissippi 27,349,000 30,477,800 32,729,600 34,933,800 35,442,700 Roane 19,093,300 21,087,900 22,518,000 24,110,700 24,116,500 Southwest 26,115,800 27,147,100 28,504,100 30,253,800 29,938,100 Volunteer 18,698,700 20,809,700 23,498,200 26,331,900 27,806,100 Walters 21,912,500 23,469,700 24,606,600 25,527,400 25,474,600
Subtotal $232,781,300 $254,764,100 $271,704,600 $291,613,800 $296,092,700UT UniversitiesUT Chattanooga $45,835,300 $51,005,300 $56,184,500 $58,905,900 $59,510,200UT Knoxville 199,911,900 217,270,000 234,382,200 247,059,300 247,566,300 UT Martin 29,922,900 32,495,400 34,698,100 35,748,200 34,665,400
Subtotal $275,670,100 $300,770,700 $325,264,800 $341,713,400 $341,741,900
Total Colleges and Universities $873,775,500 $953,075,800 $1,026,007,300 $1,086,572,100 $1,092,599,500
TN Colleges of Applied Technology $60,790,600 $66,857,600 $71,579,600 $75,727,400 $75,622,700
Total Academic Formula Units $934,566,100 $1,019,933,400 $1,097,586,900 $1,162,299,500 $1,168,222,200Note: All years of appropriations are recurring funds only.
ATTACHMENT IState Appropriations History
1 - Detail for the community colleges was estimated by THEC based on information from the Tennessee Board of Regents. Funds are allocated to the community colleges as a system.
4

Specialized Units 2016-17 2017-18 2018-19 2019-20 2020-21Medical EducationETSU College of Medicine $31,268,700 $33,094,900 $34,470,700 $35,543,300 $36,717,300ETSU Family Practice 6,687,600 7,160,800 7,526,300 7,816,500 7,835,800 UT College of Vet Medicine 18,124,700 19,710,800 21,398,400 22,192,700 22,280,200 UT Health Science Center1 140,534,000 149,498,300 157,683,100 162,001,500 162,748,000
Subtotal $196,615,000 $209,464,800 $221,078,500 $227,554,000 $229,581,300
Research and Public ServiceUT Agricultural Experiment Station $27,625,600 $29,048,400 $30,435,300 $31,092,900 $31,160,800UT Agricultural Extension Service 33,831,200 35,590,500 37,509,700 38,276,100 38,428,800 TSU McMinnville Center 594,500 608,200 619,400 1,429,200 1,429,900 TSU Institute of Ag. and Environmental Research 3,456,300 3,541,700 3,613,700 4,771,800 4,771,600 TSU Cooperative Extension 3,318,500 3,510,100 3,610,200 3,703,500 3,705,200 TSU McIntire-Stennis Forestry Research 189,400 193,300 196,200 198,900 198,900 UT Space Institute 8,490,500 8,900,500 9,129,100 9,290,800 9,301,200 UT Institute for Public Service 6,145,600 6,465,100 6,684,800 6,823,000 6,837,800 UT County Technical Assistance Service 2,236,600 2,962,700 3,103,800 3,203,900 3,221,000 UT Municipal Technical Advisory Service 3,157,300 3,408,700 3,603,800 3,713,700 3,731,200
Subtotal $89,045,500 $94,229,200 $98,506,000 $102,503,800 $102,786,400
Other Specialized UnitsUT University-Wide Administration $5,202,100 $5,537,800 $5,939,000 $6,032,100 $6,064,200TN Board of Regents Administration 5,720,200 6,483,500 8,196,600 8,444,700 12,775,800 TN Student Assistance Corporation 83,568,600 93,536,000 103,703,900 116,177,100 116,195,200 Contract Education 2,176,000 1,832,500 1,832,500 2,249,900 2,249,900 TN Higher Education Commission 3,619,300 4,495,700 5,187,100 5,757,200 5,588,500
Subtotal $100,286,200 $111,885,500 $124,859,100 $138,661,000 $142,873,600
Total Specialized Units $385,946,700 $415,579,500 $444,443,600 $468,718,800 $475,241,300
Program InitiativesCampus Centers of Excellence $17,133,600 $17,685,600 $18,063,100 $18,363,900 $18,379,300Campus Centers of Emphasis 1,236,600 1,288,100 1,314,400 1,338,100 1,340,000 Academic Scholars Program 711,800 1,211,800 1,211,800 1,211,800 1,211,800 UT Access and Diversity Initiative 5,806,700 5,806,700 5,806,700 5,806,700 5,806,700 TBR Access and Diversity Initiative 10,256,900 10,256,900 10,256,900 10,256,900 10,256,900 Research Initiatives - UT 5,852,900 5,852,900 5,852,900 5,852,900 5,852,900 THEC Grants 5,778,400 6,028,400 5,852,900 11,089,000 11,089,000
Subtotal $46,776,900 $48,130,400 $48,358,700 $53,919,300 $53,936,600
Total Operating2 $1,367,289,700 $1,483,643,300 $1,590,389,200 $1,684,937,600 $1,697,400,100
2 - Does not include $40M recurring for Capital Maintenance.1 - UT Health Science Center includes funding for UT College of Medicine, UT Family Practice, and UT Memphis.Note: All years of appropriations are recurring funds only.
ATTACHMENT IState Appropriations History
5

A B C D E = C + D F = E + A G = E / A H = F / B
2020-21 2021-22 Outcomes Formula Share of New 2021-22 2021-22 Percent Percent
Academic Formula Units Appropriation1 Formula Calculation Adjustments Funding Changes Recommendation Change FundedLGI UniversitiesAustin Peay $51,097,700 $83,521,800 $2,967,400 $1,677,800 $4,645,200 $55,742,900 9.1% 66.7%
East Tennessee2 70,556,300 109,774,200 502,500 2,205,200 2,707,700 73,264,000 3.8% 66.7%Middle Tennessee 106,483,000 161,044,200 (2,236,300) 3,235,100 998,800 107,481,800 0.9% 66.7%Tennessee State 41,365,200 61,057,400 (1,841,700) 1,226,500 (615,200) 40,750,000 -1.5% 66.7%Tennessee Tech2 57,428,600 88,052,200 (430,900) 1,768,800 1,337,900 58,766,500 2.3% 66.7%University of Memphis 123,734,100 190,519,200 (407,700) 3,827,200 3,419,500 127,153,600 2.8% 66.7%
Subtotal $450,664,900 $693,969,000 ($1,446,700) $13,940,600 $12,493,900 $463,158,800 2.8% 66.7%
Community Colleges3
Chattanooga $33,084,400 $50,969,200 ($91,100) $1,023,900 $932,800 $34,017,200 2.8% 66.7%Cleveland 11,937,900 18,747,000 197,400 376,600 574,000 12,511,900 4.8% 66.7%Columbia 17,615,800 28,293,400 699,000 568,400 1,267,400 18,883,200 7.2% 66.7%Dyersburg 10,717,100 16,729,900 112,500 336,100 448,600 11,165,700 4.2% 66.7%Jackson 14,879,600 23,477,000 317,500 471,600 789,100 15,668,700 5.3% 66.7%Motlow 19,334,000 32,847,700 1,928,800 659,700 2,588,500 21,922,500 13.4% 66.7%Nashville 22,732,000 34,225,000 (577,600) 687,500 109,900 22,841,900 0.5% 66.7%Northeast 23,013,900 35,954,300 259,900 722,300 982,200 23,996,100 4.3% 66.7%Pellissippi 35,442,700 55,201,900 290,500 1,108,900 1,399,400 36,842,100 3.9% 66.7%Roane 24,116,500 37,779,600 338,900 758,900 1,097,800 25,214,300 4.6% 66.7%Southwest 29,938,100 45,287,900 (622,400) 909,800 287,400 30,225,500 1.0% 66.7%Volunteer 27,806,100 44,524,400 1,015,300 894,400 1,909,700 29,715,800 6.9% 66.7%
Walters 25,474,600 39,145,300 (135,200) 786,400 651,200 26,125,800 2.6% 66.7%Community College Subtotal $296,092,700 $463,182,600 $3,733,500 $9,304,500 $13,038,000 $309,130,700 4.4% 66.7%
UT Universities UT Chattanooga $59,510,200 $91,369,200 ($365,300) $1,835,400 $1,470,100 $60,980,300 2.5% 66.7%UT Knoxville2 244,566,300 377,009,200 (521,600) 7,573,400 7,051,800 251,618,100 2.9% 66.7%UT Martin2 34,025,400 51,570,500 (642,900) 1,036,000 393,100 34,418,500 1.2% 66.7%
Subtotal $338,101,900 $519,948,900 ($1,529,800) $10,444,800 $8,915,000 $347,016,900 2.6% 66.7%
Total Colleges and Universities $1,084,859,500 $1,677,100,500 $757,000 $33,689,900 $34,446,900 $1,119,306,400 3.2% 66.7%
TN Colleges of Applied Technology2 $75,196,700 $114,997,200 ($757,000) $2,310,100 $1,553,100 $76,749,800 2.1% 66.7%
Total Academic Formula Units $1,160,056,200 $1,792,097,700 $0 $36,000,000 $36,000,000 $1,196,056,200 3.1% 66.7%
ATTACHMENT II2021-22 State Appropriations Distribution Recommendation
Breakdown of 2021-22 Changes
3 - THEC's community college recommendation is for the sector as a whole. Institutional detail displayed here is for informational purposes only.
1 - Recurring funding. Includes funding of $7.4M for legislative initiatives. A breakdown of these initiatives by campus is included in Appendix A.2 - Does not include recurring funds appropriated to the ETSU Gray Fossil Site ($350K), ETSU Rural Public Health Project ($750K), TTU College of Engineering ($3M), UT Knoxville College of Engineering ($3M), UT Martin Parsons Center ($200K), UT Martin Selmer Center ($190K), UT Martin Somerville Center ($250K) and the TCATs Correctional Education Investment Initiative ($426K). These appropriations are included as Program Initiatives.
6

A B C D E = D + A F = D / A
2020-21 2020-21 2021-22 2021-22 2021-22 Percent
Academic Formula Units Appropriation1 Appropriation Share Appropriation Share Funding Changes Recommendation ChangeLGI UniversitiesAustin Peay $51,097,700 4.71% 4.98% $4,645,200 $55,742,900 9.1%East Tennessee2 70,556,300 6.50% 6.55% 2,707,700 73,264,000 3.8%Middle Tennessee 106,483,000 9.82% 9.60% 998,800 107,481,800 0.9%Tennessee State 41,365,200 3.81% 3.64% (615,200) 40,750,000 -1.5%Tennessee Tech2 57,428,600 5.29% 5.25% 1,337,900 58,766,500 2.3%University of Memphis 123,734,100 11.41% 11.36% 3,419,500 127,153,600 2.8%
Subtotal $450,664,900 41.54% 41.38% $12,493,900 $463,158,800 2.8%
Community Colleges3
Chattanooga $33,084,400 3.05% 3.04% $932,800 $34,017,200 2.8%Cleveland 11,937,900 1.10% 1.12% 574,000 12,511,900 4.8%Columbia 17,615,800 1.62% 1.69% 1,267,400 18,883,200 7.2%Dyersburg 10,717,100 0.99% 1.00% 448,600 11,165,700 4.2%Jackson 14,879,600 1.37% 1.40% 789,100 15,668,700 5.3%Motlow 19,334,000 1.78% 1.96% 2,588,500 21,922,500 13.4%Nashville 22,732,000 2.10% 2.04% 109,900 22,841,900 0.5%Northeast 23,013,900 2.12% 2.14% 982,200 23,996,100 4.3%Pellissippi 35,442,700 3.27% 3.29% 1,399,400 36,842,100 3.9%Roane 24,116,500 2.22% 2.25% 1,097,800 25,214,300 4.6%Southwest 29,938,100 2.76% 2.70% 287,400 30,225,500 1.0%Volunteer 27,806,100 2.56% 2.65% 1,909,700 29,715,800 6.9%Walters 25,474,600 2.35% 2.33% 651,200 26,125,800 2.6%
Community College Subtotal $296,092,700 27.29% 27.62% $13,038,000 $309,130,700 4.4%
UT Universities UT Chattanooga $59,510,200 5.49% 5.45% $1,470,100 $60,980,300 2.5%UT Knoxville2 244,566,300 22.54% 22.48% 7,051,800 251,618,100 2.9%UT Martin2 34,025,400 3.14% 3.07% 393,100 34,418,500 1.2%
Subtotal $338,101,900 31.17% 31.00% $8,915,000 $347,016,900 2.6%
Total Colleges and Universities $1,084,859,500 100.00% 100.00% $34,446,900 $1,119,306,400 3.2%
3 - THEC's community college recommendation is for the sector as a whole. Institutional detail displayed here is for informational purposes only.
ATTACHMENT II2021-22 State Appropriations Share of Total Calculation
2 - Does not include recurring funds appropriated to the ETSU Gray Fossil Site ($350K), ETSU Rural Public Health Project ($750K), TTU College of Engineering ($3M), UT Knoxville College of Engineering ($3M), UT Martin Parsons Center ($200K), UT Martin Selmer Center ($190K), and UT Martin Somerville Center ($250K). These appropriations are included as Program Initiatives.
1 - Recurring funding. Includes historical funding of $7.4M for legislative initiatives. A breakdown of these initiatives by campus is included in Appendix A.
7

A B C = B - A D = C / A
2020-21 2021-22 Total Percent
Specialized Units Appropriation1 Recommendation1Change Change
Medical EducationETSU College of Medicine $36,717,300 $38,449,300 $1,732,000 4.7%ETSU Family Practice 7,835,800 7,945,500 109,700 1.4%UT College of Vet Medicine 22,280,200 22,592,100 311,900 1.4%UT Health Science Center 162,748,000 167,917,200 5,169,200 3.2%
Subtotal $229,581,300 $236,904,100 $7,322,800 3.2%
Research and Public ServiceUT Agricultural Experiment Station $31,160,800 $31,597,100 $436,300 1.4%UT Agricultural Extension Service 38,428,800 38,966,800 538,000 1.4%TSU McMinnville Center 1,429,900 1,478,300 48,400 3.4%TSU Institute of Ag. and Environmental Research 4,771,600 4,838,400 66,800 1.4%TSU Cooperative Extension 3,705,200 3,757,100 51,900 1.4%TSU McIntire-Stennis Forestry Research 198,900 201,700 2,800 1.4%UT Space Institute 9,301,200 9,431,400 130,200 1.4%UT Institute for Public Service 6,837,800 6,993,600 155,800 2.3%UT County Technical Assistance Service 3,221,000 3,281,700 60,700 1.9%UT Municipal Technical Advisory Service 3,731,200 3,783,400 52,200 1.4%
Subtotal $102,786,400 $104,329,500 $1,543,100 1.5%
Other Specialized UnitsUT University-Wide Administration $6,064,200 $6,064,200 $0 0.0%TN Board of Regents Administration 12,775,800 12,775,800 - 0.0%TN Student Assistance Corporation 116,195,200 116,195,200 - 0.0%Contract Education 2,249,900 2,249,900 - 0.0%TN Higher Education Commission 5,588,500 5,588,500 - 0.0%
Subtotal $142,873,600 $142,873,600 $0 0.0%
Total Specialized Units $475,241,300 $484,107,200 $8,865,900 1.9%
Program InitiativesCampus Centers of Excellence $18,379,300 $18,379,300 $0 0.0%Campus Centers of Emphasis 1,340,000 1,340,000 - 0.0%Academic Scholars Program 1,211,800 1,211,800 - 0.0%UT Access and Diversity Initiative 5,806,700 5,806,700 - 0.0%TBR Access and Diversity Initiative 10,256,900 10,256,900 - 0.0%Research Initiatives - UT 5,852,900 5,852,900 - 0.0%THEC Grants 11,089,000 11,089,000 - 0.0%Specialized Units Strategic Initiatives2 - 8,595,000 8,595,000 NAStatewide System Priorities2 - 9,350,000 9,350,000 NAETSU Rural Public Health Project3 750,000 750,000 - 0.0%ETSU Gray Fossil Site3 350,000 350,000 - 0.0%TTU College of Engineering3 3,000,000 3,000,000 - 0.0%UT Knoxville College of Engineering3 3,000,000 3,000,000 - 0.0%UT Martin Parsons, Somerville & Selmer Centers3 640,000 640,000 - 0.0%TCAT Correctional Education Investment Initiative3 426,000 426,000 - 0.0%
Subtotal $62,102,600 $80,047,600 $17,945,000 28.9%
Total $1,697,400,100 $1,760,211,000 $62,810,900 3.7%1 - Recurring funds.
3 - Recurring funds appropriated to ETSU ($1.1M), TTU ($3M), UT Knoxville ($3M), UT Martin ($640K), and the TCATs ($426K).2 - Recurring and non-recurring funding for strategic investments in specialized units and statewide system priorities. See Attachment III for further detail.
ATTACHMENT II2021-22 State Appropriations Distribution Recommendation
8

Board Priority
Governing Board
Institution Project Name Total Cost Project Description
1 UTUT Institute of
Agriculture
Competitive Salaries and Extension Agents for Distressed Rural
Counties
$6,595,000
Meeting UT's responsibility to the land-grant mission is tied directly to the professional quality of the system's faculty and staff, but recently the system has been facing competition from its peers related to salary. Currently, no peer veterinary college pays its faculty less than UT Vet Med, increasing concerns about the system's ability to recruit top talent for new or existing positions. To improve prospects of attracting and retaining the best scientific talents-and to further contributions to The University of Tennessee's goal of becoming a true comprehensive research-extensive institution-it is imperative that salaries for research faculty also be increased to a level on par with other land-grant institutions. A compensation study conducted by Sibson in April 2019 indicated that $2.3 million would be needed to retain and recruit competitively with our veterinary college peers and $2.1 million would be needed for research salaries. Additionally, UT Extension plays a critical role in addressing the challenges found in Tennessee's distressed rural counties. An additional investment of $2.19 million to the extension budget would provide at least one full-time county agent in the 4-H, family and consumer sciences, and agriculture and natural resources program areas to the citizens of every county in Tennessee. The requested budget would support the hire of 32 additional county agents that would fully implement a three-county agent model in each of Tennessee’s 95 counties. ($6.595M recurring)
1 TSUTSU Cooperative
ExtensionSustaining Cooperative
Extension Services$2,000,000
Recurring funding is requested to allow the TSU Cooperative Extension program to sustain current extension operations in fifty counties in concert with federal and county support funds. ($2.0M recurring)
Board Priority
Governing Board
Institution Project Name Total Cost Project Description
3 TBR TCATsSafety and Security for
TCATs$5,900,000
Recurring funding is requested to continue the investment that Tennessee has made in campus safety and security by adding security personnel at each TCAT campus location. This request would fund 90 FTE officers to serve approximately 68 locations for coverage when students are on campus. Additionally, the Board will add a Director of Public Safety/Chief of Police who would be responsible for campus security operations across the system. ($5.9M recurring)
1 TBR TCATsTCAT Student Success
Support$2,700,000
Over the last few years, TCATs have undergone significant operational strategic changes building off their successful foundation and expanding into new areas of student access and success. The current strategic policy environment requires TCATs to have greater capacity to serve student and workforce needs. Through a partnership with Achieving the Dream, TCATs have begun building student supports and expertise to better serve students through graduation and into the workforce. Additionally, these institutions have modernized their systems of financial aid, admissions, and business operations in recent years. This recurring funding request would provide one FTE position per TCAT main campus, allowing these institutions to build the necessary additional capacity to meet these growing strategic and operational demands. ($2.7M recurring)
2 TBRCommunity Colleges
and TCATsCompetency-Based Education Capacity
$750,000
Recurring and non-recurring funding is requested to support faculty as they convert their courses to the competency-based education (CBE) model throughout numerous programs. CBE is an approach to instruction that emphasizes mastery of material rather than simply seat time. It is a cornerstone of the TCAT model and is utilized by other colleges throughout the country to great effect. ($400,000 recurring; $350,000 non-recurring)
ATTACHMENT III2021-22 Specialized Units Strategic Initiatives
2021-22 Statewide System Priorities
9

A B C D E = C + D F = E + A G = E / A H = F / B
2020-21 2021-22 Outcomes Formula 2.0% Reduction to 2021-22 2021-22 Percent PercentAcademic Formula Units Appropriation1 Formula Calculation Adjustments Higher Education Change Recommendation Change FundedLGI UniversitiesAustin Peay $51,097,700 $83,521,800 $2,967,400 ($1,231,500) $1,735,900 $52,833,600 3.4% 63.3%East Tennessee2 70,556,300 109,774,200 502,500 (1,618,600) (1,116,100) 69,440,200 -1.6% 63.3%Middle Tennessee 106,483,000 161,044,200 (2,236,300) (2,374,500) (4,610,800) 101,872,200 -4.3% 63.3%Tennessee State 41,365,200 61,057,400 (1,841,700) (900,300) (2,742,000) 38,623,200 -6.6% 63.3%Tennessee Tech2 57,428,600 88,052,200 (430,900) (1,298,300) (1,729,200) 55,699,400 -3.0% 63.3%University of Memphis 123,734,100 190,519,200 (407,700) (2,809,100) (3,216,800) 120,517,300 -2.6% 63.3%
Subtotal $450,664,900 $693,969,000 ($1,446,700) ($10,232,300) ($11,679,000) $438,985,900 -2.6% 63.3%
Community Colleges3
Chattanooga $33,084,400 $50,969,200 ($91,100) ($751,500) ($842,600) $32,241,800 -2.5% 63.3%Cleveland 11,937,900 18,747,000 197,400 (276,400) (79,000) 11,858,900 -0.7% 63.3%Columbia 17,615,800 28,293,400 699,000 (417,200) 281,800 17,897,600 1.6% 63.3%Dyersburg 10,717,100 16,729,900 112,500 (246,700) (134,200) 10,582,900 -1.3% 63.3%Jackson 14,879,600 23,477,000 317,500 (346,200) (28,700) 14,850,900 -0.2% 63.3%Motlow 19,334,000 32,847,700 1,928,800 (484,300) 1,444,500 20,778,500 7.5% 63.3%Nashville 22,732,000 34,225,000 (577,600) (504,600) (1,082,200) 21,649,800 -4.8% 63.3%Northeast 23,013,900 35,954,300 259,900 (530,100) (270,200) 22,743,700 -1.2% 63.3%Pellissippi 35,442,700 55,201,900 290,500 (813,900) (523,400) 34,919,300 -1.5% 63.3%Roane 24,116,500 37,779,600 338,900 (557,000) (218,100) 23,898,400 -0.9% 63.3%Southwest 29,938,100 45,287,900 (622,400) (667,700) (1,290,100) 28,648,000 -4.3% 63.3%Volunteer 27,806,100 44,524,400 1,015,300 (656,500) 358,800 28,164,900 1.3% 63.3%Walters 25,474,600 39,145,300 (135,200) (577,200) (712,400) 24,762,200 -2.8% 63.3%
Community College Subtotal $296,092,700 $463,182,600 $3,733,500 ($6,829,300) ($3,095,800) $292,996,900 -1.0% 63.3%
UT UniversitiesUT Chattanooga $59,510,200 $91,369,200 ($365,300) ($1,347,200) ($1,712,500) $57,797,700 -2.9% 63.3%UT Knoxville2 244,566,300 377,009,200 (521,600) (5,558,800) (6,080,400) 238,485,900 -2.5% 63.3%UT Martin2 34,025,400 51,570,500 (642,900) (760,400) (1,403,300) 32,622,100 -4.1% 63.3%
Subtotal $338,101,900 $519,948,900 ($1,529,800) ($7,666,400) ($9,196,200) $328,905,700 -2.7% 63.3%
Total Colleges and Universities $1,084,859,500 $1,677,100,500 $757,000 ($24,728,000) ($23,971,000) $1,060,888,500 -2.2% 63.3%
TN Colleges of Applied Technology2 $75,196,700 $114,997,200 ($757,000) ($1,695,600) ($2,452,600) $72,744,100 -3.3% 63.3%
Total Academic Formula Units $1,160,056,200 $1,792,097,700 $0 ($26,423,600) ($26,423,600) $1,133,632,600 -2.3% 63.3%
3 - THEC's community college recommendation is for the sector as a whole. Institutional detail displayed here is for informational purposes only.
ATTACHMENT IV2021-22 State Appropriations Distribution with 2.0% Reduction
Breakdown of 2021-22 Changes
2 - Does not include recurring funds appropriated to the ETSU Gray Fossil Site ($350K), ETSU Rural Public Health Project ($750K), TTU College of Engineering ($3M), UT Knoxville College of Engineering ($3M), UT Martin Parsons Center ($200K), UT Martin Selmer Center ($190K), UT Martin Somerville Center ($250K) and the TCATs Correctional Education Investment Initiative ($426K). These appropriations are included as Program Initiatives.
Note: Finance and Administration sets a reduction amount each year. THEC divides this reduction amount between the formula and specialized units based on the percent of total E&G revenue reported in the most recent proposed operating budgets. Specialized units with no ability to generate additional revenue from tuition are reduced at a lower rate.
1 - Recurring funding. Includes historical funding of $7.4M for legislative initiatives. A breakdown of these initiatives by campus is included in Appendix A.
10

A B C = B - A D = C / A
2020-21 2021-22 Total PercentSpecialized Units Appropriation2 Recommendation2 Change ChangeMedical EducationETSU College of Medicine $36,717,300 $36,251,800 ($465,500) -1.3%ETSU Family Practice 7,835,800 7,757,300 (78,500) -1.0%UT College of Vet Medicine 22,280,200 21,929,700 (350,500) -1.6%UT Health Science Center 162,748,000 160,304,400 (2,443,600) -1.5%
Subtotal $229,581,300 $226,243,200 ($3,338,100) -1.5%
Research and Public ServiceUT Agricultural Experiment Station $31,160,800 $30,848,700 ($312,100) -1.0%UT Agricultural Extension Service 38,428,800 38,043,900 (384,900) -1.0%TSU McMinnville Center 1,429,900 1,415,600 (14,300) -1.0%TSU Institute of Ag. and Environmental Research 4,771,600 4,723,800 (47,800) -1.0%TSU Cooperative Extension 3,705,200 3,668,100 (37,100) -1.0%TSU McIntire-Stennis Forestry Research 198,900 196,900 (2,000) -1.0%UT Space Institute 9,301,200 9,198,000 (103,200) -1.1%UT Institute for Public Service 6,837,800 6,769,300 (68,500) -1.0%UT County Technical Assistance Service 3,221,000 3,188,700 (32,300) -1.0%UT Municipal Technical Advisory Service 3,731,200 3,693,800 (37,400) -1.0%
Subtotal $102,786,400 $101,746,800 ($1,039,600) -1.0%
Other Specialized UnitsUT University-Wide Administration $6,064,200 $6,003,500 ($60,700) -1.0%TN Board of Regents Administration 12,775,800 12,647,800 (128,000) -1.0%TN Student Assistance Corporation 116,195,200 116,173,600 (21,600) 0.0%Contract Education 2,249,900 2,227,400 (22,500) -1.0%TN Higher Education Commission 5,588,500 5,532,500 (56,000) -1.0%
Subtotal $142,873,600 $142,584,800 ($288,800) -0.2%
Total Specialized Units $475,241,300 $470,574,800 ($4,666,500) -1.0%
Program InitiativesCampus Centers of Excellence $18,379,300 $18,195,200 ($184,100) -1.0%Campus Centers of Emphasis 1,340,000 1,326,600 (13,400) -1.0%Academic Scholars Program 1,211,800 1,211,800 - 0.0%UT Access and Diversity Initiative 5,806,700 5,748,500 (58,200) -1.0%TBR Access and Diversity Initiative 10,256,900 10,154,200 (102,700) -1.0%THEC Grants 11,089,000 10,977,900 (111,100) -1.0%Research Initiatives - UT 5,852,900 5,794,300 (58,600) -1.0%ETSU Rural Public Health Project3 750,000 750,000 - 0.0%ETSU Gray Fossil Site3 350,000 350,000 - 0.0%TTU College of Engineering3 3,000,000 3,000,000 - 0.0%UT Knoxville College of Engineering3 3,000,000 3,000,000 - 0.0%UT Martin Parsons, Somerville & Selmer Centers3 640,000 640,000 - 0.0%TCAT Correctional Education Investment Initiative3 426,000 426,000 - 0.0%
Subtotal $234,205,100 $61,574,500 ($528,100) -0.2%
Total $1,869,502,600 $1,665,781,900 ($31,618,200) -1.7%
2 - Recurring funds.
3 - Recurring funds appropriated to ETSU ($1.1M), TTU ($3M), UT Knoxville ($3M), UT Martin ($640K), and TCATs ($426K).
ATTACHMENT IV2021-22 State Appropriations Distribution with 2.0% Reduction1
1 - Finance and Administration identified TSAA Awards, Loan/Scholarship Program, Academic Scholars Program, Recurring Capital Maintenance, and Allotment Reserves as exempt from the 2.0% reduction scenario for 2021-22.
11

A B C D E F
Outcomes Share of Total $36,000,000 0.0% $59,000,000 FlatFormula Formula THEC Flat Funding Increase Tuition
Academic Formula Units Calculation Calculation Recommendation Scenario Scenario1 Scenario2
LGI UniversitiesAustin Peay $83,521,800 4.98% $55,742,900 $54,065,100 $56,814,800 $59,098,500East Tennessee 109,774,200 6.55% 73,264,000 71,058,800 74,672,800 77,674,300 Middle Tennessee 161,044,200 9.60% 107,481,800 104,246,700 109,548,600 113,952,000 Tennessee State 61,057,400 3.64% 40,750,000 39,523,500 41,533,700 43,203,100 Tennessee Tech 88,052,200 5.25% 58,766,500 56,997,700 59,896,600 62,304,100 University of Memphis 190,519,200 11.36% 127,153,600 123,326,400 129,598,700 134,808,000
LGI Subtotal $693,969,000 41.38% $463,158,800 $449,218,200 $472,065,200 $491,040,000
Community CollegesChattanooga $50,969,200 3.04% $34,017,200 $32,993,300 $34,671,300 $36,064,900Cleveland 18,747,000 1.12% 12,511,900 12,135,300 12,752,500 13,265,100 Columbia 28,293,400 1.69% 18,883,200 18,314,800 19,246,300 20,019,900 Dyersburg 16,729,900 1.00% 11,165,700 10,829,600 11,380,400 11,837,800 Jackson 23,477,000 1.40% 15,668,700 15,197,100 15,970,000 16,611,900 Motlow 32,847,700 1.96% 21,922,500 21,262,800 22,344,200 23,242,200 Nashville 34,225,000 2.04% 22,841,900 22,154,400 23,281,200 24,217,000 Northeast 35,954,300 2.14% 23,996,100 23,273,800 24,457,500 25,440,600 Pellissippi 55,201,900 3.29% 36,842,100 35,733,200 37,550,600 39,059,900 Roane 37,779,600 2.25% 25,214,300 24,455,400 25,699,200 26,732,200 Southwest 45,287,900 2.70% 30,225,500 29,315,700 30,806,700 32,045,000 Volunteer 44,524,400 2.65% 29,715,800 28,821,400 30,287,200 31,504,600 Walters 39,145,300 2.33% 26,125,800 25,339,400 26,628,200 27,698,500
Community College Subtotal $463,182,600 27.62% $309,130,700 $299,826,200 $315,075,300 $327,739,600
UT UniversitiesUT Chattanooga $91,369,200 5.45% $60,980,300 $59,144,900 $62,153,000 $64,651,200UT Knoxville 377,009,200 22.48% 251,618,100 244,044,700 256,456,700 266,765,000 UT Martin 51,570,500 3.07% 34,418,500 33,382,500 35,080,300 36,490,400
UT Subtotal $519,948,900 31.00% $347,016,900 $336,572,100 $353,690,000 $367,906,600
Total Colleges and Universities $1,677,100,500 100.00% $1,119,306,400 $1,085,616,500 $1,140,830,500 $1,186,686,200
TN Colleges of Applied Technology $114,997,200 NA $76,749,800 $74,439,700 $78,225,700 $81,370,000
Total Academic Formula Units $1,792,097,700 100.00% $1,196,056,200 $1,160,056,200 $1,219,056,200 $1,268,056,200
2 - Based on a request of $36M for outcomes productivity, $23M for partial funding of an estimated 2 percent salary increase, and $49M to buy down tuition increases to 0.0% at all institutions, resulting in a total appropriation recommendation of $108M.
Alternative Funding Scenarios
1- Based on a request of $36M for outcomes productivity and $23M for partial funding of an estimated 2 percent salary increase, resulting in a total appropriation recommendation of $59M.
ATTACHMENT V2021-22 State Appropriations Funding Scenarios
12

Total Outcomes2020-21 Formula
2021-22 Formula
Students Accumulating 12 hrs 23,605 23,483 (122) -0.5%Students Accumulating 24 hrs 18,281 18,490 209 1.1%Students Accumulating 36 hrs 15,458 15,792 334 2.2%
Dual Enrollment 19,161 19,919 758 4.0%Associates1 11,243 11,785 543 4.8%
Certificates 1-2 Year 827 932 105 12.7%Certificates <1 Year 2,726 2,646 (80) -2.9%
Job Placements 3,823 3,952 129 3.4%Student Transfer 6,543 6,603 60 0.9%
Workforce Training (Contact Hours) 767,974 855,373 87,399 11.4%Awards per 100 FTE 23.53 24.68 1.15 4.9%
Adult Focus PopulationStudents Accumulating 12 hrs 4,001 4,203 202 5.0%Students Accumulating 24 hrs 3,804 4,249 446 11.7%Students Accumulating 36 hrs 3,718 4,140 422 11.4%
Associates1 4,259 4,390 131 3.1%Certificates 1-2 Year 448 499 51 11.4%Certificates <1 Year 1,495 1,445 (51) -3.4%
Low-Income Focus PopulationStudents Accumulating 12 hrs 13,902 13,834 (69) -0.5%Students Accumulating 24 hrs 11,366 11,519 154 1.4%Students Accumulating 36 hrs 9,861 10,105 244 2.5%
Associates1 7,393 7,683 290 3.9%Certificates 1-2 Year 545 610 65 11.9%Certificates <1 Year 1,552 1,529 (23) -1.5%
Academically Underprepared Focus PopulationStudents Accumulating 12 hrs 14,348 14,021 (327) -2.3%Students Accumulating 24 hrs 11,614 11,528 (86) -0.7%Students Accumulating 36 hrs 9,820 9,915 94 1.0%
Associates1 6,743 6,927 184 2.7%Certificates 1-2 Year 486 544 58 11.9%Certificates <1 Year 1,373 1,322 (52) -3.8%
One Focus Population OnlyStudents Accumulating 12 hrs 8,154 7,974 (181) -2.2%Students Accumulating 24 hrs 6,151 6,053 (97) -1.6%Students Accumulating 36 hrs 5,207 5,108 (99) -1.9%
Associates1 3,584 3,796 212 5.9%Certificates 1-2 Year 236 274 38 16.1%Certificates <1 Year 987 935 (52) -5.3%
Two Focus Populations OnlyStudents Accumulating 12 hrs 8,766 8,627 (139) -1.6%Students Accumulating 24 hrs 6,923 6,852 (71) -1.0%Students Accumulating 36 hrs 5,775 5,812 37 0.6%
Associates1 3,967 4,166 198 5.0%Certificates 1-2 Year 334 376 41 12.4%Certificates <1 Year 974 945 (29) -3.0%
All Three Focus PopulationsStudents Accumulating 12 hrs 2,189 2,277 88 4.0%Students Accumulating 24 hrs 2,262 2,513 251 11.1%Students Accumulating 36 hrs 2,214 2,476 262 11.8%
Associates1 2,292 2,291 (1) -0.1%Certificates 1-2 Year 191 209 18 9.2%Certificates <1 Year 495 490 (5) -1.0%
1 - Includes raw counts for reverse transfer associate degrees. In the funding formula, these degrees count as 0.5 each for the community college and the partner university.
Change
Community Colleges
ATTACHMENT VIThree-Year Average Change in Formula Outcomes
13

Total Outcomes2020-21 Formula
2021-22 Formula
Students Accumulating 30 hrs 17,944 18,154 210 1.2%Students Accumulating 60 hrs 18,581 18,683 102 0.5%Students Accumulating 90 hrs 21,065 21,134 69 0.3%
Bachelors and Associates1 23,443 23,780 337 1.4%Masters / Ed Specialists 5,611 5,636 25 0.4%
Doctoral / Law Degree 1,207 1,240 33 2.8%Research, Service, and Sponsored Programs $351,155,418 $360,940,909 $9,785,491 2.8%
Degrees per 100 FTE 23.24 23.75 0.51 2.2%Six-Year Graduation Rate 56.3% 58.3% 2.0 3.6%
Adult Focus PopulationStudents Accumulating 30 hrs 685 612 (73) -10.7%Students Accumulating 60 hrs 1,438 1,294 (144) -10.0%Students Accumulating 90 hrs 3,030 2,843 (187) -6.2%
Bachelors and Associates1 6,839 6,569 (270) -3.9%Low-Income Focus Population
Students Accumulating 30 hrs 7,672 7,637 (35) -0.5%Students Accumulating 60 hrs 8,350 8,224 (126) -1.5%Students Accumulating 90 hrs 10,359 10,079 (281) -2.7%
Bachelors and Associates1 12,052 11,937 (115) -1.0%One Focus Population Only
Students Accumulating 30 hrs 7,437 7,440 3 0.0%Students Accumulating 60 hrs 7,728 7,685 (44) -0.6%Students Accumulating 90 hrs 8,896 8,734 (162) -1.8%
Bachelors and Associates1 9,283 9,368 85 0.9%Two Focus Populations Only
Students Accumulating 30 hrs 460 405 (55) -12.0%Students Accumulating 60 hrs 1,030 917 (113) -11.0%Students Accumulating 90 hrs 2,247 2,094 (153) -6.8%
Bachelors and Associates1 4,804 4,569 (235) -4.9%1 - Includes raw counts for reverse transfer associate degrees. In the funding formula, these degrees count as 0.5 each for the community college and the university.
ATTACHMENT VIThree-Year Average Change in Formula Outcomes
Universities
Change
14

State Appropriation Tuition Out-of-State Total Total Formula Difference PercentAcademic Formula Units Recommendation1 Revenue2 Tuition Revenue2 Revenue Revenue Need (Short) FundedLGI UniversitiesAustin Peay $55,742,900 $71,751,800 $2,645,500 $130,140,200 $154,482,300 ($24,342,100) 84.2%East Tennessee3 73,264,000 105,112,700 19,718,000 198,094,700 215,370,000 (17,275,300) 92.0%Middle Tennessee 107,481,800 153,792,900 20,968,300 282,243,000 298,972,900 (16,729,900) 94.4%Tennessee State 40,750,000 40,596,100 20,111,800 101,457,900 124,334,900 (22,877,000) 81.6%Tennessee Tech3 58,766,500 77,298,100 3,173,900 139,238,500 165,256,400 (26,017,900) 84.3%University of Memphis 127,153,600 166,922,800 10,727,700 304,804,100 364,322,100 (59,518,000) 83.7%
LGI Subtotal $463,158,800 $615,474,400 $77,345,200 $1,155,978,400 $1,322,738,600 ($166,760,200) 87.4%
Community Colleges4
Chattanooga $34,017,200 $27,399,800 $852,600 $62,269,600 $77,756,600 ($15,487,000) 80.1%Cleveland 12,511,900 11,085,900 472,100 24,069,900 28,168,800 (4,098,900) 85.4%Columbia 18,883,200 20,191,200 482,900 39,557,300 42,602,100 (3,044,800) 92.9%Dyersburg 11,165,700 8,669,100 174,300 20,009,100 25,148,900 (5,139,800) 79.6%Jackson 15,668,700 15,605,100 208,400 31,482,200 35,273,000 (3,790,800) 89.3%Motlow 21,922,500 23,472,600 376,700 45,771,800 49,469,100 (3,697,300) 92.5%Nashville 22,841,900 22,734,000 659,300 46,235,200 51,689,800 (5,454,600) 89.4%Northeast 23,996,100 19,107,800 88,900 43,192,800 53,875,200 (10,682,400) 80.2%Pellissippi 36,842,100 34,871,300 1,913,000 73,626,400 83,371,300 (9,744,900) 88.3%Roane 25,214,300 18,535,100 279,300 44,028,700 56,918,100 (12,889,400) 77.4%Southwest 30,225,500 24,240,800 2,721,100 57,187,400 68,093,500 (10,906,100) 84.0%Volunteer 29,715,800 29,905,400 548,900 60,170,100 67,261,600 (7,091,500) 89.5%Walters 26,125,800 21,837,200 810,000 48,773,000 58,836,100 (10,063,100) 82.9%
Community College Subtotal $309,130,700 $277,655,300 $9,587,500 $596,373,500 $698,464,100 ($102,090,600) 85.4%
UT UniversitiesUT Chattanooga $60,980,300 $86,977,500 $7,244,200 $155,202,000 $170,578,600 ($15,376,600) 91.0%UT Knoxville3 251,618,100 313,478,400 52,358,400 617,454,900 710,723,300 (93,268,400) 86.9%UT Martin3 34,418,500 52,757,600 2,745,500 89,921,600 96,459,800 (6,538,200) 93.2%
UT Subtotal $347,016,900 $453,213,500 $62,348,100 $862,578,500 $977,761,700 ($115,183,200) 88.2%
TN Colleges of Applied Technology3 $76,749,800 $37,893,800 $0 $114,643,600 $143,333,000 ($28,689,400) 80.0%
Total Academic Formula Units $1,196,056,200 $1,384,237,000 $149,280,800 $2,729,574,000 $3,142,297,400 ($412,723,400) 86.9%
4 - THEC's community college recommendation is for the sector as a whole. Institutional detail displayed here is for informational purposes only.
3 - Does not include recurring funds appropriated to the ETSU Gray Fossil Site ($350K), ETSU Rural Public Health Project ($750K), TTU College of Engineering ($3M), UT Knoxville College of Engineering ($3M), UT Martin Parsons Center ($200K), UT Martin Selmer Center ($190K) , UT Martin Somerville Center ($250K) and the TCATs Correctional Education Investment Initiative ($426K).
ATTACHMENT VII2021-22 Total Formula Revenue Analysis
1 - Recurring; accounts for recommended $36M in additional funding for formula units.2 - Assumes no salary increases, tuition increases of 1.5%, and annual enrollment increases of 0% at universities, 5.0% at community colleges and 2.5% at colleges of applied technology.
15

Initiative FundingLocally Governed InstitutionsMiddle Tennessee Small Business Development Center 270,800$
Center for Dyslexic Studies 218,700
Tennessee State Cooperative Agriculture 50,000$ Center on Aging 37,000 Upward Bound 31,800 Intracampus Transportation 75,500 Academically-Talented Student Scholarships 832,000
Tennessee Tech Horticultural Research 92,300$ Joe L. Evins Center 608,600 Carnegie Classification Change 2,100,000
University of Memphis Seismic Safety Commission 65,000$
Subtotal 4,381,700$
Community CollegesColumbia Collegiate Center 72,700$
Roane Oak Ridge Campus Operations 150,000$
System-wide Administrative Support Services 2,060,300$
Subtotal 2,283,000$
UT UniversitiesUT Martin Ripley Center 310,000$
Subtotal 310,000$
TN Colleges of Applied Tech Administrative Support Services 384,500$
Total Funding 7,359,200$
Appendix ALegislative Initiatives Included in Funding Formula
This appendix presents legislative initiatives that are distributed through the funding formula. Projects identified for distribution outside the funding formula or those appropriated to specialized units are excluded.
16

DATE: November 6, 2020
SUBJECT: 2021-22 Student Fee Recommendations
ACTION RECOMMENDED: Approval
BACKGROUND INFORMATION
The Complete College Tennessee Act requires the Tennessee Higher Education Commission (THEC) to make student fee and state appropriation recommendations concurrently. Numerous factors impact the tuition recommendation, including affordability and financial aid, institutional revenues, and cost inflation factors. The FOCUS Act expanded THEC’s authority on student fee levels, requiring that THEC issue binding tuition ranges each year. These ranges apply to resident, undergraduate students’ tuition (maintenance fee) rate, as well as the combined tuition and mandatory fee charge, and are set following the General Assembly’s approval of a budget in the spring. The ranges recommended for approval today are intended for guidance.
TENNESSEE’S TUITION AND FEE PROFILE
Average full-time, annual tuition and mandatory fees for 2020-21 is $9,751 at public universities, $4,553 at community colleges, and $3,936 at the Tennessee Colleges of Applied Technology (TCATs). Tennessee’s public higher education tuition and fee levels are considered average compared to peers across member states of the Southern Regional Education Board. Tennessee institutions implemented the lowest consecutive growth in decades in the five years leading up to 2020-21 as state appropriations increased, on average, seven percent per year. Institutions maintained their commitment to an affordable college education in 2020-21 as all institutions held tuition and fees flat for Tennesseans despite no growth in state appropriations.
RECOMMENDATION
Staff recommendations for operating appropriations, student fees, and need-based financial aid work in concert to promote continuous improvement in affordability. On average, tuition and fees revenue accounts for roughly 60 percent of revenue at the universities, 50 percent at the community colleges and 33 percent at the TCATs. The
Agenda Item: III. T E N N E S S E E
H I G H E R
E D U C A T I O N
C O M M I S S I O N

combined tuition and appropriation revenue for all formula units is approximately $3.0 billion, with state appropriations comprising $1.2 billion. An appropriation request for formula units of $36 million represents about a three percent growth in appropriation revenue but just a one percent increase in total revenue. Institutions receiving state appropriation increases below three percent may need to rely on modest tuition increases to keep up with the outside forces such as inflation, while institutions receiving more than three percent may need little to no tuition increases.
Considering an appropriations request for formula units of $36 million and an estimated two percent salary increase, THEC staff recommend a guiding tuition (maintenance fee) range of zero to three percent, as well as a guiding tuition and mandatory fee range of zero to three percent for all public universities, community colleges, and TCATs.
Scenarios for tuition increases in 2021-22 of zero, one-and-a-half, and three percent are presented and summarized in Attachment I. Attachment II provides a history of tuition and mandatory fee increases across all public institutions as well as the results of the tuition model based on different funding scenarios.
At this time, staff recommend the Commission adopt the tuition and tuition and mandatory fee ranges as guidance only, with flexibility to approve final, binding ranges later in the fiscal year once clarity around the state budget and overall impact on higher education funding is determined.
At the November 6 Commission meeting, the original recommended tuition and tuition and fee range was revised from zero to three percent to zero to two percent. The below documents represent these revised recommendations.

UniversitiesCCsTCATs
2020-21
Increase Change Increase ChangeAPSU $7,044 $7,044 $7,114 $70 $7,185 $141ETSU 7,572 7,572 7,648 76 7,723 151 MTSU 7,554 7,554 7,630 76 7,705 151 TSU 7,026 7,026 7,096 70 7,167 141 TTU (Prior to Fall 2020)2 8,040 8,040 8,120 80 8,201 161 TTU (Fall 2020)2 9,060 9,060 9,151 91 9,241 181 UM (Non-Guaranteed)3 8,208 8,208 8,290 82 8,372 164 UM (Guaranteed)3 8,232 8,232 8,314 82 8,397 165 UTC (Soar in Four)4 7,836 7,836 7,914 78 7,993 157 UTC (Returning)4 7,060 7,060 7,131 71 7,201 141 UTK 11,332 11,332 11,445 113 11,559 227 UTM 8,214 8,214 8,296 82 8,378 164 CC Avg 4,242 4,242 4,284 42 4,327 85 TCATs 3,687 3,687 3,724 37 3,761 74
TuitionTuition Increase
3 - Beginning in 2019-20, the University of Memphis began to offer a "guaranteed tuition" option to undergraduate students. All incoming first-time, full-time freshmen will be eligible to enroll in the guaranteed tuition plan, which guarantees the Fall 2019 tuition rate for eight consecutive regular semesters if they take at least 12 credit hours per semester.
4 - Beginning in 2019-20, first-time, full-time students enrolled at UT Chattanooga pay a flat rate for 15 credit hours per semester, regardless of how many hours taken. Returning and part-time students are charged a flat rate for 12 credit hours per semester, regardless of how many hours are taken.
Note: "Tuition" is used here for ease of understanding, though UT, TBR, and the LGIs use the term "Maintenance Fee" when discussing tuition.
2 - Full-time students admitted in Fall 2020 at Tennessee Technological University will pay a flat rate for 15 credit hours per semester, regardless of the number of hours take. Full-time students admitted prior to Fall 2020 and part-time students will be charged a per credit hour rate for the first 12 credit hours and a discounted rate for additional hours.
1 - At the November 6 Commission meeting, the original recommended tuition and tuition and fees range was revised from 0 to 3 percent to 0 to 2 percent. This represents the Commission's final action.
ATTACHMENT I2021-22 Tuition and Fee Recommendation1
= 1.0% = 2.0%= 0.0%
Tuition Levels
0% to 2.0% Tuition Increase0% to 2.0% Tuition Increase0% to 2.0% Tuition Increase
2021-22 Scenarios

Increase Change Increase ChangeAPSU $1,583 $7,044 $8,627 $8,627 $8,713 $86 $8,800 $173ETSU 1,919 7,572 9,491 9,491 9,586 95 9,681 190 MTSU 1,870 7,554 9,424 9,424 9,518 94 9,612 188 TSU 1,157 7,026 8,183 8,183 8,265 82 8,347 164 TTU (Prior to Fall 2020)2 1,278 8,040 9,318 9,318 9,411 93 9,504 186 TTU (Fall 2020)2 1,278 9,060 10,338 10,338 10,441 103 10,545 207 UM (Non-Guaranteed)3 1,704 8,208 9,912 9,912 10,011 99 10,110 198 UM (Guaranteed)3 1,704 8,232 9,936 9,936 10,035 99 10,135 199 UTC (Soar in Four)4 1,820 7,836 9,656 9,656 9,753 97 9,849 193 UTC (Returning)4 1,820 7,060 8,880 8,880 8,969 89 9,058 178 UTK 1,932 11,332 13,264 13,264 13,397 133 13,529 265 UTM 1,534 8,214 9,748 9,748 9,845 97 9,943 195 CC Avg 311 4,242 4,553 4,553 4,598 46 4,644 91 TCATs 249 3,687 3,936 3,936 3,975 39 4,015 79
2020-21Tuition and Fee Increase
ATTACHMENT I2021-22 Tuition and Fee Recommendation1
UniversitiesCCsTCATs
2021-22 Scenarios
0% to 2.0% Tuition and Fee Increase0% to 2.0% Tuition and Fee Increase0% to 2.0% Tuition and Fee Increase
Tuition and Fee Levels
2 - Beginning in 2019-20, the University of Memphis began to offer a "guaranteed tuition" option to undergraduate students. All incoming first-time, full-time freshmen will be eligible to enroll in the guaranteed tuition plan, which guarantees the Fall 2019 tuition rate for eight consecutive regular semesters if they take at least 12 credit hours per semester.3 - Beginning in 2019-20, first-time, full-time students enrolled at UT Chattanooga pay a flat rate for 15 credit hours per semester, regardless of how many hours taken. Returning and part-time students are charged a flat rate for 12 credit hours per semester, regardless of how many hours are taken.
Note: "Tuition" is used here for ease of understanding, though UT, TBR, and the LGIs use the term "Maintenance Fee" when discussing tuition.
Mandatory Fees
Tuition Total= 0.0%
= 1.0% = 2.0%
1 - Full-time students admitted in Fall 2020 at Tennessee Technological University will pay a flat rate for 15 credit hours per semester, regardless of the number of hours take. Full-time students admitted prior to Fall 2020 and part-time students will be charged a per credit hour rate for the first 12 credit hours and a discounted rate for additional hours.
1 - At the November 6 Commission meeting, the original recommended tuition and tuition and fees range was revised from 0 to 3 percent to 0 to 2 percent. This represents the Commission's final action.

Model Assumptions University CCs TCATsCosts Inflation 1.4% 1.4% 1.4%
Enrollment 1.0% 5.0% 2.5%State Appropriations 4.7% 6.4% 4.0%
Average Tuition Model Range
Model Assumptions Universities CCs TCATsCosts Inflation 1.4% 1.4% 1.4%
Enrollment 1.0% 5.0% 2.5%State Appropriations -0.4% 1.3% -1.0%
Average Tuition Model Range
Note: The recommendation is based on an assumed costs inflation rate of 1.4% as determined by the Consumer Price Index.
Average Increase With Overall Flat Appropriations
ATTACHMENT II2021-22 Tuition Model Analysis Scenarios
The following scenarios utilize the THEC Tuition Model to estimate the tuition range required to maintain the 2020-21 estimated total revenue per FTE. The scenarios assume a 1.0% enrollment growth at universities, a 5.0% enrollment growth at community colleges, a 2.5% enrollment growth at colleges of applied technology, a 1.4% increase in inflation costs, and an estimated 2.0% salary increase at all institutions. This analysis is presented for information and is meant to provide guidance on the tuition recommendation. Binding tuition recommendations will be made in Spring 2021 in conjunction with the General Appropriations Act.
Average Increase With a $59.0M (5.1%) Increase in State Appropriations1
-4.1% to 3.1%
-0.8% to 12.1%
1- Based on a request of $36M for outcomes productivity and $23M for partial funding of an estimated 2 percent increase in salary, resulting in a total appropriation recommendation of $59M.

Agenda Item: IV.
DATE: November 6, 2020
SUBJECT: FY2021-22 Capital Project Recommendations
ACTION RECOMMENDED: Approval
BACKGROUND INFORMATION Capital projects are broadly categorized according to project scope and funding source. State appropriations fund capital outlay projects, which consist of new construction or major renovation of existing facilities, as well as capital maintenance projects, which repair and replace systems and structures on existing facilities. The third type of capital project, referred to as a disclosed project, is distinguished by its funding source, which does not include state funding. These projects typically relate to various auxiliary functions, such as residence halls, parking, and athletics. Since the project is funded without state appropriations, an institution signals its intent to initiate the project and seek approval from the State Building Commission. This declaration of intent is disclosed to the Governor and General Assembly.
RECOMMENDATION SUMMARY
Capital Outlay The capital outlay recommendation for 2021-22 state appropriation totals $480.3 million. As detailed in Attachment I, this request includes three projects for the Tennessee Board of Regents (TBR), totaling $ $87.6 million (18% percent of the total appropriation); six projects for the Locally Governed Institutions (LGIs), totaling $$307.1 million (64% of total), and three projects for University of Tennessee (UT), totaling $85.5 million (18% of total).
Institutions are encouraged to submit related renovations and demolitions as part of the project scope to improve space efficiencies and reduce maintenance costs. In addition, THEC actively encourages institutions to reduce the magnitude of project costs through a reduction in overall scope. This year, 12 outlay projects are an average cost of $40 million per project. A total of 863,000 gross s.f. of new construction, 180,000 s.f. of renovation, and 205,000 s.f. of demolitions are proposed.
These projects were identified and prioritized by Commission staff using the selection criteria endorsed by the Commission at the May 2017 quarterly
T E N N E S S E E
H I G H E R
E D U C A T I O N
C O M M I S S I O N

meeting. Due to the extraordinary circumstances of the budget appropriations process this past spring, 2020, the two projects recommended in the Governor’s budget that were not funded in FY20-21, remain at the top of the list of recommended projects for FY21-22 as priority #1 and #2. These projects are 1) TTU’s Engineering Building ($49,171,600 state request), and 2) APSU’s Health Professions Building ($66,067,500 state request). Ten additional outlay projects ($365 million of state appropriations) were submitted to THEC for review. These projects were reviewed and ranked in priority order from priority #3 through #12, and all are recommended for consideration. The capital outlay process is focused on the Drive to 55 and ensures that projects are consistent with state and institutional goals. Projects were evaluated on their relationship to state goals and degree production, congruence with an approved Master Plan, space guidelines and facility assessments, program and business plan, and match requirements.
Capital Maintenance The 2021-22 recommendation for capital maintenance is $147.3 million for 69 projects. As shown in Attachment IV, this includes 26 projects for TBR, totaling $29.8 million (20.25 percent of the total); 31 projects for the LGIs, totaling $57.57 million (39.08 percent of total); and 12 projects for the UT system, totaling $59.9 million (40.67 percent of total). This request will allow each system to limit increases in deferred maintenance.
Additionally, the 2021-22 recommendation includes $5 million as a special initiative appropriation for TSU’s Electrical Upgrades project. The TSU Electrical master plan for campus-wide electrical infrastructure improvements is complete. The initial construction funding of $5 million for this project was approved FY20-21, and the project is in progress. This Phase 3 funding request assures the continuity of the project.
Tennessee has consistently provided funding for maintenance projects across higher education. Over the last five fiscal years, capital maintenance funding has averaged nearly $90 million per year.
Disclosure of Revenue-Funded Projects Disclosed projects are funded through institutional funds, the Tennessee State School Bond Authority (TSSBA), auxiliary funds, or sources other than state appropriations. For 2021-22, TBR, the LGIs, and UT are disclosing 18 revenue- and TSSBA-funded projects totaling $276.75million. As detailed in Attachment V, the disclosure list includes 10 revenue-funded projects for the LGIs, totaling $253.8 million; and 8 projects for the UT system, totaling $22.95 million.

THEC Total Previous Years 2021-22 Match Total State AppropriationPriority Project Cost Funding Project Cost Percentage Match Funds1 Request2
1 TTU TTU $ 56,980,000 $ 3,250,000 $ 53,730,000 8% $ 4,558,400 $ 49,171,600 2 APSU APSU 70,175,000 - 70,175,000 6% 4,107,500 66,067,5003 MTSU MTSU 54,900,000 - 54,900,000 8% 4,392,000 50,508,0004 TBR Columbia State 28,630,000 700,000 27,930,000 3% 950,000 26,980,0005 ETSU ETSU 51,794,000 - 51,794,000 6% 3,303,273 48,490,7276 TBR Nashville State 19,000,000 - 19,000,000 4% 760,000 18,240,0007 UT UTK 65,000,000 - 65,000,000 13% 8,190,000 56,810,0008 UT UTM 18,600,000 - 18,600,000 6% 1,156,000 17,444,0009 UT UTHSC 11,500,000 - 11,500,000 2% 230,000 11,270,000
10 TSU TSU 50,000,000 - 50,000,000 6% 3,000,000 47,000,00011 UoM UoM 51,000,000 - 51,000,000 10% 5,100,000 45,900,00012 TBR TCAT Shelbyville
Engineering BuildingHealth Professions BuildingApplied Engineering BuildingWilliamson County Arts and Technology Building Academic BuildingClarksville Lab and Classroom Building Nursing Bldg Renovation & Addition Innovation and Product Realization Facility Nash Buildout 2 FloorsEngineering Classroom Building Academic Classroom BuildingBedford County Higher Education Center 42,400,000 - 42,400,000 0% 0 42,400,000
90,030,000$ 700,000$ 89,330,000$ 2% 1,710,000$ 87,620,000$ 334,849,000$ 3,250,000$ 331,599,000$ 7% 24,461,173$ 307,137,827$
95,100,000$ -$ 95,100,000$ 10% 9,576,000$ 85,524,000$
Total State FundsTotal Projects Request
29,830,000$ 26 29,830,000$ 57,571,000$ 31 57,571,000$ 59,910,000$ 12 59,910,000$
5,000,000$ 1 5,000,000$
Total Total State AppropriationTotal Projects Match Funds1 Request2
519,979,000$ 12 35,747,173$ 480,281,827$ 152,311,000$ 70 NA 152,311,000$ 672,290,000$ 82 35,747,173$ 632,592,827$
TotalTotal Capital Outlay RequestTotal Capital Maintenance RequestTotal Capital Investment
2 - Reflects total state appropriation request after all other funding sources — including previous years funding, total match funds and other institutional funds — are taken into account.
1 - Match is applicable to the entire scope of each capital outlay project.
Capital Projects Recommendation
Special Initiative
ATTACHMENT ITHEC 2021-22 Capital Projects Recommendation Summary
UT Total
Capital Outlay
TBR Total
UT Total
Capital MaintenanceTBR Total
LGI Total
LGI Total
3

A B C = A - B D E = D / C F = C - D
THEC Campus/System Total Previous Years 2021-22 Total Match State Appropriation
Priority Priority Institution Project Name Project Cost Funding Project Cost Match Funds1Percentage Request2
1 1 TTU Engineering Building 56,980,000$ 3,250,000$ 53,730,000$ 4,558,400$ 8% 49,171,600$
2 1 APSU Health Professions Building 70,175,000$ 70,175,000$ 4,107,500$ 6% 66,067,500$
3 1 MTSU Applied Engineering Building 54,900,000$ 54,900,000$ 4,392,000$ 8% 50,508,000$
4 1 Columbia StateWilliamson County Arts and Technology
Building28,630,000$ 700,000$ 27,930,000$ 950,000$ 3% 26,980,000$
5 1 ETSU Academic Building 51,794,000$ 51,794,000$ 3,303,273$ 6% 48,490,727$
6 2 Nashville State Clarksville Lab and Classroom Building 19,000,000$ 19,000,000$ 760,000$ 4% 18,240,000$
7 1 UTK Nursing Bldg Renovation & Addition 65,000,000$ 65,000,000$ 8,190,000$ 13% 56,810,000$
8 2 UTMInnovation and Product Realization
Facility18,600,000$ 18,600,000$ 1,156,000$ 6% 17,444,000$
9 3 UTHSC Nash Buildout 2 Floors 11,500,000$ 11,500,000$ 230,000$ 2% 11,270,000$
10 1 TSU Engineering Classroom Building 50,000,000$ 50,000,000$ 3,000,000$ 6% 47,000,000$
11 1 UoM Academic Classroom Building 51,000,000$ 51,000,000$ 5,100,000$ 10% 45,900,000$
12 3 TCAT Shelbyville Bedford County Higher Education Center 42,400,000$ 42,400,000$ -$ 0% 42,400,000$
TBR 2021-22 TBR Total 90,030,000$ 700,000$ 89,330,000$ 1,710,000$ 2% 87,620,000$
2021-22 LGI Total 334,849,000$ 3,250,000$ 331,599,000$ 24,461,173$ 7% 307,137,827$
2021-22 UT Total 95,100,000$ -$ 95,100,000$ 9,576,000$ 10% 85,524,000$
2021-22 THEC Capital Outlay Projects Recommendation 519,979,000$ 3,950,000$ 516,029,000$ 35,747,173$ 7% 480,281,827$
2 - Reflects total state appropriation request after all other funding sources — including previous years funding, total match funds and other institutional funds — are taken into account.
ATTACHMENT II
2021-22 THEC Capital Outlay Projects Recommendation
1 - Match is applicable to the entire scope of each capital outlay project.
Capital Projects Recommendation

THEC
Priority
Campus/System
Priority
Governing
BoardInstitution Project Name
Total Project
CostState Request Project Description
1 1 TTU TTU Engineering Building $ 56,980,000 $ 49,171,600
Construct a student-centered, interdisciplinary space used by all departments in the College of Engineering.
The building has been programmed around the concept of open, flexible, and re-configurable spaces to
promote multi-purpose use and collaborative learning. The building will be designed to facilitate hands-on,
interdisciplinary, and collaborative learning through “Maker” spaces, design project space, and labs. Larger,
more visible classrooms, active student labs, and student display space will pique interest and increase
prominence for the Engineering program and its activities.
2 1 APSU APSU Health Professions Building $ 70,175,000 $ 66,067,500
Construction of a new Health Professions Building to co-locate the School of Nursing, Allied Health Sciences,
Health and Human Performance, Psychological Science and Counseling, and Social Work as well as renovation
of approximately 14,000 SF in the Clement building, McCord building, Dunn Center, and Sundquist building for
the creation of classrooms and research lab.
3 1 MTSU MTSU Applied Engineering Building $ 54,900,000 $ 50,508,000
Design and construct a new center and related work for the Applied Engineering disciplines at MTSU. The
building program contains classroom, laboratory, office, and support spaces. The project contains required site
development and utility infrastructure, and the demolition of the Voorhies Engineering Technology building.
4 1 TBR Columbia StateWilliamson County Arts and Technology
Building $ 28,630,000 $ 26,980,000
This request is for a new Arts and Technology Building and renovations in existing buildings to accommodate
the collaborative programs offered with TCAT Dickson.
5 1 ETSU ETSU Academic Building $ 51,794,000 $ 48,490,727
ETSU will construct a new ETSU Academic Building adjacent to renovated Culp Student Center, and renovate
areas in Gilbreath and Burleson Halls. The existing Campus Center Building (CCB) will be demolished and the
Academic Building constructed on the same site. The new ETSU Academic Building will provide space for
flexible classrooms, instructional labs, a math, writing and speaking center, and other spaces as outlined in the
2020 Academic Facilities Master Plan. Gilbreath Hall will be renovated to provide instructional and research
space for the social sciences. The renovated Burleson Hall will consist primarily of office spaces to
accommodate those moving from CCB. The work will be phased with demolition and new construction
completed prior to the backfill renovations.
6 2 TBR Nashville State Clarksville Lab and Classroom Building $ 19,000,000 $ 18,240,000
Construction of a second building on the Clarksville Campus. Will include science and computer labs, flexible
classroom space, faculty offices and student study/gathering areas. Sitework will include new parking and an
access road to Wilma Rudolph Blvd.
7 1 UT UTK Nursing Bldg Renovation & Addition $ 65,000,000 $ 56,810,000
This project will renovate and add to the existing College of Nursing building. The new and renovated spaces
will provide enhanced learning and operational space as well as improving and expanding classrooms,
simulation facilities, offices and meeting spaces. The existing building work will also include upgrades to
building systems along with correcting code and life safety issues.
8 2 UT UTMInnovation and Product Realization
Facility $ 18,600,000 $ 17,444,000
This project will provide a new Innovation and Product Realization Facility. This facility is a partnership with
industry, TCAT, and UTM to create prototypes in a product realization process. The facility will provide
machine tools, equipment, and work space to fabricate prototypes; laboratories to support manufacturing;
and office space.
9 3 UT UTHSC Nash Buildout 2 Floors $ 11,500,000 $ 11,270,000
This project will build out the top 2 floors (4th & 5th) of the Nash / Nash Annex Building. The finish out of these
floors will extend both wet and dry labs as well as office spaces of the building. The main utilities are already in
place from the previous building renovations.
10 1 TSU TSU Engineering Classroom Building $ 50,000,000 $ 47,000,000 Replace existing engineering building with a new building
11 1 UoM UoM Academic Classroom Building $ 51,000,000 $ 45,900,000 This project will demolish Mitchell and Clement Hall and construct a new Academic Classroom facility to
provide modern accommodations and teaching functions for core curriculum
12 3 TBR TCAT ShelbyvilleBedford County Higher Education
Center $ 42,400,000 $ 42,400,000
Relocate current campus to allow expansion for new programs and develop a more efficient facility to provide
existing programs. New site will allow for expansion for future programs.
ATTACHMENT III
THEC 2021-22 Capital Outlay Projects Descriptions
Capital Projects Recommendation

Governing Board State RequestTSU 5,000,000$
2021-22 Total 5,000,000$
Governing Board Share2 State RequestAPSU: 3.13% 4,700,000$ ETSU: 7.58% 11,364,000$ MTSU: 6.64% 9,965,000$ TSU: 4.91% 6,366,000$ TTU: 5.22% 7,834,000$
UoM: 12.02% 17,342,000$ TBR: 20.02% 29,830,000$ UT: 40.47% 59,910,000$
2021-22 Total 147,311,000$
Governing Board State RequestAPSU 4,700,000$ ETSU 11,364,000$ MTSU 9,965,000$ TSU 11,366,000$ TTU 7,834,000$ UoM 17,342,000$ TBR 29,830,000$ UT 59,910,000$
2021-22 Total 152,311,000$
Total
Special Initiative: Electrical Upgrades1
General Capital Maintenance
1 - A detail, prioritized list of all capital maintenance projects for all higher education is on the following page.
Capital Projects Recommendation
2 - Shares for each governing board are determined annually by the Sherman Dergis Formula, an industry-standard facility reinvestment formula. The formula calculates an annual estimate for capital maintenance for each campus using aggregate size, age, and use of facilities. Shares here are determined based on each governing board's formula based on 2020-21 usage.
ATTACHMENT IV2021-22 THEC Capital Maintenance
6

Priority Type Governing Board Institution Project Total
1 Spec. Init. TSU TSU Electrical Upgrades Phase 3 5,000,000$
2 Gen. Maint. TBR ClSCC Science Building Renovations 1,880,000
3 Gen. Maint. TBR PSCC Strawberry Plains Roof Replacement 810,000
4 Gen. Maint. TBR NaSCC Clarksville Roof Replacement 700,000
5 Gen. Maint. MTSU MTSU Campus Wide Utilities Repairs and Replacements Phase 1 1,139,000
6 Gen. Maint. TTU TTU Steam Plant Deaerator Tank Replacement 920,000
7 Gen. Maint. TBR NeSCC Powers and Maintenance Roof Replacements 410,000
8 Gen. Maint. TBR Statewide TCAT Roof Repairs/Replacements Phase 4 850,000
9 Gen. Maint. UT UTM EPS Building Systems Upgrades 9,870,000
10 Gen. Maint. TBR MSCC Marcum Roof Replacement and Exterior Repairs 1,220,000
11 Gen. Maint. MTSU MTSU Multiple Buildings Elevator Modernization Phase 1 950,000
12 Gen. Maint. UoM UoM Multiple Buildings Upgrades and Repairs 4,309,000
13 Gen. Maint. UT UTC Roof Replacements 5,030,000
14 Gen. Maint. MTSU MTSU Campus Wide Life Safety Systems Upgrade Phase 1 400,000
15 Gen. Maint. TBR WSCC Humanities MEP Improvements 1,700,000
16 Gen. Maint. UoM UoM Central Plant & CFA Bldg. Chillers & HVAC Repl. & Repairs Planning 500,000
17 Gen. Maint. TBR JSCC Nelms Classroom Building HVAC Updates 890,000
18 Gen. Maint. MTSU MTSU Cope Building Roof Replacement 600,000
19 Gen. Maint. ETSU ETSU HVAC and Steam Line Repairs Phase 1 3,650,000
20 Gen. Maint. TBR RSCC Oakridge Campus HVAC Updates 1,450,000
21 Gen. Maint. TTU TTU Derryberry Hall Upgrades Phase 1 1,691,000
22 Gen. Maint. UT UTHSC Campus Police Building Upgrades 8,000,000
23 Gen. Maint. TBR STCC Central Plant Updates Phase 2 3,000,000
24 Gen. Maint. UT UTIA CRC/MAST, BESS, & JARTU Improvements 7,120,000
25 Gen. Maint. TSU TSU Campus HVAC Repairs Phase 2 3,650,000
26 Gen. Maint. MTSU MTSU Science Building HVAC and Exhaust System Upgrades 2,000,000
27 Gen. Maint. UoM UoM Central Plant & CFA Bldg. Chillers & HVAC Repl. & Repairs 4,500,000
28 Gen. Maint. TBR Statewide TCAT Mechanical, Electrical, and Plumbing Updates Phase 2 3,230,000
29 Gen. Maint. TBR VSCC Ramer Building ADA and Interior Upgrades 410,000
30 Gen. Maint. UT UTK Building Systems Improvements 4,000,000
31 Gen. Maint. TBR CoSCC Accessibility and Security 950,000
32 Gen. Maint. ETSU ETSU Brown Hall Structural and Shelbridge Repairs 3,000,000
33 Gen. Maint. UT UTC Elevator Upgrades 2,330,000
34 Gen. Maint. MTSU MTSU Multiple Buildings Elevator Modernization Phase 2 885,000
35 Gen. Maint. TTU TTU Building Controls Upgrade Phase 1 2,150,000
36 Gen. Maint. UT UT Facilities Space Analytics 1,000,000
37 Gen. Maint. TBR Statewide TCAT Parking and Paving Updates Phase 1 1,350,000
38 Gen. Maint. APSU APSU Sundquist Roof Replacement 3,200,000
39 Gen. Maint. TBR ChSCC CAT Building Interior Renovations 1,800,000
40 Gen. Maint. UT UTIA Morgan Hall Envelope Repairs 4,950,000
41 Gen. Maint. UoM UoM Campus Wide Boilers and Hot Water Pipes Repair Phase 2 3,500,000
42 Gen. Maint. MTSU MTSU Campus Wide Life Safety Systems Upgrade Phase 2 1,285,000
43 Gen. Maint. TBR DSCC Naifeh Building Renovations 1,250,000
44 Gen. Maint. TSU TSU Campus Building Envelope and Structure Repairs Phase 2 1,900,000
45 Gen. Maint. TBR Statewide TCAT Maintenance Repairs Phase 1 1,450,000
46 Gen. Maint. UT UTHSC Roof Replacements 5,000,000
47 Gen. Maint. TBR PSCC Alarm System Upgrades Phase 2 250,000
48 Gen. Maint. TBR ChSCC Warehouse Roof Replacement 280,000
49 Gen. Maint. ETSU ETSU Multiple Buildings Exterior Improvements 2,414,000
50 Gen. Maint. TTU TTU Bryan Fine Arts Auditorium Upgrades 1,506,000
51 Gen. Maint. TSU TSU Goodwill Manor and Harned Hall Exterior Renovations 400,000
52 Gen. Maint. TBR TCAT Hartsville TCAT Roof Repairs/Replacements Phase 5 520,000
53 Gen. Maint. UT UTM Elam Center Mall Glass Replacement 4,130,000
54 Gen. Maint. TBR Statewide TCAT Mechanical, Electrical, and Plumbing Updates Phase 3 1,210,000
55 Gen. Maint. TBR Statewide TCAT Building System Updates Phase 4 170,000
56 Gen. Maint. TSU TSU Crouch Hall Roof Replacement 416,000
57 Gen. Maint. TBR TCAT McKenzie Plumbing Repairs 300,000
58 Gen. Maint. UoM UoM Multiple Buildings Window Replacements and Brick Repairs 3,000,000
59 Gen. Maint. TBR Statewide TCAT Maintenance Repairs Phase 2 830,000
60 Gen. Maint. MTSU MTSU Campus Wide Utilities Repairs and Replacements Phase 2 1,816,000
61 Gen. Maint. UT UTC Building Envelope Repairs Ph I 4,480,000
62 Gen. Maint. MTSU MTSU College Heights Electrical Upgrades 400,000
63 Gen. Maint. UoM UoM Campus Wide HVAC Controls Replacement 1,533,000
64 Gen. Maint. TBR Statewide TCAT Parking and Paving Updates Phase 2 2,370,000
65 Gen. Maint. UT UTK HVAC Improvements Ph I 4,000,000
66 Gen. Maint. TBR NaSCC Interior and Exterior Updates 550,000
67 Gen. Maint. APSU APSU Sundquist Exhaust System Controls Upgrade 1,500,000
68 Gen. Maint. MTSU MTSU Tennessee Livestock Roof Repairs and Refurbishment 490,000
69 Gen. Maint. TTU TTU Campus Wide Exterior Lighting Upgrades 1,567,000
70 Gen. Maint. ETSU ETSU Multiple Buildings Roof Replacements 2,300,000
152,311,000$ 2021-22 Capital Maintenance Total
THEC 2021-22 Capital Maintenance Projects Recommendation
ATTACHMENT IV
Capital Projects Recommendation
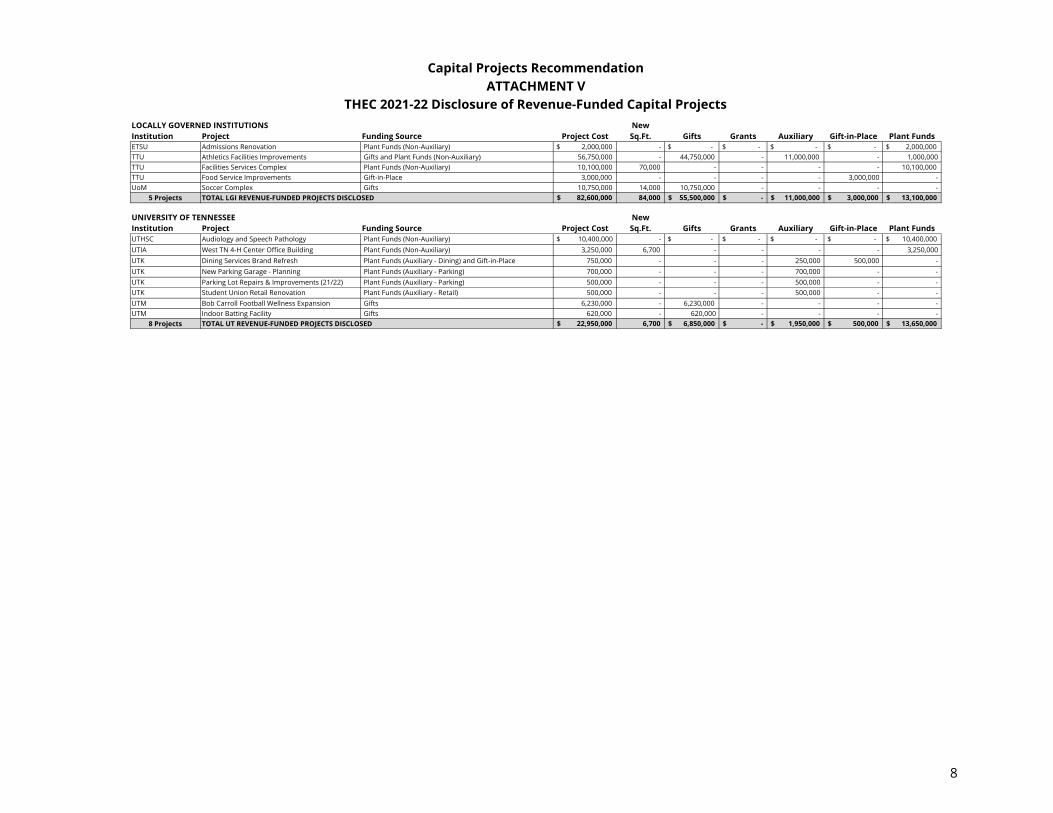
LOCALLY GOVERNED INSTITUTIONS NewInstitution Project Funding Source Project Cost Sq.Ft. Gifts Grants Auxiliary Gift-in-Place Plant FundsETSU Admissions Renovation Plant Funds (Non-Auxiliary) $ 2,000,000 - $ - $ - $ - $ - $ 2,000,000 TTU Athletics Facilities Improvements Gifts and Plant Funds (Non-Auxiliary) 56,750,000 - 44,750,000 - 11,000,000 - 1,000,000 TTU Facilities Services Complex Plant Funds (Non-Auxiliary) 10,100,000 70,000 - - - - 10,100,000 TTU Food Service Improvements Gift-in-Place 3,000,000 - - - - 3,000,000 - UoM Soccer Complex Gifts 10,750,000 14,000 10,750,000 - - - -
5 Projects 82,600,000$ 84,000 55,500,000$ -$ 11,000,000$ 3,000,000$ 13,100,000$
UNIVERSITY OF TENNESSEE NewInstitution Project Funding Source Project Cost Sq.Ft. Gifts Grants Auxiliary Gift-in-Place Plant FundsUTHSC Audiology and Speech Pathology Plant Funds (Non-Auxiliary) $ 10,400,000 - $ - $ - $ - $ - $ 10,400,000 UTIA West TN 4-H Center Office Building Plant Funds (Non-Auxiliary) 3,250,000 6,700 - - - - 3,250,000 UTK Dining Services Brand Refresh Plant Funds (Auxiliary - Dining) and Gift-in-Place 750,000 - - - 250,000 500,000 - UTK New Parking Garage - Planning Plant Funds (Auxiliary - Parking) 700,000 - - - 700,000 - - UTK Parking Lot Repairs & Improvements (21/22) Plant Funds (Auxiliary - Parking) 500,000 - - - 500,000 - - UTK Student Union Retail Renovation Plant Funds (Auxiliary - Retail) 500,000 - - - 500,000 - - UTM Bob Carroll Football Wellness Expansion Gifts 6,230,000 - 6,230,000 - - - - UTM Indoor Batting Facility Gifts 620,000 - 620,000 - - - -
8 Projects 22,950,000$ 6,700 6,850,000$ -$ 1,950,000$ 500,000$ 13,650,000$ TOTAL UT REVENUE-FUNDED PROJECTS DISCLOSED
Capital Projects Recommendation
TOTAL LGI REVENUE-FUNDED PROJECTS DISCLOSED
ATTACHMENT VTHEC 2021-22 Disclosure of Revenue-Funded Capital Projects
8

NewInstitution Project Funding Source Project Cost Sq.Ft. TSSBA Gifts Auxiliary Gift-in-Place Plant FundsMTSU Applied Engineering Building Plant Funds (Non-Auxiliary) $ 2,500,000 53,350 $ 2,500,000 $ - $ - $ - $ - MTSU New Student Housing Plant Funds (Auxiliary - Student Housing Fees) 63,200,000 184,000 63,200,000 - - - - MTSU Student Athlete Performance Center Gifts 66,000,000 75,445 56,000,000 10,000,000 - - - TTU Generator Expansion & Relocation TVA Energy Credit 10,000,000 - 3,000,000 - - - 7,000,000 TTU Residence Hall Innovation Center Plant Funds (Auxiliary - Student Housing Fees) 29,500,000 80,000 29,000,000 - 500,000 - -
5 Projects 171,200,000$ 392,795 153,700,000$ 10,000,000$ 500,000$ -$ 7,000,000$
18 Projects 276,750,000$ 483,495 153,700,000$ 72,350,000$ 13,450,000$ 3,500,000$ 33,750,000$
THEC 2021-22 Disclosure of Tennessee State School Bond Authority Funded Capital Projects
TOTAL TSSBA-FUNDED PROJECTS DISCLOSED
TOTAL REVENUE- & TSSBA-FUNDED PROJECTS DISCLOSED
ATTACHMENT VCapital Projects Recommendation
9

A B C = A - BTotal Potential State Funds
Project Cost Match RequestStatewide Center for Health Sciences & Industrial Technologies 41,740,000$ 1,030,200$ 40,710,000$
Jackson State Regional Educational Advancement Development Center 4,630,000 231,500 4,399,000 Motlow State Rutherford County Teaching Site Building 4 23,500,000 1,000,000 22,500,000
Pellissippi State Hardin Valley Renovations 22,500,000 500,000 22,000,000 Roane State Knox County Campus Expansion 38,500,000 4,000,000 34,500,000
Volunteer State Wilson County Campus 28,000,000 2,000,000 26,000,000 Walters State Health Professions and Physical Activity Center 42,000,000 1,490,000 40,510,000 TCAT Dickson Automotive Technology Training Space 2,270,000 - 2,270,000
TCAT Elizabethton Washington County Extension Campus 7,020,000 - 7,020,000 TCAT Elizabethton Classroom and Shop Building 5,240,000 - 5,240,000 TCAT McMinnville New Classroom Building and Renovations 23,000,000 - 23,000,000
TCAT Nashville Cockrill Bend HVACR and Welding Building 8,900,000 - 8,900,000 TBR Total 247,300,000$ 10,251,700$ 237,049,000$
Total Potential State FundsProject Cost Match Request
MTSU Math and Computer Science Building 60,700,000$ -$ 60,700,000$ TTU Facilities Services Complex 10,100,000 505,000 9,595,000 UoM Research Modernization 28,500,000 2,850,000 25,650,000 MTSU School of Music 60,090,000 - 60,090,000 TTU Biology Building 60,000,000 3,000,000 57,000,000 UoM Research Park 45,000,000 15,000,000 30,000,000 MTSU Liberal Arts Building 84,000,000 - 84,000,000 TTU Academic Classroom/Office Building 19,500,000 925,000 18,575,000 UoM Interdisciplinary Science Research 46,000,000 4,600,000 41,400,000 MTSU Renovations to KOM 33,000,000 - 33,000,000 TTU Memorial Gym Update 15,400,000 - 15,400,000 UoM Art Renovations and Physical Plant 26,000,000 2,600,000 23,400,000
LGI Total 488,290,000$ 29,480,000$ 458,810,000$
Total Potential State FundsProject Cost Match Request
UTC Health Science Building 70,000,000$ 5,600,000$ 64,400,000$ UTHSC Gross Anatomy Lab Renovation 20,000,000 400,000 19,600,000
UTC Maclellan Renovation 50,800,000 3,600,000 47,200,000 UTK Jessie Harris Building Renovation 51,000,000 3,060,000 47,940,000 UTIA Garden Education & Discovery Center 17,500,000 700,000 16,800,000
UTHSC Molecular Science Building Renovation 54,910,000 1,098,200 53,812,000 UTK Buehler Hall Renovation 81,000,000 4,860,000 76,140,000 UTIA North Greenhouse Expansion 5,250,000 210,000 5,040,000 UTIA Morgan Hall Renovation and Addition 33,000,000 1,320,000 31,680,000 UTK Dabney Hall Renovation 47,000,000 2,820,000 44,180,000 UTK Nielsen Physics Renovation 29,000,000 1,740,000 27,260,000 UTIA IPS-UTIA Middle Tennessee Building 47,500,000 1,900,000 45,600,000
UT Total 506,960,000$ 27,308,200$ 479,652,000$
Potential State FundsTotal Match Request
TBR Total 45,780,000$ NA 45,780,000$ LGI Total 270,697,000$ NA 270,697,000$ UT Total 257,382,000$ NA 257,382,000$
Future Years State FundsTotal Match Funds Request
1,242,550,000$ 67,039,900$ 1,175,511,000$ 573,859,000$ NA 573,859,000$
1,816,409,000$ 67,039,900$ 1,749,370,000$
Total Out Years
ATTACHMENT VITHEC Five-Year Plan for Capital Outlay - Out Years Summary
2022-23 through 2025-26
TBR Capital Outlay Out Years
UT Capital Outlay Out Years
Capital Maintenance Out Years
LGI Capital Outlay Out Years
Capital Projects Recommendation
Total Capital Outlay Out Years 2022-23 through 2025-26Total Capital Maintenance Out Years 2022-23 through 2025-26Total Capital Investment 2022-23 through 2025-26
10

Tennessee Board of Regents Project Cost Tennessee Board of Regents (cont.) Project Cost2022-23 WSCC Fire Safety Remediation 1,900,000$ 2024-25 NaSCC Storefront and Window Replacements 980,000$ 2022-23 JSCC Administration Building HVAC Updates 870,000 2024-25 WSCC Claiborne Site and Exterior Remediation 800,0002022-23 Statewide TCAT Mechanical, Electrical, and Plumbing Updates Phase 4 2,360,000 2024-25 JSCC Window Replacements 1,270,0002022-23 TCAT Hohenwald Sewer Line Replacement 220,000 2025-26 PSCC Building Envelope Repairs 800,0002022-23 NeSCC Blountville Campus Paving Repairs 350,000 2025-26 PSCC Campus Paving and Repairs 950,0002022-23 TCAT McKenzie Masonry Building Structure Repair 200,000 2025-26 DSCC Exterior Window Updates 390,0002022-23 NaSCC Parking Lot Repairs 300,000 2025-26 PSCC McWherter Elevator 630,0002022-23 Statewide TCAT Maintenance Repairs Phase 3 1,320,000 2025-26 MSCC Interior Building Repairs 870,0002022-23 STCC Building Envelope and Drainage Repairs 1,800,000 2025-26 DSCC Auditorium Upgrades 870,0002022-23 Statewide TCAT Parking and Paving Updates Phase 3 620,000 2025-26 TCATKnoxville Interior Updates 250,0002022-23 VSCC Cookeville Higher Education Center Science Lab 600,000 2025-26 TCAT Hartsville Safety and Security Updates 200,0002022-23 TCAT Hartsville Wilson County Safety and Security Updates 250,000 2025-26 TCAT Elizabethton Arney Street Bldg #2 Infrastructure and Exterior Updates 110,0002022-23 PSCC HVAC and Electrical Upgrades and Repairs Phase 2 1,100,000 2025-26 TCAT Paris Fan Coil Unit Replacements 130,0002022-23 ChSCC Central Plant Modernization Phase 1 400,000 2025-26 TCAT Knoxville Shop Flooding Repairs 10,0002022-23 VSCC Mechanical Updates 1,050,000 2025-26 TCAT Morristown Restroom Renovations 270,0002022-23 CoSCC Several Building HVAC Updates 880,000 62 Projects 45,780,000$ 2022-23 Statewide TCAT Mechanical, Electrical, and Plumbing Updates Phase 5 1,020,0002022-23 Statewide TCAT Mechanical Updates D 490,0002022-23 ChSCC Campus Accessibility Updates 750,000 Austin Peay State University Project Cost2022-23 NeSCC Auto Shop Exterior Updates 630,000 2022-23 APSU Roofing Campus Buildings 1,500,000$ 2022-23 Statewide TCAT Parking and Paving Updates C 260,000 2022-23 APSU Fire Alarm Upgrades 1,200,0002022-23 TCAT Pulaski Window Replacements 50,000 2022-23 APSU Fire Alarm Central Monitoring 500,0002022-23 TCAT Crump Building 2 Welding Technology Renovation 290,000 2022-23 APSU Memorial Health HVAC and Electrical 1,500,0002022-23 JSCC Multiple Building Fire Alarm Upgrades 500,000 2023-24 APSU Ellington Electrical, Fire Alarm, and Plumbing 1,500,0002022-23 ChSCC Humanities Elevator and 2nd Floor Accessibility 1,350,000 2023-24 APSU Modular Boiler Installation - Phase 3 1,200,0002022-23 ClSCC Data Infrastructure and Electrical Upgrade 570,000 2023-24 APSU Underground Electrical Replacement - Phase 7 2,000,0002022-23 RSCC Roane County HVAC Updates 1,800,000 2024-25 APSU Browning Electrical and Plumbing 1,200,0002022-23 RSCC Scott County HVAC Corrections 680,000 2024-25 APSU Central Plant Façade Repairs 1,000,0002023-24 PSCC McWherter Safety Renovations 1,500,000 2024-25 APSU Miller Hall HVAC , Electrical and Plumbing 1,250,0002023-24 VSCC Parking Lot Repairs 740,000 2024-25 APSU Modular Boiler Installation - Phase 4 1,250,0002023-24 Statewide TCAT Parking and Paving Updates D 490,000 2025-26 APSU Re-roof Various Buildings 500,0002023-24 Statewide TCAT Maintenance Updates C 660,000 2025-26 APSU Shasteen HVAC 750,0002023-24 MSCC Parking and Roadway Repairs 1,220,000 2025-26 APSU Farm Building Repairs 250,0002023-24 NaSCC Science Lab Upgrades 1,200,000 2025-26 APSU Exterior Brick and Envelope Repairs 500,0002023-24 ClSCC Student Center Roof Replacement 500,000 APSU Out Years Total 15 Projects 16,100,000$ 2023-24 DSCC Campus Roof Drain Replacement 270,0002023-24 JSCC Library Roof Repairs 530,000 East Tennessee State University Project Cost2023-24 VSCC CHEC Building Automation Updates 270,000 2022-23 ETSU HVAC and Steam Line Repairs Phase 2 3,800,000$ 2023-24 PSCC Boiler and Cooling Tower Replacement 850,000 2022-23 ETSU Several Building Electrical Repair and Replacement 1,600,000 2024-25 DSCC HVAC System Upgrades 390,000 2022-23 ETSU Structural, Drainage, Envelope and Code Repairs 3,200,000 2024-25 PSCC Air Handling Units and Chiller Replacement 1,250,000 2022-23 ETSU Repair and Replacement of Water Lines Phase 1 1,750,000 2024-25 ClSCC Central Plant Modernization 880,000 2023-24 ETSU Repair and Replacement of Water Lines Phase 2 2,100,000 2024-25 JSCC Campus Electrical Distribution Upgrades 1,290,000 2023-24 ETSU HVAC Repairs 2,300,000 2024-25 JSCC McWherter Center Chiller Updates 460,000 2023-24 ETSU Building Envelope Repairs 2,250,000 2024-25 VSCC Exterior Repairs 270,000 2023-24 ETSU Roof Replacements 2,300,000 2024-25 DSCC Campus Paving and Repairs 370,000 2023-24 ETSU Safety Lighting and Fire Alarm System Replacements 1,700,000 2024-25 WSCC Parking Lot and Lighting Improvements 1,500,000 2024-25 ETSU COM HVAC Replacements in Buildings 1, 4, 119, & 178. 3,000,000
Capital Projects RecommendationATTACHMENT VII
THEC Five-Year Plan for Capital Maintenance Projects - Out Years 2022-23 through 2025-26
TBR Out Years Total
11

East Tennessee State University (cont.) Project Cost Tennessee State University Project Cost2024-25 ETSU Code and Accessibility Upgrades 2,910,000 2022-23 TSU Electrical Upgrades - Phase 4 2,000,000$ 2024-25 ETSU Sewer Main Repairs and Line Improvements 2,350,000 2022-23 TSU Strange HVAC Full Replacement 1,400,0002024-25 ETSU Several Building HVAC Repairs 4,000,000 2022-23 TSU Several Building Fire Alarm Upgrades 500,0002024-25 ETSU Several Building Electrical Repairs 3,000,000 2022-23 TSU Several Building Electrical Upgrades 466,0002025-26 ETSU Window Replacement 1,500,000 2022-23 TSU HVAC Repairs 1,000,0002025-26 ETSU Fire Alarm and Systems Upgrades and Replacements 1,400,000 2022-23 TSU Gentry Center Roof Replacement 1,000,0002025-26 ETSU Roof Replacements 2,000,000 2022-23 TSU Gentry Center Lighting Upgrades 1,000,0002025-26 ETSU Code and Accessibility Upgrades 2,000,000 2023-24 TSU Electrical Upgrades - Phase 5 2,000,0002025-26 ETSU Several Building HVAC Repairs 3,000,000 2023-24 TSU Several Building Fire Alarm Upgrades 400,0002025-26 ETSU Several Building Electrical Repairs 3,500,000 2023-24 TSU Several Building HVAC Upgrades 400,000
ETSU Out Years Total 20 Projects 49,660,000$ 2023-24 TSU Brown-Daniel Library Improvements 1,000,0002023-24 TSU Several Building Roof Replacement 900,000
Middle Tennessee State University Project Cost 2023-24 TSU Several Building Envelope and Glazing Upgrades 1,000,0002022-23 MTSU Several Building Elevator Modernization Phase 3 1,000,000$ 2023-24 TSU Road and Parking Lot Upgrades 416,0002022-23 MTSU Campus Wide Utilities 2,000,000 2023-24 TSU Storm Sewer Improvements 400,0002022-23 MTSU Several Buildings Window Replacement 1,550,000 2023-24 TSU Kean Hall MEP Upgrades 850,0002022-23 MTSU Several Buildings Roof Replacements 1,400,000 2024-25 TSU Electrical Upgrades - Phase 6 2,000,0002022-23 MTSU Several Building Pneumatic Controls Replacements 650,000 2024-25 TSU McWherter MEP Upgrades 750,0002022-23 MTSU Pump and VFD Replacement Phase I 1,000,000 2024-25 TSU FP Campus Center Improvements 1,500,0002022-23 MTSU Sidewalk Repair/Replacement Phase I 800,000 2024-25 TSU Hardscape Improvements 86,0002023-24 MTSU KUC Mechanical and HVAC Upgrades Phase II 1,500,000 2024-25 TSU Queen Washington HVAC Upgrades 1,000,0002023-24 MTSU Steam/Condensate & Manhole Repair/Replacement Phase IV 1,500,000 2024-25 TSU McMinnville MEP Upgrades 1,000,0002023-24 MTSU Several Buildings Plumbing & Restroom Upgrades 2,950,000 2024-25 TSU Sanitary Sewer Improvements 1,000,0002023-24 MTSU Several Buildings Roof Replacement 750,000 2025-26 TSU Electrical Upgrades - Phase 7 2,000,0002023-24 MTSU Domestic Water & Sewer System's Updates Phase II 650,000 2025-26 TSU Safety Upgrades 450,0002023-24 MTSU Elevator Modernization Phase V 750,000 2025-26 TSU Several Building HVAC Upgrades 500,0002024-25 MTSU JUB Building Mechanical HVAC, Windows & Ceiling Upgrades 2,550,000 2025-26 TSU Several Building Electrical Upgrades 416,0002024-25 MTSU Life Safety Fire Alarm System Upgrades Phase III 850,000 2025-26 TSU Hardscape Improvements 300,0002024-25 MTSU Elevator Modernization Phase V 1,500,000 2025-26 TSU Several Building Roof Replacement 850,0002024-25 MTSU Campus Stormwater BMP Phase II 650,000 2025-26 TSU Several Building Envelope and Glazing Upgrades 1,000,0002024-25 MTSU Womack Lane Switchgear Replacement 900,000 2025-26 TSU Road and Parking Lot Upgrades 500,0002024-25 MTSU Sidewalk Repair/Replacement Phase II 700,000 2025-26 TSU Storm Sewer Improvements 500,0002024-25 MTSU Several Buildings Roof Replacements 950,000 2025-26 TSU Holland Hall MEP Upgrades 850,0002025-26 MTSU Pump and VFD Replacement 1,200,000 TSU Out Years Total 33 Projects 29,434,000$ 2025-26 MTSU Jones Hall Mechanical, HVAC, Lighting, Ceiling Upgrades 2,500,000 2025-26 MTSU Several Buildings Plumbing Upgrades 1,250,000 Tennessee Technological University Project Cost2025-26 MTSU PMH Gear Replacement 938,000 2022-23 TTU Academic Wellness Center Upgrades & Repurpose 12,100,000$ 2025-26 MTSU Several Building Mechanical, HVAC, Lighting, Ceiling Upgrades 2,500,000 2023-24 TTU Brown Hall Upgrades 10,000,000
MTSU Out Years Total 25 Projects 32,988,000$ 2024-25 TTU Derryberry Hall Upgrades Phase 2 9,000,000 2025-26 TTU Clement Hall Upgrades 11,415,000
TTU Out Years Total 4 Projects 42,515,000$
ATTACHMENT VIITHEC Five-Year Plan for Capital Maintenance Projects - Out Years 2022-23 through 2025-26
Capital Projects Recommendation
12

University of Memphis Project Cost University of Tennessee (continued) Project Cost2022-23 UoM HVAC Repairs and Replacements 3,500,000$ 2023-24 UTK Dabney Buehler Systems Upgrade 10,000,000$ 2022-23 UoM Building Repairs 4,000,000 2023-24 UTC Cadek Hall Renovations 7,690,0002022-23 UoM Roof Replacements 3,000,000 2023-24 UTHSC HVAC Mechanical Equipment Upgrades 4,750,0002022-23 UoM Wilder Tower Repairs 2,500,000 2023-24 UTM Elam Cntr Bldg Envelope & Natatorium Upgrades 7,610,0002022-23 UoM Lambuth Various Maintenance 2,500,000 2023-24 UTC Patten and Danforth Renovations 4,610,0002022-23 UoM HVAC System Replacements 5,000,000 2023-24 UTHSC HVAC Mechanical Equipment Upgrades 4,500,0002022-23 UoM Campus Lighting Replacement 2,500,000 2024-25 UTIA Livestock Housing Improvements 10,000,0002022-23 UoM Building Code and Safety 2,000,000 2024-25 UTK Jessie Harris Systems Upgrades 10,000,0002023-24 UoM Capital Maintenance 25,000,000 2024-25 UTIA Extension Central Region Improvements 2,400,0002024-25 UoM Capital Maintenance 25,000,000 2024-25 UTK Electrical Distribution Improvements 14,000,0002025-26 UoM Capital Maintenance 25,000,000 2024-25 UTM ADA Campus Upgrades 2,505,000
UoM Out Years Total 11 Projects 100,000,000$ 2024-25 UTC Elevator Upgrades 4,185,0002024-25 UTHSC Emergency Power Back-up 2,500,000
University of Tennessee Project Cost 2024-25 UTC Founders Hall Renovations 6,500,0002022-23 UTC Building Envelope Repairs Ph II 3,820,000$ 2024-25 UTHSC Campus Sidewalk Repairs 3,000,0002022-23 UTK HVAC Improvements Ph II 4,000,000 2024-25 UTIA Livestock Waste Handling & Infrastructure Improvements 9,900,0002022-23 UTIA West TN-REC Improvements 3,300,000 2025-26 UTK HVAC Control System Consolidation & Upgrades 9,000,0002022-23 UTIA West TN 4-H Center Improvements 1,700,000 2025-26 UTM ADA Campus Upgrades 2,505,0002022-23 UTM University Center Sewer Line Replacement 670,000 2025-26 UTIA Feed Storage & Feeding System Improvements 12,500,0002022-23 UTHSC Building Envelope Repair 5,500,000 2025-26 UTK Elevator Upgrades 10,000,0002022-23 UTK Window Replacement & Masonry Repair 8,000,000 2025-26 UTM Roof Replacements 3,750,0002022-23 UTC Brock Hall Improvements 10,620,000 2025-26 UTC HVAC Upgrades 9,260,0002022-23 UTK Steam Plant Improvements 7,000,000 2025-26 UTIA Blount Farm Improvements 7,200,0002022-23 UTC Building Envelope & Site Repair 7,820,000 2025-26 UTK Steam Distribution System Improvements 6,000,0002022-23 UTM Clement Bldg Systems Upgrade/Chiller Replacement 5,070,000 2025-26 UTC Central Plant Chillers & HTHW Generator Replacement 1,800,0002022-23 UTHSC HVAC Improvements 5,250,000 2025-26 UTC Emergency Generators Upgrade 2,900,0002023-24 UTIA CVM - Cherokee Bldg A 5,700,000 41 Projects 257,382,000$ 2023-24 UTIA Morgan Hall System Improvements 9,450,0002023-24 UTM Clement Building Upgrades 10,417,000
UT Out Years Total
ATTACHMENT VIITHEC Five-Year Plan for Capital Maintenance Projects - Out Years 2022-23 through 2025-26
Capital Projects Recommendation
13

Total Out Year Projects Project Cost62 Tennessee Board of Regents 45,780,000$ 15 Austin Peay State University 16,100,000$ 20 East Tennessee State University 49,660,000$ 25 Middle Tennessee State University 32,988,000$ 33 Tennessee State University 29,434,000$ 4 Tennessee Technological University 42,515,000$
11 University of Memphis 100,000,000$ 41 University of Tennessee 257,382,000$
211 Total Capital Maintenance Projects Out Years 573,859,000$
Capital Projects Recommendation
THEC Five-Year Plan for Capital Maintenance Projects - Out Years 2022-23 through 2025-26ATTACHMENT VII
14

Total Project Total State Funds Total Project Total State FundsCapital Cost Projects Match Funds 1 Request Capital Cost Projects Match Funds 1 Request
Maintenance MaintenanceTBR 29,830,000$ 26 NA 29,830,000$ TBR 22,610,000$ 28 NA 22,610,000$ LGIs 57,571,000$ 31 NA 57,571,000$ LGIs 67,916,000$ 31 NA 67,916,000$ UT 59,910,000$ 12 NA 59,910,000$ UT 62,750,000$ 12 NA 62,750,000$
Special Initiative 5,000,000$ 1 NA 5,000,000$ Special Initiative -$ - NA -$ Total 152,311,000$ 70 NA 152,311,000$ Total 153,276,000$ 71 NA 153,276,000$
Capital Outlay Capital OutlayTBR 90,030,000$ 3 1,710,000$ 87,620,000$ TBR 69,870,000$ 3 2,261,700$ 67,609,000$ LGIs 334,849,000$ 6 24,461,173$ 307,137,827$ LGIs 99,300,000$ 3 3,355,000$ 95,945,000$ UT 95,100,000$ 3 9,576,000$ 85,524,000$ UT 140,800,000$ 3 9,600,000$ 131,200,000$
Total 519,979,000$ 12 35,747,173$ 480,281,827$ Total 309,970,000$ 9 15,216,700$ 294,754,000$
Total Capital Total CapitalInvestment 672,290,000$ 82 35,747,173$ 632,592,827$ Investment 463,246,000$ 80 15,216,700$ 448,030,000$
Total Project Total State Funds Total Project Total State FundsCapital Cost Projects Match Funds 1 Request Capital Cost Projects Match Funds 1 Request
Maintenance MaintenanceTBR 8,230,000$ 11 NA 8,230,000$ TBR 9,460,000$ 11 NA 9,460,000$ LGIs 65,816,000$ 25 NA 65,816,000$ LGIs 69,396,000$ 25 NA 69,396,000$ UT 64,727,000$ 9 NA 64,727,000$ UT 64,990,000$ 10 NA 64,990,000$
Special Initiative -$ - NA -$ Special Initiative -$ - NA -$ Total 138,773,000$ 45 NA 138,773,000$ Total 143,846,000$ 46 NA 143,846,000$
Capital Outlay Capital OutlayTBR 89,000,000$ 3 6,500,000$ 82,500,000$ TBR 51,290,000$ 3 1,490,000$ 49,800,000$ LGIs 165,090,000$ 3 18,000,000$ 147,090,000$ LGIs 149,500,000$ 3 5,525,000$ 143,975,000$ UT 123,410,000$ 3 4,858,200$ 118,552,000$ UT 119,250,000$ 3 6,390,000$ 112,860,000$
Total 377,500,000$ 9 29,358,200$ 348,142,000$ Total 320,040,000$ 9 13,405,000$ 306,635,000$
Total Capital Total CapitalInvestment 516,273,000$ 54 29,358,200$ 486,915,000$ Investment 463,886,000$ 55 13,405,000$ 450,481,000$
Total Project Total State Funds Total Project Total State FundsCapital Cost Projects Match Funds 1 Request Capital Cost Projects Match Funds 1 Request
Maintenance MaintenanceTBR 5,480,000$ 12 NA 5,480,000$ TBR 75,610,000$ 88 NA 75,610,000$ LGIs 67,569,000$ 27 NA 67,569,000$ LGIs 328,268,000$ 139 NA 328,268,000$ UT 64,915,000$ 10 NA 64,915,000$ UT 317,292,000$ 53 NA 317,292,000$
Special Initiative -$ - NA -$ Special Initiative 5,000,000$ 1 NA 5,000,000$ Total 137,964,000$ 49 NA 137,964,000$ Total 726,170,000$ 281 NA 726,170,000$
Capital Outlay Capital OutlayTBR 37,140,000$ 3 -$ 37,140,000$ TBR 337,330,000$ 15 11,961,700$ 324,669,000$ LGIs 74,400,000$ 3 2,600,000$ 71,800,000$ LGIs 823,139,000$ 18 53,941,173$ 765,947,827$ UT 123,500,000$ 3 6,460,000$ 117,040,000$ UT 602,060,000$ 15 36,884,200$ 565,176,000$
Total 235,040,000$ 9 9,060,000$ 225,980,000$ Total 1,762,529,000$ 48 102,787,073$ 1,655,792,827$
Total Capital Total CapitalInvestment 373,004,000$ 58 9,060,000$ 363,944,000$ Investment 2,488,699,000$ 329 102,787,073$ 2,381,962,827$
1 - Match is applicable to the entire scope of each capital outlay project.
2025-26 Five-Year Total
2021-22 (See Detailed Summary in Attachment I) 2022-23
2023-24
Capital Projects RecommendationATTACHMENT VIII
2021-22 through 2025-26THEC Five-Year Capital Plan
2024-25
15