Embed Size (px)
Citation preview

econstorMake Your Publications Visible.
A Service of
zbwLeibniz-InformationszentrumWirtschaftLeibniz Information Centrefor Economics
Schober, Dominik
Working Paper
Static vs. dynamic impacts of unbundling: Electricitymarkets in South America
ZEW Discussion Papers, No. 13-033
Provided in Cooperation with:ZEW - Leibniz Centre for European Economic Research
Suggested Citation: Schober, Dominik (2013) : Static vs. dynamic impacts of unbundling:Electricity markets in South America, ZEW Discussion Papers, No. 13-033, Zentrum fürEuropäische Wirtschaftsforschung (ZEW), Mannheim,http://nbn-resolving.de/urn:nbn:de:bsz:180-madoc-337961
This Version is available at:http://hdl.handle.net/10419/74529
Standard-Nutzungsbedingungen:
Die Dokumente auf EconStor dürfen zu eigenen wissenschaftlichenZwecken und zum Privatgebrauch gespeichert und kopiert werden.
Sie dürfen die Dokumente nicht für öffentliche oder kommerzielleZwecke vervielfältigen, öffentlich ausstellen, öffentlich zugänglichmachen, vertreiben oder anderweitig nutzen.
Sofern die Verfasser die Dokumente unter Open-Content-Lizenzen(insbesondere CC-Lizenzen) zur Verfügung gestellt haben sollten,gelten abweichend von diesen Nutzungsbedingungen die in der dortgenannten Lizenz gewährten Nutzungsrechte.
Terms of use:
Documents in EconStor may be saved and copied for yourpersonal and scholarly purposes.
You are not to copy documents for public or commercialpurposes, to exhibit the documents publicly, to make thempublicly available on the internet, or to distribute or otherwiseuse the documents in public.
If the documents have been made available under an OpenContent Licence (especially Creative Commons Licences), youmay exercise further usage rights as specified in the indicatedlicence.
www.econstor.eu

Dis cus si on Paper No. 13-033
Static vs. Dynamic Impacts of Unbundling –
Electricity Markets in South America
Dominik Schober

Dis cus si on Paper No. 13-033
Static vs. Dynamic Impacts of Unbundling –
Electricity Markets in South America
Dominik Schober
Download this ZEW Discussion Paper from our ftp server:
http://ftp.zew.de/pub/zew-docs/dp/dp13033.pdf
Die Dis cus si on Pape rs die nen einer mög lichst schnel len Ver brei tung von neue ren For schungs arbei ten des ZEW. Die Bei trä ge lie gen in allei ni ger Ver ant wor tung
der Auto ren und stel len nicht not wen di ger wei se die Mei nung des ZEW dar.
Dis cus si on Papers are inten ded to make results of ZEW research prompt ly avai la ble to other eco no mists in order to encou ra ge dis cus si on and sug gesti ons for revi si ons. The aut hors are sole ly
respon si ble for the con tents which do not neces sa ri ly repre sent the opi ni on of the ZEW.
Non-technical Summary There is an intensive debate among academics as well as policymakers on which of the two options of unbundling, either ownership unbundling or non-discriminatory third party access, is more appropriate to foster competition and thus achieve efficient market outcomes. Whereas non-discriminatory third party access to grids and networks comprises softer forms of unbundling as informational, organizational or legal unbundling, ownership unbundling of monopolistic bottlenecks from potentially competitive value chain levels represents a much stronger approach. On the one hand, a consensus has been reached on the general advantageousness of implementing a non-discriminatory third party access regime. On the other, economists still disagree on the closely related political measure of ownership unbundling. Theoretical arguments concerning this strict form of separation are ambiguous as ownership unbundling may involve substantial restructuring costs before reducing prices in subsequent competition. The net effect is unclear a priori. In contrast, third party access might save restructuring costs but, if ineffective, leave efficiency potentials unexploited. Given these theoretical trade-offs an empirical investigation is indispensable in order to clarify whether softer measures like legal unbundling or independent transmission system operation are sufficient to make efficient operation in potentially competitive segments possible. In this article, the relative benefits of both options are investigated in static as well as in dynamic models. In prior studies, static approaches have been used to examine the effects of the measures on efficiency, prices, and distributional consequences. Market reforms, however, often induce slow adaptation processes or even reversal of initial trends after some time. Effectiveness of reforms is thus not easily measurable. A prominent example in this context is the British restructuring and privatization process. Only after several supplementary reforms competition in the wholesale electricity market started to work efficiently (cf. Newbery and Pollitt (1997)). Against this background, a dynamic framework which takes such lags into account may offer deeper insight. For the empirical analysis, the South American continent seems to be a suitable object of study, since many countries introduced regulatory reforms during the past two decades, following diverse routes. Law giving bodies have often chosen a moderate reform speed so that effects can be traced back to separate policy causes. Furthermore, residential and industrial customer prices are disposable, which allows comparing more and less price sensitive customer groups as well as redistributive tendencies. In particular, negative short term effects of ownership unbundling found in static models are approximately cancelled out by subsequent positive impacts in the dynamic model. Third party access seems to allow for similar benefits while avoiding the (restructuring) costs of ownership unbundling. Previously estimated static models thus appear to suffer from either omitted variable biases or endogeneity problems of static non-difference models.

Das Wichtigste in Kürze Sowohl in der politischen als auch in der akademischen Diskussion besteht weiterhin Uneinigkeit über die Frage, ob die eigentumsrechtliche Entflechtung oder der nicht-diskriminierende Netzzugang geeigneter ist, um Wettbewerb zu intensivieren. Während der nicht-diskriminierende Netzzugang weichere Formen der Entflechtung wie die informationelle, organisatorische und rechtliche Entflechtung umfasst, stellt die eigentumsrechtliche Entflechtung die Extremform dar. Zum einen besteht ein allgemeiner Konsens über die generelle Vorteilhaftigkeit des nicht-diskriminierenden Netzzugangs. Bezüglich der eigentumsrechtlichen Entflechtung besteht unter Ökonomen hingegen noch weitgehend Uneinigkeit. Aus der Theorie abgeleitete Wirkungen sind a priori nicht eindeutig, weil Restrukturierungskosten entstehen bevor der intensivere Wettbewerb Preise senken kann. Im Gegensatz hierzu können Regime nicht-diskriminierenden Netzzugangs Restrukturierungskosten einsparen, aber Effizienzpotentiale unausgeschöpft lassen. Eine empirische Untersuchung dieser gegenläufigen Effekte scheint deshalb hilfreich bei der Beantwortung der Frage, ob weichere Maßnahmen wie die rechtliche Entflechtung ausreichen, um effizientes Verhalten in potentiell wettbewerblichen Bereichen zu ermöglichen. In diesem Artikel wird die relative Vorteilhaftigkeit der beiden politischen Maßnahmen in statischen und dynamischen Modellen untersucht. In vorherigen Studien wurden bereits statische Ansätze genutzt, um die Auswirkungen auf Effizienz, Preise und Verteilung zu analysieren. Anpassungsprozesse im Nachgang zu Reformen finden jedoch oftmals langsam statt oder führen zu gegenteiligen Effekten. Die Effektivität von Reformen ist aus diesem Grund oftmals schwer messbar. Ein bekanntes Beispiel für einen solchen Anpassungsprozess ist die Restrukturierung des Stromsektors in Großbritannien. Erst nach mehrmaligem Nachbessern der Reformen hat ein effizienter Wettbewerb eingesetzt (vgl. Newbery and Pollitt (1997)). Vor diesem Hintergrund verspricht die Untersuchung in einem dynamischen Modellrahmen mit Lagstruktur weitergehende Einsichten. Für die empirische Analyse ist der südamerikanische Kontinent ein geeignetes Studienobjekt. Viele südamerikanische Länder haben während der letzten zwei Jahrzehnte Reformen durchgeführt und sind dabei verschiedenen Ansätzen gefolgt. Oft wurde eine geringe Geschwindigkeit bei der Verabschiedung von Reformen gewählt, sodass einzelne Reformen separat analysiert werden können. Weiterhin sind sowohl Haushaltskunden- als auch Industriepreise verfügbar. Dies ermöglicht den Vergleich mehr oder weniger preissensitiver Kunden sowie die Untersuchung von Verteilungswirkungen. Insbesondere die negativen kurzfristigen Wirkungen der eigentumsrechtlichen Entflechtung werden durch die anschließenden positiven Auswirkungen ungefähr aufgewogen. Der nicht-diskriminierende Netzzugang hingegen erlaubt ähnliche Vorteile, ohne jedoch im gleichen Umfang teure Restrukturierungskosten tragen zu müssen. Bisher verwendete statische Modelle scheinen deshalb an Verzerrungen aufgrund nicht im Modell enthaltener Variablen oder Endogenitätsproblemen statischer, nicht-differenzierter Modelle zu leiden.
Static vs. Dynamic Impacts of Unbundling
– Electricity Markets in South America1
DOMINIK SCHOBER
ZEW Centre for European Economic Research, MaCCI, and Chair for Management Science and Energy Economics,
ZEW (L7,1, 68161 Mannheim); University of Duisburg-Essen (Universitätsstr.11, 45117 Essen)
+49 - (0) 621 / 1235 385
www.zew.de
Abstract Ownership unbundling and third party access are discussed as two options of unbundling in both the literature and political discussions. Focusing on the South American electricity sector, I contrast static and dynamic impacts of ownership unbundling and third party access regimes on customer prices. Substantially different results are found using dynamic rather than static analysis. In particular, negative short term effects of ownership unbundling found in static models are approximately cancelled out by subsequent positive impacts in the dynamic model. Third party access seems to allow for similar benefits while avoiding the (restructuring) costs of ownership unbundling. Previously estimated static models thus appear to suffer from either omitted variable biases or endogeneity problems of static non-difference models.
Keywords
(de)regulation, dynamic panel data analysis, electricity markets, market organization, unbundling, non-discriminatory (third party) access
JEL-Classification: L42, L51, L52, L94
1 I want to thank Gert Brunekreeft, Christian Growitsch, Sven Heim, Kai Hüschelrath, Thomas Nowakowski, Bettina Peters, Michael
Pollitt, Claudia Schmiedeberg, Stephan Schmitt, Christoph Weber, Oliver Woll and the participants of the EEM-, CRNI- and WIP-conferences for their invaluable support. I also want to thank the Helmholtz Foundation Alliance “ENERGY-TRANS” for the financial support.
1
1 INTRODUCTION
There is an intensive debate among academics as well as policymakers on which of the two options of unbundling, either ownership unbundling or non-discriminatory third party access, is more appropriate to foster competition and thus achieve efficient market outcomes. Whereas non-discriminatory third party access to grids and networks comprises softer forms of unbundling as informational, organizational or legal unbundling, ownership unbundling of monopolistic bottlenecks from potentially competitive value chain levels represents a much stronger approach. On the one hand, a consensus has been reached on the general advantageousness of implementing a non-discriminatory third party access regime. On the other, economists still disagree on the closely related political measure of ownership unbundling. Theoretical arguments concerning this strict form of separation are ambiguous as ownership unbundling may involve substantial restructuring costs before reducing prices in subsequent competition. The net effect is unclear a priori. In contrast, third party access might save restructuring costs but, if ineffective, leave efficiency potentials unexploited. Given these theoretical trade-offs an empirical investigation is indispensable in order to clarify whether softer measures like legal unbundling or independent transmission system operation are sufficient to make efficient operation in potentially competitive segments possible. In this article, the relative benefits of both options are investigated in static as well as in dynamic models. In prior studies, static approaches have been used to examine the effects of the measures on efficiency, prices, and distributional consequences. Market reforms, however, often induce slow adaptation processes or even reversal of initial trends after some time. Effectiveness of reforms is thus not easily measurable. A prominent example in this context is the British restructuring and privatization process. Only after several supplementary reforms competition in the wholesale electricity market started to work efficiently.2 These additional measures included for example the sale of capacity or a temporary imposition of price-caps at the generation level. Against this background, a dynamic framework which takes such lags into account may offer deeper insight. For the empirical analysis, the South American continent seems to be a suitable object of study, since many countries introduced regulatory reforms during the past two decades, following diverse routes3. Law giving bodies have often chosen a moderate reform speed so that effects can be traced back to separate policy causes. Furthermore, residential and industrial customer prices are disposable, which allows comparing more and less price sensitive customer groups as well as redistributive tendencies. The article proceeds as follows: After a short method review over the different commonly used approaches to policy evaluation and an overview of literature on regulatory policy evaluation in the electricity sector in section 2, the dataset is described in section 3. The chosen empirical methods and model specifications are discussed in section 4. Section 5 comprises regression results and addresses reform impacts on industrial and residential prices as well as distributional effects. The last section draws main conclusions and gives an outlook.
2 Cf. Newbery and Pollitt (1997). 3 This makes it easier to identify statistically the effects of reforms compared to an analysis of EU countries. In EU countries a large
proportion of the reforms has been triggered by the EU directives and occurred at similar points in time. Thus it is difficult to separate their effects from other simultaneously occurring events, for example macroeconomic downturns.
2
2 Methodological Approaches and Literature review
2.1 Methods Several approaches have been applied to analyse the success of political reforms. First, the financial performance of companies undergoing certain change can be measured directly. Second, productivity changes can be examined employing total factor productivity approaches (TFP). Third, frontier methods (FM) are an advancement in reference to TFP measures as they permit to distinguish between technical and efficiency change. Lastly, the success of reforms can be evaluated using societal cost benefit analysis. The main merits and weaknesses of these approaches are briefly evoked in the following in order to provide a framework for the assessment of own achievements.4 The first methodological approach, profitability measurement, does not consider possible allocative inefficiencies but just takes financial data to judge the success of policies. TFP and FM use input-output ratios to examine efficiency gains. Whereas in theory this allows to examine allocative effects of the reform and the analysis of the resulting distributional changes, TFP and FM have weaknesses in making historical data comparable. This mainly concerns the share of capital costs. Most of the empirical literature tries to circumvent this problem by choosing physical proxies for capital costs. These are in most cases weak substitutes for (standardized) monetary values and thereby a source of substantial distortion. Contrarily, societal cost benefit analysis alleviates most comparability problems coming from historical data. This method takes companies with their particular history as given and tries to find an appropriate counterfactual to compare it with the actual development after reform. However, this requires substantial assumptions as a high degree of uncertainty on the counterfactual’s appropriateness exists. These comprise hypotheses on firm behavior, including the potential degree of competitive pressure or future asset replacement strategies as well as hypotheses on governmental comportment such as taxation policy. It should be mentioned that in empirical analysis finding an adequate “counterfactual” in the form of comparable companies is also a demanding task. Even if companies are satisfyingly similar regarding accounting procedures and data, distortions are still possible. One may cite as exemplary the fact that countries often privatize those state owned entities which already produce quite efficiently.5 This may cause further distortion leading to a misinterpretation of results.
2.2 Literature on electricity policy reform
Applied research on electricity sector reforms is quite extensive on some of the policy issues discussed in this article and mostly regroups under one of the above described methods. I will draw on important work for this article as well as on more recent studies and summarize their main conclusions.
4 For the following discussion cf. for example Coelli et al. (2005). 5 Cf. Zhang et al. (2008). In a similar way in the aftermath of the restructuring of the British Central Electricity Generating Board, the
government only sold the more modern nuclear power plants (as British Energy) and kept the elderly ones in public ownership, cf. Newbery and Pollitt (1997).
3
Ownership unbundling and third party access Pollitt (2008) gives a detailed and profound discussion of advantages and drawbacks of unbundling. Among the most important drawbacks of ownership unbundling, he finds transaction costs at the introduction stage and higher costs of capital due to an increasing risk. On the other hand the scope for discrimination against non-integrated rivals reduces, thereby promoting competition. Among the other factors, security of supply, synergy effects, and the facilitation of privatization rank lower in importance. All of these effects may have positive as well as negative impacts, however, usually to different degrees. Steiner (2000) empirically analyzes the effects of unbundling6, third party access, and privatization on electricity end user prices and different efficiency proxies in 19 OECD countries. Results of her examination of reform impacts on end user prices strongly support the hypothesis that the introduction of a wholesale market lowers prices, whereas private ownership increases electricity prices. Unbundling and third party access were found to have no significant influence. This is contrasted by a second regression of a domestic/industrial customer price ratio on regulatory variables. Here, unbundling, third party access, and the spot market introduction variable were significant. Regarding influences on efficiency, Steiner (2000) uses the average capacity utilization rate and reserve margins as proxies. In this specification only unbundling and privatization are significant. It should be mentioned that the average capacity utilization-proxy can lead to distortion between countries. There is a natural difference between those countries which are predestined for technologies such as water and wind power with usually low full load hours and those countries with high average capacity utilization rates because of a dependence on coal or nuclear technologies. In South America most countries have a substantial share of water power, which can rise to a (nearly) 100%-share for some countries. Under these circumstances weather will have a much greater influence than the competitiveness of the market. This makes it difficult to correctly incorporate the capacity utilization rate as a proxy for efficiency in an empirical analysis. The same problems can arise for the reserve margin proxy. Hattori and Tsutsui (2004) re-examine the results Steiner obtained in her study and mirror these in an analogous estimation on the basis of a similar, but longer data set. In some cases the coefficients’ signs of their regulatory variables contradict the ones of Steiner (2000). Effects of spot market introduction and privatization are reverse to the analysis of Steiner (2000) – for the former positive and for the latter negative. Hattori and Tsutsui (2004) put forward market power as a possible explanation for price increases due to the introduction of spot markets. They further show unbundling to have an increasing and third party access to have a decreasing impact on end prices. Copenhagen Economics (2005) examine diverse electricity and gas sector reforms in a study for the DG Internal Market. In a more sophisticated approach Copenhagen Economics first conduct a principal component analysis to find the composite variables explaining most of the variance. In the following regression analysis they obtain a negative significant influence for ownership unbundling on end user prices with regard to electricity. This result is not confirmed for their gas market analysis. Growitsch and Stronzik (2008) chose a dynamic estimation approach regarding the
6 The unbundling variable regroups all kinds of unbundling from accounting to ownership unbundling.
4
endogenous (price) variable, but dismiss the chance of carrying the analysis further to check for the influence of lagged exogenous (reform) variables. The focus of their analysis is the possible effects of ownership unbundling on end user prices. They see no significant influence of ownership unbundling in this static approach, but liberalization seems to have a price decreasing impact. Third party access does not seem to have a significant influence. More recent work has been conducted by Nagayama (2007, 2009) and Erdogdu (2011). Nagayama (2007) uses a panel of 83 countries and finds various reform variables to differ substantially in their impact on prices and to lead to partially unintuitive results. His results indicate that unbundling in combination with a regulatory agency may lead to lower prices, whereas unbundling alone might not. However, he does not further differentiate his unbundling variable, which covers legal and stronger forms of unbundling. Nagayama (2009) uses a single reform variable to analyze the impacts of, first, prices on the choice of the reform model, and, second, the reform model on price. By the means of a multinomial discrete choice model, he shows that prices may have an influence on the choice of the reform model. Surprisingly, for some considerable part of his sample, reforms had the tendency to increase consumer prices. Erdogdu (2011) investigates a compound unbundling variable. One of his main results is that unbundling has a positive effect when investigated separately and shows a decreasing influence when modeled as an interaction term with privatization or a regulator. He does not separate between ownership and softer forms of unbundling. In addition, the introduction of spot markets may have ambiguous effects on price-cost margins. For South America a price increasing tendency is found. From differences in impacts of regulatory reform activity between developed and developing countries the author concludes that successful models are not transferred easily between the two and that respective idiosyncrasies have to be taken into account. A recent, but broader contribution by Meyer (2012) reviews basic theoretical and some complementary empirical results.7 Empirical research so far has mostly considered simultaneous impacts of reforms on market prices in energy markets. For example Steiner (2000), Hattori and Tsutsui (2004), and Erdogdu (2011) use static approaches. Growitsch and Stronzik investigate the gas market with a lagged dependent variable model, but refrain from using distributed lags for reform variables of interest in addition. This analysis tries to fill this gap with respect to the analysis of electricity reforms, especially ownership unbundling and third party access, in South America. A different stream of research on the effects of unbundling uses simulation approaches. Newbery and Pollitt (1997) conduct a detailed societal cost benefit analysis of the British power producer and transmission operator CEGB. The restructuring was closely related to other reforms like privatization and market opening. They see high efficiency gains but also higher firms’ profits and losses by consumers in the restructuring process. De Nooij and Baarsma (2007) especially concentrate on a detailed analysis of costs and determine higher costs of an introduction of ownership unbundling than benefits for seven out of nine cases. The reference case is legal unbundling and the subject under study the Dutch distribution network. Brunekreeft (2008) instead focuses more on competition issues and employs a top-down analysis framework to German transmission system operators. He draws an opposite
7 For recent theoretical discussions of ownership versus legal or softer forms of unbundling cf. for example Höffler and Kranz (2011a,
2011b). They use sabotage models to explain the optimality of intermediate steps of unbundling. The other driving force is the increased supply with higher integration degrees leading to convexity of the problem. Cf. also Cremer et al. (2006), Mandy and Sappington (2007), Reitzes (2008).

5
conclusion and sees a small net benefit in switching from legal or functional to ownership unbundling. There are also single-country studies, one of which is by Nillesen and Pollitt (2008) on New-Zealand. Amongst others they support the conjecture of high transaction costs at the introduction stage together with decreasing unit operational costs. During the last years a lot of country case studies were published deepening the understanding and making an in-depth understanding of specific influences possible, which cannot be unveiled by statistical analysis employing typically crude proxies. Among these we find studies on prominent countries such as Argentina and Chile, but also Ecuador and many others.8 The tenor of these studies in most cases is in favor of divestiture of public firms and unbundling with a certain uncertainty of whether or not ownership unbundling has net benefits. A clearly positive aspect of these studies is that they can benefit of authors investigating alternative reasons for the failure of reforms, which sometimes are difficult to quantify and to consider in comparative econometric analyses. Yet on the other hand, case studies and qualitative analyses obviously only provide country-specific insights, no broader statistical evidence. Consequently, no clear evidence has been established so far on the effects of ownership unbundling vs. softer forms of unbundling and further investigations seem appropriate. Especially dynamic impacts depending on these different degrees of unbundling have not been analyzed yet. Further policy reforms A sort of consensus has by contrast been achieved on the effects of privatization. Megginson and Netter (2001) review the historical development, give an extensive overview of theoretical and empirical literature on the subject, discuss the pros and cons of privatization, characterize different sorts of privatization, and possible sources of efficiency and welfare gains of privatization. They conclude that effects of privatization depend very much on the political, regulatory, and economic environment. For example, privatization success would depend on specific factors like concentration rates (on generation or supply levels), public debt, etc. Zhang et al. (2008) have a similar view on privatization effects. They use different efficiency indicators to show that the relative importance of privatization is low relative to working competition. The analysis though is restricted to the generation level. Using frontier methods Berg et al. (2005) estimate the efficiency of privatized electricity distribution utilities in Ukraine showing that privatized utilities are significantly more efficient. Efficiency measures have also been used by Estache and Rossi (2005). They compare labour productivity of public firms under cost plus regulation to that of privately owned firms under rate of return and incentive regulation. They find rate of return regulated firms to be more efficient by trend. As expected, private firms under incentive regulation are most efficient. Their analyses lead to intuitively plausible results but cannot distinguish privatization from regulation effects and the regulatory framework seems to have a higher impact.9 A previous
8 Cf. Pollitt (2008), Pollitt (2004) and Peláez-Samamiego (2007). 9 By using physical measures for capital costs, shifts of operating to capital expenditure are not detected, but solely improvements in
labour productivity. In this case companies could replace assets, which influences their cost bases but not their physical asset base. For rate of return regulation, this pressure comes from the Averch-Johnson effect and for incentive regulation, under certain circumstances, firms will have the incentive to cut short run costs (labour) in non-photo years. As their sample is quite short, this can be problematic. Also, “a
6
study obtaining similar results has already been conducted by Kumbhakar and Hjalmarsson (1998). A more recent study by Cambini and Rondi (2010) focuses the interplay of regulation regimes and investment incentives in electricity distribution networks. They find higher incentives to invest for incentive regulation regimes. A very broad analysis on privatization, liberalization, unbundling, investment risk and some other key factors of reforms has been conducted by Bacon and Besant-Jones (2001). They confine themselves more or less to a discussion of these factors and highlight some of the difficulties in restructuring and reforming electricity sectors in developing countries. Among these are the ambiguous effects of privatization and its dependence on accompanying circumstances like market regulation. The authors conclude that only if investors have sufficient certainty about future returns will they invest and in turn increase competition. Another issue, which has given rise to some debate, is the independence of regulatory bodies. Whereas Posner (1975) emphasizes possible negative consequences of rent seeking behavior, Becker (1983) argues that interest group competition favors efficient taxation. Campos (1989) shows that the choice of the political instrument is important to obtain efficient market outcome. Legislators usually maximize own expected median net present value (including influence of pressure groups) but not possible maximum social welfare. Consequently, they are prone to choose a suboptimal instrument at the first level. This can prohibit welfare optimal outcomes at a second stage. In a situation where the choice is between tariff regulation either by an independent agency or by a ministry, there seems to be a danger that well-organized (and endowed) pressure groups support the choice of the latter instrument. They then could uphold their influence on politicians in the ministries on second stage welfare distribution, for example in price regulation processes. Independent agencies contrarily should be less exposed to current policy and consequently should tend to pursue a once defined mandate more rigorously and mitigate second stage influence. Mostly these mandates pursue goals of more efficient operation and price decreases to make customers better off and to increase welfare. As a consequence, under the hypothesis that legislators are able to define an optimal mandate once, independent agencies may lead to decreasing prices. On the other hand, evidence supports the impression that agencies are also subject to substantial political influence. Empirical literature dealing specifically with electricity regulation is scarce. Zhang et al. (2008) report relatively low importance of an independent regulatory agency on efficient behaviour of generating companies. Nevertheless, general theory suggests political influence on the second stage decision process to be more pronounced in ministries than in separate agencies. Under these circumstances decreasing prices (and thereby assumed welfare gains) from independent authorities are imaginable, but, as already mentioned, empirical analysis is still scarce. Under comparable conditions, a systematic impact is also expected from different price regulation methods.10 In contrast, evidence from a lot of countries shows that both the choice of regulatory asset bases and the definition of hard external price targets are often determined by political awareness and pressure, and rather independent of the form of price regulation. This can also lead to low (and even lower) prices in cost based regimes when compared to
measure of labour productivity gives little indication about efficiency in a capital-intensive sector like electricity.” (Zhang et al. (2008), Bacon and Besant-Jones (2001))
10 Cf. Estache and Rossi (2005)
7
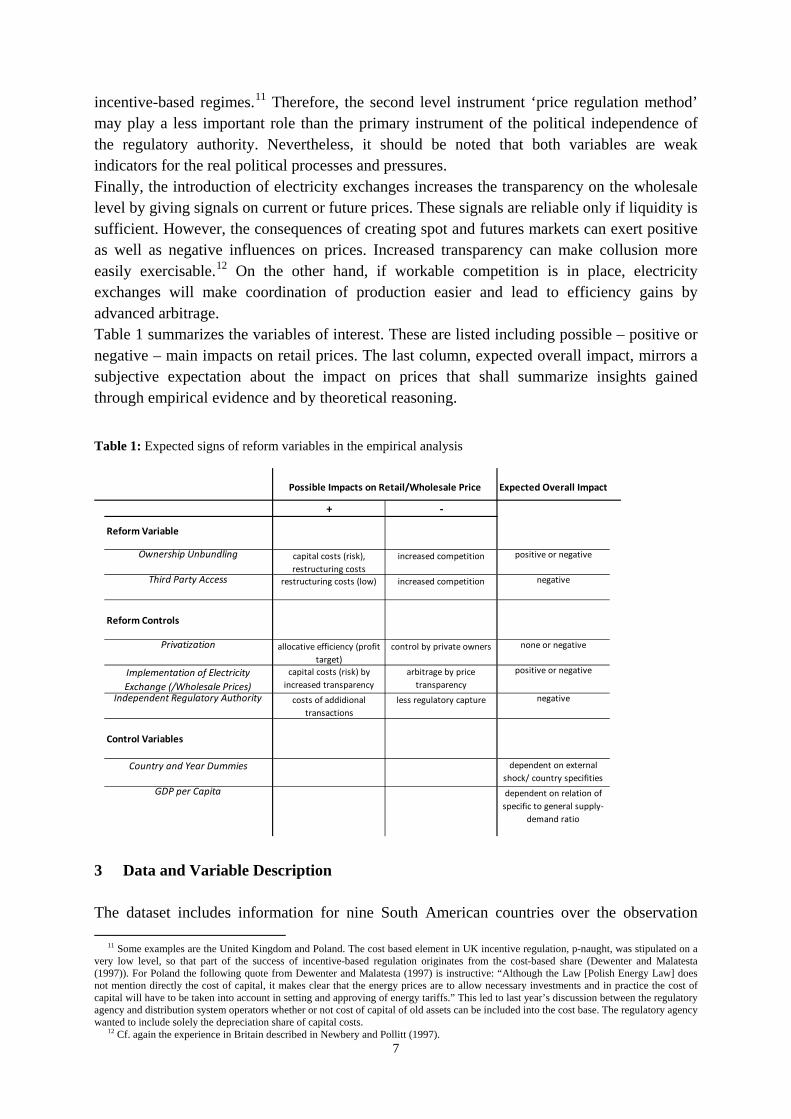
incentive-based regimes.11 Therefore, the second level instrument ‘price regulation method’ may play a less important role than the primary instrument of the political independence of the regulatory authority. Nevertheless, it should be noted that both variables are weak indicators for the real political processes and pressures. Finally, the introduction of electricity exchanges increases the transparency on the wholesale level by giving signals on current or future prices. These signals are reliable only if liquidity is sufficient. However, the consequences of creating spot and futures markets can exert positive as well as negative influences on prices. Increased transparency can make collusion more easily exercisable.12 On the other hand, if workable competition is in place, electricity exchanges will make coordination of production easier and lead to efficiency gains by advanced arbitrage. Table 1 summarizes the variables of interest. These are listed including possible – positive or negative – main impacts on retail prices. The last column, expected overall impact, mirrors a subjective expectation about the impact on prices that shall summarize insights gained through empirical evidence and by theoretical reasoning.
Table 1: Expected signs of reform variables in the empirical analysis
3 Data and Variable Description The dataset includes information for nine South American countries over the observation
11 Some examples are the United Kingdom and Poland. The cost based element in UK incentive regulation, p-naught, was stipulated on a very low level, so that part of the success of incentive-based regulation originates from the cost-based share (Dewenter and Malatesta (1997)). For Poland the following quote from Dewenter and Malatesta (1997) is instructive: “Although the Law [Polish Energy Law] does not mention directly the cost of capital, it makes clear that the energy prices are to allow necessary investments and in practice the cost of capital will have to be taken into account in setting and approving of energy tariffs.” This led to last year’s discussion between the regulatory agency and distribution system operators whether or not cost of capital of old assets can be included into the cost base. The regulatory agency wanted to include solely the depreciation share of capital costs.
12 Cf. again the experience in Britain described in Newbery and Pollitt (1997).
Reform Variable
Ownership Unbundling
Third Party Access
Reform Controls
Privatization
Independent Regulatory Authority
Control Variables
Country and Year Dummies
GDP per Capita
+ -
dependent on external shock/ country specifities
dependent on relation of specific to general supply-
demand ratio
Expected Overall Impact
Implementation of Electricity Exchange (/Wholesale Prices)
positive or negative
negative
none or negative
positive or negative
negative
arbitrage by price transparency
less regulatory capture
capital costs (risk), restructuring costs
restructuring costs (low)
allocative efficiency (profit target)
capital costs (risk) by increased transparency
costs of addidional transactions
increased competition
increased competition
control by private owners
Possible Impacts on Retail/Wholesale Price
8
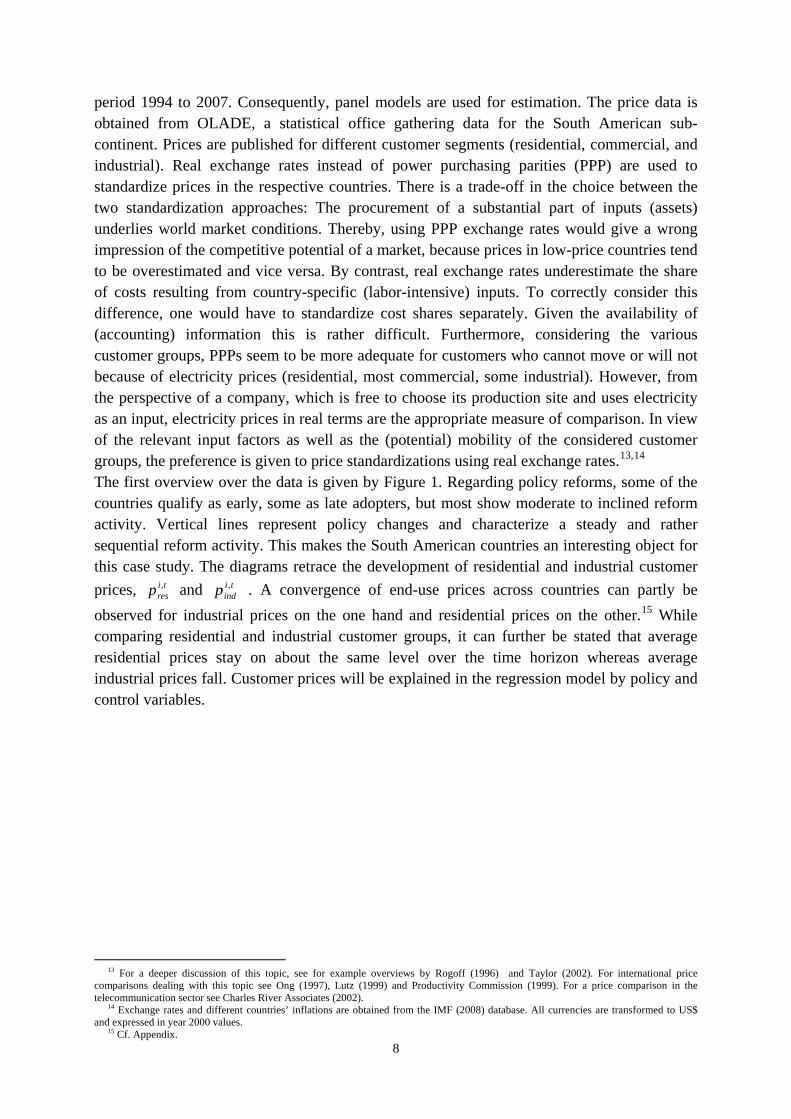
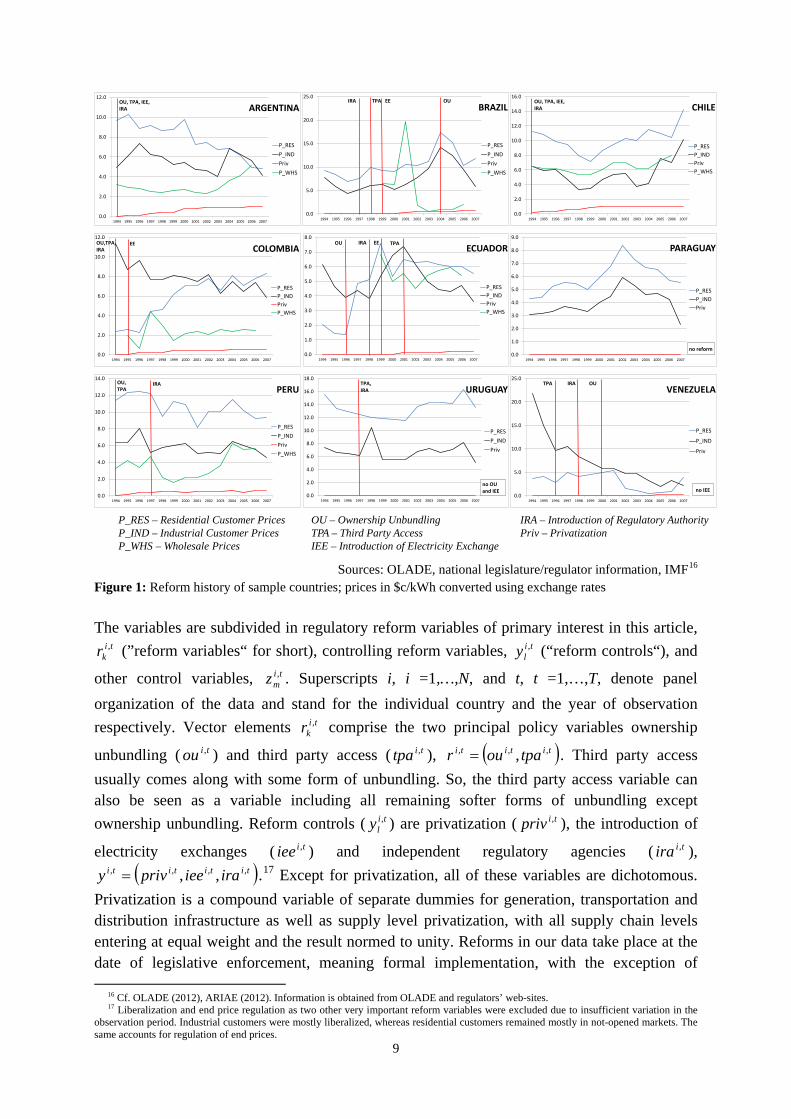
period 1994 to 2007. Consequently, panel models are used for estimation. The price data is obtained from OLADE, a statistical office gathering data for the South American sub-continent. Prices are published for different customer segments (residential, commercial, and industrial). Real exchange rates instead of power purchasing parities (PPP) are used to standardize prices in the respective countries. There is a trade-off in the choice between the two standardization approaches: The procurement of a substantial part of inputs (assets) underlies world market conditions. Thereby, using PPP exchange rates would give a wrong impression of the competitive potential of a market, because prices in low-price countries tend to be overestimated and vice versa. By contrast, real exchange rates underestimate the share of costs resulting from country-specific (labor-intensive) inputs. To correctly consider this difference, one would have to standardize cost shares separately. Given the availability of (accounting) information this is rather difficult. Furthermore, considering the various customer groups, PPPs seem to be more adequate for customers who cannot move or will not because of electricity prices (residential, most commercial, some industrial). However, from the perspective of a company, which is free to choose its production site and uses electricity as an input, electricity prices in real terms are the appropriate measure of comparison. In view of the relevant input factors as well as the (potential) mobility of the considered customer groups, the preference is given to price standardizations using real exchange rates.13,14 The first overview over the data is given by Figure 1. Regarding policy reforms, some of the countries qualify as early, some as late adopters, but most show moderate to inclined reform activity. Vertical lines represent policy changes and characterize a steady and rather sequential reform activity. This makes the South American countries an interesting object for this case study. The diagrams retrace the development of residential and industrial customer prices, ti
resp , and tiindp , . A convergence of end-use prices across countries can partly be
observed for industrial prices on the one hand and residential prices on the other.15 While comparing residential and industrial customer groups, it can further be stated that average residential prices stay on about the same level over the time horizon whereas average industrial prices fall. Customer prices will be explained in the regression model by policy and control variables.
13 For a deeper discussion of this topic, see for example overviews by Rogoff (1996) and Taylor (2002). For international price
comparisons dealing with this topic see Ong (1997), Lutz (1999) and Productivity Commission (1999). For a price comparison in the telecommunication sector see Charles River Associates (2002).
14 Exchange rates and different countries’ inflations are obtained from the IMF (2008) database. All currencies are transformed to US$ and expressed in year 2000 values.
15 Cf. Appendix.
9
Sources: OLADE, national legislature/regulator information, IMF16
Figure 1: Reform history of sample countries; prices in $c/kWh converted using exchange rates The variables are subdivided in regulatory reform variables of primary interest in this article,
tikr
, (”reform variables“ for short), controlling reform variables, tily , (“reform controls“), and
other control variables, timz , . Superscripts i, i =1,…,N, and t, t =1,…,T, denote panel
organization of the data and stand for the individual country and the year of observation respectively. Vector elements ti
kr, comprise the two principal policy variables ownership
unbundling ( tiou , ) and third party access ( titpa , ), ( )tititi tpaour ,,, ,= . Third party access usually comes along with some form of unbundling. So, the third party access variable can also be seen as a variable including all remaining softer forms of unbundling except ownership unbundling. Reform controls ( ti
ly , ) are privatization ( tipriv , ), the introduction of
electricity exchanges ( tiiee , ) and independent regulatory agencies ( tiira , ), ( )titititi iraieeprivy ,,,, ,,= .17 Except for privatization, all of these variables are dichotomous.
Privatization is a compound variable of separate dummies for generation, transportation and distribution infrastructure as well as supply level privatization, with all supply chain levels entering at equal weight and the result normed to unity. Reforms in our data take place at the date of legislative enforcement, meaning formal implementation, with the exception of
16 Cf. OLADE (2012), ARIAE (2012). Information is obtained from OLADE and regulators’ web-sites. 17 Liberalization and end price regulation as two other very important reform variables were excluded due to insufficient variation in the
observation period. Industrial customers were mostly liberalized, whereas residential customers remained mostly in not-opened markets. The same accounts for regulation of end prices.
P_RES – Residential Customer PricesP_IND – Industrial Customer PricesP_WHS – Wholesale Prices
0.0
2.0
4.0
6.0
8.0
10.0
12.0
1994 1995 1996 1997 1998 1999 2000 2001 2002 2003 2004 2005 2006 2007
ARGENTINA
P_RESP_INDPrivP_WHS
OU, TPA, IEE, IRA
0.0
5.0
10.0
15.0
20.0
25.0
1994 1995 1996 1997 1998 1999 2000 2001 2002 2003 2004 2005 2006 2007
BRAZIL
P_RESP_INDPrivP_WHS
IRA TPA OUEE
0.0
2.0
4.0
6.0
8.0
10.0
12.0
14.0
16.0
1994 1995 1996 1997 1998 1999 2000 2001 2002 2003 2004 2005 2006 2007
CHILE
P_RESP_INDPrivP_WHS
OU, TPA, IEE, IRA
0.0
2.0
4.0
6.0
8.0
10.0
12.0
1994 1995 1996 1997 1998 1999 2000 2001 2002 2003 2004 2005 2006 2007
COLOMBIA
P_RESP_INDPrivP_WHS
OU,TPA,IRA
EE
0.0
1.0
2.0
3.0
4.0
5.0
6.0
7.0
8.0
1994 1995 1996 1997 1998 1999 2000 2001 2002 2003 2004 2005 2006 2007
ECUADOR
P_RESP_INDPrivP_WHS
IRA TPAOU EE
0.0
1.0
2.0
3.0
4.0
5.0
6.0
7.0
8.0
9.0
1994 1995 1996 1997 1998 1999 2000 2001 2002 2003 2004 2005 2006 2007
PARAGUAY
P_RESP_INDPriv
no reform
0.0
2.0
4.0
6.0
8.0
10.0
12.0
14.0
1994 1995 1996 1997 1998 1999 2000 2001 2002 2003 2004 2005 2006 2007
PERU
P_RESP_INDPrivP_WHS
OU, TPA
IRA
0.0
2.0
4.0
6.0
8.0
10.0
12.0
14.0
16.0
18.0
1994 1995 1996 1997 1998 1999 2000 2001 2002 2003 2004 2005 2006 2007
URUGUAY
P_RESP_INDPriv
TPA, IRA
no OU and IEE
0.0
5.0
10.0
15.0
20.0
25.0
1994 1995 1996 1997 1998 1999 2000 2001 2002 2003 2004 2005 2006 2007
VENEZUELA
P_RES
P_IND
Priv
IRA TPA OU
no IEE
OU – Ownership UnbundlingTPA – Third Party AccessIEE – Introduction of Electricity Exchange
IRA – Introduction of Regulatory AuthorityPriv – Privatization
10
electricity exchanges because the dates of actual implementation are easily verifiable. For all of the former variables, some observation error due to unobserved heterogeneity is inevitable. For example, effective implementation can be delayed as compared to formal implementation. Also, it is difficult to trace the date of actual implementation as processes are often highly structured (with sometimes strong effects resulting from small steps) and some arbitrary judgement may occasionally be needed to define whether a certain degree corresponds to full implementation. Hence, incorporated judgement and classification in the construction of regulation variables will necessarily lead to a certain error given the specificity of and heterogeneity among countries. Further, sources of unobserved heterogeneity problems may stem from varying conditions in the economic environment. For example, the effects of the introduction of unbundling will strongly depend on the production structure at that time. A monopolistic or tight market may need much longer before profiting from an unbundled regime than a market with a fragmented structure. The use of variables accounting for all such eventualities is fairly impossible against the background of data restrictions. Also an omitted variables problem may be relevant. This might lead to the usual inconsistency and a bias of coefficient estimates. An example is an idiosyncratic and invariable production structure correlated with some regulation path. For example, the potential of countries to build cheap water power plants is restricted by environmental conditions. These factors are taken into account by the fixed-effects model with country and time specific fixed effects.18 Country-specificities are, for example, the production structure or different quality of service levels. The full set of time dummies instead of a trend variable is used to account for macroeconomic shocks and special common influences to all countries, for example technological change. In addition to these fixed effects, the gross domestic product is used as a control variable. Hausman tests also strongly indicate the use of country-specific dummies.19 Control variables
timz , therefore include individual dummies ( ti,α ), time dummies ( td ) and the gross domestic
product per capita (gdppc), ( )tittiti gdppcdz ,,, ,,α= .
4 EMPIRICAL ESTIMATION STRATEGY
Static and dynamic impacts of reforms
The main contribution of this article is contrasting static and dynamic impacts of reforms. Accordingly, both static and dynamic regression models are applied.
The naïve static regression model in this article takes the following form.
∑ ∑∑≤≤ ≤≤≤≤
++++=21
,
31
,
31
,,0
,
k
ti
m
timm
l
till
tikk
ticust zyrp εδγββ , (1)
For the left hand side variable ticustp , both industrial and residential customer prices (net of the
18 This model specification is given preference over the use of generation shares as explanatory variables as done by Steiner (2000) and
Hattori and Tsutsui (2004). Against the background of high water proportions in generation and heterogeneous levels across countries, additional variables for example considering stronger weather influences on prices would have to be included. To correctly model price formation processes, further factors and endogenous decision processes would have to be included. As this would lead to substantial complications and incur data restrictions, fixed country effects are retained here as they may cause less distortion than solely modelling shares of water generation capacity. This could be a direction for future research.
19 The results of this and the following tests of model specification can be obtained from the author upon request.
11
state induced price share) are used to contrast results of different variable and model specifications used in prior research with results of dynamic analysis by lagged models.20 Models found in prior research mostly include formulations in level equations and logarithmic price transformations. The latter are often used to deal with multicollinearity problems. I further compare a model formulation in first-differences to cope with multicollinearity in the static regression framework. Variance inflation factors (VIFs) usually exceed the critical value of 10. A further indication for this problem and especially for serial correlation problems is that Durbin-Watson statistics are significant and Breusch-Pagan-tests show very high significance. Therefore, a first step consists in estimating the static models using the Baltagi and Wu transform of the original data that removes the AR(1) component. This transformation builds on ρ , the correlation coefficient from the formula specifying the error
component assumption tititi ,1,, υρεε += − with ti,υ i.i.d. and ),0( 2υσN . In a second step
further transformations are implemented with the intention of completely removing multicollinearity problems. One usual way to cope with this problem is using the logarithmic transformations of prices and estimating a semi-log model. Though this is quite common, it is implicitly assumed that the different levels of the value chain are multiplicatively composed. This is obviously not true for additive costs for example in the case of electricity production, considering the sum of generation, transportation, distribution and retail cost. The specification using first differences is implemented as a more appropriate option to control for detrimental effects of multicollinearity.21 Durbin-Watson statistics indicate no problems with autocorrelation and VIFs fall significantly below a level of 10.22 The corresponding static models for the semi-log and the first-difference specifications are
∑ ∑∑≤≤ ≤≤≤≤
++++=21
,
31
,
31
,,0
,lnk
ti
m
timm
l
till
tikk
ticust zyrp εδγββ (2)
and
∑ ∑∑≤≤ ≤≤≤≤
+∆+∆+∆+=∆21
,
21
,
31
,,0
,
k
ti
m
timm
l
till
tikk
ticust zyrp εδγββ . (3)
In the second model, the number of further control variables z decreases as country-specific effects vanish due to differencing. The degrees of freedom of the estimation do not change due to this transformation, because one year of observation is lost (N country variables), but country effects vanish (N country variables).
Taking into account dynamic effects, the static regression model in differences is extended to a distributed lag model complementing the regression equation for two lags in reform variables.23,24
ti
m
timm
l
till
k
tikk
ticust zyrp ,
21
,
31 31
1,
21 31
1,0
, εδγββθ
θθ
θ
θθ ∆+∆+∆+∆+=∆ ∑∑ ∑∑ ∑≤≤≤≤ ≤≤
+−
≤≤ ≤≤
+− (4)
Apart from serial correlation in error terms, common panel unit root tests proposed by Levin, Lin and Chu (2002) (LLC) and Im, Pesaran and Shin (2003) (IPS) indicate problems with
20 Cf. Steiner (2000), Hattori and Tsutsui (2004), Nagayama (2009), or Erdogdu (2011). 21 Cf. Cameron and Trivedi (2005). 22 Specifications without AR(1)-term and using White’s robust variance-covariance matrices correcting for heteroscedasticity and
autocorrelation yield similar significance results. 23 Including further lags did not lead to significance of longer lags implying dynamic completeness (cf. Wooldridge (2010)). 24 Distributed lag models are estimated using White’s heteroscedasticity consistent covariance matrices (cf. Wooldridge (2010)).
12
integration (cf. Table 3). Model (4) modified to incorporate differenced endogenous lagged dependent variables then takes the following form. The lagged endogenous variable enters up to limit Θ .
ti
m
timm
l
till
k
tikk
ticustp
ticust
z
yrppcust
,
21
,
31 31
1,
21 31
1,
1
1,0
,
εδ
γβββθ
θθ
θ
θθ
θ
θθ
∆+∆+
+∆+∆+∆+=∆
∑
∑ ∑∑ ∑∑
≤≤
≤≤ ≤≤
+−
≤≤ ≤≤
+−
Θ≤≤
+−
(5)25
The LLC then tests the null hypothesis that individual coefficients θβ ,ipcust
are identical and
smaller one for all individuals ( 1...: ,,10 <=== θθθ βββ
custcustcust pNppH ). This is similar to the usual
Augmented Dickey Fuller test. The IPS in contrast averages single tests (1,...,1: ,,1
0 << θθ ββ Npp custcust
H ). The underlying implicit hypothesis is that an autoregressive
influence might distort estimation results. This is the case when prices partially move independently of observed fundamental changes and remain on similar levels as in the preceding period due to some inertia. Model specifications in section 5 differ with respect to limit Θ , which is determined dependent on autoregression statistics.
Equations (4) and (5), more generally depict an important difference compared to previous studies. The dynamic analysis makes possible flaws of these studies transparent, which solely consider static, simultaneous impacts of reforms.
The basic estimation technique of equation (5) including lagged dependent variables goes back to Anderson and Hsiao (1981). The authors propose to take first differences to avoid serial correlation of fixed effects iα with the error term iε and then to use first lags of occurring endogenous variables, for example lagged dependent variables, as instruments to avoid correlation of the remaining regressors with the error term as well.26 Despite using endogenous dependent variables consistent estimates of coefficients can be obtained. Endogeneity problems arise because 2,1,1, −−− −=∆ tititi ppp is correlated with the following
period’s error term 1,,, −−=∆ tititi εεε . 1, −tip as well as 1, −tiε are both contained in the
regression equation, which leads to inconsistent coefficient estimates as 0][ 1,1, ≠−− titipE ε .
Instrumenting 1, −tip by 2, −tip will circumvent this problem as 0][ 1,2, =−− titipE ε . Also, weak
exogeneity of regressors θ−∆ tikr
, , θ−∆ tily , (k=1,2; l=1,…,3; θ =0,1,2) and tiz ,∆ is assumed,
which already derives from the fact that the regressors are merely crude categorical variables. Thereby, additional moment conditions of the form
and,0][,0][ ,,,, =∆∆=∆∆ −− tisil
tisik yErE εε θθ ,,...,1,,0][ ,, TttszE tisi =≤=∆∆ ε can be
imposed for (k=1,2; l=1,…,3; θ =0,1,2). Based on these additional moment conditions, the instrumental variable panel GMM estimator proposed by Arellano and Bond (1991) is used,
25 Equations (1) and (2) are well-defined for i=1,…,N and t=1,…,T, whereas (3) is well-defined for t=2,…,T. (4) and (5) are well-defined
for t=4,…,T. 26 This is also known as pre-determination of variables. Cf. Wooldridge (2010).
13
which includes additional lags of the instruments increasing the efficiency of estimation.27 Regressors θ−∆ ti
kr, , θ−∆ ti
ly , (k=1,2; l=1,…,3; θ =0,1,2) and tiz ,∆ remain in the regression as well. As over-identification of the model might become a problem, the inclusion of instruments has been tested by the usual Sargan test. Results indicate no over-identification problem. In three subsets of regressions, industrial, residential prices and the difference between residential and industrial prices are taken as dependent variables. The results of the industrial customer group shall be mirrored against the ones of the residential customer group to see whether both groups are equally affected by reforms. The price difference is used to examine whether redistribution takes place as a consequence of single reforms. Selection Bias A particular problem in the context of this analysis is the potential selection bias. For example, Nagayama (2009) found partially strong dependence of the choice of the regulatory model on recent price changes and thus identified possible selection problems. If some kind of pre-selection process systematically influences reform success, estimation results of equations (1) to (5) might be distorted. To assess the relevance of the endogeneity problem of reform probability and electricity prices a bivariate sample selection model is estimated.28 A selection bias is conjectured to exist regarding reform success measured by the impact of the reform on electricity prices. Due to a possible correlation between the success of reform activity and the motivation to conduct a reform based on, for example, the quality of the reformer, the observed reform impacts might be biased. A good reformer might be more inclined to reform and then have greater success, or, the other way round, a bad reformer might suffer more political pressure and end up with less success in the reform’s execution.29 Similar to Zhang et al. (2008), prices might serve as a proxy for the quality of the reformer. They assume lower prices prior to the reform to serve as a signal for a more efficient regulator being interested in low prices already before the reform and therefore being more active and more successful in the reform activity of interest.30 She can, for example, engage in additional measures like structural interventions in new built decisions or permission of cost coverage or subsidization. In contrast, price levels might exhibit a certain pressure on regulators to undertake reforms. Such an unsuccessful regulator, who is not interested in low prices, might be reluctant and less successful in her reform activity. Of course, the argumentation may be reversed, when the continuity assumption of the regulator is abandoned. A replacement of the inefficient by a more efficient regulator in the high price scenario might as well lead to high reform impacts, whereas an efficient regulator in the low price scenario might feel less pressure to engage in the reform activity. Reforms, however, could thus have systematically different impacts depending on the sample investigated. Therefore the decision to undertake the reform measure is assumed to depend on the average
27 This is also known as stacking of instruments. Cf. Cameron and Trivedi (2005). 28 Cf. section 2.1. 29 For the following description of the methodology of sample selection models cf. Cameron and Trivedi (2005) or Wooldridge (2010). 30 Of course, one might argue the opposite way. High prices prior to the reform could serve as a signal for a less efficient regulator, but
could leave room for higher cost savings after the reform and despite the regulator’s quality.
14
price level before the reform in year R, the first variable ( ) ( )∑=<=
R
t
icustR
icust tpRtp
1
1 . First, the
hypothesis is proposed that lower prices ( )Rtpicust < induce inclined reform activity with
potentially greater subsequent reform success. As a consequence, for prices being below some individual limit value i
Lii
ixL εξ += in a random draw, a distortion of equations (1) to (5)
might occur. ix contains unobservable characteristics describing the regulator’s utility function, ξ is its
coefficient and iLiε the error term. For a random draw, the inequality
( ) iL
iiicust iLRtp εεζ +<+< then describes the condition for reform activity. Or, from a
different angle, the lower the price limit, the lower the regulator’s motivation for regulation activities and subsequent success should be.31 Simple transformation leads to
( ) 0<+−< iiicust vLRtp ζ with iv denoting the composed error term i
Li
iεε − .
We cannot measure the success of a reform ikr , which is described by induced ti
custp ,∆ , if the
reform has not been undertaken until to date. As we do not know iL we cannot use the observed ( )Rtpi
cust < directly to check for a selection bias. For example, if iL were observed
and exogenous and ( )Rtpicust < were always observed, a censored regression framework
would be the appropriate one. Alternatively, if iL were observed and exogenous and ( )Rtpi
cust < were observed when reform activity is observed, we would find ourselves in a
truncated regression framework. But, as iL is not observable the selection regression framework is appropriate. In summary, for ( )Rtpi
cust < being under a certain individual, country-specific price limit iL , a good regulator will be more inclined to unbundle or grant third party access, or also to introduce a wholesale market, representing the main variables of interest in this analysis.32 The selection equation is then represented by the indicator function for reform activity
( )[ ]01 <+−<= iiicust
ik vLRtpr ζ . To test the alternative hypothesis of a low quality regulator,
( )Rtpicust < is assumed to be strictly above limit iL .
( ) ( )( ) ( )
≤<≥<
><<<=
.0
,,1ii
custii
cust
iicust
iicusti
kLRtpifLRtpif
LRtpifelyalternativorLRtpifr (6)
Probit or logit estimation enables to ascertain the probability ( )ζicustpΦ of stepping forward
to reform activity given a certain price level. Then, if reform activity is chosen ( 1=ikr ), a
price effect is determined dependent on the success of the reform, which might be dependent on the quality of the regulator. The following two equations describe the model in which errors ti,ε might be correlated with
31 Cf. Wooldridge (2010), p. 560. 32 The emphasis on wholesale markets is justified by the fact that desired effects of increased competition may be induced by (additional)
transparency, thereby increasing allocation efficiency.
15
the errors of the selection model in equation (6), iv . A correlation of this form, i.e.
vvE ρε =)|( , would distort the general model by the inverse Mill’s ratio, the correction for
the conditional expected value ( ) ( )( )( )( )ζ
ζφζRtpRtpRtpvvE i
cust
icusti
custii
<Φ<
=<−> )|( . By the law
of iterated expectations this results in a necessary adaptation of regression equation (5).
( )( )( )( )( )k
icustk
kicustk
km
timm
l
till
k
tikk
ticustp
ik
ticust
ticust
RtpRtpzy
rprppEcust
ζζφρδγ
βββ
θ
θθ
θ
θθ
θ
θθ
ˆˆ
1,|
21
,
31 31
1,
21 31
1,
1
1,0
,,
<Φ<
+∑ ∆+∑ ∑ ∆+
+∑ ∑ ∆+∑ ∆+==∆
≤≤≤≤ ≤≤
+−
≤≤ ≤≤
+−
Θ≤≤
+−
(7)
for k=1,2,3 for the ownership unbundling reform, third party access reforms, and the introduction of wholesale markets respectively. kζ̂ are the estimates of the first stage regression. For the three different reforms we thus potentially have three inverse Mill’s ratios. The additional distorting effect on price changes caused by reforms, which is attributable to price levels, or (in other words) regulator’s quality, is then given by
=−
=∆=∆
.0
,1*,,
ik
ik
ticustti
cust rifrifp
p (8)
In the case that 0=ikr no meaningful interpretation of ti
custp ,∆ is possible with regard to reform
probability dependent on price levels. *,ticustp∆ denotes the latent variable measuring reform
success if it were observable throughout. An alternative model formulation is investigated if the reform has already been undertaken at the beginning of the inspection period. I refer to this case as case (b). The case described
beforehand – taking means before a reform takes place – is referred to as case (a). icustp then
denotes the mean over the whole period T, ( )∑==
T
t
icustT
icust tpp
1
1 .33 The selection equation is
then represented by [ ]01, >+−= iiicust
ibk vLpr ζ for case (b).34 ( )Rtpi
cust < from case (a) is
then analogously replaced by icustp in subsequent equations and inequalities (6) to (8). In
total six inverse Mill’s ratios are calculated and the corresponding coefficients kρ of equation (7) are obtained. As Table 2 shows, estimation of the whole model (7) suggests insignificance of sample selection problems. The coefficients kρ of the inverse Mill’s ratios are insignificant
throughout. A distortion of the coefficients of interest kβ is therefore unlikely and consistent estimates can be obtained. Results for ownership unbundling, third party access and the introduction of a wholesale market are depicted. Remaining results of the whole regression are contained in Table 4.
33 This is assumed to be reasonable, because the variables of primary interest are price changes and lagged price changes and not the new price levels after the reform.
34 ζ and iv in case a differs from ζ and iv in case b.
16
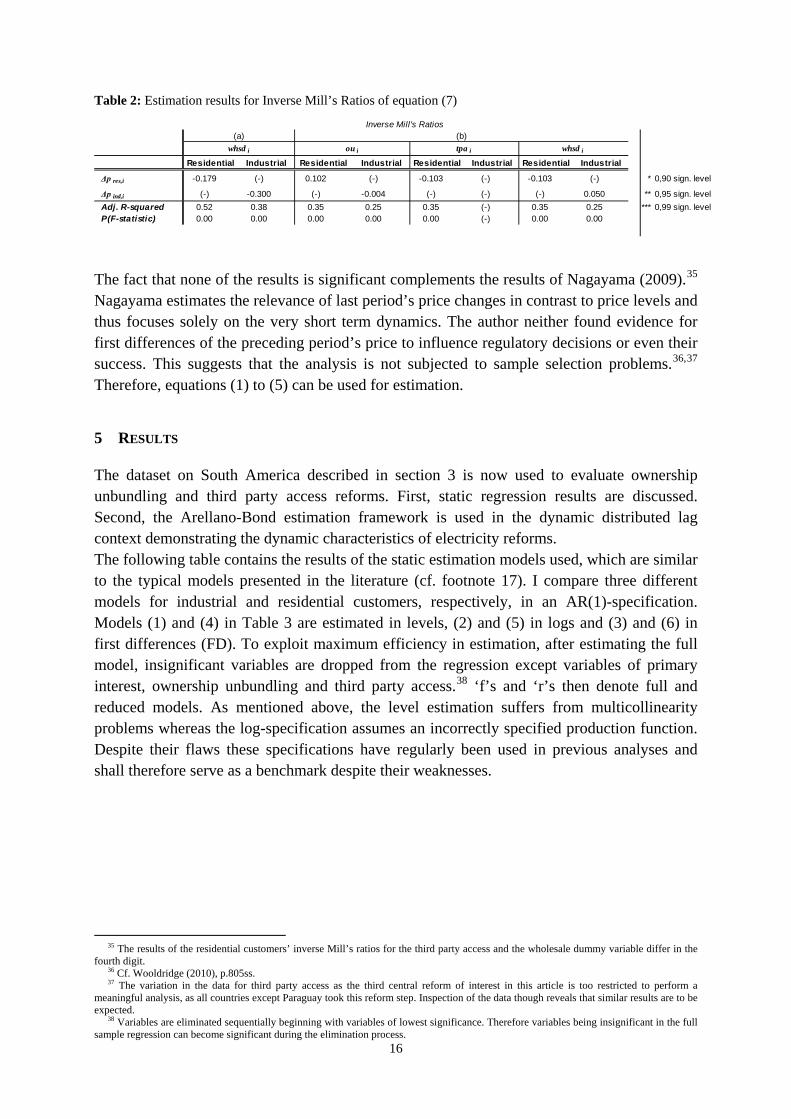
Table 2: Estimation results for Inverse Mill’s Ratios of equation (7)
The fact that none of the results is significant complements the results of Nagayama (2009).35 Nagayama estimates the relevance of last period’s price changes in contrast to price levels and thus focuses solely on the very short term dynamics. The author neither found evidence for first differences of the preceding period’s price to influence regulatory decisions or even their success. This suggests that the analysis is not subjected to sample selection problems.36,37
Therefore, equations (1) to (5) can be used for estimation.
5 RESULTS
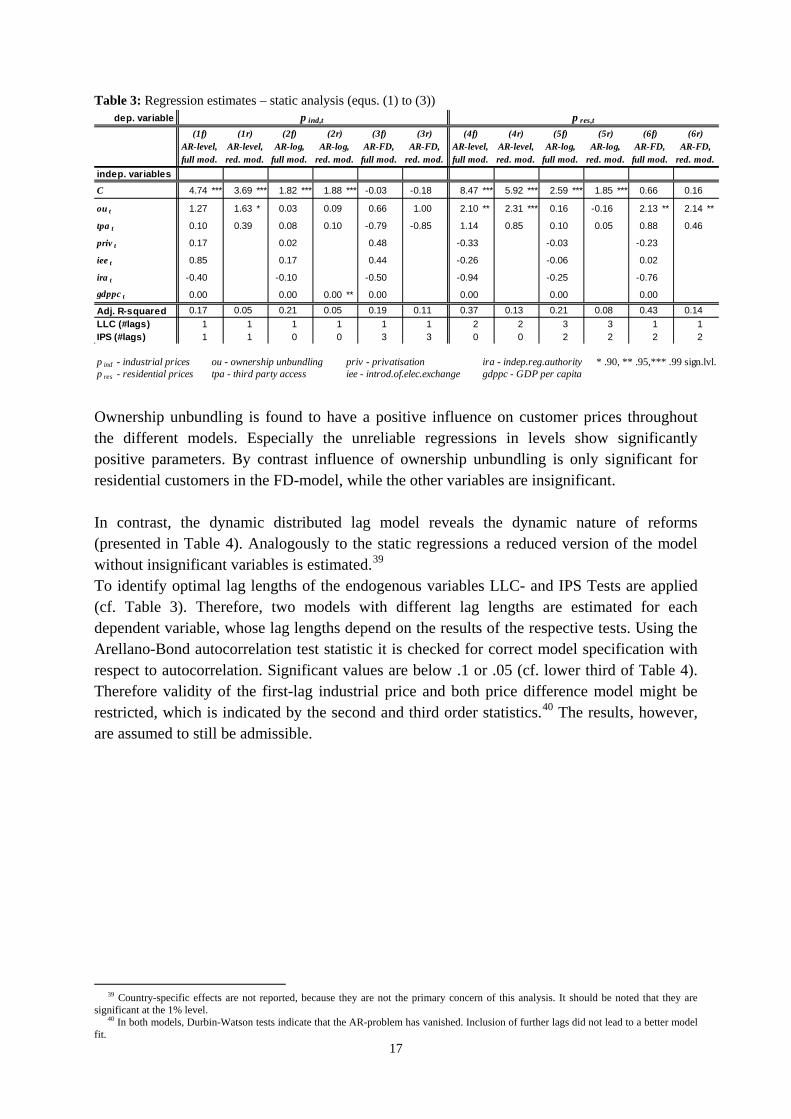
The dataset on South America described in section 3 is now used to evaluate ownership unbundling and third party access reforms. First, static regression results are discussed. Second, the Arellano-Bond estimation framework is used in the dynamic distributed lag context demonstrating the dynamic characteristics of electricity reforms. The following table contains the results of the static estimation models used, which are similar to the typical models presented in the literature (cf. footnote 17). I compare three different models for industrial and residential customers, respectively, in an AR(1)-specification. Models (1) and (4) in Table 3 are estimated in levels, (2) and (5) in logs and (3) and (6) in first differences (FD). To exploit maximum efficiency in estimation, after estimating the full model, insignificant variables are dropped from the regression except variables of primary interest, ownership unbundling and third party access.38 ‘f’s and ‘r’s then denote full and reduced models. As mentioned above, the level estimation suffers from multicollinearity problems whereas the log-specification assumes an incorrectly specified production function. Despite their flaws these specifications have regularly been used in previous analyses and shall therefore serve as a benchmark despite their weaknesses.
35 The results of the residential customers’ inverse Mill’s ratios for the third party access and the wholesale dummy variable differ in the fourth digit.
36 Cf. Wooldridge (2010), p.805ss. 37 The variation in the data for third party access as the third central reform of interest in this article is too restricted to perform a
meaningful analysis, as all countries except Paraguay took this reform step. Inspection of the data though reveals that similar results are to be expected.
38 Variables are eliminated sequentially beginning with variables of lowest significance. Therefore variables being insignificant in the full sample regression can become significant during the elimination process.
Δp res,i -0.179 (-) 0.102 (-) -0.103 (-) -0.103 (-) * 0,90 sign. level
Δp ind,i (-) -0.300 (-) -0.004 (-) (-) (-) 0.050 ** 0,95 sign. levelAdj. R-squared 0.52 0.38 0.35 0.25 0.35 (-) 0.35 0.25 *** 0,99 sign. levelP(F-statistic) 0.00 0.00 0.00 0.00 0.00 (-) 0.00 0.00
Inverse Mill's Ratios
Residential Industrial Residential Industrial Residential Industrial
(a) (b)whsd i ou i tpa i whsd i
Residential Industrial
17
Table 3: Regression estimates – static analysis (equs. (1) to (3))
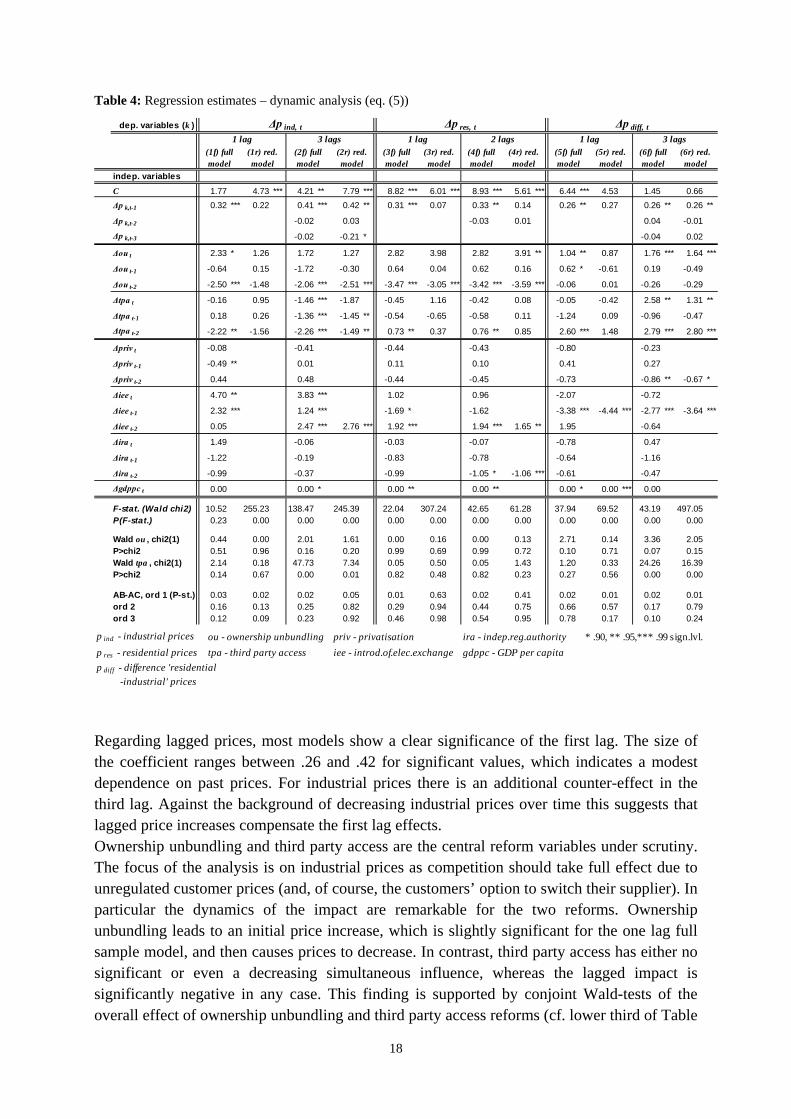
Ownership unbundling is found to have a positive influence on customer prices throughout the different models. Especially the unreliable regressions in levels show significantly positive parameters. By contrast influence of ownership unbundling is only significant for residential customers in the FD-model, while the other variables are insignificant. In contrast, the dynamic distributed lag model reveals the dynamic nature of reforms (presented in Table 4). Analogously to the static regressions a reduced version of the model without insignificant variables is estimated.39 To identify optimal lag lengths of the endogenous variables LLC- and IPS Tests are applied (cf. Table 3). Therefore, two models with different lag lengths are estimated for each dependent variable, whose lag lengths depend on the results of the respective tests. Using the Arellano-Bond autocorrelation test statistic it is checked for correct model specification with respect to autocorrelation. Significant values are below .1 or .05 (cf. lower third of Table 4). Therefore validity of the first-lag industrial price and both price difference model might be restricted, which is indicated by the second and third order statistics.40 The results, however, are assumed to still be admissible.
39 Country-specific effects are not reported, because they are not the primary concern of this analysis. It should be noted that they are
significant at the 1% level. 40 In both models, Durbin-Watson tests indicate that the AR-problem has vanished. Inclusion of further lags did not lead to a better model
fit.
indep. variablesC 4.74 *** 3.69 *** 1.82 *** 1.88 *** -0.03 -0.18 8.47 *** 5.92 *** 2.59 *** 1.85 *** 0.66 0.16
ou t 1.27 1.63 * 0.03 0.09 0.66 1.00 2.10 ** 2.31 *** 0.16 -0.16 2.13 ** 2.14 **
tpa t 0.10 0.39 0.08 0.10 -0.79 -0.85 1.14 0.85 0.10 0.05 0.88 0.46
priv t 0.17 0.02 0.48 -0.33 -0.03 -0.23
iee t 0.85 0.17 0.44 -0.26 -0.06 0.02
ira t -0.40 -0.10 -0.50 -0.94 -0.25 -0.76
gdppc t 0.00 0.00 0.00 ** 0.00 0.00 0.00 0.00
Adj. R-squared 0.17 0.05 0.21 0.05 0.19 0.11 0.37 0.13 0.21 0.08 0.43 0.14LLC (#lags) 1 1 1 1 1 1 2 2 3 3 1 1IPS (#lags) 1 1 0 0 3 3 0 0 2 2 2 2
p ind - industrial prices ou - ownership unbundling priv - privatisation ira - indep.reg.authority * .90, ** .95,*** .99 sign.lvl.p res - residential prices tpa - third party access iee - introd.of.elec.exchange gdppc - GDP per capita
(1r) AR-level, red. mod.
(2f) AR-log,
full mod.
(2r) AR-log,
red. mod.
(3f) AR-FD,
full mod.
(3r) AR-FD,
red. mod.
dep. variable p ind,t
(1f) AR-level, full mod.
p res,t
(4f) AR-level, full mod.
(4r) AR-level, red. mod.
(5f) AR-log,
full mod.
(5r) AR-log,
red. mod.
(6f) AR-FD,
full mod.
(6r) AR-FD,
red. mod.
18
Table 4: Regression estimates – dynamic analysis (eq. (5))
Regarding lagged prices, most models show a clear significance of the first lag. The size of the coefficient ranges between .26 and .42 for significant values, which indicates a modest dependence on past prices. For industrial prices there is an additional counter-effect in the third lag. Against the background of decreasing industrial prices over time this suggests that lagged price increases compensate the first lag effects. Ownership unbundling and third party access are the central reform variables under scrutiny. The focus of the analysis is on industrial prices as competition should take full effect due to unregulated customer prices (and, of course, the customers’ option to switch their supplier). In particular the dynamics of the impact are remarkable for the two reforms. Ownership unbundling leads to an initial price increase, which is slightly significant for the one lag full sample model, and then causes prices to decrease. In contrast, third party access has either no significant or even a decreasing simultaneous influence, whereas the lagged impact is significantly negative in any case. This finding is supported by conjoint Wald-tests of the overall effect of ownership unbundling and third party access reforms (cf. lower third of Table
indep. variablesC 1.77 4.73 *** 4.21 ** 7.79 *** 8.82 *** 6.01 *** 8.93 *** 5.61 *** 6.44 *** 4.53 1.45 0.66Δp k,t-1 0.32 *** 0.22 0.41 *** 0.42 ** 0.31 *** 0.07 0.33 ** 0.14 0.26 ** 0.27 0.26 ** 0.26 **
Δp k,t-2 -0.02 0.03 -0.03 0.01 0.04 -0.01
Δp k,t-3 -0.02 -0.21 * -0.04 0.02
Δou t 2.33 * 1.26 1.72 1.27 2.82 3.98 2.82 3.91 ** 1.04 ** 0.87 1.76 *** 1.64 ***
Δou t-1 -0.64 0.15 -1.72 -0.30 0.64 0.04 0.62 0.16 0.62 * -0.61 0.19 -0.49
Δou t-2 -2.50 *** -1.48 -2.06 *** -2.51 *** -3.47 *** -3.05 *** -3.42 *** -3.59 *** -0.06 0.01 -0.26 -0.29
Δtpa t -0.16 0.95 -1.46 *** -1.87 -0.45 1.16 -0.42 0.08 -0.05 -0.42 2.58 ** 1.31 **
Δtpa t-1 0.18 0.26 -1.36 *** -1.45 ** -0.54 -0.65 -0.58 0.11 -1.24 0.09 -0.96 -0.47
Δtpa t-2 -2.22 ** -1.56 -2.26 *** -1.49 ** 0.73 ** 0.37 0.76 ** 0.85 2.60 *** 1.48 2.79 *** 2.80 ***
Δpriv t -0.08 -0.41 -0.44 -0.43 -0.80 -0.23
Δpriv t-1 -0.49 ** 0.01 0.11 0.10 0.41 0.27
Δpriv t-2 0.44 0.48 -0.44 -0.45 -0.73 -0.86 ** -0.67 *
Δiee t 4.70 ** 3.83 *** 1.02 0.96 -2.07 -0.72
Δiee t-1 2.32 *** 1.24 *** -1.69 * -1.62 -3.38 *** -4.44 *** -2.77 *** -3.64 ***
Δiee t-2 0.05 2.47 *** 2.76 *** 1.92 *** 1.94 *** 1.65 ** 1.95 -0.64
Δira t 1.49 -0.06 -0.03 -0.07 -0.78 0.47
Δira t-1 -1.22 -0.19 -0.83 -0.78 -0.64 -1.16
Δira t-2 -0.99 -0.37 -0.99 -1.05 * -1.06 *** -0.61 -0.47
Δgdppc t 0.00 0.00 * 0.00 ** 0.00 ** 0.00 * 0.00 *** 0.00
F-stat. (Wald chi2) 10.52 255.23 138.47 245.39 22.04 307.24 42.65 61.28 37.94 69.52 43.19 497.05P(F-stat.) 0.23 0.00 0.00 0.00 0.00 0.00 0.00 0.00 0.00 0.00 0.00 0.00
Wald ou , chi2(1) 0.44 0.00 2.01 1.61 0.00 0.16 0.00 0.13 2.71 0.14 3.36 2.05P>chi2 0.51 0.96 0.16 0.20 0.99 0.69 0.99 0.72 0.10 0.71 0.07 0.15Wald tpa , chi2(1) 2.14 0.18 47.73 7.34 0.05 0.50 0.05 1.43 1.20 0.33 24.26 16.39P>chi2 0.14 0.67 0.00 0.01 0.82 0.48 0.82 0.23 0.27 0.56 0.00 0.00
AB-AC, ord 1 (P-st.) 0.03 0.02 0.02 0.05 0.01 0.63 0.02 0.41 0.02 0.01 0.02 0.01ord 2 0.16 0.13 0.25 0.82 0.29 0.94 0.44 0.75 0.66 0.57 0.17 0.79ord 3 0.12 0.09 0.23 0.92 0.46 0.98 0.54 0.95 0.78 0.17 0.10 0.24
p ind - industrial prices ou - ownership unbundling priv - privatisation ira - indep.reg.authority * .90, ** .95,*** .99 sign.lvl.p res - residential prices tpa - third party access iee - introd.of.elec.exchange gdppc - GDP per capitap diff - difference 'residential
-industrial' prices
Δp ind, t
(1f) full model
(1r) red. model
1 lag 3 lags(5f) full model
(5r) red. model
Δp res, t1 lag 2 lags
(3f) full model
(3r) red. model
(6f) full model
(6r) red. model
(2f) full model
(2r) red. model
dep. variables (k )
(4f) full model
(4r) red. model
Δp diff, t1 lag 3 lags
19
4). The more reliable three lag models show strongly significant results for third party access. In contrast, the overall effect of ownership unbundling appears to be neutral for industrial customers’ prices. These results are economically sensible: Ownership unbundling comes along with high costs in restructuring periods, whereas third party access would avoid the costs of unbundling but is expected to have a similar potential of cost reduction if tight supervision is exerted by a regulatory authority. This suggests that ownership unbundling has no significant net effect in the long run when dynamic specifications are used.41 With regard to control variables, only the introduction of an electricity exchange is found to have a clear impact on prices. It is positive throughout, though its scale is surprising. This is mainly attributable to Brazil and Columbia, who suffered large price increases after the introduction of their electricity exchanges. A possible explanation for this observation could be that formerly administered prices based on historical costs of mainly older (depreciated) generation plants tend to be lower than forward looking prices found in uniform price auctions. The latter typically mostly follow full replacement costs of the marginal power plant. In such a market based organization, depreciated plants may then earn high revenues of the recently installed marginal plant increasing total cost of energy production. This is the flipside of transparency: It reveals a previous overshooting as well as a previous shortfall in cost coverage.42 Privatization is the only other significant control. It has a moderate negative impact that is in line with theoretical considerations. For residential customers autocorrelation already vanishes for the two lag dynamic model. Coefficients of lagged dependent variables are of similar size. Regarding ownership unbundling a comparable effect as the one found for industrial customers is estimated:43 Initially increasing prices are offset by decreasing prices in the second lags, so that the overall effect is neutral as Wald-tests show. Interestingly, third party access neither has a systematic overall influence, though there is some evidence for the full sample models that it increases prices in the second lag, which are significant at the .95 level. The explanation for this could be that competition in the residential customer segment is usually less intense than in the industrial segment, so that reforms may represent an occasion for a reallocation of (overhead) costs and a redistribution of welfare from less competitive residential to industrial customers. Moreover, the residential customer segment often remains temporarily or permanently protected during liberalization processes. In South America, liberalization notably did not take place on residential markets during the period of observation and customer price regulation was upheld. Especially the latter exhibits a great influence on retail prices which should not be ignored when interpreting the results. With regard to third party access, the resulting neutrality is therefore plausible. Furthermore, the effects found for ownership unbundling for residential customers lead to the question whether they are a consequence of discretionary regulatory rebalancing of relative prices or effects based on increased market orientation. To answer this question it would be necessary to separate impacts on potentially competitive generation and regulated network (and retail) levels. But the data basis of this analysis does not allow further subdivision of the sample.44
41 Similar, and even clearer, results were obtained by the analysis in the simple distributed lag model, without lagged prices as explanatory variables. However, LLC- and IPS-results indicate that these results are distorted.
42 The coefficients for the introduction of an electricity exchange are comparably high. This might be due to the inclusion of stacked instruments. Therefore, interpretation of the scale of coefficients should be of secondary importance. The same, of course, holds for the other variables.
43 However, price changes take place on a higher price level. 44 Observations would be reduced to 54 points, which is not considered reliable.
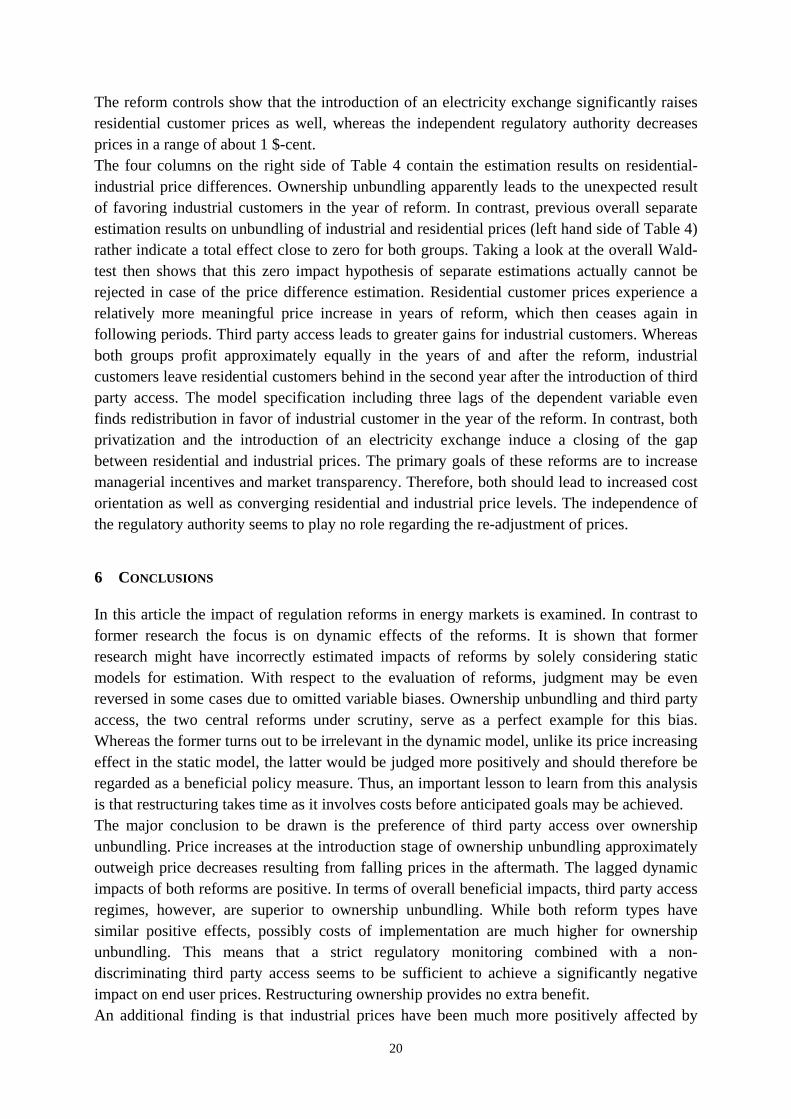
20
The reform controls show that the introduction of an electricity exchange significantly raises residential customer prices as well, whereas the independent regulatory authority decreases prices in a range of about 1 $-cent. The four columns on the right side of Table 4 contain the estimation results on residential-industrial price differences. Ownership unbundling apparently leads to the unexpected result of favoring industrial customers in the year of reform. In contrast, previous overall separate estimation results on unbundling of industrial and residential prices (left hand side of Table 4) rather indicate a total effect close to zero for both groups. Taking a look at the overall Wald-test then shows that this zero impact hypothesis of separate estimations actually cannot be rejected in case of the price difference estimation. Residential customer prices experience a relatively more meaningful price increase in years of reform, which then ceases again in following periods. Third party access leads to greater gains for industrial customers. Whereas both groups profit approximately equally in the years of and after the reform, industrial customers leave residential customers behind in the second year after the introduction of third party access. The model specification including three lags of the dependent variable even finds redistribution in favor of industrial customer in the year of the reform. In contrast, both privatization and the introduction of an electricity exchange induce a closing of the gap between residential and industrial prices. The primary goals of these reforms are to increase managerial incentives and market transparency. Therefore, both should lead to increased cost orientation as well as converging residential and industrial price levels. The independence of the regulatory authority seems to play no role regarding the re-adjustment of prices.
6 CONCLUSIONS
In this article the impact of regulation reforms in energy markets is examined. In contrast to former research the focus is on dynamic effects of the reforms. It is shown that former research might have incorrectly estimated impacts of reforms by solely considering static models for estimation. With respect to the evaluation of reforms, judgment may be even reversed in some cases due to omitted variable biases. Ownership unbundling and third party access, the two central reforms under scrutiny, serve as a perfect example for this bias. Whereas the former turns out to be irrelevant in the dynamic model, unlike its price increasing effect in the static model, the latter would be judged more positively and should therefore be regarded as a beneficial policy measure. Thus, an important lesson to learn from this analysis is that restructuring takes time as it involves costs before anticipated goals may be achieved. The major conclusion to be drawn is the preference of third party access over ownership unbundling. Price increases at the introduction stage of ownership unbundling approximately outweigh price decreases resulting from falling prices in the aftermath. The lagged dynamic impacts of both reforms are positive. In terms of overall beneficial impacts, third party access regimes, however, are superior to ownership unbundling. While both reform types have similar positive effects, possibly costs of implementation are much higher for ownership unbundling. This means that a strict regulatory monitoring combined with a non-discriminating third party access seems to be sufficient to achieve a significantly negative impact on end user prices. Restructuring ownership provides no extra benefit. An additional finding is that industrial prices have been much more positively affected by

21
reforms than residential prices. Somewhat surprising is the tendency of increasing residential prices during the observation period.45 Various reasons may be invoked for this. For example, the price regulation process could have been influenced by regulatory capture or market power could have been used to raise residential prices as customers in this segment are not able to switch. This could lead to a cross-subsidization of industrial customers. A more market oriented interpretation could be that former subsidies to residential customers have been mitigated. Also, increased competition for industrial customers is probable to have led to some sort of reallocation of costs. As a result, however, a certain redistribution of welfare from residential to industrial customers has been taking place. It seems that this process has been supported by governments due to the upheld residential customer price regulation during the inspection period. An additional explanation could be that in many countries electrification – in particular in the residential segment – has increased vastly during the observation period. Installation of new lines and cables on average costs more than operation with relatively old assets, which might have influenced residential customer prices. In addition, of course, as this customer segment increases in importance, it becomes more lucrative and less easy to subsidize. However, validity of the results is limited due to the small data set employed. This problem is attributable to the difficulties associated with the isolation of reform impacts when it comes to finding suitable countries, which introduced reforms step by step. Nevertheless, the analysis shows that dynamic effects should not be neglected as they possibly contradict findings from static analyses. Many extensions of the model framework used are possible. From a more detailed modeling of cost structures and pricing to a further analysis of impacts resulting from an abolishment of end user price regulation there is a wide scope of research. Furthermore, no hypotheses on firm behavior are incorporated in the analysis. This would more explicitly demonstrate possibly competitive or collusive firm behavior.
45 It should be noted that average industrial prices fall from a level higher than residential prices.
22
REFERENCES Anderson, T.W., Hsiao, C., 1981, “Estimation of dynamic models with error components.” Journal of the American Statistical Association 76, 598-606. Arellano, M., Bond, S. 1991, “Some tests of specification for panel data: Monte Carlo evidence and an application to employment
equations.” Review of Economic Studies, 58. 277-297. ARIAE (2012), Asociacion iberoamericana de entidades reguladoras de la energia. URL: http://www.ariae.org/spanish/contenidos/home.asp. Bacon, R.W., Besant-Jones, J., 2001, “Global electric power reform, privatization, and liberalization of the electric power industry in developing countries.” Annual Review of Energy and the Environment 26, 331-359. Baltagi, B. H., Wu, P. X., 1999, “Unequally spaced panel data regressions with AR(1) disturbances.” Econometric Theory 15, 814-823. Becker, G. S., 1983, “A theory of competition among pressure groups for political influence.” Quarterly Journal of Economics, 98 (3), 371-400. Berg, S., Lin, C., Tsaplin, V., 2005, “Regulation of state-owned and privatized utilities:Ukraine electricity distribution company performance. Journal of Regulatory Economics 28, 259–287. Brunekreeft, G., 2008, “Ownership unbundling in electricity markets – a social cost benefit analysis of the German TSOs.” Cambridge Working Paper Series in Economics 0833. Cambini, C., Rondi, L., 2010, “Incentive regulation and investment: evidence from European energy utilities.” Journal of Regulatory Economics 38, 1-26. Cameron, A.C., Trivedi, P.K., 2005, “Microeconometrics – Methods and Applications.” Cambridge University Press, New York, 754ss. Campos, J.E.L., 1989, “Legislative institutions, lobbying and the endogenous choice of regulatory instruments.” Journal of Law, Economics, Organization 5, 333-353. Charles River Associates (Asia Pacific Ltd), 2002, “PPP in telecommunications benchmarking.” Report submitted to Telecom NZ Ltd, May. Coelli, T.J., Rao, D.S.P., O’Donnell, C.J., Battese, G.E., 2005, “An Introduction to Efficiency and Productivity Analysis”, 2nd e., Springer, Heidelberg. Commission de Régulation de l’Energie, 2009, “Marché de détail de l'électricité.” URL:http://www.cre.fr/fr/marches/marche_de_l_electricite/marche_de_detail Copenhagen Economics, 2005, “Market opening in network industries: Part II sectoral analyses”, Copenhagen Economics for DG Internal Market. Cremer, H., Crémer, J., De Donder, P., 2006, “Legal vs. ownership unbundling in network industries.” IDEI Working paper 2006/405/CEPR 5767. De Nooij, M., Baarsma, B., 2007, “An ex ante welfare analysis of the unbundling of the distribution and supply companies in the Dutch electricity sector.” SEO working paper 52. Dewenter, K. H., Malatesta, P. L., 1997, “Public offerings of state-owned and privately-owned enterprises: An international comparison.” Journal of Finance 52 (4), 1659 – 1679. Erdogdu, E., 2011, “The impact of power market reforms on electricity price-cost margins and cross-subsidy levels: A cross country panel data analysis.” Energy Policy 39, 1080-1092. Estache, A., Rossi, M.A., 2005, “Do regulation and ownership drive the efficiency of electricity distribution? Evidence from Latin America.” Economics Letters 86, 253-257. Growitsch, C., Stronzik, M., 2008, “Ownership Unbundling in der Gaswirtschaft – Theoretische Grundlagen und empirische Evidenz.“ WIK Discussion Paper 308, URL: http://www.wik.org/content/diskus/diskus_308.pdf. Results also presented in English at WIP-conference, URL: http://www.infraday.tu-berlin.de/index.php?id=2351. GWB, 2008, Gesetz gegen Wettbewerbsbeschränkungen in der Fassung der Bekanntmachung vom 15. Juli2005 (BGBl. I S. 2114), zuletzt geändert durch Artikel 2c des Gesetzes vom 15. Dezember 2008 (BGBl. I S. 2426). URL:http://bundesrecht.juris.de/gwb/index.html

23
Hattori, T., Tsutsui, M., 2004, “Economic impact of regulatory reforms in the electricity supply industry: a panel data analysis for OECD countries.” Energy Policy 32, 823-832. Höffler, F., Kranz, S., 2011a, “Legal unbundling can be a golden mean between vertical integration and ownership separation.“ International Journal of Industrial Organization 29, 576-588. Höffler, F., Kranz, S., 2011b, “Imperfect legal unbundling of monopolistic bottlenecks.” Journal of Regulatory Economics 39, 273-292. Im, K.S., Pesaran, M.H., Shin, Y., 2003, “Testing for unit roots in heterogeneous panels.” Journal of Econometrics 115, 53-74. IMF (2008), International Monetary Fund – World Economic Outlook. URL: http://www.imf.org/external/pubs/ft/weo/2008/01/weodata/download.aspx
Juchniewicz, L., 1999, “Autonomy and main tasks of the President of the Energy Regulatory Authority in Poland.” (President of the Polish Regulator URE). URL: http://www.google.com/ search?hl=de&rlz=1T4IBMA_deDE308DE212&q=Autonomy+and+main+tasks+of+the+ President+of&btnG=Suche&lr= Kumbhakar, S., Hjalmarsson, L. 1998, “Relative performance of public and private ownership under yardstick competition: electricity retail distribution.” European Economic Review 42, 97-122. Levin, A., Lin, C., Chu, C., 2002, “Unit root tests in panel data: Asymptotic and finite-sample properties.” Journal of Econometrics 108, 1-24. Lutz, M., 1999, “EU Commission versus Volkswagen: new evidence on price differentiation in the European car market.” The Review of Industrial Organization 17, 313-323. Mandy, D., Sappington, D., 2007, “Incentives for sabotage in vertically related industries” Journal of Regulatory Economics, 31, 235-260. Megginson, W.L., Netter, J.M., 2001, “From State to Market: A Survey of Empirical Studies on Privatization.” Journal of Economic Literature 39, 321-389. Meyer, R., (2012), “vertical Economies and the Costs of Separating Electricity Supply – A Review of Theoretical and Empirical Literature,” Energy Journal, 33,161-185. Nagayama, H., 2007, “Effects of regulatory reforms in the electricity supply industry on electricity prices in developing countries.” Energy Policy 35, 3440-3462. Nagayama, H., 2009, “Electric power sector reform liberalization models and electric power prices in developing countries: An empirical analysis using international panel data.” Energy Economics 31, 463-472. Newbery, D., Pollitt, M., 1997, “The restructuring and privatization of Britain's CEGB—was it worth it?” The Journal of Industrial Economics 45 (3), 269-303. Nillesen, P., Pollitt, M., 2008, “Ownership unbundling in electricity distribution: Empirical evidence from New Zealand.” Cambridge Working Paper Series 0836. OLADE (2012), Organización Latinoamericana de Energía. URL: http://www.olade.org/. Ong, L. L., 1997, “Burgernomics: the economics of the Big Mac standard.” Journal of International Money and Finance 16, 865-78. Peláez-Samamiego, M.R., Garcia-Perez, M., Cortez, L.A.B., Oscullo, J., Olmedo, G, 2007, “Energy sector in Ecuador: Current status.” Energy Policy 35, 4177-4189. Pollitt, M., 2004, “Electricity reform in Chile: lessons for developing countries.” Center for Energy and Environment Policy Research 04-016 WP. Pollitt, M., 2008, “Electricity reform in Argentina: lessons for developing countries.” Energy Economics 30, 1536-1567. Pollitt, M., 2008, “The arguments for and against ownership unbundling of energy transmission networks.” Energy Policy 36 (2), 704-713. Posner, R. A., 1975, “The social cost of monopoly and regulation.” Journal of Political Economy, 83, 807-27. Productivity Commission, 1999, “International benchmarking of telecommunications prices and price changes.” Melbourne, Commonwealth of Australia. Reitzes, J., 2008, “Downstream Price-Cap Regulation and Upstream Market Power," Journal of Regulatory Economics, 33, 179-200.

24
Rogoff, K., 1996, “The purchasing power parity puzzle.” Journal of Economic Literature 34, 647-68. Steiner, F., 2000, “Regulation, industry structure and performance in the electricity supply industry.” OECD Economics Department WP 238. Taylor, A., 2002, “A century of purchasing power parity.” Review of Economics and Statistics 84, 139-150. Wooldridge, J. (2010), “Econometric analysis of cross-section and panel data”, MIT Press, Cambridge, Massachusetts. Zhang, Y.-F., Parker, D., Kirkpatrick, C., 2008, “Electricity sector reform in developingcountries: an econometric assessment of the effects of privatization, competition and regulation.” Journal of Regulatory Economics 33, 159-178.
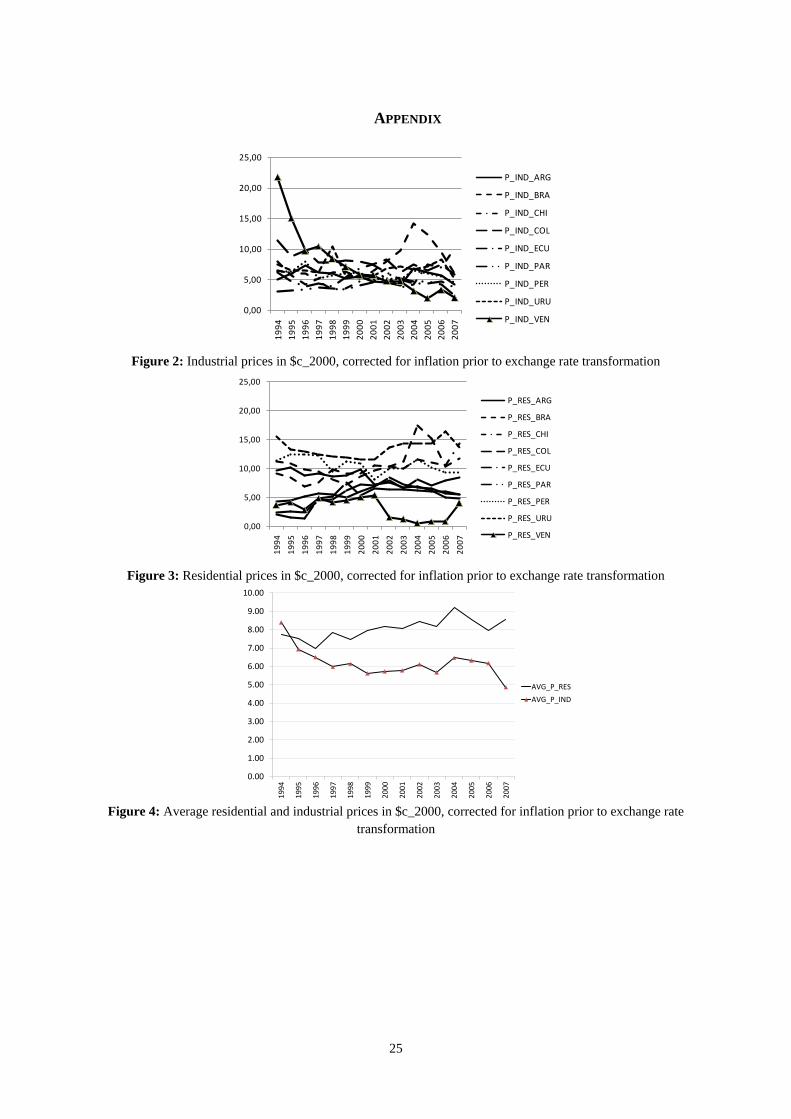
25
APPENDIX
Figure 2: Industrial prices in $c_2000, corrected for inflation prior to exchange rate transformation
Figure 3: Residential prices in $c_2000, corrected for inflation prior to exchange rate transformation
Figure 4: Average residential and industrial prices in $c_2000, corrected for inflation prior to exchange rate
transformation
0,00
5,00
10,00
15,00
20,00
25,00
1994
1995
1996
1997
1998
1999
2000
2001
2002
2003
2004
2005
2006
2007
P_IND_ARG
P_IND_BRA
P_IND_CHI
P_IND_COL
P_IND_ECU
P_IND_PAR
P_IND_PER
P_IND_URU
P_IND_VEN
0,00
5,00
10,00
15,00
20,00
25,00
1994
1995
1996
1997
1998
1999
2000
2001
2002
2003
2004
2005
2006
2007
P_RES_ARG
P_RES_BRA
P_RES_CHI
P_RES_COL
P_RES_ECU
P_RES_PAR
P_RES_PER
P_RES_URU
P_RES_VEN
0.00
1.00
2.00
3.00
4.00
5.00
6.00
7.00
8.00
9.00
10.00
1994
1995
1996
1997
1998
1999
2000
2001
2002
2003
2004
2005
2006
2007
AVG_P_RESAVG_P_IND