Embed Size (px)
Citation preview
STATISTICAL ANNEX – STATE OF THE LDCs REPORT 2017
DATA
The tables contained in the present annex were largely compiled from official, published international sources by the United Nations Office of the High Representative for the Least Developed Countries, Landlocked Developing Countries and Small Island Developing States. The published sources are cited with each table. Since national data sources have improved, international estimates were rarely used, except to adjust national data for comparability. Where sources made retrospective adjustments to data, the newer data were incorporated in the tables. As a result, some of the data may differ from those published in previous years.
Where shown, totals and averages for the least developed countries and developing regions are weighted by absolute numbers of population or economic variable used in the denominator.
Explanatory notes for tables
1. Years separated by a hyphen (such as 2001-2010) indicate data based on averages in the period shown, unless otherwise indicated in the notes to the tables. Years separated by a slash (such as 2009/2010) indicate that data are shown for the latest year available in the period.
2. Figures may not add to totals, owing to rounding.
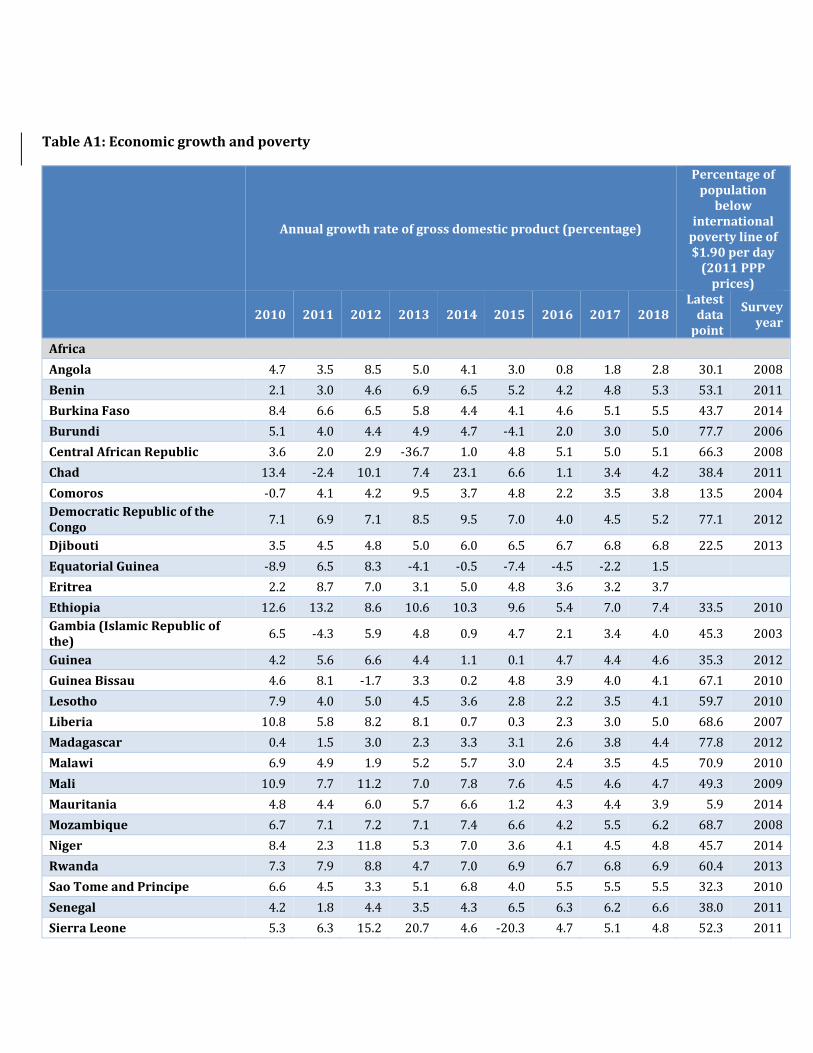
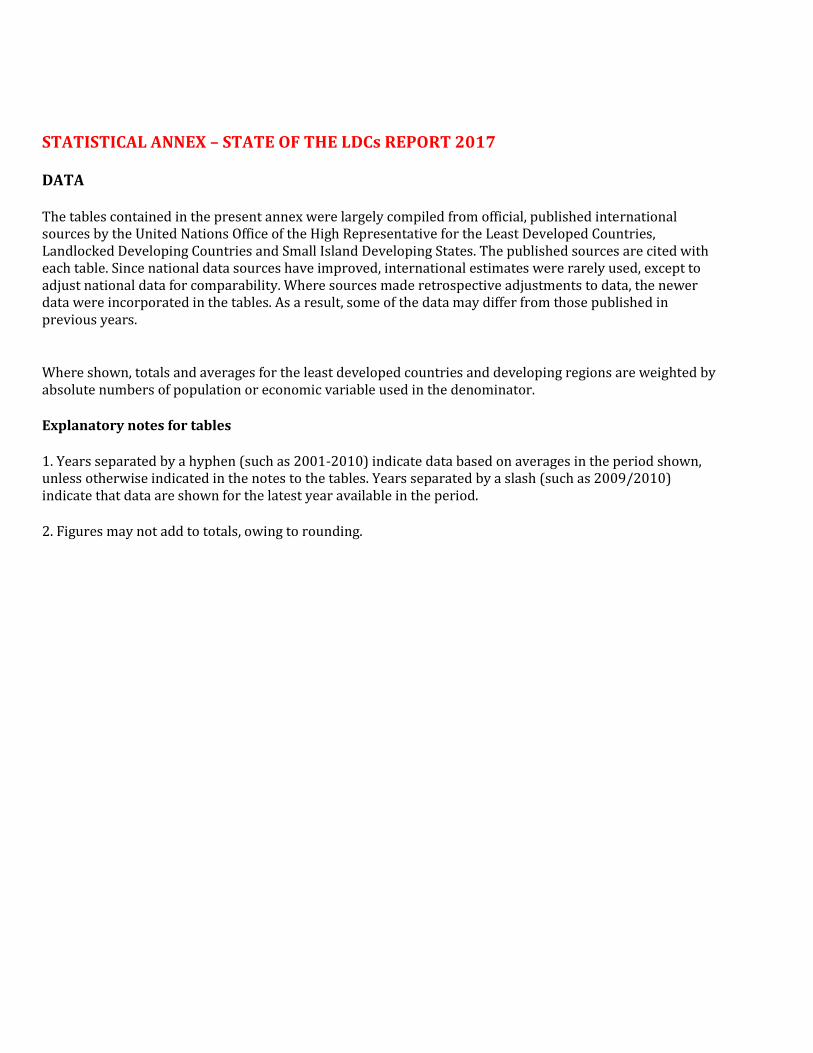
Table A1: Economic growth and poverty
Annual growth rate of gross domestic product (percentage)
Percentage of population
below international
poverty line of $1.90 per day
(2011 PPP prices)
2010 2011 2012 2013 2014 2015 2016 2017 2018 Latest
data point
Survey year
Africa
Angola 4.7 3.5 8.5 5.0 4.1 3.0 0.8 1.8 2.8 30.1 2008
Benin 2.1 3.0 4.6 6.9 6.5 5.2 4.2 4.8 5.3 53.1 2011
Burkina Faso 8.4 6.6 6.5 5.8 4.4 4.1 4.6 5.1 5.5 43.7 2014
Burundi 5.1 4.0 4.4 4.9 4.7 -4.1 2.0 3.0 5.0 77.7 2006
Central African Republic 3.6 2.0 2.9 -36.7 1.0 4.8 5.1 5.0 5.1 66.3 2008
Chad 13.4 -2.4 10.1 7.4 23.1 6.6 1.1 3.4 4.2 38.4 2011
Comoros -0.7 4.1 4.2 9.5 3.7 4.8 2.2 3.5 3.8 13.5 2004
Democratic Republic of the Congo
7.1 6.9 7.1 8.5 9.5 7.0 4.0 4.5 5.2 77.1 2012
Djibouti 3.5 4.5 4.8 5.0 6.0 6.5 6.7 6.8 6.8 22.5 2013
Equatorial Guinea -8.9 6.5 8.3 -4.1 -0.5 -7.4 -4.5 -2.2 1.5
Eritrea 2.2 8.7 7.0 3.1 5.0 4.8 3.6 3.2 3.7
Ethiopia 12.6 13.2 8.6 10.6 10.3 9.6 5.4 7.0 7.4 33.5 2010
Gambia (Islamic Republic of the)
6.5 -4.3 5.9 4.8 0.9 4.7 2.1 3.4 4.0 45.3 2003
Guinea 4.2 5.6 6.6 4.4 1.1 0.1 4.7 4.4 4.6 35.3 2012
Guinea Bissau 4.6 8.1 -1.7 3.3 0.2 4.8 3.9 4.0 4.1 67.1 2010
Lesotho 7.9 4.0 5.0 4.5 3.6 2.8 2.2 3.5 4.1 59.7 2010
Liberia 10.8 5.8 8.2 8.1 0.7 0.3 2.3 3.0 5.0 68.6 2007
Madagascar 0.4 1.5 3.0 2.3 3.3 3.1 2.6 3.8 4.4 77.8 2012
Malawi 6.9 4.9 1.9 5.2 5.7 3.0 2.4 3.5 4.5 70.9 2010
Mali 10.9 7.7 11.2 7.0 7.8 7.6 4.5 4.6 4.7 49.3 2009
Mauritania 4.8 4.4 6.0 5.7 6.6 1.2 4.3 4.4 3.9 5.9 2014
Mozambique 6.7 7.1 7.2 7.1 7.4 6.6 4.2 5.5 6.2 68.7 2008
Niger 8.4 2.3 11.8 5.3 7.0 3.6 4.1 4.5 4.8 45.7 2014
Rwanda 7.3 7.9 8.8 4.7 7.0 6.9 6.7 6.8 6.9 60.4 2013
Sao Tome and Principe 6.6 4.5 3.3 5.1 6.8 4.0 5.5 5.5 5.5 32.3 2010
Senegal 4.2 1.8 4.4 3.5 4.3 6.5 6.3 6.2 6.6 38.0 2011
Sierra Leone 5.3 6.3 15.2 20.7 4.6 -20.3 4.7 5.1 4.8 52.3 2011
Annual growth rate of gross domestic product (percentage)
Percentage of population
below international
poverty line of $1.90 per day
(2011 PPP prices)
2010 2011 2012 2013 2014 2015 2016 2017 2018 Latest
data point
Survey year
Somalia 2.6 2.6 2.6 2.6 3.7 2.7 3.4 3.7 3.9
South Sudan 5.5 -4.6 -46.1 13.1 3.4 -6.3 -13.1 -6.1 -2.7 42.7 2009
Sudan 6.9 -0.3 -2.2 5.3 1.6 4.9 4.2 4.2 4.0 14.9 2009
Togo 4.0 4.9 5.8 5.1 6.1 5.5 5.5 4.7 5.1 54.2 2011
Uganda 8.2 5.9 3.2 4.7 4.9 5.4 5.0 5.4 5.8 34.6 2012
United Republic of Tanzania 6.4 7.9 5.1 7.3 7.0 7.0 7.0 7.1 6.9 46.6 2011
Zambia 10.3 5.6 7.6 5.1 5.0 2.9 3.0 4.1 4.6 64.4 2010
Average, Africa 6.2 4.8 6.0 5.5 5.8 4.6 1.7 4.3 4.9
Asia and the Pacific
Afghanistan 3.2 8.7 10.9 6.5 2.2 -2.4 3.0 3.7 4.3
Bangladesh 5.6 6.5 6.5 6.0 6.1 6.6 7.0 6.8 6.6 18.5 2010
Bhutan 11.7 7.9 5.1 2.1 5.5 5.2 6.3 6.5 7.0 2.2 2012
Cambodia 6.0 7.1 7.3 7.4 7.1 7.0 7.0 7.0 7.1 2.2 2012
Kiribati -1.6 0.5 5.2 5.8 2.4 3.7 2.0 2.0 2.1 14.1 2006
Lao People’s Democratic Republic
8.1 8.0 7.9 8.0 7.6 7.6 7.0 7.5 7.5 16.7 2012
Myanmar 10.2 5.6 7.3 8.4 8.0 7.3 8.0 8.0
Nepal 4.8 3.4 4.8 4.1 6.0 2.7 2.2 3.8 4.5 15.0 2010
Solomon Islands 10.6 6.4 2.6 3.0 2.0 3.2 2.4 2.5 3.0 45.6 2005
Timor-Leste -1.3 10.6 1.9 -12.8 -27.8 4.3 4.6 5.1 5.6 46.8 2007
Tuvalu -2.7 8.5 0.2 1.3 2.2 2.6 4.0 2.3 2.3 2.7 2010
Vanuatu 1.6 1.2 1.8 2.0 2.3 -1.0 3.3 3.6 3.9 15.4 2010
Yemen 5.7 -12.8 2.0 -1.6 -9.6 -28.1 -4.0 5.0 4.0
Average, Asia and the Pacific 5.9 3.6 6.2 5.0 3.8 2.4 5.9 6.5 6.4
The Americas
Haiti -5.5 5.5 2.9 4.2 2.8 1.7 1.5 1.4 2.1 53.9 2012
Average, all LDCs 6.0 4.4 6.0 5.4 5.1 3.8 3.3 5.2 5.5
Source: United Nations Statistics Division (http://unstats.un.org/unsd/databases.htm) and World Bank, Development Research Group (http://iresearch.worldbank.org/PovcalNet/index.htm); United Nations Department of Economic and Social Affairs; International Monetary Fund.

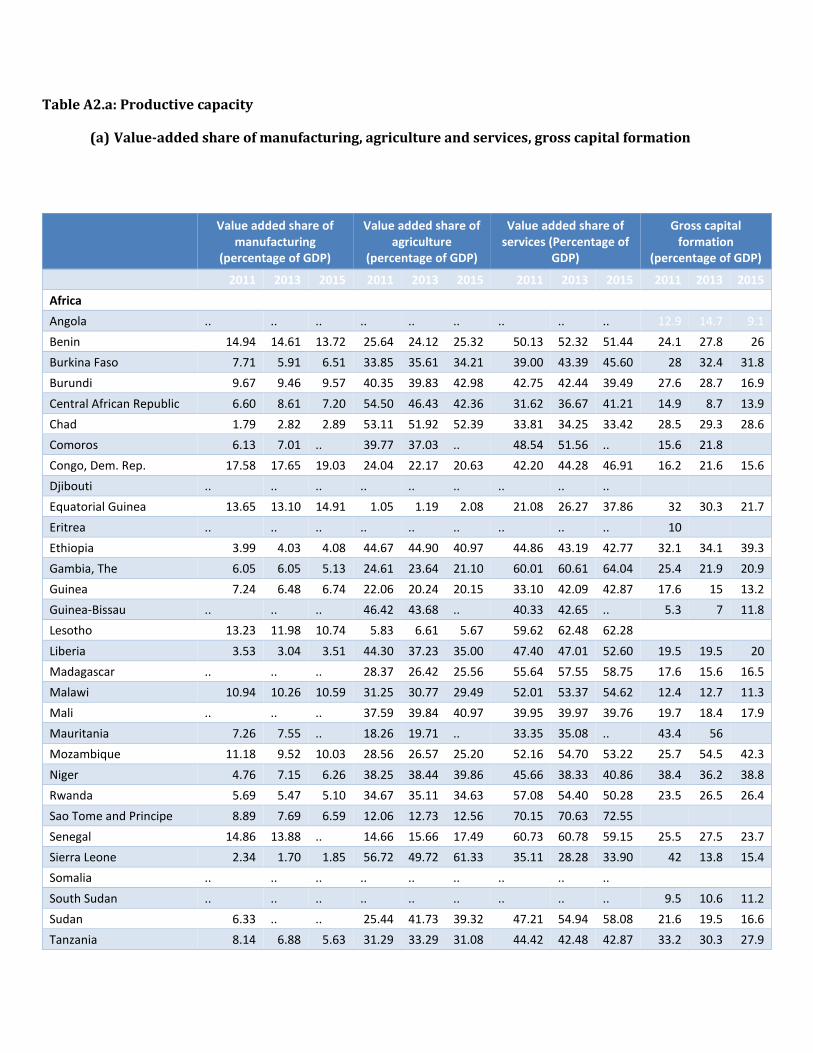
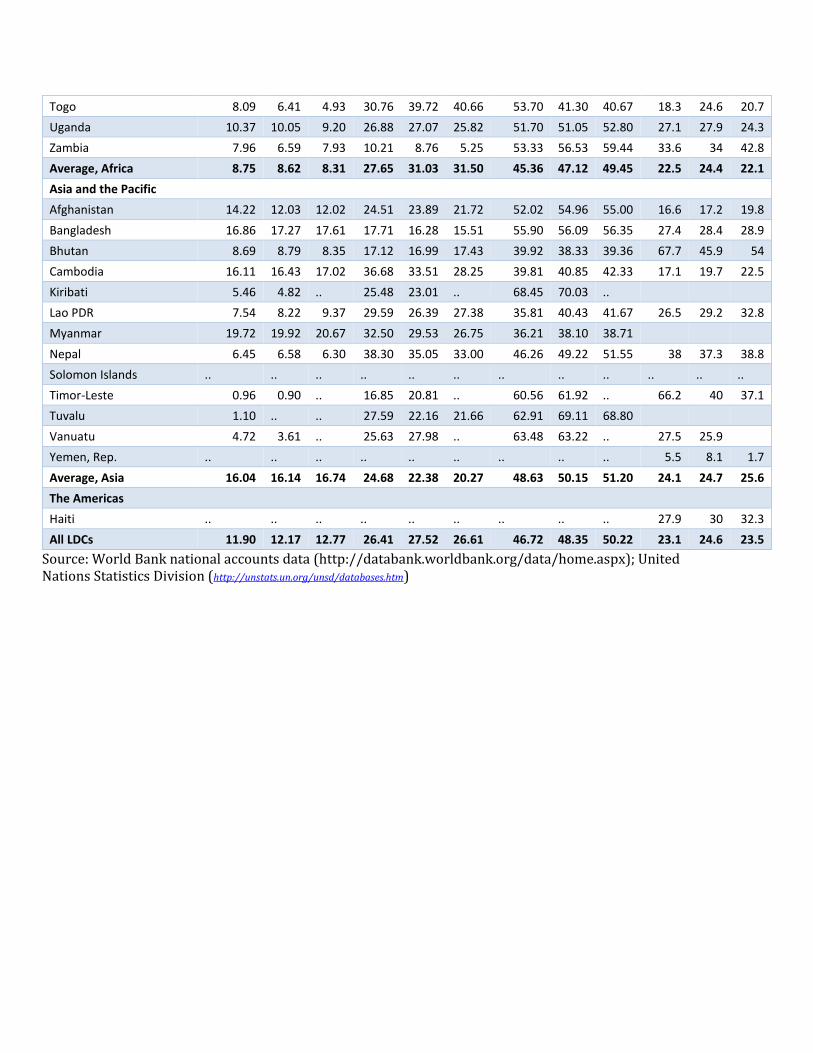
Table A2.a: Productive capacity
(a) Value-added share of manufacturing, agriculture and services, gross capital formation
Value added share of
manufacturing (percentage of GDP)
Value added share of agriculture
(percentage of GDP)
Value added share of services (Percentage of
GDP)
Gross capital formation
(percentage of GDP)
2011 2013 2015 2011 2013 2015 2011 2013 2015 2011 2013 2015
Africa
Angola .. .. .. .. .. .. .. .. .. 12.9 14.7 9.1
Benin 14.94 14.61 13.72 25.64 24.12 25.32 50.13 52.32 51.44 24.1 27.8 26
Burkina Faso 7.71 5.91 6.51 33.85 35.61 34.21 39.00 43.39 45.60 28 32.4 31.8
Burundi 9.67 9.46 9.57 40.35 39.83 42.98 42.75 42.44 39.49 27.6 28.7 16.9
Central African Republic 6.60 8.61 7.20 54.50 46.43 42.36 31.62 36.67 41.21 14.9 8.7 13.9
Chad 1.79 2.82 2.89 53.11 51.92 52.39 33.81 34.25 33.42 28.5 29.3 28.6
Comoros 6.13 7.01 .. 39.77 37.03 .. 48.54 51.56 .. 15.6 21.8
Congo, Dem. Rep. 17.58 17.65 19.03 24.04 22.17 20.63 42.20 44.28 46.91 16.2 21.6 15.6
Djibouti .. .. .. .. .. .. .. .. ..
Equatorial Guinea 13.65 13.10 14.91 1.05 1.19 2.08 21.08 26.27 37.86 32 30.3 21.7
Eritrea .. .. .. .. .. .. .. .. .. 10
Ethiopia 3.99 4.03 4.08 44.67 44.90 40.97 44.86 43.19 42.77 32.1 34.1 39.3
Gambia, The 6.05 6.05 5.13 24.61 23.64 21.10 60.01 60.61 64.04 25.4 21.9 20.9
Guinea 7.24 6.48 6.74 22.06 20.24 20.15 33.10 42.09 42.87 17.6 15 13.2
Guinea-Bissau .. .. .. 46.42 43.68 .. 40.33 42.65 .. 5.3 7 11.8
Lesotho 13.23 11.98 10.74 5.83 6.61 5.67 59.62 62.48 62.28
Liberia 3.53 3.04 3.51 44.30 37.23 35.00 47.40 47.01 52.60 19.5 19.5 20
Madagascar .. .. .. 28.37 26.42 25.56 55.64 57.55 58.75 17.6 15.6 16.5
Malawi 10.94 10.26 10.59 31.25 30.77 29.49 52.01 53.37 54.62 12.4 12.7 11.3
Mali .. .. .. 37.59 39.84 40.97 39.95 39.97 39.76 19.7 18.4 17.9
Mauritania 7.26 7.55 .. 18.26 19.71 .. 33.35 35.08 .. 43.4 56
Mozambique 11.18 9.52 10.03 28.56 26.57 25.20 52.16 54.70 53.22 25.7 54.5 42.3
Niger 4.76 7.15 6.26 38.25 38.44 39.86 45.66 38.33 40.86 38.4 36.2 38.8
Rwanda 5.69 5.47 5.10 34.67 35.11 34.63 57.08 54.40 50.28 23.5 26.5 26.4
Sao Tome and Principe 8.89 7.69 6.59 12.06 12.73 12.56 70.15 70.63 72.55
Senegal 14.86 13.88 .. 14.66 15.66 17.49 60.73 60.78 59.15 25.5 27.5 23.7
Sierra Leone 2.34 1.70 1.85 56.72 49.72 61.33 35.11 28.28 33.90 42 13.8 15.4
Somalia .. .. .. .. .. .. .. .. ..
South Sudan .. .. .. .. .. .. .. .. .. 9.5 10.6 11.2
Sudan 6.33 .. .. 25.44 41.73 39.32 47.21 54.94 58.08 21.6 19.5 16.6
Tanzania 8.14 6.88 5.63 31.29 33.29 31.08 44.42 42.48 42.87 33.2 30.3 27.9
Togo 8.09 6.41 4.93 30.76 39.72 40.66 53.70 41.30 40.67 18.3 24.6 20.7
Uganda 10.37 10.05 9.20 26.88 27.07 25.82 51.70 51.05 52.80 27.1 27.9 24.3
Zambia 7.96 6.59 7.93 10.21 8.76 5.25 53.33 56.53 59.44 33.6 34 42.8
Average, Africa 8.75 8.62 8.31 27.65 31.03 31.50 45.36 47.12 49.45 22.5 24.4 22.1
Asia and the Pacific
Afghanistan 14.22 12.03 12.02 24.51 23.89 21.72 52.02 54.96 55.00 16.6 17.2 19.8
Bangladesh 16.86 17.27 17.61 17.71 16.28 15.51 55.90 56.09 56.35 27.4 28.4 28.9
Bhutan 8.69 8.79 8.35 17.12 16.99 17.43 39.92 38.33 39.36 67.7 45.9 54
Cambodia 16.11 16.43 17.02 36.68 33.51 28.25 39.81 40.85 42.33 17.1 19.7 22.5
Kiribati 5.46 4.82 .. 25.48 23.01 .. 68.45 70.03 ..
Lao PDR 7.54 8.22 9.37 29.59 26.39 27.38 35.81 40.43 41.67 26.5 29.2 32.8
Myanmar 19.72 19.92 20.67 32.50 29.53 26.75 36.21 38.10 38.71
Nepal 6.45 6.58 6.30 38.30 35.05 33.00 46.26 49.22 51.55 38 37.3 38.8
Solomon Islands .. .. .. .. .. .. .. .. .. .. .. ..
Timor-Leste 0.96 0.90 .. 16.85 20.81 .. 60.56 61.92 .. 66.2 40 37.1
Tuvalu 1.10 .. .. 27.59 22.16 21.66 62.91 69.11 68.80
Vanuatu 4.72 3.61 .. 25.63 27.98 .. 63.48 63.22 .. 27.5 25.9
Yemen, Rep. .. .. .. .. .. .. .. .. .. 5.5 8.1 1.7
Average, Asia 16.04 16.14 16.74 24.68 22.38 20.27 48.63 50.15 51.20 24.1 24.7 25.6
The Americas
Haiti .. .. .. .. .. .. .. .. .. 27.9 30 32.3
All LDCs 11.90 12.17 12.77 26.41 27.52 26.61 46.72 48.35 50.22 23.1 24.6 23.5
Source: World Bank national accounts data (http://databank.worldbank.org/data/home.aspx); United Nations Statistics Division (http://unstats.un.org/unsd/databases.htm)
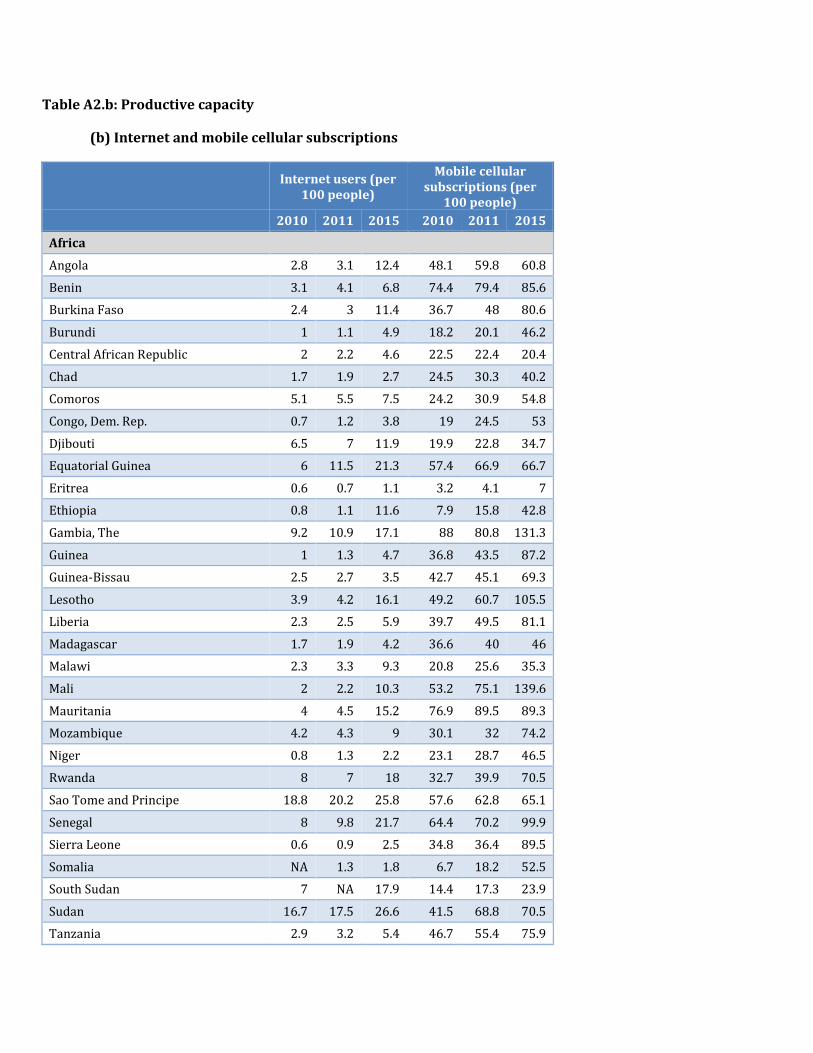
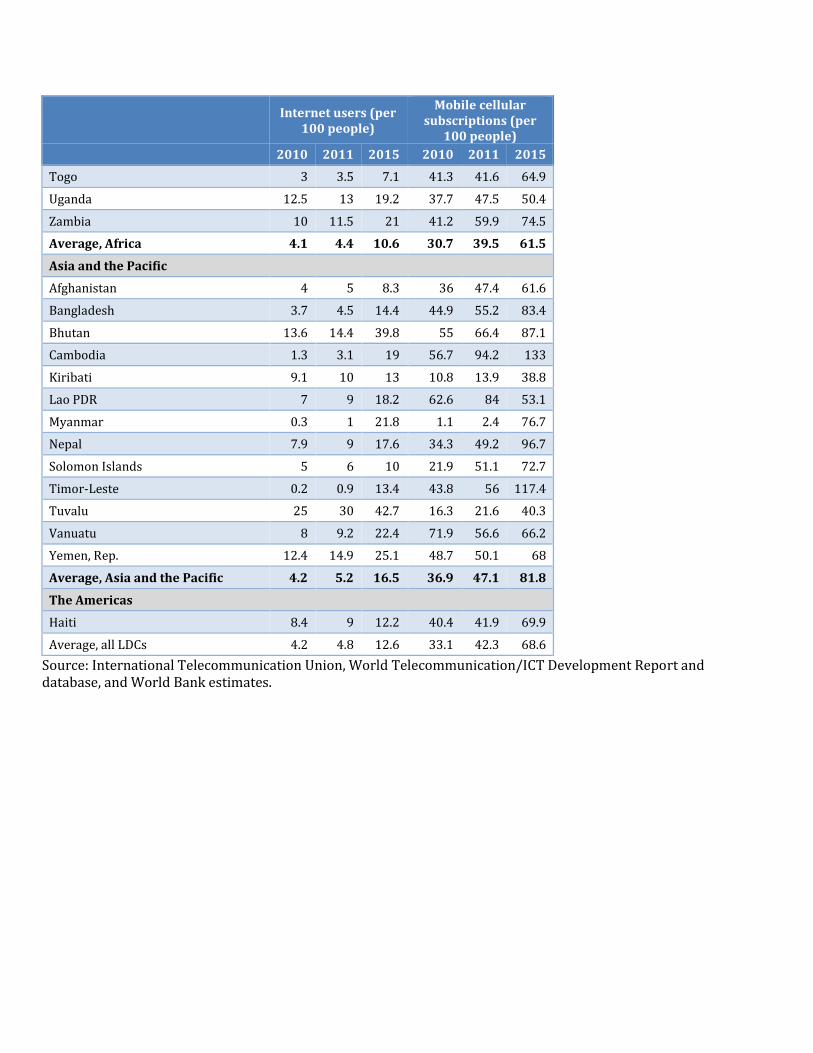
Table A2.b: Productive capacity
(b) Internet and mobile cellular subscriptions
Internet users (per
100 people)
Mobile cellular subscriptions (per
100 people)
2010 2011 2015 2010 2011 2015
Africa
Angola 2.8 3.1 12.4 48.1 59.8 60.8
Benin 3.1 4.1 6.8 74.4 79.4 85.6
Burkina Faso 2.4 3 11.4 36.7 48 80.6
Burundi 1 1.1 4.9 18.2 20.1 46.2
Central African Republic 2 2.2 4.6 22.5 22.4 20.4
Chad 1.7 1.9 2.7 24.5 30.3 40.2
Comoros 5.1 5.5 7.5 24.2 30.9 54.8
Congo, Dem. Rep. 0.7 1.2 3.8 19 24.5 53
Djibouti 6.5 7 11.9 19.9 22.8 34.7
Equatorial Guinea 6 11.5 21.3 57.4 66.9 66.7
Eritrea 0.6 0.7 1.1 3.2 4.1 7
Ethiopia 0.8 1.1 11.6 7.9 15.8 42.8
Gambia, The 9.2 10.9 17.1 88 80.8 131.3
Guinea 1 1.3 4.7 36.8 43.5 87.2
Guinea-Bissau 2.5 2.7 3.5 42.7 45.1 69.3
Lesotho 3.9 4.2 16.1 49.2 60.7 105.5
Liberia 2.3 2.5 5.9 39.7 49.5 81.1
Madagascar 1.7 1.9 4.2 36.6 40 46
Malawi 2.3 3.3 9.3 20.8 25.6 35.3
Mali 2 2.2 10.3 53.2 75.1 139.6
Mauritania 4 4.5 15.2 76.9 89.5 89.3
Mozambique 4.2 4.3 9 30.1 32 74.2
Niger 0.8 1.3 2.2 23.1 28.7 46.5
Rwanda 8 7 18 32.7 39.9 70.5
Sao Tome and Principe 18.8 20.2 25.8 57.6 62.8 65.1
Senegal 8 9.8 21.7 64.4 70.2 99.9
Sierra Leone 0.6 0.9 2.5 34.8 36.4 89.5
Somalia NA 1.3 1.8 6.7 18.2 52.5
South Sudan 7 NA 17.9 14.4 17.3 23.9
Sudan 16.7 17.5 26.6 41.5 68.8 70.5
Tanzania 2.9 3.2 5.4 46.7 55.4 75.9
Internet users (per
100 people)
Mobile cellular subscriptions (per
100 people)
2010 2011 2015 2010 2011 2015
Togo 3 3.5 7.1 41.3 41.6 64.9
Uganda 12.5 13 19.2 37.7 47.5 50.4
Zambia 10 11.5 21 41.2 59.9 74.5
Average, Africa 4.1 4.4 10.6 30.7 39.5 61.5
Asia and the Pacific
Afghanistan 4 5 8.3 36 47.4 61.6
Bangladesh 3.7 4.5 14.4 44.9 55.2 83.4
Bhutan 13.6 14.4 39.8 55 66.4 87.1
Cambodia 1.3 3.1 19 56.7 94.2 133
Kiribati 9.1 10 13 10.8 13.9 38.8
Lao PDR 7 9 18.2 62.6 84 53.1
Myanmar 0.3 1 21.8 1.1 2.4 76.7
Nepal 7.9 9 17.6 34.3 49.2 96.7
Solomon Islands 5 6 10 21.9 51.1 72.7
Timor-Leste 0.2 0.9 13.4 43.8 56 117.4
Tuvalu 25 30 42.7 16.3 21.6 40.3
Vanuatu 8 9.2 22.4 71.9 56.6 66.2
Yemen, Rep. 12.4 14.9 25.1 48.7 50.1 68
Average, Asia and the Pacific 4.2 5.2 16.5 36.9 47.1 81.8
The Americas
Haiti 8.4 9 12.2 40.4 41.9 69.9
Average, all LDCs 4.2 4.8 12.6 33.1 42.3 68.6
Source: International Telecommunication Union, World Telecommunication/ICT Development Report and database, and World Bank estimates.
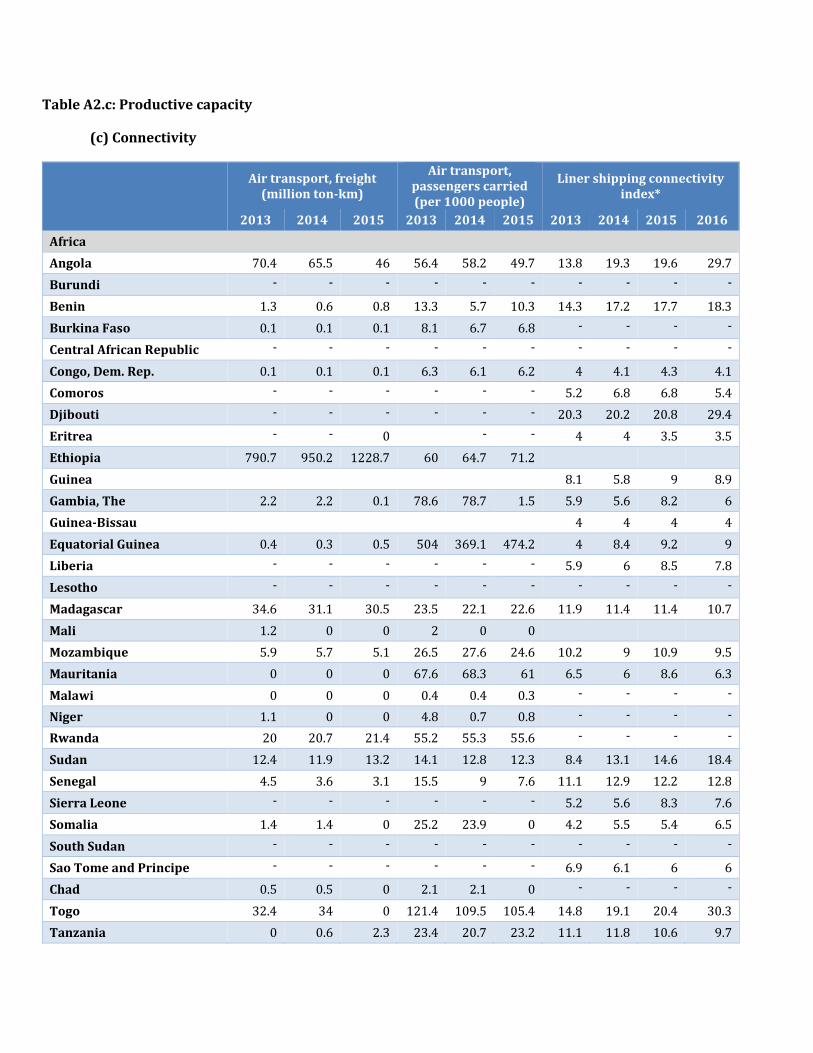
Table A2.c: Productive capacity
(c) Connectivity
Air transport, freight (million ton-km)
Air transport, passengers carried (per 1000 people)
Liner shipping connectivity index*
2013 2014 2015 2013 2014 2015 2013 2014 2015 2016
Africa
Angola 70.4 65.5 46 56.4 58.2 49.7 13.8 19.3 19.6 29.7
Burundi - - - - - - - - - -
Benin 1.3 0.6 0.8 13.3 5.7 10.3 14.3 17.2 17.7 18.3
Burkina Faso 0.1 0.1 0.1 8.1 6.7 6.8 - - - -
Central African Republic - - - - - - - - - -
Congo, Dem. Rep. 0.1 0.1 0.1 6.3 6.1 6.2 4 4.1 4.3 4.1
Comoros - - - - - - 5.2 6.8 6.8 5.4
Djibouti - - - - - - 20.3 20.2 20.8 29.4
Eritrea - - 0 - - 4 4 3.5 3.5
Ethiopia 790.7 950.2 1228.7 60 64.7 71.2
Guinea 8.1 5.8 9 8.9
Gambia, The 2.2 2.2 0.1 78.6 78.7 1.5 5.9 5.6 8.2 6
Guinea-Bissau 4 4 4 4
Equatorial Guinea 0.4 0.3 0.5 504 369.1 474.2 4 8.4 9.2 9
Liberia - - - - - - 5.9 6 8.5 7.8
Lesotho - - - - - - - - - -
Madagascar 34.6 31.1 30.5 23.5 22.1 22.6 11.9 11.4 11.4 10.7
Mali 1.2 0 0 2 0 0
Mozambique 5.9 5.7 5.1 26.5 27.6 24.6 10.2 9 10.9 9.5
Mauritania 0 0 0 67.6 68.3 61 6.5 6 8.6 6.3
Malawi 0 0 0 0.4 0.4 0.3 - - - -
Niger 1.1 0 0 4.8 0.7 0.8 - - - -
Rwanda 20 20.7 21.4 55.2 55.3 55.6 - - - -
Sudan 12.4 11.9 13.2 14.1 12.8 12.3 8.4 13.1 14.6 18.4
Senegal 4.5 3.6 3.1 15.5 9 7.6 11.1 12.9 12.2 12.8
Sierra Leone - - - - - - 5.2 5.6 8.3 7.6
Somalia 1.4 1.4 0 25.2 23.9 0 4.2 5.5 5.4 6.5
South Sudan - - - - - - - - - -
Sao Tome and Principe - - - - - - 6.9 6.1 6 6
Chad 0.5 0.5 0 2.1 2.1 0 - - - -
Togo 32.4 34 0 121.4 109.5 105.4 14.8 19.1 20.4 30.3
Tanzania 0 0.6 2.3 23.4 20.7 23.2 11.1 11.8 10.6 9.7
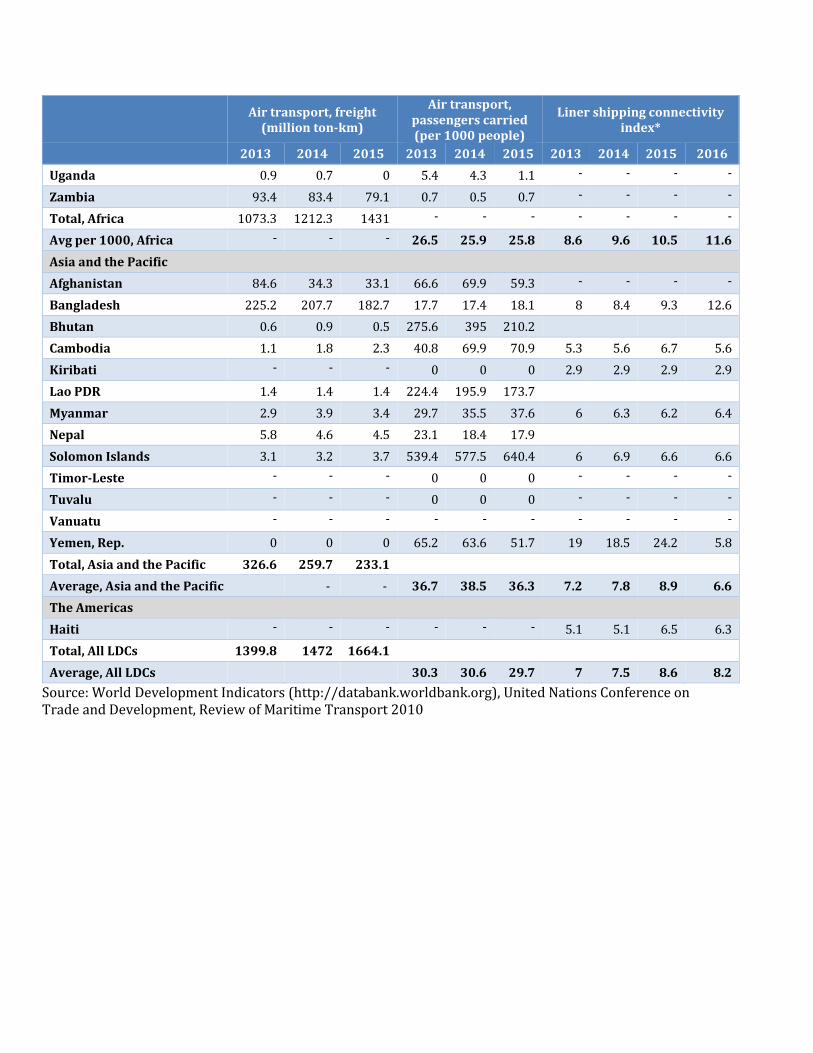
Air transport, freight (million ton-km)
Air transport, passengers carried (per 1000 people)
Liner shipping connectivity index*
2013 2014 2015 2013 2014 2015 2013 2014 2015 2016
Uganda 0.9 0.7 0 5.4 4.3 1.1 - - - -
Zambia 93.4 83.4 79.1 0.7 0.5 0.7 - - - -
Total, Africa 1073.3 1212.3 1431 - - - - - - -
Avg per 1000, Africa - - - 26.5 25.9 25.8 8.6 9.6 10.5 11.6
Asia and the Pacific
Afghanistan 84.6 34.3 33.1 66.6 69.9 59.3 - - - -
Bangladesh 225.2 207.7 182.7 17.7 17.4 18.1 8 8.4 9.3 12.6
Bhutan 0.6 0.9 0.5 275.6 395 210.2
Cambodia 1.1 1.8 2.3 40.8 69.9 70.9 5.3 5.6 6.7 5.6
Kiribati - - - 0 0 0 2.9 2.9 2.9 2.9
Lao PDR 1.4 1.4 1.4 224.4 195.9 173.7
Myanmar 2.9 3.9 3.4 29.7 35.5 37.6 6 6.3 6.2 6.4
Nepal 5.8 4.6 4.5 23.1 18.4 17.9
Solomon Islands 3.1 3.2 3.7 539.4 577.5 640.4 6 6.9 6.6 6.6
Timor-Leste - - - 0 0 0 - - - -
Tuvalu - - - 0 0 0 - - - -
Vanuatu - - - - - - - - - -
Yemen, Rep. 0 0 0 65.2 63.6 51.7 19 18.5 24.2 5.8
Total, Asia and the Pacific 326.6 259.7 233.1
Average, Asia and the Pacific - - 36.7 38.5 36.3 7.2 7.8 8.9 6.6
The Americas
Haiti - - - - - - 5.1 5.1 6.5 6.3
Total, All LDCs 1399.8 1472 1664.1
Average, All LDCs 30.3 30.6 29.7 7 7.5 8.6 8.2
Source: World Development Indicators (http://databank.worldbank.org), United Nations Conference on Trade and Development, Review of Maritime Transport 2010
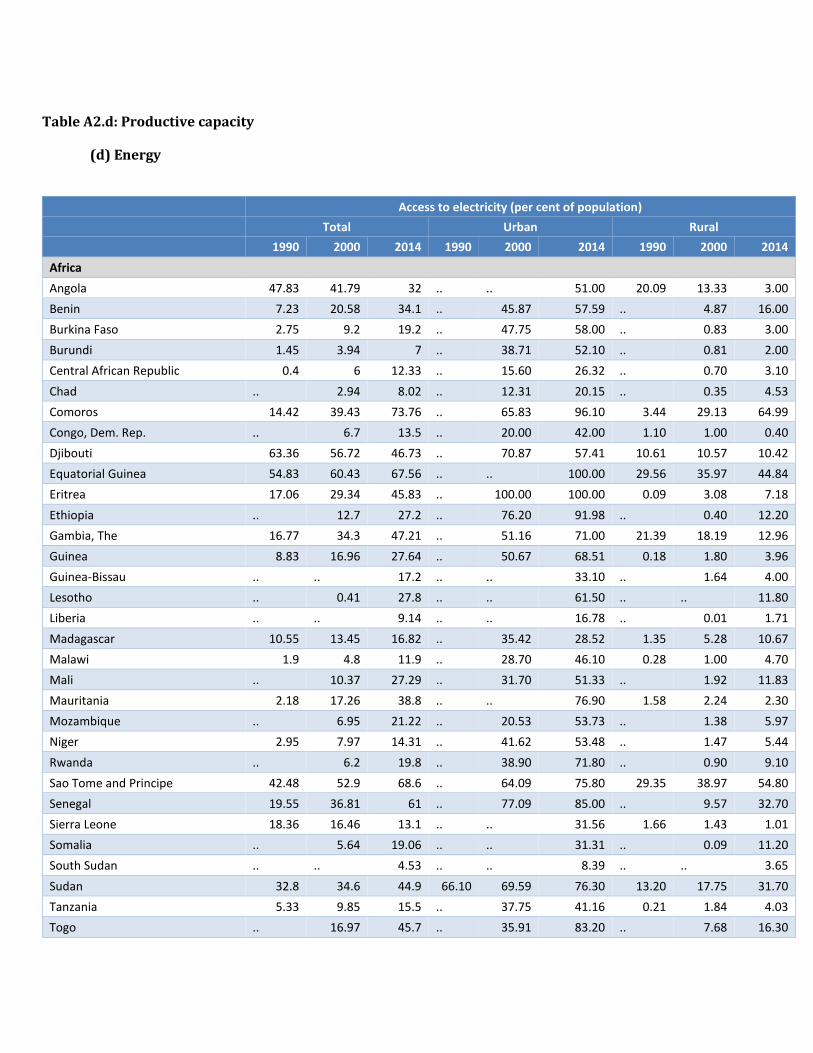
Table A2.d: Productive capacity
(d) Energy
Access to electricity (per cent of population)
Total Urban Rural 1990 2000 2014 1990 2000 2014 1990 2000 2014
Africa
Angola 47.83 41.79 32 .. .. 51.00 20.09 13.33 3.00
Benin 7.23 20.58 34.1 .. 45.87 57.59 .. 4.87 16.00
Burkina Faso 2.75 9.2 19.2 .. 47.75 58.00 .. 0.83 3.00
Burundi 1.45 3.94 7 .. 38.71 52.10 .. 0.81 2.00
Central African Republic 0.4 6 12.33 .. 15.60 26.32 .. 0.70 3.10
Chad .. 2.94 8.02 .. 12.31 20.15 .. 0.35 4.53
Comoros 14.42 39.43 73.76 .. 65.83 96.10 3.44 29.13 64.99
Congo, Dem. Rep. .. 6.7 13.5 .. 20.00 42.00 1.10 1.00 0.40
Djibouti 63.36 56.72 46.73 .. 70.87 57.41 10.61 10.57 10.42
Equatorial Guinea 54.83 60.43 67.56 .. .. 100.00 29.56 35.97 44.84
Eritrea 17.06 29.34 45.83 .. 100.00 100.00 0.09 3.08 7.18
Ethiopia .. 12.7 27.2 .. 76.20 91.98 .. 0.40 12.20
Gambia, The 16.77 34.3 47.21 .. 51.16 71.00 21.39 18.19 12.96
Guinea 8.83 16.96 27.64 .. 50.67 68.51 0.18 1.80 3.96
Guinea-Bissau .. .. 17.2 .. .. 33.10 .. 1.64 4.00
Lesotho .. 0.41 27.8 .. .. 61.50 .. .. 11.80
Liberia .. .. 9.14 .. .. 16.78 .. 0.01 1.71
Madagascar 10.55 13.45 16.82 .. 35.42 28.52 1.35 5.28 10.67
Malawi 1.9 4.8 11.9 .. 28.70 46.10 0.28 1.00 4.70
Mali .. 10.37 27.29 .. 31.70 51.33 .. 1.92 11.83
Mauritania 2.18 17.26 38.8 .. .. 76.90 1.58 2.24 2.30
Mozambique .. 6.95 21.22 .. 20.53 53.73 .. 1.38 5.97
Niger 2.95 7.97 14.31 .. 41.62 53.48 .. 1.47 5.44
Rwanda .. 6.2 19.8 .. 38.90 71.80 .. 0.90 9.10
Sao Tome and Principe 42.48 52.9 68.6 .. 64.09 75.80 29.35 38.97 54.80
Senegal 19.55 36.81 61 .. 77.09 85.00 .. 9.57 32.70
Sierra Leone 18.36 16.46 13.1 .. .. 31.56 1.66 1.43 1.01
Somalia .. 5.64 19.06 .. .. 31.31 .. 0.09 11.20
South Sudan .. .. 4.53 .. .. 8.39 .. .. 3.65
Sudan 32.8 34.6 44.9 66.10 69.59 76.30 13.20 17.75 31.70
Tanzania 5.33 9.85 15.5 .. 37.75 41.16 0.21 1.84 4.03
Togo .. 16.97 45.7 .. 35.91 83.20 .. 7.68 16.30
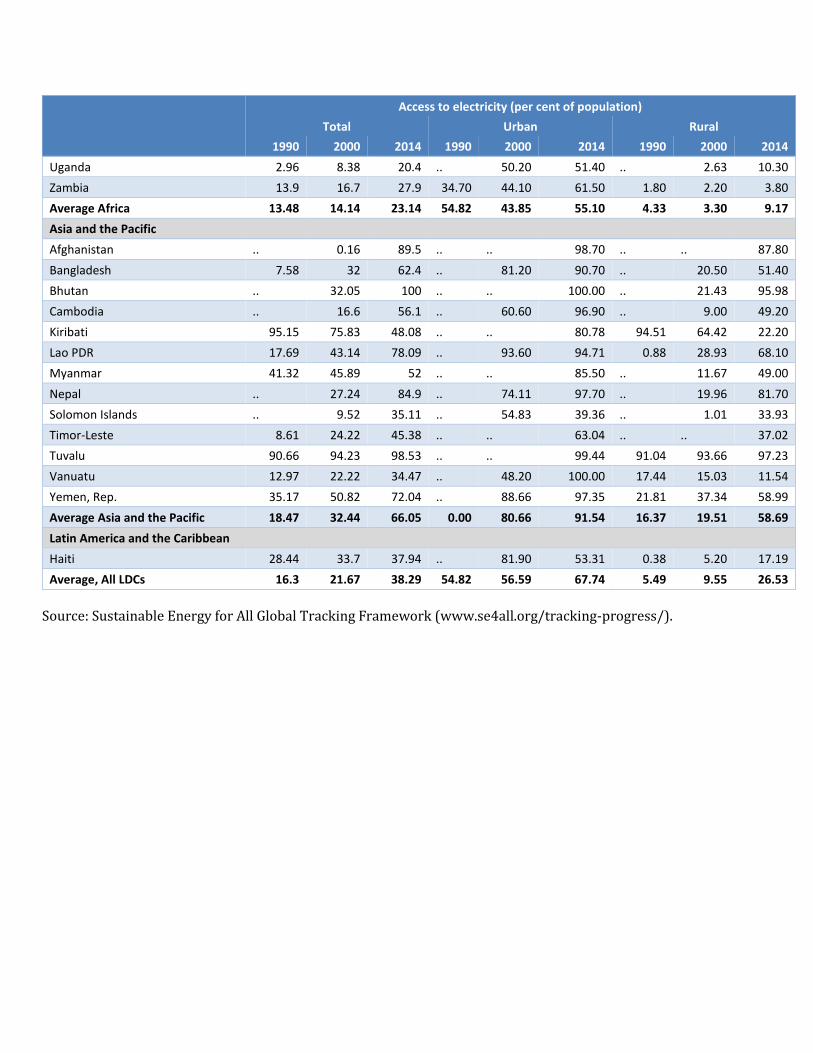
Access to electricity (per cent of population) Total Urban Rural 1990 2000 2014 1990 2000 2014 1990 2000 2014
Uganda 2.96 8.38 20.4 .. 50.20 51.40 .. 2.63 10.30
Zambia 13.9 16.7 27.9 34.70 44.10 61.50 1.80 2.20 3.80
Average Africa 13.48 14.14 23.14 54.82 43.85 55.10 4.33 3.30 9.17
Asia and the Pacific
Afghanistan .. 0.16 89.5 .. .. 98.70 .. .. 87.80
Bangladesh 7.58 32 62.4 .. 81.20 90.70 .. 20.50 51.40
Bhutan .. 32.05 100 .. .. 100.00 .. 21.43 95.98
Cambodia .. 16.6 56.1 .. 60.60 96.90 .. 9.00 49.20
Kiribati 95.15 75.83 48.08 .. .. 80.78 94.51 64.42 22.20
Lao PDR 17.69 43.14 78.09 .. 93.60 94.71 0.88 28.93 68.10
Myanmar 41.32 45.89 52 .. .. 85.50 .. 11.67 49.00
Nepal .. 27.24 84.9 .. 74.11 97.70 .. 19.96 81.70
Solomon Islands .. 9.52 35.11 .. 54.83 39.36 .. 1.01 33.93
Timor-Leste 8.61 24.22 45.38 .. .. 63.04 .. .. 37.02
Tuvalu 90.66 94.23 98.53 .. .. 99.44 91.04 93.66 97.23
Vanuatu 12.97 22.22 34.47 .. 48.20 100.00 17.44 15.03 11.54
Yemen, Rep. 35.17 50.82 72.04 .. 88.66 97.35 21.81 37.34 58.99
Average Asia and the Pacific 18.47 32.44 66.05 0.00 80.66 91.54 16.37 19.51 58.69
Latin America and the Caribbean
Haiti 28.44 33.7 37.94 .. 81.90 53.31 0.38 5.20 17.19
Average, All LDCs 16.3 21.67 38.29 54.82 56.59 67.74 5.49 9.55 26.53
Source: Sustainable Energy for All Global Tracking Framework (www.se4all.org/tracking-progress/).
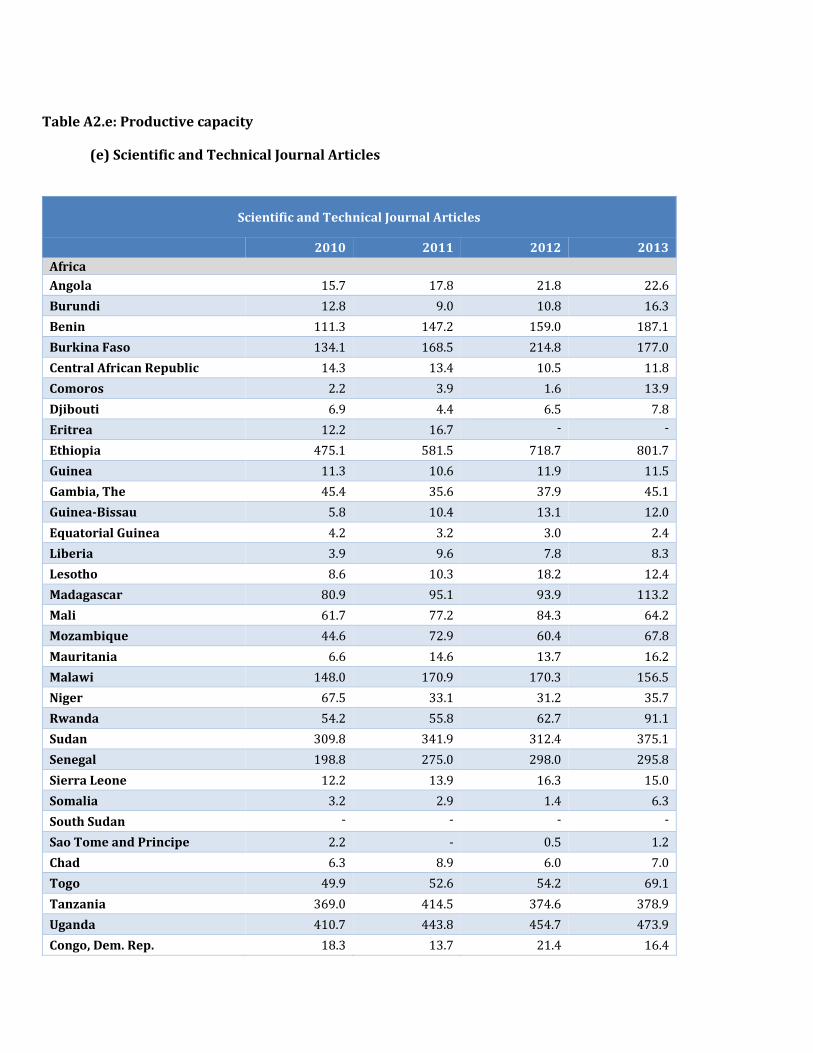
Table A2.e: Productive capacity
(e) Scientific and Technical Journal Articles
Scientific and Technical Journal Articles
2010 2011 2012 2013
Africa
Angola 15.7 17.8 21.8 22.6
Burundi 12.8 9.0 10.8 16.3
Benin 111.3 147.2 159.0 187.1
Burkina Faso 134.1 168.5 214.8 177.0
Central African Republic 14.3 13.4 10.5 11.8
Comoros 2.2 3.9 1.6 13.9
Djibouti 6.9 4.4 6.5 7.8
Eritrea 12.2 16.7 - -
Ethiopia 475.1 581.5 718.7 801.7
Guinea 11.3 10.6 11.9 11.5
Gambia, The 45.4 35.6 37.9 45.1
Guinea-Bissau 5.8 10.4 13.1 12.0
Equatorial Guinea 4.2 3.2 3.0 2.4
Liberia 3.9 9.6 7.8 8.3
Lesotho 8.6 10.3 18.2 12.4
Madagascar 80.9 95.1 93.9 113.2
Mali 61.7 77.2 84.3 64.2
Mozambique 44.6 72.9 60.4 67.8
Mauritania 6.6 14.6 13.7 16.2
Malawi 148.0 170.9 170.3 156.5
Niger 67.5 33.1 31.2 35.7
Rwanda 54.2 55.8 62.7 91.1
Sudan 309.8 341.9 312.4 375.1
Senegal 198.8 275.0 298.0 295.8
Sierra Leone 12.2 13.9 16.3 15.0
Somalia 3.2 2.9 1.4 6.3
South Sudan - - - -
Sao Tome and Principe 2.2 - 0.5 1.2
Chad 6.3 8.9 6.0 7.0
Togo 49.9 52.6 54.2 69.1
Tanzania 369.0 414.5 374.6 378.9
Uganda 410.7 443.8 454.7 473.9
Congo, Dem. Rep. 18.3 13.7 21.4 16.4
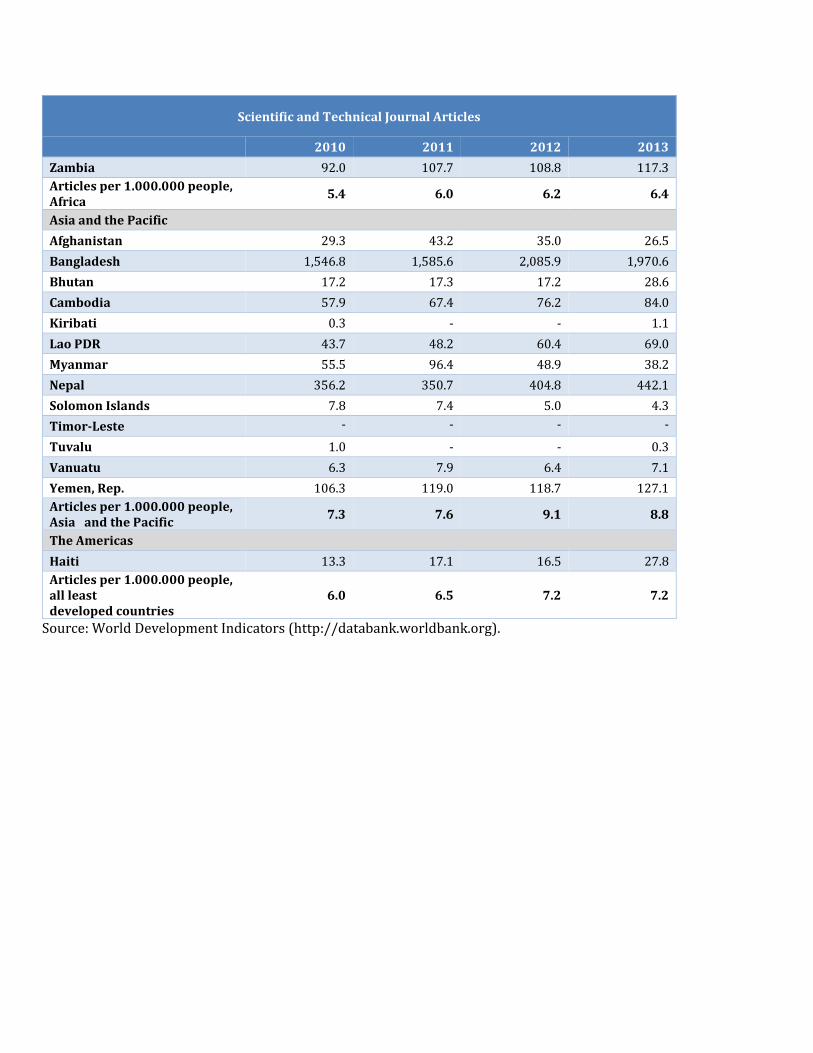
Scientific and Technical Journal Articles
2010 2011 2012 2013
Zambia 92.0 107.7 108.8 117.3
Articles per 1.000.000 people, Africa
5.4 6.0 6.2 6.4
Asia and the Pacific
Afghanistan 29.3 43.2 35.0 26.5
Bangladesh 1,546.8 1,585.6 2,085.9 1,970.6
Bhutan 17.2 17.3 17.2 28.6
Cambodia 57.9 67.4 76.2 84.0
Kiribati 0.3 - - 1.1
Lao PDR 43.7 48.2 60.4 69.0
Myanmar 55.5 96.4 48.9 38.2
Nepal 356.2 350.7 404.8 442.1
Solomon Islands 7.8 7.4 5.0 4.3
Timor-Leste - - - -
Tuvalu 1.0 - - 0.3
Vanuatu 6.3 7.9 6.4 7.1
Yemen, Rep. 106.3 119.0 118.7 127.1
Articles per 1.000.000 people, Asia and the Pacific
7.3 7.6 9.1 8.8
The Americas
Haiti 13.3 17.1 16.5 27.8
Articles per 1.000.000 people, all least developed countries
6.0 6.5 7.2 7.2
Source: World Development Indicators (http://databank.worldbank.org).
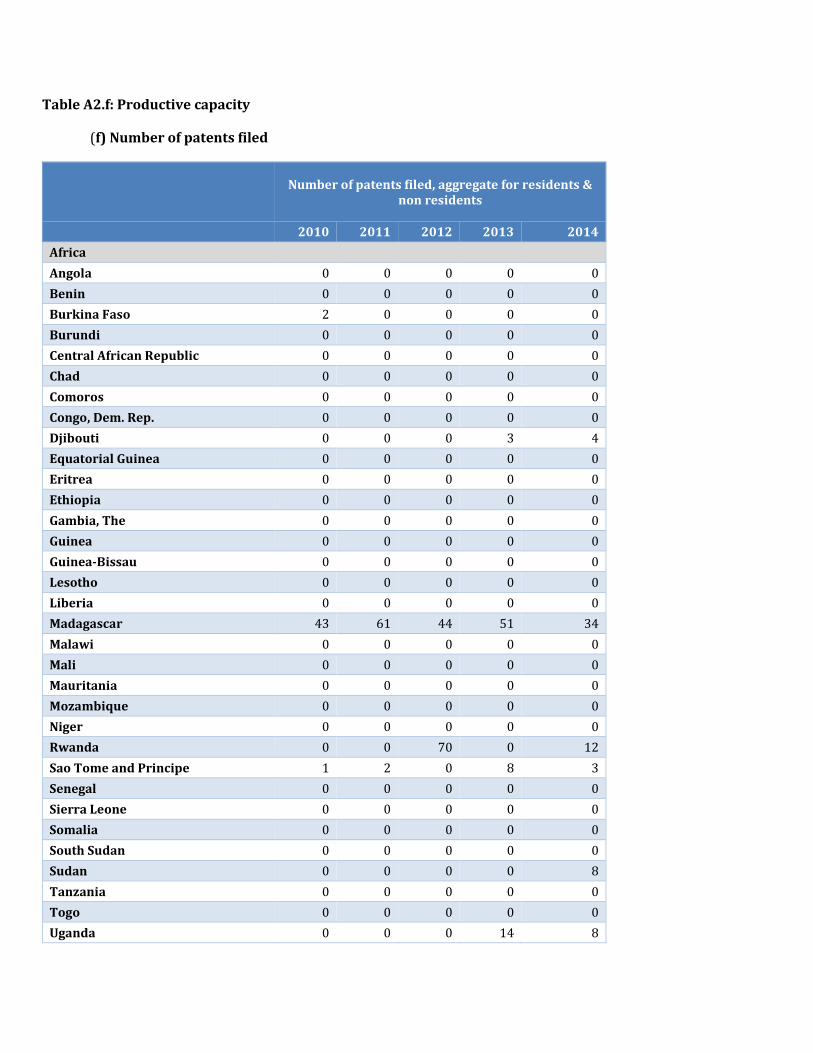
Table A2.f: Productive capacity
(f) Number of patents filed
Number of patents filed, aggregate for residents & non residents
2010 2011 2012 2013 2014
Africa
Angola 0 0 0 0 0
Benin 0 0 0 0 0
Burkina Faso 2 0 0 0 0
Burundi 0 0 0 0 0
Central African Republic 0 0 0 0 0
Chad 0 0 0 0 0
Comoros 0 0 0 0 0
Congo, Dem. Rep. 0 0 0 0 0
Djibouti 0 0 0 3 4
Equatorial Guinea 0 0 0 0 0
Eritrea 0 0 0 0 0
Ethiopia 0 0 0 0 0
Gambia, The 0 0 0 0 0
Guinea 0 0 0 0 0
Guinea-Bissau 0 0 0 0 0
Lesotho 0 0 0 0 0
Liberia 0 0 0 0 0
Madagascar 43 61 44 51 34
Malawi 0 0 0 0 0
Mali 0 0 0 0 0
Mauritania 0 0 0 0 0
Mozambique 0 0 0 0 0
Niger 0 0 0 0 0
Rwanda 0 0 70 0 12
Sao Tome and Principe 1 2 0 8 3
Senegal 0 0 0 0 0
Sierra Leone 0 0 0 0 0
Somalia 0 0 0 0 0
South Sudan 0 0 0 0 0
Sudan 0 0 0 0 8
Tanzania 0 0 0 0 0
Togo 0 0 0 0 0
Uganda 0 0 0 14 8
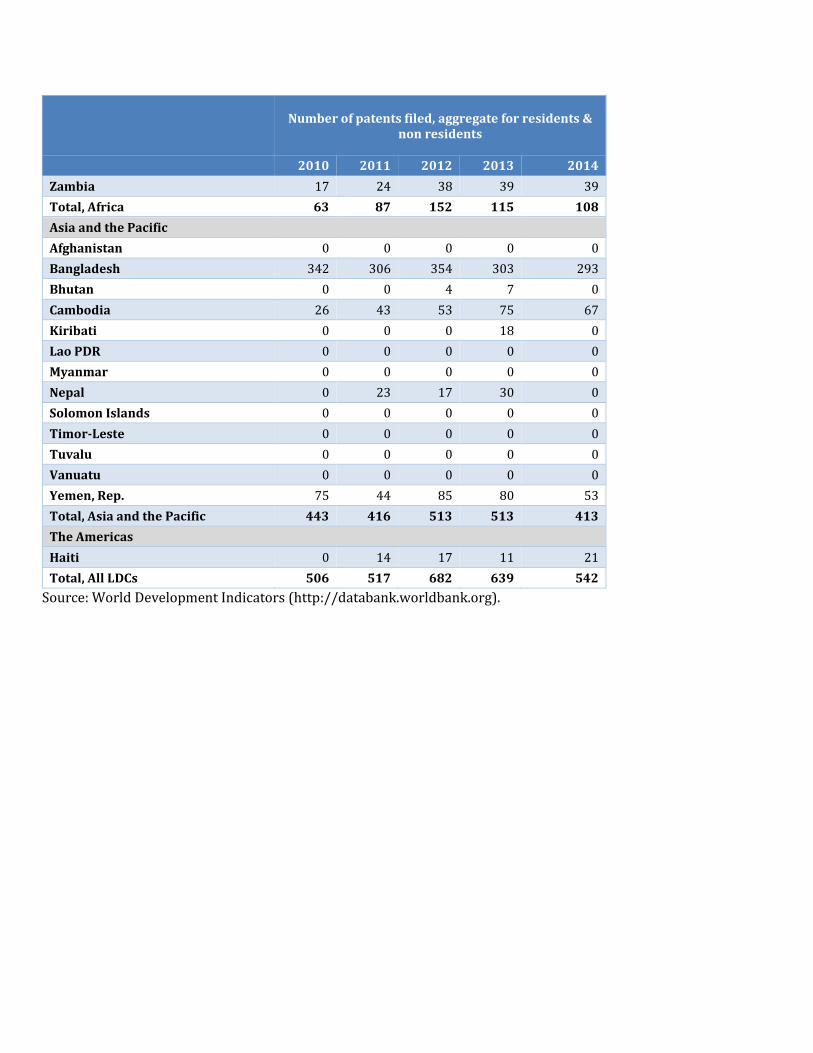
Number of patents filed, aggregate for residents & non residents
2010 2011 2012 2013 2014
Zambia 17 24 38 39 39
Total, Africa 63 87 152 115 108
Asia and the Pacific
Afghanistan 0 0 0 0 0
Bangladesh 342 306 354 303 293
Bhutan 0 0 4 7 0
Cambodia 26 43 53 75 67
Kiribati 0 0 0 18 0
Lao PDR 0 0 0 0 0
Myanmar 0 0 0 0 0
Nepal 0 23 17 30 0
Solomon Islands 0 0 0 0 0
Timor-Leste 0 0 0 0 0
Tuvalu 0 0 0 0 0
Vanuatu 0 0 0 0 0
Yemen, Rep. 75 44 85 80 53
Total, Asia and the Pacific 443 416 513 513 413
The Americas
Haiti 0 14 17 11 21
Total, All LDCs 506 517 682 639 542
Source: World Development Indicators (http://databank.worldbank.org).
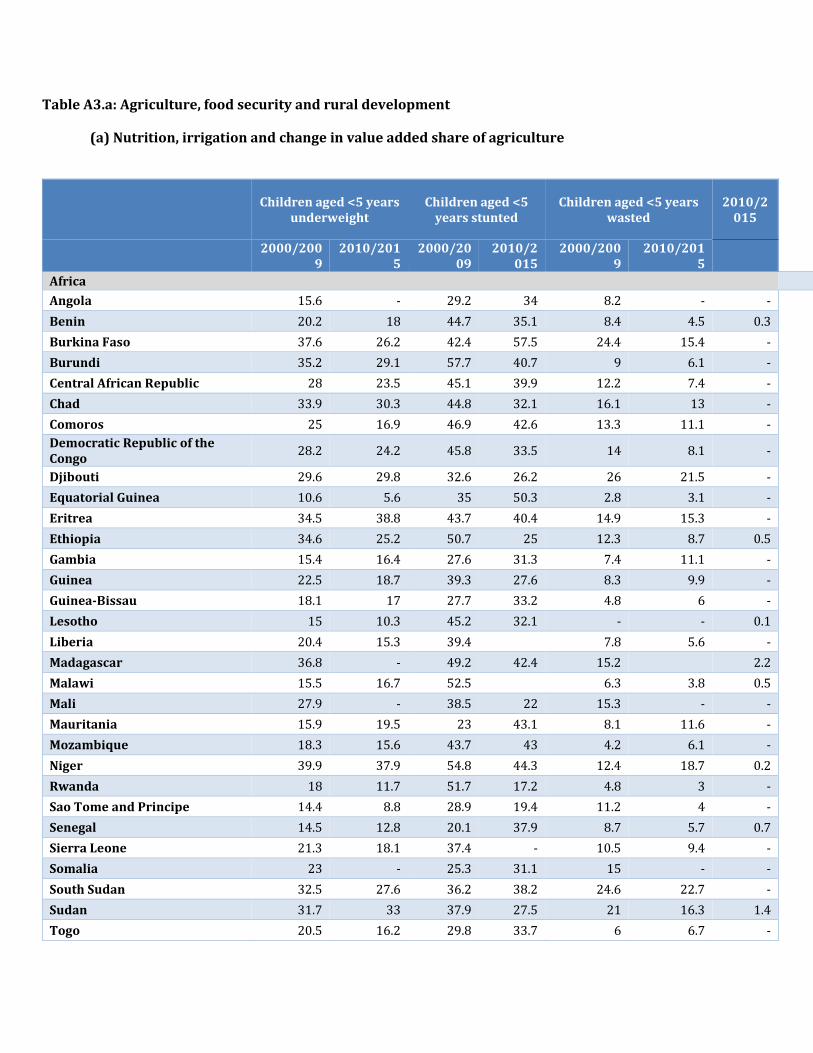
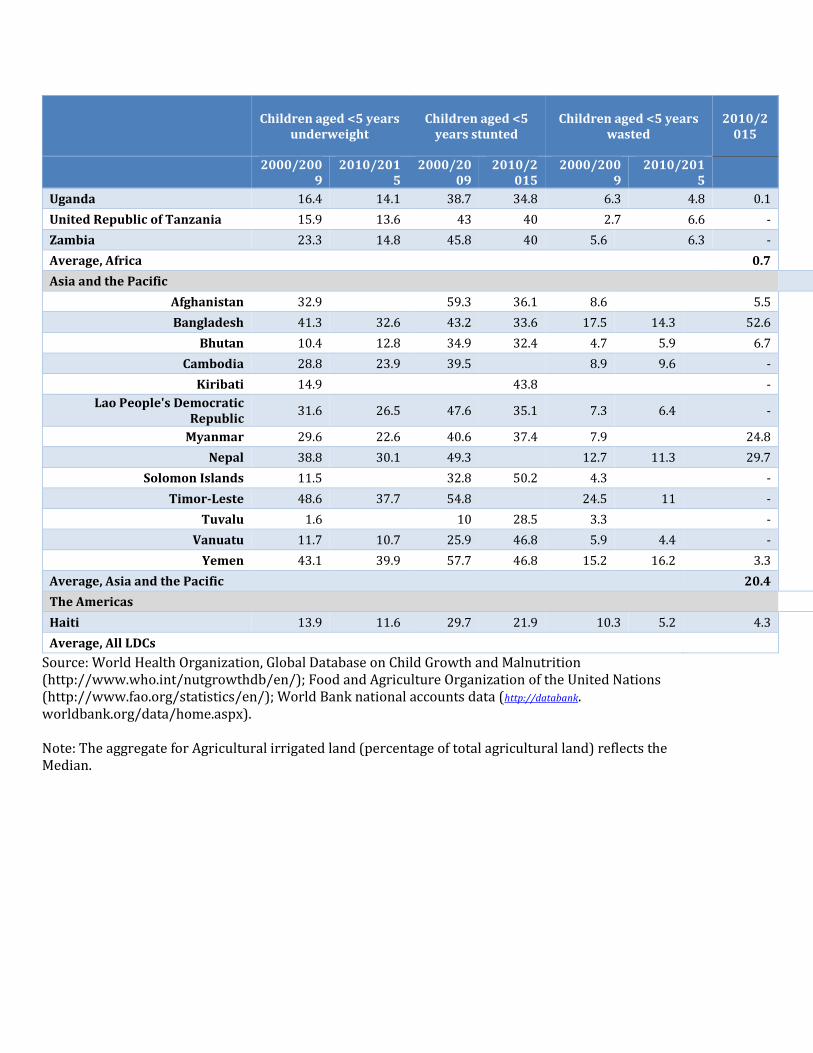
Table A3.a: Agriculture, food security and rural development
(a) Nutrition, irrigation and change in value added share of agriculture
Children aged <5 years underweight
Children aged <5 years stunted
Children aged <5 years wasted
2010/2015
2000/2009
2010/2015
2000/2009
2010/2015
2000/2009
2010/2015
Africa
Angola 15.6 - 29.2 34 8.2 - -
Benin 20.2 18 44.7 35.1 8.4 4.5 0.3
Burkina Faso 37.6 26.2 42.4 57.5 24.4 15.4 -
Burundi 35.2 29.1 57.7 40.7 9 6.1 -
Central African Republic 28 23.5 45.1 39.9 12.2 7.4 -
Chad 33.9 30.3 44.8 32.1 16.1 13 -
Comoros 25 16.9 46.9 42.6 13.3 11.1 -
Democratic Republic of the Congo
28.2 24.2 45.8 33.5 14 8.1 -
Djibouti 29.6 29.8 32.6 26.2 26 21.5 -
Equatorial Guinea 10.6 5.6 35 50.3 2.8 3.1 -
Eritrea 34.5 38.8 43.7 40.4 14.9 15.3 -
Ethiopia 34.6 25.2 50.7 25 12.3 8.7 0.5
Gambia 15.4 16.4 27.6 31.3 7.4 11.1 -
Guinea 22.5 18.7 39.3 27.6 8.3 9.9 -
Guinea-Bissau 18.1 17 27.7 33.2 4.8 6 -
Lesotho 15 10.3 45.2 32.1 - - 0.1
Liberia 20.4 15.3 39.4 7.8 5.6 -
Madagascar 36.8 - 49.2 42.4 15.2 2.2
Malawi 15.5 16.7 52.5 6.3 3.8 0.5
Mali 27.9 - 38.5 22 15.3 - -
Mauritania 15.9 19.5 23 43.1 8.1 11.6 -
Mozambique 18.3 15.6 43.7 43 4.2 6.1 -
Niger 39.9 37.9 54.8 44.3 12.4 18.7 0.2
Rwanda 18 11.7 51.7 17.2 4.8 3 -
Sao Tome and Principe 14.4 8.8 28.9 19.4 11.2 4 -
Senegal 14.5 12.8 20.1 37.9 8.7 5.7 0.7
Sierra Leone 21.3 18.1 37.4 - 10.5 9.4 -
Somalia 23 - 25.3 31.1 15 - -
South Sudan 32.5 27.6 36.2 38.2 24.6 22.7 -
Sudan 31.7 33 37.9 27.5 21 16.3 1.4
Togo 20.5 16.2 29.8 33.7 6 6.7 -
Children aged <5 years underweight
Children aged <5 years stunted
Children aged <5 years wasted
2010/2015
2000/2009
2010/2015
2000/2009
2010/2015
2000/2009
2010/2015
Uganda 16.4 14.1 38.7 34.8 6.3 4.8 0.1
United Republic of Tanzania 15.9 13.6 43 40 2.7 6.6 -
Zambia 23.3 14.8 45.8 40 5.6 6.3 -
Average, Africa 0.7
Asia and the Pacific
Afghanistan 32.9 59.3 36.1 8.6 5.5
Bangladesh 41.3 32.6 43.2 33.6 17.5 14.3 52.6
Bhutan 10.4 12.8 34.9 32.4 4.7 5.9 6.7
Cambodia 28.8 23.9 39.5 8.9 9.6 -
Kiribati 14.9 43.8 -
Lao People's Democratic Republic
31.6 26.5 47.6 35.1 7.3 6.4 -
Myanmar 29.6 22.6 40.6 37.4 7.9 24.8
Nepal 38.8 30.1 49.3 12.7 11.3 29.7
Solomon Islands 11.5 32.8 50.2 4.3 -
Timor-Leste 48.6 37.7 54.8 24.5 11 -
Tuvalu 1.6 10 28.5 3.3 -
Vanuatu 11.7 10.7 25.9 46.8 5.9 4.4 -
Yemen 43.1 39.9 57.7 46.8 15.2 16.2 3.3
Average, Asia and the Pacific 20.4
The Americas
Haiti 13.9 11.6 29.7 21.9 10.3 5.2 4.3
Average, All LDCs
Source: World Health Organization, Global Database on Child Growth and Malnutrition (http://www.who.int/nutgrowthdb/en/); Food and Agriculture Organization of the United Nations (http://www.fao.org/statistics/en/); World Bank national accounts data (http://databank. worldbank.org/data/home.aspx). Note: The aggregate for Agricultural irrigated land (percentage of total agricultural land) reflects the Median.
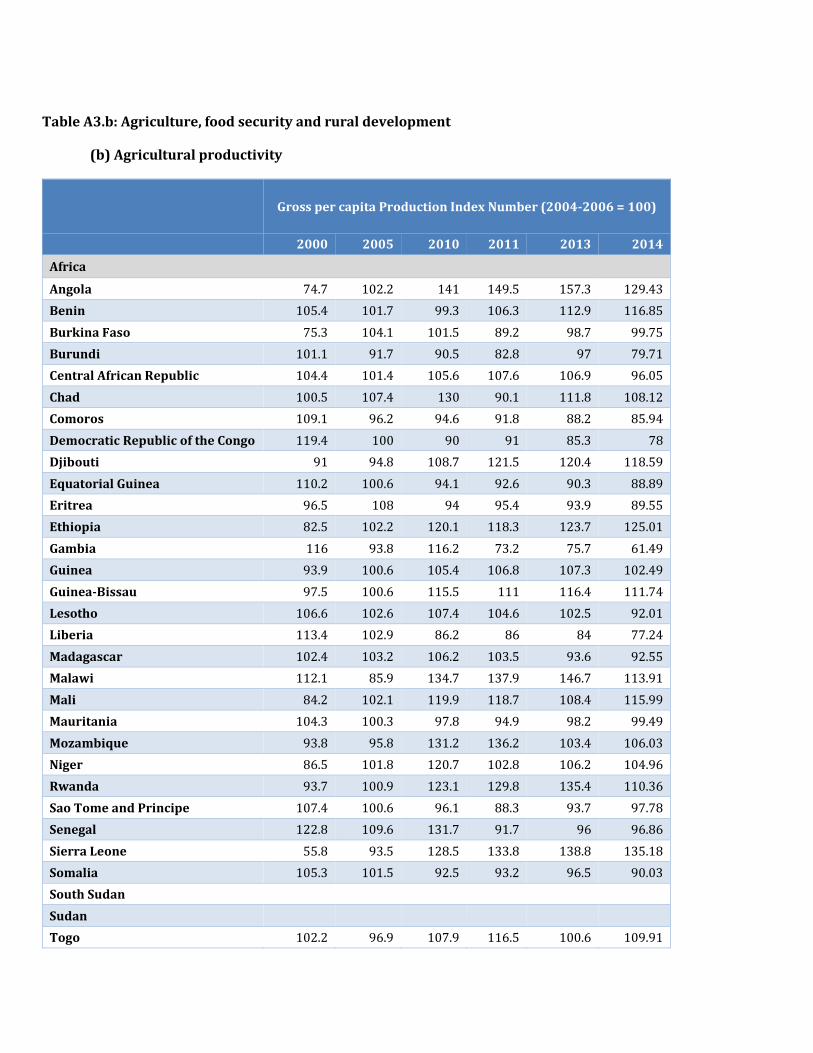
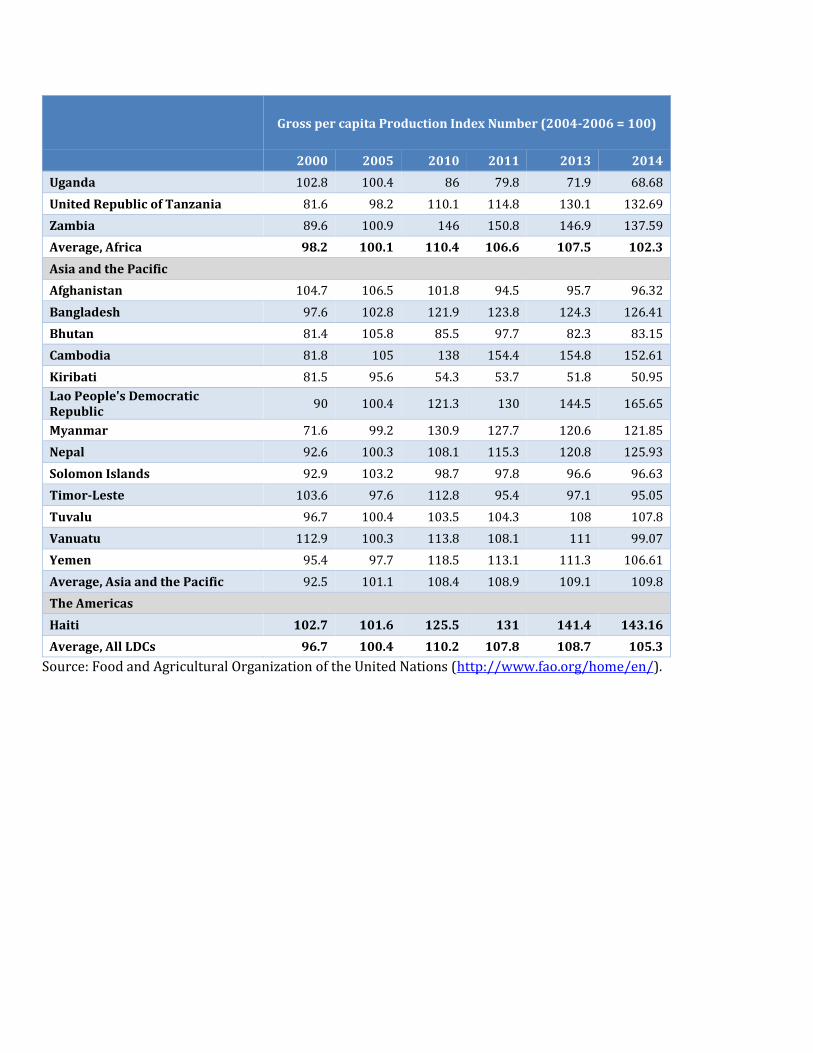
Table A3.b: Agriculture, food security and rural development
(b) Agricultural productivity
Gross per capita Production Index Number (2004-2006 = 100)
2000 2005 2010 2011 2013 2014
Africa
Angola 74.7 102.2 141 149.5 157.3 129.43
Benin 105.4 101.7 99.3 106.3 112.9 116.85
Burkina Faso 75.3 104.1 101.5 89.2 98.7 99.75
Burundi 101.1 91.7 90.5 82.8 97 79.71
Central African Republic 104.4 101.4 105.6 107.6 106.9 96.05
Chad 100.5 107.4 130 90.1 111.8 108.12
Comoros 109.1 96.2 94.6 91.8 88.2 85.94
Democratic Republic of the Congo 119.4 100 90 91 85.3 78
Djibouti 91 94.8 108.7 121.5 120.4 118.59
Equatorial Guinea 110.2 100.6 94.1 92.6 90.3 88.89
Eritrea 96.5 108 94 95.4 93.9 89.55
Ethiopia 82.5 102.2 120.1 118.3 123.7 125.01
Gambia 116 93.8 116.2 73.2 75.7 61.49
Guinea 93.9 100.6 105.4 106.8 107.3 102.49
Guinea-Bissau 97.5 100.6 115.5 111 116.4 111.74
Lesotho 106.6 102.6 107.4 104.6 102.5 92.01
Liberia 113.4 102.9 86.2 86 84 77.24
Madagascar 102.4 103.2 106.2 103.5 93.6 92.55
Malawi 112.1 85.9 134.7 137.9 146.7 113.91
Mali 84.2 102.1 119.9 118.7 108.4 115.99
Mauritania 104.3 100.3 97.8 94.9 98.2 99.49
Mozambique 93.8 95.8 131.2 136.2 103.4 106.03
Niger 86.5 101.8 120.7 102.8 106.2 104.96
Rwanda 93.7 100.9 123.1 129.8 135.4 110.36
Sao Tome and Principe 107.4 100.6 96.1 88.3 93.7 97.78
Senegal 122.8 109.6 131.7 91.7 96 96.86
Sierra Leone 55.8 93.5 128.5 133.8 138.8 135.18
Somalia 105.3 101.5 92.5 93.2 96.5 90.03
South Sudan
Sudan
Togo 102.2 96.9 107.9 116.5 100.6 109.91
Gross per capita Production Index Number (2004-2006 = 100)
2000 2005 2010 2011 2013 2014
Uganda 102.8 100.4 86 79.8 71.9 68.68
United Republic of Tanzania 81.6 98.2 110.1 114.8 130.1 132.69
Zambia 89.6 100.9 146 150.8 146.9 137.59
Average, Africa 98.2 100.1 110.4 106.6 107.5 102.3
Asia and the Pacific
Afghanistan 104.7 106.5 101.8 94.5 95.7 96.32
Bangladesh 97.6 102.8 121.9 123.8 124.3 126.41
Bhutan 81.4 105.8 85.5 97.7 82.3 83.15
Cambodia 81.8 105 138 154.4 154.8 152.61
Kiribati 81.5 95.6 54.3 53.7 51.8 50.95
Lao People's Democratic Republic
90 100.4 121.3 130 144.5 165.65
Myanmar 71.6 99.2 130.9 127.7 120.6 121.85
Nepal 92.6 100.3 108.1 115.3 120.8 125.93
Solomon Islands 92.9 103.2 98.7 97.8 96.6 96.63
Timor-Leste 103.6 97.6 112.8 95.4 97.1 95.05
Tuvalu 96.7 100.4 103.5 104.3 108 107.8
Vanuatu 112.9 100.3 113.8 108.1 111 99.07
Yemen 95.4 97.7 118.5 113.1 111.3 106.61
Average, Asia and the Pacific 92.5 101.1 108.4 108.9 109.1 109.8
The Americas
Haiti 102.7 101.6 125.5 131 141.4 143.16
Average, All LDCs 96.7 100.4 110.2 107.8 108.7 105.3
Source: Food and Agricultural Organization of the United Nations (http://www.fao.org/home/en/).
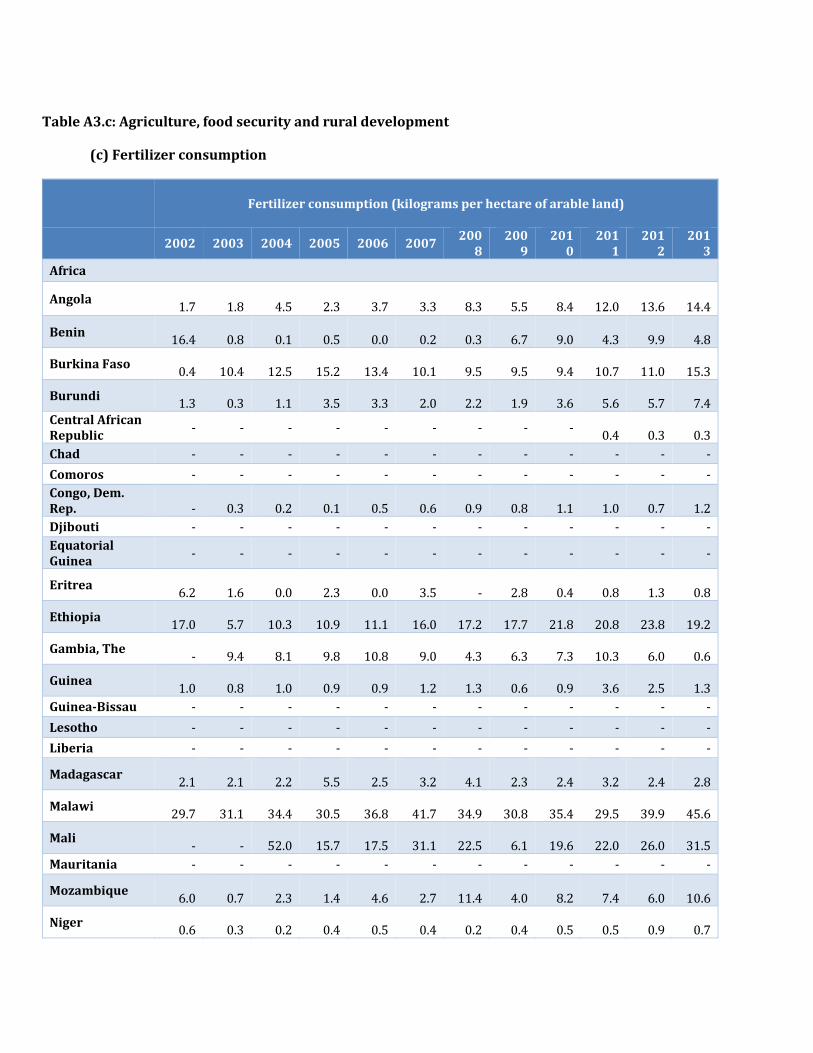
Table A3.c: Agriculture, food security and rural development
(c) Fertilizer consumption
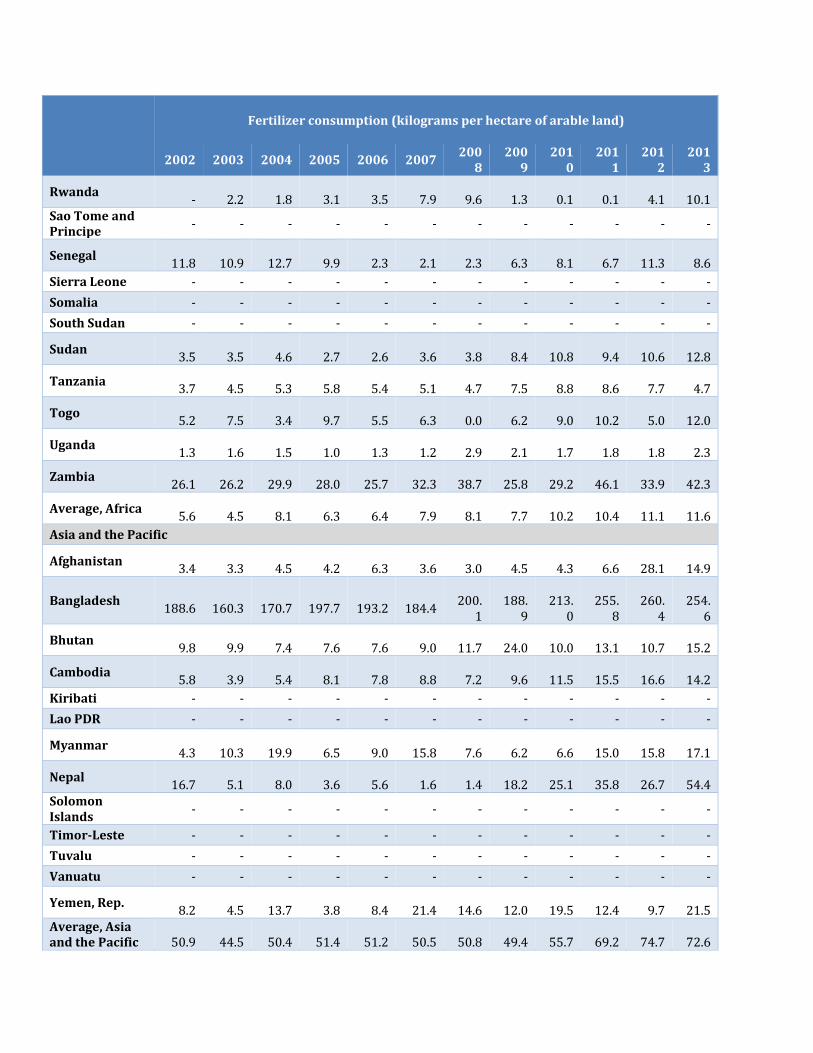
Fertilizer consumption (kilograms per hectare of arable land)
2002 2003 2004 2005 2006 2007 200
8 200
9 201
0 201
1 201
2 201
3
Africa
Angola
1.7
1.8
4.5
2.3
3.7
3.3
8.3
5.5
8.4
12.0
13.6
14.4
Benin
16.4
0.8
0.1
0.5
0.0
0.2
0.3
6.7
9.0
4.3
9.9
4.8
Burkina Faso
0.4
10.4
12.5
15.2
13.4
10.1
9.5
9.5
9.4
10.7
11.0
15.3
Burundi
1.3
0.3
1.1
3.5
3.3
2.0
2.2
1.9
3.6
5.6
5.7
7.4 Central African Republic
- - - - - - - - -
0.4
0.3
0.3
Chad - - - - - - - - - - - -
Comoros - - - - - - - - - - - -
Congo, Dem. Rep.
-
0.3
0.2
0.1
0.5
0.6
0.9
0.8
1.1
1.0
0.7
1.2
Djibouti - - - - - - - - - - - -
Equatorial Guinea
- - - - - - - - - - - -
Eritrea
6.2
1.6
0.0
2.3
0.0
3.5
-
2.8
0.4
0.8
1.3
0.8
Ethiopia
17.0
5.7
10.3
10.9
11.1
16.0
17.2
17.7
21.8
20.8
23.8
19.2
Gambia, The
-
9.4
8.1
9.8
10.8
9.0
4.3
6.3
7.3
10.3
6.0
0.6
Guinea
1.0
0.8
1.0
0.9
0.9
1.2
1.3
0.6
0.9
3.6
2.5
1.3
Guinea-Bissau - - - - - - - - - - - -
Lesotho - - - - - - - - - - - -
Liberia - - - - - - - - - - - -
Madagascar
2.1
2.1
2.2
5.5
2.5
3.2
4.1
2.3
2.4
3.2
2.4
2.8
Malawi
29.7
31.1
34.4
30.5
36.8
41.7
34.9
30.8
35.4
29.5
39.9
45.6
Mali
-
-
52.0
15.7
17.5
31.1
22.5
6.1
19.6
22.0
26.0
31.5
Mauritania - - - - - - - - - - - -
Mozambique
6.0
0.7
2.3
1.4
4.6
2.7
11.4
4.0
8.2
7.4
6.0
10.6
Niger
0.6
0.3
0.2
0.4
0.5
0.4
0.2
0.4
0.5
0.5
0.9
0.7
Fertilizer consumption (kilograms per hectare of arable land)
2002 2003 2004 2005 2006 2007 200
8 200
9 201
0 201
1 201
2 201
3
Rwanda
-
2.2
1.8
3.1
3.5
7.9
9.6
1.3
0.1
0.1
4.1
10.1 Sao Tome and Principe
- - - - - - - - - - - -
Senegal
11.8
10.9
12.7
9.9
2.3
2.1
2.3
6.3
8.1
6.7
11.3
8.6
Sierra Leone - - - - - - - - - - - -
Somalia - - - - - - - - - - - -
South Sudan - - - - - - - - - - - -
Sudan
3.5
3.5
4.6
2.7
2.6
3.6
3.8
8.4
10.8
9.4
10.6
12.8
Tanzania
3.7
4.5
5.3
5.8
5.4
5.1
4.7
7.5
8.8
8.6
7.7
4.7
Togo
5.2
7.5
3.4
9.7
5.5
6.3
0.0
6.2
9.0
10.2
5.0
12.0
Uganda
1.3
1.6
1.5
1.0
1.3
1.2
2.9
2.1
1.7
1.8
1.8
2.3
Zambia
26.1
26.2
29.9
28.0
25.7
32.3
38.7
25.8
29.2
46.1
33.9
42.3
Average, Africa
5.6
4.5
8.1
6.3
6.4
7.9
8.1
7.7
10.2
10.4
11.1
11.6
Asia and the Pacific
Afghanistan
3.4
3.3
4.5
4.2
6.3
3.6
3.0
4.5
4.3
6.6
28.1
14.9
Bangladesh
188.6
160.3
170.7
197.7
193.2
184.4
200.
1
188.
9
213.
0
255.
8
260.
4
254.
6
Bhutan
9.8
9.9
7.4
7.6
7.6
9.0
11.7
24.0
10.0
13.1
10.7
15.2
Cambodia
5.8
3.9
5.4
8.1
7.8
8.8
7.2
9.6
11.5
15.5
16.6
14.2
Kiribati - - - - - - - - - - - -
Lao PDR - - - - - - - - - - - -
Myanmar
4.3
10.3
19.9
6.5
9.0
15.8
7.6
6.2
6.6
15.0
15.8
17.1
Nepal
16.7
5.1
8.0
3.6
5.6
1.6
1.4
18.2
25.1
35.8
26.7
54.4 Solomon Islands
- - - - - - - - - - - -
Timor-Leste - - - - - - - - - - - -
Tuvalu - - - - - - - - - - - -
Vanuatu - - - - - - - - - - - -
Yemen, Rep.
8.2
4.5
13.7
3.8
8.4
21.4
14.6
12.0
19.5
12.4
9.7
21.5 Average, Asia and the Pacific
50.9
44.5
50.4
51.4
51.2
50.5
50.8
49.4
55.7
69.2
74.7
72.6
Fertilizer consumption (kilograms per hectare of arable land)
2002 2003 2004 2005 2006 2007 200
8 200
9 201
0 201
1 201
2 201
3
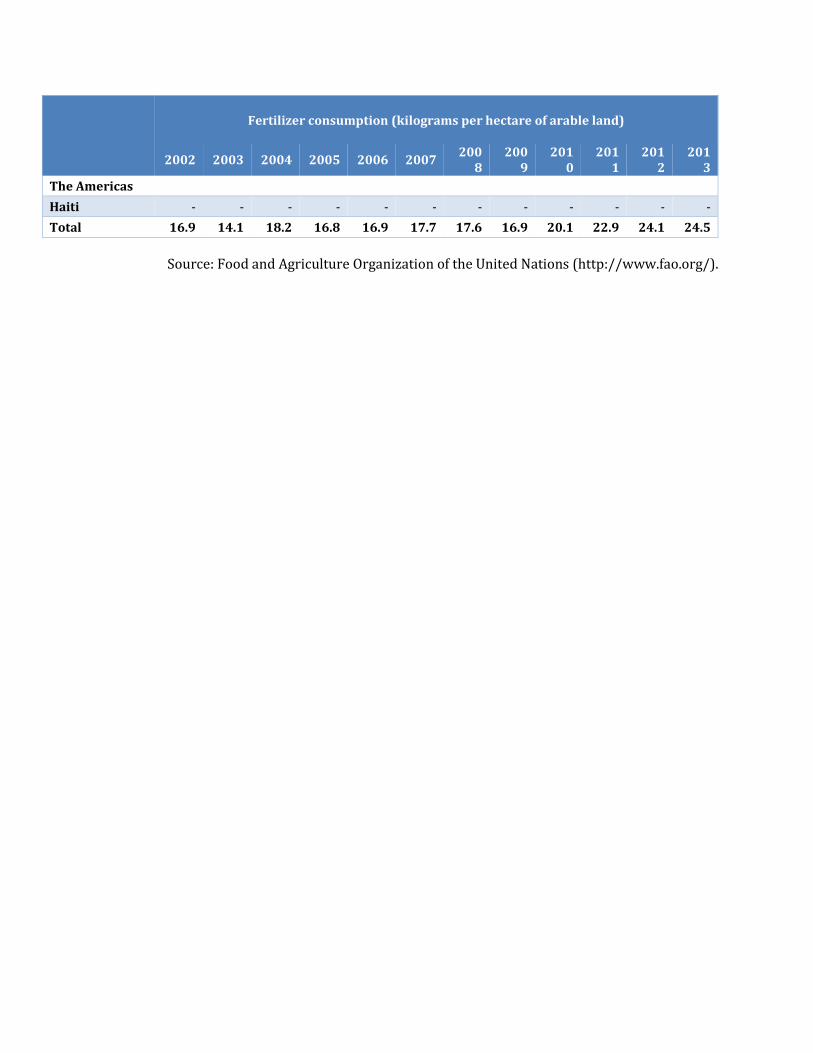
The Americas
Haiti - - - - - - - - - - - -
Total 16.9 14.1 18.2 16.8 16.9 17.7 17.6 16.9 20.1 22.9 24.1 24.5
Source: Food and Agriculture Organization of the United Nations (http://www.fao.org/).
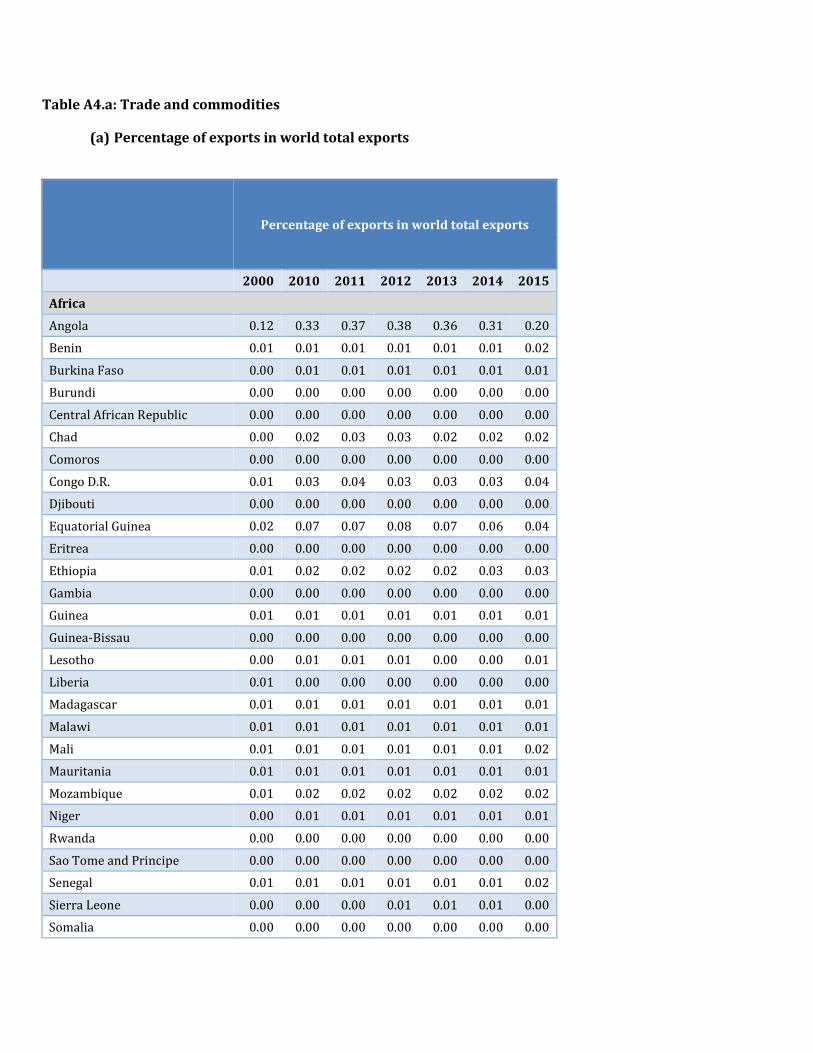
Table A4.a: Trade and commodities
(a) Percentage of exports in world total exports
Percentage of exports in world total exports
2000 2010 2011 2012 2013 2014 2015
Africa
Angola 0.12 0.33 0.37 0.38 0.36 0.31 0.20
Benin 0.01 0.01 0.01 0.01 0.01 0.01 0.02
Burkina Faso 0.00 0.01 0.01 0.01 0.01 0.01 0.01
Burundi 0.00 0.00 0.00 0.00 0.00 0.00 0.00
Central African Republic 0.00 0.00 0.00 0.00 0.00 0.00 0.00
Chad 0.00 0.02 0.03 0.03 0.02 0.02 0.02
Comoros 0.00 0.00 0.00 0.00 0.00 0.00 0.00
Congo D.R. 0.01 0.03 0.04 0.03 0.03 0.03 0.04
Djibouti 0.00 0.00 0.00 0.00 0.00 0.00 0.00
Equatorial Guinea 0.02 0.07 0.07 0.08 0.07 0.06 0.04
Eritrea 0.00 0.00 0.00 0.00 0.00 0.00 0.00
Ethiopia 0.01 0.02 0.02 0.02 0.02 0.03 0.03
Gambia 0.00 0.00 0.00 0.00 0.00 0.00 0.00
Guinea 0.01 0.01 0.01 0.01 0.01 0.01 0.01
Guinea-Bissau 0.00 0.00 0.00 0.00 0.00 0.00 0.00
Lesotho 0.00 0.01 0.01 0.01 0.00 0.00 0.01
Liberia 0.01 0.00 0.00 0.00 0.00 0.00 0.00
Madagascar 0.01 0.01 0.01 0.01 0.01 0.01 0.01
Malawi 0.01 0.01 0.01 0.01 0.01 0.01 0.01
Mali 0.01 0.01 0.01 0.01 0.01 0.01 0.02
Mauritania 0.01 0.01 0.01 0.01 0.01 0.01 0.01
Mozambique 0.01 0.02 0.02 0.02 0.02 0.02 0.02
Niger 0.00 0.01 0.01 0.01 0.01 0.01 0.01
Rwanda 0.00 0.00 0.00 0.00 0.00 0.00 0.00
Sao Tome and Principe 0.00 0.00 0.00 0.00 0.00 0.00 0.00
Senegal 0.01 0.01 0.01 0.01 0.01 0.01 0.02
Sierra Leone 0.00 0.00 0.00 0.01 0.01 0.01 0.00
Somalia 0.00 0.00 0.00 0.00 0.00 0.00 0.00
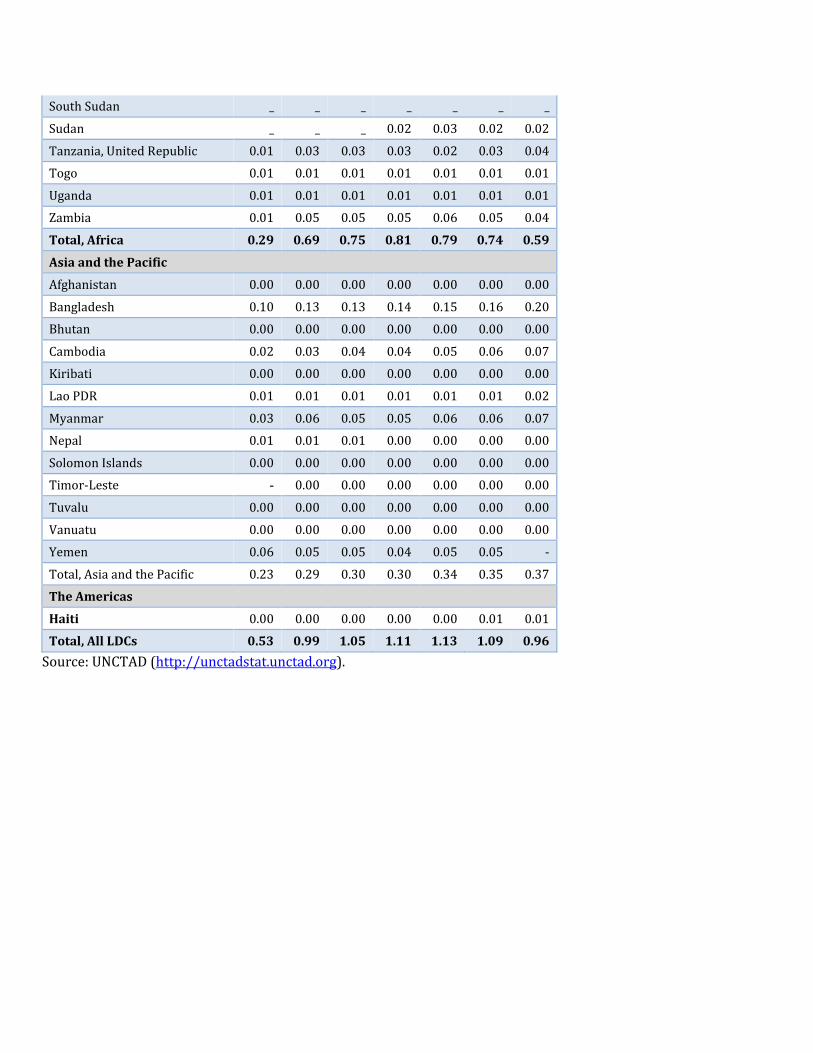
South Sudan _ _ _ _ _ _ _
Sudan _ _ _ 0.02 0.03 0.02 0.02
Tanzania, United Republic 0.01 0.03 0.03 0.03 0.02 0.03 0.04
Togo 0.01 0.01 0.01 0.01 0.01 0.01 0.01
Uganda 0.01 0.01 0.01 0.01 0.01 0.01 0.01
Zambia 0.01 0.05 0.05 0.05 0.06 0.05 0.04
Total, Africa 0.29 0.69 0.75 0.81 0.79 0.74 0.59
Asia and the Pacific
Afghanistan 0.00 0.00 0.00 0.00 0.00 0.00 0.00
Bangladesh 0.10 0.13 0.13 0.14 0.15 0.16 0.20
Bhutan 0.00 0.00 0.00 0.00 0.00 0.00 0.00
Cambodia 0.02 0.03 0.04 0.04 0.05 0.06 0.07
Kiribati 0.00 0.00 0.00 0.00 0.00 0.00 0.00
Lao PDR 0.01 0.01 0.01 0.01 0.01 0.01 0.02
Myanmar 0.03 0.06 0.05 0.05 0.06 0.06 0.07
Nepal 0.01 0.01 0.01 0.00 0.00 0.00 0.00
Solomon Islands 0.00 0.00 0.00 0.00 0.00 0.00 0.00
Timor-Leste - 0.00 0.00 0.00 0.00 0.00 0.00
Tuvalu 0.00 0.00 0.00 0.00 0.00 0.00 0.00
Vanuatu 0.00 0.00 0.00 0.00 0.00 0.00 0.00
Yemen 0.06 0.05 0.05 0.04 0.05 0.05 -
Total, Asia and the Pacific 0.23 0.29 0.30 0.30 0.34 0.35 0.37
The Americas
Haiti 0.00 0.00 0.00 0.00 0.00 0.01 0.01
Total, All LDCs 0.53 0.99 1.05 1.11 1.13 1.09 0.96
Source: UNCTAD (http://unctadstat.unctad.org).
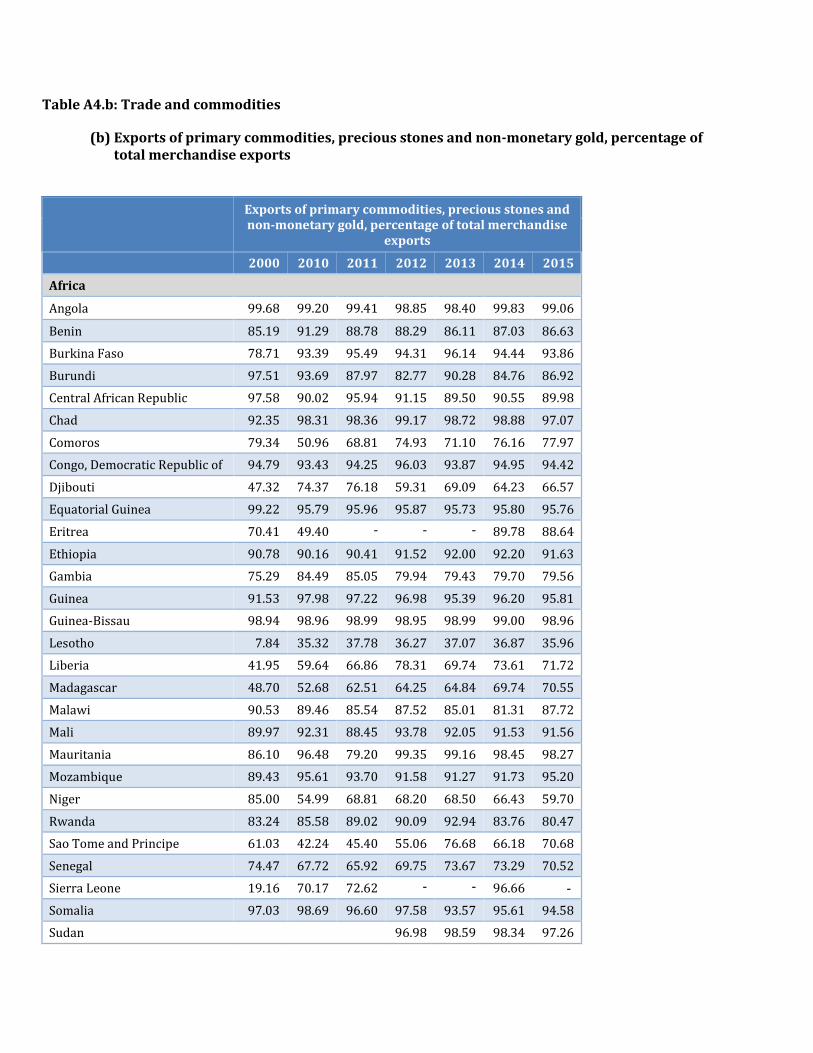
Table A4.b: Trade and commodities
(b) Exports of primary commodities, precious stones and non-monetary gold, percentage of total merchandise exports
Exports of primary commodities, precious stones and non-monetary gold, percentage of total merchandise
exports
2000 2010 2011 2012 2013 2014 2015
Africa
Angola 99.68 99.20 99.41 98.85 98.40 99.83 99.06
Benin 85.19 91.29 88.78 88.29 86.11 87.03 86.63
Burkina Faso 78.71 93.39 95.49 94.31 96.14 94.44 93.86
Burundi 97.51 93.69 87.97 82.77 90.28 84.76 86.92
Central African Republic 97.58 90.02 95.94 91.15 89.50 90.55 89.98
Chad 92.35 98.31 98.36 99.17 98.72 98.88 97.07
Comoros 79.34 50.96 68.81 74.93 71.10 76.16 77.97
Congo, Democratic Republic of 94.79 93.43 94.25 96.03 93.87 94.95 94.42
Djibouti 47.32 74.37 76.18 59.31 69.09 64.23 66.57
Equatorial Guinea 99.22 95.79 95.96 95.87 95.73 95.80 95.76
Eritrea 70.41 49.40 - - - 89.78 88.64
Ethiopia 90.78 90.16 90.41 91.52 92.00 92.20 91.63
Gambia 75.29 84.49 85.05 79.94 79.43 79.70 79.56
Guinea 91.53 97.98 97.22 96.98 95.39 96.20 95.81
Guinea-Bissau 98.94 98.96 98.99 98.95 98.99 99.00 98.96
Lesotho 7.84 35.32 37.78 36.27 37.07 36.87 35.96
Liberia 41.95 59.64 66.86 78.31 69.74 73.61 71.72
Madagascar 48.70 52.68 62.51 64.25 64.84 69.74 70.55
Malawi 90.53 89.46 85.54 87.52 85.01 81.31 87.72
Mali 89.97 92.31 88.45 93.78 92.05 91.53 91.56
Mauritania 86.10 96.48 79.20 99.35 99.16 98.45 98.27
Mozambique 89.43 95.61 93.70 91.58 91.27 91.73 95.20
Niger 85.00 54.99 68.81 68.20 68.50 66.43 59.70
Rwanda 83.24 85.58 89.02 90.09 92.94 83.76 80.47
Sao Tome and Principe 61.03 42.24 45.40 55.06 76.68 66.18 70.68
Senegal 74.47 67.72 65.92 69.75 73.67 73.29 70.52
Sierra Leone 19.16 70.17 72.62 - - 96.66 -
Somalia 97.03 98.69 96.60 97.58 93.57 95.61 94.58
Sudan 96.98 98.59 98.34 97.26
Exports of primary commodities, precious stones and non-monetary gold, percentage of total merchandise
exports
2000 2010 2011 2012 2013 2014 2015
Tanzania, United Republic of 88.49 83.37 84.06 85.64 86.11 87.34 81.89
Togo 74.68 61.08 61.11 68.99 62.69 65.61 64.05
Uganda 92.99 73.08 70.78 65.94 68.13 69.76 68.40
Zambia 82.20 89.48 89.20 85.84 84.08 86.99 85.47
Average, Africa 89.40 93.30 93.10 92.80 91.70 93.60 90.70
Asia and the Pacific
Afghanistan 85.83 59.49 71.12 64.03 65.23 64.68 64.94
Bangladesh 8.89 7.26 6.59 6.75 6.65 6.92 6.30
Bhutan 51.25 28.85 32.21 44.62 39.01 36.45 35.72
Cambodia 6.27 10.30 12.32 13.38 11.50 13.40 10.34
Kiribati 84.98 79.56 93.70 91.19 96.93 94.26 95.52
Lao PDR 41.16 82.36 85.70 84.48 86.72 85.60 86.11
Myanmar 52.88 82.92 90.70 90.95 91.27 91.13 91.20
Nepal 9.39 28.10 26.15 31.42 26.75 31.94 32.01
Solomon Islands 96.41 97.77 93.24 98.70 89.55 71.38 81.65
Timor-Leste 82.92 73.32 99.06 98.74 98.95 98.84
Tuvalu 24.35 39.40 79.28 66.90 76.89 71.89 74.39
Vanuatu 46.26 41.49 54.38 57.67 86.38 69.53 75.94
Yemen 97.94 98.24 97.68 97.18 94.07 95.52 94.75
Average, Asia and the Pacific 39.90 42.70 42.70 40.40 39.90 38.40 29.40
The Americas
Haiti 11.07 11.36 11.83 10.72 11.26 11.78 10.65
Average, All LDCs 67.10 77.80 78.40 78.50 75.90 75.70 66.60
Source: UNCTAD (http://unctadstat.unctad.org).
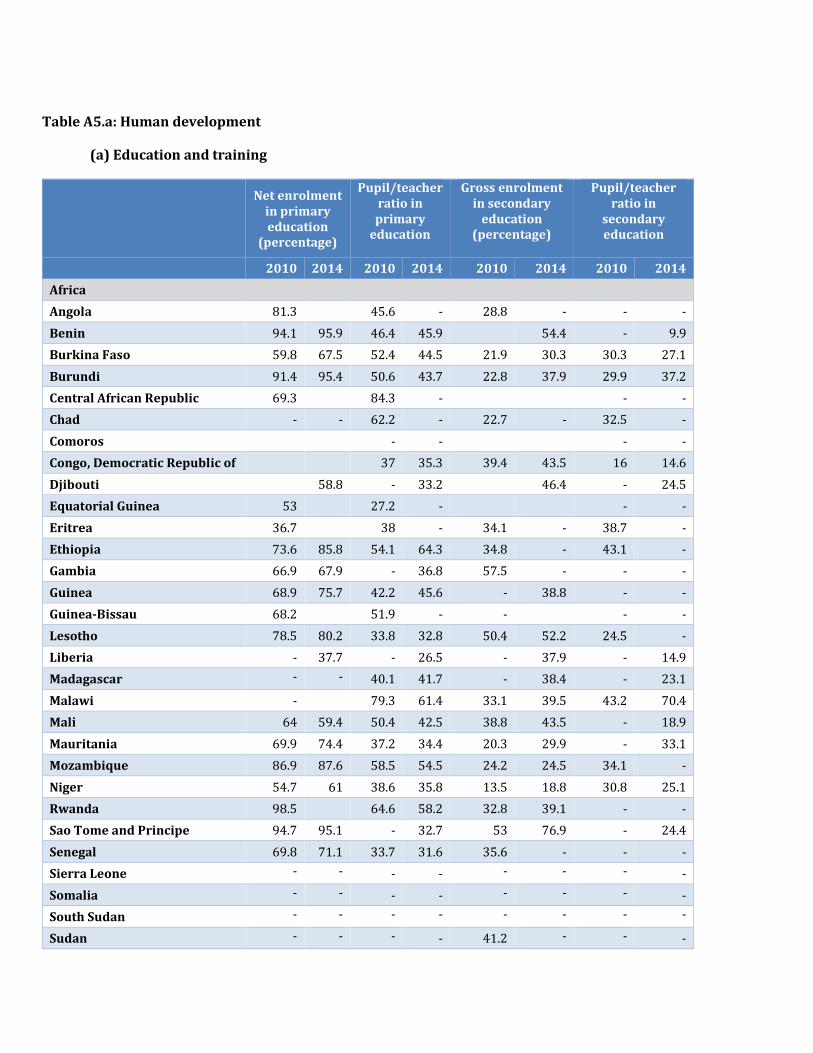
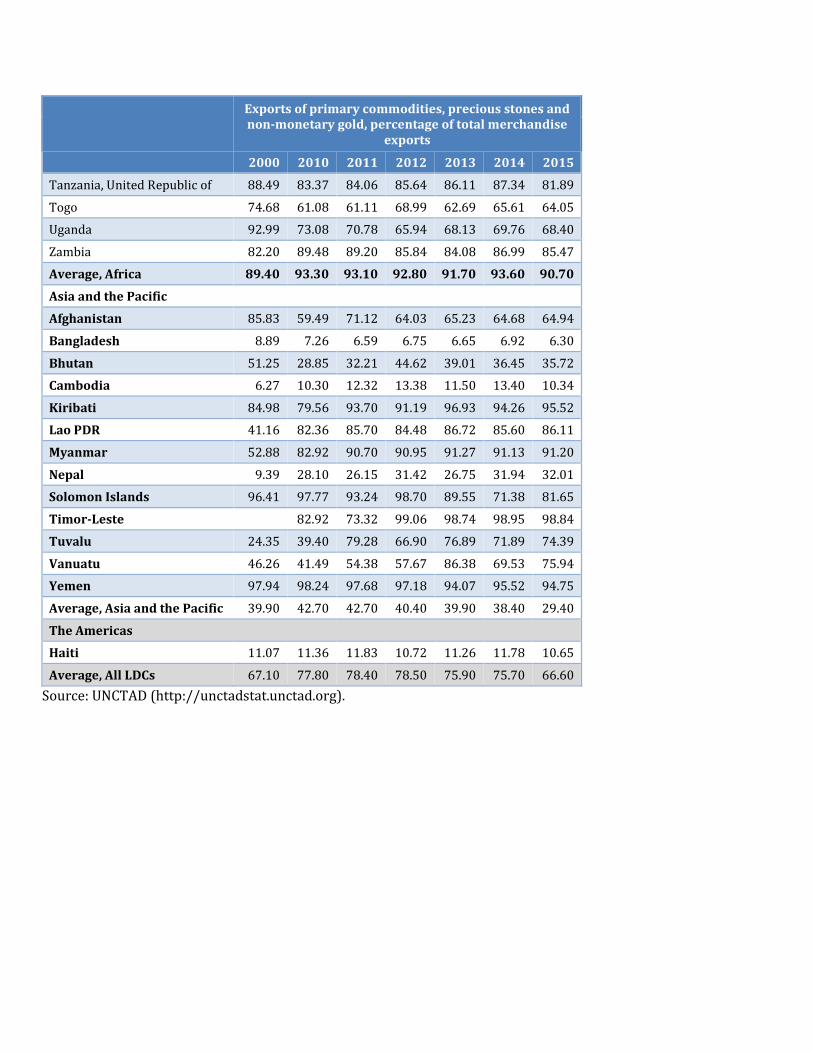
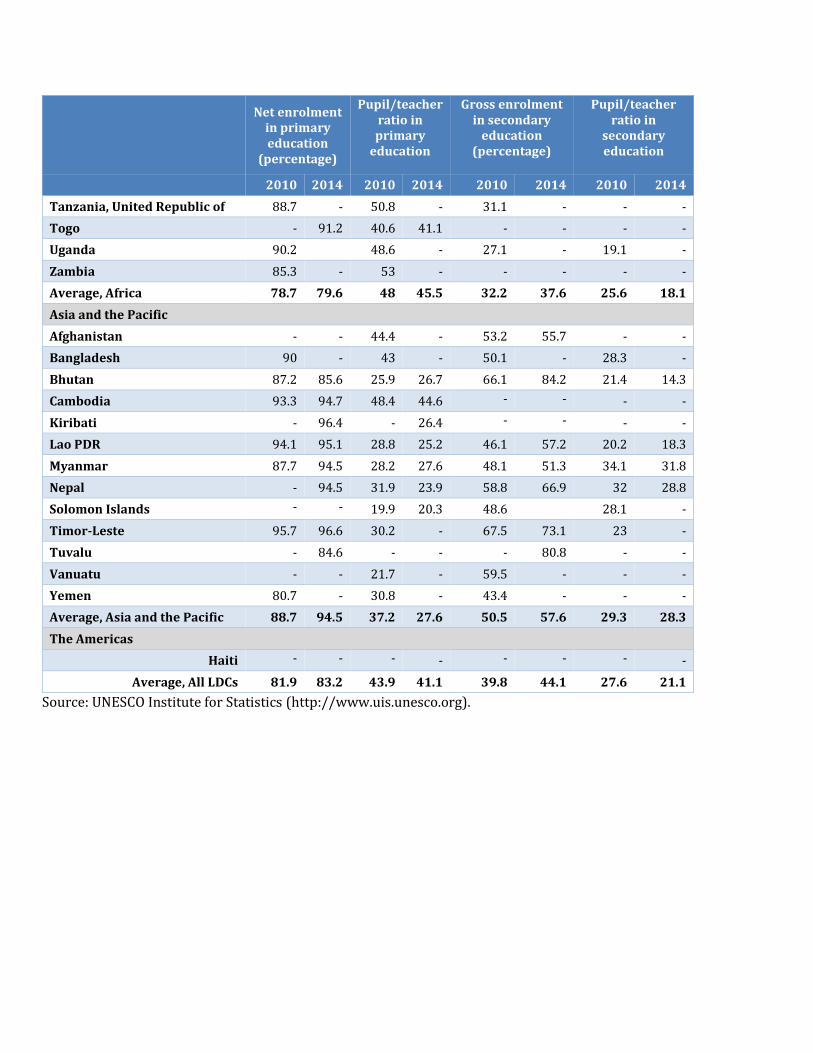
Table A5.a: Human development
(a) Education and training
Net enrolment in primary education
(percentage)
Pupil/teacher ratio in primary
education
Gross enrolment in secondary
education (percentage)
Pupil/teacher ratio in
secondary education
2010 2014 2010 2014 2010 2014 2010 2014
Africa
Angola 81.3 45.6 - 28.8 - - -
Benin 94.1 95.9 46.4 45.9 54.4 - 9.9
Burkina Faso 59.8 67.5 52.4 44.5 21.9 30.3 30.3 27.1
Burundi 91.4 95.4 50.6 43.7 22.8 37.9 29.9 37.2
Central African Republic 69.3 84.3 - - -
Chad - - 62.2 - 22.7 - 32.5 -
Comoros - - - -
Congo, Democratic Republic of 37 35.3 39.4 43.5 16 14.6
Djibouti 58.8 - 33.2 46.4 - 24.5
Equatorial Guinea 53 27.2 - - -
Eritrea 36.7 38 - 34.1 - 38.7 -
Ethiopia 73.6 85.8 54.1 64.3 34.8 - 43.1 -
Gambia 66.9 67.9 - 36.8 57.5 - - -
Guinea 68.9 75.7 42.2 45.6 - 38.8 - -
Guinea-Bissau 68.2 51.9 - - - -
Lesotho 78.5 80.2 33.8 32.8 50.4 52.2 24.5 -
Liberia - 37.7 - 26.5 - 37.9 - 14.9
Madagascar - - 40.1 41.7 - 38.4 - 23.1
Malawi - 79.3 61.4 33.1 39.5 43.2 70.4
Mali 64 59.4 50.4 42.5 38.8 43.5 - 18.9
Mauritania 69.9 74.4 37.2 34.4 20.3 29.9 - 33.1
Mozambique 86.9 87.6 58.5 54.5 24.2 24.5 34.1 -
Niger 54.7 61 38.6 35.8 13.5 18.8 30.8 25.1
Rwanda 98.5 64.6 58.2 32.8 39.1 - -
Sao Tome and Principe 94.7 95.1 - 32.7 53 76.9 - 24.4
Senegal 69.8 71.1 33.7 31.6 35.6 - - -
Sierra Leone - - - - - - - -
Somalia - - - - - - - -
South Sudan - - - - - - - -
Sudan - - - - 41.2 - - -
Net enrolment in primary education
(percentage)
Pupil/teacher ratio in primary
education
Gross enrolment in secondary
education (percentage)
Pupil/teacher ratio in
secondary education
2010 2014 2010 2014 2010 2014 2010 2014
Tanzania, United Republic of 88.7 - 50.8 - 31.1 - - -
Togo - 91.2 40.6 41.1 - - - -
Uganda 90.2 48.6 - 27.1 - 19.1 -
Zambia 85.3 - 53 - - - - -
Average, Africa 78.7 79.6 48 45.5 32.2 37.6 25.6 18.1
Asia and the Pacific
Afghanistan - - 44.4 - 53.2 55.7 - -
Bangladesh 90 - 43 - 50.1 - 28.3 -
Bhutan 87.2 85.6 25.9 26.7 66.1 84.2 21.4 14.3
Cambodia 93.3 94.7 48.4 44.6 - - - -
Kiribati - 96.4 - 26.4 - - - -
Lao PDR 94.1 95.1 28.8 25.2 46.1 57.2 20.2 18.3
Myanmar 87.7 94.5 28.2 27.6 48.1 51.3 34.1 31.8
Nepal - 94.5 31.9 23.9 58.8 66.9 32 28.8
Solomon Islands - - 19.9 20.3 48.6 28.1 -
Timor-Leste 95.7 96.6 30.2 - 67.5 73.1 23 -
Tuvalu - 84.6 - - - 80.8 - -
Vanuatu - - 21.7 - 59.5 - - -
Yemen 80.7 - 30.8 - 43.4 - - -
Average, Asia and the Pacific 88.7 94.5 37.2 27.6 50.5 57.6 29.3 28.3
The Americas
Haiti - - - - - - - -
Average, All LDCs 81.9 83.2 43.9 41.1 39.8 44.1 27.6 21.1
Source: UNESCO Institute for Statistics (http://www.uis.unesco.org).
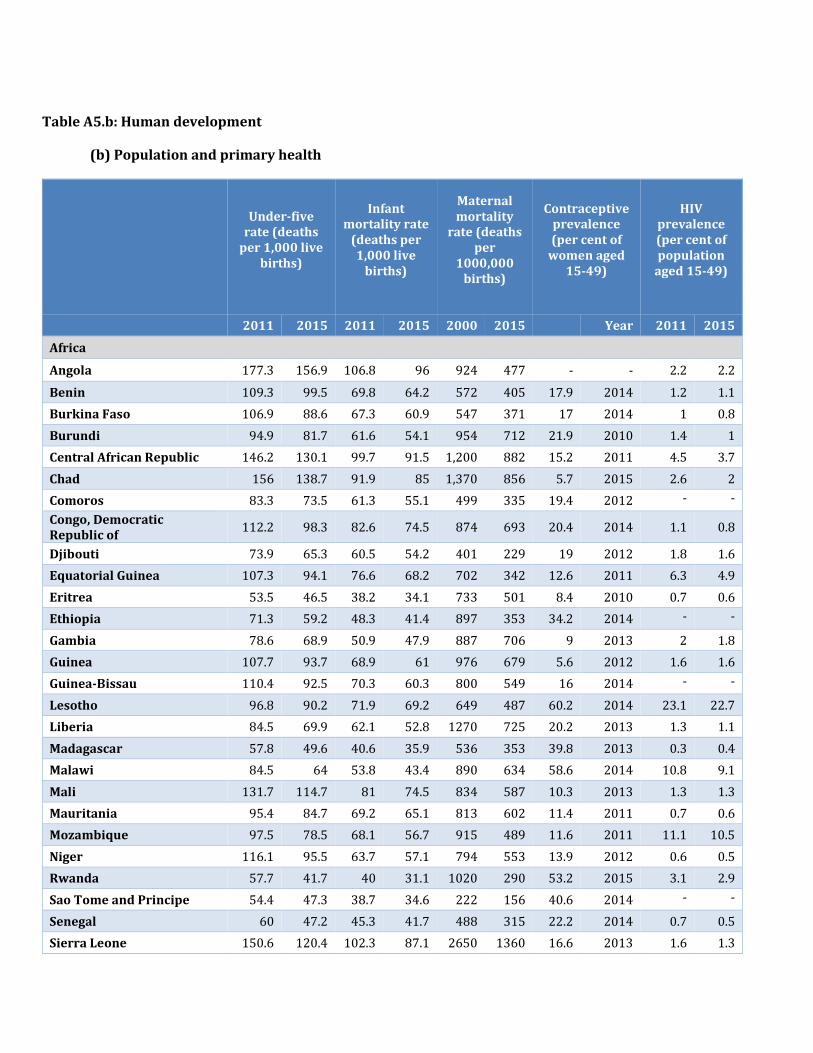
Table A5.b: Human development
(b) Population and primary health
Under-five rate (deaths
per 1,000 live births)
Infant mortality rate
(deaths per 1,000 live
births)
Maternal mortality
rate (deaths per
1000,000 births)
Contraceptive prevalence (per cent of
women aged 15-49)
HIV prevalence (per cent of population
aged 15-49)
2011 2015 2011 2015 2000 2015 Year 2011 2015
Africa
Angola 177.3 156.9 106.8 96 924 477 - - 2.2 2.2
Benin 109.3 99.5 69.8 64.2 572 405 17.9 2014 1.2 1.1
Burkina Faso 106.9 88.6 67.3 60.9 547 371 17 2014 1 0.8
Burundi 94.9 81.7 61.6 54.1 954 712 21.9 2010 1.4 1
Central African Republic 146.2 130.1 99.7 91.5 1,200 882 15.2 2011 4.5 3.7
Chad 156 138.7 91.9 85 1,370 856 5.7 2015 2.6 2
Comoros 83.3 73.5 61.3 55.1 499 335 19.4 2012 - -
Congo, Democratic Republic of
112.2 98.3 82.6 74.5 874 693 20.4 2014 1.1 0.8
Djibouti 73.9 65.3 60.5 54.2 401 229 19 2012 1.8 1.6
Equatorial Guinea 107.3 94.1 76.6 68.2 702 342 12.6 2011 6.3 4.9
Eritrea 53.5 46.5 38.2 34.1 733 501 8.4 2010 0.7 0.6
Ethiopia 71.3 59.2 48.3 41.4 897 353 34.2 2014 - -
Gambia 78.6 68.9 50.9 47.9 887 706 9 2013 2 1.8
Guinea 107.7 93.7 68.9 61 976 679 5.6 2012 1.6 1.6
Guinea-Bissau 110.4 92.5 70.3 60.3 800 549 16 2014 - -
Lesotho 96.8 90.2 71.9 69.2 649 487 60.2 2014 23.1 22.7
Liberia 84.5 69.9 62.1 52.8 1270 725 20.2 2013 1.3 1.1
Madagascar 57.8 49.6 40.6 35.9 536 353 39.8 2013 0.3 0.4
Malawi 84.5 64 53.8 43.4 890 634 58.6 2014 10.8 9.1
Mali 131.7 114.7 81 74.5 834 587 10.3 2013 1.3 1.3
Mauritania 95.4 84.7 69.2 65.1 813 602 11.4 2011 0.7 0.6
Mozambique 97.5 78.5 68.1 56.7 915 489 11.6 2011 11.1 10.5
Niger 116.1 95.5 63.7 57.1 794 553 13.9 2012 0.6 0.5
Rwanda 57.7 41.7 40 31.1 1020 290 53.2 2015 3.1 2.9
Sao Tome and Principe 54.4 47.3 38.7 34.6 222 156 40.6 2014 - -
Senegal 60 47.2 45.3 41.7 488 315 22.2 2014 0.7 0.5
Sierra Leone 150.6 120.4 102.3 87.1 2650 1360 16.6 2013 1.6 1.3
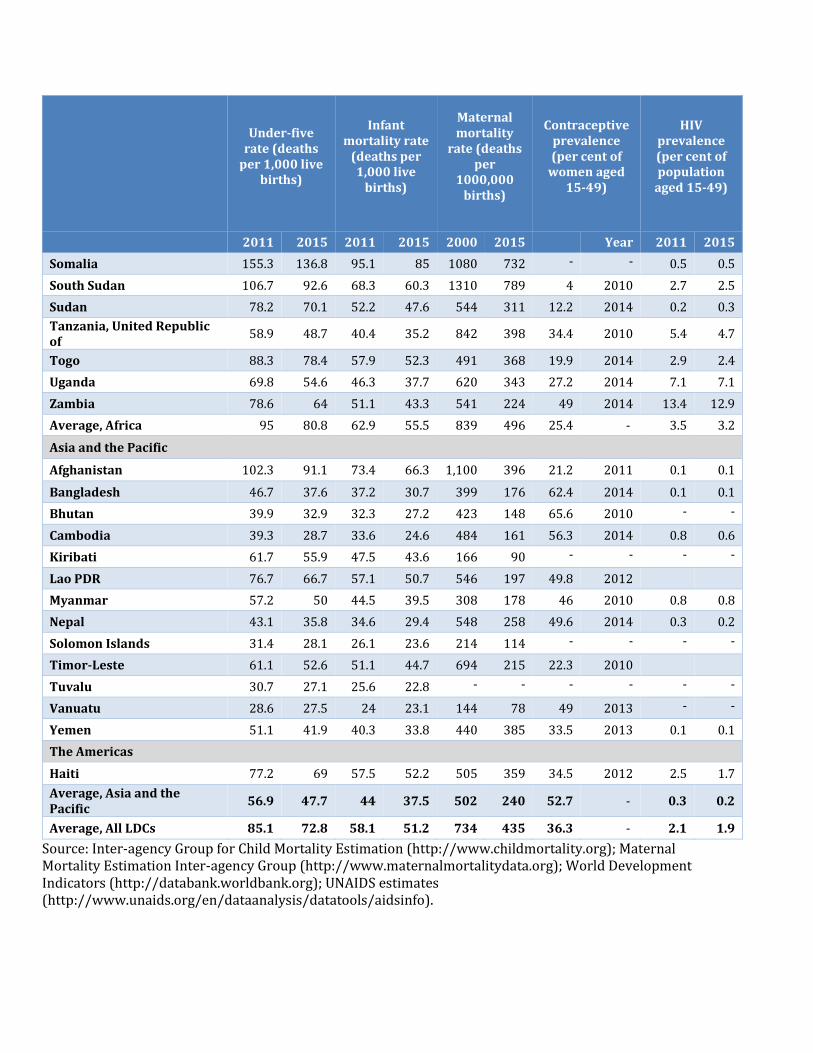
Under-five rate (deaths
per 1,000 live births)
Infant mortality rate
(deaths per 1,000 live
births)
Maternal mortality
rate (deaths per
1000,000 births)
Contraceptive prevalence (per cent of
women aged 15-49)
HIV prevalence (per cent of population
aged 15-49)
2011 2015 2011 2015 2000 2015 Year 2011 2015
Somalia 155.3 136.8 95.1 85 1080 732 - - 0.5 0.5
South Sudan 106.7 92.6 68.3 60.3 1310 789 4 2010 2.7 2.5
Sudan 78.2 70.1 52.2 47.6 544 311 12.2 2014 0.2 0.3
Tanzania, United Republic of
58.9 48.7 40.4 35.2 842 398 34.4 2010 5.4 4.7
Togo 88.3 78.4 57.9 52.3 491 368 19.9 2014 2.9 2.4
Uganda 69.8 54.6 46.3 37.7 620 343 27.2 2014 7.1 7.1
Zambia 78.6 64 51.1 43.3 541 224 49 2014 13.4 12.9
Average, Africa 95 80.8 62.9 55.5 839 496 25.4 - 3.5 3.2
Asia and the Pacific
Afghanistan 102.3 91.1 73.4 66.3 1,100 396 21.2 2011 0.1 0.1
Bangladesh 46.7 37.6 37.2 30.7 399 176 62.4 2014 0.1 0.1
Bhutan 39.9 32.9 32.3 27.2 423 148 65.6 2010 - -
Cambodia 39.3 28.7 33.6 24.6 484 161 56.3 2014 0.8 0.6
Kiribati 61.7 55.9 47.5 43.6 166 90 - - - -
Lao PDR 76.7 66.7 57.1 50.7 546 197 49.8 2012
Myanmar 57.2 50 44.5 39.5 308 178 46 2010 0.8 0.8
Nepal 43.1 35.8 34.6 29.4 548 258 49.6 2014 0.3 0.2
Solomon Islands 31.4 28.1 26.1 23.6 214 114 - - - -
Timor-Leste 61.1 52.6 51.1 44.7 694 215 22.3 2010
Tuvalu 30.7 27.1 25.6 22.8 - - - - - -
Vanuatu 28.6 27.5 24 23.1 144 78 49 2013 - -
Yemen 51.1 41.9 40.3 33.8 440 385 33.5 2013 0.1 0.1
The Americas
Haiti 77.2 69 57.5 52.2 505 359 34.5 2012 2.5 1.7
Average, Asia and the Pacific
56.9 47.7 44 37.5 502 240 52.7 - 0.3 0.2
Average, All LDCs 85.1 72.8 58.1 51.2 734 435 36.3 - 2.1 1.9
Source: Inter-agency Group for Child Mortality Estimation (http://www.childmortality.org); Maternal Mortality Estimation Inter-agency Group (http://www.maternalmortalitydata.org); World Development Indicators (http://databank.worldbank.org); UNAIDS estimates (http://www.unaids.org/en/dataanalysis/datatools/aidsinfo).
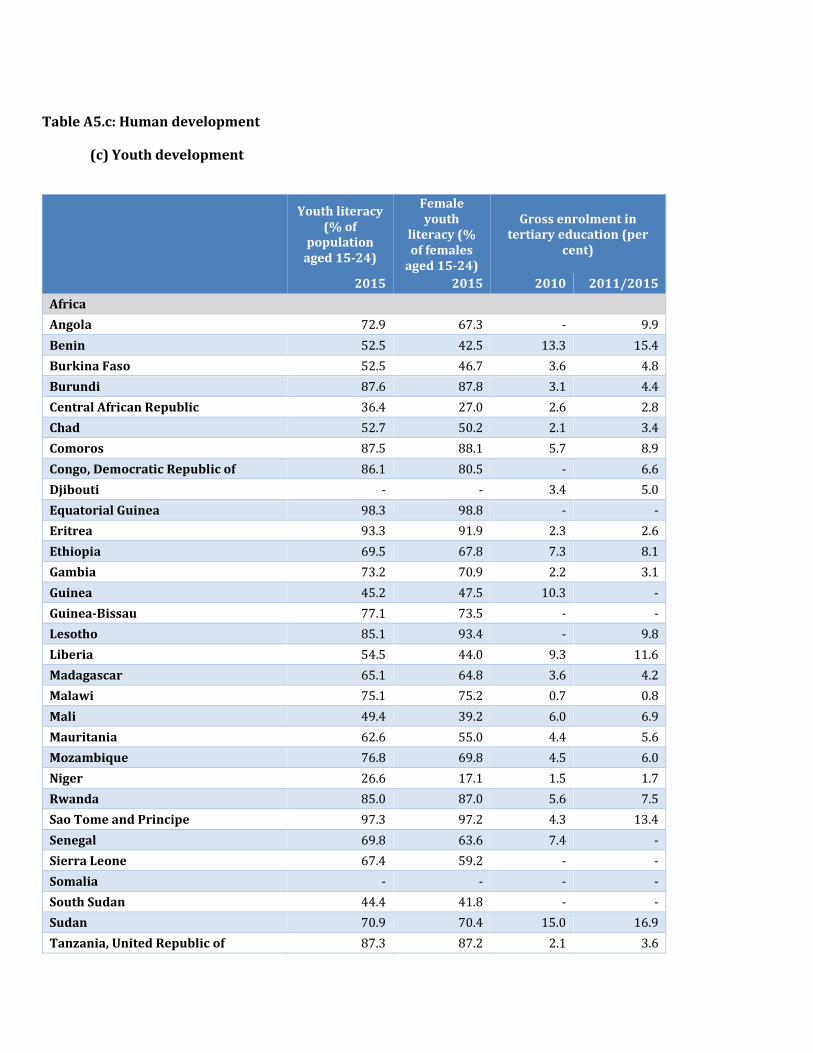
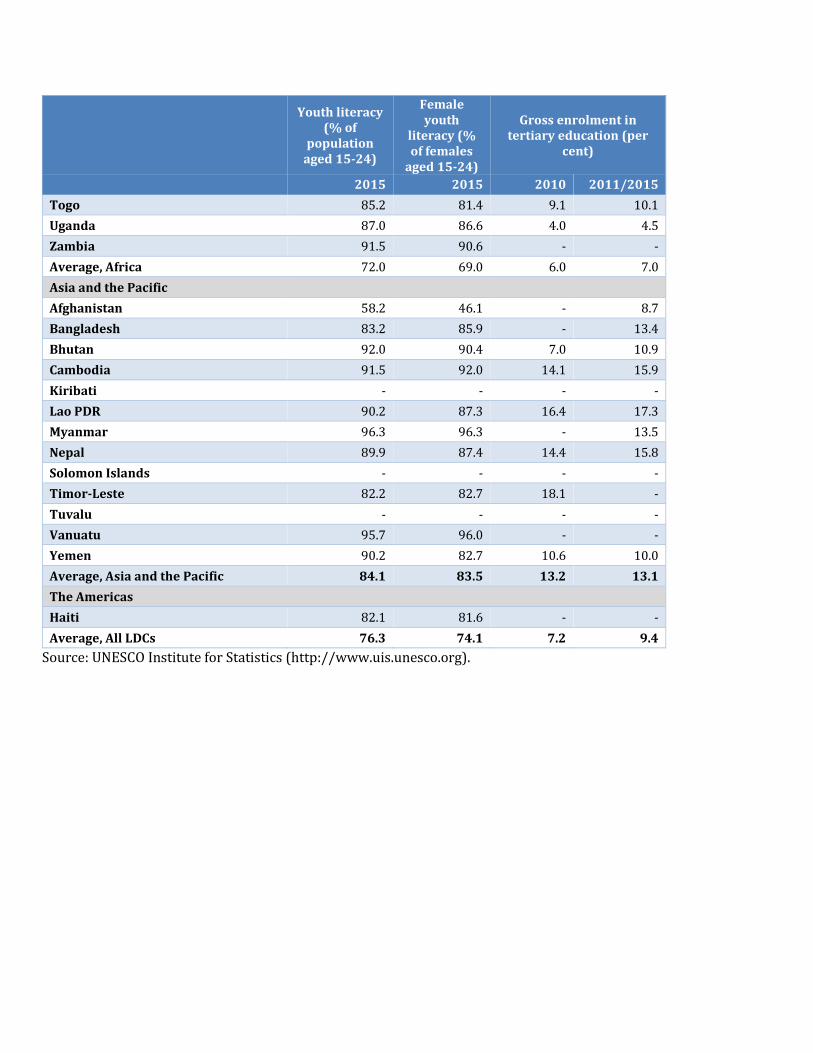
Table A5.c: Human development
(c) Youth development
Youth literacy (% of
population aged 15-24)
Female youth
literacy (% of females
aged 15-24)
Gross enrolment in tertiary education (per
cent)
2015 2015 2010 2011/2015
Africa
Angola 72.9 67.3 - 9.9
Benin 52.5 42.5 13.3 15.4
Burkina Faso 52.5 46.7 3.6 4.8
Burundi 87.6 87.8 3.1 4.4
Central African Republic 36.4 27.0 2.6 2.8
Chad 52.7 50.2 2.1 3.4
Comoros 87.5 88.1 5.7 8.9
Congo, Democratic Republic of 86.1 80.5 - 6.6
Djibouti - - 3.4 5.0
Equatorial Guinea 98.3 98.8 - -
Eritrea 93.3 91.9 2.3 2.6
Ethiopia 69.5 67.8 7.3 8.1
Gambia 73.2 70.9 2.2 3.1
Guinea 45.2 47.5 10.3 -
Guinea-Bissau 77.1 73.5 - -
Lesotho 85.1 93.4 - 9.8
Liberia 54.5 44.0 9.3 11.6
Madagascar 65.1 64.8 3.6 4.2
Malawi 75.1 75.2 0.7 0.8
Mali 49.4 39.2 6.0 6.9
Mauritania 62.6 55.0 4.4 5.6
Mozambique 76.8 69.8 4.5 6.0
Niger 26.6 17.1 1.5 1.7
Rwanda 85.0 87.0 5.6 7.5
Sao Tome and Principe 97.3 97.2 4.3 13.4
Senegal 69.8 63.6 7.4 -
Sierra Leone 67.4 59.2 - -
Somalia - - - -
South Sudan 44.4 41.8 - -
Sudan 70.9 70.4 15.0 16.9
Tanzania, United Republic of 87.3 87.2 2.1 3.6
Youth literacy (% of
population aged 15-24)
Female youth
literacy (% of females
aged 15-24)
Gross enrolment in tertiary education (per
cent)
2015 2015 2010 2011/2015
Togo 85.2 81.4 9.1 10.1
Uganda 87.0 86.6 4.0 4.5
Zambia 91.5 90.6 - -
Average, Africa 72.0 69.0 6.0 7.0
Asia and the Pacific
Afghanistan 58.2 46.1 - 8.7
Bangladesh 83.2 85.9 - 13.4
Bhutan 92.0 90.4 7.0 10.9
Cambodia 91.5 92.0 14.1 15.9
Kiribati - - - -
Lao PDR 90.2 87.3 16.4 17.3
Myanmar 96.3 96.3 - 13.5
Nepal 89.9 87.4 14.4 15.8
Solomon Islands - - - -
Timor-Leste 82.2 82.7 18.1 -
Tuvalu - - - -
Vanuatu 95.7 96.0 - -
Yemen 90.2 82.7 10.6 10.0
Average, Asia and the Pacific 84.1 83.5 13.2 13.1
The Americas
Haiti 82.1 81.6 - -
Average, All LDCs 76.3 74.1 7.2 9.4
Source: UNESCO Institute for Statistics (http://www.uis.unesco.org).
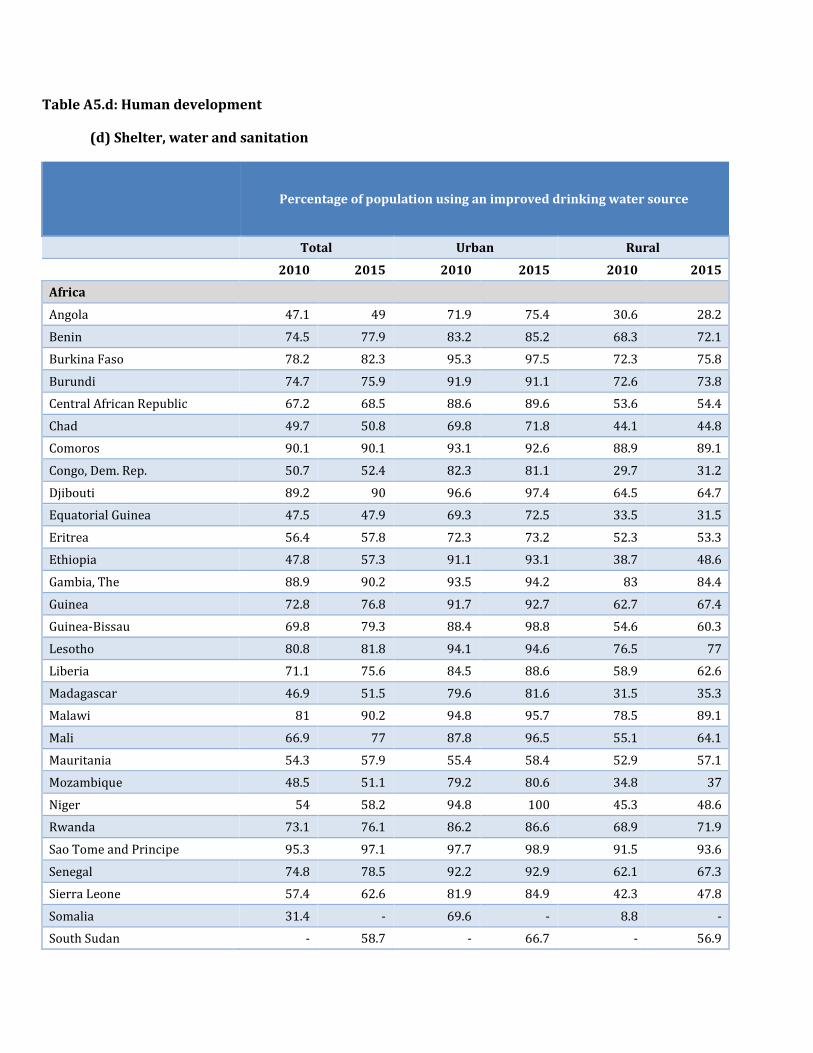
Table A5.d: Human development
(d) Shelter, water and sanitation
Percentage of population using an improved drinking water source
Total Urban Rural
2010 2015 2010 2015 2010 2015
Africa
Angola 47.1 49 71.9 75.4 30.6 28.2
Benin 74.5 77.9 83.2 85.2 68.3 72.1
Burkina Faso 78.2 82.3 95.3 97.5 72.3 75.8
Burundi 74.7 75.9 91.9 91.1 72.6 73.8
Central African Republic 67.2 68.5 88.6 89.6 53.6 54.4
Chad 49.7 50.8 69.8 71.8 44.1 44.8
Comoros 90.1 90.1 93.1 92.6 88.9 89.1
Congo, Dem. Rep. 50.7 52.4 82.3 81.1 29.7 31.2
Djibouti 89.2 90 96.6 97.4 64.5 64.7
Equatorial Guinea 47.5 47.9 69.3 72.5 33.5 31.5
Eritrea 56.4 57.8 72.3 73.2 52.3 53.3
Ethiopia 47.8 57.3 91.1 93.1 38.7 48.6
Gambia, The 88.9 90.2 93.5 94.2 83 84.4
Guinea 72.8 76.8 91.7 92.7 62.7 67.4
Guinea-Bissau 69.8 79.3 88.4 98.8 54.6 60.3
Lesotho 80.8 81.8 94.1 94.6 76.5 77
Liberia 71.1 75.6 84.5 88.6 58.9 62.6
Madagascar 46.9 51.5 79.6 81.6 31.5 35.3
Malawi 81 90.2 94.8 95.7 78.5 89.1
Mali 66.9 77 87.8 96.5 55.1 64.1
Mauritania 54.3 57.9 55.4 58.4 52.9 57.1
Mozambique 48.5 51.1 79.2 80.6 34.8 37
Niger 54 58.2 94.8 100 45.3 48.6
Rwanda 73.1 76.1 86.2 86.6 68.9 71.9
Sao Tome and Principe 95.3 97.1 97.7 98.9 91.5 93.6
Senegal 74.8 78.5 92.2 92.9 62.1 67.3
Sierra Leone 57.4 62.6 81.9 84.9 42.3 47.8
Somalia 31.4 - 69.6 - 8.8 -
South Sudan - 58.7 - 66.7 - 56.9

Percentage of population using an improved drinking water source
Total Urban Rural
2010 2015 2010 2015 2010 2015
Sudan 54.9 - 66 - 50.2 -
Tanzania 55.2 55.6 80.1 77.2 45.5 45.5
Togo 59.8 63.1 89 91.4 42.3 44.2
Uganda 72.5 79 92.6 95.5 69.1 75.8
Zambia 61.4 65.4 86.2 85.6 45.8 51.3
Average, Africa 57.4 62.6 82.5 85.3 47.2 52.4
Asia and the Pacific
Afghanistan 48 55.3 70.7 78.2 40.5 47
Bangladesh 83.5 86.9 85.4 86.5 82.6 87
Bhutan 96 100 99.5 100 94.1 100
Cambodia 64.2 75.5 86.1 100 58.8 69.1
Kiribati 65.4 66.9 86.2 87.3 49.3 50.6
Lao PDR 67.5 75.7 81.8 85.6 60.4 69.4
Myanmar 78.1 80.6 91.4 92.7 72 74.4
Nepal 87 91.6 92 90.9 86 91.8
Solomon Islands 80.4 80.8 93.2 93.2 77.2 77.2
Timor-Leste 68.2 71.9 90.8 95.2 58.7 60.5
Tuvalu 97.7 97.7 98.3 98.3 97 97
Vanuatu 88.4 94.5 97.8 98.9 85.4 92.9
Yemen, Rep. 54.6 - 72 - 46.5 -
Average, Asia and the Pacific 76.1 81.9 84.6 87.7 72.7 79.2
The Americas
Haiti 59.3 57.7 69.7 64.9 48.1 47.6
Average, All LDCs 64.2 69.2 83 85.7 56.6 61.7
Source: WHO/UNICEF Joint Monitoring Programme for Water Supply and Sanitation (http://www.wssinfo.org).
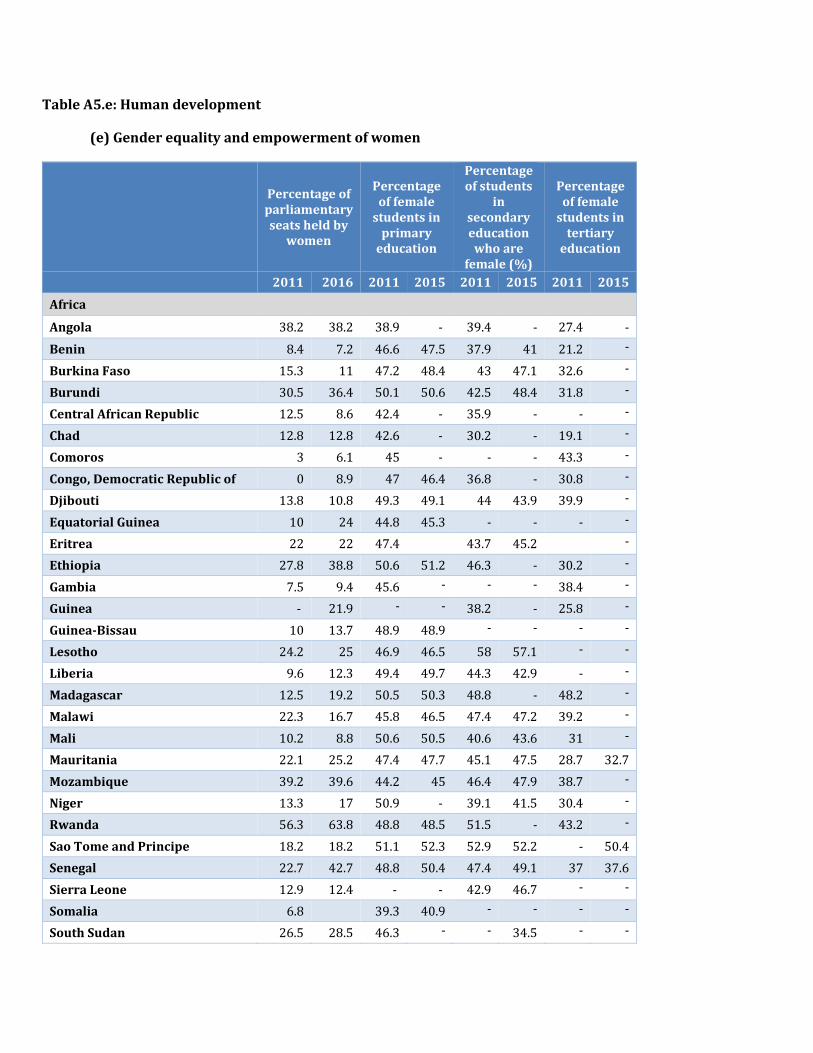
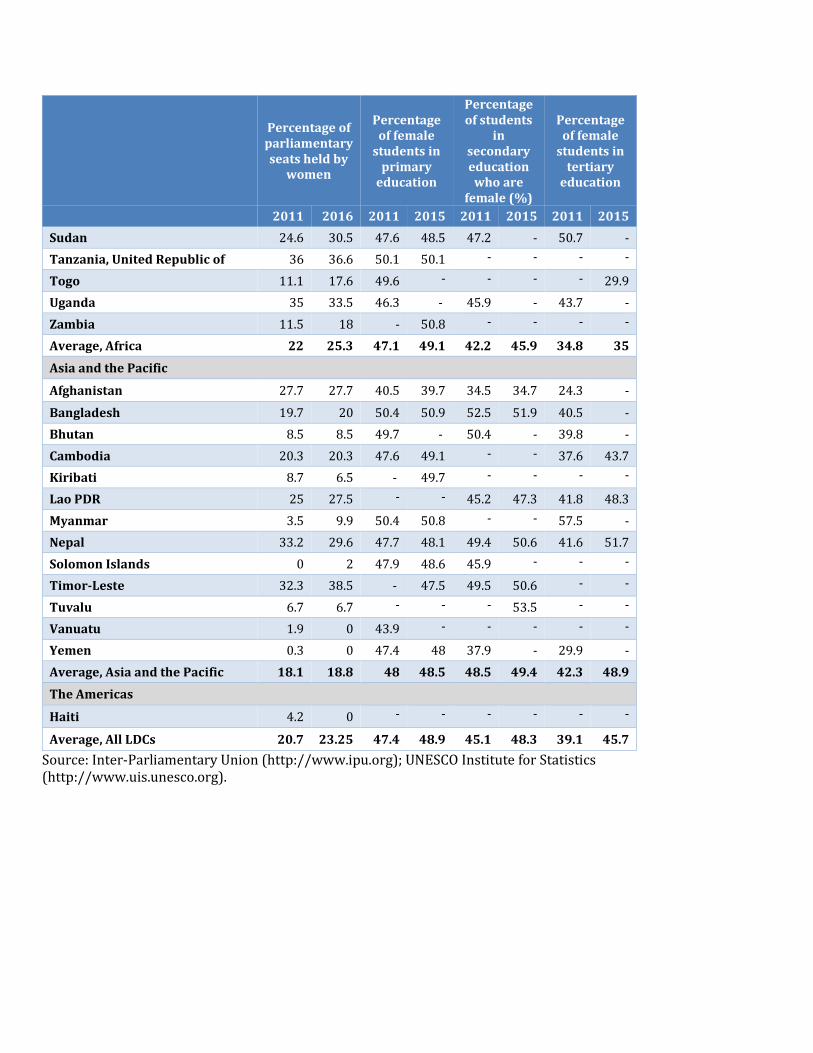
Table A5.e: Human development
(e) Gender equality and empowerment of women
Percentage of parliamentary seats held by
women
Percentage of female
students in primary
education
Percentage of students
in secondary education who are
female (%)
Percentage of female
students in tertiary
education
2011 2016 2011 2015 2011 2015 2011 2015
Africa
Angola 38.2 38.2 38.9 - 39.4 - 27.4 -
Benin 8.4 7.2 46.6 47.5 37.9 41 21.2 -
Burkina Faso 15.3 11 47.2 48.4 43 47.1 32.6 -
Burundi 30.5 36.4 50.1 50.6 42.5 48.4 31.8 -
Central African Republic 12.5 8.6 42.4 - 35.9 - - -
Chad 12.8 12.8 42.6 - 30.2 - 19.1 -
Comoros 3 6.1 45 - - - 43.3 -
Congo, Democratic Republic of 0 8.9 47 46.4 36.8 - 30.8 -
Djibouti 13.8 10.8 49.3 49.1 44 43.9 39.9 -
Equatorial Guinea 10 24 44.8 45.3 - - - -
Eritrea 22 22 47.4 43.7 45.2 -
Ethiopia 27.8 38.8 50.6 51.2 46.3 - 30.2 -
Gambia 7.5 9.4 45.6 - - - 38.4 -
Guinea - 21.9 - - 38.2 - 25.8 -
Guinea-Bissau 10 13.7 48.9 48.9 - - - -
Lesotho 24.2 25 46.9 46.5 58 57.1 - -
Liberia 9.6 12.3 49.4 49.7 44.3 42.9 - -
Madagascar 12.5 19.2 50.5 50.3 48.8 - 48.2 -
Malawi 22.3 16.7 45.8 46.5 47.4 47.2 39.2 -
Mali 10.2 8.8 50.6 50.5 40.6 43.6 31 -
Mauritania 22.1 25.2 47.4 47.7 45.1 47.5 28.7 32.7
Mozambique 39.2 39.6 44.2 45 46.4 47.9 38.7 -
Niger 13.3 17 50.9 - 39.1 41.5 30.4 -
Rwanda 56.3 63.8 48.8 48.5 51.5 - 43.2 -
Sao Tome and Principe 18.2 18.2 51.1 52.3 52.9 52.2 - 50.4
Senegal 22.7 42.7 48.8 50.4 47.4 49.1 37 37.6
Sierra Leone 12.9 12.4 - - 42.9 46.7 - -
Somalia 6.8 39.3 40.9 - - - -
South Sudan 26.5 28.5 46.3 - - 34.5 - -
Percentage of parliamentary seats held by
women
Percentage of female
students in primary
education
Percentage of students
in secondary education who are
female (%)
Percentage of female
students in tertiary
education
2011 2016 2011 2015 2011 2015 2011 2015
Sudan 24.6 30.5 47.6 48.5 47.2 - 50.7 -
Tanzania, United Republic of 36 36.6 50.1 50.1 - - - -
Togo 11.1 17.6 49.6 - - - - 29.9
Uganda 35 33.5 46.3 - 45.9 - 43.7 -
Zambia 11.5 18 - 50.8 - - - -
Average, Africa 22 25.3 47.1 49.1 42.2 45.9 34.8 35
Asia and the Pacific
Afghanistan 27.7 27.7 40.5 39.7 34.5 34.7 24.3 -
Bangladesh 19.7 20 50.4 50.9 52.5 51.9 40.5 -
Bhutan 8.5 8.5 49.7 - 50.4 - 39.8 -
Cambodia 20.3 20.3 47.6 49.1 - - 37.6 43.7
Kiribati 8.7 6.5 - 49.7 - - - -
Lao PDR 25 27.5 - - 45.2 47.3 41.8 48.3
Myanmar 3.5 9.9 50.4 50.8 - - 57.5 -
Nepal 33.2 29.6 47.7 48.1 49.4 50.6 41.6 51.7
Solomon Islands 0 2 47.9 48.6 45.9 - - -
Timor-Leste 32.3 38.5 - 47.5 49.5 50.6 - -
Tuvalu 6.7 6.7 - - - 53.5 - -
Vanuatu 1.9 0 43.9 - - - - -
Yemen 0.3 0 47.4 48 37.9 - 29.9 -
Average, Asia and the Pacific 18.1 18.8 48 48.5 48.5 49.4 42.3 48.9
The Americas
Haiti 4.2 0 - - - - - -
Average, All LDCs 20.7 23.25 47.4 48.9 45.1 48.3 39.1 45.7
Source: Inter-Parliamentary Union (http://www.ipu.org); UNESCO Institute for Statistics (http://www.uis.unesco.org).
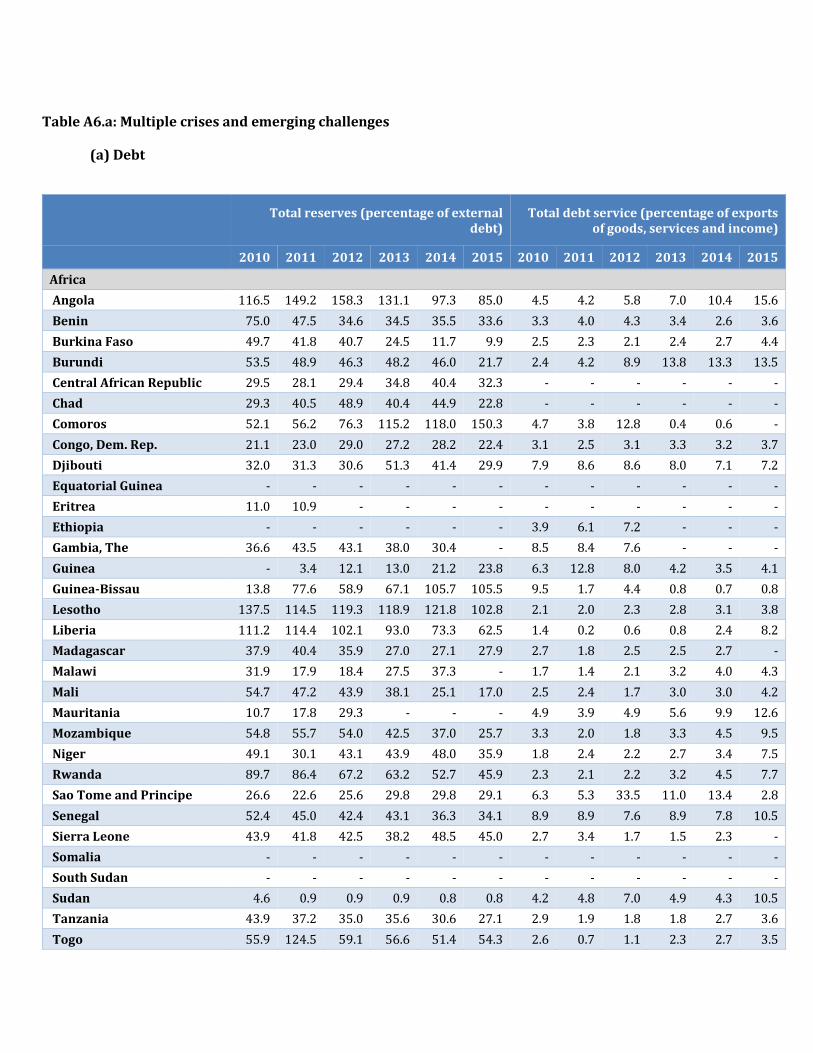
Table A6.a: Multiple crises and emerging challenges
(a) Debt
Total reserves (percentage of external debt)
Total debt service (percentage of exports of goods, services and income)
2010 2011 2012 2013 2014 2015 2010 2011 2012 2013 2014 2015
Africa
Angola 116.5 149.2 158.3 131.1 97.3 85.0 4.5 4.2 5.8 7.0 10.4 15.6
Benin 75.0 47.5 34.6 34.5 35.5 33.6 3.3 4.0 4.3 3.4 2.6 3.6
Burkina Faso 49.7 41.8 40.7 24.5 11.7 9.9 2.5 2.3 2.1 2.4 2.7 4.4
Burundi 53.5 48.9 46.3 48.2 46.0 21.7 2.4 4.2 8.9 13.8 13.3 13.5
Central African Republic 29.5 28.1 29.4 34.8 40.4 32.3 - - - - - -
Chad 29.3 40.5 48.9 40.4 44.9 22.8 - - - - - -
Comoros 52.1 56.2 76.3 115.2 118.0 150.3 4.7 3.8 12.8 0.4 0.6 -
Congo, Dem. Rep. 21.1 23.0 29.0 27.2 28.2 22.4 3.1 2.5 3.1 3.3 3.2 3.7
Djibouti 32.0 31.3 30.6 51.3 41.4 29.9 7.9 8.6 8.6 8.0 7.1 7.2
Equatorial Guinea - - - - - - - - - - - -
Eritrea 11.0 10.9 - - - - - - - - - -
Ethiopia - - - - - - 3.9 6.1 7.2 - - -
Gambia, The 36.6 43.5 43.1 38.0 30.4 - 8.5 8.4 7.6 - - -
Guinea - 3.4 12.1 13.0 21.2 23.8 6.3 12.8 8.0 4.2 3.5 4.1
Guinea-Bissau 13.8 77.6 58.9 67.1 105.7 105.5 9.5 1.7 4.4 0.8 0.7 0.8
Lesotho 137.5 114.5 119.3 118.9 121.8 102.8 2.1 2.0 2.3 2.8 3.1 3.8
Liberia 111.2 114.4 102.1 93.0 73.3 62.5 1.4 0.2 0.6 0.8 2.4 8.2
Madagascar 37.9 40.4 35.9 27.0 27.1 27.9 2.7 1.8 2.5 2.5 2.7 -
Malawi 31.9 17.9 18.4 27.5 37.3 - 1.7 1.4 2.1 3.2 4.0 4.3
Mali 54.7 47.2 43.9 38.1 25.1 17.0 2.5 2.4 1.7 3.0 3.0 4.2
Mauritania 10.7 17.8 29.3 - - - 4.9 3.9 4.9 5.6 9.9 12.6
Mozambique 54.8 55.7 54.0 42.5 37.0 25.7 3.3 2.0 1.8 3.3 4.5 9.5
Niger 49.1 30.1 43.1 43.9 48.0 35.9 1.8 2.4 2.2 2.7 3.4 7.5
Rwanda 89.7 86.4 67.2 63.2 52.7 45.9 2.3 2.1 2.2 3.2 4.5 7.7
Sao Tome and Principe 26.6 22.6 25.6 29.8 29.8 29.1 6.3 5.3 33.5 11.0 13.4 2.8
Senegal 52.4 45.0 42.4 43.1 36.3 34.1 8.9 8.9 7.6 8.9 7.8 10.5
Sierra Leone 43.9 41.8 42.5 38.2 48.5 45.0 2.7 3.4 1.7 1.5 2.3 -
Somalia - - - - - - - - - - - -
South Sudan - - - - - - - - - - - -
Sudan 4.6 0.9 0.9 0.9 0.8 0.8 4.2 4.8 7.0 4.9 4.3 10.5
Tanzania 43.9 37.2 35.0 35.6 30.6 27.1 2.9 1.9 1.8 1.8 2.7 3.6
Togo 55.9 124.5 59.1 56.6 51.4 54.3 2.6 0.7 1.1 2.3 2.7 3.5
Total reserves (percentage of external debt)
Total debt service (percentage of exports of goods, services and income)
2010 2011 2012 2013 2014 2015 2010 2011 2012 2013 2014 2015
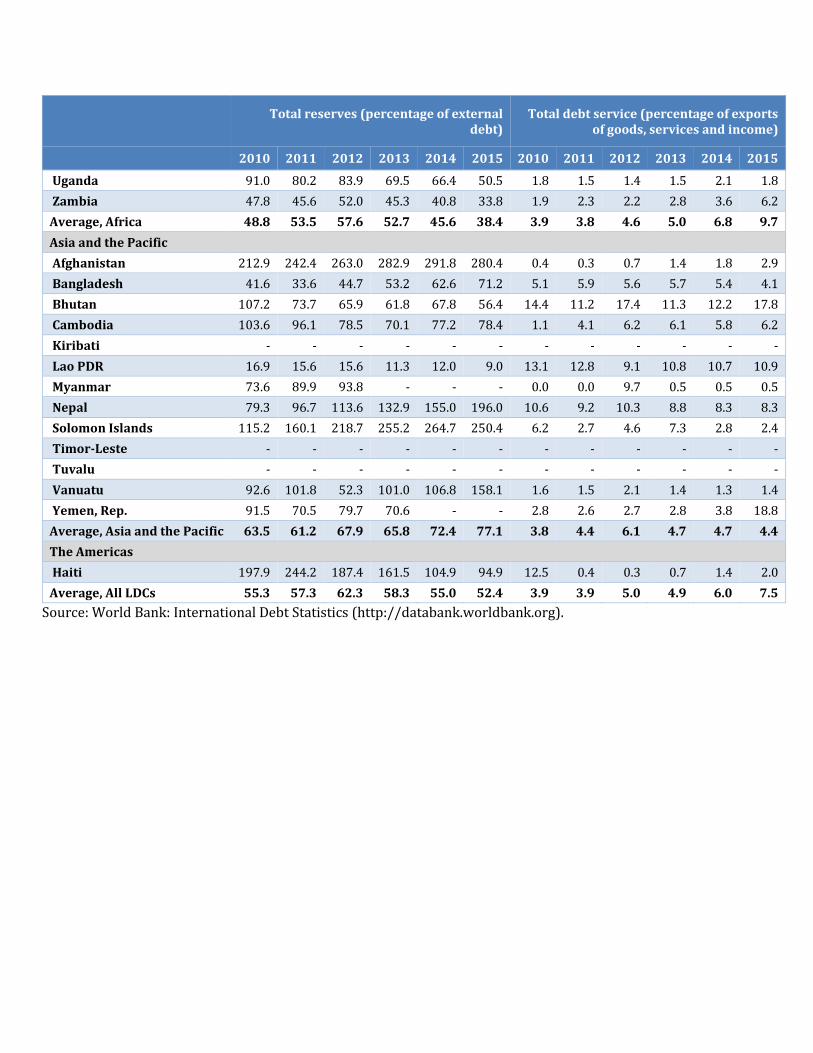
Uganda 91.0 80.2 83.9 69.5 66.4 50.5 1.8 1.5 1.4 1.5 2.1 1.8
Zambia 47.8 45.6 52.0 45.3 40.8 33.8 1.9 2.3 2.2 2.8 3.6 6.2
Average, Africa 48.8 53.5 57.6 52.7 45.6 38.4 3.9 3.8 4.6 5.0 6.8 9.7
Asia and the Pacific
Afghanistan 212.9 242.4 263.0 282.9 291.8 280.4 0.4 0.3 0.7 1.4 1.8 2.9
Bangladesh 41.6 33.6 44.7 53.2 62.6 71.2 5.1 5.9 5.6 5.7 5.4 4.1
Bhutan 107.2 73.7 65.9 61.8 67.8 56.4 14.4 11.2 17.4 11.3 12.2 17.8
Cambodia 103.6 96.1 78.5 70.1 77.2 78.4 1.1 4.1 6.2 6.1 5.8 6.2
Kiribati - - - - - - - - - - - -
Lao PDR 16.9 15.6 15.6 11.3 12.0 9.0 13.1 12.8 9.1 10.8 10.7 10.9
Myanmar 73.6 89.9 93.8 - - - 0.0 0.0 9.7 0.5 0.5 0.5
Nepal 79.3 96.7 113.6 132.9 155.0 196.0 10.6 9.2 10.3 8.8 8.3 8.3
Solomon Islands 115.2 160.1 218.7 255.2 264.7 250.4 6.2 2.7 4.6 7.3 2.8 2.4
Timor-Leste - - - - - - - - - - - -
Tuvalu - - - - - - - - - - - -
Vanuatu 92.6 101.8 52.3 101.0 106.8 158.1 1.6 1.5 2.1 1.4 1.3 1.4
Yemen, Rep. 91.5 70.5 79.7 70.6 - - 2.8 2.6 2.7 2.8 3.8 18.8
Average, Asia and the Pacific 63.5 61.2 67.9 65.8 72.4 77.1 3.8 4.4 6.1 4.7 4.7 4.4
The Americas
Haiti 197.9 244.2 187.4 161.5 104.9 94.9 12.5 0.4 0.3 0.7 1.4 2.0
Average, All LDCs 55.3 57.3 62.3 58.3 55.0 52.4 3.9 3.9 5.0 4.9 6.0 7.5
Source: World Bank: International Debt Statistics (http://databank.worldbank.org).
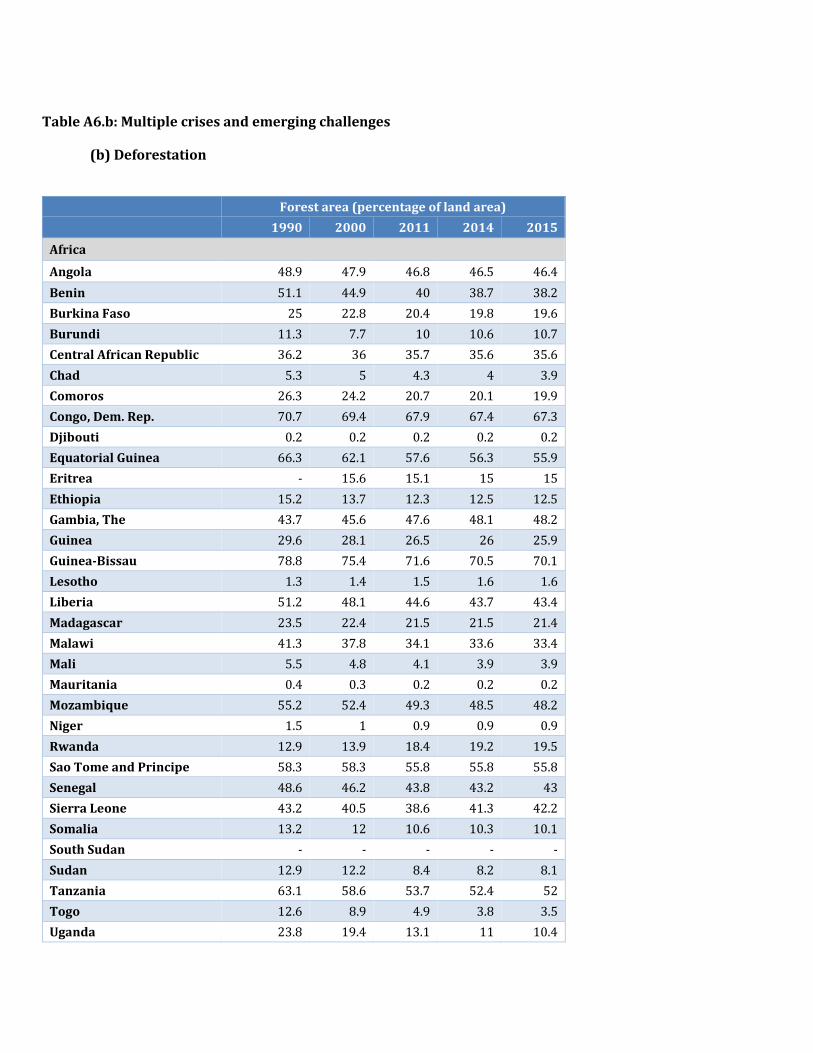
Table A6.b: Multiple crises and emerging challenges
(b) Deforestation
Forest area (percentage of land area)
1990 2000 2011 2014 2015
Africa
Angola 48.9 47.9 46.8 46.5 46.4
Benin 51.1 44.9 40 38.7 38.2
Burkina Faso 25 22.8 20.4 19.8 19.6
Burundi 11.3 7.7 10 10.6 10.7
Central African Republic 36.2 36 35.7 35.6 35.6
Chad 5.3 5 4.3 4 3.9
Comoros 26.3 24.2 20.7 20.1 19.9
Congo, Dem. Rep. 70.7 69.4 67.9 67.4 67.3
Djibouti 0.2 0.2 0.2 0.2 0.2
Equatorial Guinea 66.3 62.1 57.6 56.3 55.9
Eritrea - 15.6 15.1 15 15
Ethiopia 15.2 13.7 12.3 12.5 12.5
Gambia, The 43.7 45.6 47.6 48.1 48.2
Guinea 29.6 28.1 26.5 26 25.9
Guinea-Bissau 78.8 75.4 71.6 70.5 70.1
Lesotho 1.3 1.4 1.5 1.6 1.6
Liberia 51.2 48.1 44.6 43.7 43.4
Madagascar 23.5 22.4 21.5 21.5 21.4
Malawi 41.3 37.8 34.1 33.6 33.4
Mali 5.5 4.8 4.1 3.9 3.9
Mauritania 0.4 0.3 0.2 0.2 0.2
Mozambique 55.2 52.4 49.3 48.5 48.2
Niger 1.5 1 0.9 0.9 0.9
Rwanda 12.9 13.9 18.4 19.2 19.5
Sao Tome and Principe 58.3 58.3 55.8 55.8 55.8
Senegal 48.6 46.2 43.8 43.2 43
Sierra Leone 43.2 40.5 38.6 41.3 42.2
Somalia 13.2 12 10.6 10.3 10.1
South Sudan - - - - -
Sudan 12.9 12.2 8.4 8.2 8.1
Tanzania 63.1 58.6 53.7 52.4 52
Togo 12.6 8.9 4.9 3.8 3.5
Uganda 23.8 19.4 13.1 11 10.4
Forest area (percentage of land area)
1990 2000 2011 2014 2015
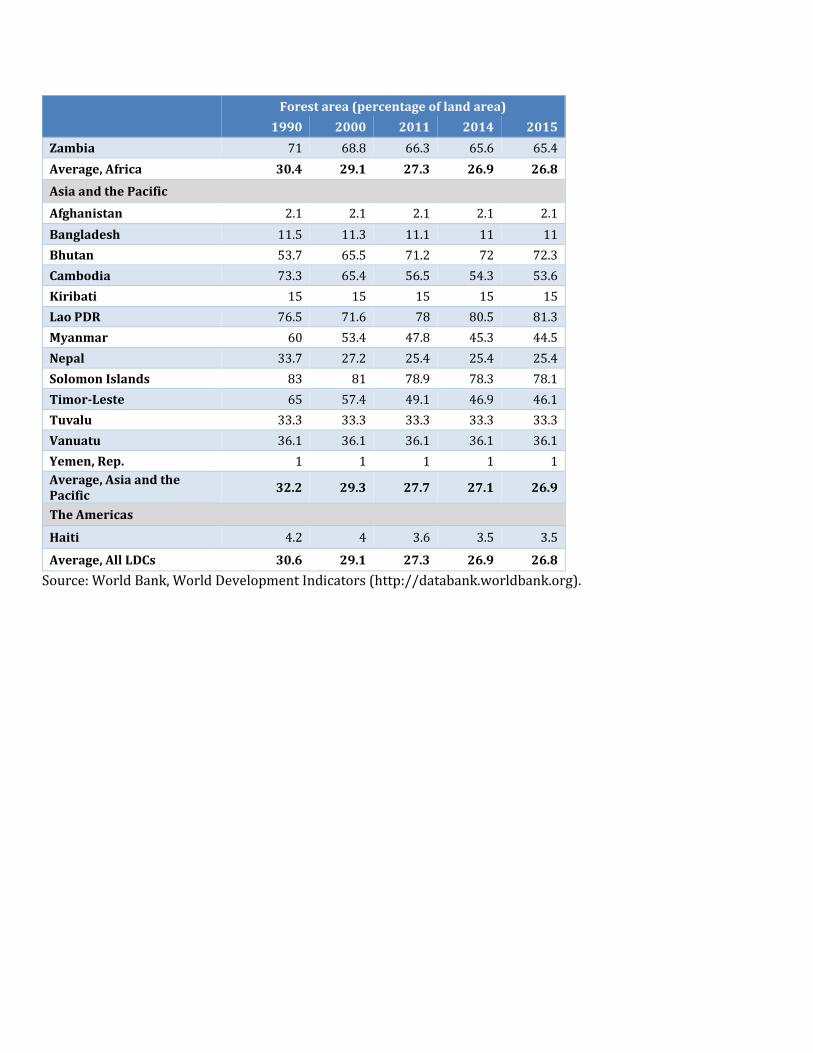
Zambia 71 68.8 66.3 65.6 65.4
Average, Africa 30.4 29.1 27.3 26.9 26.8
Asia and the Pacific
Afghanistan 2.1 2.1 2.1 2.1 2.1
Bangladesh 11.5 11.3 11.1 11 11
Bhutan 53.7 65.5 71.2 72 72.3
Cambodia 73.3 65.4 56.5 54.3 53.6
Kiribati 15 15 15 15 15
Lao PDR 76.5 71.6 78 80.5 81.3
Myanmar 60 53.4 47.8 45.3 44.5
Nepal 33.7 27.2 25.4 25.4 25.4
Solomon Islands 83 81 78.9 78.3 78.1
Timor-Leste 65 57.4 49.1 46.9 46.1
Tuvalu 33.3 33.3 33.3 33.3 33.3
Vanuatu 36.1 36.1 36.1 36.1 36.1
Yemen, Rep. 1 1 1 1 1
Average, Asia and the Pacific
32.2 29.3 27.7 27.1 26.9
The Americas
Haiti 4.2 4 3.6 3.5 3.5
Average, All LDCs 30.6 29.1 27.3 26.9 26.8
Source: World Bank, World Development Indicators (http://databank.worldbank.org).
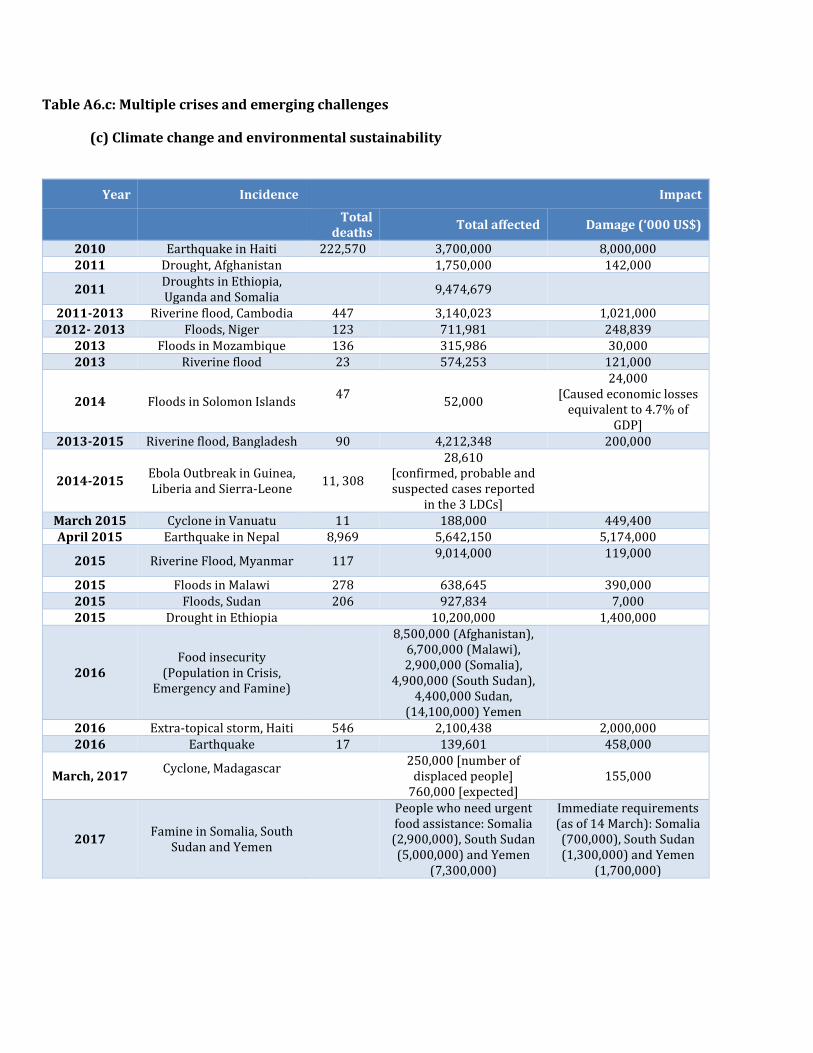
Table A6.c: Multiple crises and emerging challenges
(c) Climate change and environmental sustainability
Year Incidence Impact
Total
deaths Total affected Damage (‘000 US$)
2010 Earthquake in Haiti 222,570 3,700,000 8,000,000 2011 Drought, Afghanistan 1,750,000 142,000
2011 Droughts in Ethiopia, Uganda and Somalia
9,474,679
2011-2013 Riverine flood, Cambodia 447 3,140,023 1,021,000 2012- 2013 Floods, Niger 123 711,981 248,839
2013 Floods in Mozambique 136 315,986 30,000 2013 Riverine flood 23 574,253 121,000
2014 Floods in Solomon Islands 47
52,000
24,000 [Caused economic losses
equivalent to 4.7% of GDP]
2013-2015 Riverine flood, Bangladesh 90 4,212,348 200,000
2014-2015 Ebola Outbreak in Guinea, Liberia and Sierra-Leone
11, 308
28,610 [confirmed, probable and suspected cases reported
in the 3 LDCs]
March 2015 Cyclone in Vanuatu 11 188,000 449,400 April 2015 Earthquake in Nepal 8,969 5,642,150 5,174,000
2015 Riverine Flood, Myanmar 117 9,014,000
119,000
2015 Floods in Malawi 278 638,645 390,000 2015 Floods, Sudan 206 927,834 7,000 2015 Drought in Ethiopia 10,200,000 1,400,000
2016 Food insecurity
(Population in Crisis, Emergency and Famine)
8,500,000 (Afghanistan), 6,700,000 (Malawi), 2,900,000 (Somalia),
4,900,000 (South Sudan), 4,400,000 Sudan,
(14,100,000) Yemen
2016 Extra-topical storm, Haiti 546 2,100,438 2,000,000 2016 Earthquake 17 139,601 458,000
March, 2017 Cyclone, Madagascar
250,000 [number of displaced people]
760,000 [expected] 155,000
2017 Famine in Somalia, South
Sudan and Yemen
People who need urgent food assistance: Somalia (2,900,000), South Sudan (5,000,000) and Yemen
(7,300,000)
Immediate requirements (as of 14 March): Somalia (700,000), South Sudan (1,300,000) and Yemen
(1,700,000)
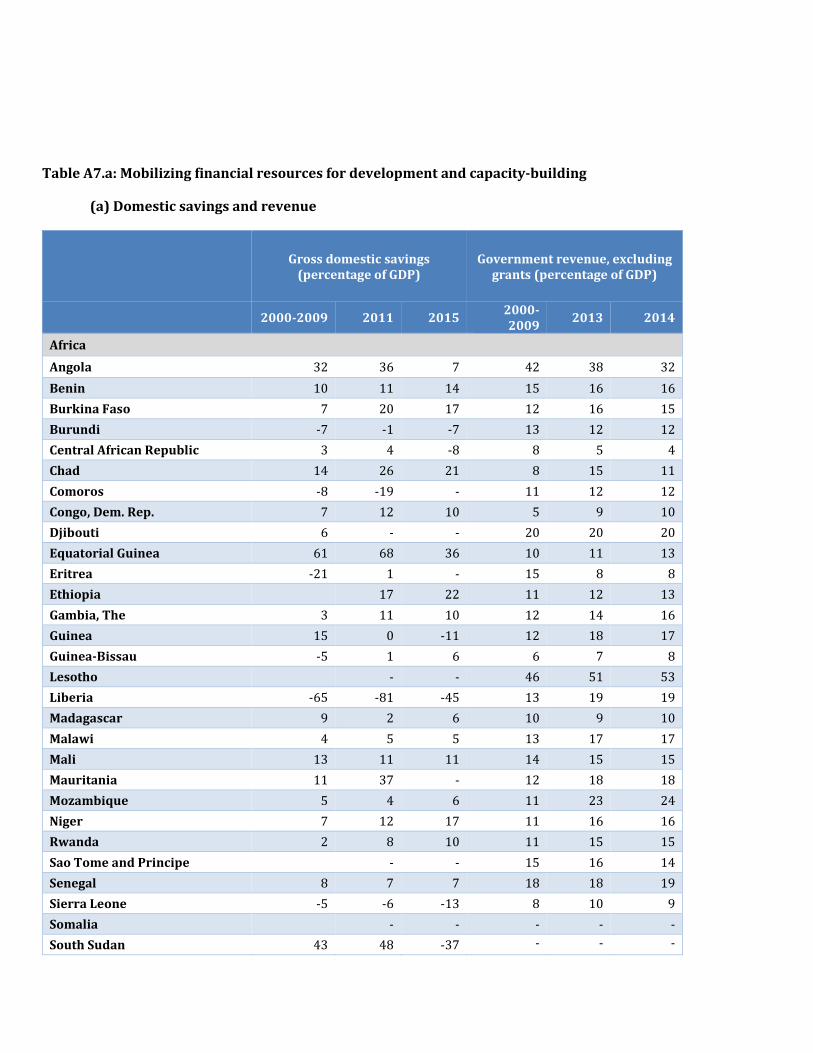
Table A7.a: Mobilizing financial resources for development and capacity-building
(a) Domestic savings and revenue
Gross domestic savings
(percentage of GDP) Government revenue, excluding
grants (percentage of GDP)
2000-2009 2011 2015 2000-2009
2013 2014
Africa
Angola 32 36 7 42 38 32
Benin 10 11 14 15 16 16
Burkina Faso 7 20 17 12 16 15
Burundi -7 -1 -7 13 12 12
Central African Republic 3 4 -8 8 5 4
Chad 14 26 21 8 15 11
Comoros -8 -19 - 11 12 12
Congo, Dem. Rep. 7 12 10 5 9 10
Djibouti 6 - - 20 20 20
Equatorial Guinea 61 68 36 10 11 13
Eritrea -21 1 - 15 8 8
Ethiopia 17 22 11 12 13
Gambia, The 3 11 10 12 14 16
Guinea 15 0 -11 12 18 17
Guinea-Bissau -5 1 6 6 7 8
Lesotho - - 46 51 53
Liberia -65 -81 -45 13 19 19
Madagascar 9 2 6 10 9 10
Malawi 4 5 5 13 17 17
Mali 13 11 11 14 15 15
Mauritania 11 37 - 12 18 18
Mozambique 5 4 6 11 23 24
Niger 7 12 17 11 16 16
Rwanda 2 8 10 11 15 15
Sao Tome and Principe - - 15 16 14
Senegal 8 7 7 18 18 19
Sierra Leone -5 -6 -13 8 10 9
Somalia - - - - -
South Sudan 43 48 -37 - - -
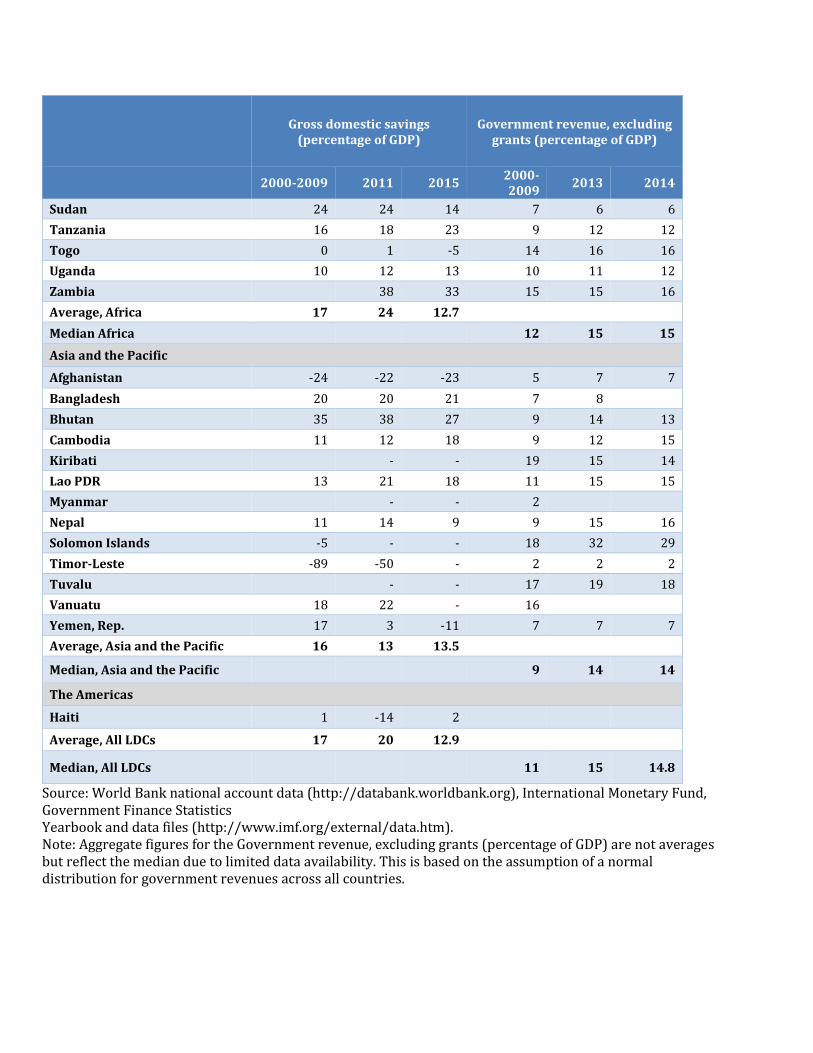
Gross domestic savings
(percentage of GDP) Government revenue, excluding
grants (percentage of GDP)
2000-2009 2011 2015 2000-2009
2013 2014
Sudan 24 24 14 7 6 6
Tanzania 16 18 23 9 12 12
Togo 0 1 -5 14 16 16
Uganda 10 12 13 10 11 12
Zambia 38 33 15 15 16
Average, Africa 17 24 12.7
Median Africa 12 15 15
Asia and the Pacific
Afghanistan -24 -22 -23 5 7 7
Bangladesh 20 20 21 7 8
Bhutan 35 38 27 9 14 13
Cambodia 11 12 18 9 12 15
Kiribati - - 19 15 14
Lao PDR 13 21 18 11 15 15
Myanmar - - 2
Nepal 11 14 9 9 15 16
Solomon Islands -5 - - 18 32 29
Timor-Leste -89 -50 - 2 2 2
Tuvalu - - 17 19 18
Vanuatu 18 22 - 16
Yemen, Rep. 17 3 -11 7 7 7
Average, Asia and the Pacific 16 13 13.5
Median, Asia and the Pacific 9 14 14
The Americas
Haiti 1 -14 2
Average, All LDCs 17 20 12.9
Median, All LDCs 11 15 14.8
Source: World Bank national account data (http://databank.worldbank.org), International Monetary Fund, Government Finance Statistics Yearbook and data files (http://www.imf.org/external/data.htm). Note: Aggregate figures for the Government revenue, excluding grants (percentage of GDP) are not averages but reflect the median due to limited data availability. This is based on the assumption of a normal distribution for government revenues across all countries.
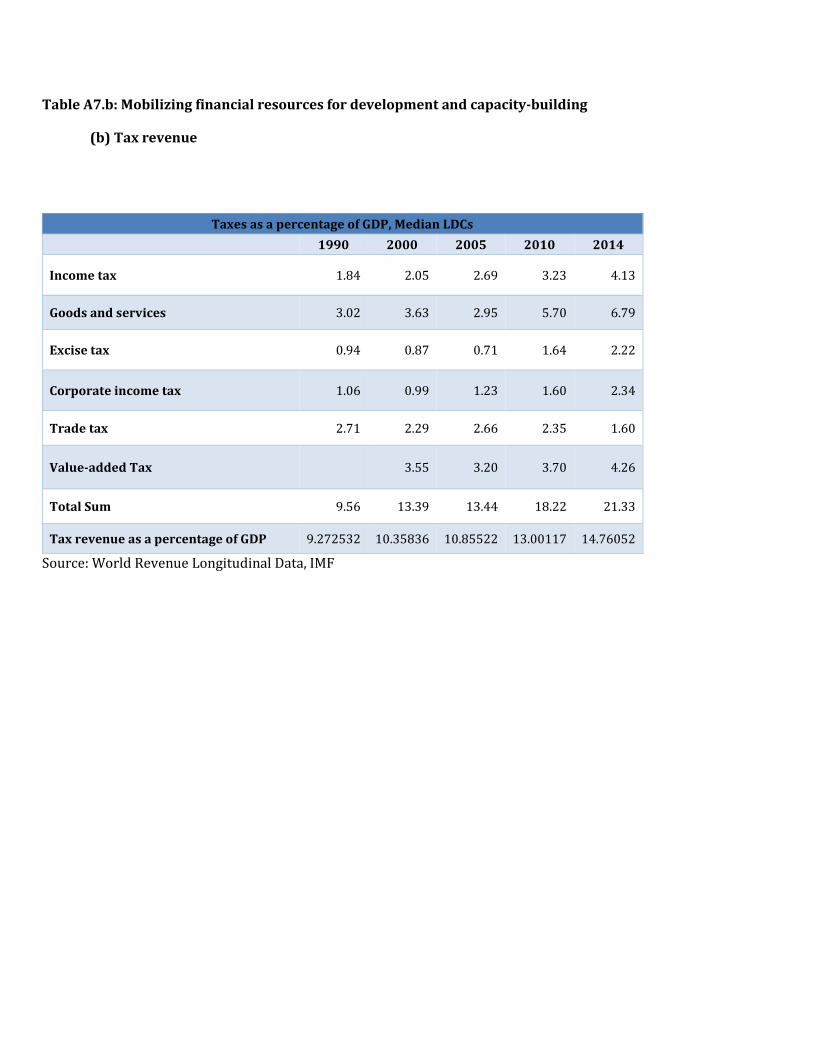
Table A7.b: Mobilizing financial resources for development and capacity-building
(b) Tax revenue
Taxes as a percentage of GDP, Median LDCs 1990 2000 2005 2010 2014
Income tax 1.84 2.05 2.69 3.23 4.13
Goods and services 3.02 3.63 2.95 5.70 6.79
Excise tax 0.94 0.87 0.71 1.64 2.22
Corporate income tax 1.06 0.99 1.23 1.60 2.34
Trade tax 2.71 2.29 2.66 2.35 1.60
Value-added Tax 3.55 3.20 3.70 4.26
Total Sum 9.56 13.39 13.44 18.22 21.33
Tax revenue as a percentage of GDP 9.272532 10.35836 10.85522 13.00117 14.76052
Source: World Revenue Longitudinal Data, IMF
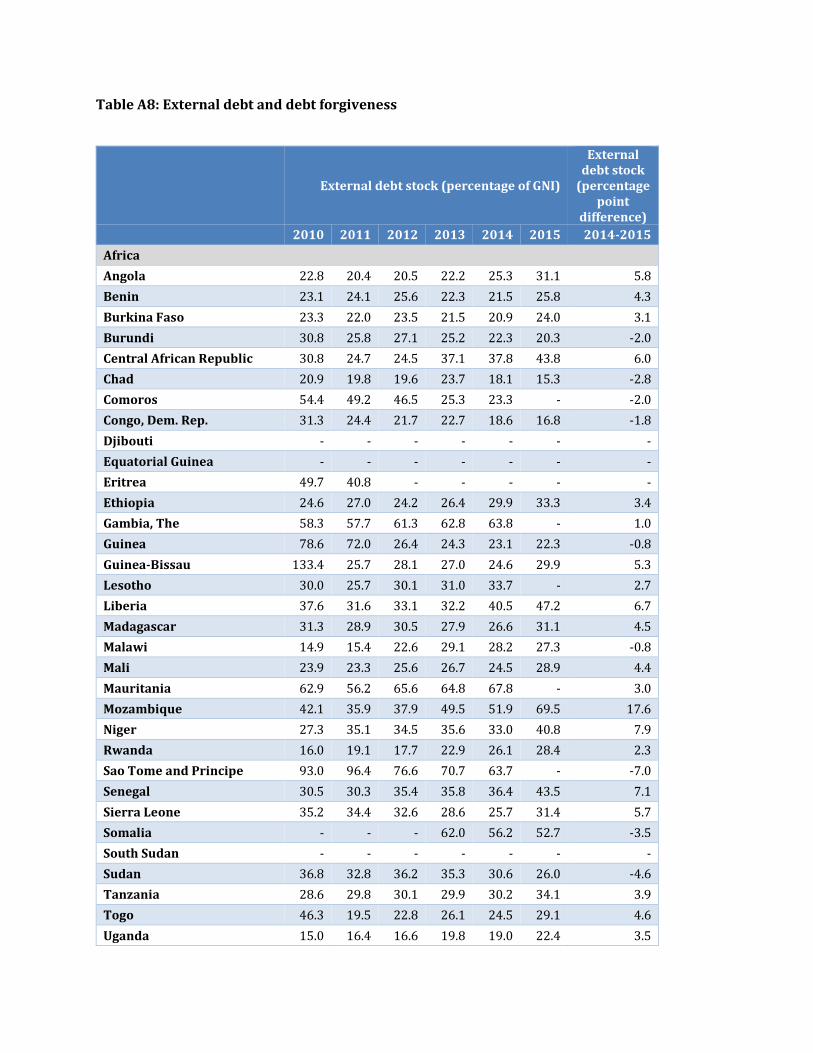
Table A8: External debt and debt forgiveness
External debt stock (percentage of GNI)
External debt stock
(percentage point
difference) 2010 2011 2012 2013 2014 2015 2014-2015
Africa
Angola 22.8 20.4 20.5 22.2 25.3 31.1 5.8
Benin 23.1 24.1 25.6 22.3 21.5 25.8 4.3
Burkina Faso 23.3 22.0 23.5 21.5 20.9 24.0 3.1
Burundi 30.8 25.8 27.1 25.2 22.3 20.3 -2.0
Central African Republic 30.8 24.7 24.5 37.1 37.8 43.8 6.0
Chad 20.9 19.8 19.6 23.7 18.1 15.3 -2.8
Comoros 54.4 49.2 46.5 25.3 23.3 - -2.0
Congo, Dem. Rep. 31.3 24.4 21.7 22.7 18.6 16.8 -1.8
Djibouti - - - - - - -
Equatorial Guinea - - - - - - -
Eritrea 49.7 40.8 - - - - -
Ethiopia 24.6 27.0 24.2 26.4 29.9 33.3 3.4
Gambia, The 58.3 57.7 61.3 62.8 63.8 - 1.0
Guinea 78.6 72.0 26.4 24.3 23.1 22.3 -0.8
Guinea-Bissau 133.4 25.7 28.1 27.0 24.6 29.9 5.3
Lesotho 30.0 25.7 30.1 31.0 33.7 - 2.7
Liberia 37.6 31.6 33.1 32.2 40.5 47.2 6.7
Madagascar 31.3 28.9 30.5 27.9 26.6 31.1 4.5
Malawi 14.9 15.4 22.6 29.1 28.2 27.3 -0.8
Mali 23.9 23.3 25.6 26.7 24.5 28.9 4.4
Mauritania 62.9 56.2 65.6 64.8 67.8 - 3.0
Mozambique 42.1 35.9 37.9 49.5 51.9 69.5 17.6
Niger 27.3 35.1 34.5 35.6 33.0 40.8 7.9
Rwanda 16.0 19.1 17.7 22.9 26.1 28.4 2.3
Sao Tome and Principe 93.0 96.4 76.6 70.7 63.7 - -7.0
Senegal 30.5 30.3 35.4 35.8 36.4 43.5 7.1
Sierra Leone 35.2 34.4 32.6 28.6 25.7 31.4 5.7
Somalia - - - 62.0 56.2 52.7 -3.5
South Sudan - - - - - - -
Sudan 36.8 32.8 36.2 35.3 30.6 26.0 -4.6
Tanzania 28.6 29.8 30.1 29.9 30.2 34.1 3.9
Togo 46.3 19.5 22.8 26.1 24.5 29.1 4.6
Uganda 15.0 16.4 16.6 19.8 19.0 22.4 3.5
External debt stock (percentage of GNI)
External debt stock
(percentage point
difference) 2010 2011 2012 2013 2014 2015 2014-2015
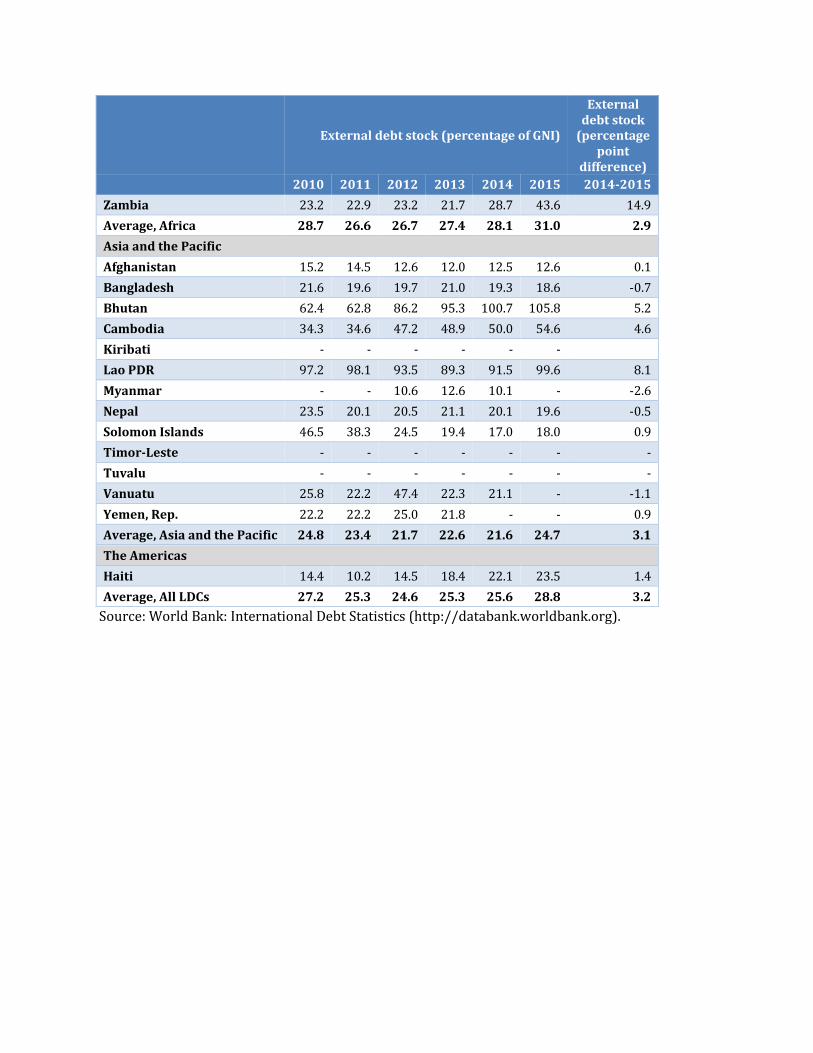
Zambia 23.2 22.9 23.2 21.7 28.7 43.6 14.9
Average, Africa 28.7 26.6 26.7 27.4 28.1 31.0 2.9
Asia and the Pacific
Afghanistan 15.2 14.5 12.6 12.0 12.5 12.6 0.1
Bangladesh 21.6 19.6 19.7 21.0 19.3 18.6 -0.7
Bhutan 62.4 62.8 86.2 95.3 100.7 105.8 5.2
Cambodia 34.3 34.6 47.2 48.9 50.0 54.6 4.6
Kiribati - - - - - -
Lao PDR 97.2 98.1 93.5 89.3 91.5 99.6 8.1
Myanmar - - 10.6 12.6 10.1 - -2.6
Nepal 23.5 20.1 20.5 21.1 20.1 19.6 -0.5
Solomon Islands 46.5 38.3 24.5 19.4 17.0 18.0 0.9
Timor-Leste - - - - - - -
Tuvalu - - - - - - -
Vanuatu 25.8 22.2 47.4 22.3 21.1 - -1.1
Yemen, Rep. 22.2 22.2 25.0 21.8 - - 0.9
Average, Asia and the Pacific 24.8 23.4 21.7 22.6 21.6 24.7 3.1
The Americas
Haiti 14.4 10.2 14.5 18.4 22.1 23.5 1.4
Average, All LDCs 27.2 25.3 24.6 25.3 25.6 28.8 3.2
Source: World Bank: International Debt Statistics (http://databank.worldbank.org).
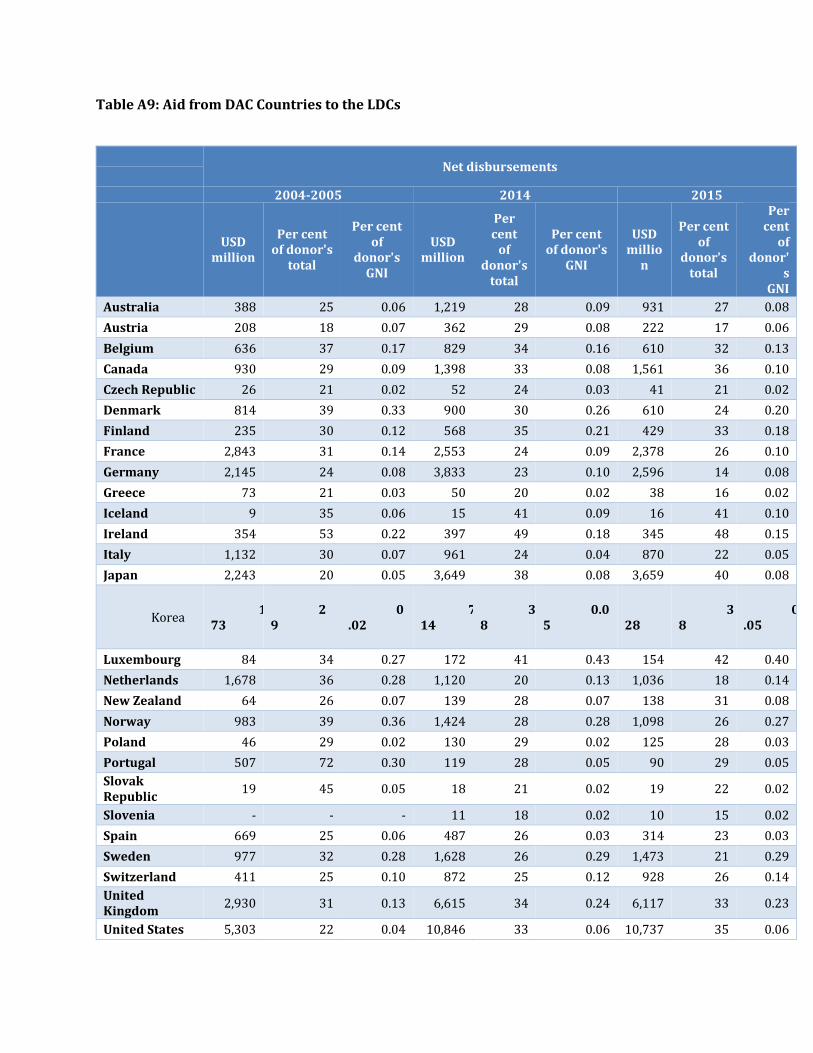
Table A9: Aid from DAC Countries to the LDCs
Net disbursements 2004-2005 2014 2015
USD million
Per cent of donor's
total
Per cent of
donor's GNI
USD million
Per cent
of donor's
total
Per cent of donor's
GNI
USD millio
n
Per cent of
donor's total
Per cent
of donor'
s GNI
Australia 388 25 0.06 1,219 28 0.09 931 27 0.08
Austria 208 18 0.07 362 29 0.08 222 17 0.06
Belgium 636 37 0.17 829 34 0.16 610 32 0.13
Canada 930 29 0.09 1,398 33 0.08 1,561 36 0.10
Czech Republic 26 21 0.02 52 24 0.03 41 21 0.02
Denmark 814 39 0.33 900 30 0.26 610 24 0.20
Finland 235 30 0.12 568 35 0.21 429 33 0.18
France 2,843 31 0.14 2,553 24 0.09 2,378 26 0.10
Germany 2,145 24 0.08 3,833 23 0.10 2,596 14 0.08
Greece 73 21 0.03 50 20 0.02 38 16 0.02
Iceland 9 35 0.06 15 41 0.09 16 41 0.10
Ireland 354 53 0.22 397 49 0.18 345 48 0.15
Italy 1,132 30 0.07 961 24 0.04 870 22 0.05
Japan 2,243 20 0.05 3,649 38 0.08 3,659 40 0.08
Korea 1
73 2
9 0
.02 7
14 3
8 0.0
5 7
28 3
8 0
.05
Luxembourg 84 34 0.27 172 41 0.43 154 42 0.40
Netherlands 1,678 36 0.28 1,120 20 0.13 1,036 18 0.14
New Zealand 64 26 0.07 139 28 0.07 138 31 0.08
Norway 983 39 0.36 1,424 28 0.28 1,098 26 0.27
Poland 46 29 0.02 130 29 0.02 125 28 0.03
Portugal 507 72 0.30 119 28 0.05 90 29 0.05
Slovak Republic
19 45 0.05 18 21 0.02 19 22 0.02
Slovenia - - - 11 18 0.02 10 15 0.02
Spain 669 25 0.06 487 26 0.03 314 23 0.03
Sweden 977 32 0.28 1,628 26 0.29 1,473 21 0.29
Switzerland 411 25 0.10 872 25 0.12 928 26 0.14
United Kingdom
2,930 31 0.13 6,615 34 0.24 6,117 33 0.23
United States 5,303 22 0.04 10,846 33 0.06 10,737 35 0.06
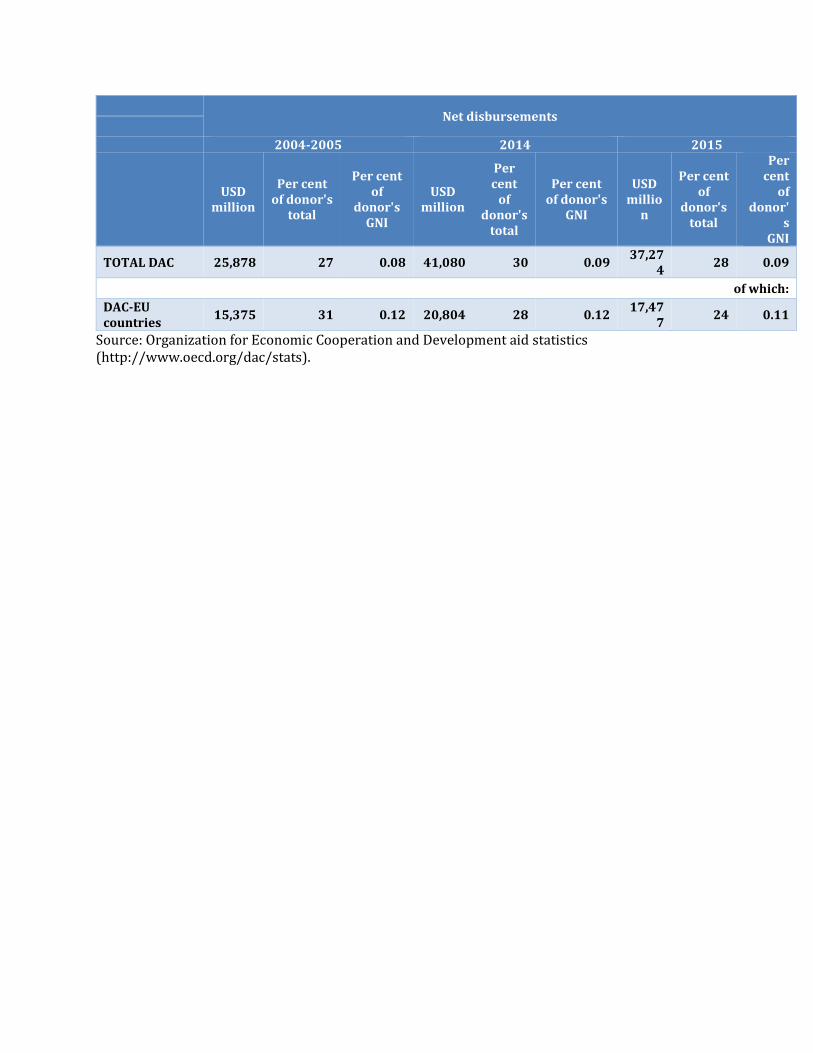
Net disbursements
2004-2005 2014 2015
USD million
Per cent of donor's
total
Per cent of
donor's GNI
USD million
Per cent
of donor's
total
Per cent of donor's
GNI
USD millio
n
Per cent of
donor's total
Per cent
of donor'
s GNI
TOTAL DAC 25,878 27 0.08 41,080 30 0.09 37,27
4 28 0.09
of which:
DAC-EU countries
15,375 31 0.12 20,804 28 0.12 17,47
7 24 0.11
Source: Organization for Economic Cooperation and Development aid statistics (http://www.oecd.org/dac/stats).
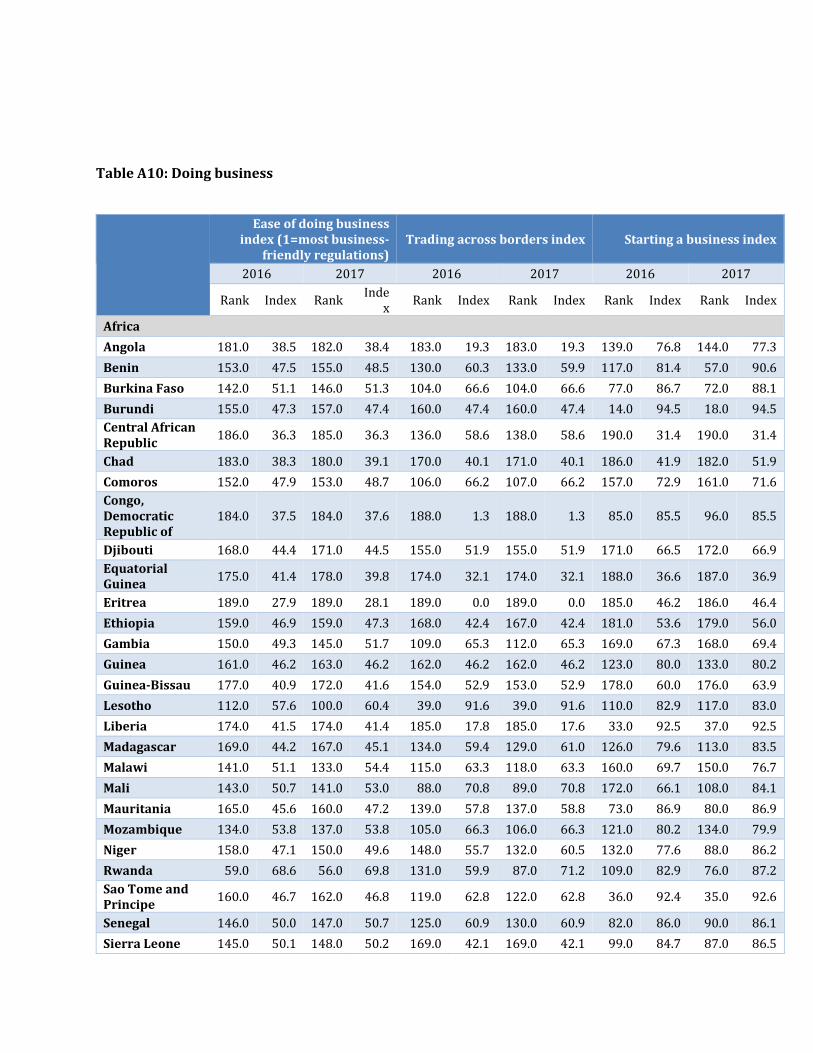
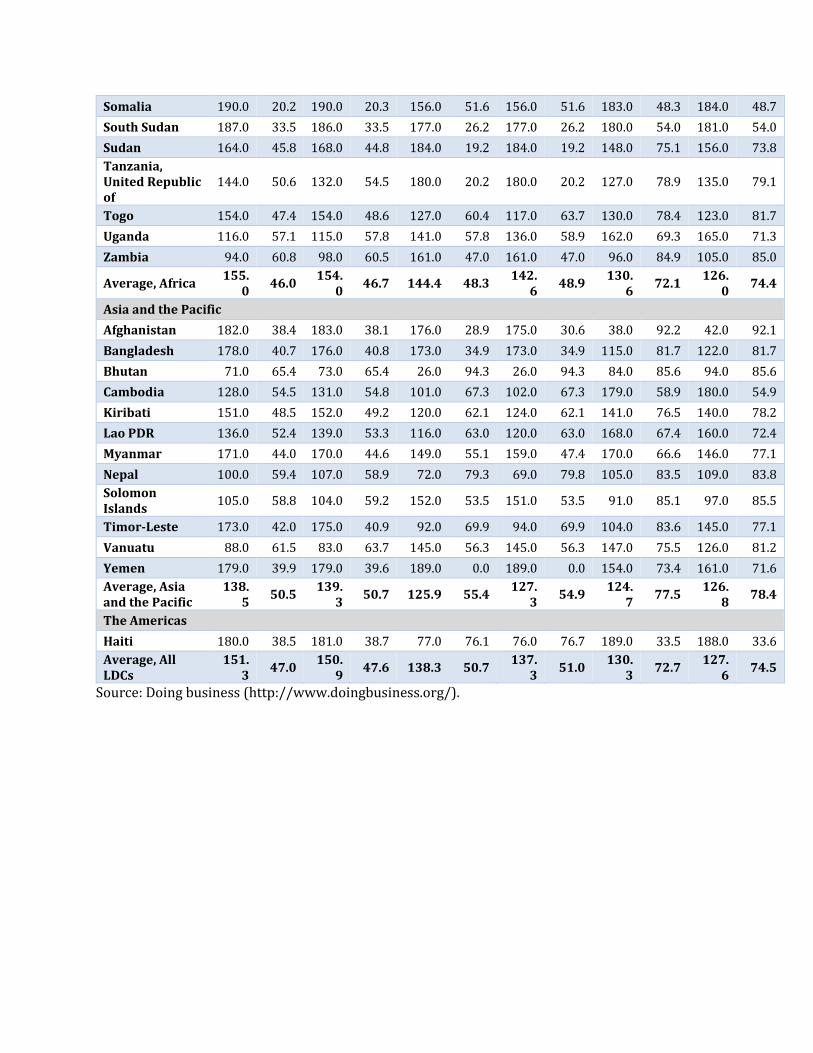
Table A10: Doing business
Ease of doing business index (1=most business-
friendly regulations) Trading across borders index Starting a business index
2016 2017 2016 2017 2016 2017
Rank Index Rank Inde
x Rank Index Rank Index Rank Index Rank Index
Africa
Angola 181.0 38.5 182.0 38.4 183.0 19.3 183.0 19.3 139.0 76.8 144.0 77.3
Benin 153.0 47.5 155.0 48.5 130.0 60.3 133.0 59.9 117.0 81.4 57.0 90.6
Burkina Faso 142.0 51.1 146.0 51.3 104.0 66.6 104.0 66.6 77.0 86.7 72.0 88.1
Burundi 155.0 47.3 157.0 47.4 160.0 47.4 160.0 47.4 14.0 94.5 18.0 94.5
Central African Republic
186.0 36.3 185.0 36.3 136.0 58.6 138.0 58.6 190.0 31.4 190.0 31.4
Chad 183.0 38.3 180.0 39.1 170.0 40.1 171.0 40.1 186.0 41.9 182.0 51.9
Comoros 152.0 47.9 153.0 48.7 106.0 66.2 107.0 66.2 157.0 72.9 161.0 71.6
Congo, Democratic Republic of
184.0 37.5 184.0 37.6 188.0 1.3 188.0 1.3 85.0 85.5 96.0 85.5
Djibouti 168.0 44.4 171.0 44.5 155.0 51.9 155.0 51.9 171.0 66.5 172.0 66.9
Equatorial Guinea
175.0 41.4 178.0 39.8 174.0 32.1 174.0 32.1 188.0 36.6 187.0 36.9
Eritrea 189.0 27.9 189.0 28.1 189.0 0.0 189.0 0.0 185.0 46.2 186.0 46.4
Ethiopia 159.0 46.9 159.0 47.3 168.0 42.4 167.0 42.4 181.0 53.6 179.0 56.0
Gambia 150.0 49.3 145.0 51.7 109.0 65.3 112.0 65.3 169.0 67.3 168.0 69.4
Guinea 161.0 46.2 163.0 46.2 162.0 46.2 162.0 46.2 123.0 80.0 133.0 80.2
Guinea-Bissau 177.0 40.9 172.0 41.6 154.0 52.9 153.0 52.9 178.0 60.0 176.0 63.9
Lesotho 112.0 57.6 100.0 60.4 39.0 91.6 39.0 91.6 110.0 82.9 117.0 83.0
Liberia 174.0 41.5 174.0 41.4 185.0 17.8 185.0 17.6 33.0 92.5 37.0 92.5
Madagascar 169.0 44.2 167.0 45.1 134.0 59.4 129.0 61.0 126.0 79.6 113.0 83.5
Malawi 141.0 51.1 133.0 54.4 115.0 63.3 118.0 63.3 160.0 69.7 150.0 76.7
Mali 143.0 50.7 141.0 53.0 88.0 70.8 89.0 70.8 172.0 66.1 108.0 84.1
Mauritania 165.0 45.6 160.0 47.2 139.0 57.8 137.0 58.8 73.0 86.9 80.0 86.9
Mozambique 134.0 53.8 137.0 53.8 105.0 66.3 106.0 66.3 121.0 80.2 134.0 79.9
Niger 158.0 47.1 150.0 49.6 148.0 55.7 132.0 60.5 132.0 77.6 88.0 86.2
Rwanda 59.0 68.6 56.0 69.8 131.0 59.9 87.0 71.2 109.0 82.9 76.0 87.2
Sao Tome and Principe
160.0 46.7 162.0 46.8 119.0 62.8 122.0 62.8 36.0 92.4 35.0 92.6
Senegal 146.0 50.0 147.0 50.7 125.0 60.9 130.0 60.9 82.0 86.0 90.0 86.1
Sierra Leone 145.0 50.1 148.0 50.2 169.0 42.1 169.0 42.1 99.0 84.7 87.0 86.5
Somalia 190.0 20.2 190.0 20.3 156.0 51.6 156.0 51.6 183.0 48.3 184.0 48.7
South Sudan 187.0 33.5 186.0 33.5 177.0 26.2 177.0 26.2 180.0 54.0 181.0 54.0
Sudan 164.0 45.8 168.0 44.8 184.0 19.2 184.0 19.2 148.0 75.1 156.0 73.8
Tanzania, United Republic of
144.0 50.6 132.0 54.5 180.0 20.2 180.0 20.2 127.0 78.9 135.0 79.1
Togo 154.0 47.4 154.0 48.6 127.0 60.4 117.0 63.7 130.0 78.4 123.0 81.7
Uganda 116.0 57.1 115.0 57.8 141.0 57.8 136.0 58.9 162.0 69.3 165.0 71.3
Zambia 94.0 60.8 98.0 60.5 161.0 47.0 161.0 47.0 96.0 84.9 105.0 85.0
Average, Africa 155.
0 46.0
154.0
46.7 144.4 48.3 142.
6 48.9
130.6
72.1 126.
0 74.4
Asia and the Pacific
Afghanistan 182.0 38.4 183.0 38.1 176.0 28.9 175.0 30.6 38.0 92.2 42.0 92.1
Bangladesh 178.0 40.7 176.0 40.8 173.0 34.9 173.0 34.9 115.0 81.7 122.0 81.7
Bhutan 71.0 65.4 73.0 65.4 26.0 94.3 26.0 94.3 84.0 85.6 94.0 85.6
Cambodia 128.0 54.5 131.0 54.8 101.0 67.3 102.0 67.3 179.0 58.9 180.0 54.9
Kiribati 151.0 48.5 152.0 49.2 120.0 62.1 124.0 62.1 141.0 76.5 140.0 78.2
Lao PDR 136.0 52.4 139.0 53.3 116.0 63.0 120.0 63.0 168.0 67.4 160.0 72.4
Myanmar 171.0 44.0 170.0 44.6 149.0 55.1 159.0 47.4 170.0 66.6 146.0 77.1
Nepal 100.0 59.4 107.0 58.9 72.0 79.3 69.0 79.8 105.0 83.5 109.0 83.8
Solomon Islands
105.0 58.8 104.0 59.2 152.0 53.5 151.0 53.5 91.0 85.1 97.0 85.5
Timor-Leste 173.0 42.0 175.0 40.9 92.0 69.9 94.0 69.9 104.0 83.6 145.0 77.1
Vanuatu 88.0 61.5 83.0 63.7 145.0 56.3 145.0 56.3 147.0 75.5 126.0 81.2
Yemen 179.0 39.9 179.0 39.6 189.0 0.0 189.0 0.0 154.0 73.4 161.0 71.6
Average, Asia and the Pacific
138.5
50.5 139.
3 50.7 125.9 55.4
127.3
54.9 124.
7 77.5
126.8
78.4
The Americas
Haiti 180.0 38.5 181.0 38.7 77.0 76.1 76.0 76.7 189.0 33.5 188.0 33.6
Average, All LDCs
151.3
47.0 150.
9 47.6 138.3 50.7
137.3
51.0 130.
3 72.7
127.6
74.5
Source: Doing business (http://www.doingbusiness.org/).