Embed Size (px)
Citation preview
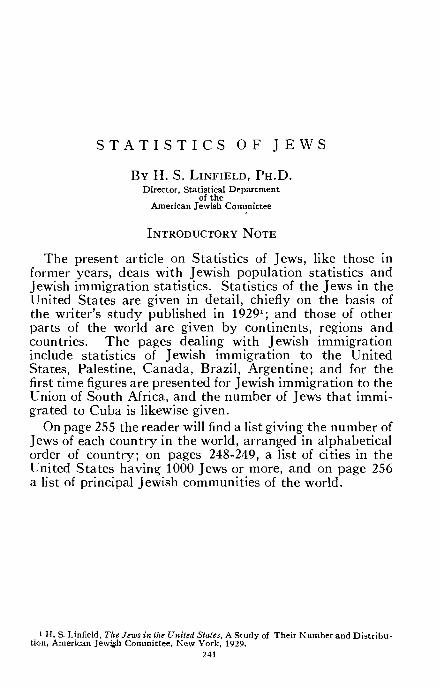
S T A T I S T I C S O F J E W S
BY H. S. LINFIELD, P H . D .Director, Statistical Department
of theAmerican Jewish Committee
INTRODUCTORY NOTE
The present article on Statistics of Jews, like those informer years, deals with Jewish population statistics andJewish immigration statistics. Statistics of the Jews in theUnited States are given in detail, chiefly on the basis ofthe writer's study published in 19291; and those of otherparts of the world are given by continents, regions andcountries. The pages dealing with Jewish immigrationinclude statistics of Jewish immigration to the UnitedStates, Palestine, Canada, Brazil, Argentine; and for thefirst time figures are presented for Jewish immigration to theUnion of South Africa, and the number of Jews that immi-grated to Cuba is likewise given.
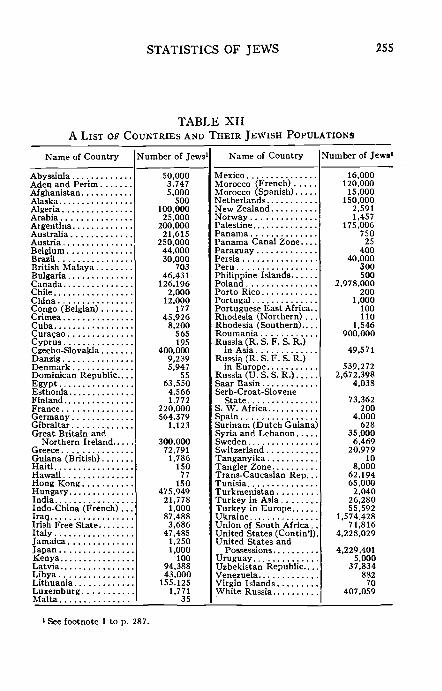
On page 255 the reader will find a list giving the number ofJews of each country in the world, arranged in alphabeticalorder of country; on pages 248-249, a list of cities in theUnited States having 1000 Jews or more, and on page 256a list of principal Jewish communities of the world.
1 H. S. Linfield, The Jews in the United Stales, A Study of Their Number and Distribu-tion, American Jewish Committee, New York, 1929.
241
242 AMERICAN JEWISH YEAR BOOK
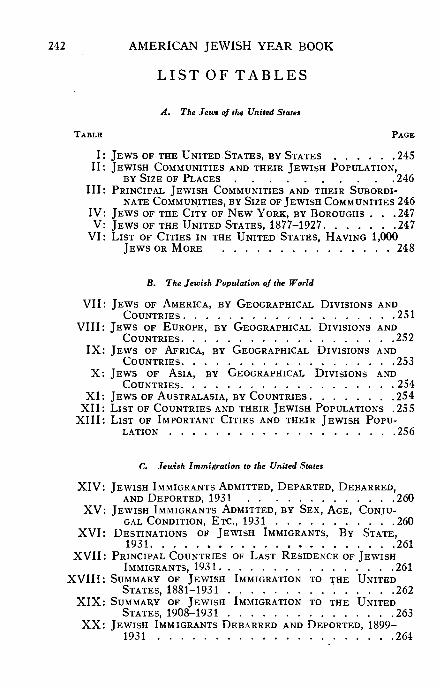
LIST OF TABLES
A. The Jews of the United States
TABLE PAGE
I: JEWS OF THE UNITED STATES, BY STATES 245II : JEWISH COMMUNITIES AND THEIR JEWISH POPULATION,
BY SIZE OF PLACES 246III : PRINCIPAL JEWISH COMMUNITIES AND THEIR SUBORDI-
NATE COMMUNITIES, BY SIZE OF JEWISH COMMUNITIES 246IV: JEWS OF THE CITY OF NEW YORK, BY BOROUGHS . . .247V: JEWS OF THE UNITED STATES, 1877-1927 247
VI: LIST OF CITIES IN THE UNITED STATES, HAVING 1,000JEWS OR MORE 248
B. The Jewish Population of the World
VII: JEWS OF AMERICA, BY GEOGRAPHICAL DIVISIONS ANDCOUNTRIES 251
VIII: JEWS OF EUROPE, BY GEOGRAPHICAL DIVISIONS ANDCOUNTRIES 252
IX: JEWS OF AFRICA, BY GEOGRAPHICAL DIVISIONS ANDCOUNTRIES 253
X: JEWS OF ASIA, BY GEOGRAPHICAL DIVISIONS ANDCOUNTRIES 254
XI: JEWS OF AUSTRALASIA, BY COUNTRIES 254XII : LIST OF COUNTRIES AND THEIR JEWISH POPULATIONS .255
XIII : LIST OF IMPORTANT CITIES AND THEIR JEWISH POPU-LATION 256
C. Jewish Immigration to the United States
XIV: JEWISH IMMIGRANTS ADMITTED, DEPARTED, DEBARRED,AND DEPORTED, 1931 260
XV: JEWISH IMMIGRANTS ADMITTED, BY SEX, AGE, CONJU-GAL CONDITION, ETC., 1931 260
XVI: DESTINATIONS OF JEWISH IMMIGRANTS, BY STATE,1931 261
XVII: PRINCIPAL COUNTRIES OF LAST RESIDENCE OF JEWISHIMMIGRANTS, 1931 261
XVIII: SUMMARY OF JEWISH IMMIGRATION TO THE UNITEDSTATES, 1881-1931 262
XIX: SUMMARY OF JEWISH IMMIGRATION TO THE UNITEDSTATES, 1908-1931 263
XX: JEWISH IMMIGRANTS DEBARRED AND DEPORTED, 1899—1931 264
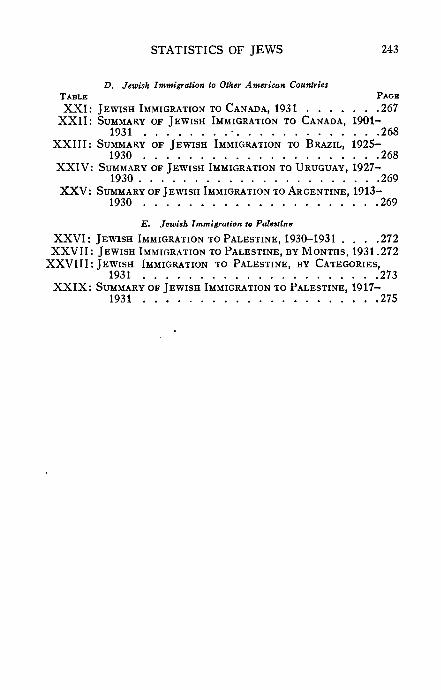
STATISTICS OF JEWS 243
D. Jewish Immigration to Other American CountriesTABLE PAGB
XXI: JEWISH IMMIGRATION TO CANADA, 1931 267XXII: SUMMARY OF JEWISH IMMIGRATION TO CANADA, 1901-
1931 268XXIII : SUMMARY OF JEWISH IMMIGRATION TO BRAZIL, 1925—
1930 268XXIV: SUMMARY OF JEWISH IMMIGRATION TO URUGUAY, 1927—
1930 269XXV: SUMMARY OF JEWISH IMMIGRATION TO ARGENTINE, 1913-
1930 269E. Jewish Immigration to Palestine
XXVI: JEWISH IMMIGRATION TO PALESTINE, 1930-1931 . . . .272XXVII: JEWISH IMMIGRATION TO PALESTINE, BY MONTHS, 1931.272
XXVIII: JEWISH IMMIGRATION TO PALESTINE, BY CATEGORIES,1931 273
XXIX: SUMMARY OF JEWISH IMMIGRATION TO PALESTINE, 1917—1931 275
244 AMERICAN JEWISH YEAR BOOK
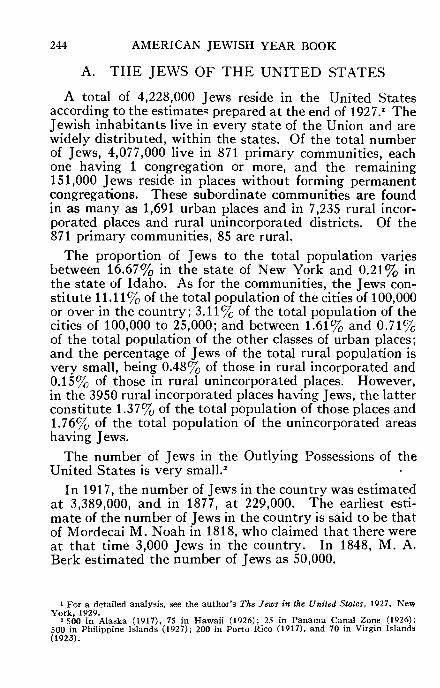
A. THE JEWS OF THE UNITED STATES
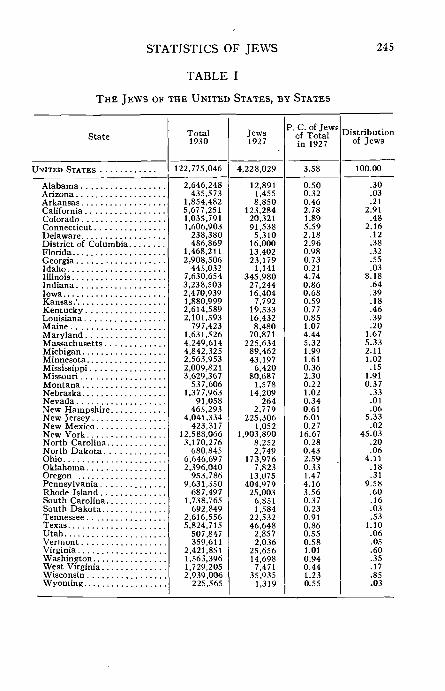
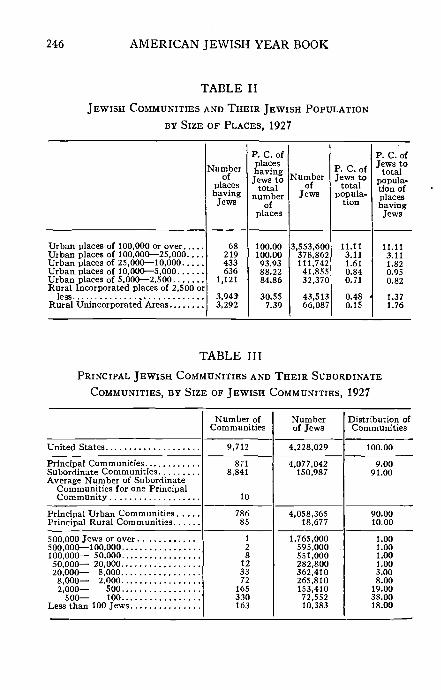
A total of 4,228,000 Jews reside in the United Statesaccording to the estimates prepared at the end of 1927.1 TheJewish inhabitants live in every state of the Union and arewidely distributed, within the states. Of the total numberof Jews, 4,077,000 live in 871 primary communities, eachone having 1 congregation or more, and the remaining151,000 Jews reside in places without forming permanentcongregations. These subordinate communities are foundin as many as 1,691 urban places and in 7,235 rural incor-porated places and rural unincorporated districts. Of the871 primary communities, 85 are rural.
The proportion of Jews to the total population variesbetween 16.67% in the state of New York and 0.21% inthe state of Idaho. As for the communities, the Jews con-stitute 11.11% of the total population of the cities of 100,000or over in the country; 3.11% of the total population of thecities of 100,000 to 25,000; and between 1.61% and 0.71%of the total population of the other classes of urban places;and the percentage of Jews of the total rural population isvery small, being 0.48% of those in rural incorporated and0.15% of those in rural unincorporated places. However,in the 3950 rural incorporated places having Jews, the latterconstitute 1.37% of the total population of those places and1.76% of the total population of the unincorporated areashaving Jews.
The number of Jews in the Outlying Possessions of theUnited States is very small.2
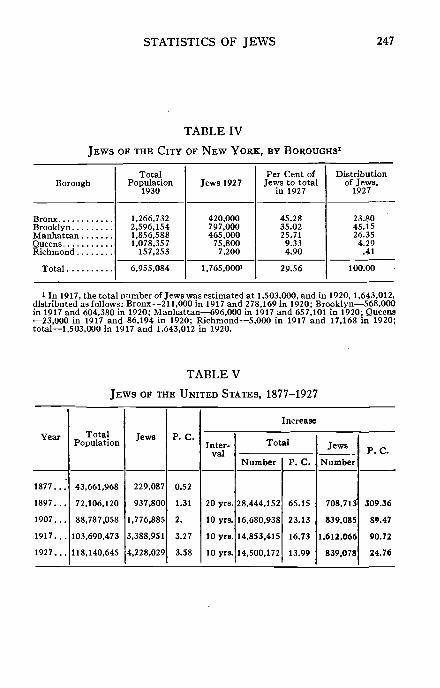
In 1917, the number of Jews in the country was estimatedat 3,389,000, and in 1877, at 229,000. The earliest esti-mate of the number of Jews in the country is said to be thatof Mordecai M. Noah in 1818, who claimed that there wereat that time 3,000 Jews in the country. In 1848, M. A.Berk estimated the number of Jews as 50,000.
i For a detailed analysis, see the author's The Jews in the United Stales, 1927, NewYork. 1929.1 500 in Alaska (1917), 75 in Hawaii (1926); 25 in Panama Canal Zone (1926);500 in Philippine Islands (1927); 200 in Porto Rico (1917), and 70 in Virgin Islands(1923).
STATISTICS OF JEWS
TABLE I
THE JEWS OF THE UNITED STATES, BY STATES
245
State
UNITED STATES
Florida
Idaho
New YorkNorth CarolinaNorth DakotaOhio. . .OklahomaOregon. ..
Rhode IslandSouth CarolinaSouth DakotaTennessee. .TexasUtahVermont. . .Virginia . . . .
West Virginia
Total1930
122,775,046
2,646,248435,573
1,854,4825,677,2511,035,7911,606,903
238,380486,869
1,468,2112,908,506
445,0327,630,6543,238,5032,470,9391,880,9992,614,5892,101,593
797,4231,631,5264,249,6144,842,3252,563,9532,009,8213,629,367
537,6061,377,963
91,058465,293
4,041,334423,317
12,588,0663,170 276
680,8456,646,6972,396,040
953,7869,631,350
687,4971,738,765
692.8492,616,5565,824,715
507,847359,611
2,421,8511,563,3961,729,2052,939 006
225,565
Jews1927
4,228,029
12,8911 4558 850
123 28420,32191 538
5,31016,00013 40223 179
1 141345,980
27 24416,404
7,79219,53316,4328 480
70,871225 634
89 46243,197
6,42080,687
1,57814 209
2642,779
225,3061,052
1,903,8908 2522,749
173 9767 823
13 075404 979
25,0036 8511 584
22 53246 648
2 8572 036
25 65614,6987.471
35 9151,319
P. C. of Jewsof Totalin 1927
3.58
0.500.320.462.781.895.592.182.960.980.730.214.740.860.680.590.770.851.074.445.321.991.610.362.300.221.020.340.616.010.27
16.670 280.432.590.331.474.163.560.370.230.910.860.550.581.010.940.441 230.55
Distributionof Jews
100.00
.30
.03
.212.91
.482.16
.12
.38
.32
.55
.038.18
.64
.39
.18
.46
.39
.201.675.332.111.02
.151.910.37
.33
.01
.065.33
.0245.03
.20
.064.11
.18
.319.58
.60.16.03.53
1.10.06.05.60.35.17.85.03
246 AMERICAN JEWISH YEAR BOOK
TABLE II
JEWISH COMMUNITIES AND THEIR JEWISH POPULATION
BY SIZE OF PLACES, 1927
Urban places of 100,000 or overUrban places of 100,000—25,000Urban places of 25,000—10,000Urban places of 10,000—5,000Urban places of 5,000—2,500Rural Incorporated places of 2,500 or
lessRural Unincorporated Areas...
Numberof
placeshavingJews
68219433636
1,121
3,943-3,292
P. C. ofplaces
totalnumber
ofplaces
100.00100.0093.9388.2284.86
30.557.39
Numberof
Jews
3,553,600378,862111,74241,85532,370
43,51366,087
P. C. ofJews to
totalpopula-
tion
11.113.111.610.840.71
0.48 •0.15
P. C. ofJews to
totalpopula-tion ofplaceshavingJews
11.113.111.820.950.82
1.371.76
TABLE III
PRINCIPAL JEWISH COMMUNITIES AND THEIR SUBORDINATE
COMMUNITIES, BY SIZE OF JEWISH COMMUNITIES, 1927
United States
Principal CommunitiesSubordinate CommunitiesAverage Number of Subordinate
Communities for one PrincipalCommunity
Principal Urban CommunitiesPrincipal Rural Communities
500,000 Jews or over500,000—100,000100,000— 50,00050,000— 20,00020,000— 8,0008,000— 2,0002,000— 500
500— 100Less than 100 Jews
Number ofCommunities
9,712
8718,841
10
78685
128
123372
165330163
Numberof Jews
4,228,029
4,077,042150,987
4,058,36518,677
1,765,000595,000551,000282,800362,410265,810153,41072,55210,383
Distribution ofCommunities
100.00
9.0091.00
90.0010.00
1.001.001.001.003.008.00
19.0038.0018.00
STATISTICS OF JEWS 247
TABLE IV
JEWS OF THE CITY OF NEW YORK, BY BOROUGHS1
Borough
BronxBrooklynManhattanQueensRichmond
Total
TotalPopulation
1930
1,266,7322,596,1541,856,5881,078,357
157,253
6,955,084
Jews 1927
420,000797,000465,000
75,8007,200
1,765,000'
Per Cent ofJews to total
in 1927
45.2835.0225.71
9.334.90
29.56
Distributionof Jews,
1927
23.8045.1526.354.29
.41
100.00
1 In 1917, the total number of Jews was estimated at 1,503,000, and in 1920, 1,643,012,distributed as follows: Bronx—211,000 in 1917 and 278,169 in 1920; Brooklyn—568,000in 1917 and 604,380 in 1920; Manhattan—696,000 in 1917 and 657,101 in 1920; Queens—23,000 in 1917 and 86,194 in 1920; Richmond—5,000 in 1917 and 17,168 in 1920;total—1,503,000 in 1917 and 1.643,012 in 1920.
TABLE V
JEWS OF THE UNITED STATES, 1877-1927
Year
1877..."
1897. . .
1907. . .
1917. . .
1927. . .
TotalPopulation
43,661,968
72,106,120
88,787.058
103,690,473
118,140,645
Jews
229,087
937.800
1,776,885
3,388,951
4,228,029
P. C.
0.52
1.31
2.
3.27
3.58
Increase
Inter-
20 yrs.
10 yrs.
10 yrs.
10 yrs.
Total
Number
28,444,152
16,680,938
14,853,415
14,500,172
P. C.
65.15
23.13
16.73
13.99
Jews
Number
708,713
839,085
1,612,066
839,078
P. C.
309.36
89.47
VO.72
24.76
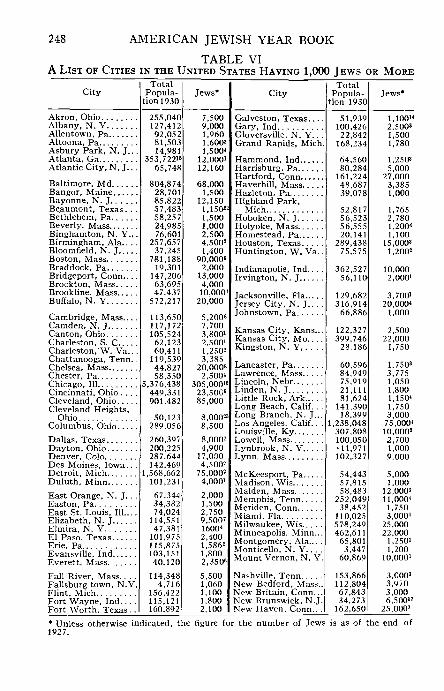
248 AMERICAN JEWISH YEAR BOOK
TABLE VIA LIST OF CITIES IN THE UNITED STATES HAVING 1,000 JEWS OR MORE
City
Akron, OhioAlbany, N . YAllentown, PaAltoona, PaAsbury Park, N. J...Atlanta, GaAtlantic City, N. J.. .
Baltimore, MdBangor, MaineBayonne, N. JBeaumont, Texas. . .Bethlehem, PaBeverly, MassBinghamton, N. Y...Birmingham, Ala.. . .Bloomfield, N. JBoston, MassBraddock, PaBridgeport, Conn....Brockton, MassBrookline, MassBuffalo, N. Y
Cambridge, MassCamden, N. J.Canton, OhioCharleston, S. CCharleston, W. Va...Chattanooga, Tenn..Chelsea, Mass.Chester, Pa.. .Chicago, 111Cincinnati, O h i o . . . .Cleveland, OhioCleveland Heiehts
OhioColumbus, Ohio
Dallas, TexasDayton, OhioDenver, ColoDes Moines, Iowa...Detroit, MichDuluth, MinnEast Orange, N. J . . .Easton, PaEast St. Louis, 111....Elizabeth, N. JElmira, N. YEl Paso, TexasErie, PaEvansville. IndEverett, Mass
Fall River, Mass.. . .Fallsburg town, N.Y.Flint, MichFort Wayne, Ind.. . .Fort Worth. Texas . .
TotalPopula-
tion 1930
255,040127,41292,05281,50314,981
353,7221'65,748
804,87428,70185,82257,48358,25724,98576,601
257,65737,245
781,18819,301
147,20663,69547,437
572,217
113,650117,172105,52462,12360,411
119,53944,82758,350
3,376,438449,331901.482
50,123289,056
260.397200,225287,644142.469
1,568,662101,23167,34434,38274,024
114,55147,381
101,975115,875103,15140,120
114,3484,716
156,422115,121160,892
Jews'
7,5009,0001,9601,600s
1,500*12,000'12,160
68,0001,500
12,1501.15052
1,5001,0002,5004.5002
1,40090,000»
2,00013,0004,00010,000'
20,000
5,200 s
7,7003,800'2,500'1,250'3,385
20.000 s
2,500*3O5,OO0i«
23.5OC6
85,000
8.00023
8,500
8.OOO2
4,90017,0004.5002
75,000 '4.0001
2,0001,5002,7509,500 '1600*2,4001.5862
1,8002,350"
5,5001,0601,1001,8002,100
City
Galveston, TexasGary, IndGloversville, N. Y. . .Grand Rapids, Mich.
Hammond, IndHarrisburg, PaHartford, ConnHaverhill, MassHazleton, PaHighland Park,
Mich.Hoboken, N. JHolyoke, MassHomestead, PaHouston, TexasHuntington, W. Va..
Indianapolis, Ind . . . .Irvington, N. J
Jacksonville, FlaJersey City, N. J.. . .Johnstown. Pa
Kansas City, Kans...Kansas City, Mo.. . .Kingston, N . Y
Lancaster, PaLawrence, MassLincoln, NebrLinden, N. JLittle Rock, ArkLong Beach, Calif.. .Long Branch, N. J...Los Angeles, Calif.. .Louisville, KyLowell, MassLynbrook, N. YLynn, Mass
McKeesport, PaMadison, WisMaiden, MassMemphis, TennMeriden, ConnMiami, FlaMilwaukee, WisMinneapolis, Minn...Montgomery, Ala... .Monticello, N. YMount Vernon, N. Y.
Nashville, TennNew Bedford. Mass..New Britain, Conn...New Brunswick, N.J.New Haven. Conn...
TotalPopula-
tion 1930
51,939100,42622,842
168,234
64,56080,284
161,22448,68739,078
52,81756,52356,55520,141
289,43875,575
362,52756,110
129,682316,91466,886
122,327399,746
28.186
60,59684,94975,91921,11181,624
141,39018,399
1,238,048307,808100,050•11,971102,327
54,44357,81558,483
252,04938,452
110,025578,249462,611
65,8013,447
60,869
153,866112,80467,84334,273
162,650
Jews*
1,100'2.500»1,5001,780
1,250s
5,00027,000
3,3851,000
1,7652,780l,200<1,100
15,000s
l,200 !
10,0002,000'
3,700'20,000*
1,000
2,50022,000
1,750
1,750s
3,7751,0501,8001,150*1,7503,000
75,OOOJ
10,000'2,7001,0009.000
5,0001,000
12,000311,000*1,7503,000*
25,00022,000
1,250'1,200
10,000'
3.0O03
3,9703,0006,500"
25,OOO3
* Unless otherwise indicated, the figure for the number of Jews is as of the end of1927.
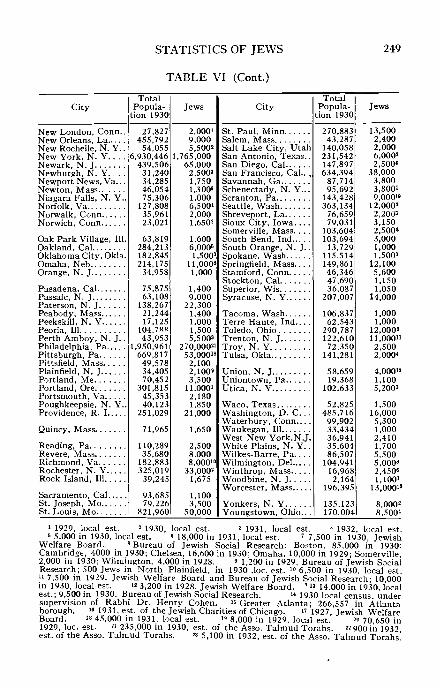
STATISTICS OF JEWS 249
TABLE VI (Cont.)
City
New London, Conn..New Orleans, LaNewRochelle, N. Y..New York, N. YNewark, N. JNewburgh, N. Y. . . .Newport News, Va. . .Newton, MassNiagara Falls, N. Y..Norfolk, VaNorwalk, ConnNorwich, Conn
Oak Park Village, 111.Oakland, CalOklahoma City, Okla.Dmaha, NebOrange, N. J
Pasadena, CalPassaic, N. JPaterson, N. JPeabody, MassPeekskill, N. YPeoria, 111Perth Amboy, N. J . .Philadelphia, PaPittsburgh, PaPittsfield, MassPlainfield, N. JPortland, MePortland, OrePortsmouth, VaPoughkeepsie, N. Y..Providence, R. I
Quincy, Mass
Reading, PaRevere, MassRichmond, VaRochester, N. YRock Island, 111
Sacramento, CalSt. Joseph, MoSt. Louis, Mo
TotalPopula-
tion 1930
27,827455,792
54,0556,930,446
439,50631,24034,28546,05475,306
127,80835,96123,021
63,819284,213182,845214,17534,958
75,87563,108
138,26721,24417,125
104.78S43,953
1,950,961669,817
49,57834,40570,452
301,81545,35340,123
251,029
71,965
110,28935,680
182,883325,019
39,245
93,68579,226
821,960
Jews
2.0004
9,0005.5OO2
1,765,00065,000
2,50031,7501,300s
1,0006,500'2,0001.6502
1,6006,000s
1.5OO3
11,000s
1,000
1,4009.000
22,3001,4001,0001,5005.5003
270,000"53.00018
2,1002,100»3,500
11.0001
2,1801,850
21,000
1,650
2,5008,0008,000'°
33,000'1,675
1,1003,500
50,000
City
St. Paul, MinnSalem, MassSalt Lake City, UtahSan Antonio, Texas..San Diego, CalSan Francisco, Cal...Savannah, GaSchenectady, N. Y...Scranton, PaSeattle, WashShreveport, LaSioux City, Iowa....Somerville, Mass.. . .South Bend, IndSouth Orange, N. J..Spokane, WashSpringfield, Mass....Stamford, ConnStockton, CalSuperior, WisSyracuse, N. Y
Tacoma, WashTerre Haute, IndToledo, OhioTrenton, N. JTroy, N. YTulsa, Okla
Union, N. JUniontown, PaUtica, N. Y
Waco, TexasWashington, D. C...Waterbury, Conn....Waukegan, 111West New York.N.J.White Plains, N. Y..Wilkes-Barre, PaWilmington, DelWinthrop, MassWoodbine, N. JWorcester, Mass
Yonkers, N. YYoungstown, Ohio...
TotalPopula-
tion 1930
270,88343,287
140,058231,542147,897634,394
87,71495,692
143,428363,134
76,65979,031
103.604103,694
13,729115,514149,86146,34647,69036,087
207,007
106,83762,543
290,787122,610
72,350141,281
58,65919,368
102,633
52,825485,71699,90233,43436,94135,60486,507
104,94116,9682,164
196,395
135,123170,004
Jews
13,5002,4002,0006,000'2,500'
38,0003,8003,800'9,000"
12,000'2,20033,1502,500s
3,0001,0001,5003
12,1005,6001,1501,050
14,000
1,0001,000
12,000'11,000"2,5002,000<
4,000"1,1005.2003
1,50016,0005,3001,0002,4101,7005,5005,000«2,450s
1,100'13,000"
8,000'8,500'
' 1929, local est. * 1930, local est. ' 1931, local est. * 1932, local est.« 5,000 in 1930, local est. • 18,000 in 1931, local est. ' 7.500 in 1930, Jewish
Welfare Board. 8 Bureau of Jewish Social Research: Boston, 85,000 in 1930!Cambridge, 4000 in 1930; Chelsea, 16,600 in 1930; Omaha, 10,000 in 1929; Somerville,2,000 in 1930; Wilmington, 4,000 in 1928. » 1,200 in 1929, Bureau of Jewish SocialResearch; 500 Jews in North Plainfield, in 1930 .loc. est. 10 6,500 in 1930, local est." 7,500 in 1929, Jewish Welfare Board and Bureau of Jewish Social Research; 10,000in 1930, local est. « 3,200 in 1928, Jewish Welfare Board. ' " 14.000 in 1930, localest.; 9,500 in 1930. Bureau of Jewish Social Research. » 1930 local census, undersupervision of Rabbi Dr. Henry Cohen. » Greater Atlanta; 266,557 in Atlantaborough. "> 1931, est. of the Jewish Charities of Chicago. " 1927, Jewish WelfareBoard. '» 45,000 in 1931, local est. '» 8,000 in 1929, local est. !» 70 650 in1929, loc. est. !I 235,000 in 1930, est. of the Asso. Talmud Torahs. » 900 in 1932est. of the Asso. Talmud Torahs. a 5,100 in 1932, est. of the Asso. Talmud Torahs.
250 AMERICAN JEWISH YEAR BOOK
B. JEWISH POPULATION OF THE WORLD
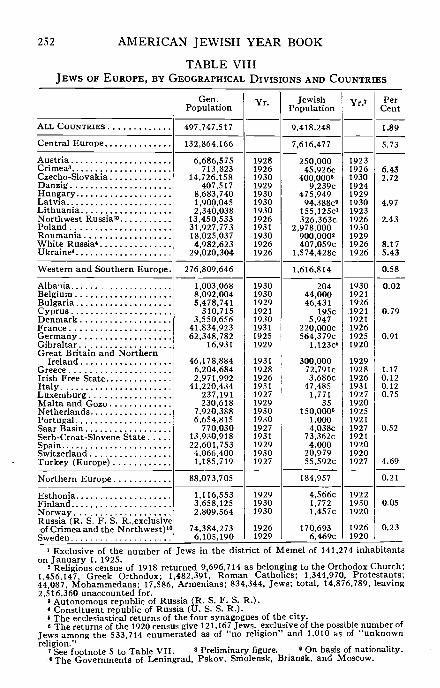
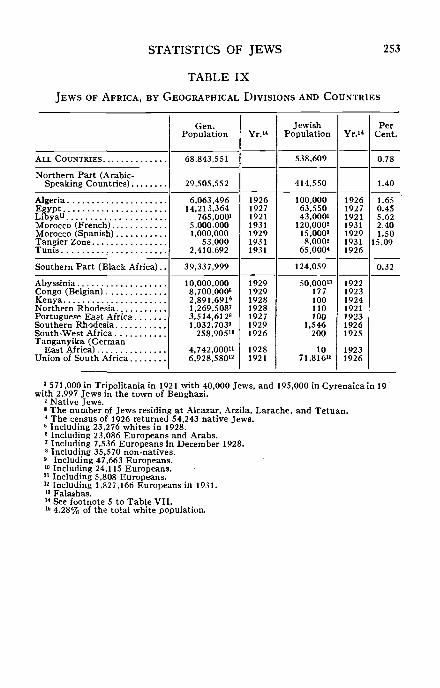
The total number of Jews in the world is here estimatedat 15,200,000. Of that number, 7,600,000 reside in a groupof adjacent countries located in the center of the continentof Europe, which region may be designated as the "Jewish"Central Europe. This region includes Poland, Danzig,Lithuania, Latvia; Austria, Czecho-Slovakia, Hungary;Roumania, Russia (Crimea, Ukraine, and White Russia).In this region the Jews constitute nearly 6% of the total pop-ulation. Over 4,380,000 live in North America and the WestIndies, where the Jews constitute nearly 3% of the totalpopulation. 325,000 Jews live in Palestine and the surround-ing countries of Arabia, Iraq, and Syria, constituting over2% of the total population of that region. Over 400,000Jews reside in the Arab-speaking countries of North Africa,namely, Tangiers, Morocco, Algeria, Tunis, Libya, andEgypt; in this region the Jews form nearly 1.5% of the totalpopulation. In addition to these regions, the proportionof Jews to the total population is considerable in Nether-lands (2%) and in the southeastern portion of Europe,namely, Greece and European Turkey (1.74%); in thesouthernmost country of the continent of Africa, namely,the Union of South Africa, where the Jews constitute nearly1% of the total population and over 4% of the white popu-lation in that country; and in the southernmost country ofthe American continent, namely, Argentine, where theJews constitute nearly 2% of the total.
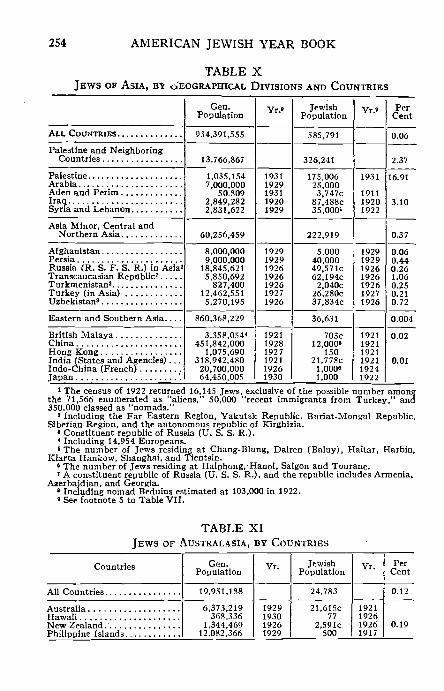
In all other regions the Jews constitute less than 1% ofthe total population. Of the latter, over 1,500,000 residein western and southern Europe; nearly 200,000, in northernand eastern Europe (Russia and the Baltic countries); andnearly 25,000 reside in Australia and New Zealand, constitu-ting a little over 0.5% among the European peoples in Eur-ope and nearly 0.33% among the white countries of Australia.Nearly 225,000 Jews reside among the peoples of Asia Minor,and central and northern Asia; and only about 125,000Jews reside among the peoples of eastern and southern Asia
STATISTICS OF JEWS 251
(Japan, China, India and Indo-China, in Central Africa,Oceania, and Central and Southern America, exclusive ofthe Argentine Republic; and the proportion of Jews to non-Jews in those countries is very small. There are 50,000Falashas, it is claimed, in Abyssinia.
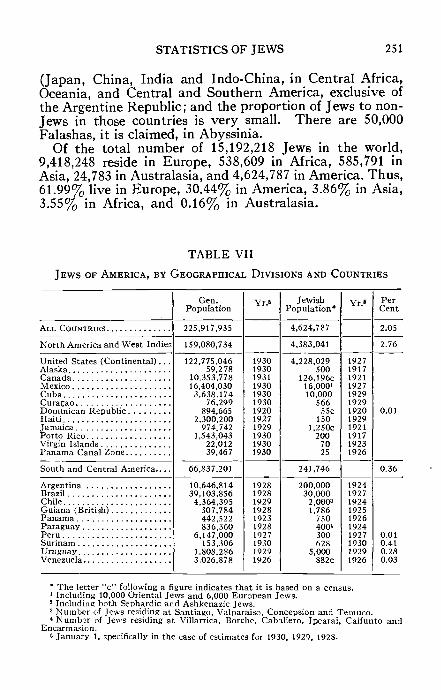
Of the total number of 15,192,218 Jew6 in the world,9,418,248 reside in Europe, 538,609 in Africa, 585,791 inAsia, 24,783 in Australasia, and 4,624,787 in America. Thus,61.99% live in Europe, 30.44% in America, 3.86% in Asia,3.55% in Africa, and 0.16% in Australasia.
TABLE VII
JEWS OF AMERICA, BY GEOGRAPHICAL DIVISIONS AND COUNTRIES
ALL COUNTRIES
North America and West Indies
United States (Continental) . . .
Cuba
Haiti
Panama Canal Zone
South and Central America.. . .
BrazilChile
Peru
Gen.Population
225,917,935
159,080,734
122,775,04659,278
10,353,77816,404,0303,638,174
76,299894,665
2,300,200974,742
1,543,04322,01239,467
66,837,201
10,646,81439,103,856
4,364,395307,784442,522836,360
6 147 000153 306
1,808,2863,026,878
Yr.«
193019301931193019301930192019271929193019301930
1928192819291928192319281927193019291926
JewishPopulation*
4,624,787
4,383,041
4,228,029500
126,196c16,000110,000
56655c
1501,250c
2007025
241,746
200,00030,000
2,000=1,786
750400<300628
5,000882c
Yr.«
192719171921192719291929192019291921191719231926
1924192719241925192619241927193019291926
PerCent
2.05
2.76
0.01
0.36
0.010.410.280.03
* The letter "c" following a figure indicates that it is based on a census.1 Including 10,000 Oriental Jews and 6,000 European Jews.2 Including both Sephardic and Ashkenazic Jews.3 Number of Jews residing at Santiago, Valparaiso, Concepsion and Temuco.* Number of Jews residing at Villarrica, Borche, Cabaliero, Ipcarai, Caifunto and
Encarmasion.6 January 1, specifically in the case of estimates for 1930, 1929, 1928.
252 AMERICAN JEWISH YEAR BOOK
TABLE VIIIJEWS OF EUROPE, BY GEOGRAPHICAL DIVISIONS AND COUNTRIES
ALL COUNTRIES
Central Europe
AustriaCrimea3
Czechoslovakia
LithuaniaNorthwest Russia1*PolandRoumaniaWhite Russia4
Ukraine4
Western and Southern Europe.
AlbaniaBelgium
FranceGermany
Great Britain and Northern
Irish Free StateItaly
Serb-Croat-Slovene State
Turkey (Europe)
Northern Europe
Esthonia
Russia (R. S. F. S. R.,exclusiveof Crimea and the Northwest)10
Sweden
Gen.Population
497,747,517
132,864,166
6.686,575713,823
14,726,158407,517
8,683,7401,900,0452,340,038
13,450 53331,927,77318,025,0374,982,623
29,020,304
276,809,646
1,003,0688,092,0045,478,741
310,7153,550,656
41,834,92362,348,782
16,931
46,178,8846,204,6842,971,992
41,220,434237,191230,618
7,920,3886,654,815
770,03013,930,91822,601,7534,066,4001,185,719
88,073,705
1,116,5533,658,1252,809,564
74,384,2736,105,190
Yr.
192819261930192919301930193019261931193019261926
19301930192919211930193119251929
1931192819261931192719291930193019271931192919301927
192919301930
19261929
JewishPopulation
9,418,248
7,616,477
250,00045,926c
400,000'9,239c
475,94994,388c8
155 125c1
326 363c2 978 000
900 000 !
407,059c1,574,428c
1,616,814
20444,00046,431
195c5,947
220,000c564,379c
1,123c1
300,00072,791c3,686c
47,4851,771
35150.000"
1.0004,038c
73,362c4,000
20,97955,592c
184,957
4,566c1,7721,457c
170,6936,469c
Yr.'
192319261930192419291930192319261930192919261926
19301921192619211921192619251920
1929192819261931192719201925192119271921192019201927
192219301920
19261920
PerCent
1.89
5.73
6.432.72
4.97
2 43
8.175.43
0.58
0.02
0.79
0.91
1.170.120.120.75
0.52
4.69
0.21
0.05
0.23
1 Exclusive of the number of Jews in the district of Memel of 141,274 inhabitantson January 1, 1925.
2 Religious census of 1918 returned 9,696,714 as belonging to the Orthodox Church;1,456,147, Greek Orthodox; 1,482,391, Roman Catholics; 1,344,970, Protestants;44,087, Mohammedans; 17,586, Armenians; 834,344, Jews; total, 14,876,789, leaving2,516,360 unaccounted for.
1 Autonomous republic of Russia (R. S. F. S. R.).1 Constituent republic of Russia (U. S. S. R.).• The ecclesiastical returns of the four synagogues of the city.• The returns of the 1920 census give 121,167 Jews, exclusive of the possible number of
Jews among the 533,714 enumerated as of "no religion" and 1,010 as of "unknownr e J See footnote 5 to Table VII. • Preliminary figure. • On basis of nationality.
10The Governments of Leningrad, Pskov, Smolensk, Briansk, and Moscow.
STATISTICS OF JEWS 253
TABLE IX
JEWS OF AFRICA, BY GEOGRAPHICAL DIVISIONS AND COUNTRIES
Gen.Population Yr.i*
JewishPopulation
PerCent.
ALL COUNTRIES
Northern Part (Arabic-Speaking Countries)
AlgeriaEgyptLibya"Morocco (French)Morocco (Spanish)Tangier ZoneTunis ,
Southern Part (Black Africa)
AbyssiniaCongo (Belgian)KenyaNorthern RhodesiaPortuguese East AfricaSouthern RhodesiaSouth-West AfricaTanganyika (German
East Africa)Union of South Africa
68,843,551 538,609 0.78
29,505,552 414,550 1.40
6,063,49614,213,364
765,000'5,000,0001,000,000
53,0002,410,692
1926192719211931192919311931
100,00063,55043,0001120,000'15,000s
8,000'65,000*
1926192719211931192919311926
1.650.455.622.401.50
15.09
39,337,999 124,059 0.32
10,000,0008,700,000s
2,891,691s
1,269,508'3,514,612a
l,O32,7O33
258,905"
4,742,000"6,928,5801*
1929192919281928192719291926
19281921
50,000"177100no100
1,546200
1071,8161s
1922192319241921192319261925
19231926
» 571,000 in Tripolitania in 1921 with 40,000 Jews, and 195,000 in Cyrenaicain 19with 2,997 Jews in the town of Benghazi.2 Native Jews.
1 The number of Jews residing at Alcazar, Arzila, Larache, and Tetuan.* The census of 1926 returned 54,243 native Jews.'• Including 23,276 whites in 1928.' Including 23,086 Europeans and Arabs.' Including 7,536 Europeans in December 1928.' Including 35,570 non-natives.
Including 47,663 Europeans.1 Including 24,115 Europeans.1 Including 5,808 Europeans.'• Including 1,827,166 Europeans in 1931.13 Falashas.
» See footnote 5 to Table VII.6 4.28% of the total white population.
254 AMERICAN JEWISH YEAR BOOK
TABLE XJEWS OF ASIA, B* GEOGRAPHICAL DIVISIONS AND COUNTRIES
ALL COUNTRIES
Palestine and NeighboringCountries
Aden and PerimIraqSyria and Lebanon
Asia Minor, Central andNorthern Asia
PersiaRussia (R. S. F. S. R.) in Asia2
Transcaucasian Republic7
Turkmenistan3
Turkey (in Asia)Uzbekistan3
Eastern and Southern Asia. . . .
British MalayaChina
India (States and Agencies)...Indo-China (French)Japan '.
Gen.Population
934,391,555
13,766,867
1,035,1547,000,000
50.8092,849,2822,831,622
60,256,459
8,000,0009,000,000
18,845,6215,850,692
827,40012,462,5515,270,195
860,368,229
3,358,054*451,842,000
1,075,690318,942,48020,700,00064,450,005
Yr.»
19311929193119201929
1929192919261926192619271926
192119281927192119261930
JewishPopulation
585,791
326,241
175,00625,0003,747c
87,488c35.0001
222,919
5,00040,00049,571c62,194c2,040c
26,280c37,834c
36,631
703c12,0005
15021,778c
1,000s
1,000
Yr.»
1931
191119201922
1929192919261926192619271926
192119211921192119241922
PerCent
0.06
2.37
16.91
3.10
0.37
0.060.440.261.060.250.210.72
0.004
0.02
0.01
1 The census of 1922 returned 16,145 Jews, exclusive of the possible number amongthe 71,566 enumerated as "aliens," 50,000 "recent immigrants from Turkey," and350,000 classed as "nomads."
a Including the Far Eastern Region, Yakutsk Republic, Buriat-Mongul Republic,Siberian Region, and the autonomous republic of Kirghizia.
» Constituent republic of Russia (U. S. S. R.).4 Including 14,954 Europeans.•The number of Jews residing at Chang-Blung, Dairen (Baluy), Haitar, Harbin,
Kiarta Hankow, Shanghai, and Tientsin.• The number of Jews residing at Haiphong.Hanoi, Saigon and Tourane.• A constituent republic of Russia (U. S. S. R.), and the republic includes Armenia,
Azerbajdjan, and Georgia.8 Including nomad Beduins estimated at 103,000 in 1922.» See footnote S to Table VII.
TABLE XIJEWS OF AUSTRALASIA, BY COUNTRIES
Countries
Australia
Philippine Islands
Gen.Population
19,951,188
6,373,219368,336
1,344,46912,082,366
Yr.
1929193019261929
JewishPopulation
24,783
21,615c77
2,591c500
Yr.
1921192619261917
PerCent
0.12
0.19
STATISTICS OF JEWS 255
TABLE XIIA LIST OF COUNTRIES AND THEIR JEWISH POPULATIONS
Name of Country Number of Jews1] Name of Country |Number of Jews1
AbyssiniaAden and PerimAfghanistan..AlaskaAlgeriaArabiaArgentinaAustraliaAustriaBelgiumBrazilBritish MalayaBulgariaCanadaChileChinaCongo (Belgian)....CrimeaCubaCuracaoCyprusCzecho-Slovakia....DanzigDenmarkDominican Republic.EgyptEsthoniaFinlandFranceGermanyGibraltarGreat Britain and
Northern Ireland..GreeceGuiana (British)Haiti...HawaiiHong KongHungaryIndiaIndo-China (French)IraqIrish Free StateItalyJamaicaJapanKenyaLatviaLibyaLithuaniaLuxemburgMalta
50,0003,7475,000
500100,00025,000
200,00021,615
250,00044,00030,000
70346,431
126,1962,000
12,000177
45,9268,200
565195
400,0009,2395,947
5563,5504,5661,772
220,000564,379
1,123
300,00072,7911,786
15077
150475,94921,778
1,00087,4883,686
47,4851,2501,000
10094,38843,000
155,1251.771
35
MexicoMorocco (French)Morocco (Spanish)NetherlandsNew ZealandNorwayPalestinePanamaPanama Canal ZoneParaguayPersiaPeruPhilippine IslandsPolandPorto RicoPortugalPortuguese East Africa..Rhodesia (Northern) . . .Rhodesia (Southern)....RoumaniaRussia (R. S. F. S. R.)
in AsiaRussia (R. S. F. S. R.)
in EuropeRussia (U. S. S. R.)Saar BasinSerb-Croat-Slovene
StateS. W.AfricaSpainSurinam (Dutch Guiana)Syria and LebanonSwedenSwitzerlandTanganyikaTangier ZoneTrans-Caucasian Rep...TunisiaTurkmenistanTurkey in AsiaTurkey in EuropeUkraineUnion of South Africa..United States (Contin'l).United States and
PossessionsUruguayUzbekistan Republic....VenezuelaVirgin IslandsWhite Russia
16,000120,00015,000
150,0002,5911,457
175,00675025
40040,000
300500
2,978,000200
1,000100110
1,546900,000
49,571
539,2722,672,398
4,038
73,362200
4,000628
35,0006,469
20,97910
8,00062,19465,0002,040
26,28055,592
1,574,42871,816
4,228,029
4,229,4015,000
37,83488270
407,059
1 See footnote 1 to p. 287.
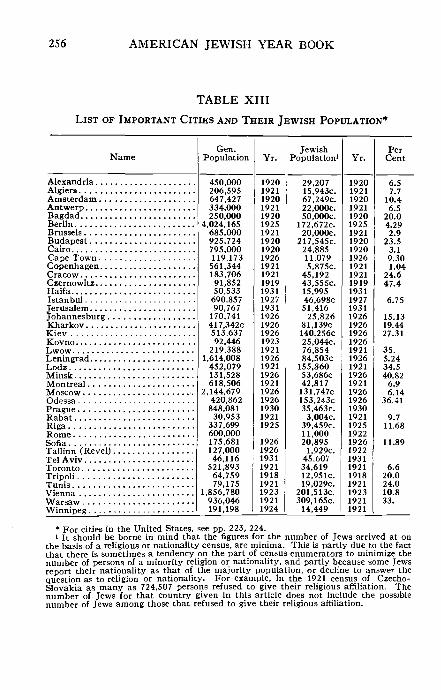
256 AMERICAN JEWISH YEAR BOOK
TABLE XIII
LIST OF IMPORTANT CITIES AND THEIR JEWISH POPULATION*
NameGen.
Population
450,000206,595647,427334,000250,000
4,024,165685,000925,724795,000119,173561,344183,70691,85250,533690,85790,767170,741417,342c513,63792,446
219,3881,614,008452,079131,528618,506
2,144,679420,862848,08130,953
337,699600,000175.681127,00046,116
521,89364,75979,175
1,856,780936,046191,198
Yr.
192019211920192119201925192119201920192619211921191919311927193119261926192619231921192619211926192119261926193019211925
192619261931192119181921192319211924
JewishPopulation1
29,20715,943c.67,249c.22,000e.50,000c.
172,672c.20,000e.
217,545c.24,88511,0795,875c.
45,19243,555c.15,99546,698c51,41625,826
81,139c140,256c25,044c.76,85484,503c155,86053,686c42,817131,747c153,243c35,463c.3,004c.
39,459c.11,00020,8951,929c.45,60734,61912,951c.19,029c.
201,513c.309,165c.14,449
Yr.
1920192119201921192019251921192019201926192119211919193119271931192619261926192619211926192119261921192619261930192119251922192619221931192119181921192319211921
PerCent
6.57.7
10.46.520.04.292.9
23.53.19.301.04
24.647.4
6.75
15.1319.4427.31
35.5.2434.540.826.96.14
36.41
9.711.68
11.89
6.620.024.010.833.
Alexandria....AlgiersAmsterdam. . .Antwerp ,BagdadBerlinBrusselsBudapestCairoCape Town . . .Copenhagen...CracowCzernowitzHaifaIstanbulJerusalemJohannesburg. .KharkovKievKovnoLwowLeningradLodzMinskMontrealMoscowOdessaPragueRabatRigaRomeSofiaTallinn (Revel).Tel AvivTorontoTripoliTunisViennaWarsawWinnipeg
• For cities in the United States, see pp. 223, 224.i It should be borne in mind that the figures for the number of Jews arrived at on
the basis of a religious or nationality census, are minima. This is partly due to the factthat there is sometimes a tendency on the part of census enumerators to minimize thenumber of persons of a minority religion or nationality, and partly because some Jewsreport their nationality as that of the majority population, or decline to answer thequestion as to religion or nationality. For example, in the 1921 census of Czecho-slovakia as many as 724,507 persons refused to give their religious affiliation. Thenumber of Jews for that country given in this article does not include the possiblenumber of Jews among those that refused to give their religious affiliation.
STATISTICS OF JEWS 257
C. JEWISH IMMIGRATION TO T H E U N I T E DSTATES
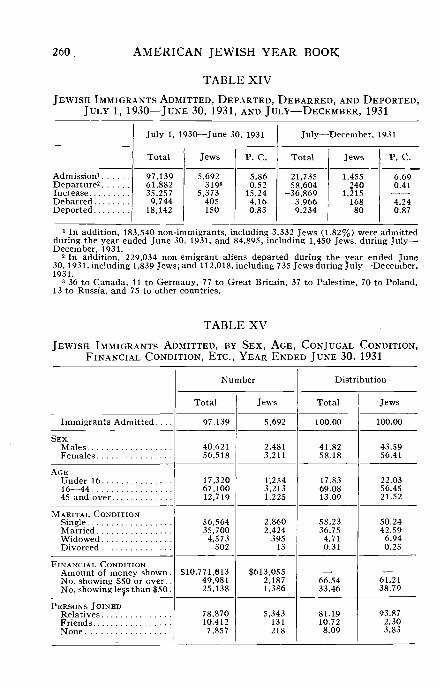
During the year ended June 30, 1931, a total of 5,692Jewish immigrants were admitted to the country, 5,834 lessthan during the past year, and 1,455 Jews were admittedduring the 6 months ended December 31, 1931. The mimberof Jews who departed was small: 319 during the year endedJune 30, 1931, and 240 during the following 6 months. Thenet increase through immigration was thus 5,373 (15.24%)of the total) during the fiscal year of 1931, and 1,215 during,the 6 months ended December 31, 1931.
A total of 150 Jews were deported during the fiscal yearof 1930-1931, and 80 during the 6 months that followed.During the same period, 405 Jews during the fiscal yearof 1930-1931 and 168 during the 6 months of July-December1931-, were debarred from entering the country. Thus,compared with the net increase of Jewish immigrants thenumber deported was 2.79% during 1931 and 6.58% duringthe following 6 months; and the ratio of the number of Jewsdebarred to those admitted was 7.12% in 1931 and 11.25%during the 6 months of July-December 1931. These highratios of Jews deported and Jews debarred, are direct resultsof the present immigration policies of the United States.The ratio of those deported and of those debarred were evenhigher for the total. Thus, compared with the net increaseof the total number of immigrants, the number deportedduring 1931 was 51.46%, and the number of debarred tothose admitted was 18.25%.
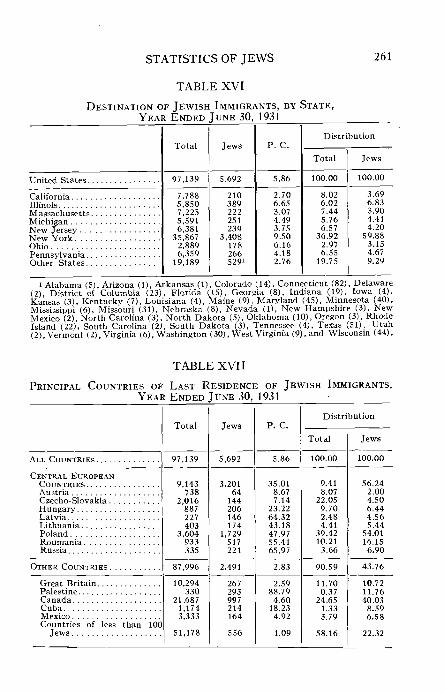
Of the 5,692 Jews admitted during the year ended June30, 1931, a total of 3,201 (56.24%) came from a groupof adjacent countries in the center of Europe1, and 2,491(43.76%) came from other countries, chiefly Canada,Cuba, Great Britain, and Palestine. In 1930, 64.95% camefrom the Jewish Central Europe1 and 35.05% from othercountries. In the case of the countries of the JewishCentral Europe, the Jewish immigrants constituted but5.86% of the total number of immigrants admitted fromthose countries, as against 36.48% during the preceding year.
1 Poland, Lithuania, Latvia. Austria, Czecho-SIovakia, Hungary, Roumania, Russia.
258 AMERICAN JEWISH YEAR BOOK
During the year ended June 30, 1931, the Jewish immi-grants admitted were destined for every state in the Union,chiefly New York, Illinois, Pennsylvania, Michigan, NewJersey, Massachusetts, California, and Ohio, in the ordergiven.
Of the total number of immigrants admitted during theyear ended June 30, 1931, 2,481 were males and 3,211 werefemales (43.59% and 56.41%), over against 41.82% and58.18% respectively for the total number of immigrantsadmitted to the country. The Jewish immigrants differedin the matter of age distribution and conjugal condition.Of the total number of Jewish immigrants, 22.03% werechildren under 16 years, 56.45% were persons between16 and 44, and 21.52%, 45 years and over; as against17.83%, 69.08%, and 13.09%, respectively, for the totalnumber of immigrants. Of the total number of Jewishimmigrants, 50.24% were single, 42.59% married,- and7.17% widowed and divorced; as against 58.23%, 36.75%,and 5.02% respectively for the total. The family characterof Jewish immigration to the United States is also evidentfrom the fact that, of the total number of Jewish immi-grants, 93.87% came to join relatives, as against 81.19%for the total number of immigrants. This family characterof Jewish immigration accounts for the variation from thenorm on the part of Jewish immigrants in the matter of theamount of money shown by the immigrants upon landing.In 1930, the sum of money shown by the Jewish immigrantsupon landing, amounted to 5.69% of the total sumshown.
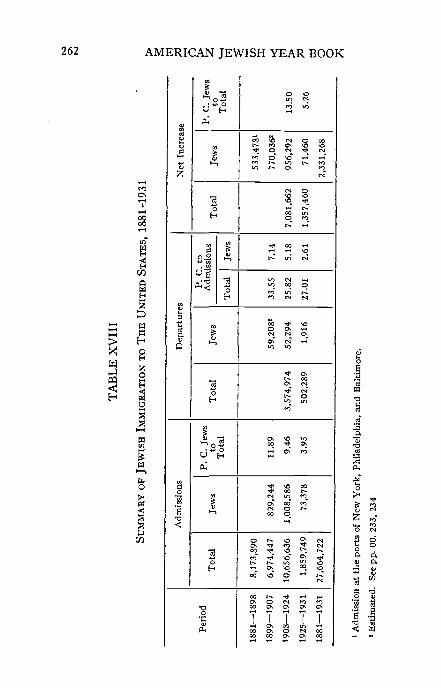
Little is known statistically of the early waves of Jewishimmigration to the United States, the immigration of Por-tuguese and Spanish Jews, and of German Jews. We are inpossession of statistics beginning with 1881, and the datawe have bear on the following: (1) the number of Jews whowere admitted at the ports of the City of New York, Phil-adelphia, and Baltimore, during 1881—1898; (2) the num-ber of Jews who were admitted to the country at all portsbetween 1899—1907; and (3) the number of Jews who wereadmitted as well as those who departed from 1908 onwards.
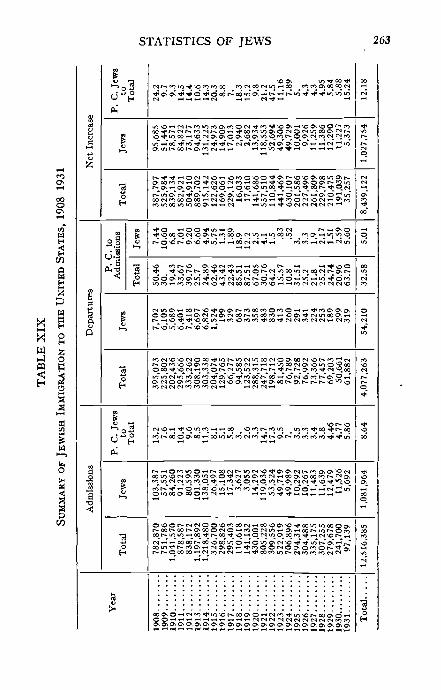
Now, during 1908—1914, the percentage of Jewish
STATISTICS OF JEWS .259
departures to Jewish admissions was 7.14%.' We may,therefore, perhaps assume that the percentages were similarduring the period between 1899—1907. We may also per-haps assume that during 1881-1898 the Jewish departuresequalled the number of Jewish admissions through portsother than New York, Philadelphia, and Baltimore. Ifthese assumptions be correct, then the number of Jewishimmigrants to the United States during 1881—1931 maybe estimated at 2,331,268.2
The percentage of Jewish departures during the entire period between 1908-1929 i3is close to the one of 7.1
igration. See table XIX.5.03% which percentage is close to the one of 7.14% for the seven years between1908-1914 of "free" immigration. S "
1 See Table XVIII.
260 AMERICAN JEWISH YEAR BOOK
TABLE XIVJEWISH IMMIGRANTS ADMITTED, DEPARTED, DEBARRED, AND DEPORTED,
JULY 1, 1930—JUNE 30, 1931, AND JULY—DECEMBER, 1931
Admission1
Departure2
IncreaseDebarredDeported
July 1, 1930—June 30, 1931
Total
97,13961,88235,2579,744
18,142
Jews
5,6923193
5,373405150
P. C.
5.860.52
15.244.160.83
July—December, 1931
Total
21,73558,604
-36,8693,9669,234
Jews
1,455240
1,21516880
P. C.
6.690.41
4.240.87
1 In addition, 183,540 non-immigrants, including 3,332 Jews (1.82%) were admittedduring the year ended June 30, 1931, and 84,895, including 1,450 Jews, during July—December, 1931.
2 In addition, 229,034 non-emigrant aliens departed during the year ended June30, 1931, including 1,839 Jews; and 112,018, including 735 Jews during July—-December,1931.
3 36 to Canada, 11 to Germany, 77 to Great Britain, 37 to Palestine, 70 to Poland,13 to Russia, and 75 to other countries.
TABLE XV
JEWISH IMMIGRANTS ADMITTED, BY SEX, AGE, CONJUGAL CONDITION,FINANCIAL CONDITION, ETC., YEAR ENDED JUNE 30, 1931
Immigrants Admitted.. . .
SEXMalesFemales
AGEUnder 1616—4445 and over
MARITAL CONDITIONSingleMarriedWidowedDivorced
FINANCIAL CONDITIONAmount of money shown .No. showing $50 or over..No. showing less than $50 .
PERSONS JOINEDRelativesFriendsNone
Number
Total
97,139
40,62156,518
17,32067,10012,719
56,56435,7004,573
302
$10,771,61349,98125,138
78,87010,4127,857
Jews
5,692
2,4813,211
1,2543,2131,225
2,8602,424
39513
$613,0552,1871,386
5,343131218
Distribution
Total
100.00
41.8258.18
17.8369.0813.09
58.2336.754.710.31
66.5433.46
81.1910.728.09
Jews
100.00
43.5956.41
22.0356.4521.52
50.2442.596.940.23
61.2138.79
93.872.303.83
STATISTICS OF JEWS 261
TABLE XVI
DESTINATION OF JEWISH IMMIGRANTS, BY STATE,YEAR ENDED JUNE 30, 1931
United States..
Total
97,139
7,7885,8507,2255,5916,381
35,8672,8896,359
19,189
Jews
5,692
210389222251239
3,4081782665291
P. C.
5.86
2.706.653.074.493.759.506.164.182.76
Distribution
Total
100.00
8.026.027.445.766.57
36.922.976.55
19.75
Jews
100.00
3.696.833.904.414.20
59.883.134.679.29
CaliforniaIllinoisMassachusetts.MichiganNew Jersey . . .New Y o r k . . . .OhioPennsylvania..Other States. .
i Alabama (5), Arizona (1), Arkansas (1), Colorado (14), Connecticut (82), Delaware(2), District of Columbia (23), Florida (15), Georgia (8), Indiana (19), Iowa (4),Kansas (3), Kentucky (7), Louisiana (4), Maine (9), Maryland (45), Minnesota (40),TV*;™;,^;™; {t.\ Missouri (31) Nebraska (8), Nevada (1), New Hampshire (3), New
-- - - • — - — ~ . • • ~ <•" Rhode
), Utah:sin (44).
TABLE XVII
PRINCIPAL COUNTRIES OF LAST RESIDENCE OF JEWISH IMMIGRANTS,YEAR ENDED JUNE 30, 1931
ALL COUNTRIES
CENTRAL EUROPEAN
Hungary
Poland
OTHER COUNTRIES
Great Britain
CanadaCuba
Countries of less than 10C
Total
97,139
9 143738
2 016887227403
3 604933335
87,996
10,294330
21,6871,1743,333
51,178
Jews
5,692
3,20164
144206146174
1,729517221
2,491
267293997214164
556
P. C.
5.86
35.018.677.14
23.2264.3243.1847.9755.4165.97
2.83
2.5988.79
4.6018.234.92
1.09
Distribution
Total
100.00
9.418.07
22.059.702.484.41
39.4210.213.66
90.59
11.700.37
24.651.333.79
58.16
Jews
100.00
56.242.004.506.444.565.44
54.0116.156.90
43.76
10.7211.7640.03
8.596.58
22.32
262 AMERICAN JEWISH YEAR BOOK
a03
H w
o
o
S
W
u
1
CO
J!
0
so"m
Adm
i
P.
C. J
ews
Tota
l
>
§
3
S
:. to
issi
o
tal
1—»
Tota
l
1
CO
3oH
Per
i
00
,47
fO
o
73,8
9
CO
-189
8
0000
5b
,03
o
,55
to
COoON*
in
ONCO
O\"
CO
74,4
4
ON
NO"
-190
7
ICO
13.5
0
?3NO*
ON
ts
,66
7,08
1
00
in
,82
ON
52,
3,57
4,97
NO
NOCO
co"
1,00
NO
56,6
3
NO
10,
-192
4
CO
oOv
5.26
o
O
.46
1,35
7
NO
o
27.
NO
°l
ON
502,
28
ON
CO
CO
COto"
ON
inCO
-193
125
—
CO
2,33
54,7
2
NO
s
-193
1
00CO
11
11
STATISTICS OF JEWS 263
o3i
O 00 »O iO 00 W *"• »-* f
H
ow
O 'HOOOO
3o
i CN oo es r - o\ c -
X 8.-I O« P
Q
(NO0iSC0*O
a
bO
^ oo o oo i T O *•!" O »^ CS O O ^ **) C
3o
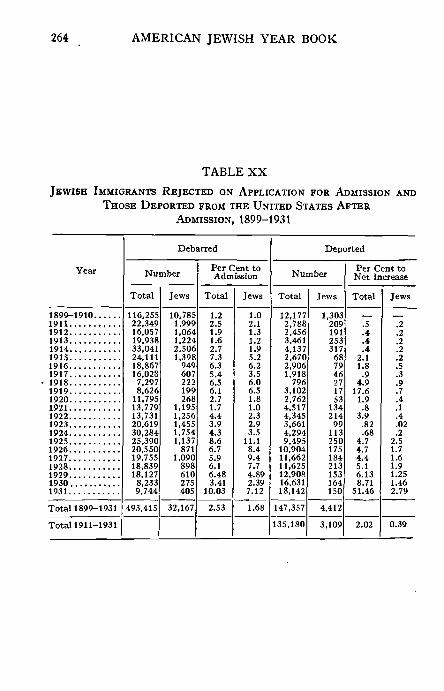
264 AMERICAN JEWISH YEAR BOOK
TABLE XXJEWISH IMMIGRANTS REJECTED ON APPLICATION FOR ADMISSION AND
THOSE DEPORTED FROM THE UNITED STATES AFTERADMISSION, 1899-1931
Year
1899-1910...1911 . . .1912191319141915 . . . .1916191719181919192019211922192319241925192619271928192919301931
Total 1899-1931
Total 1911-1931
Debarred
Number
Total
116,25522,34916,05719,93833,04124.11118,86716,0287,2978,626
11,79513,77913.73120,61930,28425,39020,55019,75518,83918,1278,2339,744
493,415
Jews
10,7851,9991,0641,2242,5061,398
949607222199268
1,1951,2561,4551,7541,137
8711,090
898610275405
32,167
Per Cent toAdmission
Total
1.22.51.91.62.77.36.35.46.56.12.71.74.43.94.38.66.75.96.16.483.41
10.03
2.53
Jews
1.02.11.31.21.95.26.23.56.06.51.81.02.32.93.5
11.18.49.47.74.892.397.12
1.68
Deported
Number
Total
12,1772,7882 4563 4614,1372,6702,9061,918
7963,1022,7624,5174,3453,6614,2949,495
10,90411,66211,62512,90816,63118,142
147,357
135,180
Jews
1,303209191253317687946271753
13421499
113250175184213153164150
4,412
3,109
Per Cent toNet Increase
Total
.5
.4,4.4
2.11.8
.94.9
17.61.9.8
3.9.82.68
4.74.74.45.16.138.71
51.46
2.02
Jews
.2
.2
.2
.2.2.5.3.9.7.4.1.4.02.2
2.51.71.61.91.251.462.79
0.39
STATISTICS OF JEWS 265
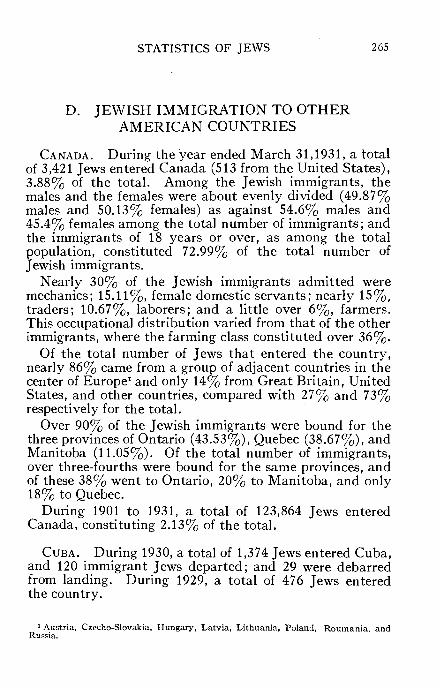
D. JEWISH IMMIGRATION TO OTHERAMERICAN COUNTRIES
CANADA. During the year ended March 31,1931, a totalof 3,421 Jews entered Canada (513 from the United States),3.88% of the total. Among the Jewish immigrants, themales and the females were about evenly divided (49.87%males and 50.13% females) as against 54.6% males and45.4% females among the total number of immigrants; andthe immigrants of 18 years or over, as among the totalpopulation, constituted 72.99% of the total number ofJewish immigrants.
Nearly 30% of the Jewish immigrants admitted weremechanics; 15.11%, female domestic servants; nearly 15%,traders; 10.67%, laborers; and a little over 6%, farmers.This occupational distribution varied from that of the otherimmigrants, where the farming class constituted over 36%.
Of the total number of Jews that entered the country,nearly 86% came from a group of adjacent countries in thecenter of Europe1 and only 14% from Great Britain, UnitedStates, and other countries, compared with 27% and 73%respectively for the total.
Over 90% of the Jewish immigrants were bound for thethree provinces of Ontario (43.53%), Quebec (38.67%), andManitoba (11.05%). Of the total number of immigrants,over three-fourths were bound for the same provinces, andof these 38% went to Ontario, 20% to Manitoba, and only18% to Quebec.
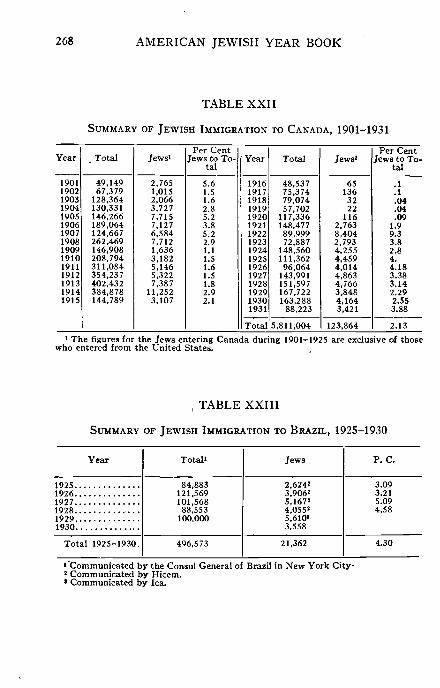
During 1901 to 1931, a total of 123,864 Jews enteredCanada, constituting 2.13% of the total.
CUBA. During 1930, a total of 1,374 Jews entered Cuba,and 120 immigrant Jews departed; and 29 were debarredfrom landing. During 1929, a total of 476 Jews enteredthe country.
1 Austria, Czecho-Slovakia, Hungary, Latvia, Lithuania, Poland, Roumania, andRussia.
266 AMERICAN JEWISH YEAR BOOK
BRAZIL. During 1930, a total of 3,558 Jewish immigrantswere admitted to Brazil. From 1925 to 1929, a total of21,362 Jews entered the country, constituting 4.3% of thetotal number of persons admitted.
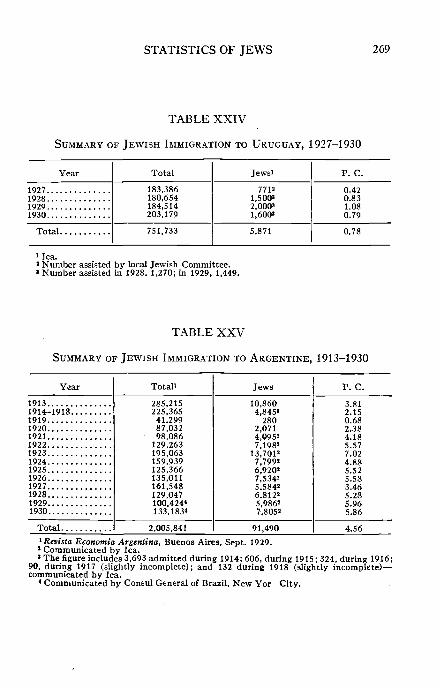
URUGUAY. During 1930, about 1,600 Jews enteredUruguay; and during 1927-1930, a total of 5,871 Jewishimmigrants entered the country, 0.78%.
ARGENTINE. During 1930, a total of 7,805 Jews enteredArgentine, constituting 5.86% of the total number ofimmigrants admitted to the country during that year. Dur-ing the period of 18 years of 1913-1930, a total of 91,490Jews entered the country, constituting 4.56% of theadmissions.
UNION OF SOUTH AFRICA. During 1930, a total of 1,200Jewish immigrants entered the Union of South Africa,compared with 2,664 in 1929.
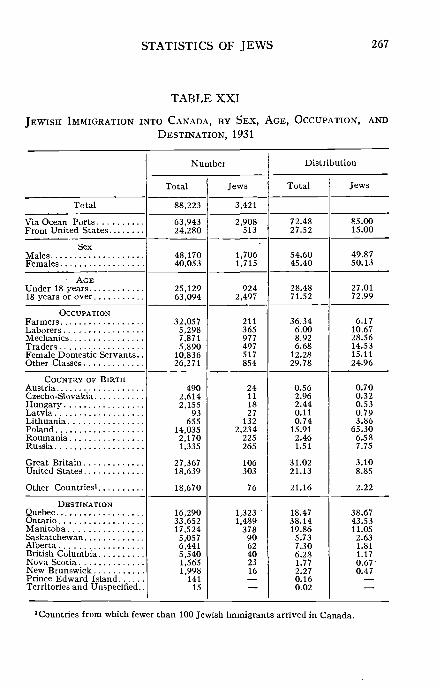
STATISTICS OF JEWS 267
TABLE XXI
JEWISH IMMIGRATION INTO CANADA, BY SEX, AGE, OCCUPATION, AND
DESTINATION, 1931
Total
Via Ocean PortsFrom United States
SexMales
AGEUnder 18 years18 years or over
OCCUPATION
TradersFemale Domestic Servants..Other Classes
COUNTRY OF BIRTH
Czecho-Slovakia
Poland
Great BritainUnited States
Other Countries'
DESTINATION
Ontario
SaskatchewanAlbertaBritish ColumbiaNova ScotiaNew BrunswickPrince Edward IslandTerritories and Unspecified..
Number
Total
88,223
63,94324,280
48,17040,053
25,12963,094
32,0575,2987,8715,890
10,83626,271
4902,6142,155
93655
14,0352,1701,335
27,36718,639
18,670
16,29033,65217,5245,0576,4415,5401,5651,998
14115
Jews
3,421
2,908513
1,7061,715
9242,497
211365977497517854
24111827
1322,234
225265
106303
76
1,3231,489
3789062402316
Distribution
Total
72.4827.52
54.6045.40
28.4871.52
36.346.008.926.68
12.2829.78
0.562.962.440.110.74
15.912.461.51
31.0221.13
21.16
18.4738.1419.865.737.306.281.772.270.160.02
Jews
85.0015.00
49.8750.13
27.0172.99
6.1710.6728.5614.5315.1124.96
0.700.320.530.793.86
65.306.587.75
3.108.85
2.22
38.6743.5311.052.631.811.170.67-0.47
•Countries from which fewer than 100 Jewish immigrants arrived in Canada.
268 AMERICAN JEWISH YEAR BOOK
TABLE XXII
SUMMARY OF JEWISH IMMIGRATION TO CANADA, 1901-1931
Year
190119021903190419051906190719081909191019111912191319141915
Total
49,14967,379
128,364130,331146,266189,064124,667262,469146,908208,794311,084354,237402,432384,878144,789
Jews1
2,7651,0152,0663,7277,7157,1276,5847,7121,6363,1825,1465,3227,387
11,2523,107
Per CentJews to To-
tal
5.61.51.62.85.23.85.22.91.11.51.61.51.82.92.1
Year
1916191719181919192019211922192319241925192619271928192919301931
Total
Total
48,53775,37479,07457,702
117,336148,47789,99972,887
148,560111,36296,064
143,991151,597167,722163,288
88,2235,811,004
Jews'
651363222
1162,7638,4042,7934,2554,4594,0144,8634,7663,8484,1643,421
123,864
Per CentJews to To-
tal
.1
.1
.04
.04
.091.99.33.82.84.4.183.383.142.292.553.882.13
1 The figures for the Jews entering Canada during 1901-1925 are exclusive of thosewho entered from the United States.
, TABLE XXIII
SUMMARY OF JEWISH IMMIGRATION TO BRAZIL, 1925-1930
Year
192519261927192819291930
Total 1925-1930.
Total'
84,883121,569101,56888,553
100,000
496,573
Jews
2,624'3,906'5,167'4,055'5,610s
3,558
21,362
P. C.
3.093.215.094,58
4.30
i Communicated by the Consul General of Brazil in New York City' Communicated by Hicem.• Communicated by lea.
STATISTICS OF JEWS 269
TABLE XXIV
SUMMARY OF JEWISH IMMIGRATION TO URUGUAY, 1927-1930
Year
1927192819291930
Total
Total
183,386180,654184,514203,179
751,733
Jews'
77121,500s
2.0003
1,600'
5,871
P. C.
0.420.831.080.79
0.78
' l e a .2 Number assisted by local Jewish Committee.» Number assisted in 1928, 1,270; in 1929, 1,449.
TABLE XXV
SUMMARY OF JEWISH IMMIGRATION TO ARGENTINE, 1913-1930
Year
19131914-1918191919201921192219231924192519261927192819291930
Total
Total1
285,215225,365
41,29987,03298,086
129,263195,063159,939125,366135,011161,548129,047100,424«133,183*
2,005,841
Jews
10,8604,845>
2802,0714,09527.1982
13,70127,799"6,92027,53425,58426,81225,98627,8052
91,490
P. C.
3.812.150.682.384.185.577.024.885.525.583.465.285.965.86
4.561Revista Economia Argentina, Buenos Aires, Sept. 1929.
1 Communicated by lea.•The figure includes 3,693 admitted during 1914; 606, during 1915; 324, during 1916;
90, during 1917 (slightly incomplete); and 132 during 1918 (slightly incomplete)—communicated by lea.
' Communicated by Consul General of Brazil, New Yor City.
270 AMERICAN JEWISH YEAR BOOK
E. JEWISH IMMIGRATION TO PALESTINE
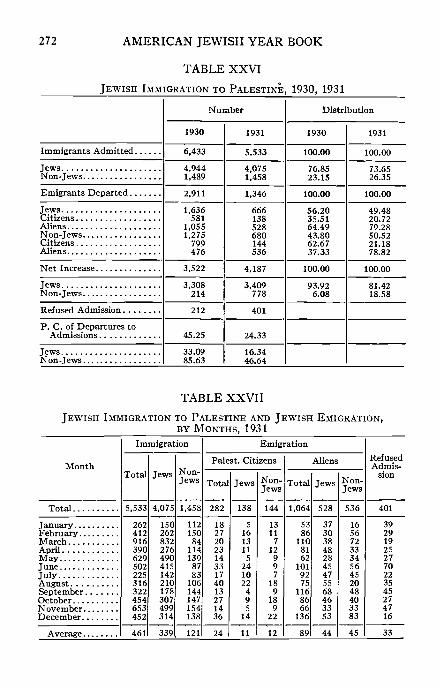
During 1931, a total of 4,075 Jewish immigrants entered,and 666 Jews departed from, Palestine, leaving a net increaseof 3,409 Jews. During the same year, 1,458 non-Jewishimmigrants entered, and 680 emigrants departed from,Palestine. Thus, during 1931, a total of 5,533 immigrants(73.65% Jews and 26.35% non-Jews) entered, and 1,346(49.48% Jews and 50.52% non-Jews) departed from, Pales-tine, the percentage of departures to admissions being16.34% for Jews and 46.64% for non-Jews, as against33.09% and 85.63% respectively during 1930.
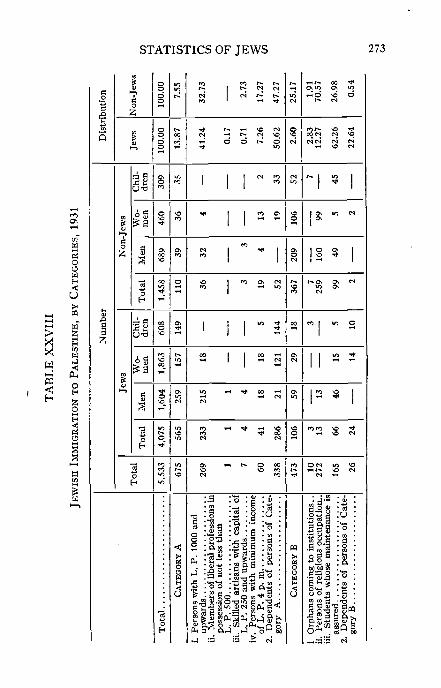
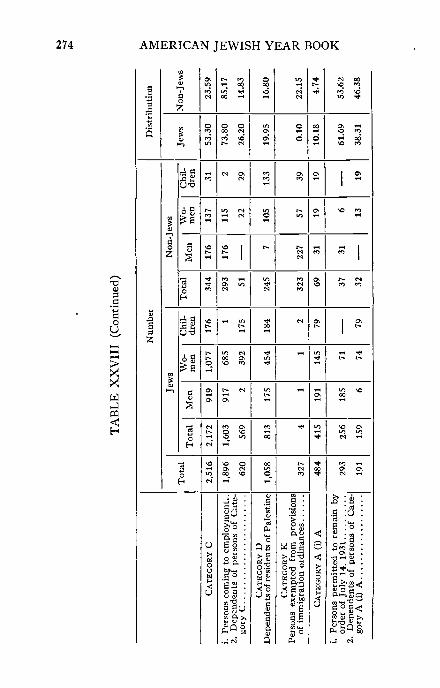
During 1931, for which year detailed information isavailable, over half (53.3%) of the Jews admitted werepersons coming to employment and their dependents;19.95% were dependents of residents already in Palestine;and 13.87% were persons with capital, or assured income ormaintenance, and their dependents; 2.6% were persons ofreligious occupations, students, orphans, and their depen-dents. Four of the 327 persons admitted under exemptionfrom the provisions of the immigration ordinance were Jews.
The distribution of the non-Jewish immigrants wasnotably different from that of the Jewish newcomers. Over22% of the non-Jewish immigrants were admitted underexemption from the immigration ordinance; less than one-fourth (23.59%) were persons coming to employment andtheir dependents, more than one-fourth (25.17%) werepersons of religious occupations, students and orphans,16.80% were dependents of Palestinian citizens; and 7.55%were persons of means.
There was also a considerable difference in the sex group-ings, as between Jews and non-Jews. Of the Jewish immi-grants admitted, 39.36% were men, 45.72% women and14.92% children, as compared with 47.26%, 31.55%, and21.19% for the non-Jewish immigrants.
Jews constituted almost half (49.48%) of the total numberof emigrants in 1931. About 80% were aliens and 20% werePalestinian citizens, as was also the case with the non-Jewishemigrants.
STATISTICS OF JEWS 271
During 1931, 401 persons were refused admission, anaverage of 33 persons monthly.
In 1931, the monthly immigration of the Jews averaged339. The largest number (832) was admitted in March andthe smallest number (142) during July. The monthlyaverage for non-Jews was 121, the largest number (154)was admitted during November and the smallest number(83) during July. The average monthly number of Jewswho emigrated was 55 (11 citizens and 44 aliens) and ofnon-Jews, 57 (12 citizens and 45 aliens).
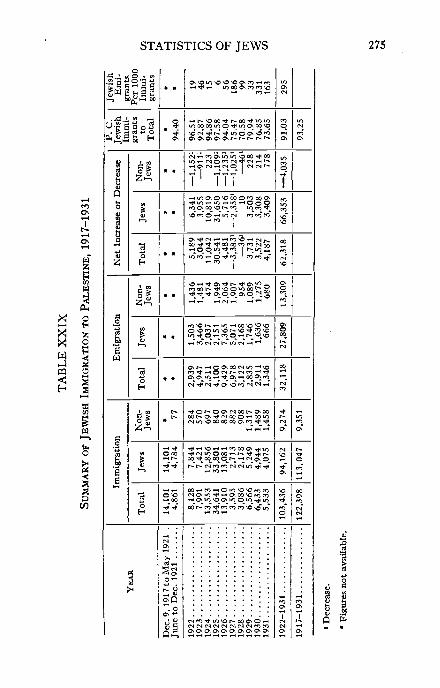
From the date of the British occupation of Palestine,December 9, 1917, to the end of 1931, a total of 113,047Jews entered the country, the yearly number varyingbetween 33,801 in 1925 and 2,178 in 1928. The number ofJews that departed between December 9, 1917 and theend of 1921, was small. But, during the decade from 1922to 1931, a total of 27,809 Jews, emigrated, or 29.53% ofthe number admitted. The yearly emigration of Jews variedbetween 666 in 1931 and 7,365 in 1926; and the percentageof Jewish emigration to Jewish immigration varied between6.36% in 1925 and 99.54% in 1928. The net immigrationof Jews during 1922-1931 wax 66,353. One year, 1927,shows a decrease of 2,358 Jews, but all other years witnessedan increase of Jewish immigration over emigration, varyingbetween 10 in 1928 and 31,650 in 1925. A total of 9,274non-Jews were admitted to the country during 1922-1931,and an additional small number between December 9, 1917and May 31, 1921, for which period no statistics of non-Jewswere kept; and during 1922-1931, a total of 13,309 departed,being 4,035 in excess of the number admitted. During1922-1931, an average of 9% of the yearly immigration wasnon-Jewish, the yearly percentage varying between 2.42%in 1925, and 29.42% in 1928. The yearly immigration ofnon-Jews varied between 284 in 1922 and 1,489 in 1930,and the yearly emigration, between 474 in 1924 and 2,064in 1926.
272 AMERICAN JEWISH YEAR BOOK
TABLE XXVI
JEWISH IMMIGRATION TO PALESTINE, 1930, 1931
Immigrants Admitted
JewsNon-Jews
Emigrants Departed
CitizensAliens
Net Increase
Non-Jews
Refused Admission
P. C. of Departures toAdmissions
Non-Jews
Number
1930
6,433
4,9441,489
2,911
1,636581
1,0551,275
799476
3,522
3,308214
212
45.25
33.0985.63
1931
5,533
4,0751,458
1,346
666138528680144536
4,187
3,409778
401
24.33
16.3446.64
Distribution
1930
100.00
76.8523.15
100.00
56.2035.5164.4943.8062.6737.33
100.00
93.926.08
1931
100.00
73.6526.35
100.00
49.4820.7279.2850.5221.1878.82
100.00
81.4218.58
TABLE XXVII
JEWISH IMMIGRATION
Month
Total
MarchApril
July
October
Average
TO PALESTINE AND JEWISHBY MONTHS, 1931
Immigration
Total
5,533
262412916390629502225316322454653452
461
Jews
4.075
150262832276490415142210178307499314
339
Non-Jews
1,458
11215084
1141398783
106144147154138
121
EMIGRATION,
Emigration
Palest. Citizens
Total
282
182720231433174013271436
24
Jews
138
51613115
241022495
14
11
Non-Jews
144
1311
712997
189
189
22
12
Aliens
Total
1,064
5386
1108162
1019275
1168666
136
89
Jews
528
373038482845475568463353
44
Non-Jews
536
165672333456452048403383
45
RefusedAdmis-
sion
401
392919252770223545274716
33
STATISTICS OF JEWS 273
atOoaH
_, m
PH
o
OH
.2Q
Iis
I I I
« • * 00 ->
" - g
| O \ IO N
t*o* ©> «
fO I »O O
-g " -r w g |V\
274 AMERICAN JEWISH YEAR BOOK
=.S+JeoU
g•a3j a
'SIn
Q
mbe
r
Z
»a j
§
H i
[ew
son
-J
Chi
l-dr
en
o c
^ s
g
oH
hil-
ren
II
Men
ota
l
H
o
cs
oTO
f O
s
I —f O
vO
f O
1,07
791
9,1
72
2"1CN"
CJ
EG
OR
Y
H<
iH CO
CO -
o oco esfO* VO*
EN
VO
CA
00 O\so fO
fO O
OO \OH
mem
' C
atin
g to
iof
per
com
ien
tsP
erso
nsD
epen
dgo
ry C
.
o00vd
o
19.
133
u^O
cs
CO1 - 1
454
175
813
00
q
a
Jest
i
CO
A,o
OS
EG
OR
Yre
side
nC
AT
]:s
of l
g•a&QJ
Q
xn
( N
o
o
r*
cs
f O
csf O
<N
* ^
ENt o
CA .
visi
oK >m
pr
ona
nces
OS t
< e «uijii
S |
00
d
2
o
o»t^
145
191
415
0 0
<
OR
Y A
ITE
G
o
<N 00
O *HVO fOi - * COvO fO
1 2
vO fO
1CO fO
1 £1
to voCO
S §
8 S
to
rem
'31
....
sons
of
[lit
ted
14,
ISof
per
5^s<
Per
sons
orde
r of
Dep
end
gory
A (
STATISTICS OF JEWS 275
I
inW
X o
i
o
§
sII
OGO
O\ O ^ 6 O O O^H ^H ^ IO 00
TT