Embed Size (px)
Citation preview

STATS IN BRIEFU.S. DEPARTMENT OF EDUCATION MAY 2018 NCES 2018–160
Statistics in Brief publications describe key findings from statistical
tables to provide useful information to a broad audience, including
members of the general public. They address simple and topical issues
and questions. They do not investigate more complex hypotheses,
account for inter-relationships among variables, or support causal
inferences. We encourage readers who are interested in more complex
questions and in-depth analysis to explore other NCES resources,
including publications, online data tools, and public- and restricted-
use datasets. See nces.ed.gov and references noted in the body of this
document for more information.
This publication was prepared for NCES under Contract No. ED-IES-12-D-0002 with American Institutes for Research. Mention of trade names, commercial products, or organizations does not imply endorsement by the U.S. Government.
The Summer After Kindergarten: Children’s Experiences by Socioeconomic Characteristics
AUTHORS
Jeremy RedfordStephanie Burns American Institutes for Research
L. Jane Hall Activate Research, Inc.
PROJECT OFFICER
John RalphNational Center for Education Statistics
Over the summer months, elementary school children may experience
a range of activities, including summer
camps, family vacations, and home learning
activities. Access to summer activities
may vary for children from different
socioeconomic status (SES) backgrounds.
In the prior administration of the Early
Childhood Longitudinal Study, Kindergarten
Class of 1998–99 (ECLS-K), an analysis found
that 20 percent of low-SES students visited
an art, science, or discovery museum in
summer 1999, compared to 62 percent
of high-SES students (Meyer, Princiotta,
and Lanahan 2004). Disparities by SES
were also found across other activities
examined in the report, including going to
a library and visiting historic sites. Another
analysis, of children’s time-use during the
summer months, found that children from
lower-income households watched more
television and spent less time talking with
parents than children from higher-income
households (Gershenson 2013).
In addition to disparities in activities
over the summer, children of different
SES backgrounds may also have different
primary care arrangements. However,
information on elementary school
children’s care arrangements during the
summer months is sparse. Children’s
primary care arrangements prior to
entering kindergarten highlight differences
in arrangements by child and family
characteristics (Rathbun and Zhang 2016).

2
Further, another study found that some
55 percent of children under 5 had no
regular child care arrangement during
the summer of 2006, and about 58
percent of children between the ages
of 5 and 14 had no regular child care
arrangement (Laughlin 2010).
Examinations of variations in care
arrangements and activities during
the summer after kindergarten
are important because previous
research has found that achievement
gaps widen by SES during this time
(Downey, Broh, and von Hippel
2004; Entwisle and Alexander 1995).
Other studies provide evidence that
summer achievement gaps in the early
elementary grades are associated with
students’ high school achievement
and college enrollment (Alexander,
Entwisle, and Olson 2007).
Other researchers have examined
achievement gaps between
kindergarten and first grade. These
studies have reported mixed findings
on the relationship between reading
achievement and SES during the
summer months, but the relationship
between math achievement and SES
has been more consistent. For example,
Burkham et al. (2004) examined the
relationship between SES and reading
and math achievement between
kindergarten and first grade. They
found that both reading and math
gaps increased between students in
the highest SES quintile and students
in the lowest SES quintile over the
summer months. A more recent study,
by Quinn et al. (2016), found that math
gaps between children in the highest
and lowest SES quintiles increased over
the summer after kindergarten after
narrowing during kindergarten. For
reading, the gaps also narrowed over
kindergarten, but there was no change
in the reading gap during the summer
after kindergarten.
This Statistics in Brief investigates
some factors that may contribute to
achievement gaps in the summer
after kindergarten, including
differences in children’s experiences,
such as participation in summer care
arrangements, programs, and activities.
Specifically, the brief describes
students’ summer nonparental care
arrangements, program attendance
(e.g., at summer camps or summer
school), participation in activities with
family members in a typical week, and
places visited with family members.
Participation in summer activities
is compared by two socioeconomic
characteristics—household poverty
status and parents’ highest level
of education—utilizing data from
the Early Childhood Longitudinal
Study, Kindergarten Class of 2010–11
(ECLS-K:2011).
DATA, METHODS, AND STRUCTURE OF THE REPORTThis Statistics in Brief presents data
from the ECLS-K:2011, which is a
nationally representative sample of
students in the kindergarten class of
2010–11. Data on children’s summer
experiences were collected from
interviews with parents or guardians
in fall 2011, when most children were
entering the first grade.1
1 For more information about the data collection, please see page 21 of the Technical Notes.
Within each section of this brief,
findings are presented first for the
overall population of students, then by
household poverty status and parents’
highest level of education.
The differences reported in this brief
are statistically significant at the p < .05
level to ensure that they are larger than
might be expected due to sampling
variation. No adjustments were made
for multiple comparisons. For more
information about the data, measures,
and methods used in this brief, please
see the Technical Notes toward the
end of the report.
3
STUDY QUESTIONS
1 During the summer
after kindergarten
in 2011, how did
children’s nonparental
care arrangements
and participation in
summer programs vary
by household poverty
status and parents’
highest level
of education?
2 Did the frequency of
children’s participation
in activities during
the summer after
kindergarten in 2011
vary by household
poverty status and
parents’ highest level
of education?
3 Did the percentage of
children who visited
various places with
family members during
the summer after
kindergarten in 2011
vary by household
poverty status and
parents’ highest level
of education?
KEY FINDINGS• During the summer after
kindergarten in 2011, a higher
percentage of children from poor
households (83 percent) than from
nonpoor households (70 percent)
did not have a regular care
arrangement with someone other
than their parents (figure 3).
• The use of computers for
educational purposes over the
summer differed by parents’
educational attainment and
household poverty status. For
instance, a higher percentage
of children whose parents had
a high school diploma or below
(32 percent) than who had
some postsecondary education
(18 percent) or a bachelor’s degree
or above (15 percent) never used a
computer for educational purposes
(figure 9).
• Overall, about 76 percent of children
played outside every day during
the summer after kindergarten.
No measurable differences were
found by household poverty status
or parent education in how often
children played outside every day
(table A-3).
• More than half of all children
visited a beach, lake, river, or state
or national park (figure 10); zoo or
aquarium (figure 11); or amusement
park (figure 12) during the summer
after kindergarten. However,
differences existed by household
poverty status and parent
education. For example, a lower
percentage of children from poor
households (54 percent) than from
near-poor (66 percent) and nonpoor
(69 percent) households visited a
zoo or aquarium.
4
Socioeconomic characteristics
Socioeconomic status (SES) refers to one’s access to financial, social, cultural, and human capital resources (National
Forum on Education Statistics 2015). The methods for determining SES vary depending on data availability and the
purposes for which the SES measures are to be used. For example, in the ECLS-K:2011 data file, researchers have access
to a composite measure of SES that is composed of parent education, parent occupational prestige, and household
income, which are components commonly used to describe SES (Tourangeau et al. 2015).
For the purposes of this Statistics in Brief, two common components of SES are analyzed: household poverty status
(which is based on household income) and parents’ highest level of education. Please see the Technical Notes for more
detail about the SES variables used in this report. By presenting separate results for each component, the brief provides
a more detailed view of differences in children’s summer experiences by socioeconomic characteristics than it would if a
composite measure were used. For example, disparities in students’ participation in summer activities may be found by
household poverty status but not by parents’ highest level of education, or vice versa.
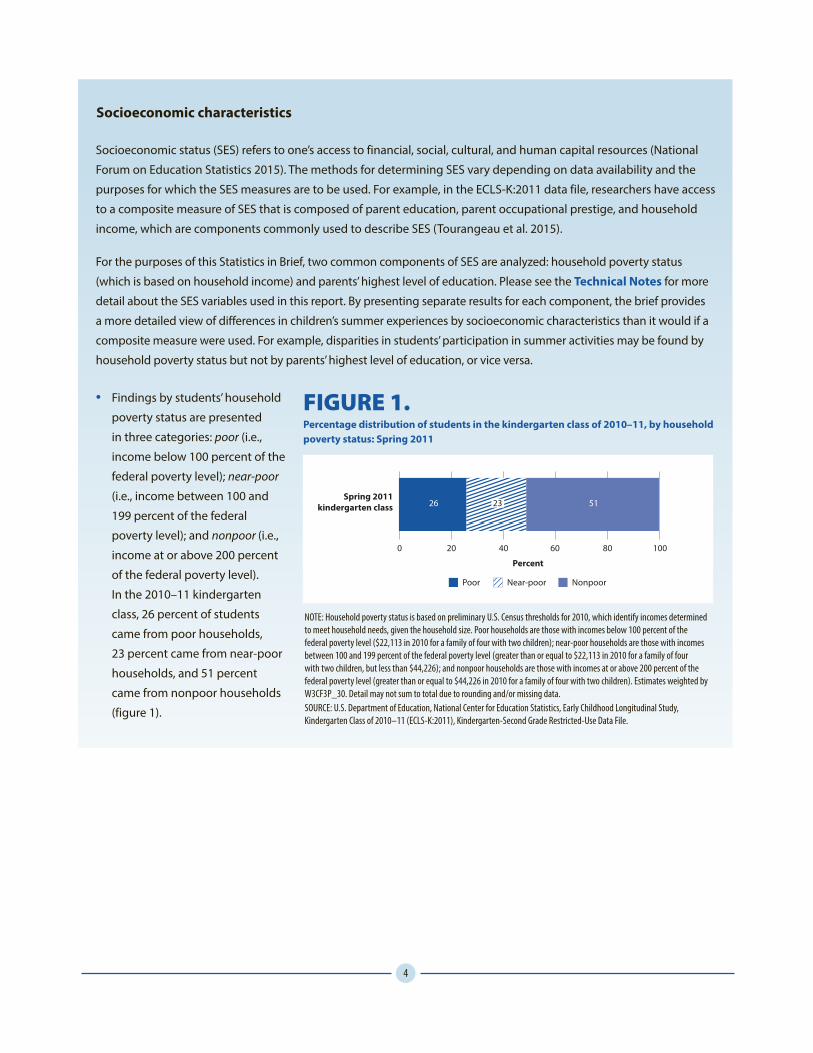
• Findings by students’ household
poverty status are presented
in three categories: poor (i.e.,
income below 100 percent of the
federal poverty level); near-poor
(i.e., income between 100 and
199 percent of the federal
poverty level); and nonpoor (i.e.,
income at or above 200 percent
of the federal poverty level).
In the 2010–11 kindergarten
class, 26 percent of students
came from poor households,
23 percent came from near-poor
households, and 51 percent
came from nonpoor households
(figure 1).
FIGURE 1.Percentage distribution of students in the kindergarten class of 2010–11, by household poverty status: Spring 2011
Spring 2011kindergarten class
Percent
0 20 40 60 80 100
Poor Near-poor Nonpoor
26 23 51
NOTE: Household poverty status is based on preliminary U.S. Census thresholds for 2010, which identify incomes determined to meet household needs, given the household size. Poor households are those with incomes below 100 percent of the federal poverty level ($22,113 in 2010 for a family of four with two children); near-poor households are those with incomes between 100 and 199 percent of the federal poverty level (greater than or equal to $22,113 in 2010 for a family of four with two children, but less than $44,226); and nonpoor households are those with incomes at or above 200 percent of the federal poverty level (greater than or equal to $44,226 in 2010 for a family of four with two children). Estimates weighted by W3CF3P_30. Detail may not sum to total due to rounding and/or missing data. SOURCE: U.S. Department of Education, National Center for Education Statistics, Early Childhood Longitudinal Study, Kindergarten Class of 2010–11 (ECLS-K:2011), Kindergarten-Second Grade Restricted-Use Data File.
5
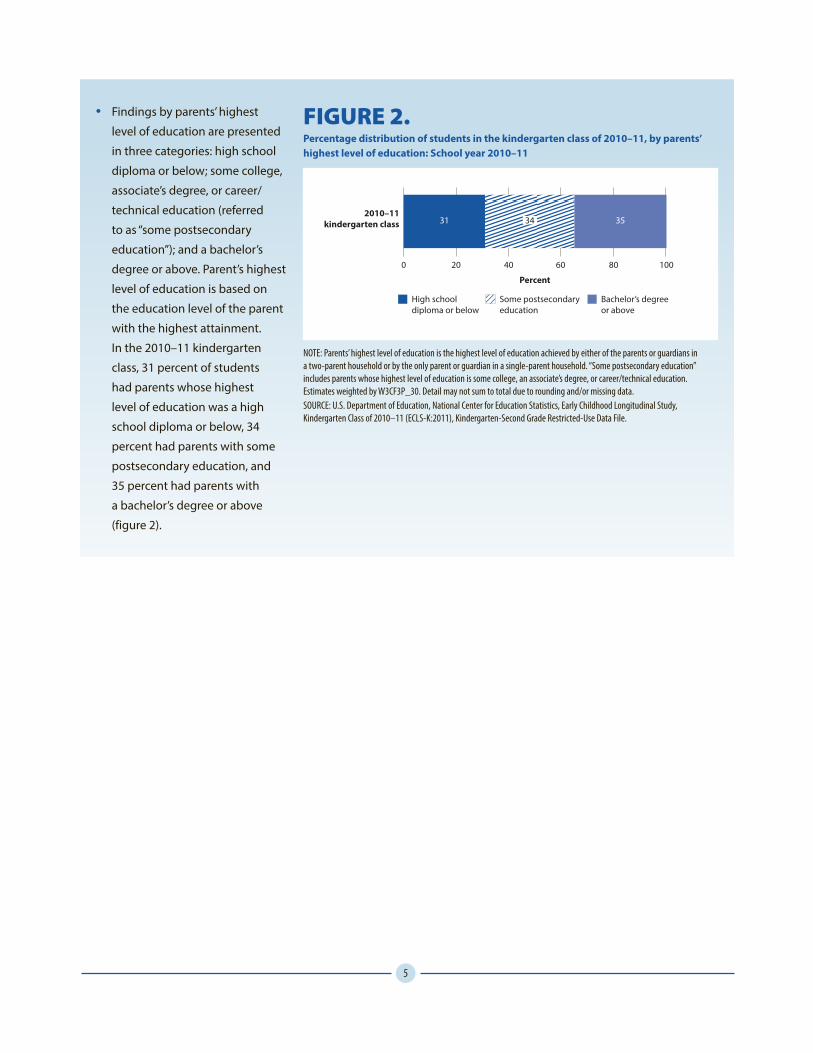
• Findings by parents’ highest
level of education are presented
in three categories: high school
diploma or below; some college,
associate’s degree, or career/
technical education (referred
to as “some postsecondary
education”); and a bachelor’s
degree or above. Parent’s highest
level of education is based on
the education level of the parent
with the highest attainment.
In the 2010–11 kindergarten
class, 31 percent of students
had parents whose highest
level of education was a high
school diploma or below, 34
percent had parents with some
postsecondary education, and
35 percent had parents with
a bachelor’s degree or above
(figure 2).
FIGURE 2.Percentage distribution of students in the kindergarten class of 2010–11, by parents’ highest level of education: School year 2010–11
2010–11kindergarten class
Percent
0 20 40 60 80 100
High school diploma or below
Some postsecondaryeducation
Bachelor’s degree or above
31 34 35
NOTE: Parents’ highest level of education is the highest level of education achieved by either of the parents or guardians in a two-parent household or by the only parent or guardian in a single-parent household. “Some postsecondary education” includes parents whose highest level of education is some college, an associate’s degree, or career/technical education. Estimates weighted by W3CF3P_30. Detail may not sum to total due to rounding and/or missing data.SOURCE: U.S. Department of Education, National Center for Education Statistics, Early Childhood Longitudinal Study, Kindergarten Class of 2010–11 (ECLS-K:2011), Kindergarten-Second Grade Restricted-Use Data File.
6
1 During the summer after kindergarten in 2011, how did children’s nonparental care arrangements and participation in summer programs vary by household poverty status and parents’ highest level of education?
In the summer after kindergarten in
2011, students’ vacations spanned
78 days, on average (data not in tables).
This section examines the extent to
which nonparental care arrangements
and participation in summer programs
(such as camp or summer school)
in 2011 differed by socioeconomic
characteristics.
Nonparental care arrangements
In the ECLS-K:2011 parent interview, parents or guardians were asked to report whether their child received child care
on a regularly scheduled basis during the summer from someone other than a parent or guardian. Parents were told
that these arrangements may include grandparents, brothers and sisters, or any other relative other than a parent or
guardian. They also may include home child care providers and regular sitters or neighbors, in addition to day care
centers or extended day programs. Parents reported on the type of child care arrangement (i.e., relative, nonrelative,
or day care center or extended day program) where the child spent the most time. If a child spent equal time across
two or more care arrangements, parents reported in which programs the child spent equal time. For the purposes
of this report, children who spent equal hours across two or more child care arrangements are reported as having
multiple care arrangements. Parents or guardians were instructed not to report on summer camp in their answers.
They were asked about their child’s participation in summer camp in subsequent questions.
“Regular” arrangements were defined by the study as an arrangement or program occurring on a routine schedule
(i.e., occurring at least weekly or on some other schedule). They did not include occasional babysitting or “back up”
arrangements that are just not used routinely. Also, regular care did not include staying with a relative for a period
of time during the summer.
This report classifies nonparental care arrangements into five groups:
• Relative care is care provided in a private home by a relative of the child. The private home may be the child’s
home, the caregiver’s home, or another home. The care may be provided by a relative who lives in the child’s
household.
• Nonrelative care is care provided in a private home by someone not related to the child. The private home may
be the child’s home, the caregiver’s home, or another home. The care may be provided by a nonrelative who lives
in the child’s household.
• Center care includes any type of formal program that provides care and supervision. This includes Head
Start programs, nursery schools, preschools, and prekindergarten programs that include children who are in
kindergarten or about to enter the first grade (some of which may be sponsored by the state). The care may be
provided in a child’s school or in another location, such as a church or a free-standing building.
• Multiple care arrangements is care provided in equal amounts of time in each of two or more types of care
arrangements.
• None includes children who did not attend any care arrangements on a regular basis. Their primary care
arrangement is with their parents.

7
Primary type of nonparental care arrangement during the summer
During summer 2011, about 13 percent
of children had a nonparental
care arrangement with relatives;
6 percent received nonparental care
from nonrelatives; 7 percent had a
center care arrangement; and less
than 1 percent had multiple care
arrangements. About 74 percent of
children did not have a regular care
arrangement with someone other than
a parent (figure 3).
Household poverty status
A higher percentage of children from
poor households (83 percent) than from
nonpoor households (70 percent) did
not have a regular care arrangement
with someone other than their parents
during summer 2011.
Compared to children in nonpoor
households, a lower percentage of
children in poor households had a
relative (10 vs. 14 percent), nonrelative
(3 vs. 8 percent), or center care (5 vs.
7 percent) arrangement as their primary
type of nonparental care arrangement.
Parents’ highest level of education
A higher percentage of children whose
parents had a high school diploma or
below (78 percent) than whose parents
had some postsecondary education
(72 percent) did not have a regular care
arrangement with someone other than
a parent. The percentage of children
who did not have a nonparental care
arrangement did not differ measurably
between those whose parents had
a high school diploma or below and
those whose parents had a bachelor’s
degree or above.
Compared to children whose parents
had a bachelor’s degree or above, a
lower percentage of children whose
parents had a high school diploma
or below had a nonrelative care
arrangement (3 vs. 8 percent).
FIGURE 3.Percentage distribution of students in the kindergarten class of 2010–11, by household poverty status, parents’ highest level of education, and primary type of nonparental care arrangement during the summer: Summer 2011
‡
‡
‡
13 6 7 74
10 3 5 83
13 5 6 77
14 8 7 70
14 3 5 78
13 5 9 72
12 8 6 73
1
#
1!
#Total
Poor
Near-poor
NonpoorHou
seho
ld
pove
rty
stat
us1
Pare
nts’
hig
hest
le
vel o
f edu
cati
on2
High schooldiploma or below
Some postsecondaryeducation
Bachelor’s degreeor above
Percent
0 20 40 60 80 100
Relativecare
Nonrelativecare
Centercare
Multiple carearrangements
None
# Rounds to zero.! Interpret data with caution. The coefficient of variation for this estimate is between 30 and 50 percent.‡ Reporting standards not met. Either there are too few cases for a reliable estimate or the coefficient of variation (CV) is 50 percent or greater.1Household poverty status is based on preliminary U.S. Census thresholds for 2010, which identify incomes determined to meet household needs, given the household size. Poor households are those with incomes below 100 percent of the federal poverty level ($22,113 in 2010 for a family of four with two children); near-poor households are those with incomes between 100 and 199 percent of the federal poverty level (greater than or equal to $22,113 in 2010 for a family of four with two children, but less than $44,226); and nonpoor households are those with incomes at or above 200 percent of the federal poverty level (greater than or equal to $44,226 in 2010 for a family of four with two children). 2 Parents’ highest level of education is the highest level of education achieved by either of the parents or guardians in a two-parent household or by the only parent or guardian in a single-parent household. “Some postsecondary education” includes parents whose highest level of education is some college, an associate’s degree, or career/technical education. NOTE: Nonparental care arrangements include child care provided on a regular basis by someone other than a parent or guardian. This does not include occasional babysitting or backup care providers. It also does not include summer camp. “Center care” includes child care from day care centers or extended day programs. “Multiple care arrangements” is care provided in equal amounts of time in each of two or more types of care arrangements. “None” includes children who did not attend any care arrangements on a regular basis. Their primary care arrangement is with their parents. Data on summer vacation characteristics in summer 2011 were collected in fall 2011. Estimates weighted by W3CF3P_30. Detail may not sum to total due to rounding and/or missing data.SOURCE: U.S. Department of Education, National Center for Education Statistics, Early Childhood Longitudinal Study, Kindergarten Class of 2010–11 (ECLS-K:2011), Kindergarten-Second Grade Restricted-Use Data File.

8
Summer camp attendance
Parents also reported on summer camp
attendance. Specifically, they were
asked, “Did child attend any day or
overnight camps over the summer?”
For this question, parents reported on
any summer camp the child attended
over the summer. Additional questions
on summer camp attendance (not
analyzed in this report) asked parents
how many camps the child attended
and how many days, hours each day,
and weeks the child attended the camp
where he or she spent the most time.
About 23 percent of children attended
a day camp and 1 percent went to an
overnight camp during the summer
after kindergarten, compared to 76
percent of children who did not attend
a day or overnight camp (figure 4).
Differences by socioeconomic
characteristics were found for day
camp attendance.
Household poverty status
A higher percentage of children from
nonpoor households (38 percent)
attended a day camp in the summer
after kindergarten than did children
from near-poor (13 percent) and poor
(7 percent) households.
Parents’ highest level of education
Attendance at day camps during
the summer was more common
for children whose parents had a
bachelor’s degree or above (43 percent)
than for those whose parents had some
postsecondary education (18 percent)
or a high school diploma or below
(6 percent).
Summer school or summer enrichment program attendance
About 10 percent of children
attended summer school or a summer
enrichment program in the summer
after kindergarten (table A-2). No
measurable differences were found
by household poverty status or
parent education.
FIGURE 4.Percentage distribution of students in the kindergarten class of 2010–11, by household poverty status, parents’ highest level of education, and summer camp attendance: Summer 2011
Hou
seho
ld
pove
rty
stat
us1
Pare
nts’
hig
hest
le
vel o
f edu
cati
on2
High schooldiploma or below
Some postsecondaryeducation
Bachelor’s degreeor above
Total
Poor
Near-poor
Nonpoor
Percent
0 20 40 60 80 100
Day camp Overnight camp None
‡
‡
23 76
7 92
13 86
38 61
6 93
18 82
43 56
1
1
1
1!
1!
! Interpret data with caution. The coefficient of variation for this estimate is between 30 and 50 percent.‡ Reporting standards not met. Either there are too few cases for a reliable estimate or the coefficient of variation (CV) is 50 percent or greater.1 Household poverty status is based on preliminary U.S. Census thresholds for 2010, which identify incomes determined to meet household needs, given the household size. Poor households are those with incomes below 100 percent of the federal poverty level ($22,113 in 2010 for a family of four with two children); near-poor households are those with incomes between 100 and 199 percent of the federal poverty level (greater than or equal to $22,113 in 2010 for a family of four with two children, but less than $44,226); and nonpoor households are those with incomes at or above 200 percent of the federal poverty level (greater than or equal to $44,226 in 2010 for a family of four with two children). 2 Parents’ highest level of education is the highest level of education achieved by either of the parents or guardians in a two-parent household or by the only parent or guardian in a single-parent household. “Some postsecondary education” includes parents whose highest level of education is some college, an associate’s degree, or career/technical education. NOTE: Students were categorized as attending an overnight camp if they attended camp 24 hours per day, as reported by parents. Data on summer vacation characteristics in summer 2011 were collected in fall 2011. Estimates weighted by W3CF3P_30. Detail may not sum to total due to rounding and/or missing data.SOURCE: U.S. Department of Education, National Center for Education Statistics, Early Childhood Longitudinal Study, Kindergarten Class of 2010–11 (ECLS-K:2011), Kindergarten-Second Grade Restricted-Use Data File.

9
2 Did the frequency of children’s participation in activities during the summer after kindergarten in 2011 vary by household poverty status and parents’ highest level of education?
When interviewed in fall 2011, parents
described the frequency of their child’s
various activities with family members
in a typical week during the summer
after kindergarten.2
2 Note that the analysis excludes fewer than 50 cases in which parents reported that their child was “away for summer.”
Specifically, they
were asked, “How often did you or any
other family member do math activities
with child, such as learning numbers,
adding, subtracting, or measuring; do
writing activities with him or her; and
read books to him or her.” Parents were
also asked, “During a typical week in
the summer, how often did child look
at or read books on his or her own; use
a computer or other electronic device
for educational purposes; and play
outside actively (for example, running,
jumping, or swinging)?” For both
sets of items, parents reported the
frequency of these activities in a
typical week using the following
options: never, once or twice, 3 to
6 times, or every day.
Parents also reported whether their
child was tutored (“Was child tutored
over the summer on a regular basis,
by someone other than you or a
family member, in a specific subject,
such as reading, math, science, or a
foreign language?”) and whether the
school provided a book list for their
child to read over the summer (“Did
child’s school give you a book list
with particular books to read over the
summer?”).
Math activities with family members in a typical week
Overall, 12 percent of children
participated in math activities with
a family member every day in a typical
week, while 30 percent participated
in math activities 3–6 times a week,
51 percent participated in math
activities once or twice a week, and
7 percent never participated in math
activities (figure 5).
FIGURE 5.Percentage distribution of students in the kindergarten class of 2010–11, by household poverty status, parents’ highest level of education, and frequency of math activities with family members during a typical week in the summer: Summer 2011
Hou
seho
ld
pove
rty
stat
us1
Pare
nts’
hig
hest
le
vel o
f edu
cati
on2
High schooldiploma or below
Some postsecondaryeducation
Bachelor’s degreeor above
Total
Poor
Near-poor
Nonpoor
Percent
0 20 40 60 80 100
Never Once or twice 3 to 6 times Every day
7 51 30 12
6 50 30 15
5 50 30 15
8 53 30 9
6 50 28 16
6 49 33 12
8 53 29 10
1 Household poverty status is based on preliminary U.S. Census thresholds for 2010, which identify incomes determined to meet household needs, given the household size. Poor households are those with incomes below 100 percent of the federal poverty level ($22,113 in 2010 for a family of four with two children); near-poor households are those with incomes between 100 and 199 percent of the federal poverty level (greater than or equal to $22,113 in 2010 for a family of four with two children, but less than $44,226); and nonpoor households are those with incomes at or above 200 percent of the federal poverty level (greater than or equal to $44,226 in 2010 for a family of four with two children). 2 Parents’ highest level of education is the highest level of education achieved by either of the parents or guardians in a two-parent household or by the only parent or guardian in a single-parent household. “Some postsecondary education” includes parents whose highest level of education is some college, an associate’s degree, or career/technical education.NOTE: In the parent questionnaire, the term “family” refers to any person who lives in the child’s household and any relative of the child living outside the child’s household. Data on summer vacation characteristics in summer 2011 were collected in fall 2011. Estimates weighted by W3CF3P_30. Detail may not sum to total due to rounding and/or missing data.SOURCE: U.S. Department of Education, National Center for Education Statistics, Early Childhood Longitudinal Study, Kindergarten Class of 2010–11 (ECLS-K:2011), Kindergarten-Second Grade Restricted-Use Data File.

10
Household poverty status
Higher percentages of children from
poor and near-poor households
(15 percent each) than from nonpoor
households (9 percent) participated
in math activities every day.
Parents’ highest level of education
A higher percentage of children whose
parents had a high school diploma or
below (16 percent) than whose parents
had some postsecondary education
(12 percent) or held a bachelor’s degree
or above (10 percent) participated
in math activities every day.
Writing activities with family members in a typical week
The percentage of children whose
parents reported that they participated
in writing activities with a family
member once or twice a week
(40 percent) was higher than the
percentage who participated every
day (19 percent), participated 3–6
times a week (34 percent), or never
participated (6 percent) (figure 6).
Household poverty status
Compared to children from poor
households (31 percent), a higher
percentage of children from nonpoor
households (37 percent) participated
in writing activities with a family
member 3-6 times a week. Conversely,
a higher percentage of children from
poor (25 percent) and near-poor
(22 percent) households than from
nonpoor households (13 percent)
participated in writing activities with
a family member every day.
Parents’ highest level of education
Children whose parents had a high
school diploma or below participated
in writing activities with a family
member every day at a higher
percentage (23 percent) than children
whose parents had a bachelor’s degree
or above (16 percent).
FIGURE 6.Percentage distribution of students in the kindergarten class of 2010–11, by household poverty status, parents’ highest level of education, and frequency of writing activities with family members during a typical week in the summer: Summer 2011
Hou
seho
ld
pove
rty
stat
us1
Pare
nts’
hig
hest
le
vel o
f edu
cati
on2
High schooldiploma or below
Some postsecondaryeducation
Bachelor’s degreeor above
Total
Poor
Near-poor
Nonpoor
Percent
0 20 40 60 80 100
Never Once or twice 3 to 6 times Every day
6 40 34 19
5 38 31 25
5 38 34 22
7 43 37 13
6 39 32 23
6 38 37 19
8 43 33 16
1 Household poverty status is based on preliminary U.S. Census thresholds for 2010, which identify incomes determined to meet household needs, given the household size. Poor households are those with incomes below 100 percent of the federal poverty level ($22,113 in 2010 for a family of four with two children); near-poor households are those with incomes between 100 and 199 percent of the federal poverty level (greater than or equal to $22,113 in 2010 for a family of four with two children, but less than $44,226); and nonpoor households are those with incomes at or above 200 percent of the federal poverty level (greater than or equal to $44,226 in 2010 for a family of four with two children).2 Parents’ highest level of education is the highest level of education achieved by either of the parents or guardians in a two-parent household or by the only parent or guardian in a single-parent household. “Some postsecondary education” includes parents whose highest level of education is some college, an associate’s degree, or career/technical education.NOTE: In the parent questionnaire, the term “family” refers to any person who lives in the child’s household and any relative of the child living outside the child’s household. Data on summer vacation characteristics in summer 2011 were collected in fall 2011. Estimates weighted by W3CF3P_30. Detail may not sum to total due to rounding and/or missing data.SOURCE: U.S. Department of Education, National Center for Education Statistics, Early Childhood Longitudinal Study, Kindergarten Class of 2010–11 (ECLS-K:2011), Kindergarten-Second Grade Restricted-Use Data File.
11
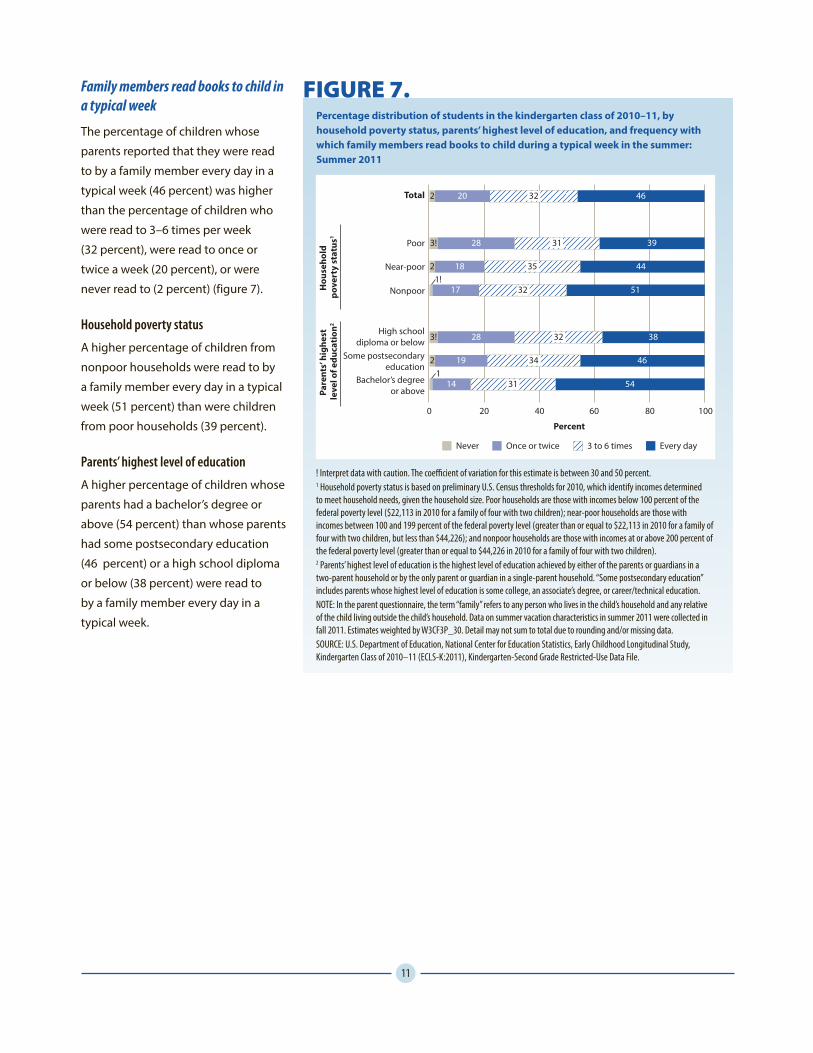
Family members read books to child in a typical week
The percentage of children whose
parents reported that they were read
to by a family member every day in a
typical week (46 percent) was higher
than the percentage of children who
were read to 3–6 times per week
(32 percent), were read to once or
twice a week (20 percent), or were
never read to (2 percent) (figure 7).
Household poverty status
A higher percentage of children from
nonpoor households were read to by
a family member every day in a typical
week (51 percent) than were children
from poor households (39 percent).
Parents’ highest level of education
A higher percentage of children whose
parents had a bachelor’s degree or
above (54 percent) than whose parents
had some postsecondary education
(46 percent) or a high school diploma
or below (38 percent) were read to
by a family member every day in a
typical week.
FIGURE 7.Percentage distribution of students in the kindergarten class of 2010–11, by household poverty status, parents’ highest level of education, and frequency with which family members read books to child during a typical week in the summer: Summer 2011
Hou
seho
ld
pove
rty
stat
us1
Pare
nts’
hig
hest
le
vel o
f edu
cati
on2
High schooldiploma or below
Some postsecondaryeducation
Bachelor’s degreeor above
Total
Poor
Near-poor
Nonpoor
Percent
0 20 40 60 80 100
Never Once or twice 3 to 6 times Every day
2 20 32 46
3! 28 31 39
2 18 35 44
17 32 51
3! 28 32 38
2 19 34 46
14 31 54
1!
1
! Interpret data with caution. The coefficient of variation for this estimate is between 30 and 50 percent.1 Household poverty status is based on preliminary U.S. Census thresholds for 2010, which identify incomes determined to meet household needs, given the household size. Poor households are those with incomes below 100 percent of the federal poverty level ($22,113 in 2010 for a family of four with two children); near-poor households are those with incomes between 100 and 199 percent of the federal poverty level (greater than or equal to $22,113 in 2010 for a family of four with two children, but less than $44,226); and nonpoor households are those with incomes at or above 200 percent of the federal poverty level (greater than or equal to $44,226 in 2010 for a family of four with two children).2 Parents’ highest level of education is the highest level of education achieved by either of the parents or guardians in a two-parent household or by the only parent or guardian in a single-parent household. “Some postsecondary education” includes parents whose highest level of education is some college, an associate’s degree, or career/technical education.NOTE: In the parent questionnaire, the term “family” refers to any person who lives in the child’s household and any relative of the child living outside the child’s household. Data on summer vacation characteristics in summer 2011 were collected in fall 2011. Estimates weighted by W3CF3P_30. Detail may not sum to total due to rounding and/or missing data.SOURCE: U.S. Department of Education, National Center for Education Statistics, Early Childhood Longitudinal Study, Kindergarten Class of 2010–11 (ECLS-K:2011), Kindergarten-Second Grade Restricted-Use Data File.

12
Child looked at or read books on his/her own in a typical week
The percentage of children whose
parents reported that they never
looked at books on their own
(4 percent) was smaller than the
percentages in all other categories
(figure 8). The percentages of children
whose parents reported that they
looked at books on their own once or
twice (27 percent) was smaller than the
percentages of children who looked at
books on their own 3–6 times a week
(35 percent) or every day (33 percent).
Household poverty status
A higher percentage of children from
nonpoor households (37 percent) than
from poor households (32 percent)
looked at or read books on their
own 3–6 times a week. There were
no measurable differences in the
percentage of children who looked
at books on their own every day by
household poverty status.
Parents’ highest level of education
The percentage of children whose
parents had a bachelor’s degree or
above who looked at books on their
own every day (36 percent) or 3-6 times
a week (38 percent) was higher than
the percentage of children in those
categories whose parents had a high
school diploma or below (30 percent
and 32 percent, respectively).
FIGURE 8.Percentage distribution of students in the kindergarten class of 2010–11, by household poverty status, parents’ highest level of education, and frequency with which child looked at or read books on his/her own during a typical week in the summer: Summer 2011
Hou
seho
ld
pove
rty
stat
us1
Pare
nts’
hig
hest
le
vel o
f edu
cati
on2
High schooldiploma or below
Some postsecondaryeducation
Bachelor’s degreeor above
Total
Poor
Near-poor
Nonpoor
Percent
0 20 40 60 80 100
Never Once or twice 3 to 6 times Every day
4 27 35 33
5 31 32 32
4 27 34 35
5 25 37 33
4 33 32 30
5 27 35 33
4 22 38 36
1 Household poverty status is based on preliminary U.S. Census thresholds for 2010, which identify incomes determined to meet household needs, given the household size. Poor households are those with incomes below 100 percent of the federal poverty level ($22,113 in 2010 for a family of four with two children); near-poor households are those with incomes between 100 and 199 percent of the federal poverty level (greater than or equal to $22,113 in 2010 for a family of four with two children, but less than $44,226); and nonpoor households are those with incomes at or above 200 percent of the federal poverty level (greater than or equal to $44,226 in 2010 for a family of four with two children).2 Parents’ highest level of education is the highest level of education achieved by either of the parents or guardians in a two-parent household or by the only parent or guardian in a single-parent household. “Some postsecondary education” includes parents whose highest level of education is some college, an associate’s degree, or career/technical education.NOTE: Data on summer vacation characteristics in summer 2011 were collected in fall 2011. Estimates weighted by W3CF3P_30. Detail may not sum to total due to rounding and/or missing data.SOURCE: U.S. Department of Education, National Center for Education Statistics, Early Childhood Longitudinal Study, Kindergarten Class of 2010–11 (ECLS-K:2011), Kindergarten-Second Grade Restricted-Use Data File.
Child used a computer or other electronic device for educational purposes in a typical week
According to parents, about 16 percent
of children used a computer or other
electronic device for educational
purposes every day during the
summer, compared to 28 percent who
used a computer 3–6 times a week,
35 percent who used a computer once
or twice a week, and 21 percent who
never used a computer (figure 9).

13
Household poverty status
A higher percentage of children
living in near-poor (20 percent) than
in nonpoor (13 percent) households
used a computer for educational
purposes every day. Meanwhile, a
higher percentage of children living
in poor households (32 percent) than
in near-poor (20 percent) or nonpoor
(16 percent) households never used
a computer for educational purposes.
Parents’ highest level of education
There were no measurable differences
in the percentage of children who
used a computer for educational
purposes every day by parents’ highest
level of education. However, a higher
percentage of children whose parents
had a high school diploma or below
(32 percent) than whose parents
had some postsecondary education
(18 percent) or a bachelor’s degree
or above (15 percent) never used a
computer for educational purposes.
FIGURE 9.Percentage distribution of students in the kindergarten class of 2010–11, by household poverty status, parents’ highest level of education, and frequency with which child used a computer or other electronic device for educational purposes during a typical week in the summer: Summer 2011
Hou
seho
ld
pove
rty
stat
us1
Pare
nts’
hig
hest
le
vel o
f edu
cati
on2
High schooldiploma or below
Some postsecondaryeducation
Bachelor’s degreeor above
Total
Poor
Near-poor
Nonpoor
Percent
0 20 40 60 80 100
Never Once or twice 3 to 6 times Every day
21 35 28 16
32 31 20 17
20 31 29 20
16 39 31 13
32 31 19 18
18 33 32 17
15 39 30 15
1 Household poverty status is based on preliminary U.S. Census thresholds for 2010, which identify incomes determined to meet household needs, given the household size. Poor households are those with incomes below 100 percent of the federal poverty level ($22,113 in 2010 for a family of four with two children); near-poor households are those with incomes between 100 and 199 percent of the federal poverty level (greater than or equal to $22,113 in 2010 for a family of four with two children, but less than $44,226); and nonpoor households are those with incomes at or above 200 percent of the federal poverty level (greater than or equal to $44,226 in 2010 for a family of four with two children).2 Parents’ highest level of education is the highest level of education achieved by either of the parents or guardians in a two-parent household or by the only parent or guardian in a single-parent household. “Some postsecondary education” includes parents whose highest level of education is some college, an associate’s degree, or career/technical education.NOTE: Data on summer vacation characteristics in summer 2011 were collected in fall 2011. Estimates weighted by W3CF3P_30. Detail may not sum to total due to rounding and/or missing data.SOURCE: U.S. Department of Education, National Center for Education Statistics, Early Childhood Longitudinal Study, Kindergarten Class of 2010–11 (ECLS-K:2011), Kindergarten-Second Grade Restricted-Use Data File.
Additional summer activities
Table A-3 also shows additional
summer activities, including the
frequency with which children played
outside actively, whether they were
tutored over the summer, and whether
they received a book list from their
school. The percentage of children
whose parents reported that they
played outside actively every day
in a typical week (76 percent) in the
summer after kindergarten was higher
than the percentages who played
outside 3-6 times a week (19 percent)
or once or twice a week (5 percent).
A higher percentage of children living
in poor households (6 percent) than
in nonpoor households (4 percent)
played outside actively once or twice a
week. In addition, a higher percentage
of children whose parents had a high
school diploma or below (6 percent)
than whose parents had some
postsecondary education (4 percent)
or a bachelor’s degree or above
(4 percent) played outside actively
once or twice a week.
About 4 percent of children were
tutored in the summer after
kindergarten. About 28 percent of
children received a book list from
their school with particular books to
read over the summer. No measurable
differences were found by household
poverty status or parents’ education
for children who were tutored over the
summer or received a book list from
their school.
14
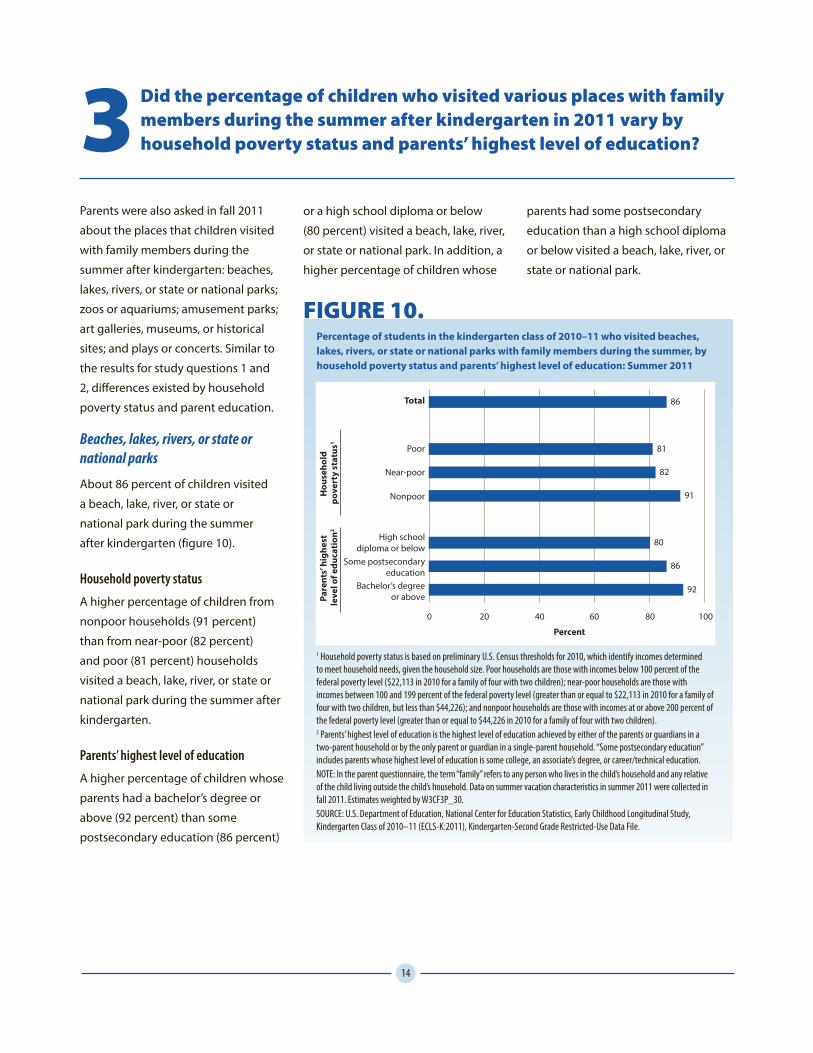
3 Did the percentage of children who visited various places with family members during the summer after kindergarten in 2011 vary by household poverty status and parents’ highest level of education?
Parents were also asked in fall 2011
about the places that children visited
with family members during the
summer after kindergarten: beaches,
lakes, rivers, or state or national parks;
zoos or aquariums; amusement parks;
art galleries, museums, or historical
sites; and plays or concerts. Similar to
the results for study questions 1 and
2, differences existed by household
poverty status and parent education.
Beaches, lakes, rivers, or state or national parks
About 86 percent of children visited
a beach, lake, river, or state or
national park during the summer
after kindergarten (figure 10).
Household poverty status
A higher percentage of children from
nonpoor households (91 percent)
than from near-poor (82 percent)
and poor (81 percent) households
visited a beach, lake, river, or state or
national park during the summer after
kindergarten.
Parents’ highest level of education
A higher percentage of children whose
parents had a bachelor’s degree or
above (92 percent) than some
postsecondary education (86 percent)
or a high school diploma or below
(80 percent) visited a beach, lake, river,
or state or national park. In addition, a
higher percentage of children whose
parents had some postsecondary
education than a high school diploma
or below visited a beach, lake, river, or
state or national park.
FIGURE 10.Percentage of students in the kindergarten class of 2010–11 who visited beaches, lakes, rivers, or state or national parks with family members during the summer, by household poverty status and parents’ highest level of education: Summer 2011
Hou
seho
ld
pove
rty
stat
us1
Pare
nts’
hig
hest
le
vel o
f edu
cati
on2
High schooldiploma or below
Some postsecondaryeducation
Bachelor’s degreeor above
Total
Poor
Near-poor
Nonpoor
Percent
0 20 40 60 80 100
86
81
82
91
80
86
92
1 Household poverty status is based on preliminary U.S. Census thresholds for 2010, which identify incomes determined to meet household needs, given the household size. Poor households are those with incomes below 100 percent of the federal poverty level ($22,113 in 2010 for a family of four with two children); near-poor households are those with incomes between 100 and 199 percent of the federal poverty level (greater than or equal to $22,113 in 2010 for a family of four with two children, but less than $44,226); and nonpoor households are those with incomes at or above 200 percent of the federal poverty level (greater than or equal to $44,226 in 2010 for a family of four with two children).2 Parents’ highest level of education is the highest level of education achieved by either of the parents or guardians in a two-parent household or by the only parent or guardian in a single-parent household. “Some postsecondary education” includes parents whose highest level of education is some college, an associate’s degree, or career/technical education.NOTE: In the parent questionnaire, the term “family” refers to any person who lives in the child’s household and any relative of the child living outside the child’s household. Data on summer vacation characteristics in summer 2011 were collected in fall 2011. Estimates weighted by W3CF3P_30.SOURCE: U.S. Department of Education, National Center for Education Statistics, Early Childhood Longitudinal Study, Kindergarten Class of 2010–11 (ECLS-K:2011), Kindergarten-Second Grade Restricted-Use Data File.

15
Zoos or aquariums
About 64 percent of children visited a
zoo or aquarium during the summer
after kindergarten (figure 11).
Household poverty status
A lower percentage of children from
poor households (54 percent) than
from near-poor (66 percent) and
nonpoor (69 percent) households
went to a zoo or aquarium.
Parents’ highest level of education
A lower percentage of children whose
parents had a high school diploma
or below (54 percent) than children
whose parents had a bachelor’s degree
or above (73 percent) went to a zoo or
aquarium.
FIGURE 11.Percentage of students in the kindergarten class of 2010–11 who went to zoos or aquariums with family members during the summer, by household poverty status and parents’ highest level of education: Summer 2011
Hou
seho
ld
pove
rty
stat
us1
Pare
nts’
hig
hest
le
vel o
f edu
cati
on2
High schooldiploma or below
Some postsecondaryeducation
Bachelor’s degreeor above
Total
Poor
Near-poor
Nonpoor
Percent
0 20 40 60 80 100
64
54
66
69
54
63
73
1 Household poverty status is based on preliminary U.S. Census thresholds for 2010, which identify incomes determined to meet household needs, given the household size. Poor households are those with incomes below 100 percent of the federal poverty level ($22,113 in 2010 for a family of four with two children); near-poor households are those with incomes between 100 and 199 percent of the federal poverty level (greater than or equal to $22,113 in 2010 for a family of four with two children, but less than $44,226); and nonpoor households are those with incomes at or above 200 percent of the federal poverty level (greater than or equal to $44,226 in 2010 for a family of four with two children).2 Parents’ highest level of education is the highest level of education achieved by either of the parents or guardians in a two-parent household or by the only parent or guardian in a single-parent household. “Some postsecondary education” includes parents whose highest level of education is some college, an associate’s degree, or career/technical education.NOTE: In the parent questionnaire, the term “family” refers to any person who lives in the child’s household and any relative of the child living outside the child’s household. Data on summer vacation characteristics in summer 2011 were collected in fall 2011. Estimates weighted by W3CF3P_30.SOURCE: U.S. Department of Education, National Center for Education Statistics, Early Childhood Longitudinal Study, Kindergarten Class of 2010–11 (ECLS-K:2011), Kindergarten-Second Grade Restricted-Use Data File.

16
Amusement parks
About 58 percent of children went
to an amusement park in the summer
after kindergarten (figure 12).
Household poverty status
A lower percentage of children from
poor households (53 percent) than
from nonpoor households (62 percent)
went to an amusement park.
Parents’ highest level of education
There were no measurable differences
in amusement park visits by parents’
level of education.
FIGURE 12.Percentage of students in the kindergarten class of 2010–11 who visited amusement parks with family members during the summer, by household poverty status and parents’ highest level of education: Summer 2011
Hou
seho
ld
pove
rty
stat
us1
Pare
nts’
hig
hest
le
vel o
f edu
cati
on2
High schooldiploma or below
Some postsecondaryeducation
Bachelor’s degreeor above
Total
Poor
Near-poor
Nonpoor
Percent
0 20 40 60 80 100
58
53
59
62
55
56
64
1 Household poverty status is based on preliminary U.S. Census thresholds for 2010, which identify incomes determined to meet household needs, given the household size. Poor households are those with incomes below 100 percent of the federal poverty level ($22,113 in 2010 for a family of four with two children); near-poor households are those with incomes between 100 and 199 percent of the federal poverty level (greater than or equal to $22,113 in 2010 for a family of four with two children, but less than $44,226); and nonpoor households are those with incomes at or above 200 percent of the federal poverty level (greater than or equal to $44,226 in 2010 for a family of four with two children).2 Parents’ highest level of education is the highest level of education achieved by either of the parents or guardians in a two-parent household or by the only parent or guardian in a single-parent household. “Some postsecondary education” includes parents whose highest level of education is some college, an associate’s degree, or career/technical education.NOTE: In the parent questionnaire, the term “family” refers to any person who lives in the child’s household and any relative of the child living outside the child’s household. Data on summer vacation characteristics in summer 2011 were collected in fall 2011. Estimates weighted by W3CF3P_30.SOURCE: U.S. Department of Education, National Center for Education Statistics, Early Childhood Longitudinal Study, Kindergarten Class of 2010–11 (ECLS-K:2011), Kindergarten-Second Grade Restricted-Use Data File.
17
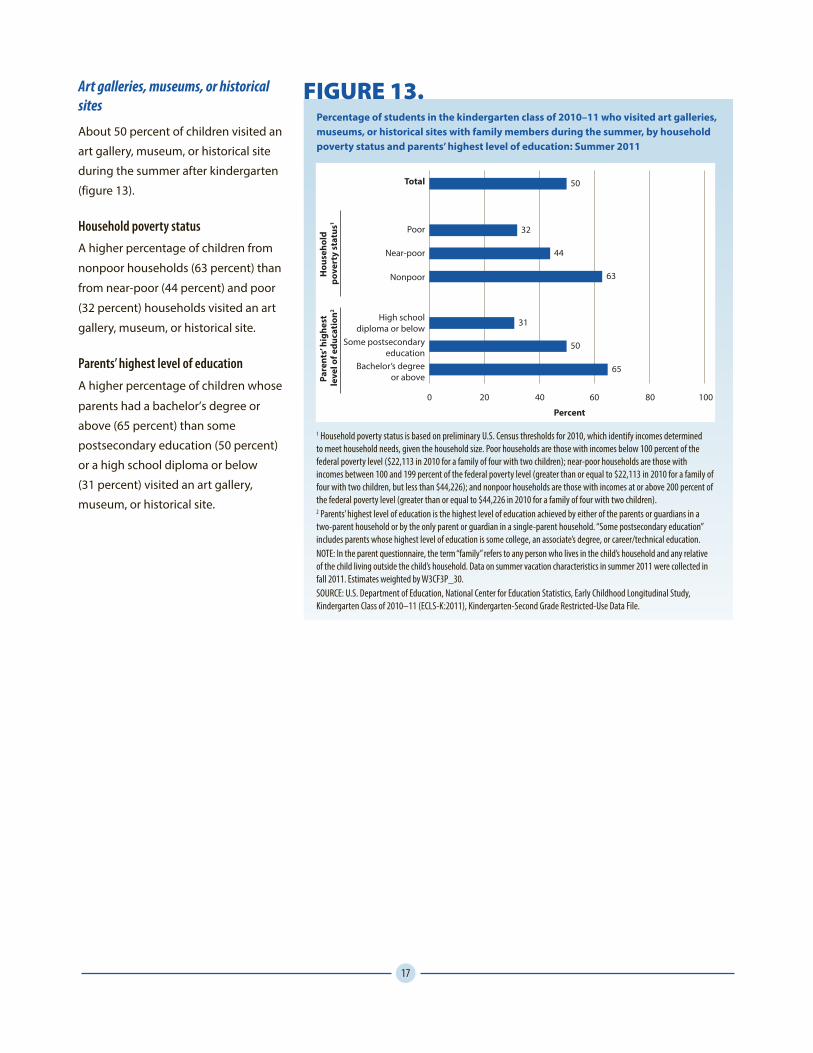
Art galleries, museums, or historical sites
About 50 percent of children visited an
art gallery, museum, or historical site
during the summer after kindergarten
(figure 13).
Household poverty status
A higher percentage of children from
nonpoor households (63 percent) than
from near-poor (44 percent) and poor
(32 percent) households visited an art
gallery, museum, or historical site.
Parents’ highest level of education
A higher percentage of children whose
parents had a bachelor’s degree or
above (65 percent) than some
postsecondary education (50 percent)
or a high school diploma or below
(31 percent) visited an art gallery,
museum, or historical site.
FIGURE 13.Percentage of students in the kindergarten class of 2010–11 who visited art galleries, museums, or historical sites with family members during the summer, by household poverty status and parents’ highest level of education: Summer 2011
Hou
seho
ld
pove
rty
stat
us1
Pare
nts’
hig
hest
le
vel o
f edu
cati
on2
High schooldiploma or below
Some postsecondaryeducation
Bachelor’s degreeor above
Total
Poor
Near-poor
Nonpoor
Percent
0 20 40 60 80 100
50
32
44
63
31
50
65
1 Household poverty status is based on preliminary U.S. Census thresholds for 2010, which identify incomes determined to meet household needs, given the household size. Poor households are those with incomes below 100 percent of the federal poverty level ($22,113 in 2010 for a family of four with two children); near-poor households are those with incomes between 100 and 199 percent of the federal poverty level (greater than or equal to $22,113 in 2010 for a family of four with two children, but less than $44,226); and nonpoor households are those with incomes at or above 200 percent of the federal poverty level (greater than or equal to $44,226 in 2010 for a family of four with two children).2 Parents’ highest level of education is the highest level of education achieved by either of the parents or guardians in a two-parent household or by the only parent or guardian in a single-parent household. “Some postsecondary education” includes parents whose highest level of education is some college, an associate’s degree, or career/technical education.NOTE: In the parent questionnaire, the term “family” refers to any person who lives in the child’s household and any relative of the child living outside the child’s household. Data on summer vacation characteristics in summer 2011 were collected in fall 2011. Estimates weighted by W3CF3P_30.SOURCE: U.S. Department of Education, National Center for Education Statistics, Early Childhood Longitudinal Study, Kindergarten Class of 2010–11 (ECLS-K:2011), Kindergarten-Second Grade Restricted-Use Data File.

18
Plays or concerts
About 25 percent of children went to
a play or concert in the summer after
kindergarten (figure 14).
Household poverty status
A higher percentage of children from
nonpoor households (33 percent) than
from near-poor (19 percent) or poor
(15 percent) households went to a
play or concert.
Parents’ highest level of education
A higher percentage of children whose
parents had a bachelor’s degree or
above (35 percent) than some
postsecondary education (22 percent)
or a high school diploma or below
(15 percent) went to a play or concert.
FIGURE 14.Percentage of students in the kindergarten class of 2010–11 who went to plays or concerts with family members during the summer, by household poverty status and parents’ highest level of education: Summer 2011
Hou
seho
ld
pove
rty
stat
us1
Pare
nts’
hig
hest
le
vel o
f edu
cati
on2
High schooldiploma or below
Some postsecondaryeducation
Bachelor’s degreeor above
Total
Poor
Near-poor
Nonpoor
Percent
0 20 40 60 80 100
25
15
19
33
15
22
35
1 Household poverty status is based on preliminary U.S. Census thresholds for 2010, which identify incomes determined to meet household needs, given the household size. Poor households are those with incomes below 100 percent of the federal poverty level ($22,113 in 2010 for a family of four with two children); near-poor households are those with incomes between 100 and 199 percent of the federal poverty level (greater than or equal to $22,113 in 2010 for a family of four with two children, but less than $44,226); and nonpoor households are those with incomes at or above 200 percent of the federal poverty level (greater than or equal to $44,226 in 2010 for a family of four with two children).2 Parents’ highest level of education is the highest level of education achieved by either of the parents or guardians in a two-parent household or by the only parent or guardian in a single-parent household. “Some postsecondary education” includes parents whose highest level of education is some college, an associate’s degree, or career/technical education.NOTE: In the parent questionnaire, the term “family” refers to any person who lives in the child’s household and any relative of the child living outside the child’s household. Data on summer vacation characteristics in summer 2011 were collected in fall 2011. Estimates weighted by W3CF3P_30.SOURCE: U.S. Department of Education, National Center for Education Statistics, Early Childhood Longitudinal Study, Kindergarten Class of 2010–11 (ECLS-K:2011), Kindergarten-Second Grade Restricted-Use Data File.

19
FIND OUT MOREFor questions about content, to download this Statistics in Brief, or to view this report online, go to:
http://nces.ed.gov/pubsearch/pubsinfo.asp?pubid=2018160
More detailed information on reports produced by the National Center for Education Statistics (NCES) using the Early Childhood Longitudinal Study, Kindergarten Class of 1998–99 (ECLS-K) and Kindergarten Class of 2010–11 (ECLS-K:2011), can be found in the following publications:
Meyer, D., Princiotta, D., and Lanahan, L. (2004). The Summer After Kindergarten: Children’s Activities and Library Use by Household Socioeconomic Status (NCES 2004-037).
Mulligan, G.M., Hastedt, S., and McCarroll, J.C. (2012). First-Time Kindergartners in 2010–11: First Findings From the Kindergarten Rounds of the Early Childhood Longitudinal Study, Kindergarten Class of 2010–11 (ECLS-K:2011) (NCES 2012-049).
Mulligan, G.M., McCarroll, J.C., Flanagan, K.D., and Potter, D. (2014). Findings From the First-Grade Rounds of the Early Childhood Longitudinal Study, Kindergarten Class of 2010–11 (ECLS-K:2011) (NCES 2015-109).
Rathbun, A., and Zhang, A. (2016). Primary Early Care and Education Arrangements and Achievement at Kindergarten Entry (NCES 2016-070).
Walston, J., and McCarroll, J.C. (2010). Eighth-Grade Algebra: Findings From the Eighth-Grade Round of the Early Childhood Longitudinal Study, Kindergarten Class of 1998–99 (ECLS-K) (NCES 2010-016).
Walston, J., and West, J. (2004). Full-Day and Half-Day Kindergarten in the United States: Findings From the Early Childhood Longitudinal Study, Kindergarten Class of 1998–99 (NCES 2004-078).
West, J., Denton, K., and Germino-Hausken, E. (2000). America’s Kindergartners (NCES 2000-070).

20
METHODOLOGY AND TECHNICAL NOTESSurvey Overview and Methodology
The Early Childhood Longitudinal
Study, Kindergarten Class of 2010–11
(ECLS-K:2011) is sponsored by the
National Center for Education Statistics
(NCES) to provide detailed information
on the school achievement and
experiences of students throughout
their elementary school years. The
study follows students longitudinally
from kindergarten (the 2010–11
school year) through the spring of
2016, when most participants were
expected to be in fifth grade. This
sample of students is designed to be
nationally representative of all students
who were enrolled in kindergarten
or who were of kindergarten age
and being educated in an ungraded
classroom or school in the United
States in the 2010–11 school year,
including those in public and private
schools,3
3 Students who attended early learning centers or institutions that offered education only through kindergarten are included in the study sample and represented in the cohort.
those who attended full-day
and part-day programs, those who
were in kindergarten for the first time,
and those who were kindergarten
repeaters.
The ECLS-K:2011 places an emphasis
on measuring students’ experiences
within multiple contexts and
development in multiple domains. The
study is designed to collect information
from students as well as from their
parents and guardians, teachers,
schools, and before- and afterschool
care providers.
Socioeconomic Characteristics Used in the Report
Poverty status [X2POVTY]
The federal poverty level status
composite variable is derived from
household income and the total
number of household members.
Parent respondents first were asked
to report household income using a
standard list of income categories. If a
parent reported a household income
indicating the household was close to
or lower than 200 percent of the U.S.
Census Bureau poverty threshold for a
household of its size, the respondent
was asked to report household income
to the nearest $1,000 (referred to as
exact income).
Poverty classification was determined
using the reported income category,
exact income when necessary, and
household size. Preliminary weighted
2010 Census poverty thresholds
were used to define household
poverty status. Households with
a total income that fell below the
appropriate threshold were classified
as being below the federal poverty
level (labeled poor in this report).
Households with a total income that
was at or above the poverty threshold
but below 200 percent of the poverty
threshold were classified in a middle
category, 100 to 199 percent of the
federal poverty level (labeled near-
poor in this report). Households with a
total income that was at or above 200
percent of the poverty threshold were
categorized as being at 200 percent
of the federal poverty level or above
(labeled nonpoor in this report).
For example, if a household contained
two members with two children and
the household income was lower than
$22,113, the household was classified
as being below the federal poverty
level. If a household with two members
with two children had an income
of $22,113 or more, but less than
$44,226 (200 percent of the poverty
threshold for a household of two with
two children), the household was
classified in the category “100 to 199
percent of the federal poverty level.” If
a household with two members with
two children had an income of $44,226
or more, the household was classified
as being at 200 percent of the federal
poverty level or above.
Parents’ highest level of education [X12PAR1ED_I, X12PAR2ED_I]
Parents’ highest level of education is
the highest level of education achieved
by either of the parents or guardians in
a two-parent household or by the only
parent or guardian in a single-parent
household. This composite is derived
from parent interview information
about parents’ educational attainment.
Data were imputed using a hot-deck
procedure if they were not obtained
during the parent interview but a
parent completed at least a portion
of the parent interview in either the
fall or spring data collection. For this
report, the parent education composite
variable available on the data file
was collapsed into three categories:
high school diploma or below; some
college, associate’s degree, or career/
technical education (referred to as
“some postsecondary education”);
and Bachelor’s degree or above.
21
Sample Design
Base Year
A nationally representative sample of
approximately 18,170 children from
about 1,310 schools4
4 This number includes both schools that were part of the original sample of schools selected for the study (approximately 970) and schools to which children transferred during the base year of the study (approximately 340).
participated in
the base-year administration of the
ECLS-K:2011 in the 2010–11 school
year.
The ECLS-K:2011 cohort was sampled
using a multistage sampling design.
In the first stage, 90 primary sampling
units (PSUs) were selected from a
national sample of PSUs. The PSUs
were counties and county groups. In
the second stage, public and private
schools educating kindergartners
(or ungraded schools educating
children of kindergarten age) were
selected within the PSUs. Finally,
students were sampled from the
selected schools. The schools were
selected from a preliminary version
of the frame developed for the 2010
National Assessment of Educational
Progress (NAEP), which contained
information about public schools that
were included in the 2006–07 Common
Core of Data Public Elementary/
Secondary School Universe Survey and
private schools that were included in
the 2007–08 Private School Universe
Survey. The NAEP frame had not yet
been updated and, therefore, was
not final at the time it was obtained
for use in the ECLS-K:2011. For this
reason, a supplemental frame of newly
opened schools and kindergarten
programs was developed in the spring
of 2010, and a supplemental sample of
schools selected from that frame was
added to the main sample of study
schools in the ECLS-K:2011. In the third
stage of sampling, approximately 23
kindergartners were selected from a
list of all enrolled kindergartners (or
students of kindergarten age being
educated in an ungraded classroom) in
each of the sampled schools.
Fall First Grade
A subsample of students was selected
for the fall first-grade data collection
via a three-step procedure. In the
first step, 30 PSUs were sampled from
the 90 PSUs selected for the base
year. These 90 PSUs consisted of 10
self-representing PSUs (due to their
large population size) and 80 non-self-
representing PSUs selected from 40
strata. The 10 self-representing PSUs
were included in the fall first-grade
sample with certainty. The remaining
20 PSUs were selected from the 80
non-self-representing PSUs. To select
the 20 non-self-representing PSUs,
20 strata were sampled with equal
probability from the 40 strata used to
stratify the 80 non-self-representing
PSUs in the full sample and then one
PSU was sampled within each stratum,
also with equal probability. This is
equivalent to selection with probability
proportional to size since the original
PSU sample was selected with
probability proportional to size.
In the second step, all eligible schools
within the sampled PSUs with students
who were sampled in the base year
were included in the fall first-grade
sample. In the third step, students
attending the subsampled schools who
were respondents in the base year5
5 A base-year respondent has child data—scoreable assessment data or height or weight measurements (or was excluded from assessment due to lack of accommodation for a disability)—or parent interview data from at least one round of data collection in the base year.
and who had not moved outside of the
United States were included as part of
the fall first-grade sample. A subsample
of eligible students who had moved
to another school in the same PSU or
another sampled PSU were assessed
in their new school (or home, if the
student’s new school refused to
participate in the study). An attempt
was made to complete a parent
interview, but not a child assessment,
for students who moved to a PSU that
was not part of the full ECLS-K:2011
sample of 90 PSUs.
Data Collection
Base Year
Parent interviews were conducted
mostly by telephone, although the
interview was conducted in-person
for parents who did not have a
telephone or who preferred an
in-person interview. The respondent
to the parent interview was usually a
parent or guardian in the household
who identified himself or herself
as the person who knew the most
about the child’s care, education, and
health. During the spring kindergarten
data collection round, interviewers
attempted to complete the parent
interview with the same respondent
who answered the parent interview in
the fall kindergarten round; however,
another parent or guardian in the
household who knew about the
child’s care, education, and health was

22
selected if the fall respondent was not
available.
The parent interview was fully
translated into Spanish before data
collection began and could be
administered by bilingual interviewers
if parent respondents preferred to
speak in Spanish. Because it was
cost prohibitive to do so, the parent
interview was not translated into
other languages. However, interviews
could be completed with parents who
spoke other languages by using an
interpreter who translated from the
English during the interview.
Fall First Grade
During the first-grade data collection
rounds, interviewers attempted to
complete the parent interview with the
same respondent who completed the
parent interview in the previous round;
however, another parent or guardian
in the household who knew about the
child’s care, education, and health was
selected if the prior-round respondent
was not available.
Response Rates
The weighted parent unit response
rates were 74 percent for the fall
kindergarten data collection, 67
percent for the spring kindergarten
data collection, and 87 percent for
the fall first-grade data collection.
The overall response rates for the
parent interviews, which also take into
account school-level response, were 47
percent for the fall kindergarten data
collection, 42 percent for the spring
kindergarten data collection, and 54
percent for the fall first-grade data
collection.
NCES statistical standards require that
any survey instrument with a unit
response rate less than 85 percent be
evaluated for potential nonresponse
bias.
Nonresponse bias analyses were
conducted to determine if substantial
bias was introduced as a result of
nonresponse in the kindergarten and
first-grade rounds of data collection.
Three methods were used to examine
the potential for nonresponse bias in
the kindergarten data: (1) a comparison
of estimates from the ECLS-K:2011
schools to those produced using frame
data (i.e., data from the Common Core
of Data and the Private School Universe
Survey); (2) a comparison of estimates
from the ECLS-K:2011 to those from
other data sources (for example, the
National Household Education Surveys
Program); and (3) a comparison of
estimates produced using weights that
include adjustments for nonresponse
to estimates produced using weights
without nonresponse adjustments.
The nonresponse bias analysis for the
first-grade data focused on the third
method.
The findings from the kindergarten
and the first-grade analyses suggest
that there is not a substantial bias due
to nonresponse after adjusting for that
nonresponse. For more information on
the nonresponse bias analyses, refer
to the Early Childhood Longitudinal
Study, Kindergarten Class of 2010–11
(ECLS-K:2011), User’s Manual for the
ECLS-K:2011 Kindergarten Data File
and Electronic Codebook (Tourangeau
et al. 2013) and the Early Childhood
Longitudinal Study, Kindergarten Class
of 2010–11 (ECLS-K:2011), User’s Manual
for the ECLS-K:2011 Kindergarten–First
Grade Data File and Electronic Codebook
(Tourangeau et al. 2014).
Data Reliability
Estimates produced using data from
the ECLS-K:2011 are subject to two
types of error: nonsampling error and
sampling error. Nonsampling errors
are errors made in the collection and
processing of data. Sampling errors
occur because the data are collected
from a sample rather than a census of
the population.
Nonsampling Errors
Nonsampling error is the term
used to describe variations in the
estimates that may be caused by
population coverage limitations, as
well as data collection, processing,
and reporting procedures. The
sources of nonsampling errors are
typically nonresponse, differences in
respondents’ interpretations of the
meaning of survey questions, response
differences related to the particular
time the survey was conducted, and
mistakes in data preparation.
In general, it is difficult to identify
and estimate either the amount of
nonsampling error or the bias caused
by this error. In the ECLS-K:2011, efforts
were made to prevent such errors from
occurring and to compensate for them
where possible (e.g., by field-testing
items and assessments, using survey
questions that had been tested and
used in previous surveys, conducting
multiday assessor/interviewer training,
holding assessor certification sessions,
and monitoring assessor/interviewer

23
performance and field data quality
throughout the collection period).
Another potential source of
nonsampling error is respondent
bias that occurs when respondents
systematically misreport (intentionally
or unintentionally) information in
a study. One potential source of
respondent bias is social desirability
bias, which can result when
respondents provide information
they believe is socially desirable or
acceptable but that does not accurately
reflect the respondents’ characteristics
or experiences. An associated error
occurs when respondents give unduly
positive reports about those close
to them. For example, parents may
overestimate their children’s reading
ability compared to information that
might be obtained from a direct
assessment. If there are no systematic
differences among specific groups
under study in their tendency to
give socially desirable or unduly
positive responses, then comparisons
of the different groups will provide
reasonable measures of relative
differences among the groups.
Sampling Errors and Weighting
The ECLS-K:2011 data are weighted to
compensate for unequal probabilities
of selection at each sampling stage
and to adjust for the effects of school,
teacher, before- and afterschool
care provider, child, and parent
nonresponse. The sample weights
used in the ECLS-K:2011 analyses
were developed in several stages. The
first stage of the weighting process
assigned weights to the sampled
primary sampling units that are equal
to the inverse of the PSU probability
of selection. The second stage of the
weighting process assigned weights to
the schools sampled within selected
PSUs. The base weight for each sampled
school is the PSU weight multiplied
by the inverse of the probability of
the school being selected from the
PSU. The base weights of responding
schools were adjusted to compensate
for nonresponse among the set of
eligible schools. These adjustments
were made separately for public and
private schools.
To compute the base weight for each
student in the sample, the school
nonresponse-adjusted weight for
the school the student attended was
multiplied by the within-school student
weight. The within-school student
weight was calculated separately for
Asian/Pacific Islander (API) students
and non-Asian/Pacific Islander students
to account for oversampling of API
students.6
6 Asians, Native Hawaiians, and Other Pacific Islanders were sampled at a higher rate in order to achieve the minimum sample size required to generate reliable estimates. Although they were oversampled as one group, the numbers of completed interviews for children in the Asian group and children in the Native Hawaiian and Other Pacific Islander group were large enough to produce estimates for each of these two groups separately.
For API students, the within-
school student weight is the total
number of API kindergarten students
in the school divided by the number of
API kindergarten students sampled in
the school. For non-API students, the
within-school student weight is the
total number of non-API kindergarten
students in the school divided by
the number of non-API kindergarten
students sampled in the school. The
student-level base weight was then
adjusted for nonresponse for different
components of the study.
In this brief, estimates were weighted
by W3CF3P_30. The weight is
computed from the child base weight
adjusted for nonresponse associated
with child assessment data from spring
kindergarten and fall first grade, parent
data from fall kindergarten or spring
kindergarten, and parent data from fall
first grade.
In addition to properly weighting the
data in this brief, special procedures for
estimating the statistical significance
of the estimates were employed,
because the data were collected
using a complex sample design. A
complex sample design, like that
used in the ECLS-K:2011, results in
data that violate the assumptions that
are normally required to assess the
statistical significance of results. The
standard errors of the estimates from
complex surveys may vary from those
that would be expected if the sample
were a simple random sample and
the observations were independent
and identically distributed random
variables. Using the statistical software
Stata, the jackknife replication variance
estimation method was used to
compute approximately unbiased
estimates of the standard errors of the
estimates in this brief.
Statistical Procedures
Comparisons made in the text were
tested for statistical significance at
the p < .05 level to ensure that the
differences were larger than might be
expected due to sampling variation.
When comparing estimates within
categorical groups (e.g., sex, race/

24
ethnicity), t statistics were calculated.
The formula used to compute the
t statistic is
t =x2 – x1
√SE2 + SE12 2
where x1 and x2 are the estimates being
compared and SE1 and SE2 are their
corresponding standard errors. No
adjustments were made for multiple
comparisons.
Additional Technical Documentation
For more information, refer to the
Early Childhood Longitudinal Study,
Kindergarten Class of 2010–11
(ECLS-K:2011), User’s Manual for the
ECLS-K:2011 Kindergarten Data File and
Electronic Codebook (Tourangeau et al.
2013); the Early Childhood Longitudinal
Study, Kindergarten Class of 2010–11
(ECLS-K:2011), User’s Manual for the
ECLS-K:2011 Kindergarten–First Grade
Data File and Electronic Codebook
(Tourangeau et al. 2014); and the
Early Childhood Longitudinal Study,
Kindergarten Class of 2010–11
(ECLS-K:2011), User’s Manual for the
ECLS-K:2011 Kindergarten–Second
Grade Data File and Electronic Codebook
(Tourangeau et al. 2015).

25
REFERENCESAlexander, K.L., Entwisle, D.R., and
Olson, L.S. (2007). Lasting Consequences of the Summer Learning Gap. American Sociological Review, 72(April): 167–180.
Burkham, D.T., Ready, D.D., Lee, V.E., and LoGerfo, L.F. (2004). Social-Class Differences in Summer Learning Between Kindergarten and First Grade: Model Specification and Estimation. Sociology of Education 77(January): 1–31.
Downey, D.B., Broh, B.A., and von Hippel, P.T. (2004). Are Schools the Great Equalizer? Cognitive Inequality During the Summer Months and the School Year. American Sociological Review, 69(October): 613–635.
Entwisle, D.R., and Alexander, K.L. (1995). A Parent’s Economic Shadow: Family Structure Versus Family Resources as Influences on Early School Achievement. Journal of Marriage and Family, 57(2): 399–409.
Gershenson, S. (2013). Do Summer Time-Use Gaps Vary by Socioeconomic Status? American Educational Research Journal, 50(6): 1219–1248.
Laughlin, L. (2010). Who’s Minding the Kids? Child Care Arrangements: Spring 2005/Summer 2006. Current Population Reports, P70-121. U.S. Census Bureau, Washington, DC.
Meyer, D., Princiotta, D., and Lanahan, L. (2004). The Summer After Kindergarten: Children’s Activities and Library Use by Household Socioeconomic Status (NCES 2004-037). U.S. Department of Education. Washington, DC: National Center for Education Statistics.
National Forum on Education Statistics. (2015). Forum Guide to Alternative Measures of Socioeconomic Status in Education Data Systems (NFES 2015-158). U.S. Department of Education. Washington, DC: National Center for Education Statistics.
Quinn, D.M., Cooc, N., McIntyre, J., and Gomez, C.J. (2016). Seasonal Dynamics of Academic Achievement Inequality by Socioeconomic Status and Race/Ethnicity: Updating and Extending Past Research With New National Data. Educational Researcher, 45(8): 443–453.
Rathbun, A., and Zhang, A. (2016). Primary Early Care and Education Arrangements and Achievement at Kindergarten Entry (NCES 2016-070). U.S. Department of Education. Washington, DC: National Center for Education Statistics.
Tourangeau, K., Nord, C., Lê, T., Sorongon, A.G., Hagedorn, M.C., Daly, P., and Najarian, M. (2013). Early Childhood Longitudinal Study, Kindergarten Class of 2010–11 (ECLS-K:2011), User’s Manual for the ECLS-K:2011 Kindergarten Data File and Electronic Codebook (NCES 2013-061). U.S. Department of Education. Washington, DC: National Center for Education Statistics.
Tourangeau, K., Nord, C., Lê, T., Wallner-Allen, K., Hagedorn, M.C., Leggitt, J., and Najarian, M. (2014). Early Childhood Longitudinal Study, Kindergarten Class of 2010–11 (ECLS-K:2011), User’s Manual for the ECLS-K:2011 Kindergarten–First Grade Data File and Electronic Codebook (NCES 2015-069). U.S. Department of Education. Washington, DC: National Center for Education Statistics.
Tourangeau, K., Nord, C., Lê, T., Wallner-Allen, K., Hagedorn, M.C., Leggitt, J., and Najarian, M. (2015). Early Childhood Longitudinal Study, Kindergarten Class of 2010–11 (ECLS-K:2011), User’s Manual for the ECLS-K:2011 Kindergarten–Second Grade Data File and Electronic Codebook (NCES 2015-050). U.S. Department of Education. Washington, DC: National Center for Education Statistics.
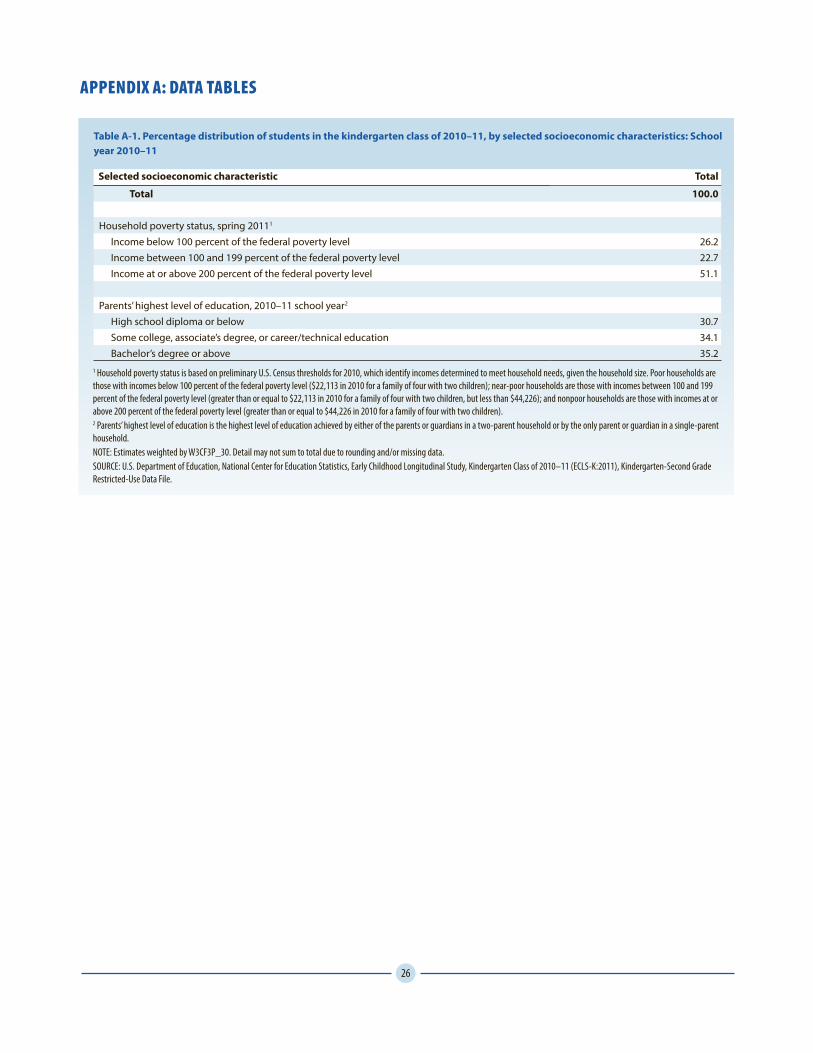
26
APPENDIX A: DATA TABLES
Table A-1. Percentage distribution of students in the kindergarten class of 2010–11, by selected socioeconomic characteristics: School year 2010–11
Selected socioeconomic characteristic Total
Total 100.0
Household poverty status, spring 20111
Income below 100 percent of the federal poverty level 26.2Income between 100 and 199 percent of the federal poverty level 22.7Income at or above 200 percent of the federal poverty level 51.1
Parents’ highest level of education, 2010–11 school year2
High school diploma or below 30.7Some college, associate’s degree, or career/technical education 34.1Bachelor’s degree or above 35.2
1 Household poverty status is based on preliminary U.S. Census thresholds for 2010, which identify incomes determined to meet household needs, given the household size. Poor households are those with incomes below 100 percent of the federal poverty level ($22,113 in 2010 for a family of four with two children); near-poor households are those with incomes between 100 and 199 percent of the federal poverty level (greater than or equal to $22,113 in 2010 for a family of four with two children, but less than $44,226); and nonpoor households are those with incomes at or above 200 percent of the federal poverty level (greater than or equal to $44,226 in 2010 for a family of four with two children). 2 Parents’ highest level of education is the highest level of education achieved by either of the parents or guardians in a two-parent household or by the only parent or guardian in a single-parent household. NOTE: Estimates weighted by W3CF3P_30. Detail may not sum to total due to rounding and/or missing data. SOURCE: U.S. Department of Education, National Center for Education Statistics, Early Childhood Longitudinal Study, Kindergarten Class of 2010–11 (ECLS-K:2011), Kindergarten-Second Grade Restricted-Use Data File.

27
Table A-2. Percentage distribution of students in the kindergarten class of 2010–11, by household poverty status, parents’ highest level of education, and selected summer care and education programs: Summer 2011
Selected summer care and education program Total
Household poverty status, spring 20111
Parents’ highest level of education, 2010–11 school year2
Income below 100 percent of
the federal poverty
level
Income between
100 and 199 percent of
the federal poverty
level
Income at or
above 200 percent of
the federal poverty
level
High school diploma or below
Some college,
associate's degree,
or career/technical
education
Bachelor's degree or
above
Total 100.0 100.0 100.0 100.0 100.0 100.0 100.0
Primary type of nonparental care arrangement during the summer3
Relative care 12.8 9.5 12.9 13.7 13.6 13.0 12.1Nonrelative care 5.6 2.5 4.6 8.3 3.2 5.4 7.8Center care 6.7 4.5 5.8 7.2 4.8 8.9 6.0Multiple care arrangements 0.5 ‡ ‡ 0.8 ‡ 0.4 ! 0.6 !None 74.4 83.1 76.6 70.0 78.0 72.4 73.5
Attended camp during the summer4
Yes, day camp 22.9 7.1 13.1 38.1 6.4 17.6 42.7Yes, overnight camp 0.8 ‡ ‡ 0.8 0.7 0.7 ! 0.9 !No 76.3 92.3 85.8 61.1 92.9 81.7 56.4
Attended summer school or summer enrichment program
Yes 9.6 10.4 10.9 8.0 10.9 8.6 9.0No 90.4 89.6 89.1 92.0 89.1 91.4 91.0
! Interpret data with caution. The coefficient of variation (CV) for this estimate is between 30 and 50 percent. ‡ Reporting standards not met. Either there are too few cases for a reliable estimate or the CV is 50 percent or greater. 1 Household poverty status is based on preliminary U.S. Census thresholds for 2010, which identify incomes determined to meet household needs, given the household size. Poor households are those with incomes below 100 percent of the federal poverty level ($22,113 in 2010 for a family of four with two children); near-poor households are those with incomes between 100 and 199 percent of the federal poverty level (greater than or equal to $22,113 in 2010 for a family of four with two children, but less than $44,226); and nonpoor households are those with incomes at or above 200 percent of the federal poverty level (greater than or equal to $44,226 in 2010 for a family of four with two children). 2 Parents’ highest level of education is the highest level of education achieved by either of the parents or guardians in a two-parent household or by the only parent or guardian in a single-parent household. 3 Nonparental care arrangements include child care provided on a regular basis by someone other than a parent or guardian. This does not include occasional babysitting or backup care providers. It also does not include summer camp. “Center care” includes child care from day care centers or extended day programs. “Multiple care arrangements” is care provided in equal amounts of time in each of two or more types of care arrangements. “None” includes children who did not attend any care arrangements on a regular basis. Their primary care arrangement is with their parents. 4 Students were categorized as attending an overnight camp if they attended camp 24 hours per day, as reported by parents. NOTE: Data on summer vacation characteristics in summer 2011 were collected in fall 2011. Estimates weighted by W3CF3P_30. Detail may not sum to total due to rounding and/or missing data.SOURCE: U.S. Department of Education, National Center for Education Statistics, Early Childhood Longitudinal Study, Kindergarten Class of 2010–11 (ECLS-K:2011), Kindergarten-Second Grade Restricted-Use Data File.
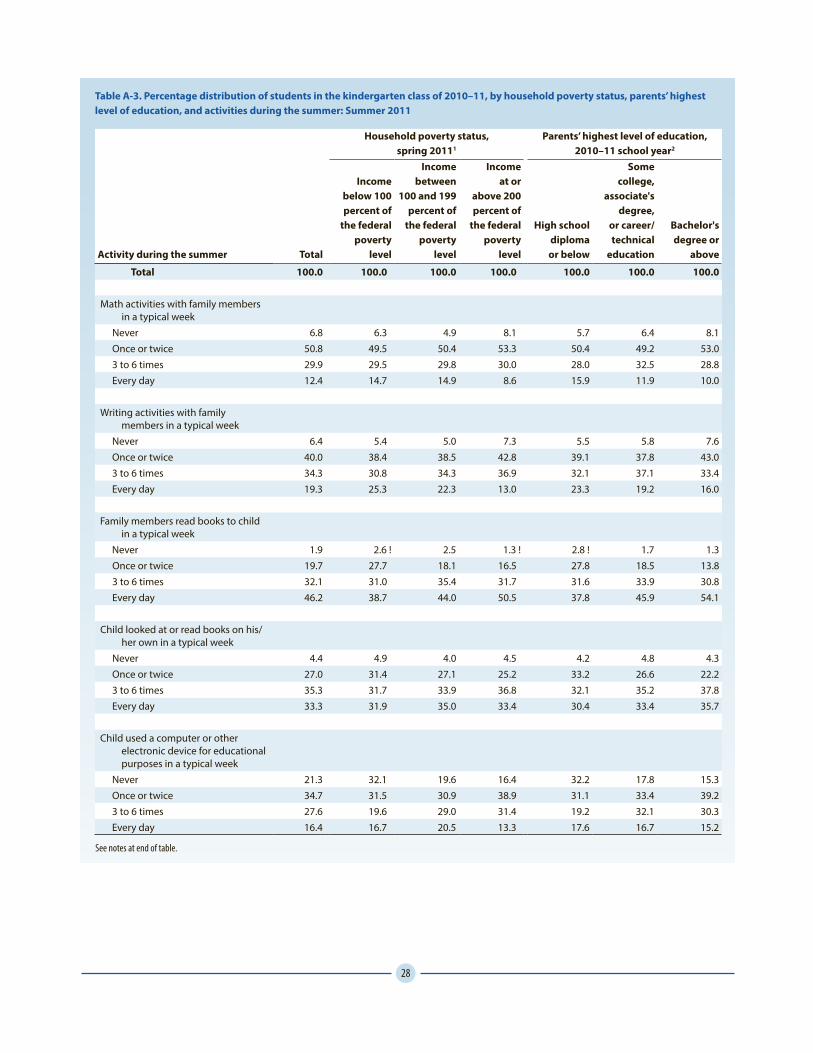
28
Table A-3. Percentage distribution of students in the kindergarten class of 2010–11, by household poverty status, parents’ highest level of education, and activities during the summer: Summer 2011
Activity during the summer Total
Household poverty status, spring 20111
Parents’ highest level of education, 2010–11 school year2
Income below 100 percent of
the federal poverty
level
Income between
100 and 199 percent of
the federal poverty
level
Income at or
above 200 percent of
the federal poverty
level
High school diploma or below
Some college,
associate's degree,
or career/technical
education
Bachelor's degree or
above
Total 100.0 100.0 100.0 100.0 100.0 100.0 100.0
Math activities with family members in a typical week
Never 6.8 6.3 4.9 8.1 5.7 6.4 8.1Once or twice 50.8 49.5 50.4 53.3 50.4 49.2 53.03 to 6 times 29.9 29.5 29.8 30.0 28.0 32.5 28.8Every day 12.4 14.7 14.9 8.6 15.9 11.9 10.0
Writing activities with family members in a typical week
Never 6.4 5.4 5.0 7.3 5.5 5.8 7.6Once or twice 40.0 38.4 38.5 42.8 39.1 37.8 43.03 to 6 times 34.3 30.8 34.3 36.9 32.1 37.1 33.4Every day 19.3 25.3 22.3 13.0 23.3 19.2 16.0
Family members read books to child in a typical week
Never 1.9 2.6 ! 2.5 1.3 ! 2.8 ! 1.7 1.3Once or twice 19.7 27.7 18.1 16.5 27.8 18.5 13.83 to 6 times 32.1 31.0 35.4 31.7 31.6 33.9 30.8Every day 46.2 38.7 44.0 50.5 37.8 45.9 54.1
Child looked at or read books on his/her own in a typical week
Never 4.4 4.9 4.0 4.5 4.2 4.8 4.3Once or twice 27.0 31.4 27.1 25.2 33.2 26.6 22.23 to 6 times 35.3 31.7 33.9 36.8 32.1 35.2 37.8Every day 33.3 31.9 35.0 33.4 30.4 33.4 35.7
Child used a computer or other electronic device for educational purposes in a typical week
Never 21.3 32.1 19.6 16.4 32.2 17.8 15.3Once or twice 34.7 31.5 30.9 38.9 31.1 33.4 39.23 to 6 times 27.6 19.6 29.0 31.4 19.2 32.1 30.3Every day 16.4 16.7 20.5 13.3 17.6 16.7 15.2
See notes at end of table.
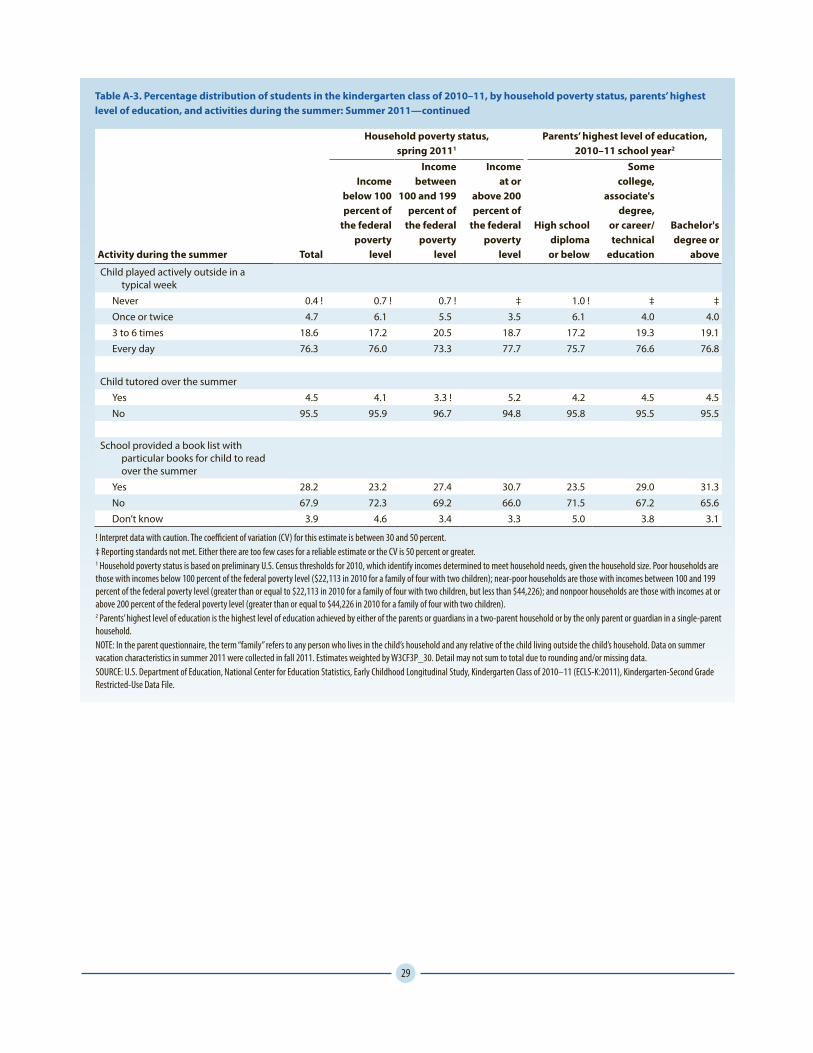
29
Table A-3. Percentage distribution of students in the kindergarten class of 2010–11, by household poverty status, parents’ highest level of education, and activities during the summer: Summer 2011—continued
Activity during the summer Total
Household poverty status, spring 20111
Parents’ highest level of education, 2010–11 school year2
Income below 100 percent of
the federal poverty
level
Income between
100 and 199 percent of
the federal poverty
level
Income at or
above 200 percent of
the federal poverty
level
High school diploma or below
Some college,
associate's degree,
or career/technical
education
Bachelor's degree or
above
Child played actively outside in a typical week
Never 0.4 ! 0.7 ! 0.7 ! ‡ 1.0 ! ‡ ‡Once or twice 4.7 6.1 5.5 3.5 6.1 4.0 4.03 to 6 times 18.6 17.2 20.5 18.7 17.2 19.3 19.1Every day 76.3 76.0 73.3 77.7 75.7 76.6 76.8
Child tutored over the summerYes 4.5 4.1 3.3 ! 5.2 4.2 4.5 4.5No 95.5 95.9 96.7 94.8 95.8 95.5 95.5
School provided a book list with particular books for child to read over the summer
Yes 28.2 23.2 27.4 30.7 23.5 29.0 31.3No 67.9 72.3 69.2 66.0 71.5 67.2 65.6Don’t know 3.9 4.6 3.4 3.3 5.0 3.8 3.1
! Interpret data with caution. The coefficient of variation (CV) for this estimate is between 30 and 50 percent. ‡ Reporting standards not met. Either there are too few cases for a reliable estimate or the CV is 50 percent or greater. 1 Household poverty status is based on preliminary U.S. Census thresholds for 2010, which identify incomes determined to meet household needs, given the household size. Poor households are those with incomes below 100 percent of the federal poverty level ($22,113 in 2010 for a family of four with two children); near-poor households are those with incomes between 100 and 199 percent of the federal poverty level (greater than or equal to $22,113 in 2010 for a family of four with two children, but less than $44,226); and nonpoor households are those with incomes at or above 200 percent of the federal poverty level (greater than or equal to $44,226 in 2010 for a family of four with two children). 2 Parents’ highest level of education is the highest level of education achieved by either of the parents or guardians in a two-parent household or by the only parent or guardian in a single-parent household. NOTE: In the parent questionnaire, the term “family” refers to any person who lives in the child’s household and any relative of the child living outside the child’s household. Data on summer vacation characteristics in summer 2011 were collected in fall 2011. Estimates weighted by W3CF3P_30. Detail may not sum to total due to rounding and/or missing data. SOURCE: U.S. Department of Education, National Center for Education Statistics, Early Childhood Longitudinal Study, Kindergarten Class of 2010–11 (ECLS-K:2011), Kindergarten-Second Grade Restricted-Use Data File.
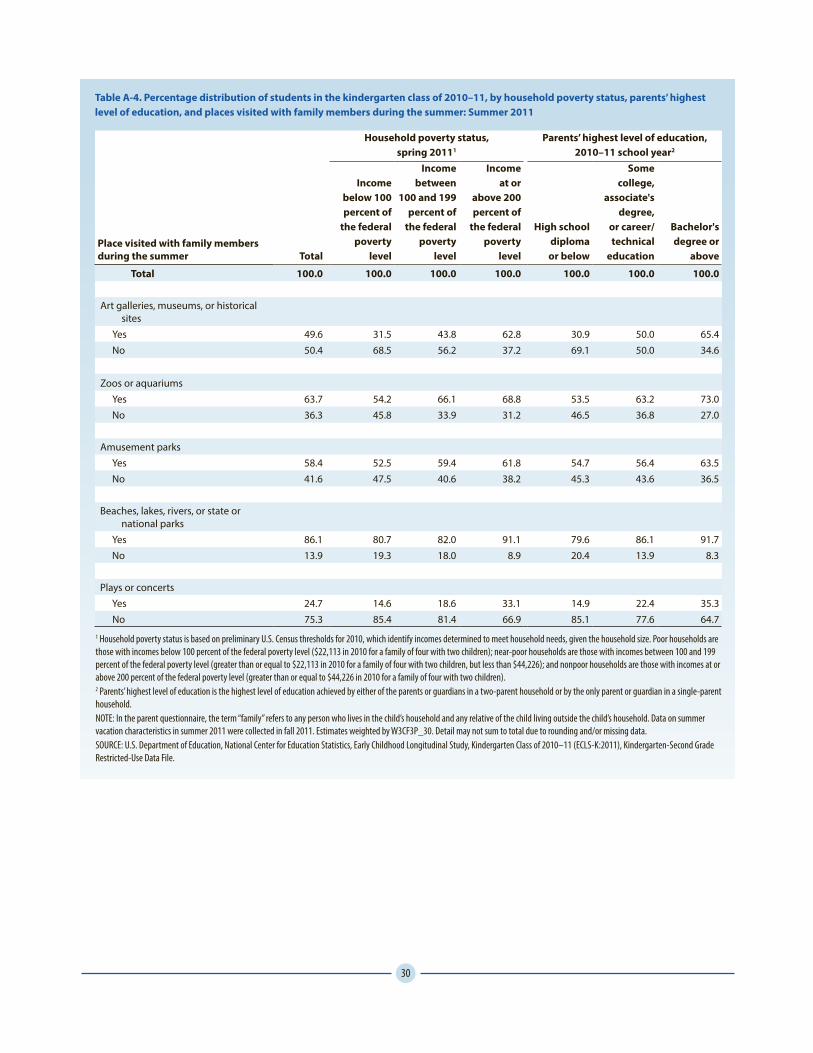
30
Table A-4. Percentage distribution of students in the kindergarten class of 2010–11, by household poverty status, parents’ highest level of education, and places visited with family members during the summer: Summer 2011
Place visited with family members during the summer Total
Household poverty status, spring 20111
Parents’ highest level of education, 2010–11 school year2
Income below 100 percent of
the federal poverty
level
Income between
100 and 199 percent of
the federal poverty
level
Income at or
above 200 percent of
the federal poverty
level
High school diploma or below
Some college,
associate's degree,
or career/technical
education
Bachelor's degree or
above
Total 100.0 100.0 100.0 100.0 100.0 100.0 100.0
Art galleries, museums, or historical sites
Yes 49.6 31.5 43.8 62.8 30.9 50.0 65.4No 50.4 68.5 56.2 37.2 69.1 50.0 34.6
Zoos or aquariumsYes 63.7 54.2 66.1 68.8 53.5 63.2 73.0No 36.3 45.8 33.9 31.2 46.5 36.8 27.0
Amusement parksYes 58.4 52.5 59.4 61.8 54.7 56.4 63.5No 41.6 47.5 40.6 38.2 45.3 43.6 36.5
Beaches, lakes, rivers, or state or national parks
Yes 86.1 80.7 82.0 91.1 79.6 86.1 91.7No 13.9 19.3 18.0 8.9 20.4 13.9 8.3
Plays or concertsYes 24.7 14.6 18.6 33.1 14.9 22.4 35.3No 75.3 85.4 81.4 66.9 85.1 77.6 64.7
1 Household poverty status is based on preliminary U.S. Census thresholds for 2010, which identify incomes determined to meet household needs, given the household size. Poor households are those with incomes below 100 percent of the federal poverty level ($22,113 in 2010 for a family of four with two children); near-poor households are those with incomes between 100 and 199 percent of the federal poverty level (greater than or equal to $22,113 in 2010 for a family of four with two children, but less than $44,226); and nonpoor households are those with incomes at or above 200 percent of the federal poverty level (greater than or equal to $44,226 in 2010 for a family of four with two children). 2 Parents’ highest level of education is the highest level of education achieved by either of the parents or guardians in a two-parent household or by the only parent or guardian in a single-parent household. NOTE: In the parent questionnaire, the term “family” refers to any person who lives in the child’s household and any relative of the child living outside the child’s household. Data on summer vacation characteristics in summer 2011 were collected in fall 2011. Estimates weighted by W3CF3P_30. Detail may not sum to total due to rounding and/or missing data. SOURCE: U.S. Department of Education, National Center for Education Statistics, Early Childhood Longitudinal Study, Kindergarten Class of 2010–11 (ECLS-K:2011), Kindergarten-Second Grade Restricted-Use Data File.
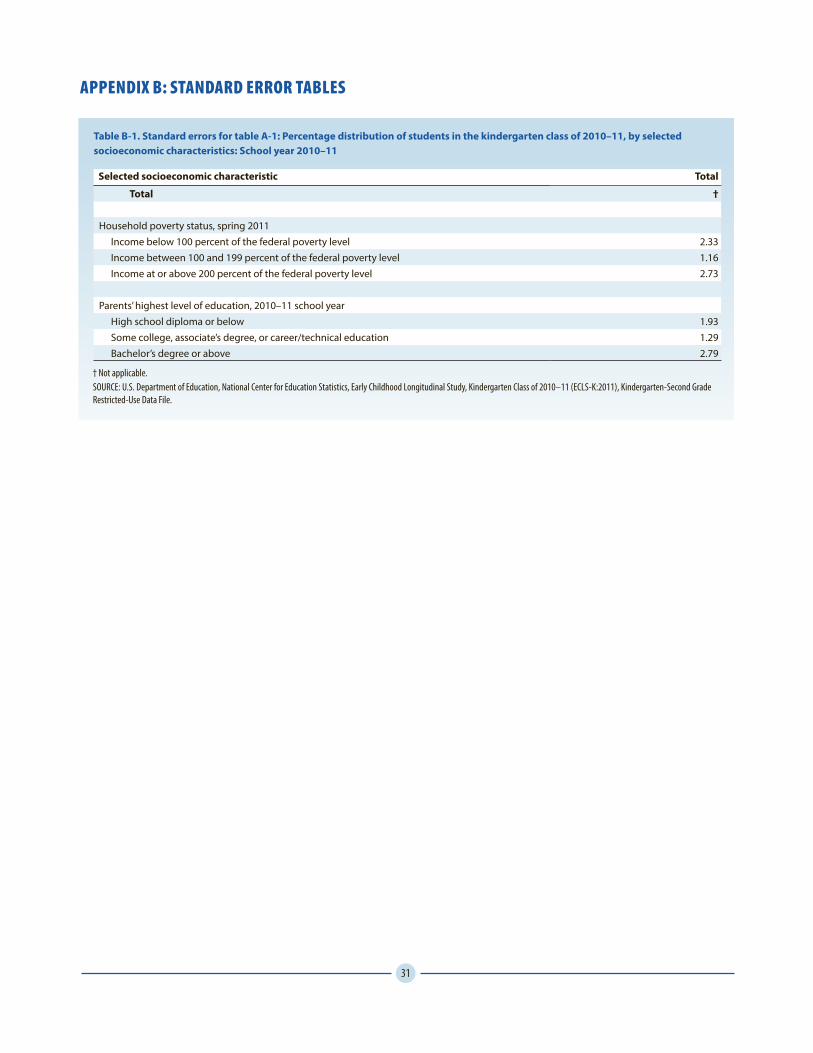
31
APPENDIX B: STANDARD ERROR TABLES
Table B-1. Standard errors for table A-1: Percentage distribution of students in the kindergarten class of 2010–11, by selected socioeconomic characteristics: School year 2010–11
Selected socioeconomic characteristic Total
Total †
Household poverty status, spring 2011Income below 100 percent of the federal poverty level 2.33Income between 100 and 199 percent of the federal poverty level 1.16Income at or above 200 percent of the federal poverty level 2.73
Parents’ highest level of education, 2010–11 school yearHigh school diploma or below 1.93Some college, associate’s degree, or career/technical education 1.29Bachelor’s degree or above 2.79
† Not applicable.SOURCE: U.S. Department of Education, National Center for Education Statistics, Early Childhood Longitudinal Study, Kindergarten Class of 2010–11 (ECLS-K:2011), Kindergarten-Second Grade Restricted-Use Data File.

32
Table B-2. Standard errors for table A-2: Percentage distribution of students in the kindergarten class of 2010–11, by household poverty status, parents’ highest level of education, and selected summer care and education programs: Summer 2011
Selected summer care and education program Total
Household poverty status, spring 2011
Parents’ highest level of education, 2010–11 school year
Income below 100 percent of
the federal poverty
level
Income between
100 and 199 percent of
the federal poverty
level
Income at or
above 200 percent of
the federal poverty
level
High school diploma or below
Some college,
associate's degree,
or career/technical
education
Bachelor's degree or
above
Total † † † † † † †
Primary type of nonparental care arrangement during the summer
Relative care 0.92 1.36 1.22 1.22 1.35 1.85 1.41Nonrelative care 0.89 0.76 0.97 1.54 0.78 1.04 1.31Center care 0.59 0.89 1.06 0.80 1.00 0.96 0.80Multiple care arrangements 0.11 † † 0.21 † 0.15 0.28None 1.24 1.39 1.58 1.79 1.52 1.31 1.94
Attended camp during the summerYes, day camp 1.67 1.68 1.88 1.57 1.09 1.49 1.59Yes, overnight camp 0.13 † † 0.23 0.17 0.30 0.38No 1.69 1.78 1.98 1.70 1.14 1.39 1.67
Attended summer school or summer enrichment program
Yes 1.00 1.63 1.48 1.13 1.70 1.06 1.25No 1.00 1.63 1.48 1.13 1.70 1.06 1.25
† Not applicable.SOURCE: U.S. Department of Education, National Center for Education Statistics, Early Childhood Longitudinal Study, Kindergarten Class of 2010–11 (ECLS-K:2011), Kindergarten-Second Grade Restricted-Use Data File.

33
Table B-3. Standard errors for table A-3: Percentage distribution of students in the kindergarten class of 2010–11, by household poverty status, parents’ highest level of education, and activities during the summer: Summer 2011
Activity during the summer Total
Household poverty status, spring 2011
Parents’ highest level of education, 2010–11 school year
Income below 100 percent of
the federal poverty
level
Income between
100 and 199 percent of
the federal poverty
level
Income at or
above 200 percent of
the federal poverty
level
High school diploma or below
Some college,
associate's degree,
or career/technical
education
Bachelor's degree or
above
Total † † † † † † †
Math activities with family members in a typical week
Never 0.62 1.10 1.12 0.81 0.95 1.69 1.07Once or twice 0.79 2.62 1.76 1.06 1.51 1.27 1.663 to 6 times 0.69 1.57 1.92 1.10 2.10 1.19 1.41Every day 0.70 1.51 2.59 0.85 1.65 1.18 1.07
Writing activities with family members in a typical week
Never 0.69 1.10 1.05 0.83 1.02 1.42 0.94Once or twice 0.84 2.18 2.34 1.25 1.78 2.30 2.433 to 6 times 0.90 1.99 2.71 1.11 2.06 1.92 1.51Every day 0.92 2.08 1.67 0.76 2.00 0.98 1.51
Family members read books to child in a typical week
Never 0.39 1.02 0.60 0.40 0.87 0.51 0.26Once or twice 1.00 2.02 1.90 1.06 1.75 1.77 1.523 to 6 times 1.05 1.62 2.13 1.46 2.18 1.70 1.02Every day 1.73 3.56 3.22 1.58 2.96 2.40 2.12
Child looked at or read books on his/her own in a typical week
Never 0.44 0.79 0.77 0.60 0.72 0.62 0.83Once or twice 1.18 2.83 3.22 1.80 1.79 2.26 2.163 to 6 times 0.83 2.06 2.08 1.52 0.78 1.65 1.56Every day 1.40 2.59 2.19 1.72 1.58 2.46 1.63
Child used a computer or other electronic device for educational purposes in a typical week
Never 1.80 2.64 2.29 1.37 2.88 2.42 1.53Once or twice 1.01 2.15 1.75 1.60 1.88 1.20 1.333 to 6 times 1.06 1.52 1.69 1.27 1.31 2.17 0.49Every day 1.37 2.45 1.61 1.40 1.98 1.70 1.90
See notes at end of table.
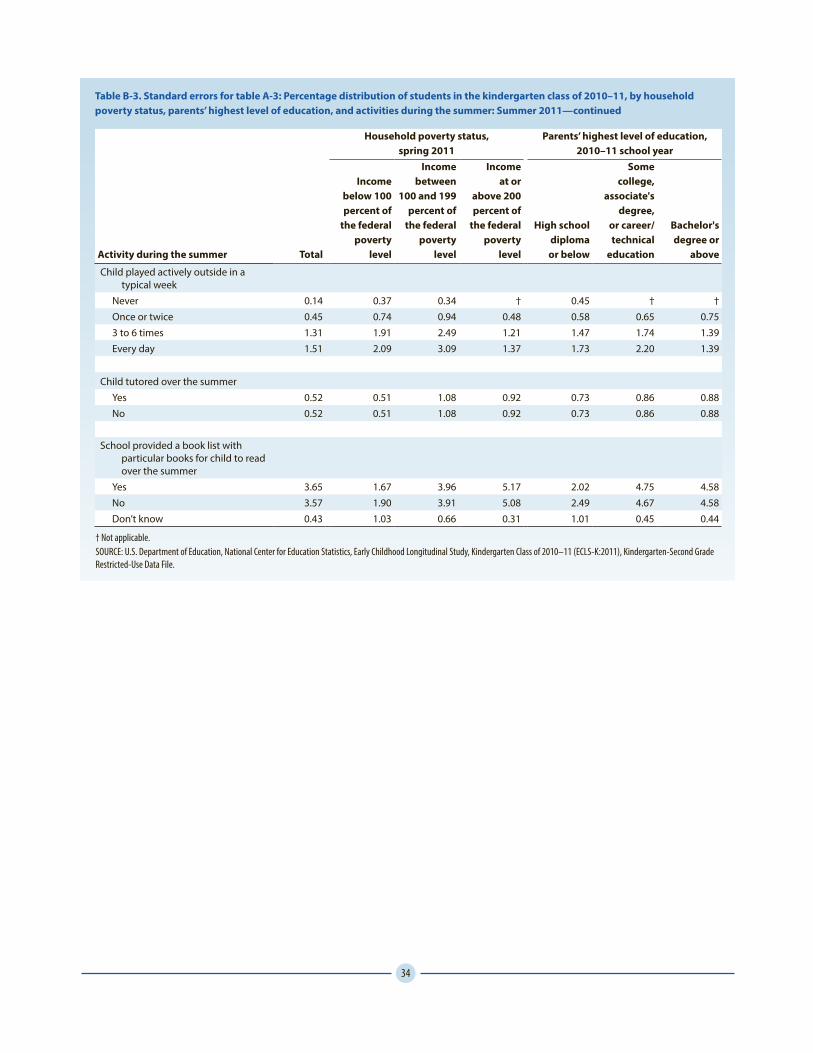
34
Table B-3. Standard errors for table A-3: Percentage distribution of students in the kindergarten class of 2010–11, by household poverty status, parents’ highest level of education, and activities during the summer: Summer 2011—continued
Activity during the summer Total
Household poverty status, spring 2011
Parents’ highest level of education, 2010–11 school year
Income below 100 percent of
the federal poverty
level
Income between
100 and 199 percent of
the federal poverty
level
Income at or
above 200 percent of
the federal poverty
level
High school diploma or below
Some college,
associate's degree,
or career/technical
education
Bachelor's degree or
above
Child played actively outside in a typical week
Never 0.14 0.37 0.34 † 0.45 † †Once or twice 0.45 0.74 0.94 0.48 0.58 0.65 0.753 to 6 times 1.31 1.91 2.49 1.21 1.47 1.74 1.39Every day 1.51 2.09 3.09 1.37 1.73 2.20 1.39
Child tutored over the summerYes 0.52 0.51 1.08 0.92 0.73 0.86 0.88No 0.52 0.51 1.08 0.92 0.73 0.86 0.88
School provided a book list with particular books for child to read over the summer
Yes 3.65 1.67 3.96 5.17 2.02 4.75 4.58No 3.57 1.90 3.91 5.08 2.49 4.67 4.58Don’t know 0.43 1.03 0.66 0.31 1.01 0.45 0.44
† Not applicable. SOURCE: U.S. Department of Education, National Center for Education Statistics, Early Childhood Longitudinal Study, Kindergarten Class of 2010–11 (ECLS-K:2011), Kindergarten-Second Grade Restricted-Use Data File.

35
Table B-4. Standard errors for table A-4: Percentage distribution of students in the kindergarten class of 2010–11, by household poverty status, parents’ highest level of education, and places visited with family members during the summer: Summer 2011
Place visited with family members during the summer Total
Household poverty status, spring 2011
Parents’ highest level of education, 2010–11 school year
Income below 100 percent of
the federal poverty
level
Income between
100 and 199 percent of
the federal poverty
level
Income at or
above 200 percent of
the federal poverty
level
High school diploma or below
Some college,
associate's degree,
or career/technical
education
Bachelor's degree or
above
Total † † † † † † †
Art galleries, museums, or historical sites
Yes 2.65 2.41 3.78 2.34 2.50 2.83 2.54No 2.65 2.41 3.78 2.34 2.50 2.83 2.54
Zoos or aquariumsYes 3.33 3.40 4.62 3.16 3.61 3.75 3.32No 3.33 3.40 4.62 3.16 3.61 3.75 3.32
Amusement parksYes 1.52 2.42 2.66 3.03 2.38 1.63 4.01No 1.52 2.42 2.66 3.03 2.38 1.63 4.01
Beaches, lakes, rivers, or state or national parks
Yes 1.45 1.53 2.28 1.45 1.09 1.88 1.55No 1.45 1.53 2.28 1.45 1.09 1.88 1.55
Plays or concertsYes 1.83 1.96 3.01 1.67 1.04 1.93 2.29No 1.83 1.96 3.01 1.67 1.04 1.93 2.29
† Not applicable. SOURCE: U.S. Department of Education, National Center for Education Statistics, Early Childhood Longitudinal Study, Kindergarten Class of 2010–11 (ECLS-K:2011), Kindergarten-Second Grade Restricted-Use Data File.