Embed Size (px)
Citation preview
STATS IN BRIEF U.S. DEPARTMENT OF EDUCATION APRIL 2013 NCES 2013-155
Federal Student Loan Debt Burden of Noncompleters
AUTHORS
Christina Chang Wei Laura Horn MPR Associates, Inc.
PROJECT OFFICER
Matthew Soldner National Center for Education Statistics
Statistics in Brief publications present descriptive data in tabu-lar formats to provide useful information to a broad audience, including members of the general public. They address simple and topical issues and questions. They do not investigate more complex hypotheses, account for inter-relationships among variables, or sup-port causal inferences. We encourage readers who are interested in more complex questions and in-depth analysis to explore other NCES resources, including publications, online data tools, and public- and restricted-use datasets. See nces.ed.gov and references noted in the body of this document for more information.
This report was prepared for the National Center for Education Statistics under Contract No. ED-07-CO-0104 with MPR Associates, Inc. Mention of trade names, commercial products, or organizations does not imply endorsement by the U.S. Government.
Nearly half of all undergraduates take out student loans over the course of
their enrollment to help them pay for their
postsecondary education; this includes
nearly two-thirds of students who attend
private nonprofit 4-year colleges and
about 90 percent of students enrolled in
for-profit institutions (Wei and Skomsvold
2011, table 1). In the decade between
2000–01 and 2010–11, total borrowing
per full-time-equivalent (FTE) undergrad-
uate student increased by 56 percent
(Baum and Payea 2011). While student
loans improve access to postsecondary
education, repaying them has become in-
creasingly difficult for students who are
unemployed, underemployed, or who
earn a limited income; furthermore, these
circumstances are more common among
students who do not complete a degree
than among those who do (Gladieux and
Perna 2005; Nguyen 2012). Several studies
and government reports have highlighted
the problems of heavy borrowing, high
default rates, and unmanageable debt
among students who graduate from
postsecondary education with a degree or
credential (Choy and Li 2006; GAO 2009;
Rothstein and Rouse 2011).
This Statistics in Brief focuses on students
who do not complete a postsecondary
credential and the substantial federal
2
education debt they accrue.1 Specific-
ally, the analysis compares the cumula-
tive debt from Stafford and Perkins
loan programs of students who did not
complete a degree within 6 years of
first enrolling (noncompleters) with that
of their counterparts who did complete
(completers). Students still enrolled in
postsecondary education after 6 years
are not included because many of
these students have not yet entered
repayment or formally entered the
labor force and lack sufficient income
data for a key measure used in the
analysis (the total-federal-debt-to-
annual-income ratio, explained below).
These students constitute 15 percent
of beginning postsecondary students
in 2009 and 14 percent in 2001
(Berkner, He, and Cataldi 2002;
Skomsvold, Radford, and Berkner 2011,
table 2.0A).
The study is based on data from the
two most recent cohorts of first-time
beginning postsecondary students
surveyed by the National Center for
Education Statistics (NCES): students
who began postsecondary education
in 1995–96 and those who began in
2003–04. Each cohort was followed for
6 years, with final data collection for
each cohort occurring in 2001 and
2009, respectively. The sampled stu-
dents were identified in the 1995–96
and 2003–04 National Postsecondary
Student Aid Studies (NPSAS),
1 The analysis is limited to federal student loan debt because data on private borrowing are available only for the 2003–04 cohort and were provided by respondents. In contrast, adminis-trative data on federal borrowing, which are more reliable than student-provided data, are available from the National Student Loan Data System for both cohorts.
respectively, and followed up in the
corresponding Beginning Postsecond-
ary Students (BPS) Longitudinal Studies
(BPS:95/01 and BPS:04/09).
Measures of borrowing and debt
analyzed in the study include the fol-
lowing: the percentage of students
who borrowed from federal loan pro-
grams (Stafford and Perkins), the
average cumulative amount borrowed
through those programs, and the aver-
age federal amount borrowed per
credit earned. Throughout this report,
cumulative or total debt refers to debt
from federal Stafford and Perkins loan
programs accrued throughout stu-
dents’ enrollment over the 6-year study
period regardless of whether they were
enrolled continuously.
A key measure analyzed in the study is
debt burden, defined as the ratio of
borrowers’ cumulative federal debt to
their annual income, or total-federal-
debt-to-annual-income ratio, 6 years af-
ter they first enrolled. The concept of
debt-to-income ratio, referring to
monthly loan repayments relative to
monthly earnings, has been widely
used in past research (Baum and Saun-
ders 1998; Choy and Li 2006; Gladieux
and Perna 2005). In contrast, the cur-
rent study uses total federal student
loan debt relative to annual income in
order to capture debt burden for all
borrowers.
Although the total-federal-debt-to-
annual-income ratio used in this study
has not, to our knowledge, been used
in prior scholarship, we prefer it to
other commonly used metrics for
two reasons. Foremost, monthly loan
payments can be zero under many cir-
cumstances, even when borrowers still
owe. For example, borrowers may be in
the 6-month grace period, have ob-
tained a hardship deferment, be in
forbearance, have defaulted, or now
increasingly, be participating in the In-
come-Based Repayment program. In
each of these cases, the monthly pay-
ment is zero, but the total loan remains
to be repaid and usually continues to
accrue interest.
Second, the total-federal-debt-to-
annual-income ratio allows for the in-
clusion of unemployed borrowers.
This is important both for analyzing
changes over time and because
noncompleters, the focus of this study,
tend to have relatively high unem-
ployment rates. When analyzing
changes over time, it is important to
take into account circumstances that
might affect the metric’s numerator,
denominator, and the underlying pop-
ulation. For example, if the unemploy-
ment rate changes between cohorts,
the underlying population of students
in repayment changes as well. This
change cannot be accounted for by us-
ing the monthly repayment metric,
which excludes unemployed borrow-
ers. Therefore, the current study, which
includes employed and unemployed
borrowers and analyzes changes be-
tween two cohorts, uses the total-
federal-debt-to-annual-income ratio.
By definition, unemployed borrowers
have zero earnings. In order to be able
to estimate a ratio and include them in
3
the analyses, their total-federal-debt-
to-annual-income ratio was set to 100.
A limitation to this approach is the
inability to distinguish between unem-
ployed borrowers with zero income
and employed borrowers with a total
debt equal to or exceeding 100 per-
cent of their income. Therefore, the
report includes data on the percentage
of borrowers with a debt burden of 100
percent who were unemployed (bot-
tom of figure 8 on page 12).
In addition, the specific total-federal-
debt-to-annual-income ratio variable
used here is also of value because one
component—total federal debt—is de-
rived from the National Student Loan
Data System (NSLDS) and may there-
fore be more reliable than ratios
created entirely from student-reported
data, the typical source of monthly
loan repayment information (Porter
2011).
Students included in the analysis
are those who began postsecondary
education in one of the four major in-
stitution sectors: public 4-year, public
2-year, private nonprofit 4-year, and
for-profit institutions (at all levels).
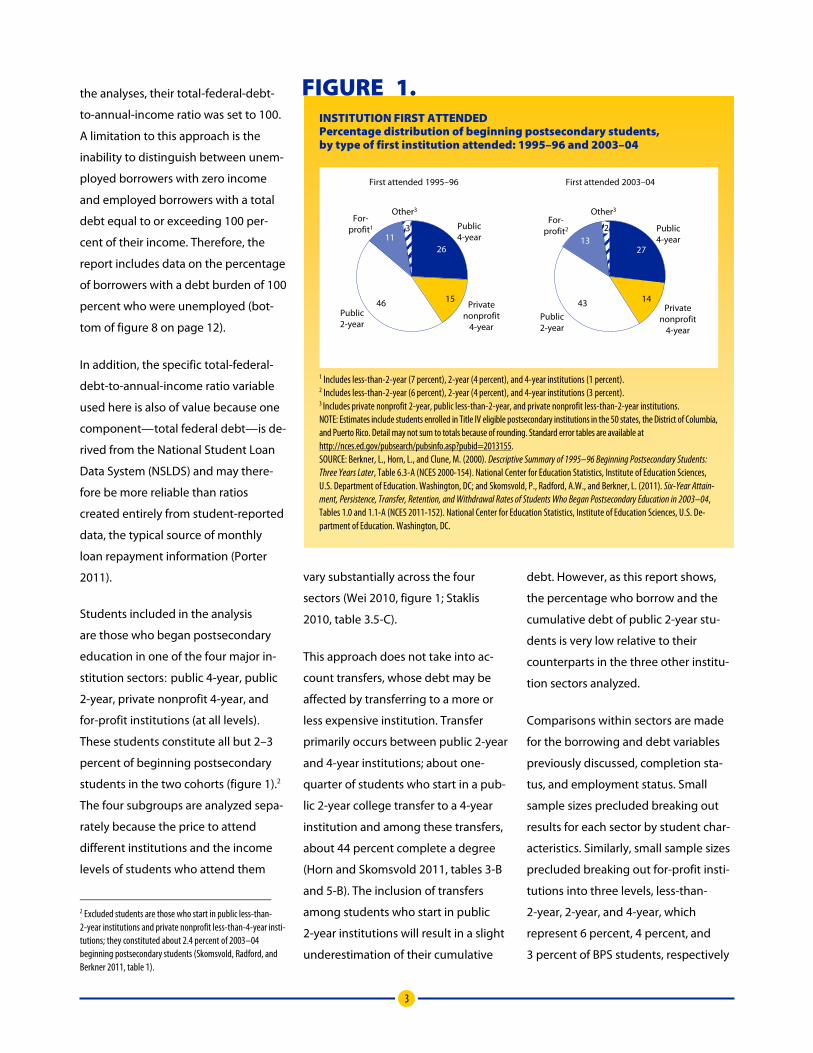
These students constitute all but 2–3
percent of beginning postsecondary
students in the two cohorts (figure 1).2
The four subgroups are analyzed sepa-
rately because the price to attend
different institutions and the income
levels of students who attend them
2 Excluded students are those who start in public less-than-2-year institutions and private nonprofit less-than-4-year insti-tutions; they constituted about 2.4 percent of 2003–04 beginning postsecondary students (Skomsvold, Radford, and Berkner 2011, table 1).
vary substantially across the four
sectors (Wei 2010, figure 1; Staklis
2010, table 3.5-C).
FIGURE 1. INSTITUTION FIRST ATTENDED Percentage distribution of beginning postsecondary students, by type of first institution attended: 1995–96 and 2003–04
Public 4-year
Private nonprofit
4-year
Public 2-year
For-profit1
Other3
First attended 1995–96
26
15 46
11 3 Public
4-year
Private nonprofit
4-year Public 2-year
For-profit2
Other3
First attended 2003–04
27
14 43
13 2
1 Includes less-than-2-year (7 percent), 2-year (4 percent), and 4-year institutions (1 percent). 2 Includes less-than-2-year (6 percent), 2-year (4 percent), and 4-year institutions (3 percent). 3 Includes private nonprofit 2-year, public less-than-2-year, and private nonprofit less-than-2-year institutions. NOTE: Estimates include students enrolled in Title IV eligible postsecondary institutions in the 50 states, the District of Columbia, and Puerto Rico. Detail may not sum to totals because of rounding. Standard error tables are available at http://nces.ed.gov/pubsearch/pubsinfo.asp?pubid=2013155. SOURCE: Berkner, L., Horn, L., and Clune, M. (2000). Descriptive Summary of 1995–96 Beginning Postsecondary Students: Three Years Later, Table 6.3-A (NCES 2000-154). National Center for Education Statistics, Institute of Education Sciences, U.S. Department of Education. Washington, DC; and Skomsvold, P., Radford, A.W., and Berkner, L. (2011). Six-Year Attain-ment, Persistence, Transfer, Retention, and Withdrawal Rates of Students Who Began Postsecondary Education in 2003–04, Tables 1.0 and 1.1-A (NCES 2011-152). National Center for Education Statistics, Institute of Education Sciences, U.S. De-partment of Education. Washington, DC.
This approach does not take into ac-
count transfers, whose debt may be
affected by transferring to a more or
less expensive institution. Transfer
primarily occurs between public 2-year
and 4-year institutions; about one-
quarter of students who start in a pub-
lic 2-year college transfer to a 4-year
institution and among these transfers,
about 44 percent complete a degree
(Horn and Skomsvold 2011, tables 3-B
and 5-B). The inclusion of transfers
among students who start in public
2-year institutions will result in a slight
underestimation of their cumulative
debt. However, as this report shows,
the percentage who borrow and the
cumulative debt of public 2-year stu-
dents is very low relative to their
counterparts in the three other institu-
tion sectors analyzed.
Comparisons within sectors are made
for the borrowing and debt variables
previously discussed, completion sta-
tus, and employment status. Small
sample sizes precluded breaking out
results for each sector by student char-
acteristics. Similarly, small sample sizes
precluded breaking out for-profit insti-
tutions into three levels, less-than-
2-year, 2-year, and 4-year, which
represent 6 percent, 4 percent, and
3 percent of BPS students, respectively
4
(Berkner, He, and Cataldi 2002;
Skomsvold, Radford, and Berkner 2011,
table 1).
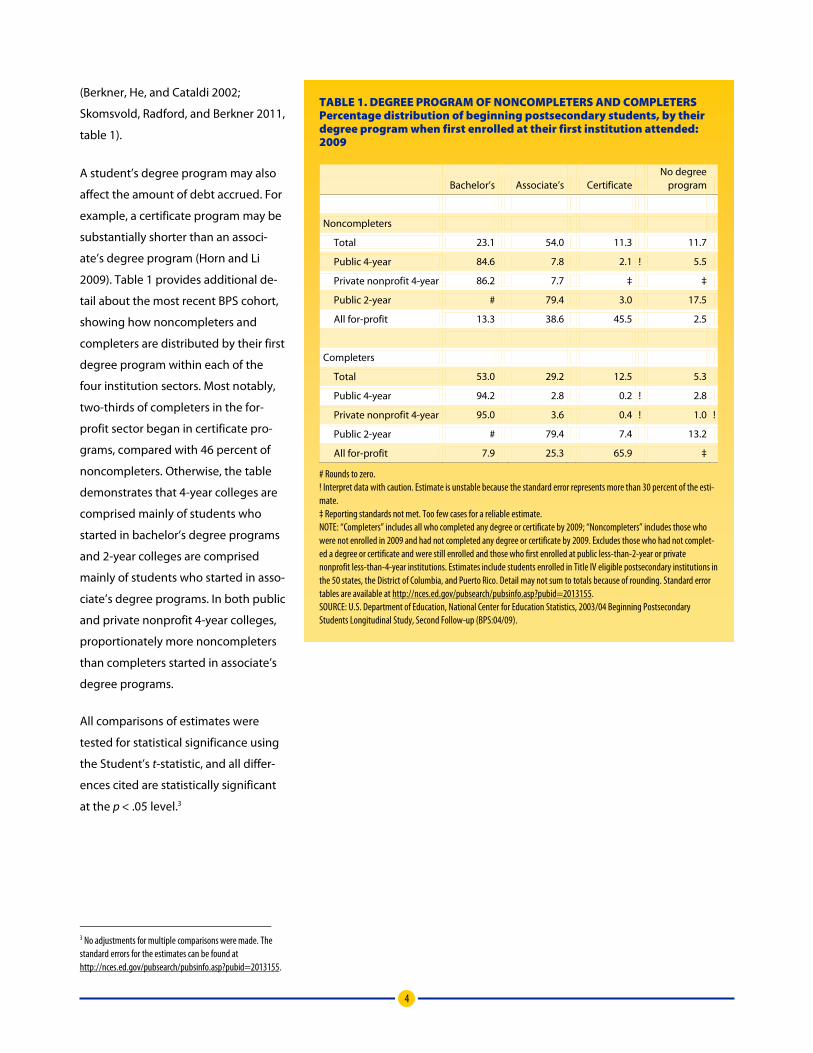
A student’s degree program may also
affect the amount of debt accrued. For
example, a certificate program may be
substantially shorter than an associ-
ate’s degree program (Horn and Li
2009). Table 1 provides additional de-
tail about the most recent BPS cohort,
showing how noncompleters and
completers are distributed by their first
degree program within each of the
four institution sectors. Most notably,
two-thirds of completers in the for-
profit sector began in certificate pro-
grams, compared with 46 percent of
noncompleters. Otherwise, the table
demonstrates that 4-year colleges are
comprised mainly of students who
started in bachelor’s degree programs
and 2-year colleges are comprised
mainly of students who started in asso-
ciate’s degree programs. In both public
and private nonprofit 4-year colleges,
proportionately more noncompleters
than completers started in associate’s
degree programs.
All comparisons of estimates were
tested for statistical significance using
the Student’s t-statistic, and all differ-
ences cited are statistically significant
at the p < .05 level.3
3 No adjustments for multiple comparisons were made. The standard errors for the estimates can be found at http://nces.ed.gov/pubsearch/pubsinfo.asp?pubid=2013155.
TABLE 1. DEGREE PROGRAM OF NONCOMPLETERS AND COMPLETERS Percentage distribution of beginning postsecondary students, by their degree program when first enrolled at their first institution attended: 2009
Bachelor’s Associate’s Certificate No degree
program
Noncompleters
Total 23.1 54.0 11.3 11.7
Public 4-year 84.6 7.8 2.1 ! 5.5
Private nonprofit 4-year 86.2 7.7 ‡ ‡
Public 2-year # 79.4 3.0 17.5
All for-profit 13.3 38.6 45.5 2.5
Completers
Total 53.0 29.2 12.5 5.3
Public 4-year 94.2 2.8 0.2 ! 2.8
Private nonprofit 4-year 95.0 3.6 0.4 ! 1.0 !
Public 2-year # 79.4 7.4 13.2
All for-profit 7.9 25.3 65.9 ‡
# Rounds to zero. ! Interpret data with caution. Estimate is unstable because the standard error represents more than 30 percent of the esti-mate. ‡ Reporting standards not met. Too few cases for a reliable estimate. NOTE: “Completers” includes all who completed any degree or certificate by 2009; “Noncompleters” includes those who were not enrolled in 2009 and had not completed any degree or certificate by 2009. Excludes those who had not complet-ed a degree or certificate and were still enrolled and those who first enrolled at public less-than-2-year or private nonprofit less-than-4-year institutions. Estimates include students enrolled in Title IV eligible postsecondary institutions in the 50 states, the District of Columbia, and Puerto Rico. Detail may not sum to totals because of rounding. Standard error tables are available at http://nces.ed.gov/pubsearch/pubsinfo.asp?pubid=2013155. SOURCE: U.S. Department of Education, National Center for Education Statistics, 2003/04 Beginning Postsecondary Students Longitudinal Study, Second Follow-up (BPS:04/09).
5
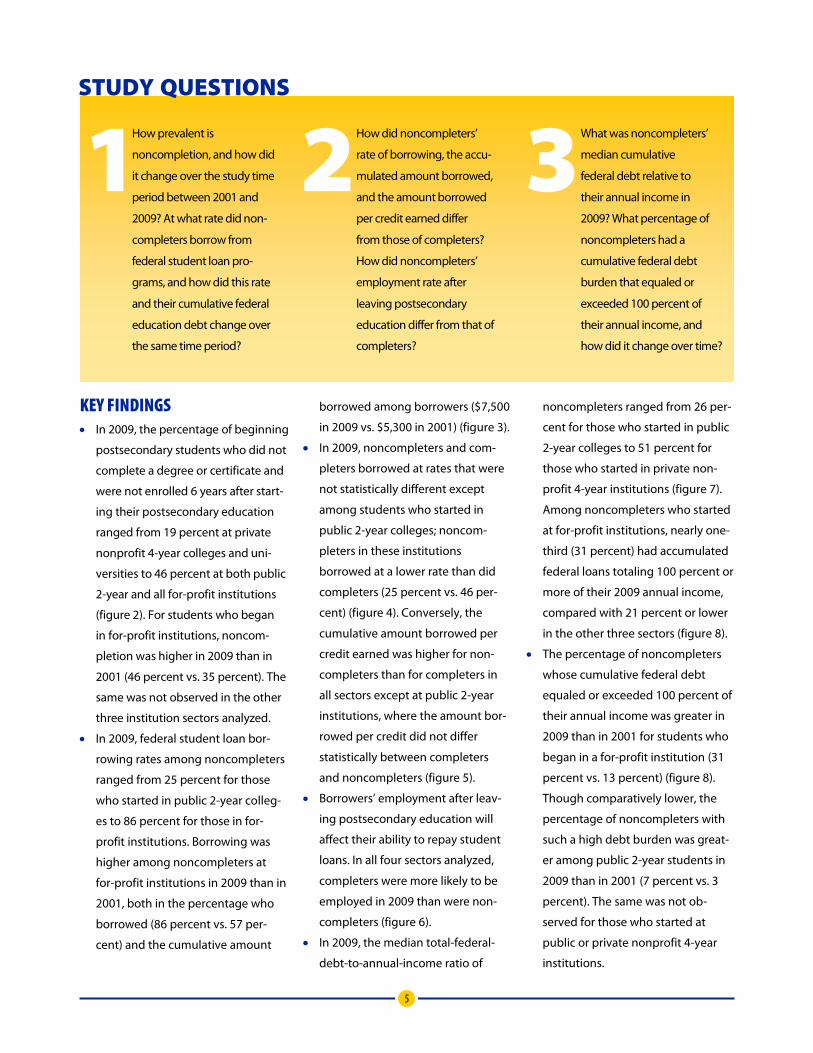
STUDY QUESTIONS
1 How prevalent is
noncompletion, and how did
it change over the study time
period between 2001 and
2009? At what rate did non-
completers borrow from
federal student loan pro-
grams, and how did this rate
and their cumulative federal
education debt change over
the same time period?
2 How did noncompleters’
rate of borrowing, the accu-
mulated amount borrowed,
and the amount borrowed
per credit earned differ
from those of completers?
How did noncompleters’
employment rate after
leaving postsecondary
education differ from that of
completers?
3 What was noncompleters’
median cumulative
federal debt relative to
their annual income in
2009? What percentage of
noncompleters had a
cumulative federal debt
burden that equaled or
exceeded 100 percent of
their annual income, and
how did it change over time?
KEY FINDINGS • In 2009, the percentage of beginning
postsecondary students who did not
complete a degree or certificate and
were not enrolled 6 years after start-
ing their postsecondary education
ranged from 19 percent at private
nonprofit 4-year colleges and uni-
versities to 46 percent at both public
2-year and all for-profit institutions
(figure 2). For students who began
in for-profit institutions, noncom-
pletion was higher in 2009 than in
2001 (46 percent vs. 35 percent). The
same was not observed in the other
three institution sectors analyzed.
• In 2009, federal student loan bor-
rowing rates among noncompleters
ranged from 25 percent for those
who started in public 2-year colleg-
es to 86 percent for those in for-
profit institutions. Borrowing was
higher among noncompleters at
for-profit institutions in 2009 than in
2001, both in the percentage who
borrowed (86 percent vs. 57 per-
cent) and the cumulative amount
borrowed among borrowers ($7,500
in 2009 vs. $5,300 in 2001) (figure 3).
• In 2009, noncompleters and com-
pleters borrowed at rates that were
not statistically different except
among students who started in
public 2-year colleges; noncom-
pleters in these institutions
borrowed at a lower rate than did
completers (25 percent vs. 46 per-
cent) (figure 4). Conversely, the
cumulative amount borrowed per
credit earned was higher for non-
completers than for completers in
all sectors except at public 2-year
institutions, where the amount bor-
rowed per credit did not differ
statistically between completers
and noncompleters (figure 5).
• Borrowers’ employment after leav-
ing postsecondary education will
affect their ability to repay student
loans. In all four sectors analyzed,
completers were more likely to be
employed in 2009 than were non-
completers (figure 6).
• In 2009, the median total-federal-
debt-to-annual-income ratio of
noncompleters ranged from 26 per-
cent for those who started in public
2-year colleges to 51 percent for
those who started in private non-
profit 4-year institutions (figure 7).
Among noncompleters who started
at for-profit institutions, nearly one-
third (31 percent) had accumulated
federal loans totaling 100 percent or
more of their 2009 annual income,
compared with 21 percent or lower
in the other three sectors (figure 8).
• The percentage of noncompleters
whose cumulative federal debt
equaled or exceeded 100 percent of
their annual income was greater in
2009 than in 2001 for students who
began in a for-profit institution (31
percent vs. 13 percent) (figure 8).
Though comparatively lower, the
percentage of noncompleters with
such a high debt burden was great-
er among public 2-year students in
2009 than in 2001 (7 percent vs. 3
percent). The same was not ob-
served for those who started at
public or private nonprofit 4-year
institutions.
6
1 How prevalent is noncompletion, and how did it change over the study time period between 2001 and 2009? At what rate did noncompleters borrow from federal student loan programs, and how did this rate and their cumulative federal education debt change over the same time period?
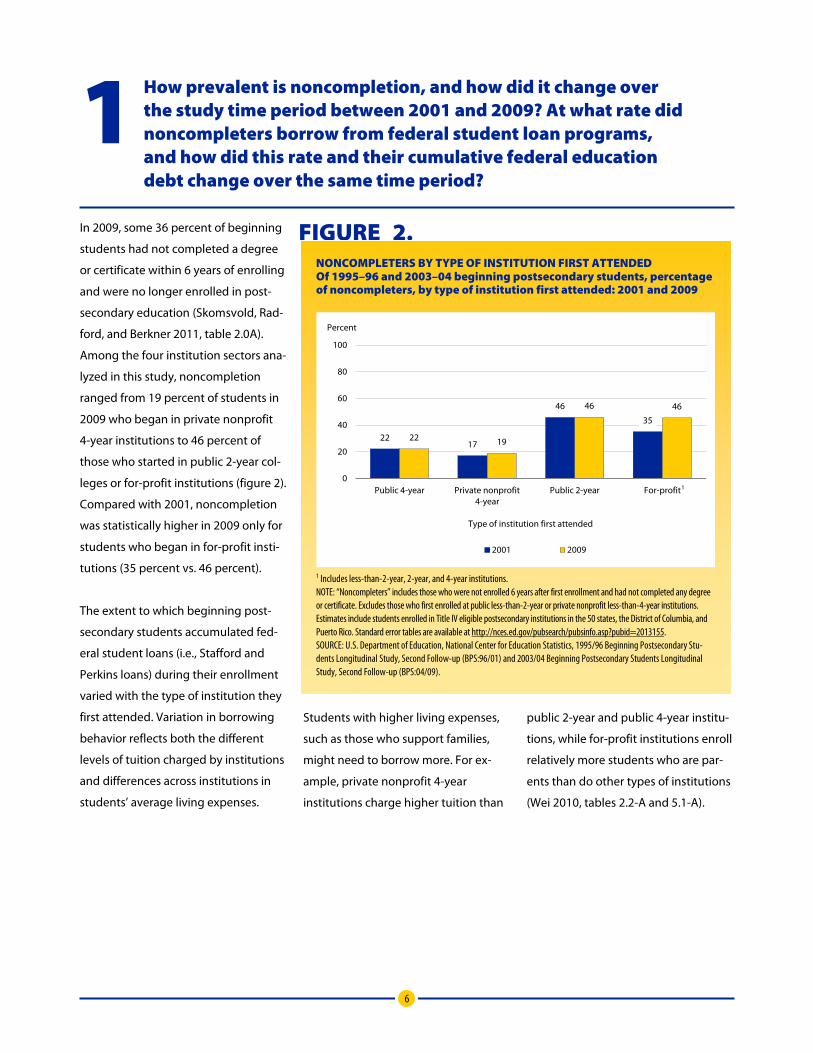
In 2009, some 36 percent of beginning
students had not completed a degree
or certificate within 6 years of enrolling
and were no longer enrolled in post-
secondary education (Skomsvold, Rad-
ford, and Berkner 2011, table 2.0A).
Among the four institution sectors ana-
lyzed in this study, noncompletion
ranged from 19 percent of students in
2009 who began in private nonprofit
4-year institutions to 46 percent of
those who started in public 2-year col-
leges or for-profit institutions (figure 2).
Compared with 2001, noncompletion
was statistically higher in 2009 only for
students who began in for-profit insti-
tutions (35 percent vs. 46 percent).
The extent to which beginning post-
secondary students accumulated fed-
eral student loans (i.e., Stafford and
Perkins loans) during their enrollment
varied with the type of institution they
first attended. Variation in borrowing
behavior reflects both the different
levels of tuition charged by institutions
and differences across institutions in
students’ average living expenses.
Students with higher living expenses,
such as those who support families,
might need to borrow more. For ex-
ample, private nonprofit 4-year
institutions charge higher tuition than
public 2-year and public 4-year institu-
tions, while for-profit institutions enroll
relatively more students who are par-
ents than do other types of institutions
(Wei 2010, tables 2.2-A and 5.1-A).
FIGURE 2. NONCOMPLETERS BY TYPE OF INSTITUTION FIRST ATTENDED Of 1995–96 and 2003–04 beginning postsecondary students, percentage of noncompleters, by type of institution first attended: 2001 and 2009
22 17
46
35
22 19
46 46
0
20
40
60
80
100
Public 4-year Private nonprofit 4-year
Public 2-year For-profit
Percent
Type of institution first attended
2001 2009
1
1 Includes less-than-2-year, 2-year, and 4-year institutions. NOTE: “Noncompleters” includes those who were not enrolled 6 years after first enrollment and had not completed any degree or certificate. Excludes those who first enrolled at public less-than-2-year or private nonprofit less-than-4-year institutions. Estimates include students enrolled in Title IV eligible postsecondary institutions in the 50 states, the District of Columbia, and Puerto Rico. Standard error tables are available at http://nces.ed.gov/pubsearch/pubsinfo.asp?pubid=2013155. SOURCE: U.S. Department of Education, National Center for Education Statistics, 1995/96 Beginning Postsecondary Stu-dents Longitudinal Study, Second Follow-up (BPS:96/01) and 2003/04 Beginning Postsecondary Students Longitudinal Study, Second Follow-up (BPS:04/09).
7
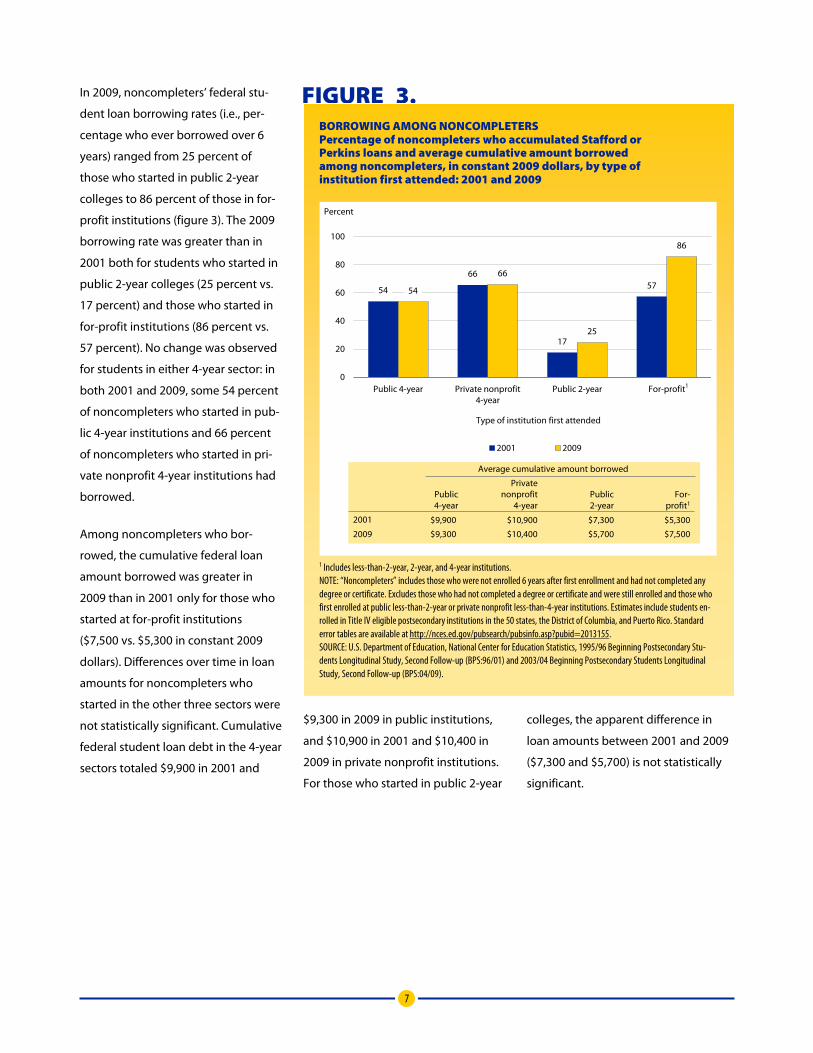
In 2009, noncompleters’ federal stu-
dent loan borrowing rates (i.e., per-
centage who ever borrowed over 6
years) ranged from 25 percent of
those who started in public 2-year
colleges to 86 percent of those in for-
profit institutions (figure 3). The 2009
borrowing rate was greater than in
2001 both for students who started in
public 2-year colleges (25 percent vs.
17 percent) and those who started in
for-profit institutions (86 percent vs.
57 percent). No change was observed
for students in either 4-year sector: in
both 2001 and 2009, some 54 percent
of noncompleters who started in pub-
lic 4-year institutions and 66 percent
of noncompleters who started in pri-
vate nonprofit 4-year institutions had
borrowed.
Among noncompleters who bor-
rowed, the cumulative federal loan
amount borrowed was greater in
2009 than in 2001 only for those who
started at for-profit institutions
($7,500 vs. $5,300 in constant 2009
dollars). Differences over time in loan
amounts for noncompleters who
started in the other three sectors were
not statistically significant. Cumulative
federal student loan debt in the 4-year
sectors totaled $9,900 in 2001 and
$9,300 in 2009 in public institutions,
and $10,900 in 2001 and $10,400 in
2009 in private nonprofit institutions.
For those who started in public 2-year
colleges, the apparent difference in
loan amounts between 2001 and 2009
($7,300 and $5,700) is not statistically
significant.
FIGURE 3. BORROWING AMONG NONCOMPLETERS Percentage of noncompleters who accumulated Stafford or Perkins loans and average cumulative amount borrowed among noncompleters, in constant 2009 dollars, by type of institution first attended: 2001 and 2009
54
66
17
57 54
66
25
86
0
20
40
60
80
100
Public 4-year Private nonprofit 4-year
Public 2-year For-profit
Percent
Type of institution first attended
2001 2009
Average cumulative amount borrowed
2001
2009
Public 4-year
Private nonprofit
4-year Public 2-year
For-profit1
$9,900
$9,300
$10,900
$10,400
$5,300
$7,500
$7,300
$5,700
1
1 Includes less-than-2-year, 2-year, and 4-year institutions. NOTE: “Noncompleters” includes those who were not enrolled 6 years after first enrollment and had not completed any degree or certificate. Excludes those who had not completed a degree or certificate and were still enrolled and those who first enrolled at public less-than-2-year or private nonprofit less-than-4-year institutions. Estimates include students en-rolled in Title IV eligible postsecondary institutions in the 50 states, the District of Columbia, and Puerto Rico. Standard error tables are available at http://nces.ed.gov/pubsearch/pubsinfo.asp?pubid=2013155. SOURCE: U.S. Department of Education, National Center for Education Statistics, 1995/96 Beginning Postsecondary Stu-dents Longitudinal Study, Second Follow-up (BPS:96/01) and 2003/04 Beginning Postsecondary Students Longitudinal Study, Second Follow-up (BPS:04/09).
8
2 How did noncompleters’ rate of borrowing, the accumulated amount borrowed, and the amount borrowed per credit earned differ from those of completers? How did noncompleters’ employment rate after leaving postsecondary education differ from that of completers?
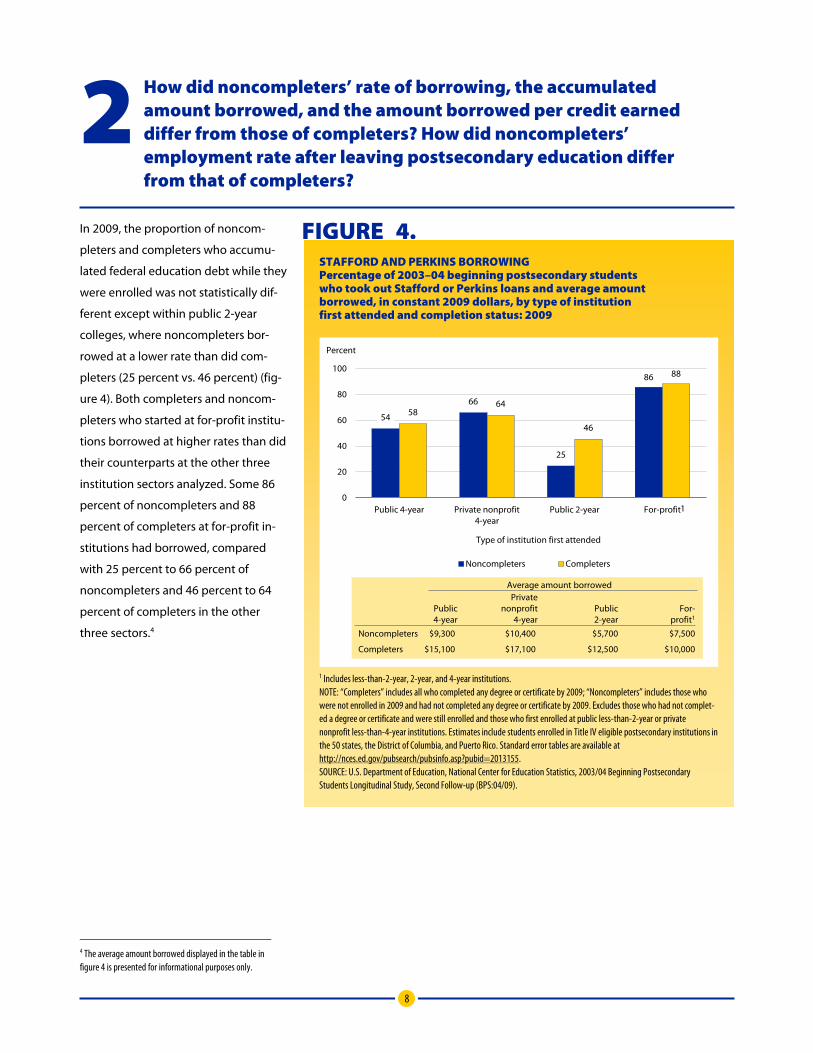
In 2009, the proportion of noncom-
pleters and completers who accumu-
lated federal education debt while they
were enrolled was not statistically dif-
ferent except within public 2-year
colleges, where noncompleters bor-
rowed at a lower rate than did com-
pleters (25 percent vs. 46 percent) (fig-
ure 4). Both completers and noncom-
pleters who started at for-profit institu-
tions borrowed at higher rates than did
their counterparts at the other three
institution sectors analyzed. Some 86
percent of noncompleters and 88
percent of completers at for-profit in-
stitutions had borrowed, compared
with 25 percent to 66 percent of
noncompleters and 46 percent to 64
percent of completers in the other
three sectors.4
4 The average amount borrowed displayed in the table in figure 4 is presented for informational purposes only.
FIGURE 4. STAFFORD AND PERKINS BORROWING Percentage of 2003–04 beginning postsecondary students who took out Stafford or Perkins loans and average amount borrowed, in constant 2009 dollars, by type of institution first attended and completion status: 2009
54
66
25
86
58 64
46
88
0
20
40
60
80
100
Public 4-year Private nonprofit 4-year
Public 2-year For-profit
Percent
Type of institution first attended
Noncompleters Completers
$9,300
$15,100
$10,400
$17,100
$5,700
$12,500
$7,500
$10,000
Average amount borrowed
Noncompleters
Completers
Public 4-year
Private nonprofit
4-year Public 2-year
For-profit1
1
1 Includes less-than-2-year, 2-year, and 4-year institutions. NOTE: “Completers” includes all who completed any degree or certificate by 2009; “Noncompleters” includes those who were not enrolled in 2009 and had not completed any degree or certificate by 2009. Excludes those who had not complet-ed a degree or certificate and were still enrolled and those who first enrolled at public less-than-2-year or private nonprofit less-than-4-year institutions. Estimates include students enrolled in Title IV eligible postsecondary institutions in the 50 states, the District of Columbia, and Puerto Rico. Standard error tables are available at http://nces.ed.gov/pubsearch/pubsinfo.asp?pubid=2013155. SOURCE: U.S. Department of Education, National Center for Education Statistics, 2003/04 Beginning Postsecondary Students Longitudinal Study, Second Follow-up (BPS:04/09).
9
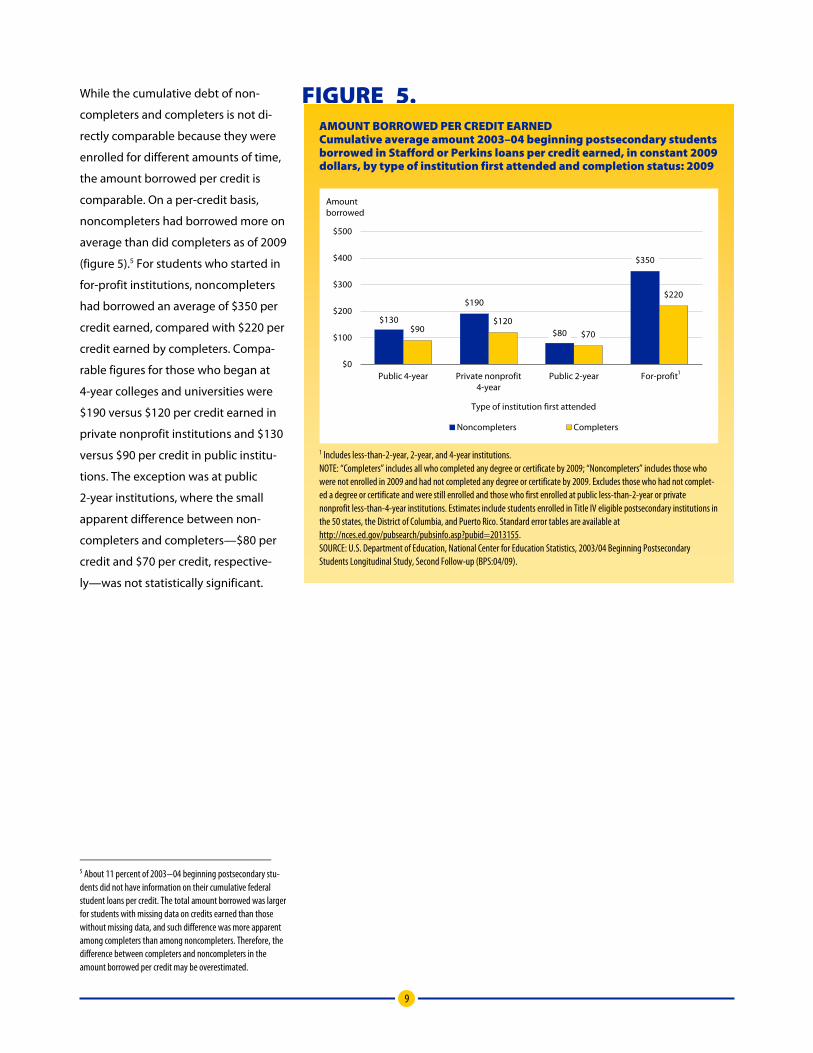
While the cumulative debt of non-
completers and completers is not di-
rectly comparable because they were
enrolled for different amounts of time,
the amount borrowed per credit is
comparable. On a per-credit basis,
noncompleters had borrowed more on
average than did completers as of 2009
(figure 5).5 For students who started in
for-profit institutions, noncompleters
had borrowed an average of $350 per
credit earned, compared with $220 per
credit earned by completers. Compa-
rable figures for those who began at
4-year colleges and universities were
$190 versus $120 per credit earned in
private nonprofit institutions and $130
versus $90 per credit in public institu-
tions. The exception was at public
2-year institutions, where the small
apparent difference between non-
completers and completers—$80 per
credit and $70 per credit, respective-
ly—was not statistically significant.
5 About 11 percent of 2003−04 beginning postsecondary stu-dents did not have information on their cumulative federal student loans per credit. The total amount borrowed was larger for students with missing data on credits earned than those without missing data, and such difference was more apparent among completers than among noncompleters. Therefore, the difference between completers and noncompleters in the amount borrowed per credit may be overestimated.
FIGURE 5. AMOUNT BORROWED PER CREDIT EARNED Cumulative average amount 2003–04 beginning postsecondary students borrowed in Stafford or Perkins loans per credit earned, in constant 2009 dollars, by type of institution first attended and completion status: 2009
$130
$190
$80
$350
$90 $120
$70
$220
$0
$100
$200
$300
$400
$500
Public 4-year Private nonprofit 4-year
Public 2-year For-profit
Amount borrowed
Type of institution first attended
Noncompleters Completers
1
1 Includes less-than-2-year, 2-year, and 4-year institutions. NOTE: “Completers” includes all who completed any degree or certificate by 2009; “Noncompleters” includes those who were not enrolled in 2009 and had not completed any degree or certificate by 2009. Excludes those who had not complet-ed a degree or certificate and were still enrolled and those who first enrolled at public less-than-2-year or private nonprofit less-than-4-year institutions. Estimates include students enrolled in Title IV eligible postsecondary institutions in the 50 states, the District of Columbia, and Puerto Rico. Standard error tables are available at http://nces.ed.gov/pubsearch/pubsinfo.asp?pubid=2013155. SOURCE: U.S. Department of Education, National Center for Education Statistics, 2003/04 Beginning Postsecondary Students Longitudinal Study, Second Follow-up (BPS:04/09).
10
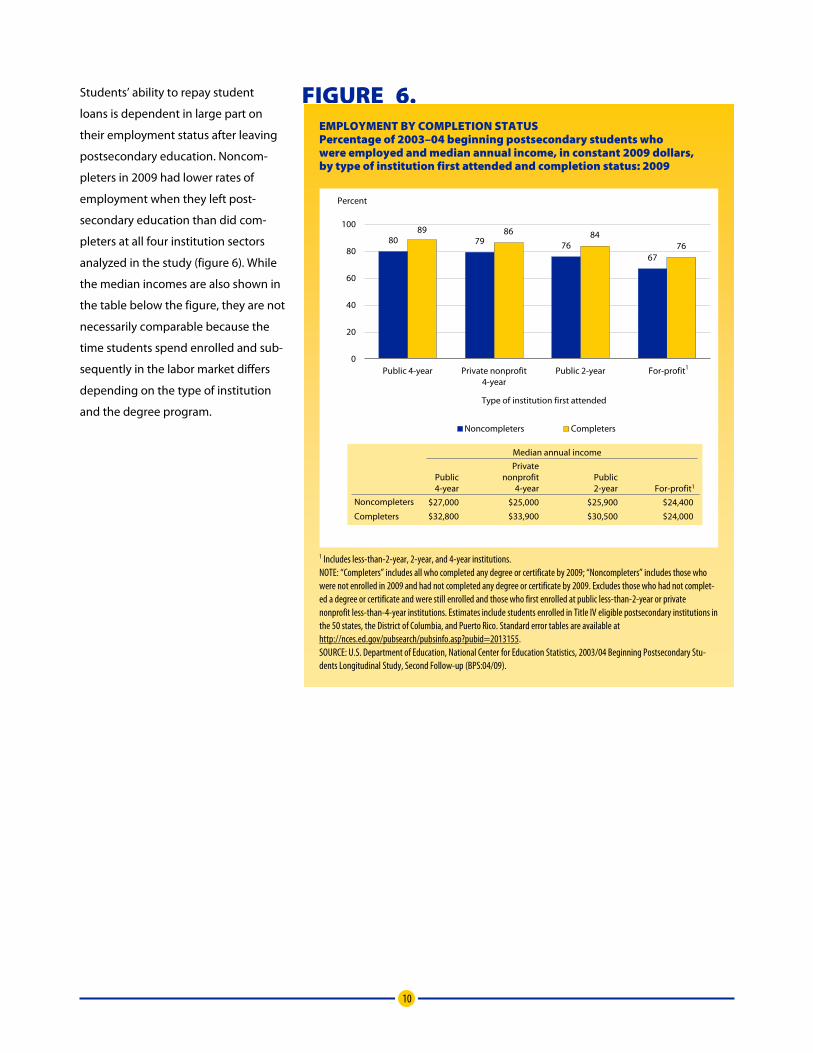
Students’ ability to repay student
loans is dependent in large part on
their employment status after leaving
postsecondary education. Noncom-
pleters in 2009 had lower rates of
employment when they left post-
secondary education than did com-
pleters at all four institution sectors
analyzed in the study (figure 6). While
the median incomes are also shown in
the table below the figure, they are not
necessarily comparable because the
time students spend enrolled and sub-
sequently in the labor market differs
depending on the type of institution
and the degree program.
FIGURE 6. EMPLOYMENT BY COMPLETION STATUS Percentage of 2003–04 beginning postsecondary students who were employed and median annual income, in constant 2009 dollars, by type of institution first attended and completion status: 2009
80 79 76 67
89 86 84 76
0
20
40
60
80
100
Public 4-year Private nonprofit 4-year
Public 2-year For-profit
Percent
Type of institution first attended
Noncompleters Completers
Median annual income
Noncompleters
Completers
Public 4-year
Private nonprofit
4-year Public 2-year For-profit1
$27,000
$32,800
$25,000
$33,900
$24,400
$24,000
$25,900
$30,500
1
1 Includes less-than-2-year, 2-year, and 4-year institutions. NOTE: “Completers” includes all who completed any degree or certificate by 2009; “Noncompleters” includes those who were not enrolled in 2009 and had not completed any degree or certificate by 2009. Excludes those who had not complet-ed a degree or certificate and were still enrolled and those who first enrolled at public less-than-2-year or private nonprofit less-than-4-year institutions. Estimates include students enrolled in Title IV eligible postsecondary institutions in the 50 states, the District of Columbia, and Puerto Rico. Standard error tables are available at http://nces.ed.gov/pubsearch/pubsinfo.asp?pubid=2013155. SOURCE: U.S. Department of Education, National Center for Education Statistics, 2003/04 Beginning Postsecondary Stu-dents Longitudinal Study, Second Follow-up (BPS:04/09).
11
3 What was noncompleters’ median cumulative federal debt relative to their annual income in 2009? What percentage of noncompleters had a cumulative federal debt burden that equaled or exceeded 100 percent of their annual income, and how did it change over time?
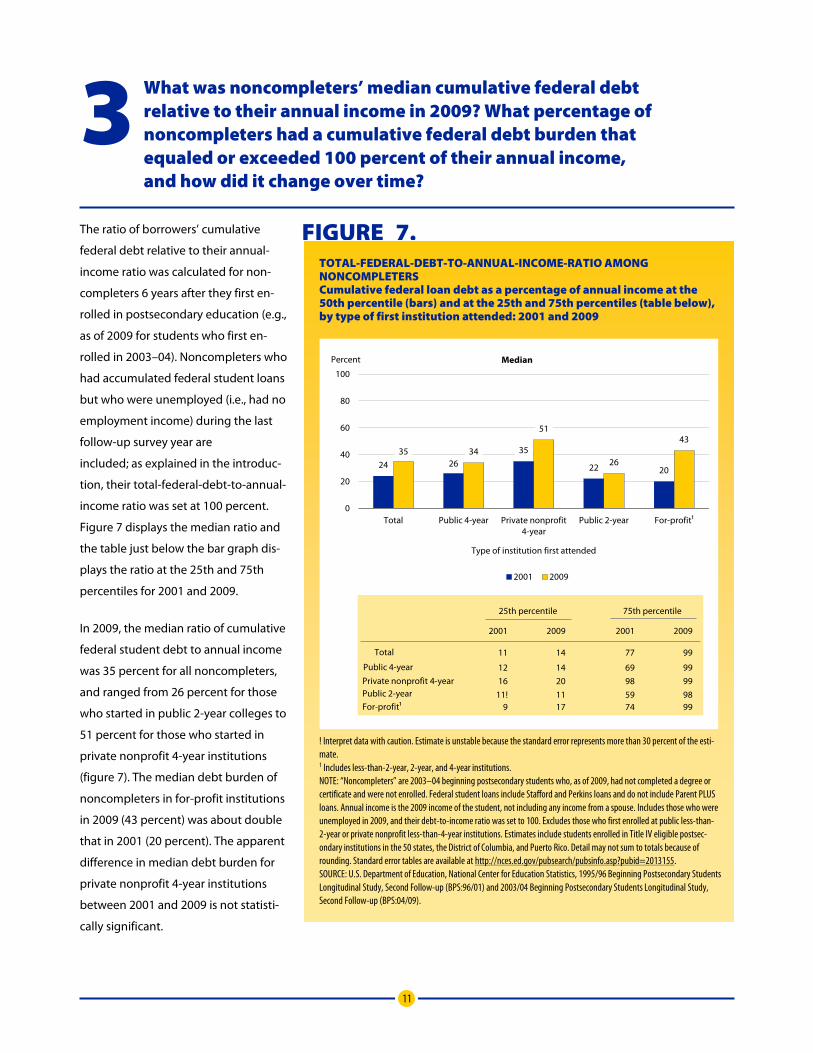
The ratio of borrowers’ cumulative
federal debt relative to their annual-
income ratio was calculated for non-
completers 6 years after they first en-
rolled in postsecondary education (e.g.,
as of 2009 for students who first en-
rolled in 2003–04). Noncompleters who
had accumulated federal student loans
but who were unemployed (i.e., had no
employment income) during the last
follow-up survey year are
included; as explained in the introduc-
tion, their total-federal-debt-to-annual-
income ratio was set at 100 percent.
Figure 7 displays the median ratio and
the table just below the bar graph dis-
plays the ratio at the 25th and 75th
percentiles for 2001 and 2009.
In 2009, the median ratio of cumulative
federal student debt to annual income
was 35 percent for all noncompleters,
and ranged from 26 percent for those
who started in public 2-year colleges to
51 percent for those who started in
private nonprofit 4-year institutions
(figure 7). The median debt burden of
noncompleters in for-profit institutions
in 2009 (43 percent) was about double
that in 2001 (20 percent). The apparent
difference in median debt burden for
private nonprofit 4-year institutions
between 2001 and 2009 is not statisti-
cally significant.
FIGURE 7. TOTAL-FEDERAL-DEBT-TO-ANNUAL-INCOME-RATIO AMONG NONCOMPLETERS Cumulative federal loan debt as a percentage of annual income at the 50th percentile (bars) and at the 25th and 75th percentiles (table below), by type of first institution attended: 2001 and 2009
24 26 35
22 20
35 34
51
26
43
0
20
40
60
80
100
Total Public 4-year Private nonprofit 4-year
Public 2-year For-profit¹
Percent
Type of institution first attended
Median
2001 2009
Total
Public 4-year Private nonprofit 4-year Public 2-year For-profit¹
16 11!
11
12
2001
9
20 11
14
14
2009
17
98 59
77
69
2001
74
99 98
99
99
2009
99
25th percentile 75th percentile
! Interpret data with caution. Estimate is unstable because the standard error represents more than 30 percent of the esti-mate. 1 Includes less-than-2-year, 2-year, and 4-year institutions. NOTE: “Noncompleters” are 2003–04 beginning postsecondary students who, as of 2009, had not completed a degree or certificate and were not enrolled. Federal student loans include Stafford and Perkins loans and do not include Parent PLUS loans. Annual income is the 2009 income of the student, not including any income from a spouse. Includes those who were unemployed in 2009, and their debt-to-income ratio was set to 100. Excludes those who first enrolled at public less-than-2-year or private nonprofit less-than-4-year institutions. Estimates include students enrolled in Title IV eligible postsec-ondary institutions in the 50 states, the District of Columbia, and Puerto Rico. Detail may not sum to totals because of rounding. Standard error tables are available at http://nces.ed.gov/pubsearch/pubsinfo.asp?pubid=2013155. SOURCE: U.S. Department of Education, National Center for Education Statistics, 1995/96 Beginning Postsecondary Students Longitudinal Study, Second Follow-up (BPS:96/01) and 2003/04 Beginning Postsecondary Students Longitudinal Study, Second Follow-up (BPS:04/09).

12
Figure 8 displays the percentage of
noncompleters with a debt burden
equal to or exceeding 100 percent of
their annual income. Among non-
completers who started in for-profit in-
stitutions, nearly one-third (31 percent)
carried such a high debt burden in
2009, compared with 7 percent to 21
percent among those who first attend-
ed other types of institutions. More-
over, the percentage of noncompleters
with a debt burden of at least 100 per-
cent of annual income was greater in
2009 than in 2001 for those who start-
ed in for-profit institutions (31 percent
vs. 13 percent). These findings are con-
sistent with prior research showing
high debt burdens among for-profit
students relative to their peers in pub-
lic and nonprofit institutions (Deming,
Goldin, and Katz 2012). Though the
percentage with a high debt burden
was lower among noncompleters who
started in public 2-year colleges com-
pared with those in other sectors, their
share was also greater in 2009 than in
2001 (7 percent vs. 3 percent). Analo-
gous differences for those who started
in public or private nonprofit 4-year
institutions were not statistically signif-
icant.
FIGURE 8. NONCOMPLETERS WHOSE STUDENT LOAN DEBT WAS 100 PERCENT OR MORE OF ANNUAL INCOME Percentage of noncompleters whose cumulative federal student loans were 100 percent or more of annual income and average cumulative amount borrowed, in constant 2009 dollars, by type of first institution attended: 2001 and 2009
12
17
3
13 13
21
7
31
0
10
20
30
40
50
Public 4-year Private nonprofit 4-year
Public 2-year For-profit
Percent
Type of institution first attended
2001 2009
1
Public 4-year
Private nonprofit 4-year Public 2-year
For-profit¹
68.6
‡
72.4
2001
94.7
70.3
89.7
74.4
2009
88.1
Percent with loan debt of 100 percent or more of annual income who were unemployed
‡ Reporting standards not met. Too few cases for a reliable estimate. 1 Includes less-than-2-year, 2-year, and 4-year institutions. NOTE: Federal student loans include Stafford and Perkins loans and do not include Parent PLUS loans. Annual income is the 2001 or 2009 income of the student, not including any income from a spouse. Includes those who were unemployed in 2001 or 2009, and their debt-to-income ratio was set to 100. “Noncompleters” includes those who were not enrolled 6 years after first enrollment and had not completed any degree or certificate. Excludes those who had not completed a degree or certificate and were still enrolled and those who first enrolled at public less-than-2-year or private nonprofit less-than-4-year institutions. Estimates include students enrolled in Title IV eligible postsecondary institutions in the 50 states, the District of Columbia, and Puerto Rico. Standard error tables are available at http://nces.ed.gov/pubsearch/pubsinfo.asp?pubid=2013155. SOURCE: U.S. Department of Education, National Center for Education Statistics, 1995/96 Beginning Postsecondary Students Longitudinal Study, Second Follow-up (BPS:96/01) and 2003/04 Beginning Postsecondary Students Longitudinal Study, Second Follow-up (BPS:04/09).
13
FIND OUT MORE
For questions about content or to order additional copies of this Statistics in Brief or view this report online, go to:
http://nces.ed.gov/pubsearch/pubsinfo.asp?pubid=2013155
More detailed information on the debt burden of
undergraduate students, noncompletion among
undergraduates, and undergraduate financing can be
found in the following publications produced by the
National Center for Education Statistics (NCES) using
Baccalaureate and Beyond (B&B) and Beginning
Postsecondary Students (BPS) Longitudinal Studies data:
Dealing With Debt: 1992–93 Bachelor’s Degree Recipients
10 Years Later (NCES 2006-156). http://nces.ed.gov/
pubsearch/pubsinfo.asp?pubid=2006156
Debt Burden: A Comparison of 1992–93 and 1999–2000
Bachelor’s Degree Recipients a Year After Graduating
(NCES 2005-170). http://nces.ed.gov/pubsearch/
pubsinfo.asp?pubid=2005170
Debt Burden Four Years After College (NCES 2000-188).
http://nces.ed.gov/pubsearch/pubsinfo.asp?pubid=
2000188
Descriptive Summary of 1995–96 Beginning Postsecondary
Students: Six Years Later (NCES 2003-151). http://nces.
ed.gov/pubsearch/pubsinfo.asp?pubid=2003151
Descriptive Summary of 2003–04 Beginning Postsecondary
Students: Three Years Later (NCES 2008-174). http://
nces.ed.gov/pubsearch/pubsinfo.asp?pubid=2008174
Web Tables—Six-Year Attainment, Persistence, Transfer,
Retention, and Withdrawal Rates of Students Who Began
Postsecondary Education in 2003–04 (NCES 2011-152).
http://nces.ed.gov/pubsearch/pubsinfo.asp?pubid=
2011152
14
TECHNICAL NOTES
Survey Methodology The estimates provided in this Statistics
in Brief are based on data collected
through the 1996/2001 and 2004/09
Beginning Postsecondary Students
Longitudinal Studies (BPS:96/01 and
BPS:04/09), as well as transcript data
collected on students who participated
in BPS:04/09. Each BPS follows a cohort
of students who enroll in postsecond-
ary education for the first time and
covers broad topics concerning stu-
dent persistence in and completion of
postsecondary education and transi-
tions to employment. In BPS:96/01,
students provided data through in-
struments administered by telephone
and in-person interviews, and in
BPS:04/09, students provided the same
data through instruments adminis-
tered via the Internet or telephone. In
addition to student responses, data
were collected from the first institu-
tions attended by the sampled
students, and the U.S. Department of
Education supplied respondent-level
data on student loan and grant pro-
grams (i.e., the National Student Loan
Data System) and federal student
financial aid applications (i.e., the
Central Processing System), matching
student records using a common iden-
tifier. In BPS:04/09, students’ transcripts
through the 2008–09 academic year
were also collected as part of the
Postsecondary Education Transcript
Study (PETS), creating a 6-year record
of academic enrollment including
coursetaking, credit accumulation,
academic performance, and degree
receipt.
The BPS:96/01 and BPS:04/09 target
populations were based on the subset
of first-time beginning (FTB) respond-
ents from the 1995–96 and 2003–04
National Postsecondary Student Aid
Studies (NPSAS:96 and NPSAS:04),
which include students enrolled in
postsecondary institutions in the
United States and Puerto Rico at any
time between July 1 and June 30 of the
survey year.6 In BPS:04/09, the popula-
tion also was limited to students
enrolled in Title IV institutions.7 The
target populations included 3 million
FTBs in 1995–96 and 4 million in
2003–04 (table A-1).
For each NPSAS/BPS, the sampling de-
sign consisted of first selecting eligible
institutions from the sampling frame.
Institutions were selected with proba-
bilities proportional to a composite
measure of size based on expected
enrollment during the survey year.
Table A-1 lists the institution sampling
frames for BPS:96/01 and BPS:04/09,
which were constructed from data files
of the Integrated Postsecondary Edu-
6 The target population of NPSAS was limited to those enrolled in an academic program, at least one course for credit that could be applied toward an academic degree, or an occupation-al or vocational program requiring at least 3 months or 300 clock hours of instruction to receive a degree, certificate, or other formal award. The target population excluded students who were also enrolled in high school or a high school comple-tion (e.g., GED preparation) program. 7 “Title IV institutions” refers to institutions eligible to partici-pate in federal financial aid programs under Title IV of the Higher Education Act.
cation Data System (IPEDS), which
includes all U.S. postsecondary institu-
tions that are eligible to participate in
federal financial aid programs under
Title IV of the Higher Education Act.
Table A-1 also provides the numbers of
sampled and participating institutions
for each study and each study’s
weighted institution response rate,
that is, the weighted percentage of
institutions that provided student en-
rollment lists.
Once institutions were selected, stu-
dents were sampled from the enroll-
ment lists provided by sampled institu-
tions. Table A-1 indicates the numbers
of students who were sampled and de-
termined eligible to participate in each
of the two studies and provides
weighted response rates for the two
BPS cohorts. For BPS:96/01, 84 percent
of eligible sample members completed
either a full or a partial interview and
were defined as interview respondents.
In BPS:04/09, eligible sampled students
were defined as study respondents if
they completed the interview or had
enrollment data from either the Na-
tional Student Clearinghouse or from
transcripts: 89 percent of eligible sam-
ple members were study respondents.
Approximately 80 percent of eligible
sample members completed inter-
views. Estimates were weighted to
adjust for the unequal probability of
selection into the sample and for non-
response.

15
TABLE A-1. Selected statistics on BPS:96/01 and BPS:04/09 data collections
Statistic BPS:96/01 BPS:04/09
Target population FTBs1 in 1995–96 FTBs1 in 2003–04
Target population size 3 million 4 million
IPEDS2 datafile(s) used as NPSAS sampling frame
1993–94 Institutional
Characteristics
2000–01 and 2001–02
Institutional Characteristics
and Header; 2000 and 2001
Fall Enrollment
Number of sampled institutions (unweighted) 973 1,670
Number of participating institutions (unweighted) 788 1,360
Institution response rate3 (weighted) 91.1 80.0
Number of sampled students 12,400 23,100
Number of eligible students 12,100 18,600
Study response rate4 (weighted) † 89.2
Interview response rate (weighted) 83.6 80.2
† Not applicable. 1 First-time beginning students (FTBs). 2 Integrated Postsecondary Education Data System, Institutional Characteristics file. 3 Percentage of institutions that provided student enrollment lists. 4 Percentage of BPS:04/09 eligible sampled students who completed a 2009 interview or for whom enrollment data were obtained from either the National Student Clearinghouse or transcripts. SOURCE: Riccobono, J.A., Whitmore, R.W., Gabel, T.J., Traccarella, M.A., Pratt, D.J., and Berkner, L.K. (1997). National Postsecondary Student Aid Study, 1995–96 (NPSAS:96) Methodology Report (NCES 98-073). National Center for Education Statistics, U.S. Department of Education. Washington, DC. Wine, J.S., Heuer, R.E., Wheeless, S.C., Francis, T.L., Franklin, J.W., and Dudley, K.M. (2002). Beginning Postsecondary Students Longitudinal Study 1996–2001 (BPS:1996/2001) Method-ology Report (NCES 2002-171). National Center for Education Statistics, U.S. Department of Education. Washington, DC. Radford, A.W., Berkner, L., Wheeless, S.C., and Shepherd, B. (2010). Persistence and Attainment of 2003–04 Beginning Postsecondary Students: After 6 Years: First Look (NCES 2011-151). National Center for Education Statistics, Institute of Edu-cation Sciences, U.S. Department of Education. Washington, DC. Wine, J., Janson, N., and Wheeless, S. (2011). 2004/09 Beginning Postsecondary Students Longitudinal Study (BPS:04/09) Methodology Report (NCES 2012-246). National Center for Education Statistics, Institute of Education Sciences, U.S. Department of Education. Washington, DC.
Two broad categories of error occur in
estimates generated from surveys:
sampling and nonsampling errors.
Sampling errors occur when observa-
tions are based on samples rather than
on entire populations. The standard er-
ror of a sample statistic is a measure of
the variation due to sampling and indi-
cates the precision of the statistic. The
complex sampling designs used in
NPSAS:96 for BPS:96/01 and in
NPSAS:04 for BPS:04/09 must be taken
into account when calculating variance
estimates such as standard errors.
NCES’s online analysis tool PowerStats,
which generated the estimates in this
report, uses the balanced repeated rep-
lication (BRR) and Jackknife II (JK2)
methods to adjust variance estimation
for the complex sample designs
(Kaufman 2004; Wolter 1985).
Nonsampling errors can be attributed
to several sources: incomplete infor-
mation about all respondents (e.g.,
some students or institutions refused
to participate, or students participated
but answered only certain items); dif-
ferences among respondents in
question interpretation; inability or
unwillingness to give correct infor-
mation; mistakes in recording or
coding data; and other errors of col-
lecting, processing, sampling, and
imputing missing data.
For more information on the BPS meth-
odology, see the following reports:
Beginning Postsecondary Students
Longitudinal Study: 1996–2001
(BPS:1996/2001) (http://nces.ed.gov/
pubsearch/pubsinfo.asp?pubid=
2002171)
Persistence and Attainment of 2003–04
Beginning Postsecondary Students:
After Six Years: First Look
(http://nces.ed.gov/pubsearch/
pubsinfo.asp?pubid=2011151)

16
Item Response Rates NCES Statistical Standard 4-4-1 states
that “[a]ny survey stage of data collec-
tion with a unit or item response rate
less than 85 percent must be evaluated
for the potential magnitude of non-
response bias before the data or any
analysis using the data may be
released” (U.S. Department of Educa-
tion 2002). In the case of BPS:04/09,
this means that nonresponse bias anal-
ysis could be required at any of three
levels: institutions, study respondents,
or items.
For BPS:04/09, the weighted institution
response rate for all institutions was
80 percent. The response rate varied
by institution sector, ranging from 70
percent for public 4-year non-
doctorate-granting institutions to 93
percent for private nonprofit 4-year
non-doctorate-granting institutions.
The following characteristics were used
to perform institution nonresponse bi-
as analysis: institution sector;8 Carnegie
classification; degree of urbanization;
Office of Business Economics (OBE)
region; historically Black college or
university indicator; percentage of
students receiving federal grant aid,
state/local grant aid, institutional grant
aid, and student loan aid; percentage
of students enrolled by race; and en-
rollment for undergraduate and
graduate/first-professional students,
total and by sex. Before weight ad-
justments, 6 percent of the variable
categories were significantly biased for
all institutions. After weight adjust-
ments, the percentage of categories
with significant bias rounded to zero.
8 Institution sector was used only for nonresponse bias analysis of all institutions.
As shown in table A-1, the study re-
spondent response rate was 89
percent. Consequently, nonresponse
bias analysis was not needed at the re-
spondent level. The student interview
response rate, however, was 80 per-
cent, and therefore nonresponse bias
analysis was required for those varia-
bles based in whole or in part on
student interviews. In this report, three
variables required nonresponse bias
analysis: INCRES09 (respondents’ an-
nual income), INCTOT08 (annual
household income), and JOBST09
(employment status). For each of these
variables, nonresponse bias analyses
were conducted to determine whether
respondents and nonrespondents dif-
fered on the following characteristics:
institution sector, region, and total en-
rollment; student type, sex, and age
group; whether the student had sub-
mitted the Free Application for Federal
Student Aid (FAFSA), was a federal aid
recipient, was a Pell Grant recipient, or
took out a Stafford Loan; and the
amount, if any, of a student’s Pell Grant
or Stafford Loan. Differences between
respondents and nonrespondents on
these variables were tested for statisti-
cal significance at the .05 level. A
VARIABLES USED
All estimates in this Statistics in Brief were produced using PowerStats, a web-
based software application that allows users to generate tables for many of
the postsecondary surveys conducted by NCES. See “Run Your Own Analysis
With DataLab” below for more information on PowerStats. The variables used
in this Statistics in Brief are listed below. Visit the NCES DataLab website
http://nces.ed.gov/datalab to view detailed information on how these varia-
bles were constructed and their sources. Under Codebooks select BPS: 2009 or
BPS: 2001, under view by subject or view by variable name. The program files
that generated the statistics presented in this Statistics in Brief can be found
at http://nces.ed.gov/pubsearch/20pubsinfo.asp?pubid=2013155.
BPS:96/01 BPS:04/09 Label Variable Variable
Annual household income — INCTOT08
Completion status PROUTYX6 PROUT6
Cumulative federal student loans T4TOXCUM T4XCUM09
Cumulative federal student loans per credit earned — FDLNCR09
Employment status — JOBST09
Federal student loan repayment status — LOANST09
First institution type ITNPSAS FSECTOR
Ratio of cumulative federal student loans to annual income DEBTRT01 DEBTRT09
Respondent’s annual income — INCRES09
—Not available in BPS:96/01.
17
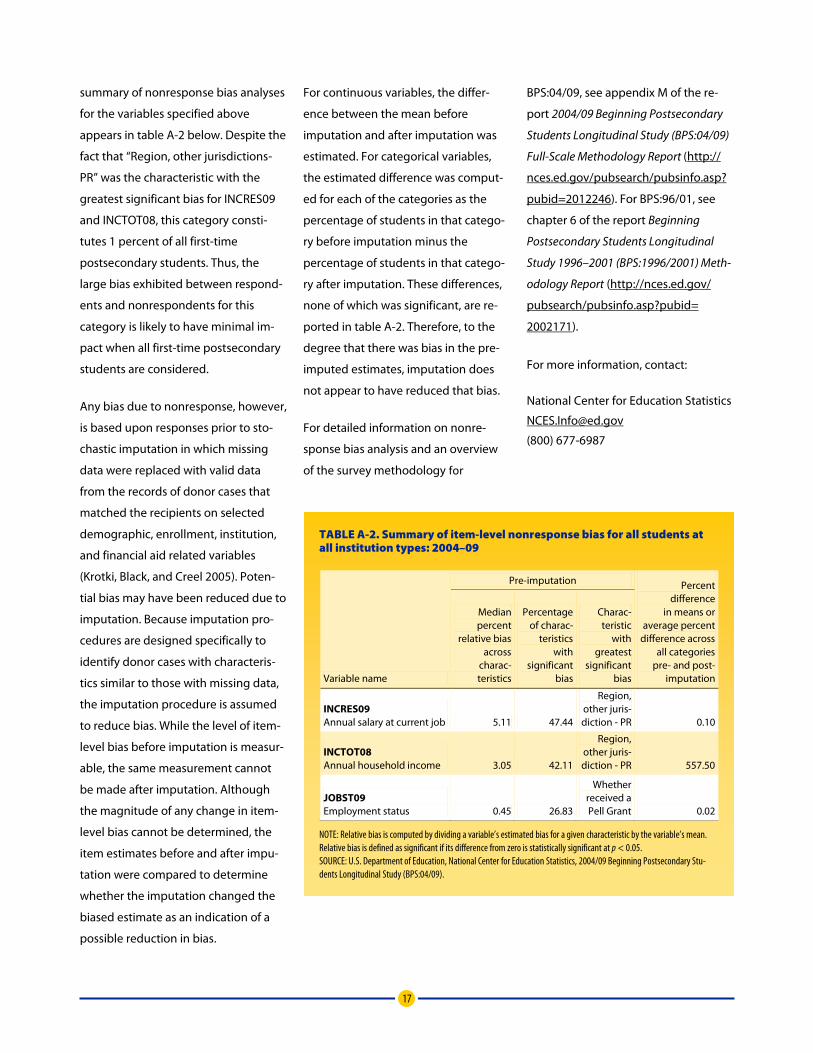
summary of nonresponse bias analyses
for the variables specified above
appears in table A-2 below. Despite the
fact that “Region, other jurisdictions-
PR” was the characteristic with the
greatest significant bias for INCRES09
and INCTOT08, this category consti-
tutes 1 percent of all first-time
postsecondary students. Thus, the
large bias exhibited between respond-
ents and nonrespondents for this
category is likely to have minimal im-
pact when all first-time postsecondary
students are considered.
Any bias due to nonresponse, however,
is based upon responses prior to sto-
chastic imputation in which missing
data were replaced with valid data
from the records of donor cases that
matched the recipients on selected
demographic, enrollment, institution,
and financial aid related variables
(Krotki, Black, and Creel 2005). Poten-
tial bias may have been reduced due to
imputation. Because imputation pro-
cedures are designed specifically to
identify donor cases with characteris-
tics similar to those with missing data,
the imputation procedure is assumed
to reduce bias. While the level of item-
level bias before imputation is measur-
able, the same measurement cannot
be made after imputation. Although
the magnitude of any change in item-
level bias cannot be determined, the
item estimates before and after impu-
tation were compared to determine
whether the imputation changed the
biased estimate as an indication of a
possible reduction in bias.
For continuous variables, the differ-
ence between the mean before
imputation and after imputation was
estimated. For categorical variables,
the estimated difference was comput-
ed for each of the categories as the
percentage of students in that catego-
ry before imputation minus the
percentage of students in that catego-
ry after imputation. These differences,
none of which was significant, are re-
ported in table A-2. Therefore, to the
degree that there was bias in the pre-
imputed estimates, imputation does
not appear to have reduced that bias.
For detailed information on nonre-
sponse bias analysis and an overview
of the survey methodology for
BPS:04/09, see appendix M of the re-
port 2004/09 Beginning Postsecondary
Students Longitudinal Study (BPS:04/09)
Full-Scale Methodology Report (http://
nces.ed.gov/pubsearch/pubsinfo.asp?
pubid=2012246). For BPS:96/01, see
chapter 6 of the report Beginning
Postsecondary Students Longitudinal
Study 1996–2001 (BPS:1996/2001) Meth-
odology Report (http://nces.ed.gov/
pubsearch/pubsinfo.asp?pubid=
2002171).
For more information, contact:
National Center for Education Statistics
(800) 677-6987
TABLE A-2. Summary of item-level nonresponse bias for all students at all institution types: 2004–09
Variable name
Pre-imputation Percent difference
in means or average percent
difference across all categories
pre- and post-imputation
Median percent
relative bias across
charac-teristics
Percentage of charac-
teristics with
significant bias
Charac-teristic
with greatest
significant bias
INCRES09 Annual salary at current job 5.11 47.44
Region, other juris-diction - PR 0.10
INCTOT08 Annual household income 3.05 42.11
Region, other juris-diction - PR 557.50
JOBST09 Employment status 0.45 26.83
Whether received a Pell Grant 0.02
NOTE: Relative bias is computed by dividing a variable’s estimated bias for a given characteristic by the variable’s mean. Relative bias is defined as significant if its difference from zero is statistically significant at p < 0.05. SOURCE: U.S. Department of Education, National Center for Education Statistics, 2004/09 Beginning Postsecondary Stu-dents Longitudinal Study (BPS:04/09).
18
Statistical Procedures Comparisons of means and proportions
were tested using Student’s t statistic.
Differences between estimates were
tested against the probability of a
Type I error9 or significance level. The
statistical significance of each compari-
son was determined by calculating the
Student’s t value for the difference
between each pair of means or propor-
tions and comparing the t value with
published tables of significance levels
for two-tailed hypothesis testing. Stu-
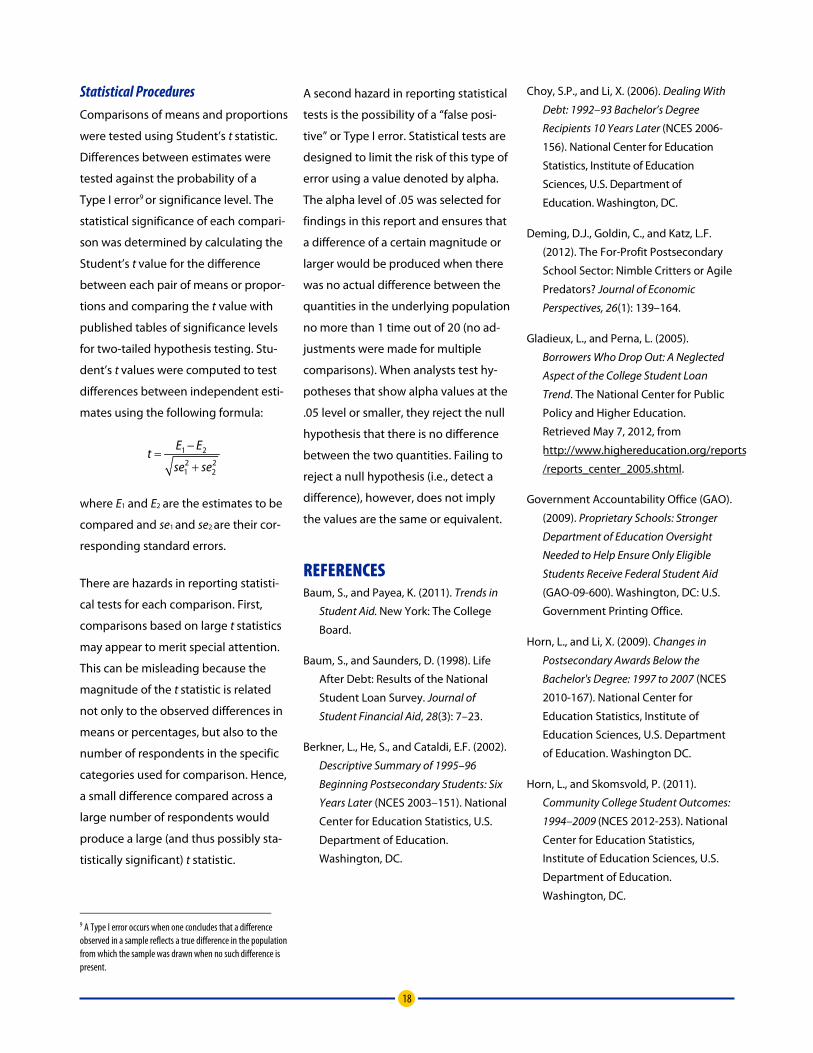
dent’s t values were computed to test
differences between independent esti-
mates using the following formula:
1 22 21 2
E Et
se se
−=
+
where E1 and E2 are the estimates to be
compared and se1 and se2 are their cor-
responding standard errors.
9 A Type I error occurs when one concludes that a difference observed in a sample reflects a true difference in the population from which the sample was drawn when no such difference is present.
There are hazards in reporting statisti-
cal tests for each comparison. First,
comparisons based on large t statistics
may appear to merit special attention.
This can be misleading because the
magnitude of the t statistic is related
not only to the observed differences in
means or percentages, but also to the
number of respondents in the specific
categories used for comparison. Hence,
a small difference compared across a
large number of respondents would
produce a large (and thus possibly sta-
tistically significant) t statistic.
A second hazard in reporting statistical
tests is the possibility of a “false posi-
tive” or Type I error. Statistical tests are
designed to limit the risk of this type of
error using a value denoted by alpha.
The alpha level of .05 was selected for
findings in this report and ensures that
a difference of a certain magnitude or
larger would be produced when there
was no actual difference between the
quantities in the underlying population
no more than 1 time out of 20 (no ad-
justments were made for multiple
comparisons). When analysts test hy-
potheses that show alpha values at the
.05 level or smaller, they reject the null
hypothesis that there is no difference
between the two quantities. Failing to
reject a null hypothesis (i.e., detect a
difference), however, does not imply
the values are the same or equivalent.
REFERENCES Baum, S., and Payea, K. (2011). Trends in
Student Aid. New York: The College
Board.
Baum, S., and Saunders, D. (1998). Life
After Debt: Results of the National
Student Loan Survey. Journal of
Student Financial Aid, 28(3): 7–23.
Berkner, L., He, S., and Cataldi, E.F. (2002).
Descriptive Summary of 1995–96
Beginning Postsecondary Students: Six
Years Later (NCES 2003–151). National
Center for Education Statistics, U.S.
Department of Education.
Washington, DC.
Choy, S.P., and Li, X. (2006). Dealing With
Debt: 1992–93 Bachelor’s Degree
Recipients 10 Years Later (NCES 2006-
156). National Center for Education
Statistics, Institute of Education
Sciences, U.S. Department of
Education. Washington, DC.
Deming, D.J., Goldin, C., and Katz, L.F.
(2012). The For-Profit Postsecondary
School Sector: Nimble Critters or Agile
Predators? Journal of Economic
Perspectives, 26(1): 139–164.
Gladieux, L., and Perna, L. (2005).
Borrowers Who Drop Out: A Neglected
Aspect of the College Student Loan
Trend. The National Center for Public
Policy and Higher Education.
Retrieved May 7, 2012, from
http://www.highereducation.org/reports
/reports_center_2005.shtml.
Government Accountability Office (GAO).
(2009). Proprietary Schools: Stronger
Department of Education Oversight
Needed to Help Ensure Only Eligible
Students Receive Federal Student Aid
(GAO-09-600). Washington, DC: U.S.
Government Printing Office.
Horn, L., and Li, X. (2009). Changes in
Postsecondary Awards Below the
Bachelor's Degree: 1997 to 2007 (NCES
2010-167). National Center for
Education Statistics, Institute of
Education Sciences, U.S. Department
of Education. Washington DC.
Horn, L., and Skomsvold, P. (2011).
Community College Student Outcomes:
1994–2009 (NCES 2012-253). National
Center for Education Statistics,
Institute of Education Sciences, U.S.
Department of Education.
Washington, DC.

19
Kaufman, S. (2004). Using the Bootstrap
in a Two-Stage Design When Some
Second-Stage Strata Have Only One
Unit Allocated. Proceedings of the
American Statistical Association,
Section on Survey Research Methods.
Krotki, K., Black, S., and Creel, D. (2005).
Mass Imputation. In Proceedings of the
Section on Survey Research Methods,
American Statistical Association [CD-
ROM]. Alexandria, VA: American
Statistical Association.
Nguyen, M. (2012). Degreeless in Debt:
What Happens to Borrowers Who Drop
Out. Education Sector. Retrieved June
1, 2012, from
http://www.educationsector.org/sites
/default/files/publications/Degreeless
Debt_CYCT_RELEASE.pdf.
Porter, S.R. (2011, Fall). Do College
Student Surveys Have Any Validity?
Review of Higher Education, 35(1): 45–
76. Retrieved February 8, 2013, from
http://muse.jhu.edu/login?auth=0&
type=summary&url=/journals/review_
of_higher_education/v035/
35.1.porter.html.
Rothstein, J., and Rouse, C.E. (2011).
Constrained After College: Student
Loans and Early-Career Occupational
Choices. Journal of Public Economics,
95(1–2): 149–163.
Skomsvold, P., Radford, A., and Berkner, L.
(2011). Web Tables—Six-Year
Completion, Persistence, Transfer,
Retention, and Withdrawal Rates of
Students Who Began Postsecondary
Education in 2003–04 (NCES 2011-152).
National Center for Education
Statistics, Institute of Education
Sciences, U.S. Department of
Education. Washington, DC.
Staklis, S. (2010). Web Tables—Profile of
Undergraduate Students: 2007–08
(NCES 2010-205). National Center for
Education Statistics, Institute of
Education Sciences, U.S. Department
of Education. Washington, DC.
U.S. Department of Education. (2002).
NCES Statistical Standards (NCES 2003-
601). Washington, DC: National Center
for Education Statistics. Retrieved
November 19, 2010, from
http://nces.ed.gov/pubsearch.
Wei, C. (2010). Web Tables—Student
Financing of Undergraduate Education:
2007–08 (NCES 2010-162). National
Center for Education Statistics,
Institute of Education Sciences, U.S.
Department of Education.
Washington, DC.
Wei, C., and Skomsvold, P. (2011).
Borrowing at the Maximum:
Undergraduate Stafford Loan
Borrowers in 2007–08 (NCES 2012-161).
National Center for Education
Statistics, Institute of Education
Sciences, U.S. Department of
Education. Washington, DC.
Wolter, K. (1985). Introduction to Variance
Estimation. New York: Springer-Verlag.
20
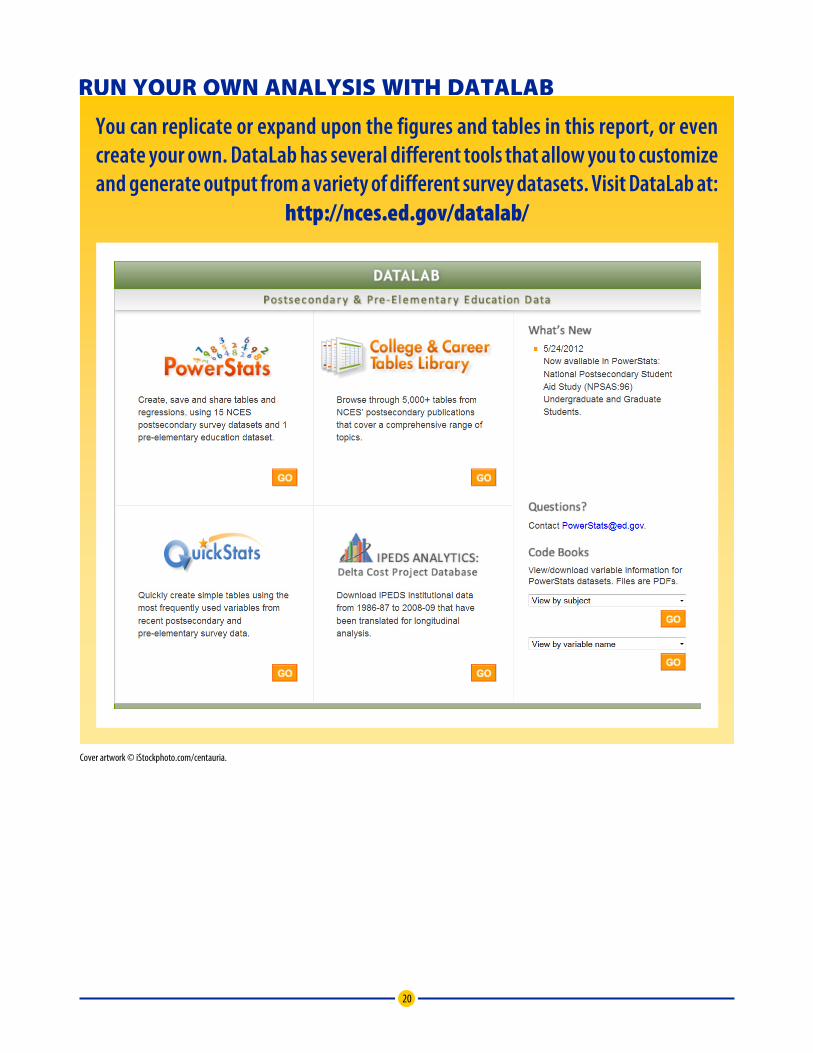
RUN YOUR OWN ANALYSIS WITH DATALAB
You can replicate or expand upon the figures and tables in this report, or even create your own. DataLab has several different tools that allow you to customize and generate output from a variety of different survey datasets. Visit DataLab at:
http://nces.ed.gov/datalab/
Cover artwork © iStockphoto.com/centauria.