Embed Size (px)
Citation preview

STATS IN BRIEF U.S. DEPARTMENT OF EDUCATION NOVEMBER 2016 NCES 2017-414
New American Undergraduates Enrollment Trends and Age at Arrival of Immigrant and Second-Generation Students
AUTHORS
Caren A. Arbeit Sandra Staklis Laura Horn RTI International
PROJECT OFFICER
Sean A. Simone National Center for Education Statistics
Statistics in Brief publications present descriptive data in tabular formats to provide useful information to a broad audience, including members of the general public. They address simple and topical issues and questions. They do not investigate more complex hypotheses, account for inter-relationships among variables, or support causal inferences. We encourage readers who are interested in more complex questions and in-depth analysis to explore other NCES resources, including publications, online data tools, and public- and restricted-use datasets. See nces.ed.gov and references noted in the body of this document for more information.
This Statistics in Brief was prepared for the National Center for Education Statistics under Contract No. ED-IES-12-C-0095 with RTI International. Mention of trade names, commercial products, or organizations does not imply endorsement by the U.S. Government.
In the United States,
the number and proportion of “New
Americans”—immigrants and second-
generation Americans—have increased
in the last several decades.1
1 Immigrants are U.S. citizens and permanent residents who were born abroad to non-U.S. citizens; second-generation Americans are U.S. citizens with one or both parents born outside of the United States. Together, immigrants and second-generation Americans are “New Americans.”
From 1970 to
2010, the immigrant population more
than tripled to 40 million residents, consti-
tuting 13 percent of Americans. Further,
between 1980 and 2013, the percentage
of young adult immigrants (ages 18–34)
more than doubled from 6 percent to
15 percent (U.S. Census Bureau 2014;
Grieco et al. 2012). In 2012, one-quarter of
the U.S. population were second-generation
Americans (Pew Research Center 2013).
Among adults aged 25 and older, recent
data indicate that bachelor’s degree
attainment rates of foreign and native-
born residents were similar (29 percent vs.
31 percent, respectively), but educational
attainment below the bachelor’s degree
differed: 16 percent of foreign-born resi-
dents obtained some college education,
compared with 27 percent and 29 percent
of second- and third-generation Americans,
respectively (U.S. Census Bureau 2012).
Prior research has shown that, when
controlling for such factors as race/
ethnicity and socioeconomic status,
2
second-generation American students
attend school longer, on average, and
are more likely to earn bachelor’s
degrees when compared with all other
undergraduates (Siahaan, Lee, and
Kalist 2014; Baum and Flores 2011;
Teranishi, Suárez-Orozco, and Suárez-
Orozco 2011).
Among immigrant students, college
enrollment and attainment differs by
race/ethnicity, with Asian students at-
tending and completing college at
higher rates than Hispanic students
(Staklis and Horn 2012). These differ-
ences have been attributed, at least in
part, to the relatively higher parental
educational attainment of many
Asian immigrant groups (Portes and
Rumbaut 2006). Furthermore, the
educational outcomes of immigrants
vary by the age at which they arrived in
the United States. Immigrants who
arrive as adolescents2
2 Adolescent immigrant arrivals are often referred to as the “one-and-a-half” or “1.5-generation.” There is little consensus on the ages that constitute this group in the literature on immigrants (Zhou 1997). See the Data and Key Definitions section for more information on age at arrival.
face different
challenges than children educated in
the United States do (Feliciano 2005;
Hernandez, Denton, and Blanchard
2011; Zhou 1997). Specifically, children
who immigrate before age 12 are
exposed to the language and norms
of the American educational system
earlier (Baum and Flores 2011), and
therefore fare better in school than
children who immigrate at later ages
(Hernandez et al. 2011).
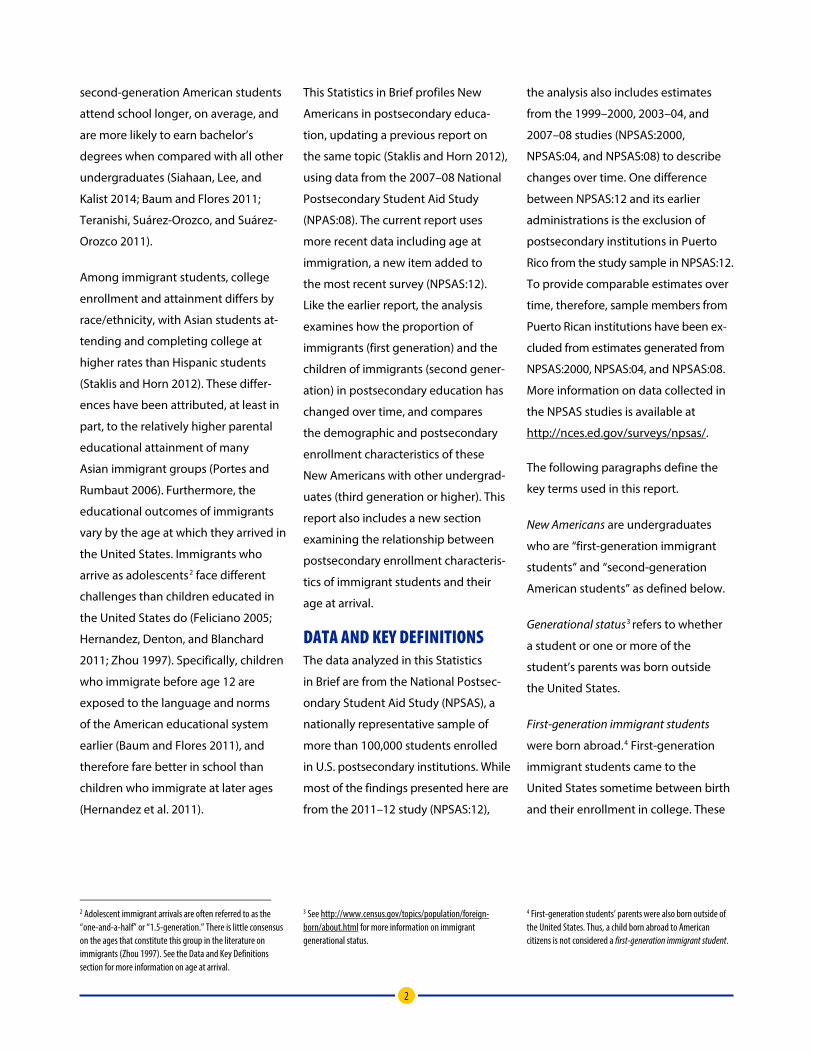
This Statistics in Brief profiles New
Americans in postsecondary educa-
tion, updating a previous report on
the same topic (Staklis and Horn 2012),
using data from the 2007–08 National
Postsecondary Student Aid Study
(NPAS:08). The current report uses
more recent data including age at
immigration, a new item added to
the most recent survey (NPSAS:12).
Like the earlier report, the analysis
examines how the proportion of
immigrants (first generation) and the
children of immigrants (second gener-
ation) in postsecondary education has
changed over time, and compares
the demographic and postsecondary
enrollment characteristics of these
New Americans with other undergrad-
uates (third generation or higher). This
report also includes a new section
examining the relationship between
postsecondary enrollment characteris-
tics of immigrant students and their
age at arrival.
DATA AND KEY DEFINITIONS The data analyzed in this Statistics
in Brief are from the National Postsec-
ondary Student Aid Study (NPSAS), a
nationally representative sample of
more than 100,000 students enrolled
in U.S. postsecondary institutions. While
most of the findings presented here are
from the 2011–12 study (NPSAS:12),
the analysis also includes estimates
from the 1999–2000, 2003–04, and
2007–08 studies (NPSAS:2000,
NPSAS:04, and NPSAS:08) to describe
changes over time. One difference
between NPSAS:12 and its earlier
administrations is the exclusion of
postsecondary institutions in Puerto
Rico from the study sample in NPSAS:12.
To provide comparable estimates over
time, therefore, sample members from
Puerto Rican institutions have been ex-
cluded from estimates generated from
NPSAS:2000, NPSAS:04, and NPSAS:08.
More information on data collected in
the NPSAS studies is available at
http://nces.ed.gov/surveys/npsas/.
The following paragraphs define the
key terms used in this report.
New Americans are undergraduates
who are “first-generation immigrant
students” and “second-generation
American students” as defined below.
Generational status3
3 See http://www.census.gov/topics/population/foreign-born/about.html for more information on immigrant generational status.
refers to whether
a student or one or more of the
student’s parents was born outside
the United States.
First-generation immigrant students
were born abroad.4
4 First-generation students’ parents were also born outside of the United States. Thus, a child born abroad to American citizens is not considered a first-generation immigrant student.
First-generation
immigrant students came to the
United States sometime between birth
and their enrollment in college. These

3
students were legally authorized to
reside in the United States and were
admitted to the United States for the
purpose of obtaining permanent
residency, had permanent residency,
or had become American citizens.
Note, the NPSAS studies do not
identify undocumented status.
For simplicity and consistency with
the earlier National Center for Educa-
tion Statistics (NCES) report on New
Americans (Staklis and Horn 2012),
first-generation immigrant students
are referred to as immigrant students.
Second-generation American students
were born in the United States to at
least one parent who was born abroad.
Third-generation or higher American
students5
5 In the body of the report, first-generation immigrant students is shortened to immigrants, second-generation American students is shortened to second-generation students, and third-generation or higher American students is shortened to third-generation students.
were born to U.S.-born parents.
Foreign students or “nonresident alien
students,” who do not have citizenship
or were not admitted to the United
States for the purpose of obtaining
permanent residency, are not included
in this report.6
6 See http://nces.ed.gov/ipeds/glossary/index.asp?id=419 for more information on “nonresident alien” and “resident alien students.” Undocumented students cannot be identified in these data. Individuals whose immigration status was not clear were assigned to the foreign students’ category and are not included in these analyses.
To examine age at arrival in the
United States, immigrant students
are divided into three categories:
adult arrivals, those who arrived in
the United States at age 18 or older;
adolescent arrivals, who arrived in
the United States between ages 12
and 17; and child arrivals, who arrived
in the United States before age 12.
These age groups align with those
used in prior research on age at
immigration (Baum and Flores
2011; Rumbaut 2004; Portes and
Rumbaut 2006).
After discussing changes in the
generational status composition of
all undergraduates, subsequent
analysis of background characteris-
tics, academic preparation, and
enrollment characteristics of New
American undergraduates focuses
on Asian and Hispanic students, who
comprise the majority of immigrant
and second-generation American
undergraduates. The final section
examines immigrant outcomes by
age at immigration.
The data and analysis presented in
this study are limited by a number of
factors. First, small sample sizes do
not permit the analysis of immigrants’
postsecondary experiences and out-
comes by region and country of
origin. The data also do not include
information on the type or level of
education that students’ parents might
have completed in another country.
The current study, unlike the prior
study, does not include state-level
analyses because state-level repre-
sentative samples were not included in
NPSAS:12. Finally, although NPSAS
does collect data on students’ citizen-
ship status, the study does not collect
information on whether students who
are not citizens are in the United States
legally. Consequently, the study does
not provide any information on undoc-
umented immigrants.
All comparisons of estimates were
tested for statistical significance using
the Student’s t statistic, and all differ-
ences cited are statistically significant
at the p < .05 level.7
7 No adjustments for multiple comparisons were made. The standard errors for the estimates can be found at http://nces.ed.gov/pubsearch/pubsinfo.asp?pubid=2017414.
4
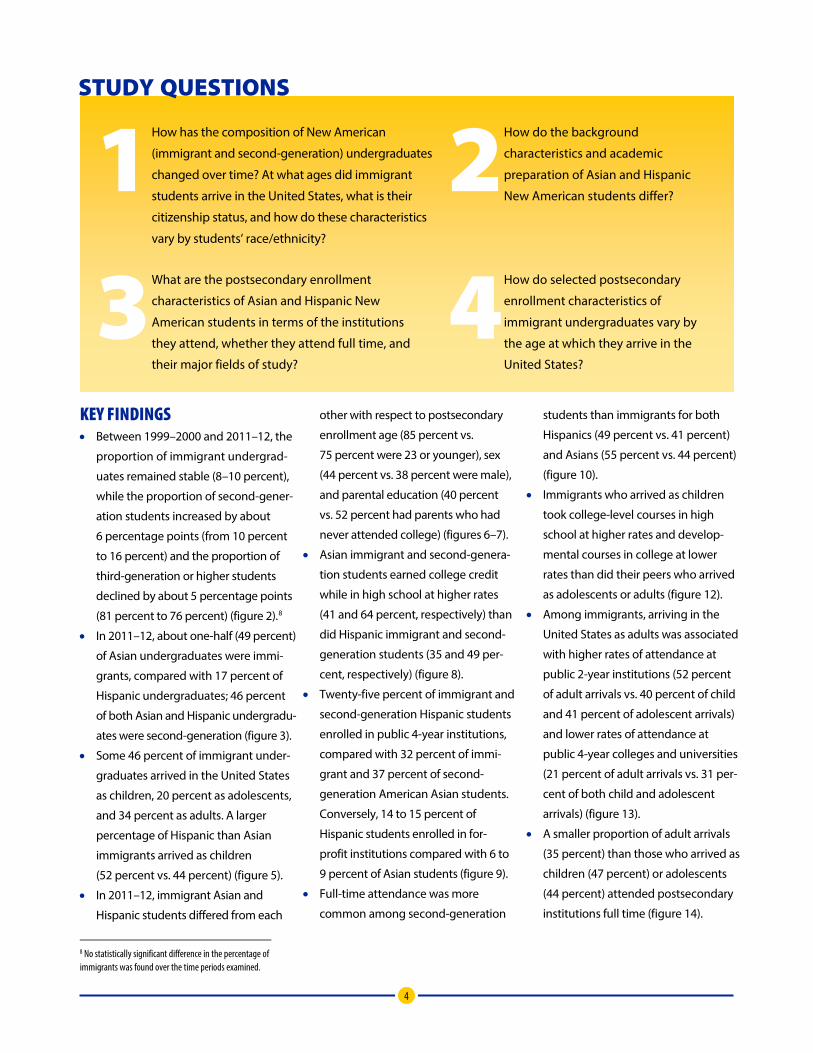
STUDY QUESTIONS
1 How has the composition of New American
(immigrant and second-generation) undergraduates
changed over time? At what ages did immigrant
students arrive in the United States, what is their
citizenship status, and how do these characteristics
vary by students’ race/ethnicity?
2 How do the background
characteristics and academic
preparation of Asian and Hispanic
New American students differ?
3 What are the postsecondary enrollment
characteristics of Asian and Hispanic New
American students in terms of the institutions
they attend, whether they attend full time, and
their major fields of study?
4 How do selected postsecondary
enrollment characteristics of
immigrant undergraduates vary by
the age at which they arrive in the
United States?
KEY FINDINGS • Between 1999–2000 and 2011–12, the
proportion of immigrant undergrad-
uates remained stable (8–10 percent),
while the proportion of second-gener-
ation students increased by about
6 percentage points (from 10 percent
to 16 percent) and the proportion of
third-generation or higher students
declined by about 5 percentage points
(81 percent to 76 percent) (figure 2).8
8 No statistically significant difference in the percentage of immigrants was found over the time periods examined.
• In 2011–12, about one-half (49 percent)
of Asian undergraduates were immi-
grants, compared with 17 percent of
Hispanic undergraduates; 46 percent
of both Asian and Hispanic undergradu-
ates were second-generation (figure 3).
• Some 46 percent of immigrant under-
graduates arrived in the United States
as children, 20 percent as adolescents,
and 34 percent as adults. A larger
percentage of Hispanic than Asian
immigrants arrived as children
(52 percent vs. 44 percent) (figure 5).
• In 2011–12, immigrant Asian and
Hispanic students differed from each
other with respect to postsecondary
enrollment age (85 percent vs.
75 percent were 23 or younger), sex
(44 percent vs. 38 percent were male),
and parental education (40 percent
vs. 52 percent had parents who had
never attended college) (figures 6–7).
• Asian immigrant and second-genera-
tion students earned college credit
while in high school at higher rates
(41 and 64 percent, respectively) than
did Hispanic immigrant and second-
generation students (35 and 49 per-
cent, respectively) (figure 8).
• Twenty-five percent of immigrant and
second-generation Hispanic students
enrolled in public 4-year institutions,
compared with 32 percent of immi-
grant and 37 percent of second-
generation American Asian students.
Conversely, 14 to 15 percent of
Hispanic students enrolled in for-
profit institutions compared with 6 to
9 percent of Asian students (figure 9).
• Full-time attendance was more
common among second-generation
students than immigrants for both
Hispanics (49 percent vs. 41 percent)
and Asians (55 percent vs. 44 percent)
(figure 10).
• Immigrants who arrived as children
took college-level courses in high
school at higher rates and develop-
mental courses in college at lower
rates than did their peers who arrived
as adolescents or adults (figure 12).
• Among immigrants, arriving in the
United States as adults was associated
with higher rates of attendance at
public 2-year institutions (52 percent
of adult arrivals vs. 40 percent of child
and 41 percent of adolescent arrivals)
and lower rates of attendance at
public 4-year colleges and universities
(21 percent of adult arrivals vs. 31 per-
cent of both child and adolescent
arrivals) (figure 13).
• A smaller proportion of adult arrivals
(35 percent) than those who arrived as
children (47 percent) or adolescents
(44 percent) attended postsecondary
institutions full time (figure 14).

5
1 How has the composition of New American (immigrant and second-generation) undergraduates changed over time? At what ages did immigrant students arrive in the United States, what is their citizenship status, and how do these characteristics vary by students’ race/ethnicity?
Immigrant and second-generation
undergraduates comprised 24 per-
cent of the undergraduate student
population in 2011–12. In the years
examined (1999–2000, 2003–04,
2007–08, and 2011–12), immigrants
comprised 8–10 percent of all U.S.
undergraduates, with no statistically
significant differences in their
representation across these years
(figure 1). In contrast, the proportion
of second-generation students
was 6 percentage points higher
in 2011–12 than in 1999–2000
(16 percent vs. 10 percent), and the
proportion of undergraduates
who were third-generation or
higher was 5 percentage points
lower (76 percent vs. 81 percent).
FIGURE 1. UNDERGRADUATE IMMIGRANT GENERATIONS OVER TIME Percentage distribution of undergraduates, by immigrant generation: 1999–2000, 2003–04, 2007–08, and 2011–12
81 78 77 76
10 12 13 16
9 10 10 8
0
20
40
60
80
100
1999–2000 2003–04 2007–08 2011–12
Percent
Year
Immigrants¹
Second-generationAmericans²
Third-generation orhigher Americans³
1 Immigrant undergraduates were citizens, permanent residents, or noncitizens eligible for citizenship who were born abroad to at least one foreign-born parent. 2 Second-generation American students were born in the United States to at least one parent who was born abroad. 3 Third-generation or higher American students were born in the United States to U.S.-born parents. NOTE: Estimates exclude foreign students or nonresident aliens who do not have citizenship or were not admitted to the United States for the purpose of obtaining permanent residency. For information on the samples included in these studies, see Staklis, S., and Horn, L. (2012). New Americans in Postsecondary Education: A Profile of Immigrant and Second-Generation American Undergraduates (NCES 2012-213). Estimates include undergraduate students who were enrolled in Title IV eligible postsecondary institutions in the 50 states and the District of Columbia. The 2011–12 sample design did not include Puerto Rican institutions. To provide comparable estimates over time, sample members from Puerto Rican institutions have been excluded from estimates generated for 1999–2000, 2003–04, and 2007–08. Detail may not sum to totals because of rounding. SOURCE: U.S. Department of Education, National Center for Education Statistics, 1999–2000, 2003–04, 2007–08, and 2011–12 National Postsecondary Student Aid Studies (NPSAS:2000, NPSAS: 04, NPSAS:08, and NPSAS:12).

6
The majority of immigrant under-
graduates were of Asian (28 percent)
or Hispanic descent (32 percent);
Asians and Hispanics together also
constituted a majority of second-
generation undergraduates (14 per-
cent and 46 percent, respectively)
(figure 2). Although Asians comprised
5 percent of all undergraduates
in 2011–12, they accounted for
28 percent of immigrant and
14 percent of second-generation
American students. Likewise, while
Hispanic students comprised
16 percent of all undergraduates,
they accounted for 32 percent of
immigrant and 46 percent of second-
generation American students.
Among third-generation or higher
students, under 1 percent were Asian
and 8 percent were Hispanic.
FIGURE 2. IMMIGRANT GENERATION, BY RACE/ETHNICITY Percentage distribution of undergraduates, by immigrant generation and race/ethnicity: 2011–12
70
23
20
59
18
10
16
16
8
46
32
16
#
14
28
5
4
7
3
4
0 20 40 60 80 100
Third-generation or higher Americans³
Second-generation Americans²
Immigrants¹
All undergraduates
Percent
White Black Hispanic/Latino Asian Other
# Rounds to zero. 1 Immigrant undergraduates were citizens, permanent residents, or noncitizens eligible for citizenship who were born abroad to at least one foreign-born parent. 2 Second-generation American students were born in the United States to at least one parent who was born abroad. 3 Third-generation or higher American students were born in the United States to U.S.-born parents. NOTE: Black includes African American, and Other includes American Indian or Alaska Native, Native Hawaiian or Other Pacific Islander, or students who are more than one race. Race categories exclude Hispanic origin unless specified. Estimates exclude foreign students or nonresident aliens who do not have citizenship or were not admitted to the United States for the purpose of obtaining permanent residency. Estimates include students enrolled in Title IV eligible post-secondary institutions in the 50 states and the District of Columbia. Detail may not sum to totals because of rounding. SOURCE: U.S. Department of Education, National Center for Education Statistics, 2011–12 National Postsecondary Student Aid Study (NPSAS:12).

7
As was found in 2007–08 (Staklis and
Horn 2012), more than one-half of
Asian and Hispanic undergraduates
in 2011–12 (figure 3) were New
Americans. In contrast, 9 percent
and 18 percent of White and Black
undergraduates, respectively, were
New Americans. Asian and Hispanic
students differed with respect to
generational status. Immigrants
constituted a larger proportion of
Asian than Hispanic undergraduates
(49 percent vs. 17 percent). Con-
versely, third-generation or higher
American students constituted a
larger proportion of Hispanic than
Asian undergraduates (37 percent vs.
5 percent of Asian undergraduates).
In contrast to both Asian and Hispanic
undergraduates, three-quarters of all
undergraduates, 91 percent of White
students, and 82 percent of Black
students were third-generation or
higher Americans.
FIGURE 3. RACE/ETHNICITY, BY IMMIGRANT GENERATION Percentage distribution of undergraduates, by race/ethnicity and immigrant generation: 2011–12
7691 82
37
5
69
166
10
46
46
24
8 3 817
49
7
0
20
40
60
80
100
Allunder-
graduates
White Black Hispanic/Latino
Asian Other
Percent
Race/ethnicity
Immigrants¹
Second-generationAmericans²
Third-generationor higherAmericans³
1 Immigrant undergraduates were citizens, permanent residents, or noncitizens eligible for citizenship who were born abroad to at least one foreign-born parent. 2 Second-generation American students were born in the United States to at least one parent who was born abroad. 3 Third-generation or higher American students were born in the United States to U.S.-born parents. NOTE: Black includes African American, and Other includes American Indian or Alaska Native, Native Hawaiian or Other Pacific Islander, or students who are more than one race. Race categories exclude Hispanic origin unless specified. Estimates exclude foreign students or nonresident aliens who do not have citizenship or were not admitted to the United States for the purpose of obtaining permanent residency. Estimates include students enrolled in Title IV eligible post-secondary institutions in the 50 states and the District of Columbia. Detail may not sum to totals because of rounding. SOURCE: U.S. Department of Education, National Center for Education Statistics, 2011–12 National Postsecondary Student Aid Study (NPSAS:12).
8
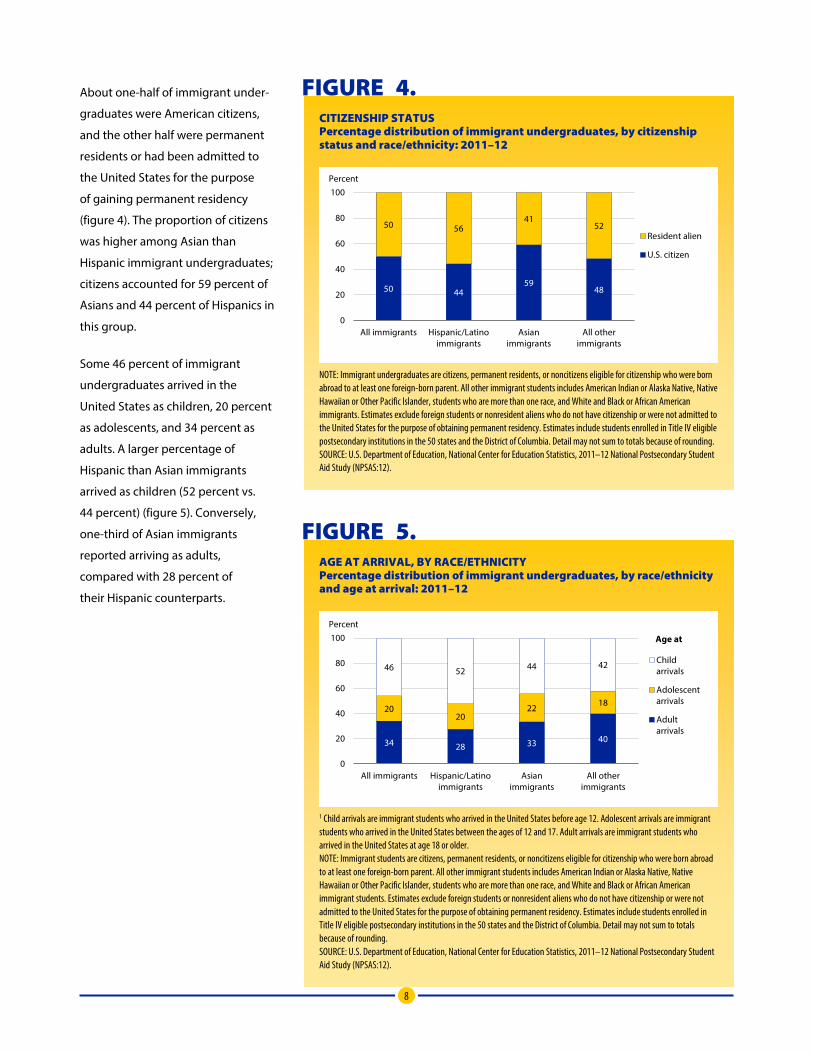
About one-half of immigrant under-
graduates were American citizens,
and the other half were permanent
residents or had been admitted to
the United States for the purpose
of gaining permanent residency
(figure 4). The proportion of citizens
was higher among Asian than
Hispanic immigrant undergraduates;
citizens accounted for 59 percent of
Asians and 44 percent of Hispanics in
this group.
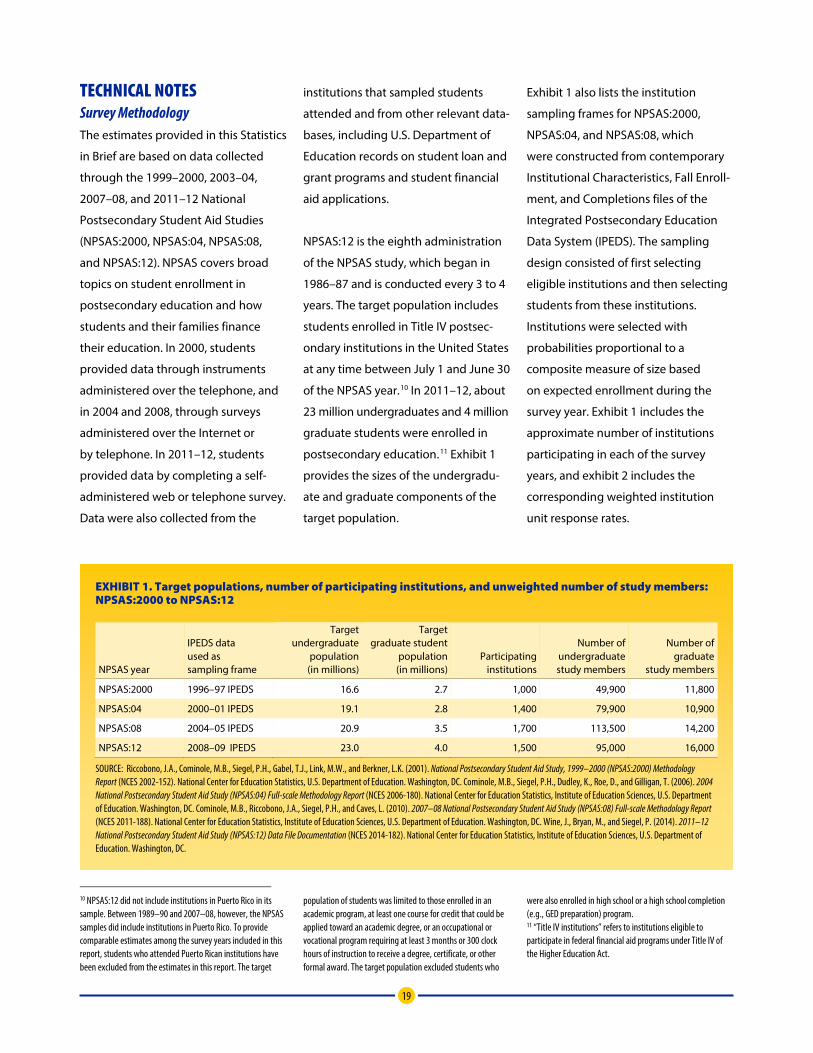
Some 46 percent of immigrant
undergraduates arrived in the
United States as children, 20 percent
as adolescents, and 34 percent as
adults. A larger percentage of
Hispanic than Asian immigrants
arrived as children (52 percent vs.
44 percent) (figure 5). Conversely,
one-third of Asian immigrants
reported arriving as adults,
compared with 28 percent of
their Hispanic counterparts.
FIGURE 4. CITIZENSHIP STATUS Percentage distribution of immigrant undergraduates, by citizenship status and race/ethnicity: 2011–12
50 4459
48
50 5641
52
0
20
40
60
80
100
All immigrants Hispanic/Latinoimmigrants
Asianimmigrants
All otherimmigrants
Percent
Resident alien
U.S. citizen
NOTE: Immigrant undergraduates are citizens, permanent residents, or noncitizens eligible for citizenship who were born abroad to at least one foreign-born parent. All other immigrant students includes American Indian or Alaska Native, Native Hawaiian or Other Pacific Islander, students who are more than one race, and White and Black or African American immigrants. Estimates exclude foreign students or nonresident aliens who do not have citizenship or were not admitted to the United States for the purpose of obtaining permanent residency. Estimates include students enrolled in Title IV eligible postsecondary institutions in the 50 states and the District of Columbia. Detail may not sum to totals because of rounding. SOURCE: U.S. Department of Education, National Center for Education Statistics, 2011–12 National Postsecondary Student Aid Study (NPSAS:12).
FIGURE 5. AGE AT ARRIVAL, BY RACE/ETHNICITY Percentage distribution of immigrant undergraduates, by race/ethnicity and age at arrival: 2011–12
34 28 33 40
2020
22 18
46 52 44 42
0
20
40
60
80
100
All immigrants Hispanic/Latinoimmigrants
Asianimmigrants
All otherimmigrants
Percent
Childarrivals
Adolescentarrivals
Adultarrivals
Age at
1 Child arrivals are immigrant students who arrived in the United States before age 12. Adolescent arrivals are immigrant students who arrived in the United States between the ages of 12 and 17. Adult arrivals are immigrant students who arrived in the United States at age 18 or older. NOTE: Immigrant students are citizens, permanent residents, or noncitizens eligible for citizenship who were born abroad to at least one foreign-born parent. All other immigrant students includes American Indian or Alaska Native, Native Hawaiian or Other Pacific Islander, students who are more than one race, and White and Black or African American immigrant students. Estimates exclude foreign students or nonresident aliens who do not have citizenship or were not admitted to the United States for the purpose of obtaining permanent residency. Estimates include students enrolled in Title IV eligible postsecondary institutions in the 50 states and the District of Columbia. Detail may not sum to totals because of rounding. SOURCE: U.S. Department of Education, National Center for Education Statistics, 2011–12 National Postsecondary Student Aid Study (NPSAS:12).

9
2 How do the background characteristics and academic preparation of Asian and Hispanic New American students differ?
The remainder of this report focuses
on Asian and Hispanic students who
make up the majority of New American
students. As detailed below, in 2011–12,
immigrant and second-generation Asian
and Hispanic students differed from
each other and from all undergraduates
with respect to age at enrollment, sex,
and parental education. The extent
to which English was the primary lan-
guage spoken in the home also varied
between these two groups.
The two age groups compared in this
study—students age 23 or younger and
those 24 or older—reflect the division
between those who likely receive
financial support from their parents
and students who are generally consid-
ered financially independent of their
parents.9
9 For additional information on financial dependency for college students, please see https://studentaid.ed.gov/glossary#Dependent_Student.
The two age groups also mark
the division between “traditional-age”
and older undergraduates. Traditional-
age students generally take little, if any,
time off between high school and
college and attain credentials at higher
rates than do students who first enroll in
postsecondary education as older stu-
dents (Wyatt 2011). Among all 2011–12
undergraduates, 82 percent were age
23 or younger (figure 6). In comparison,
this younger age group made up a
larger proportion of Asian immigrant
students (85 percent), but a smaller
proportion of Hispanic immigrant
undergraduates (75 percent). Students
age 23 or younger also made up a
FIGURE 6. TRADITIONAL-AGE UNDERGRADUATES AND PERCENTAGE OF MALES Percentage of New American undergraduates age 23 or younger, and percentage who were male, by race/ethnicity and immigrant generation: 2011–12
92
85
89
75
82
Second-generation Americans²
Immigrants¹
Second-generation Americans²
Immigrants¹
All undergraduates
Hispanic/Latino
Asian
Age 23 or younger
53
56
56
62
57
47
44
44
38
43
0 20 40 60 80 100
Second-generation Americans²
Immigrants¹
Second-generation Americans²
Immigrants¹
All undergraduates
Percent
Male
Female
Hispanic/Latino
Asian
Sex
1 Immigrant students are citizens, permanent residents, or noncitizens eligible for citizenship who were born abroad to at least one foreign-born parent. 2 Second-generation American students were born in the United States to at least one parent who was born abroad. NOTE: New American students include immigrant and second-generation American students. Estimates exclude foreign students or nonresident aliens who do not have citizenship or were not admitted to the United States for the purpose of obtaining permanent residency. Data for American Indian or Alaska Native, Native Hawaiian or Other Pacific Islander, Black or African American, White, or undergraduates with more than one race are not shown separately but are included in the data for all undergraduates. Estimates include students enrolled in Title IV eligible postsecondary institutions in the 50 states and the District of Columbia. SOURCE: U.S. Department of Education, National Center for Education Statistics, 2011–12 National Postsecondary Student Aid Study (NPSAS:12).

10
larger proportion of both Asian
(92 percent) and Hispanic (89 percent)
second-generation American students
than of all undergraduates.
Recent studies have documented
declining proportions of young men in
postsecondary education (DiPrete and
Buchmann 2013). In 2011–12, men com-
prised 43 percent of all undergraduates
and also less than one-half of Hispanic
and Asian New American students.
Males accounted for 38 percent of
Hispanic immigrant students and
44 percent of Asian immigrant students
(figure 6). For all groups, more under-
graduates were women than men, with
higher proportions of female immigrants
than second-generation students.
Parental education is associated with
student educational attainment, and
varies by country of origin and immi-
grant generation (Portes and Rumbaut
2006; Feliciano 2005). Asian and Hispanic
immigrant and second-generation
students differed from each other and
from all undergraduates in terms of the
percentage who were from families
where neither parent had attended
college. Compared with all undergradu-
ates (33 percent), higher percentages of
both Hispanic and Asian immigrants
(52 percent and 40 percent, respectively)
had parents who had no college educa-
tion either in the United States or in
another country (figure 7). In addition,
proportionally more second-generation
Hispanic undergraduates (54 percent)
than all undergraduates (33 percent)
had parents with no college education.
Among Asian undergraduates, however,
proportionally fewer second-generation
students (30 percent) than all under-
graduates (33 percent) had parents who
had never attended college.
Finally, the frequency with which
English was the primary language
spoken in the home was lower for both
Hispanic and Asian immigrant under-
graduates than for all undergraduates
(19 and 24 percent vs. 87 percent,
respectively) (figure 7). Likewise, about
two-thirds of both Hispanic and Asian
second-generation undergraduates
(63 percent and 65 percent, respectively)
reported that English was the primary
language spoken in the home, which was
lower than among all undergraduates.
The academic preparation of New
American students was examined in
two ways. First, the analysis examined
college-level coursetaking before
FIGURE 7. PARENTS’ EDUCATION AND ENGLISH SPOKEN IN THE HOME Percentage of New American undergraduates whose parents did not attend postsecondary education, and percentage who reported English as the primary language spoken in the home, by race/ethnicity and immigrant generation: 2011–12
65
24
63
19
87
30
40
54
52
33
0 20 40 60 80 100
Second-generation Americans²
Immigrants¹
Second-generation Americans²
Immigrants¹
All undergraduates
Second-generation Americans²
Immigrants¹
Second-generation Americans²
Immigrants¹
All undergraduates
Percent
Hispanic/Latino
Asian
Hispanic/Latino
Asian
English as the primary language
Parents did not attend college
1 Immigrant students are citizens, permanent residents, or noncitizens eligible for citizenship who were born abroad to at least one foreign-born parent. 2 Second-generation American students were born in the United States to at least one parent who was born abroad. NOTE: New American students include immigrant and second-generation American students. Estimates exclude foreign students or nonresident aliens who do not have citizenship or were not admitted to the United States for the purpose of obtaining permanent residency. Data for American Indian or Alaska Native, Native Hawaiian or Other Pacific Islander, Black or African American, White, or undergraduates with more than one race are not shown separately but are included in the data for all undergraduates. Estimates include students enrolled in Title IV eligible postsecondary institutions in the 50 states and the District of Columbia. SOURCE: U.S. Department of Education, National Center for Education Statistics, 2011–12 National Postsecondary Student Aid Study (NPSAS:12).

11
college entry by examining self-reports
of enrollment in Advanced Placement
(AP) or of other college coursetaking in
high school. This information was only
available for undergraduates under
age 30. Second, the analysis examined
the extent to which students reported
ever taking developmental education
courses (also called remedial courses)
in college. When considering the find-
ings below, it is important to remember
that unobservable secondary school
characteristics, such as the availability
of college-level courses, may contribute
to the differences identified below
(Baum and Flores 2011).
Among undergraduates under age 30,
second-generation Asians and Hispanics
took college-level courses in high
school at higher rates, 64 percent and
49 percent, respectively, than all under-
graduates did (42 percent) (figure 8).
Second-generation Asians and Hispanics
also took these courses at higher rates
than their immigrant counterparts.
Among both immigrant and second-
generation undergraduates, a higher
proportion of Asian than Hispanic
undergraduates reported college-level
coursetaking in high school: 41 percent
of Asian immigrant undergraduates
took these courses vs. 35 percent of
Hispanics. For second-generation Asian
and Hispanic undergraduates, the
percentages were 64 percent and
49 percent, respectively.
As with college-level coursetaking in
high school, developmental education
coursetaking in college also varied by
generational status (figure 8). Second-
generation undergraduates reported
lower rates of developmental education
coursetaking than did immigrant
undergraduates. Among immigrant
undergraduates, 45 percent of Hispanics
reported taking developmental courses,
compared with 38 percent of their Asian
peers. Similarly, 38 percent of Hispanic
second-generation undergraduates
took these courses, compared with
27 percent of Asian second-generation
undergraduates who did the same.
FIGURE 8. COLLEGE CREDITS EARNED IN HIGH SCHOOL AND DEVELOPMENTAL COURSETAKING IN COLLEGE Percentage of New American undergraduates who reported taking college-level courses (advanced placement or college courses) in high school, and percentage who reported ever taking a developmental course to improve basic skills since completing high school, by race/ethnicity and immigrant generation: 2011–12
27
38
38
45
31
64
41
49
35
42
0 20 40 60 80 100
Second-generation Americans²
Immigrants¹
Second-generation Americans²
Immigrants¹
All undergraduates
Second-generation Americans²
Immigrants¹
Second-generation Americans²
Immigrants¹
All undergraduates
Percent
Hispanic/Latino
Asian
Hispanic/Latino
Asian
Took a developmental course
Earned college credit (AP or credits) in high school
1 Immigrant students are citizens, permanent residents, or noncitizens eligible for citizenship who were born abroad to at least one foreign-born parent. 2 Second-generation American students were born in the United States to at least one parent who was born abroad. NOTE: New American students include immigrant and second-generation American students. Self-reported data about courses taken in high school prior to college enrollment are available for respondents under age 30 only. Estimates exclude foreign students or nonresident aliens who do not have citizenship or were not admitted to the United States for the purpose of obtaining permanent residency. Data for American Indian or Alaska Native, Native Hawaiian or Other Pacific Islander, Black or African American, White, or undergraduates with more than one race are not shown separately but are included in the data for all undergraduates. Estimates include students enrolled in Title IV eligible postsecondary institutions in the 50 states and the District of Columbia. SOURCE: U.S. Department of Education, National Center for Education Statistics, 2011–12 National Postsecondary Student Aid Study (NPSAS:12).

12
3 What are the postsecondary enrollment characteristics of Asian and Hispanic New American students in terms of the institutions they attend, whether they attend full time, and their major fields of study?
New Americans’ enrollment in post-
secondary institutions was compared
across the four main institution types:
public 2-year, public 4-year, private
nonprofit 4-year, and for-profit institu-
tions. The percentage attending
public 4-year institutions was lower
for Hispanics than for Asians among
both immigrant and second-generation
students (figure 9). Twenty-five
percent of both Hispanic immigrant
and second-generation students
attended public 4-year institutions,
compared with 32 percent of
immigrant and 37 percent of second-
generation Asian students. Conversely,
enrollment in for-profit institutions
was higher for Hispanic than for Asian
students. For-profit institutions
accounted for 15 percent of immi-
grant and 14 percent of second-
generation Hispanic students’
enrollment, respectively. In contrast,
6 percent and 9 percent of immigrants
and second-generation Asian
students, respectively, attended
for-profit institutions.
FIGURE 9. INSTITUTION TYPE Percentage distribution of New American undergraduates’ type of institution, by race/ethnicity and immigrant generation: 2011–12
3847 44 41
28
2825 25 32
37
12 6 811
14
13 15 146
9
9 8 9 9 12
0
20
40
60
80
100
Allunder-
graduates
Immi-grants¹
Second-generationAmericans²
Immi-grants¹
Second-generationAmericans²
Percent
Hispanic/Latino Asian
Others or attended more than one school
For-profit
Private nonprofit 4-year
Public 4-year
Public 2-year
1 Immigrant students are citizens, permanent residents, or noncitizens eligible for citizenship who were born abroad to at least one foreign-born parent. 2 Second-generation American students were born in the United States to at least one parent who was born abroad. NOTE: For-profit institutions include less-than-2-year, 2-year, and 4-year institutions. Estimates exclude foreign students or nonresident aliens who do not have citizenship or were not admitted to the United States for the purpose of obtaining permanent residency. Data for American Indian or Alaska Native, Native Hawaiian or Other Pacific Islander, Black or African American, White, or undergraduates with more than one race are not shown separately but are included in the data for all undergraduates. Estimates include students enrolled in Title IV eligible postsecondary institutions in the 50 states and the District of Columbia. Detail may not sum to totals because of rounding. SOURCE: U.S. Department of Education, National Center for Education Statistics, 2011–12 National Postsecondary Student Aid Study (NPSAS:12).

13
Full-time attendance also varied with
the generational status of Hispanic
and Asian students. Hispanic and
Asian immigrants attended full time
at lower rates (41 percent and
44 percent, respectively) than both
all undergraduates (50 percent) and
their second-generation counterparts
(49 percent among Hispanic and
55 percent among Asian students)
(figure 10).
FIGURE 10. FULL-TIME ATTENDANCE Percentage of New American undergraduates who attended full time, by race/ethnicity and immigrant generation: 2011–12
50
41
4944
55
0
20
40
60
80
100
All under-graduates
Immigrants¹ Second-generationAmericans²
Immigrants¹ Second-generationAmericans²
Percent
Hispanic/Latino Asian
1 Immigrant students are citizens, permanent residents, or noncitizens eligible for citizenship who were born abroad to at least one foreign-born parent. 2 Second-generation American students were born in the United States to at least one parent who was born abroad. NOTE: Estimates exclude foreign students or nonresident aliens who do not have citizenship or were not admitted to the United States for the purpose of obtaining permanent residency. Data for American Indian or Alaska Native, Native Hawaiian or Other Pacific Islander, Black or African American, White, or undergraduates with more than one race are not shown separately but are included in the data for all undergraduates. Estimates include students enrolled in Title IV eligible postsecondary institutions in the 50 states and the District of Columbia. SOURCE: U.S. Department of Education, National Center for Education Statistics, 2011–12 National Postsecondary Student Aid Study (NPSAS:12).

14
Finally, the fields in which New
American Asian and Hispanic under-
graduates majored also varied with
their immigrant generation status
(figure 11). Due to small sample sizes,
major fields of study were aggregated
into seven categories, and immigrant
and second-generation were combined
into an all New Americans category
for Asian and Hispanic undergraduates,
respectively. The most common major
category among Asian New Americans
was engineering, math, computer,
and physical sciences. Asian New
Americans majored in these fields at
a rate that was 12 percentage points
higher than that of their Hispanic
peers (26 percent vs. 14 percent) and
11 percentage points higher than that
of all undergraduates (15 percent).
The most common major category
among Hispanic New Americans was
education and other applied fields
(24 percent).
FIGURE 11. MAJOR FIELD OF STUDY Percentage distribution of undergraduates’ major field of study, by immigrant generation and race/ethnicity: 2011–12
8
5
5
26
14
15
8
9
7
15
18
19
17
14
15
15
17
16
12
24
23
0 20 40 60 80 100
Asian
Hispanic/Latino
All undergraduates
Percent
Unknown/undecided
Engineering,math, computer,and physicalsciences
Social sciences,includingpsychology
Healthcarefields
Business Humanities,general studies,and history
Education andother applied
First- and second-generation¹,²
1 Immigrant students are citizens, permanent residents, or noncitizens eligible for citizenship who were born abroad to at least one foreign-born parent. 2 Second-generation American students were born in the United States to at least one parent who was born abroad. NOTE: Computer and information sciences, engineering and engineering technology and biology, physical science, technology, math and agriculture are combined. Social sciences includes psychology. Humanities, history, general studies and all other are combined. Estimates exclude foreign students or nonresident aliens who do not have citizenship or were not admitted to the United States for the purpose of obtaining permanent residency. Data for American Indian or Alaska Native, Native Hawaiian or Other Pacific Islander, Black or African American, White, or undergraduates with more than one race are not shown separately but are included in the data for all undergraduates. Estimates include students enrolled in Title IV eligible postsecondary institutions in the 50 states and the District of Columbia. Detail may not sum to totals because of rounding. SOURCE: U.S. Department of Education, National Center for Education Statistics, 2011–12 National Postsecondary Student Aid Study (NPSAS:12).

15
4 How do selected postsecondary enrollment characteristics of immigrant undergraduates vary by the age at which they arrive in the United States?
Study findings revealed that the
age at which immigrants arrived in
the United States was associated
with specific enrollment characteris-
tics, including traditional age at
enrollment, academic preparation
indicators, the type of institution
attended, full-time attendance, and
major field of study. The outcomes of
immigrants who arrived as children
(under age 12) were distinct from
those of adolescent (ages 12–17) and
adult (age 18 or older) arrivals.
Immigrants’ age at arrival in the United
States and their age of postsecondary
enrollment are related, since those
who arrive as adults may be older
at immigration than the traditional
enrollment age (age 23 or younger),
and those who arrive as children have
more time and opportunity to prepare
for college. Some 19 percent of adult
arrivals enrolled in college at a tradi-
tional age, compared with 61 percent
of child arrivals (figure 12). The per-
centage of child arrivals who enrolled
in postsecondary education before
they reached age 24 was lower than
the 82 percent of all undergraduates
who did so. Adolescent arrivals fell
between child and adult arrivals:
54 percent enrolled when they were
in the traditional age range.
FIGURE 12. TRADITIONAL AGE UNDERGRADUATES, COLLEGE CREDIT IN HIGH SCHOOL, AND DEVELOPMENTAL EDUCATION, BY AGE AT ARRIVAL Percentage of immigrant undergraduates age 23 or younger; among undergraduates under age 30, percentage who reported taking college-level courses (AP/or college courses) in high school, and percentage of all undergraduates who reported ever taking a developmental course to improve basic skills since completing high school, by age at arrival: 2011–12
48
46
33
31
15
36
50
42
19
54
61
82
0 20 40 60 80 100
Adult arrivals
Adolescent arrivals
Child arrivals
All undergraduates
Adult arrivals
Adolescent arrivals
Child arrivals
All undergraduates
Adult arrivals
Adolescent arrivals
Child arrivals
All undergraduates
Percent
Took a developmental course
Earned college credit (AP or credits) in high school
Age 23 or younger
NOTE: Child arrivals are immigrant students who arrived in the United States before age 12. Adolescent arrivals are immigrant students who arrived in the United States between the ages of 12 and 17. Adult arrivals are immigrant students who arrived in the United States at age 18 or older. Self-reported data about courses taken in high school prior to college enrollment are available for undergraduates under age 30 only. Estimates exclude foreign students or nonresident aliens who do not have citizenship or were not admitted to the United States for the purpose of obtaining permanent residency. Estimates include students enrolled in Title IV eligible postsecondary institutions in the 50 states and the District of Columbia. SOURCE: U.S. Department of Education, National Center for Education Statistics, 2011–12 National Postsecondary Student Aid Study (NPSAS:12).

16
Examining the two indicators of academic
preparation—taking AP or college-level
courses in high school and absence of
developmental courses in college—
revealed stronger academic preparation
for immigrants who arrived in childhood
than as adolescents or adults. Among
students who were younger than age 30
in 2011–12, one-half of child arrivals
reported taking college-level courses in
high school, compared with 42 percent
of all undergraduates, 36 percent of ado-
lescent arrivals, and 15 percent of adult
arrivals. Conversely, a smaller percentage
of child arrivals than their peers who
arrived as adolescents or adults reported
ever taking a developmental course in
college (33 percent vs. 46 percent and
48 percent, respectively). Larger propor-
tions of adolescent and adult arrivals
took remedial courses than did all under-
graduates (31 percent).
The type of institutions undergraduates
attended and whether they attended
full time also varied with immigrant
students’ age at arrival. Arriving in the
United States as adults was associated
with higher rates of attendance at public
2-year institutions; 52 percent of this
group attended public 2-year institu-
tions, compared with 40 percent of child
and 41 percent of adolescent arrivals.
Conversely, 21 percent of those arriving
as adults attended public 4-year institu-
tions, compared with 31 percent of child
and 31 percent of adolescent arrivals
(figure 13). Also, the younger the age at
arrival, the higher the percentage of
full-time attendance: 47 percent of
child arrivals, 44 percent of adolescent
arrivals, and 35 percent of adult arrivals
attended full time (figure 14).
FIGURE 13. INSTITUTION TYPE, BY AGE AT ARRIVAL Percentage distribution of immigrant undergraduates’ type of institution, by age at arrival: 2011–12
38 40 4152
28 31 3121
12 10 9 713 10 11 11
9 9 8 10
0
20
40
60
80
100
All under-
graduates
Child arrivals
Adolescent arrivals
Adult arrivals
Age at arrival¹
Percent
Others or attended morethan one school
For-profit
Private nonprofit4-year
Public 4-year
Public 2-year
1 Child arrivals are immigrant students who arrived in the United States before age 12. Adolescent arrivals are immigrant students who arrived in the United States between the ages of 12 and 17. Adult arrivals are immigrant students who arrived in the United States at age 18 or older. NOTE: For-profit institutions include less-than-2-year, 2-year, and 4-year institutions. Estimates exclude foreign students or nonresident aliens who do not have citizenship or were not admitted to the United States for the purpose of obtaining permanent residency. Estimates include students enrolled in Title IV eligible postsecondary institutions in the 50 states and the District of Columbia. Detail may not sum to totals because of rounding. SOURCE: U.S. Department of Education, National Center for Education Statistics, 2011–12 National Postsecondary Student Aid Study (NPSAS:12).
FIGURE 14. FULL-TIME ENROLLMENT, BY AGE AT ARRIVAL Percentage of immigrant undergraduates enrolled full time, by age at arrival: 2011–12
35
44
47
50
0 20 40 60 80 100
Adult arrivals
Adolescent arrivals
Child arrivals
All undergraduates
Percent
Age at arrival¹
1 Child arrivals are immigrant students who arrived in the United States before age 12. Adolescent arrivals are immigrant students who arrived in the United States between the ages of 12 and 17. Adult arrivals are immigrant students who arrived in the United States at age 18 or older. NOTE: Estimates exclude foreign students or nonresident aliens who do not have citizenship or were not admitted to the United States for the purpose of obtaining permanent residency. Estimates include students enrolled in Title IV eligible postsecondary institutions in the 50 states and the District of Columbia. SOURCE: U.S. Department of Education, National Center for Education Statistics, 2011–12 National Postsecondary Student Aid Study (NPSAS:12).

17
Immigrants who arrived as children
and adolescents majored in science,
technology, engineering, and math-
ematics fields at higher rates (21 percent
and 20 percent, respectively) than did
their peers who arrived as adults
(15 percent) (figure 15). Younger
arrivals also majored in social science
fields more often than adult arrivals did
(8 percent and 7 percent for child and
adolescent arrivals, respectively, vs.
4 percent for adult arrivals). Conversely,
a larger percentage of adult arrivals
(25 percent) than child and adolescent
arrivals (19 percent each) majored in
health care fields.
FIGURE 15. MAJOR FIELD OF STUDY, BY AGE AT ARRIVAL Percentage distribution of undergraduates’ major field of study, by age at arrival: 2011–12
7
3
5
5
15
20
21
15
4
7
8
7
25
19
19
19
17
21
14
15
14
16
16
16
17
16
16
23
0 20 40 60 80 100
Adult arrivals
Adolescent arrivals
Child arrivals
All undergraduates
Percent
Unknown/undecided
Engineering,math, computer,and physicalsciences
Social sciences,includingpsychology
Healthcarefields
Business Humanities,general studies,and history
Education andother applied
Age at arrival¹
1 Child arrivals are immigrant students who arrived in the United States before age 12. Adolescent arrivals are immigrant students who arrived in the United States between the ages of 12 and 17. Adult arrivals are immigrant students who arrived in the United States at age 18 or older. NOTE: Computer and information sciences, engineering and engineering technology and biology, physical science, technology, math and agriculture are combined. Social sciences includes psychology. Humanities, history, general studies and other are combined. Estimates exclude foreign students or nonresident aliens who do not have citizenship or were not admitted to the United States for the purpose of obtaining permanent residency. Estimates include students enrolled in Title IV eligible postsecondary institutions in the 50 states and the District of Columbia. Detail may not sum to totals because of rounding. SOURCE: U.S. Department of Education, National Center for Education Statistics, 2011–12 National Postsecondary Student Aid Study (NPSAS:12).

18
FIND OUT MORE
For questions about content or to order additional copies of this Statistics in Brief or view this report online, go to:
http://nces.ed.gov/pubsearch/pubsinfo.asp?pubid=2017414
More detailed information on 2011–12 U.S. undergrad-
uates can be found in Web Tables produced by NCES
using the NPSAS:12 data. Included are estimates of
students’ demographics, enrollment, and employment
characteristics.
2011–12 National Postsecondary Student Aid Study
(NPSAS:12): Student Financial Aid Estimates for
2011–12 (NCES 2013-165).
http://nces.ed.gov/pubsearch/pubsinfo.asp?
pubid=2013165
Web Tables—Profile of Undergraduate Students in U.S.
Postsecondary Institutions: 2011–12 (NCES 2015-167).
http://nces.ed.gov/pubsearch/pubsinfo.asp?
pubid=2015167
Readers may also be interested in the following
NCES products related to topics covered in this
Statistics in Brief:
New Americans in Postsecondary Education:
A Profile of Immigrant and Second-Generation
American Undergraduates (NCES 2012-213).
http://nces.ed.gov/pubsearch/pubsinfo.asp?
pubid=2012213
Status and Trends in the Education of Racial and
Ethnic Groups (NCES 2010-015).
http://nces.ed.gov/pubsearch/pubsinfo.asp?
pubid=2010015
Reading, Mathematics, and Science Achievement
of Language-Minority Students in Grade 8
(NCES 2012-028).
http://nces.ed.gov/pubsearch/pubsinfo.asp?
pubid=2012028
First-Year Undergraduate Remedial Coursetaking:
1999–2000, 2003–04, and 2007–08 (NCES 2013-013).
http://nces.ed.gov/pubsearch/pubsinfo.asp?
pubid=2013013
19
TECHNICAL NOTES Survey Methodology The estimates provided in this Statistics
in Brief are based on data collected
through the 1999–2000, 2003–04,
2007–08, and 2011–12 National
Postsecondary Student Aid Studies
(NPSAS:2000, NPSAS:04, NPSAS:08,
and NPSAS:12). NPSAS covers broad
topics on student enrollment in
postsecondary education and how
students and their families finance
their education. In 2000, students
provided data through instruments
administered over the telephone, and
in 2004 and 2008, through surveys
administered over the Internet or
by telephone. In 2011–12, students
provided data by completing a self-
administered web or telephone survey.
Data were also collected from the
institutions that sampled students
attended and from other relevant data-
bases, including U.S. Department of
Education records on student loan and
grant programs and student financial
aid applications.
NPSAS:12 is the eighth administration
of the NPSAS study, which began in
1986–87 and is conducted every 3 to 4
years. The target population includes
students enrolled in Title IV postsec-
ondary institutions in the United States
at any time between July 1 and June 30
of the NPSAS year.10
10 NPSAS:12 did not include institutions in Puerto Rico in its sample. Between 1989–90 and 2007–08, however, the NPSAS samples did include institutions in Puerto Rico. To provide comparable estimates among the survey years included in this report, students who attended Puerto Rican institutions have been excluded from the estimates in this report. The target
population of students was limited to those enrolled in an academic program, at least one course for credit that could be applied toward an academic degree, or an occupational or vocational program requiring at least 3 months or 300 clock hours of instruction to receive a degree, certificate, or other formal award. The target population excluded students who
were also enrolled in high school or a high school completion (e.g., GED preparation) program.
In 2011–12, about
23 million undergraduates and 4 million
graduate students were enrolled in
postsecondary education.11
11 “Title IV institutions” refers to institutions eligible to participate in federal financial aid programs under Title IV of the Higher Education Act.
Exhibit 1
provides the sizes of the undergradu-
ate and graduate components of the
target population.
Exhibit 1 also lists the institution
sampling frames for NPSAS:2000,
NPSAS:04, and NPSAS:08, which
were constructed from contemporary
Institutional Characteristics, Fall Enroll-
ment, and Completions files of the
Integrated Postsecondary Education
Data System (IPEDS). The sampling
design consisted of first selecting
eligible institutions and then selecting
students from these institutions.
Institutions were selected with
probabilities proportional to a
composite measure of size based
on expected enrollment during the
survey year. Exhibit 1 includes the
approximate number of institutions
participating in each of the survey
years, and exhibit 2 includes the
corresponding weighted institution
unit response rates.
EXHIBIT 1. Target populations, number of participating institutions, and unweighted number of study members: NPSAS:2000 to NPSAS:12
NPSAS year
IPEDS data used as sampling frame
Target undergraduate
population (in millions)
Target graduate student
population (in millions)
Participating institutions
Number of undergraduate study members
Number of graduate
study members
NPSAS:2000 1996–97 IPEDS 16.6 2.7 1,000 49,900 11,800
NPSAS:04 2000–01 IPEDS 19.1 2.8 1,400 79,900 10,900
NPSAS:08 2004–05 IPEDS 20.9 3.5 1,700 113,500 14,200
NPSAS:12 2008–09 IPEDS 23.0 4.0 1,500 95,000 16,000
SOURCE: Riccobono, J.A., Cominole, M.B., Siegel, P.H., Gabel, T.J., Link, M.W., and Berkner, L.K. (2001). National Postsecondary Student Aid Study, 1999–2000 (NPSAS:2000) Methodology Report (NCES 2002-152). National Center for Education Statistics, U.S. Department of Education. Washington, DC. Cominole, M.B., Siegel, P.H., Dudley, K., Roe, D., and Gilligan, T. (2006). 2004 National Postsecondary Student Aid Study (NPSAS:04) Full-scale Methodology Report (NCES 2006-180). National Center for Education Statistics, Institute of Education Sciences, U.S. Department of Education. Washington, DC. Cominole, M.B., Riccobono, J.A., Siegel, P.H., and Caves, L. (2010). 2007–08 National Postsecondary Student Aid Study (NPSAS:08) Full-scale Methodology Report (NCES 2011-188). National Center for Education Statistics, Institute of Education Sciences, U.S. Department of Education. Washington, DC. Wine, J., Bryan, M., and Siegel, P. (2014). 2011–12 National Postsecondary Student Aid Study (NPSAS:12) Data File Documentation (NCES 2014-182). National Center for Education Statistics, Institute of Education Sciences, U.S. Department of Education. Washington, DC.

20
The sampling frame for NPSAS:12 was
constructed from files collected in the
2008–09 and 2009–10 IPEDS cycles.
The sampling design included first
selecting eligible institutions and then
selecting students from those institu-
tions. Institutions were selected with
probabilities proportional to a compo-
site measure of size based on expected
enrollment in each NPSAS year. In
NPSAS:12, the response rate was
87 percent of approximately 1,500
sampled institutions, all of whom
were eligible (exhibit 2). In NPSAS:12,
eligible sampled students were defined
as “study respondents” if a subset of
key data elements was available from
any data source. Sample members also
must have had valid data for at least
one key variable from at least one data
source other than the U.S. Department
of Education’s Central Processing
System. Similar definitions of study
respondents were developed for each
of the earlier NPSAS administrations.
See the methodology reports listed at
the end of this section for detailed
descriptions of these definitions.
Exhibit 2 provides a summary of
weighted response rates across NPSAS
administrations. There are several
types of participation/coverage rates
in NPSAS. For the student records col-
lection phase of the study, institution
completion rates vary across different
types of institutions and depend on
the method of data submission (manual
or computer-automated). Overall
student-level record completion rates,
that is, the percentage of NPSAS-
eligible sample members for whom
a completed student record was
obtained, are reported in exhibit 2
as “Student survey (analysis file).”
This exhibit also contains weighted
response rates to the student inter-
view, i.e., the percentages of sampled
students who completed either a full
or partial “Student survey (student
interview).” Estimates were weighted
to adjust for the unequal probability
of selection into the sample and for
nonresponse.
Two broad categories of error occur
in estimates generated from surveys:
sampling and nonsampling errors. Sam-
pling errors occur when observations
are based on samples rather than on
entire populations. The standard
error of a sample statistic is a measure
of the variation due to sampling and
indicates the precision of the statistic.
The complex sampling design used in
NPSAS:12 must be taken into account
when calculating such variance esti-
mates as standard errors. NCES’s web-
based software application, PowerStats,
which generated the estimates in this
report, uses the balanced repeated
replication and Jackknife II methods
to adjust variance estimation for the
complex sample design (Kaufman
2004; Wolter 1985).
EXHIBIT 2. Weighted response rates for NPSAS surveys: NPSAS:2000 to NPSAS:12
Component Institution list
participation rate Student
response rate Overall¹
NPSAS:2000
Student survey (analysis file²) 91 97 89
Student survey (student interview) 91 72 66
NPSAS:04
Student survey (analysis file²) 80 91 72
Student survey (student interview) 80 71 56
NPSAS:08
Student survey (analysis file²) 90 96 86
Student survey (student interview) 90 71 64
NPSAS:12
Student survey (analysis file²) 87 91 79
Student survey (student interview) 87 73 64
¹ Institution list participation rate times student response rate. ² NPSAS analysis file contains analytic variables derived from all NPSAS data sources (including institutional records and external data sources) as well as selected direct student interview variables. NOTE: The student interview response rates for NPSAS:2000 are for telephone interviews only. The response rates for student interviews in NPSAS:04 and NPSAS:08 include all interview modes (self-administered web-based, telephone, and in-person interviews). SOURCE: Thurgood, L., Walter, E., Carter, G., Henn, S., Huang, G., Nooter, D., Smith, W., Cash, R.W., and Salvucci, S. (2003). NCES Handbook of Survey Methods (NCES 2003-603). National Center for Education Statistics, U.S. Department of Education. Washington, DC. Burns, S., Wang, X., and Henning, A. (Eds.) (2011). NCES Handbook of Survey Methods (NCES 2011-609). National Center for Education Statistics, Institute of Education Sciences, U.S. Department of Education. Washington, DC. Wine, J., Bryan, M., and Siegel, P. (2014). 2011–12 National Postsecondary Student Aid Study (NPSAS:12) Data File Documentation (NCES 2014-182). National Center for Education Statistics, Institute of Education Sciences, U.S. Department of Education. Washington, DC.

21
Nonsampling errors can be attributed
to several sources: incomplete infor-
mation about all respondents (e.g.,
some students or institutions refused
to participate, or students participated
but answered only certain items); differ-
ences among respondents in question
interpretation; inability or unwillingness
to give correct information; mistakes
in recording or coding data; and
other errors of collecting, processing,
sampling, and imputing missing data.
For more information on NPSAS:2000,
NPSAS:04, NPSAS:08, and NPSAS:12
methodology, see the following reports:
• National Postsecondary Student
Aid Study 1999–2000 (NPSAS: 2000)
Methodology Report
(http://nces.ed.gov/pubsearch/
pubsinfo.asp?pubid=2002152)
• 2004 National Postsecondary
Student Aid Study (NPSAS:04)
Full-scale Methodology Report
(http://nces.ed.gov/pubsearch/
pubsinfo.asp?pubid=2006180)
• 2007–08 National Postsecondary
Student Aid Study (NPSAS:08):
Student Financial Aid Estimates
for 2007–08: First Look
(http://nces.ed.gov/pubsearch/
pubsinfo.asp?pubid=2009166)
• 2011–12 National Postsecondary
Student Aid Study (NPSAS:12) Data
File Documentation
(http://nces.ed.gov/pubsearch/
pubsinfo.asp?pubid=2014182)
Variables Used The variables used in this Statistics
in Brief are described in appendix C.
Visit the NCES DataLab website
http://nces.ed.gov/datalab to
view more detailed information on
question wording for variables
coming directly from an interview,
how variables were constructed, and
their sources. The program files that
generated the statistics presented in
this Statistics in Brief can be found at
http://nces.ed.gov/pubsearch/
pubsinfo.asp?pubid=2017414.
Response Rates NCES Statistical Standard 4-4-1 states
that “[a]ny survey stage of data collec-
tion with a unit or item response rate
less than 85 percent must be evaluated
for the potential magnitude of nonre-
sponse bias before the data or any
analysis using the data may be released”
(U.S. Department of Education 2012).
This means that nonresponse bias
analysis could be required at any
of three levels: institutions, study re-
spondents, or items. In NPSAS:12, the
institution response rate and the per-
centage of eligible sampled students
who met the study respondent defini-
tion were 87 percent and 91 percent,
respectively. Therefore, nonresponse
bias analysis was not required at
those levels. For more information on
response rates and nonresponse bias
analysis in NPSAS:2000, NPSAS:04, and
NPSAS:08, please see the NPSAS meth-
odology reports listed above.
The NPSAS:12 weighted student
interview response rate, however,
was 73 percent, and therefore, nonre-
sponse bias analysis was required for
those variables based in whole or in
part on student interviews. In this
Statistics in Brief, six variables with
response rates below 85 percent
required nonresponse bias analysis:
HSCRDANY (63 percent), IMMAGE
(65 percent), IMMIGEN (66 percent),
PAREDUC (78 percent), PRIMLANG
(65 percent), and REMEVER (76 percent);
for each of these variables, nonre-
sponse bias analyses were conducted
to determine whether respondents
and nonrespondents differed on
the following characteristics:
institution sector, region, and total
enrollment; student type, sampled
as a first-time beginner, and age
group; whether the student had

22
Free Application for Federal Student
Aid (FAFSA) data, was a federal aid
recipient, was a state aid recipient, was
an institution aid recipient, was a Pell
Grant recipient, or borrowed a Direct
Loan; and the amount, if any, of a
student’s Pell Grant or Direct Loan
(exhibit 3). Differences between re-
spondents and nonrespondents on
these variables were tested for statisti-
cal significance at the 5 percent level.
Nonresponse bias analyses of the six
variables with response rates less than
85 percent indicated that respondents
differed from nonrespondents on
65 percent to 82 percent of the charac-
teristics analyzed and, therefore, there
may be bias in these estimates. Any
bias due to nonresponse, however,
is based upon responses prior to
stochastic imputation in which miss-
ing data were replaced with valid data
from the records of donor cases that
matched the recipients on selected
demographic, enrollment, institution,
and financial aid-related variables
(Krotki, Black, and Creel 2005). The
potential for bias in these estimates
may have been reduced through im-
putation. Imputation procedures are
designed specifically to identify do-
nors with similar characteristics to
those with missing data, so imputation
may reduce bias. While the level of
item-level bias before imputation is
measurable, the same measurement
cannot be made after imputation.
Although the magnitude of any
change in item-level bias cannot be
determined, the item estimates before
and after imputation were compared
to determine whether the imputation
changed the biased estimates and
may, therefore, have reduced the
amount of bias.
For continuous variables, the difference
between the mean before imputation
and the mean after imputation was
estimated. For categorical variables,
the estimated difference was computed
for each of the categories as the per-
centage of students in that category
before imputation minus the percent-
age of students in that category after
imputation. These estimated differ-
ences were tested for statistical
significance at the 5 percent level.
A significant difference in the item
means after imputation implies a
reduction in bias due to imputation.
A nonsignificant difference suggests
that imputation may not have reduced
bias, that the sample size was too
small to detect a significant difference,
or that there was little bias to be
reduced. Statistical tests of the differ-
ences between the means before and
after imputation for four of these
EXHIBIT 3. Bias analysis results
Pre-imputation
Variable name
Response rate
Median percent relative bias across
characteristics
Percentage of characteristics with
significant bias
Characteristic with greatest
significant bias
Percent difference in means or average
percent difference across all categories
pre- and post-imputation
HSCRDCOL 62.9 7.68 79.59 #
IMMAGE 64.9 23.49 70.59 0.04 *
IMMIGEN 65.8 5.22 80.39 Whether had
FAFSA data 0.06 *
JOBENR2 76.1 4.64 78.43 Whether had
FAFSA data 0.03
PAREDUC 77.5 3.64 64.71 Whether had
FAFSA data 0.12 *
PRIMLANG 65.3 5.72 80.39 0.03 *
REMEVER 76.4 5.02 82.00 Whether had
FAFSA data #
# Rounds to zero. NOTE: FAFSA is the Free Application for Federal Student Aid. Relative bias is computed by dividing a variable’s estimated bias for a given characteristic by the variable’s mean. Relative bias is defined as significant if its difference from zero is statistically significant at p < .05 (signified by an asterisk). SOURCE: U.S. Department of Education, National Center for Education Statistics, 2011–12 National Postsecondary Student Aid Study (NPSAS:12).

23
variables (IMMAGE, IMMIGEN, PAREDUC,
and PRIMLANG) were significant, indi-
cating that the nonresponse bias was
reduced through imputation. For the
other two, HSCRDANY and REMEVER,
statistical tests of the differences
between the means before and after
imputation were not significant,
suggesting that for these variables
imputation may not have reduced bias,
that the sample size was too small to
detect a significant difference, or that
there was little bias to be reduced.
For more detailed information on
nonresponse bias analysis and an
overview of the survey methodology,
see the 2011–12 National Postsecondary
Student Aid Study (NPSAS:12) Data File
Documentation (NCES 2014-182)
(http://nces.ed.gov/pubsearch/
pubsinfo.asp?pubid=2014182).
Statistical Procedures Comparisons of means and propor-
tions were tested using Student’s
t statistic. Differences between
estimates were tested against the
probability of a Type I error12
12 A Type I error occurs when one concludes that a difference observed in a sample reflects a true difference in the population from which the sample was drawn, when no such difference is present.
or signifi-
cance level. The statistical significance
of each comparison was determined
by calculating the Student’s t value
for the difference between each pair
of means or proportions and compar-
ing the t value with published tables
of significance levels for two-tailed
hypothesis testing. Student’s t values
were computed to test differences
between independent estimates using
the following formula:
−=
+1 2
2 21 2
E Et
se se
where E1 and E2 are the estimates to
be compared and se1 and se2 are their
corresponding standard errors.
There are hazards in reporting statisti-
cal tests for each comparison. First,
comparisons based on large t statistics
may appear to merit special attention.
This can be misleading since the mag-
nitude of the t statistic is related not
only to the observed differences in
means or percentages but also to the
number of respondents in the specific
categories used for comparison. Hence,
a small difference compared across a
large number of respondents would
produce a large (and thus possibly
statistically significant) t statistic.
A second hazard in reporting statistical
tests is the possibility that one can
report a “false positive” or Type I error.
Statistical tests are designed to limit
the risk of this type of error using a
value denoted by alpha. The alpha
level of .05 was selected for findings
in this report and ensures that a differ-
ence of a certain magnitude or larger
would be produced when there was
no actual difference between the
quantities in the underlying popula-
tion no more than 1 time out of 20.13
13 No adjustments were made for multiple comparisons.
When analysts test hypotheses that
show alpha values at the .05 level or
smaller, they reject the null hypothesis
that there is no difference between
the two quantities. Failing to reject a
null hypothesis (i.e., detect a differ-
ence), however, does not imply the
values are the same or equivalent.

24
REFERENCES Baum, S., and Flores, S.M. (2011). Higher
Education and Children in Immigrant
Families. The Future of Children,
21(1): 171–193. Princeton University.
Retrieved July 17, 2014, from
http://www.jstor.org/stable/
41229016.
DiPrete, T.A., and Buchmann, C. (2013).
The Rise of Women: The Growing
Gender Gap in Education and What It
Means for American Schools. New York:
Russell Sage Foundation.
Feliciano, C. (2005). Does Selective
Migration Matter? Explaining Ethnic
Disparities in Educational Attainment
Among Immigrants’ Children.
International Migration Review,
39(4): 841–871. Blackwell Publishing
Ltd. Retrieved July 17, 2014, from
http://dx.doi.org/10.1111/j.1747-
7379.2005.tb00291.x.
Grieco, E.M., Trevelyan, E., Larsen, L.,
Acosta, Y.D., Gambino, C., de la Cruz, P.,
Gryn, T., and Walters, N. (2012). The
Size, Place of Birth, and Geographic
Distribution of the Foreign-Born
Population in the United States:
1960 to 2010. Washington, DC: U.S.
Census Bureau.
Hernandez, D.J., Denton, N.A., and
Blanchard, V.L. (2011). Children in the
United States of America: A Statistical
Portrait by Race-Ethnicity, Immigrant
Origins, and Language. The Annals of
the American Academy of Political and
Social Science, 633(1): 102–127.
Kaufman, S. (2004). Using the Bootstrap in
a Two-Stage Design When Some
Second-Stage Strata Have Only One
Unit Allocated. Proceedings of the
American Statistical Association,
Section on Survey Research Methods.
Krotki, K., Black, S., and Creel, D. (2005).
Mass Imputation. In Proceedings of the
Section on Survey Research Methods,
American Statistical Association.
Alexandria, VA: American Statistical
Association.
Pew Research Center. (2013, February 7).
Second-Generation Americans:
A Portrait of the Adult Children of
Immigrants. Washington, DC: Author.
Portes, A., and Rumbaut, R.G. (2006).
Immigrant America (3rd ed.). Berkeley,
CA: University of California Press.
Rumbaut, R.G. (2004). Ages, Life
Stages, and Generational Cohorts:
Decomposing the Immigrant First
and Second Generations in the
United States. International Migration
Review, 38(3): 1160–1205.
Siahaan, F., Lee, D.Y., and Kalist, D.E.
(2014). Educational Attainment of
Children of Immigrants: Evidence
From the National Longitudinal
Survey of Youth. Economics of
Education Review, 38: 1–8.
Staklis, S., and Horn, L. (2012). New
Americans in Postsecondary Education:
A Profile of Immigrant and Second-
Generation American Undergraduates
(NCES 2012-213). National Center for
Education Statistics, Institute of
Education Sciences, U.S. Department
of Education. Washington, DC.
Teranishi, R.T., Suárez-Orozco, C., and
Suárez-Orozco, M. (2011). Immigrants
in Community Colleges. The Future
of Children, 21(1): 153–169. Princeton
University. Retrieved July 17, 2014,
from http://www.jstor.org/stable/
41229015.
U.S. Census Bureau. (2012). Current
Population Survey - March 2012
Detailed Tables. Table 4.5. Washington,
DC: Author. Retrieved January 14, 2015,
from http://www.census.gov/
population/foreign/data/cps2012.html.
U.S. Census Bureau. (2014, December 4).
New Census Bureau Statistics Show
How Young Adults Today Compare
With Previous Generations in
Neighborhoods Nationwide. Press
Release. CB14-219. Washington, DC:
Author. Retrieved December 19, 2014,
from http://www.census.gov/
newsroom/press-releases/2014/
cb14-219.html.
U.S. Department of Education. (2012).
2012 Revision of NCES Statistical
Standards (NCES 2014-097). National
Center for Education Statistics.
Washington, DC. Retrieved from
https://nces.ed.gov/statprog/2012/.
U.S. Department of Education, Institute of
Education Sciences, National Center
for Education Statistics (NCES). (2010).
IPEDS Classification of Instructional
Programs (CIP): CIP 2010. Washington,
DC: Author. Retrieved August 22,
2016, from http://nces.ed.gov/ipeds/
cipcode/resources.aspx?y=55.
Wolter, K. (1985). Introduction to Variance
Estimation. New York: Springer-Verlag.
Wyatt, L.G. (2011). Nontraditional
Student Engagement: Increasing
Adult Student Success and
Retention. The Journal of Continuing
Higher Education 59(1):10–20.
Zhou, M. (1997). Segmented Assimilation:
Issues, Controversies, and Recent
Research on the New Second
Generation. International Migration
Review, 31(4): 975–1008. The Center
for Migration Studies of New York, Inc.
Retrieved July 17, 2014, from
http://www.jstor.org/stable/2547421.

25
APPENDIX A. DATA TABLES
Table A-1. Estimates for figure 1: UNDERGRADUATE IMMIGRANT GENERATIONS OVER TIME Percentage distribution of undergraduates, by immigrant generation: 1999–2000, 2003–04, 2007–08, and 2011–12
Immigrant generation 1999–2000 2003–04 2007–08 2011–12
Immigrants¹ 9.5 10.1 10.1 8.3
Second-generation Americans² 10.0 11.6 13.2 16.0
Third-generation or higher Americans³ 80.5 78.3 76.7 75.7
1 Immigrant undergraduates were citizens, permanent residents, or noncitizens eligible for citizenship who were born abroad to at least one foreign-born parent. 2 Second-generation American students were born in the United States to at least one parent who was born abroad. 3 Third-generation or higher American students were born in the United States to U.S.-born parents. NOTE: Estimates exclude foreign students or nonresident aliens who do not have citizenship or were not admitted to the United States for the purpose of obtaining permanent residency. For information on the samples included in these studies, see Staklis, S., and Horn, L. (2012). New Americans in Postsecondary Education: A Profile of Immigrant and Second-Generation American Undergraduates (NCES 2012-213). Estimates include undergraduate students who were enrolled in Title IV eligible postsecondary institutions in the 50 states and the District of Columbia. The 2011–12 sample design did not include Puerto Rican institutions. To provide comparable estimates over time, sample members from Puerto Rican institutions have been excluded from estimates generated for 1999–2000, 2003–04, and 2007–08. Detail may not sum to totals because of rounding. SOURCE: U.S. Department of Education, National Center for Education Statistics, 1999–2000, 2003–04, 2007–08, and 2011–12 National Postsecondary Student Aid Studies (NPSAS:2000, NPSAS: 04, NPSAS:08, and NPSAS:12).
Table A-2. Estimates for figure 2: IMMIGRANT GENERATION, BY RACE/ETHNICITY Percentage distribution of undergraduates, by immigrant generation and race/ethnicity: 2011–12
Immigrant generation White Black Hispanic/
Latino Asian Other
All undergraduates 58.5 16.2 16.1 4.8 4.4
Immigrants¹ 20.3 15.6 32.4 28.2 3.5
Second-generation Americans² 23.4 9.6 46.3 13.8 6.8
Third-generation or higher Americans³ 70.1 17.6 7.9 0.3 4.1
1 Immigrant undergraduates were citizens, permanent residents, or noncitizens eligible for citizenship who were born abroad to at least one foreign-born parent. 2 Second-generation American students were born in the United States to at least one parent who was born abroad. 3 Third-generation or higher American students were born in the United States to U.S.-born parents. NOTE: Black includes African American, and Other includes American Indian or Alaska Native, Native Hawaiian or Other Pacific Islander, or students who are more than one race. Race categories exclude Hispanic origin unless specified. Estimates exclude foreign students or nonresident aliens who do not have citizenship or were not admitted to the United States for the purpose of obtaining permanent residency. Estimates include students enrolled in Title IV eligible postsecondary institutions in the 50 states and the District of Columbia. Detail may not sum to totals because of rounding. SOURCE: U.S. Department of Education, National Center for Education Statistics, 2011–12 National Postsecondary Student Aid Study (NPSAS:12).
Table A-3. Estimates for figure 3: RACE/ETHNICITY, BY IMMIGRANT GENERATION Percentage distribution of undergraduates, by race/ethnicity and immigrant generation: 2011–12
Immigrant generation All undergraduates White Black Hispanic/
Latino Asian Other
Immigrants¹ 8.3 2.9 8.1 16.8 48.9 6.6
Second-generation Americans² 16.0 6.4 9.5 46.0 45.8 24.4
Third-generation or higher Americans³ 75.7 90.7 82.4 37.1 5.3 69.0
1 Immigrant undergraduates were citizens, permanent residents, or noncitizens eligible for citizenship who were born abroad to at least one foreign-born parent. 2 Second-generation American students were born in the United States to at least one parent who was born abroad. 3 Third-generation or higher American students were born in the United States to U.S.-born parents. NOTE: Black includes African American, and Other includes American Indian or Alaska Native, Native Hawaiian or Other Pacific Islander, or students who are more than one race. Race categories exclude Hispanic origin unless specified. Estimates exclude foreign students or nonresident aliens who do not have citizenship or were not admitted to the United States for the purpose of obtaining permanent residency. Estimates include students enrolled in Title IV eligible postsecondary institutions in the 50 states and the District of Columbia. Detail may not sum to totals because of rounding. SOURCE: U.S. Department of Education, National Center for Education Statistics, 2011–12 National Postsecondary Student Aid Study (NPSAS:12).

26
Table A-4. Estimates for figure 4: CITIZENSHIP STATUS Percentage distribution of immigrant undergraduates, by citizenship status and race/ethnicity: 2011–12
Race/ethnicity Resident alien U.S. citizen
All immigrants 50.0 50.0
Hispanic/Latino immigrants 55.8 44.2
Asian immigrants 41.0 59.0
All other immigrants 51.7 48.3
NOTE: Immigrant undergraduates are citizens, permanent residents, or noncitizens eligible for citizenship who were born abroad to at least one foreign-born parent. All other immigrant students includes American Indian or Alaska Native, Native Hawaiian or Other Pacific Islander, students who are more than one race, and White and Black or African American immigrants. Estimates exclude foreign students or nonresident aliens who do not have citizenship or were not admitted to the United States for the purpose of obtaining permanent residency. Estimates include students enrolled in Title IV eligible postsecondary institutions in the 50 states and the District of Columbia. Detail may not sum to totals because of rounding. SOURCE: U.S. Department of Education, National Center for Education Statistics, 2011–12 National Postsecondary Student Aid Study (NPSAS:12).
Table A-5. Estimates for figure 5: AGE AT ARRIVAL, BY RACE/ETHNICITY Percentage distribution of immigrant undergraduates, by race/ethnicity and age at arrival: 2011–12
Age at arrival¹ All immigrants Hispanic/Latino
immigrants Asian
immigrants All other
immigrants
Child arrivals 46.1 52.2 44.3 42.3
Adolescent arrivals 19.9 20.2 22.4 17.8
Adult arrivals 34.1 27.6 33.3 39.9
1 Child arrivals are immigrant students who arrived in the United States before age 12. Adolescent arrivals are immigrant students who arrived in the United States between the ages of 12 and 17. Adult arrivals are immigrant students who arrived in the United States at age 18 or older. NOTE: Immigrant students are citizens, permanent residents, or noncitizens eligible for citizenship who were born abroad to at least one foreign-born parent. All other immigrant students includes American Indian or Alaska Native, Native Hawaiian or Other Pacific Islander, students who are more than one race, and White and Black or African American immigrant students. Estimates exclude foreign students or nonresident aliens who do not have citizenship or were not admitted to the United States for the purpose of obtaining permanent residency. Estimates include students enrolled in Title IV eligible postsecondary institutions in the 50 states and the District of Columbia. Detail may not sum to totals because of rounding. SOURCE: U.S. Department of Education, National Center for Education Statistics, 2011–12 National Postsecondary Student Aid Study (NPSAS:12).
Table A-6. Estimates for figure 6: TRADITIONAL-AGE UNDERGRADUATES AND PERCENTAGE OF MALES Percentage of New American undergraduates age 23 or younger, and percentage who were male, by race/ethnicity and immigrant generation: 2011–12
Sex
Race/ethnicity and immigrant generation Age 23 or younger Male Female
All undergraduates 82.2 43.0 57.0
Hispanic/Latino
Immigrants¹ 75.3 38.4 61.6
Second-generation Americans² 89.0 43.9 56.1
Asian
Immigrants¹ 85.3 44.5 55.5
Second-generation Americans² 92.4 47.0 53.0
1 Immigrant students are citizens, permanent residents, or noncitizens eligible for citizenship who were born abroad to at least one foreign-born parent. 2 Second-generation American students were born in the United States to at least one parent who was born abroad. NOTE: New American students include immigrant and second-generation American students. Estimates exclude foreign students or nonresident aliens who do not have citizenship or were not admitted to the United States for the purpose of obtaining permanent residency. Data for American Indian or Alaska Native, Native Hawaiian or Other Pacific Islander, Black or African American, White, or undergraduates with more than one race are not shown separately but are included in the data for all undergraduates. Estimates include students enrolled in Title IV eligible postsecondary institutions in the 50 states and the District of Columbia. SOURCE: U.S. Department of Education, National Center for Education Statistics, 2011–12 National Postsecondary Student Aid Study (NPSAS:12).

27
Table A-7. Estimates for figure 7: PARENTS’ EDUCATION AND ENGLISH SPOKEN IN THE HOME Percentage of New American undergraduates whose parents did not attend postsecondary education, and percentage who reported English as the primary language spoken in the home, by race/ethnicity and immigrant generation: 2011–12
Race/ethnicity and immigrant generation Parents did not attend college English as the primary language
All undergraduates 33.5 87.1
Hispanic/Latino
Immigrants¹ 51.7 18.6
Second-generation Americans² 53.8 62.7
Asian
Immigrants¹ 39.8 24.2
Second-generation Americans² 30.2 65.2
1 Immigrant students are citizens, permanent residents, or noncitizens eligible for citizenship who were born abroad to at least one foreign-born parent. 2 Second-generation American students were born in the United States to at least one parent who was born abroad. NOTE: New American students include immigrant and second-generation American students. Estimates exclude foreign students or nonresident aliens who do not have citizenship or were not admitted to the United States for the purpose of obtaining permanent residency. Data for American Indian or Alaska Native, Native Hawaiian or Other Pacific Islander, Black or African American, White, or undergraduates with more than one race are not shown separately but are included in the data for all undergraduates. Estimates include students enrolled in Title IV eligible postsecondary institutions in the 50 states and the District of Columbia. SOURCE: U.S. Department of Education, National Center for Education Statistics, 2011–12 National Postsecondary Student Aid Study (NPSAS:12).
Table A-8. Estimates for figure 8: COLLEGE CREDITS EARNED IN HIGH SCHOOL AND DEVELOPMENTAL COURSETAKING IN COLLEGE Percentage of New American undergraduates who reported taking college-level courses (advanced placement or college courses) in high school, and percentage who reported ever taking a developmental course to improve basic skills since completing high school, by race/ethnicity and immigrant generation: 2011–12
Race/ethnicity and immigrant generation Earned college credit
(AP or credits) in high school Took a
developmental course
All undergraduates 41.7 30.7
Hispanic/Latino
Immigrants¹ 35.3 45.2
Second-generation Americans² 49.3 37.6
Asian
Immigrants¹ 41.3 37.8
Second-generation Americans² 63.6 26.8
1 Immigrant students are citizens, permanent residents, or noncitizens eligible for citizenship who were born abroad to at least one foreign-born parent. 2 Second-generation American students were born in the United States to at least one parent who was born abroad. NOTE: New American students include immigrant and second-generation American students. Self-reported data about courses taken in high school prior to college enrollment are available for respondents under age 30 only. Estimates exclude foreign students or nonresident aliens who do not have citizenship or were not admitted to the United States for the purpose of obtaining permanent residency. Data for American Indian or Alaska Native, Native Hawaiian or Other Pacific Islander, Black or African American, White, or undergraduates with more than one race are not shown separately but are included in the data for all undergraduates. Estimates include students enrolled in Title IV eligible postsecondary institutions in the 50 states and the District of Columbia. SOURCE: U.S. Department of Education, National Center for Education Statistics, 2011–12 National Postsecondary Student Aid Study (NPSAS:12).

28
Table A-9. Estimates for figure 9: INSTITUTION TYPE Percentage distribution of New American undergraduates’ type of institution, by race/ethnicity and immigrant generation: 2011–12
Race/ethnicity and immigrant generation
Others or attended more
than one school For-profit
Private nonprofit
4-year Public 4-year
Public 2-year
All undergraduates 9.0 12.9 11.7 28.4 38.1
Hispanic/Latino
Immigrants¹ 8.1 15.2 5.6 24.5 46.6
Second-generation Americans² 9.2 13.9 7.8 25.3 43.7
Asian
Immigrants¹ 9.2 6.2 11.1 32.5 41.1
Second-generation Americans² 12.0 8.8 13.7 37.3 28.2
1 Immigrant students are citizens, permanent residents, or noncitizens eligible for citizenship who were born abroad to at least one foreign-born parent. 2 Second-generation American students were born in the United States to at least one parent who was born abroad. NOTE: For-profit institutions include less-than-2-year, 2-year, and 4-year institutions. Estimates exclude foreign students or nonresident aliens who do not have citizenship or were not admitted to the United States for the purpose of obtaining permanent residency. Data for American Indian or Alaska Native, Native Hawaiian or Other Pacific Islander, Black or African American, White, or undergraduates with more than one race are not shown separately but are included in the data for all undergraduates. Estimates include students enrolled in Title IV eligible postsecondary institutions in the 50 states and the District of Columbia. Detail may not sum to totals because of rounding. SOURCE: U.S. Department of Education, National Center for Education Statistics, 2011–12 National Postsecondary Student Aid Study (NPSAS:12).
Table A-10. Estimates for figure 10: FULL-TIME ATTENDANCE Percentage of New American undergraduates who attended full time, by race/ethnicity and immigrant generation: 2011–12
Race/ethnicity and immigrant generation Attend exclusively full-time
All undergraduates 50.5
Hispanic/Latino
Immigrants¹ 41.1
Second-generation Americans² 48.9
Asian
Immigrants¹ 44.2
Second-generation Americans² 54.9
1 Immigrant students are citizens, permanent residents, or noncitizens eligible for citizenship who were born abroad to at least one foreign-born parent. 2 Second-generation American students were born in the United States to at least one parent who was born abroad. NOTE: Estimates exclude foreign students or nonresident aliens who do not have citizenship or were not admitted to the United States for the purpose of obtaining permanent residency. Data for American Indian or Alaska Native, Native Hawaiian or Other Pacific Islander, Black or African American, White, or undergraduates with more than one race are not shown separately but are included in the data for all undergraduates. Estimates include students enrolled in Title IV eligible postsecondary institutions in the 50 states and the District of Columbia. SOURCE: U.S. Department of Education, National Center for Education Statistics, 2011–12 National Postsecondary Student Aid Study (NPSAS:12).

29
Table A-11. Estimates for figure 11: MAJOR FIELD OF STUDY Percentage distribution of undergraduates’ major field of study, by immigrant generation and race/ethnicity: 2011–12
Immigrant generation and race/ethnicity
Unknown/ undecided
Engineering, math, computer, and
physical sciences
Social sciences, including
psychology Health care
fields Business
Humanities, general studies,
and history
Education and other
applied
All undergraduates 5.3 15.0 6.9 18.5 15.2 16.3 22.8
First- and second-generation¹,²
Asian 7.5 25.5 7.8 15.4 17.2 14.8 11.8
Hispanic/Latino 5.2 13.9 8.8 18.0 13.7 16.8 23.5
1 Immigrant students are citizens, permanent residents, or noncitizens eligible for citizenship who were born abroad to at least one foreign-born parent. 2 Second-generation American students were born in the United States to at least one parent who was born abroad. NOTE: Computer and information sciences, engineering and engineering technology and biology, physical science, technology, math and agriculture are combined. Social sciences includes psychology. Humanities, history, general studies and all other are combined. Estimates exclude foreign students or nonresident aliens who do not have citizenship or were not admitted to the United States for the purpose of obtaining permanent residency. Data for American Indian or Alaska Native, Native Hawaiian or Other Pacific Islander, Black or African American, White, or undergraduates with more than one race are not shown separately but are included in the data for all undergraduates. Estimates include students enrolled in Title IV eligible postsecondary institutions in the 50 states and the District of Columbia. Detail may not sum to totals because of rounding. SOURCE: U.S. Department of Education, National Center for Education Statistics, 2011–12 National Postsecondary Student Aid Study (NPSAS:12).
Table A-12. Estimates for figure 12: TRADITIONAL AGE UNDERGRADUATES, COLLEGE CREDIT IN HIGH SCHOOL, AND DEVELOPMENTAL EDUCATION, BY AGE AT ARRIVAL Percentage of immigrant undergraduates age 23 or younger; among undergraduates under age 30, percentage who reported taking college-level courses (AP/or college courses) in high school, and percentage of all undergraduates who reported ever taking a developmental course to improve basic skills since completing high school, by age at arrival: 2011–12
Age at arrival Age 23 or younger Earned college credit
(AP or credits) in high school Took a
developmental course
All undergraduates 82.2 41.7 30.7
Adult arrivals 18.5 15.2 48.5
Adolescent arrivals 53.9 36.1 45.7
Child arrivals 61.5 49.8 32.8
NOTE: Child arrivals are immigrant students who arrived in the United States before age 12. Adolescent arrivals are immigrant students who arrived in the United States between the ages of 12 and 17. Adult arrivals are immigrant students who arrived in the United States at age 18 or older. Self-reported data about courses taken in high school prior to college enrollment are available for undergraduates under age 30 only. Estimates exclude foreign students or nonresident aliens who do not have citizenship or were not admitted to the United States for the purpose of obtaining permanent residency. Estimates include students enrolled in Title IV eligible postsecondary institutions in the 50 states and the District of Columbia. SOURCE: U.S. Department of Education, National Center for Education Statistics, 2011–12 National Postsecondary Student Aid Study (NPSAS:12).

30
Table A-13. Estimates for figure 13: INSTITUTION TYPE, BY AGE AT ARRIVAL Percentage distribution of immigrant undergraduates’ type of institution, by age at arrival: 2011–12
Age at arrival Others or attended
more than one school For-profit Private nonprofit
4-year Public 4-year
Public 2-year
All undergraduates 9.0 12.9 11.7 28.4 38.1
Age at arrival¹
Child arrivals 8.6 10.1 10.3 30.8 40.2
Adolescent arrivals 8.5 11.2 8.5 30.8 41.0
Adult arrivals 9.5 10.7 6.9 20.8 52.1
1 Child arrivals are immigrant students who arrived in the United States before age 12. Adolescent arrivals are immigrant students who arrived in the United States between the ages of 12 and 17. Adult arrivals are immigrant students who arrived in the United States at age 18 or older. NOTE: For-profit institutions include less-than-2-year, 2-year, and 4-year institutions. Estimates exclude foreign students or nonresident aliens who do not have citizenship or were not admitted to the United States for the purpose of obtaining permanent residency. Estimates include students enrolled in Title IV eligible postsecondary institutions in the 50 states and the District of Columbia. Detail may not sum to totals because of rounding. SOURCE: U.S. Department of Education, National Center for Education Statistics, 2011–12 National Postsecondary Student Aid Study (NPSAS:12).
Table A-14. Estimates for figure 14: FULL-TIME ENROLLMENT, BY AGE AT ARRIVAL Percentage of immigrant undergraduates enrolled full time, by age at arrival: 2011–12
Age at arrival Exclusively full-time
All undergraduates 50.5
Age at arrival¹
Child arrivals 46.9
Adolescent arrivals 43.6
Adult arrivals 34.8
1 Child arrivals are immigrant students who arrived in the United States before age 12. Adolescent arrivals are immigrant students who arrived in the United States between the ages of 12 and 17. Adult arrivals are immigrant students who arrived in the United States at age 18 or older. NOTE: Estimates exclude foreign students or nonresident aliens who do not have citizenship or were not admitted to the United States for the purpose of obtaining permanent residency. Estimates include students enrolled in Title IV eligible postsecondary institutions in the 50 states and the District of Columbia. SOURCE: U.S. Department of Education, National Center for Education Statistics, 2011–12 National Postsecondary Student Aid Study (NPSAS:12).
Table A-15. Estimates for figure 15: MAJOR FIELD OF STUDY, BY AGE AT ARRIVAL Percentage distribution of undergraduates’ major field of study, by age at arrival: 2011–12
Age at arrival Unknown/ undecided
Engineering, math, computer,
and physical sciences
Social sciences, including
psychology Health care
fields Business
Humanities, general studies,
and history
Education and other
applied
All undergraduates 5.3 15.0 6.9 18.5 15.2 16.3 22.8
Age at arrival¹
Child arrivals 5.1 21.2 8.5 18.9 14.5 15.5 16.4
Adolescent arrivals 3.4 19.6 6.8 18.6 20.5 15.5 15.6
Adult arrivals 6.9 15.3 4.3 25.4 17.4 13.9 16.8
1 Child arrivals are immigrant students who arrived in the United States before age 12. Adolescent arrivals are immigrant students who arrived in the United States between the ages of 12 and 17. Adult arrivals are immigrant students who arrived in the United States at age 18 or older. NOTE: Computer and information sciences, engineering and engineering technology and biology, physical science, technology, math and agriculture are combined. Social sciences includes psychology. Humanities, history, general studies and other are combined. Estimates exclude foreign students or nonresident aliens who do not have citizenship or were not admitted to the United States for the purpose of obtaining permanent residency. Estimates include students enrolled in Title IV eligible postsecondary institutions in the 50 states and the District of Columbia. Detail may not sum to totals because of rounding. SOURCE: U.S. Department of Education, National Center for Education Statistics, 2011–12 National Postsecondary Student Aid Study (NPSAS:12).

31
APPENDIX B. STANDARD ERROR TABLES
Table B-1. Standard errors for table A-1 and figure 1: UNDERGRADUATE IMMIGRANT GENERATIONS OVER TIME Percentage distribution of undergraduates, by immigrant generation: 1999–2000, 2003–04, 2007–08, and 2011–12
Immigrant generation 1999–2000 2003–04 2007–08 2011–12
Immigrants 0.34 0.36 0.21 0.22
Second-generation Americans 0.38 0.35 0.21 0.23
Third-generation or higher Americans 0.59 0.63 0.28 0.33
SOURCE: U.S. Department of Education, National Center for Education Statistics, 1999–2000, 2003–04, 2007–08, and 2011–12 National Postsecondary Student Aid Studies (NPSAS:2000, NPSAS: 04, NPSAS:08, and NPSAS:12).
Table B-2. Standard errors for table A-2 and figure 2: IMMIGRANT GENERATION, BY RACE/ETHNICITY Percentage distribution of undergraduates, by immigrant generation and race/ethnicity: 2011–12
Immigrant generation White Black Hispanic/
Latino Asian Other
All undergraduates 0.43 0.30 0.37 0.13 0.12
Immigrants 0.81 0.94 1.42 1.01 0.38
Second-generation Americans 0.66 0.47 0.79 0.56 0.37
Third-generation or higher Americans 0.40 0.35 0.22 0.03 0.12
SOURCE: U.S. Department of Education, National Center for Education Statistics, 2011–12 National Postsecondary Student Aid Study (NPSAS:12).
Table B-3. Standard errors for table A-3 and figure 3: RACE/ETHNICITY, BY IMMIGRANT GENERATION Percentage distribution of undergraduates, by race/ethnicity and immigrant generation: 2011–12
Immigrant generation All undergraduates White Black Hispanic/
Latino Asian Other
Immigrants 0.33 0.24 0.63 0.78 0.56 1.24
Second-generation Americans 0.23 0.17 0.44 0.64 1.44 1.18
Third-generation or higher Americans 0.22 0.13 0.49 0.72 1.42 0.63
SOURCE: U.S. Department of Education, National Center for Education Statistics, 2011–12 National Postsecondary Student Aid Study (NPSAS:12).
Table B-4. Standard errors for table A-4 and figure 4: CITIZENSHIP STATUS Percentage distribution of immigrant undergraduates, by citizenship status and race/ethnicity: 2011–12
Race/ethnicity Resident alien U.S. citizen
All immigrants 1.11 1.11
Hispanic/Latino immigrants 1.77 1.77
Asian immigrants 1.72 1.72
All other immigrants 1.65 1.65
SOURCE: U.S. Department of Education, National Center for Education Statistics, 2011–12 National Postsecondary Student Aid Study (NPSAS:12).

32
Table B-5. Standard errors for table A-5 and figure 5: AGE AT ARRIVAL, BY RACE/ETHNICITY Percentage distribution of immigrant undergraduates, by race/ethnicity and age at arrival: 2011–12
Age at arrival All immigrants Hispanic/Latino
immigrants Asian
immigrants All other
immigrants
Child arrivals 0.95 1.91 1.78 1.40
Adolescent arrivals 0.71 1.23 1.36 1.10
Adult arrivals 1.02 1.77 2.07 1.59
SOURCE: U.S. Department of Education, National Center for Education Statistics, 2011–12 National Postsecondary Student Aid Study (NPSAS:12).
Table B-6. Standard errors for table A-6 and figure 6: TRADITIONAL-AGE UNDERGRADUATES AND PERCENTAGE OF MALES Percentage of New American undergraduates age 23 or younger, and percentage who were male, by race/ethnicity and immigrant generation: 2011–12
Sex
Race/ethnicity and immigrant generation Age 23 or younger Male Female
All undergraduates 0.25 0.11 0.11
Hispanic/Latino
Immigrants 1.69 1.65 1.65
Second-generation Americans 0.65 0.92 0.92
Asian
Immigrants 1.36 1.64 1.64
Second-generation Americans 1.37 1.80 1.80
SOURCE: U.S. Department of Education, National Center for Education Statistics, 2011–12 National Postsecondary Student Aid Study (NPSAS:12).
Table B-7. Standard errors for table A-7 and figure 7: PARENTS’ EDUCATION AND ENGLISH SPOKEN IN THE HOME Percentage of New American undergraduates whose parents did not attend postsecondary education, and percentage who reported English as the primary language spoken in the home, by race/ethnicity and immigrant generation: 2011–12
Race/ethnicity and immigrant generation Parents did not attend college English as the primary language
All undergraduates 0.27 0.26
Hispanic/Latino
Immigrants 1.66 1.34
Second-generation Americans 1.19 0.79
Asian
Immigrants 1.69 1.42
Second-generation Americans 1.74 1.61
SOURCE: U.S. Department of Education, National Center for Education Statistics, 2011–12 National Postsecondary Student Aid Study (NPSAS:12).

33
Table B-8. Standard errors for table A-8 and figure 8: COLLEGE CREDITS EARNED IN HIGH SCHOOL AND DEVELOPMENTAL COURSETAKING IN COLLEGE Percentage of New American undergraduates who reported taking college-level courses (advanced placement or college courses) in high school, and percentage who reported ever taking a developmental course to improve basic skills since completing high school, by race/ethnicity and immigrant generation: 2011–12
Race/ethnicity and immigrant generation Earned college credit
(AP or credits) in high school Took a
developmental course
All undergraduates 0.27 0.27
Hispanic/Latino
Immigrants 1.51 1.98
Second-generation Americans 1.00 1.02
Asian
Immigrants 1.77 1.71
Second-generation Americans 1.83 1.56
SOURCE: U.S. Department of Education, National Center for Education Statistics, 2011–12 National Postsecondary Student Aid Study (NPSAS:12).
Table B-9. Standard errors for table A-9 and figure 9: INSTITUTION TYPE Percentage distribution of New American undergraduates’ type of institution, by race/ethnicity and immigrant generation: 2011–12
Race/ethnicity and immigrant generation
Others or attended more
than one school For-profit
Private nonprofit
4-year Public 4-year
Public 2-year
All undergraduates 0.28 0.03 0.08 0.10 0.14
Hispanic/Latino
Immigrants 1.08 2.02 0.98 2.86 2.85
Second-generation Americans 0.64 0.81 0.61 1.15 1.49
Asian
Immigrants 0.96 0.75 1.24 1.74 1.99
Second-generation Americans 1.04 1.49 1.41 1.79 1.82
SOURCE: U.S. Department of Education, National Center for Education Statistics, 2011–12 National Postsecondary Student Aid Study (NPSAS:12).
Table B-10. Standard errors for table A-10 and figure 10: FULL-TIME ATTENDANCE Percentage of New American undergraduates who attended full time, by race/ethnicity and immigrant generation: 2011–12
Race/ethnicity and immigrant generation Attend exclusively full-time
All undergraduates 0.40
Hispanic/Latino
Immigrants 1.68
Second-generation Americans 1.16
Asian
Immigrants 1.64
Second-generation Americans 1.89
SOURCE: U.S. Department of Education, National Center for Education Statistics, 2011–12 National Postsecondary Student Aid Study (NPSAS:12).

34
Table B-11. Standard errors for table A-11 and figure 11: MAJOR FIELD OF STUDY Percentage distribution of undergraduates’ major field of study, by immigrant generation and race/ethnicity: 2011–12
Immigrant generation and race/ethnicity
Unknown/ undecided
Engineering, math, computer, and
physical sciences
Social sciences, including
psychology Health
care fields Business
Humanities, general studies,
and history
Education and other
applied
All undergraduates 0.24 0.24 0.15 0.33 0.20 0.30 0.32
First- and second-generation
Asian 0.75 1.14 0.77 0.94 0.96 1.03 0.91
Hispanic/Latino 0.56 0.68 0.48 0.72 0.68 0.92 0.82
SOURCE: U.S. Department of Education, National Center for Education Statistics, 2011–12 National Postsecondary Student Aid Study (NPSAS:12).
Table B-12. Standard errors for table A-12 and figure 12: TRADITIONAL AGE UNDERGRADUATES, COLLEGE CREDIT IN HIGH SCHOOL, AND DEVELOPMENTAL EDUCATION, BY AGE AT ARRIVAL Percentage of immigrant undergraduates age 23 or younger; among undergraduates under age 30, percentage who reported taking college-level courses (AP/or college courses) in high school, and percentage of all undergraduates who reported ever taking a developmental course to improve basic skills since completing high school, by age at arrival: 2011–12
Age at arrival Age 23 or younger Earned college credit
(AP or credits) in high school Took a
developmental course
All undergraduates 0.96 0.27 0.27
Adult arrivals 1.19 1.17 2.02
Adolescent arrivals 2.23 1.72 2.06
Child arrivals 1.41 1.32 1.26
SOURCE: U.S. Department of Education, National Center for Education Statistics, 2011–12 National Postsecondary Student Aid Study (NPSAS:12).
Table B-13. Standard errors for table A-13 and figure 13: INSTITUTION TYPE, BY AGE AT ARRIVAL Percentage distribution of immigrant undergraduates’ type of institution, by age at arrival: 2011–12
Age at arrival Others or attended
more than one school For-profit
Private nonprofit
4-year Public 4-year
Public 2-year
All undergraduates 0.28 0.03 0.08 0.10 0.14
Age at arrival
Child arrivals 0.75 0.83 0.88 1.30 1.71
Adolescent arrivals 0.89 1.21 1.43 1.75 2.05
Adult arrivals 1.07 1.39 1.06 1.50 2.14
SOURCE: U.S. Department of Education, National Center for Education Statistics, 2011–12 National Postsecondary Student Aid Study (NPSAS:12).

35
Table B-14. Standard errors for table A-14 and figure 14: FULL-TIME ENROLLMENT, BY AGE AT ARRIVAL Percentage of immigrant undergraduates enrolled full time, by age at arrival: 2011–12
Age at arrival Exclusively full-time
All undergraduates 0.40
Age at arrival
Child arrivals 1.26
Adolescent arrivals 1.92
Adult arrivals 1.71
SOURCE: U.S. Department of Education, National Center for Education Statistics, 2011–12 National Postsecondary Student Aid Study (NPSAS:12).
Table B-15. Standard errors for table A-15 and figure 15: MAJOR FIELD OF STUDY, BY AGE AT ARRIVAL Percentage distribution of undergraduates’ major field of study, by age at arrival: 2011–12
Age at arrival Unknown/ undecided
Engineering, math, computer,
and physical sciences
Social sciences,
including psychology
Health care fields Business
Humanities, general studies,
and history
Education and other
applied
All undergraduates 0.24 0.24 0.15 0.33 0.20 0.30 0.32
Age at arrival
Child arrivals 0.69 0.95 0.81 0.98 0.99 1.24 1.00
Adolescent arrivals 0.60 1.68 1.18 1.59 1.62 1.54 1.38
Adult arrivals 1.26 1.23 0.75 1.75 1.19 1.30 1.46
SOURCE: U.S. Department of Education, National Center for Education Statistics, 2011–12 National Postsecondary Student Aid Study (NPSAS:12).

POWERSTATS VARIABLE
36
APPENDIX C. GLOSSARY
This glossary describes the variables
used in this study. These variables are
primarily from the 2011–12 National
Postsecondary Student Aid Study
(NPSAS:12), and some are from NPSAS
studies conducted in 1999–2000,
2003–04, and 2007–08 (NPSAS:2000,
NPSAS:04, and NPSAS:08). In this
glossary, the variables are listed in
alphabetical order for each study
by the labels used for them in the
tables and figures. The name of each
variable appears to the right of the
variable label.
GLOSSARY INDEX
NPSAS:12 Age as of 12/31/2011 ................................................................................................................... AGE Age when arrived in the United States ....................................................................... IMMIAGE Attended full time ............................................................................................................ ATTNPTRN Citizenship .............................................................................................................................. CITIZEN2 Earned any college credits in high school ............................................................. HSCRDANY English primary language spoken ............................................................................. PRIMLANG Field of study: undergraduate (10 categories) ..................................................... MAJORS4Y Immigrant generational status ...................................................................................... IMMIGEN NPSAS institution sector (4 with multiple) ................................................................ SECTOR4 Parents’ highest education level .................................................................................. PAREDUC Race/ethnicity (with multiple) without foreign students ......................................... RACE2 Remedial courses: ever taken ......................................................................................... REMEVER Sex ............................................................................................................................................... GENDER Undergraduate degree program ...................................................................................... UGDEG
NPSAS:08 Hispanic type ........................................................................................................................ HISPTYPE Immigrant status.................................................................................................................. IMMIGRA NPSAS institution state .................................................................................................... INSTSTAT
NPSAS:04 Hispanic type ........................................................................................................................ HISPTYPE Immigrant status.................................................................................................................. IMMIGRA NPSAS institution state .................................................................................................... INSTSTAT
NPSAS:2000 Hispanic type ........................................................................................................................ NBHISTYP Immigrant status..................................................................................................................... IMMIGR NPSAS institution state .................................................................................................... INSSTATE
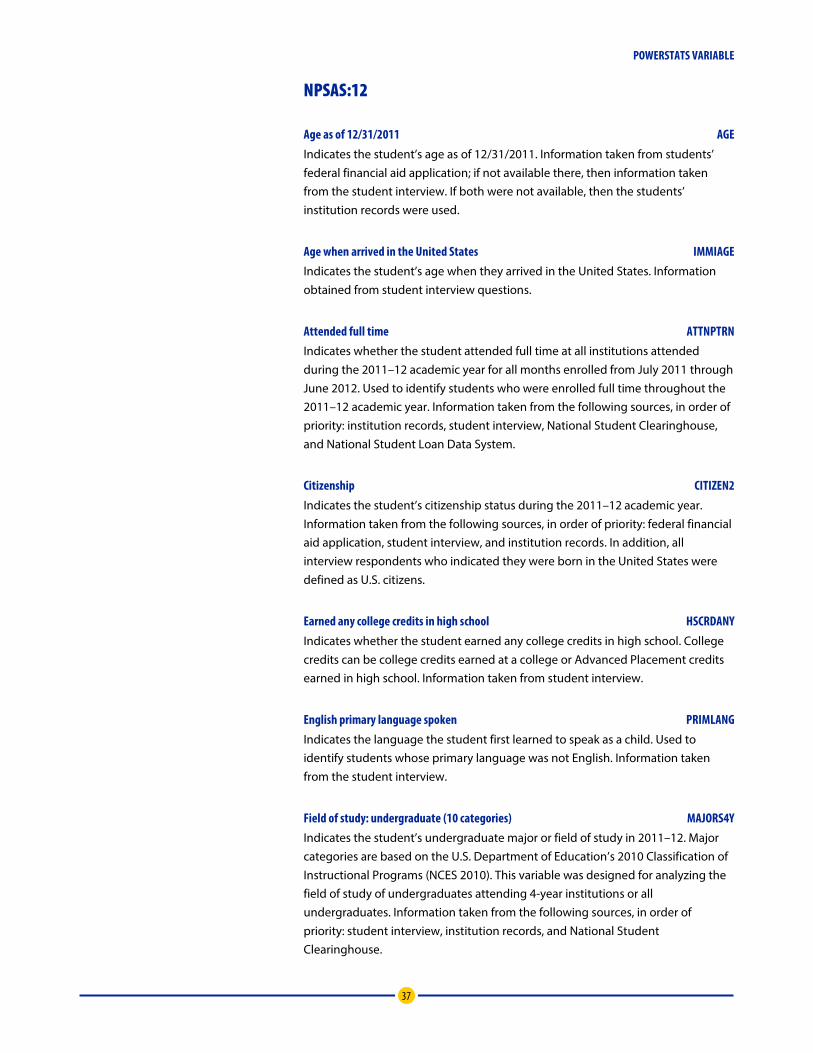
POWERSTATS VARIABLE
37
NPSAS:12
Age as of 12/31/2011 AGE Indicates the student’s age as of 12/31/2011. Information taken from students’ federal financial aid application; if not available there, then information taken from the student interview. If both were not available, then the students’ institution records were used.
Age when arrived in the United States IMMIAGE Indicates the student’s age when they arrived in the United States. Information obtained from student interview questions.
Attended full time ATTNPTRN Indicates whether the student attended full time at all institutions attended during the 2011–12 academic year for all months enrolled from July 2011 through June 2012. Used to identify students who were enrolled full time throughout the 2011–12 academic year. Information taken from the following sources, in order of priority: institution records, student interview, National Student Clearinghouse, and National Student Loan Data System.
Citizenship CITIZEN2 Indicates the student’s citizenship status during the 2011–12 academic year. Information taken from the following sources, in order of priority: federal financial aid application, student interview, and institution records. In addition, all interview respondents who indicated they were born in the United States were defined as U.S. citizens.
Earned any college credits in high school HSCRDANY Indicates whether the student earned any college credits in high school. College credits can be college credits earned at a college or Advanced Placement credits earned in high school. Information taken from student interview.
English primary language spoken PRIMLANG Indicates the language the student first learned to speak as a child. Used to identify students whose primary language was not English. Information taken from the student interview.
Field of study: undergraduate (10 categories) MAJORS4Y Indicates the student’s undergraduate major or field of study in 2011–12. Major categories are based on the U.S. Department of Education’s 2010 Classification of Instructional Programs (NCES 2010). This variable was designed for analyzing the field of study of undergraduates attending 4-year institutions or all undergraduates. Information taken from the following sources, in order of priority: student interview, institution records, and National Student Clearinghouse.

POWERSTATS VARIABLE
38
Immigrant generational status IMMIGEN Indicates the number of generations the student’s family has been in the United States. Second-generation includes U.S.-born citizens with one foreign-born parent. Information was taken from the following sources, in order of priority: student interview, federal financial aid application, and institution records.
NPSAS institution sector (4 with multiple) SECTOR4 Indicates the control and level of the NPSAS sample institution attended during the 2011–12 academic year, for students who attended only one institution. Information was taken from records from each institution a student attended during the 2011–12 academic year.
Parents’ highest education level PAREDUC Indicates the highest level of education achieved by either parent of the student. Used to identify students whose parents did not attend college. If one parent’s education level was unknown, then the level of the other parent was used. Information was taken from the student interview or the federal financial aid application.
Race/ethnicity (with multiple) without foreign students RACE2 Indicates the student’s race/ethnicity with foreign students as a separate category. Information was taken from the following sources, in order of priority: student interview, institution records, and the federal financial aid application.
Remedial courses: ever taken REMEVER Indicates whether the student took remedial or developmental courses to improve basic skills since they completed high school. Information taken from a student interview question reading: “Since you completed high school and through June 30, 2012, have you taken any remedial or developmental courses to improve your basic skills in English, math, reading, or writing? (Remedial or developmental courses are used to strengthen your skills before you take your first college-level course in math, reading, or other subjects. Students are usually assigned to these courses on the basis of a placement test taken before the school year begins. Often, these courses do not count for credit toward graduation.)”
Sex GENDER Indicates the student’s gender. Information taken from the following sources, in order of priority: student interview, federal financial aid application, and institution records.
Undergraduate degree program UGDEG Indicates the undergraduate student’s degree program during the 2011–12 academic year. Information was taken from the following sources, in order of priority: student interview, institution records, and federal financial aid application.

POWERSTATS VARIABLE
39
NPSAS:08
Hispanic type HISPTYPE Indicates the student’s type of Hispanic or Latino origin. Information taken from the student interview.
Immigrant status IMMIGRA Indicates the student’s immigrant status. Information on citizenship is taken from the following sources, in order of priority: institutional records, student interview, and federal financial aid application. Information on student and parent national origin is taken from the student interview.
NPSAS institution state INSTSTAT Indicates the state where NPSAS sample institution is located. Used to remove Puerto Rican institutions from the sample to be comparable to NPSAS:12. Information taken from the 2005–06 Integrated Postsecondary Education Data System (IPEDS), which was used as the sampling frame for NPSAS:08.
NPSAS:04
Hispanic type HISPTYPE Indicates the student’s type of Hispanic or Latino origin. Information taken from the student interview.
Immigrant status IMMIGRA Indicates the student’s immigrant status. Information on citizenship is taken from the following sources, in order of priority: institutional records, student interview, and federal financial aid application. Information on student and parent national origin is taken from the student interview.
NPSAS institution state INSTSTAT Indicates the state where NPSAS sample institution is located. Used to remove Puerto Rican institutions from the sample to be comparable to NPSAS:12. Information taken from IPEDS 2001–02, which was used as the sampling frame for NPSAS:04.

POWERSTATS VARIABLE
40
NPSAS:2000
Hispanic type NBHISTYP Indicates the student’s type of Hispanic or Latino origin. Information taken from IPEDS 1998–99, which was used as the sampling frame for NPSAS:2000.
Immigrant status IMMIGR Indicates the student’s immigrant status. Information on citizenship is taken from the following sources: institutional records, student interview, and federal financial aid application. Information on student and parent national origin is taken from the student interview. If sources conflicted, students were assumed to be noncitizens unless students indicated in the interview that they were born in the United States.
NPSAS institution state INSSTATE Indicates the state where NPSAS sample institution is located. Used to remove Puerto Rican institutions from the sample to be comparable to NPSAS:12. Information taken from IPEDS 1998–99, which was used as the sampling frame for NPSAS:2000.
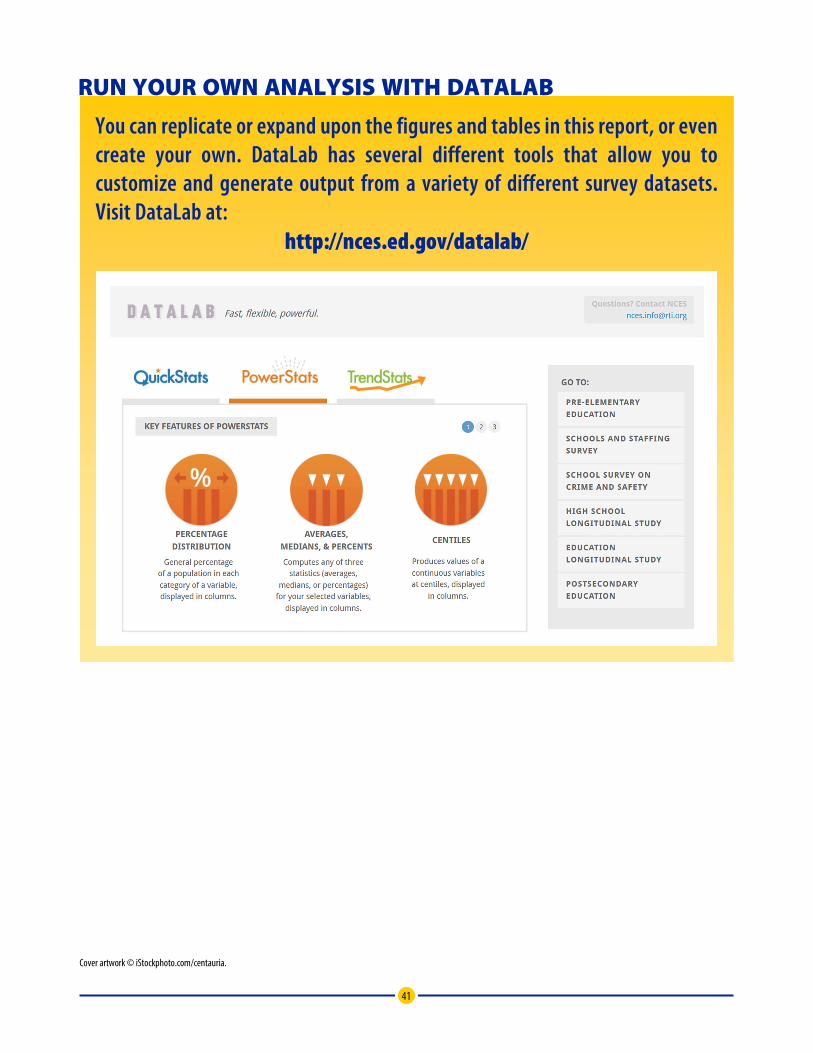
41
RUN YOUR OWN ANALYSIS WITH DATALAB
You can replicate or expand upon the figures and tables in this report, or even create your own. DataLab has several different tools that allow you to customize and generate output from a variety of different survey datasets. Visit DataLab at:
http://nces.ed.gov/datalab/
Cover artwork © iStockphoto.com/centauria.