Embed Size (px)
Citation preview
- United States General Accounting Office
Fact Sheet for the Chairman, Committeeon Governmental Affairs, U.S., Senate
May992CONTRACT PRICING
Status of DefectivePricing yr7
wLCT
BEST Z9~92,533AVAIUBE COP
GAOMSU1CCO1J$4&S
United States iA o -- /General Accounting Office NT TS Q1914GA0 Washington, D.C. 20548 JYI 0l
_____________________St 1 Lo£if, .
National Security andInternational Affairs Division
B-248401IAvailability God"e
May 21,1992 Avail and/orDist special
The Honorable John Glenn I
Chairman, Committee on Governmental AffairsUnited States Senate
Dear Mr. Chairman:
This report is one in a series being issued in response to your request thatwe evaluate the adequacy of controls for preventing fraud, waste, andmismanagement in Department of Defense (DOD) subcontract pricing. Asagreed with your staff, we analyzed the Defense Contract Audit Agency(DCAA) data base of defective pricing audits to assess whether primecontractors and subcontractors complied with a key safeguard intended toensure fair and reasonable prices on noncompetitive procurements-theTruth in Negotiations Act (P.L. 87-653, codified at 10 U.S.C. 2306a).' Lastyear, we issued a report analyzing this data base for fiscal years 1987-90.2
In this report, we have updated the information to include fiscal year 1991and have conducted additional analyses of the data. Our objectives were todetermine (1) the dollar amount of the potential3 defective pricing DCAAidentified in prime contract and subcontract audits, (2) the risk of defectivepricing in smaller contracts, (3) the frequency with which defective pricingoccurred in prime contract and subcontract audits, and (4) the extent thatdefective pricing is concentrated among a small number of contractors.
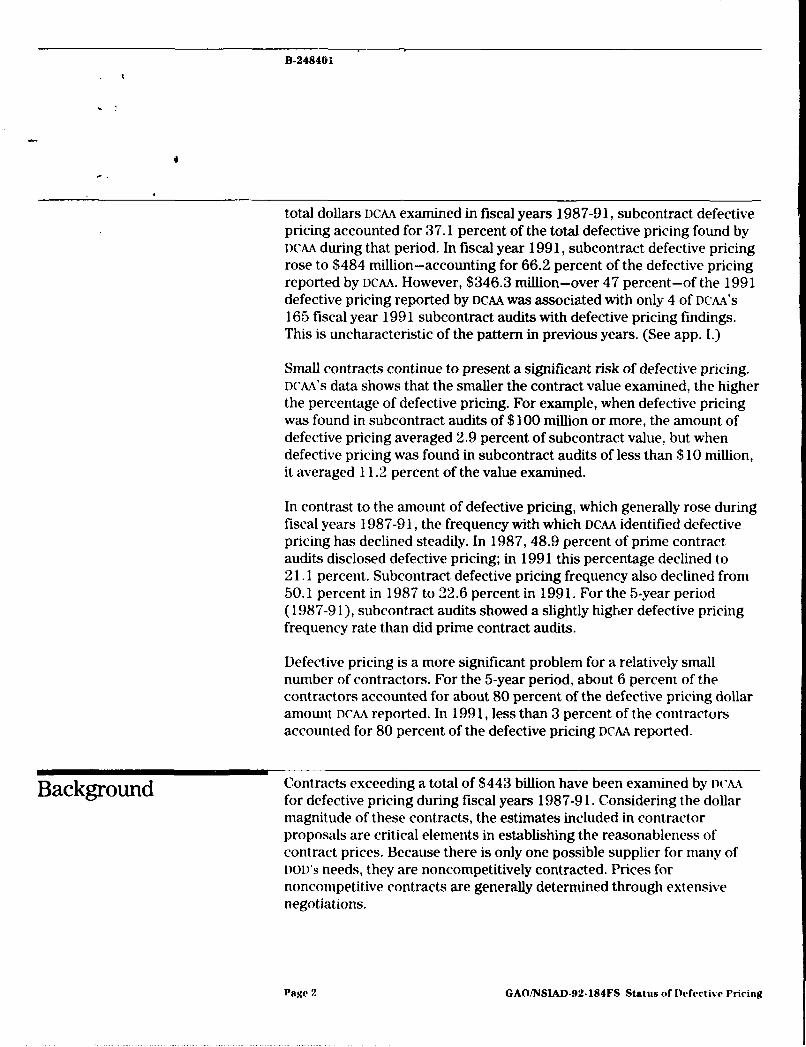
Results in Brief During fiscal years 1987-91, DCAA identified defective pricing totaling$3.67 billion. Defective pricing increased annually until 1990, when itreached $896.6 million. In fiscal year 1991, defective pricing declined to$730.7 million.
A significant portion of the defective pricing identified by DCAA is related tosubcontracts. While subcontracts accounted for only 16.2 percent of the
'Defective pricing occurs when a contractor or subcontractor negotiating a price for a noncompetitivecontract or subcontract, respectively, does not submit accurate, current, or complete data about thecosts included in its proposal and, as a result, the contract or subcontract is increased. If defectivepricing is found, the government has a right to recover the amount of the overcharge.2Contract Pricing: Subcontractor Defective Pricing Audits (GAO/NSIAD-91-148FS, Mar. 21, 1991).
3These are 'potential" defective pricing amounts that are based on recommended adjustments tocontract prices resulting from DCAA defective pricing audits.
Page 1 GAO/NSIAD.92.184FS Status of Defective Pricing
B-248401
total dollars DCAA examined in fiscal years 1987-91, subcontract defectivepricing accounted for 37.1 percent of the total defective pricing found byDCAA during that period. In fiscal year 1991, subcontract defective pricingrose to $484 million-accounting for 66.2 percent of the defective pricingreported by DCAA. However, $346.3 million-over 47 percent-of the 1991defective pricing reported by DCAA was associated with only 4 of DCAA'S
165 fiscal year 1991 subcontract audits with defective pricing findings.This is uncharacteristic of the pattern in previous years. (See app. I.)
Small contracts continue to present a significant risk of defective pricing.DCAA's data shows that the smaller the contract value examined, the higherthe percentage of defective pricing. For example, when defective pricingwas found in subcontract audits of $100 million or more, the amount ofdefective pricing averaged 2.9 percent of subcontract value, but whendefective pricing was found in subcontract audits of less than $10 million,it averaged 11.2 percent of the value examined.
In contrast to the amount of defective pricing, which generally rose duringfiscal years 1987-91, the frequency with which DCAA identified defectivepricing has declined steadily. In 1987, 48.9 percent of prime contractaudits disclosed defective pricing; in 1991 this percentage declined to21.1 percent. Subcontract defective pricing frequency also declined from50.1 percent in 1987 to 22.6 percent in 1991. For the 5-year period(1987-91), subcontract audits showed a slightly higher defective pricingfrequency rate than did prime contract audits.
Defective pricing is a more significant problem for a relatively smallnumber of contractors. For the 5-year period, about 6 percent of thecontractors accounted for about 80 percent of the defective pricing dollaramount DCAA reported. In 1991, less than 3 percent of the contractorsaccounted for 80 percent of the defective pricing DCAA reported.
Backgo~roun d Contracts exceeding a total of $443 billion have been examined by IR.kfor defective pricing during fiscal years 1987-91. Considering the dollarmagnitude of these contracts, the estimates included in contractorproposals are critical elements in establishing the reasonableness ofcontract prices. Because there is only one possible supplier for many ofDOD)'s needs, they are noncompetitively contracted. Prices fornoncompetitive contracts are generally determined through extensivenegotiations.
Page 2 GAO/NSIAD-92-184FS Status of Defective Pricing
B-248401
Recognizing the government's vulnerability in noncompetitive contractingsituations, the Congress passed the Truth in Negotiations Act in 1962 toprotect the government against overstated contract prices. The actrequires that prime contractors and subcontractors submit cost or pricingdata supporting their proposed prices above certain thresholds and certifythat the data submitted is accurate, complete, and current.
If contractors provide inaccurate, incomplete, or noncurrent data thatcauses the contract price to be overstated, the act provides the governmentthe right to reduce the contract price. Historically, DOD has successfullyrecovered about half of the contract price adjustments recommended byDCAA.
DOD established DCAA for the purpose of performing all its contract audits,including defective pricing audits. DCAA performs these audits through itsheadquarters, 5 regional offices, 4 a field detachment in charge of classifiedwork, and 152 field audit offices. DCAA headquarters develops policy andguidance. Regional offices and the field detachment provide planning andoversight. The field audit offices implement the defective pricing program.
DCAA maintains an automated information system that contains informationon completed audits. We used DCAA's data base of completed defectivepricing audits as the basis for our analysis.
Defective Pricing Between fiscal years 1987 and 1991, DCAA completed 8,566 prime contractaudits-3,048 (36 percent) identified $2.31 billion in prime contract
Totaled $3.67 Billion defective pricing. DCAA completed 2,795 subcontract defective pricingaudits during the 5-year period and 1,053 (38 percent) identified$1.36 billion in subcontract defective pricing. Overall, for both primecontract and subcontract audits, defective pricing totaled $3.67 billion forthe 5-year period.
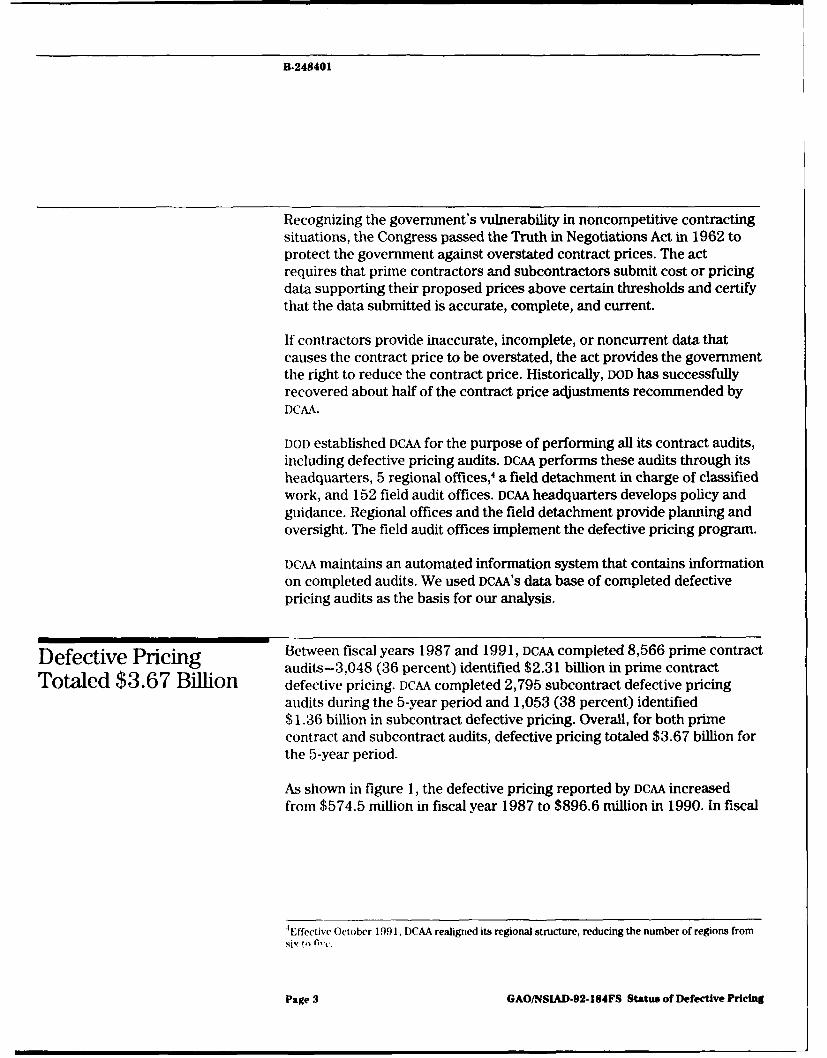
As shown in figure 1, the defective pricing reported by DCAA increasedfrom $574.5 million in fiscal year 1987 to $896.6 million in 1990. In fiscal
'Effective October 1991, DCAA realigned its regional structure, reducing the number of regions from
Page 3 GAO/NSIAD-92-184FS Status of Defective Pricing
B-248401
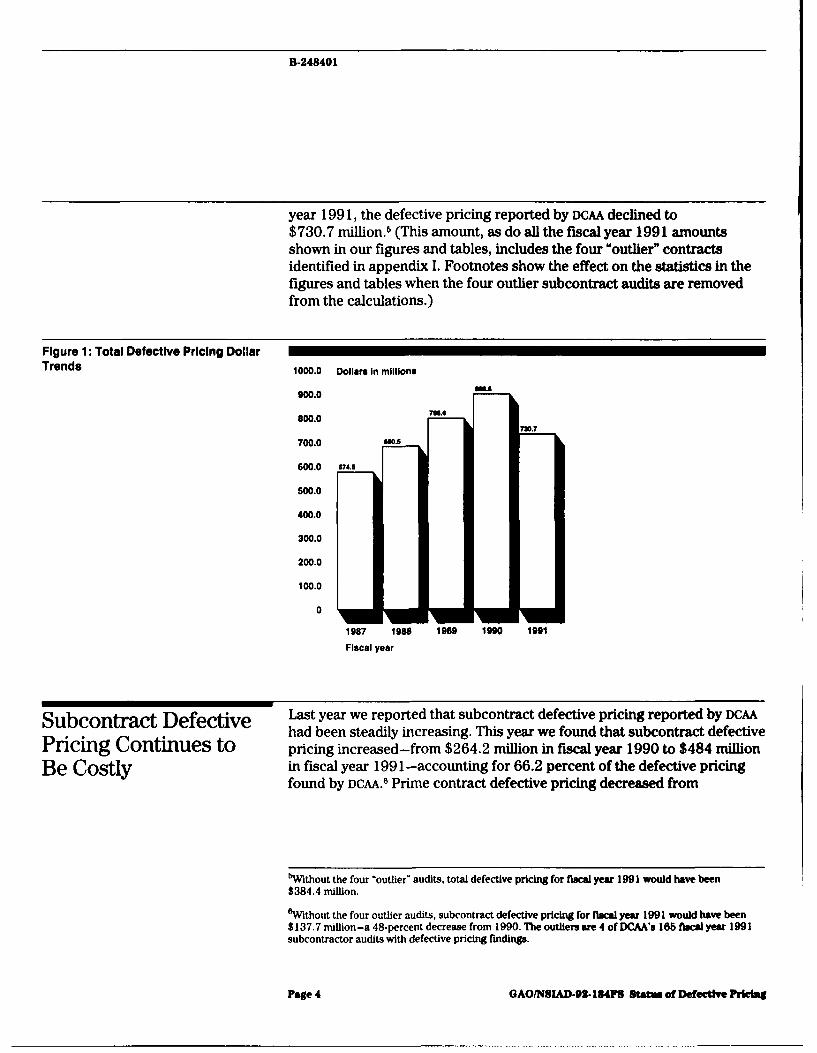
year 1991, the defective pricing reported by DCAA declined to$730.7 million.' (This amount, as do all the fiscal year 1991 amountsshown in our figures and tables, includes the four "outlier" contractsidentified in appendix I. Footnotes show the effect on the statistics in thefigures and tables when the four outlier subcontract audits are removedfrom the calculations.)
Figure 1: Total Defective Pricing DollarTrends 1000.0 Dollars In millions
900.0 49. .
800.0
700.0 OWA
600.0 ss
500.0
400.0
300.0
200.0
100.0
0
1987 1988 1989 190 1991
Fiscal year
Subcontract Defective Last year we reported that subcontract defective pricing reported by DCAAhad been steadily increasing. This year we found that subcontract defective
Pricing Continues to pricing increased-from $264.2 million in fiscal year 1990 to $484 million
Be Costly in fiscal year 1991-accounting for 66.2 percent of the defective pricingfound by DCAA.8 Prime contract defective pricing decreased from
5Without the four 'outlier" audits, total defective pricing for fiscal year 1991 would have been$384.4 million.
OWithout the four outlier audits, subcontract defective pricing for fiscal year 1991 would have been$137.7 million-a 48-percent decrease from 1990. The outliers are 4 of DCAA's 165 fiscal year 1991subcontractor audits with defective pricing findings.
Page 4 GAO/NSIAD-2.184FS Status of Defective Pricing

B348401
$632.4 million in fiscal year 1990 to $246.7 million in fiscal year 1991.(See fig. 2.)
Figure 2: Prime Contract andSubcontract Defective Pricing Dollar 700.0 Dollars In millionsTrends MA
600.0
106.244.
500.0
400.0 .4
300.0
200.0 i
100.0
0
1987 1988 1989 1990 1991
Fiscal year
[ Prime contract defective pricing
Subcontract defective pricing
Subcontract Audits Had a While subcontract audits accounted for 16.2 percent of all dollars
Disproportionate Share of examined by DCAA during the fiscal years 1987-91 ($72 billion versus
Defective Pricing Dollars $371.2 billion for prime contracts), subcontract defective pricingaccounted for 37.1 percent of all defective pricing reported ($1.36 billionversus $2.31 billion for prime contracts).7 (See fig. 3.)
7Vthout the four outlier audits, subcontract audits accounted for 15.9 percent of all dollars examined
($70.3 billion versus $371.2 billion for prime contracts) and 30.6 percent of all defective pricingreported ($1.02 billion versus $2.31 billion for prime contracts).
Page 5 GAO/NSIAD.92.184FS Status of Defective Pricing

B-248401
Figure 3: Total Contract Dollars Examined and Defective Pricing Reported, Fiscal Years 1987-91
16.2% Subcontract dollars examined ($72.0billion)
37.1%. - Subcontract defective pricing ($1.36billion)
152.91%.Prime contract detective pricing ($2,3billion)
83.8% - Prime contract dollars examined ($371.2billion)
Defective Pricing in Last year we reported that subcontracts valued at less than $10 millionhad, as a percentage of contract value, more defective pricing than did
Smaller Contracts larger subcontracts, indicating that smaller subcontracts presented asignificant risk of defective pricing. i('AAs data for fiscal years 1987-91shows that defective pricing was, on average, 7.1 percent of the total valueof prime contract audits under $ 10 million and 11.2 percent of the totalvalue of subcontract audits under $ 10 million. By comparison. tor audits ofcontracts valued at $100 million or more, defective pricing was, onaverage, 0.7 percent of total prime contract value audited and 2.9 percent'of the total subcontract value audited. (See table 1.)
81 ithou the four outlier milwctilract aiet s. tic awvragc (1c tct' C p( il'ng a.1 a |lct'lI it Contract
value would have been 1 .5 pc('cent.
Page 6 GAOrNSIAI)-92- 184FS Status of Defective Pricing
B-248401
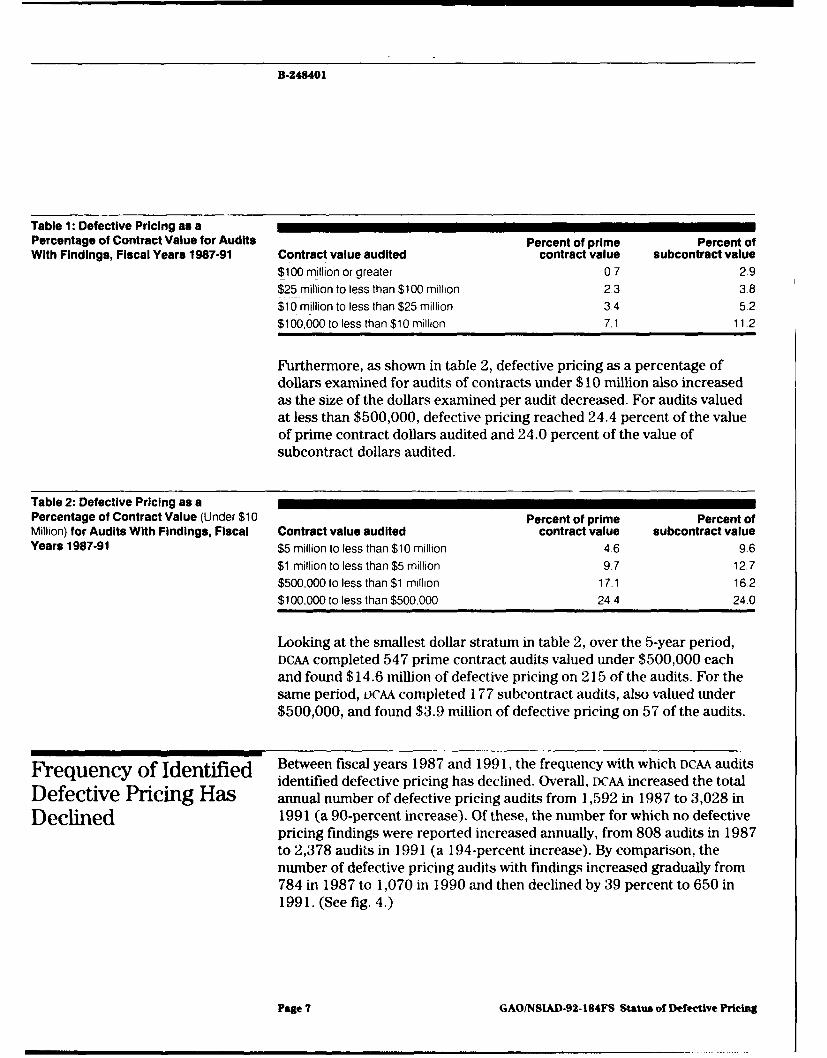
Table 1: Defective Pricing as aPercentage of Contract Value for Audits Percent of prime Percent ofWith Findings, Fiscal Years 1987-91 Contract value audited contract value subcontract value
$100 million or greater 0.7 29$25 million to less than $100 million 2.3 38
$10 million to less than $25 million 3.4 5.2$100,000 to less than $10 million 7.1 11.2
Furthermore, as shown in table 2, defective pricing as a percentage ofdollars examined for audits of contracts under $10 million also increasedas the size of the dollars examined per audit decreased. For audits valuedat less than $500,000, defective pricing reached 24.4 percent of the valueof prime contract dollars audited and 24.0 percent of the value ofsubcontract dollars audited.
Table 2: Defective Pricing as aPercentage of Contract Value (Under $10 Percent of prime Percent ofMillion) for Audits With Findings, Fiscal Contract value audited contract value subcontract valueYears 1987-91 $5 million to less than $10 million 46 96
$1 million to less than $5 million 9.7 12.7
$500,000 to less than $1 million 17.1 16.2$100,000 to less than $500,000 24.4 24.0
Looking at the smallest dollar stratum in table 2, over the 5-year period,DCAA completed 547 prime contract audits valued under $500,000 eachand found $14.6 million of defective pricing on 215 of the audits. For thesame period, oCAA completed 177 subcontract audits, also valued under$500,000, and found $3.9 million of defective pricing on 57 of the audits.
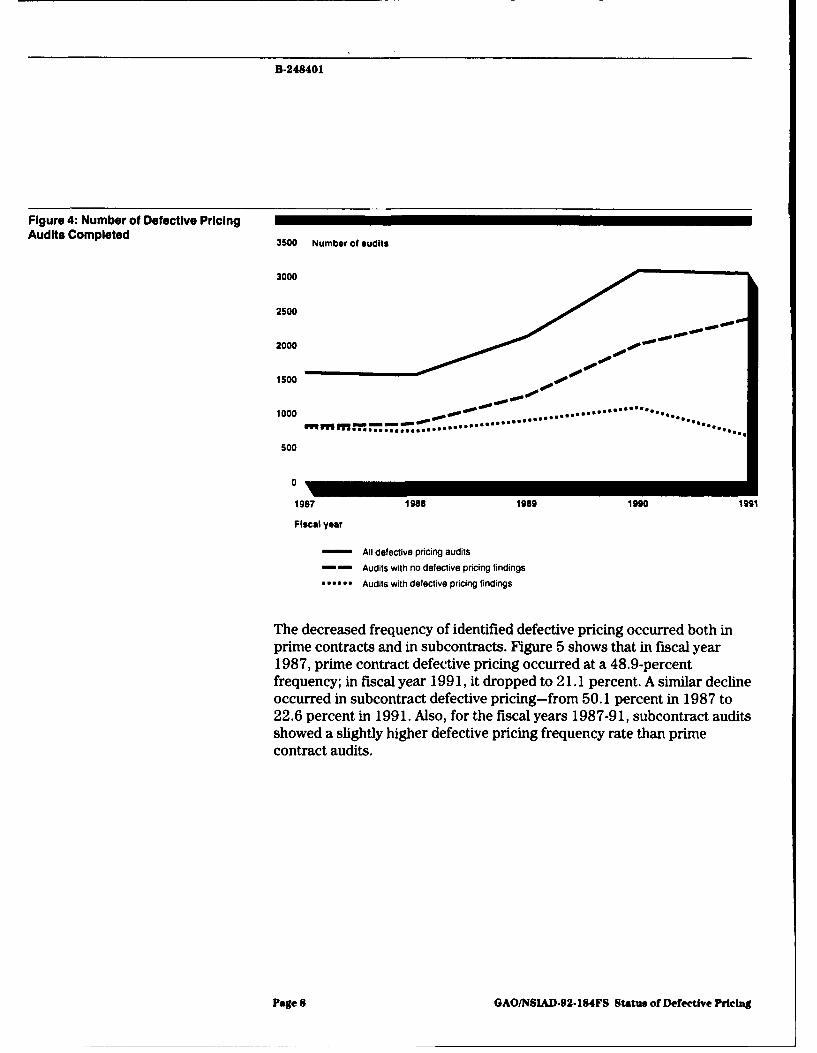
Frequency of Identified Between fiscal years 1987 and 199 1, the frequency with which DCAA auditsidentified defective pricing has declined. Overall, DCAA increased the total
Defective Pricing Has annual number of defective pricing audits from 1,592 in 1987 to 3,028 in
Declined 1991 (a 90-percent increase). Of these, the number for which no defectivepricing findings were reported increased annually, from 808 audits in 1987to 2,378 audits in 1991 (a 194-percent increase). By comparison, thenumber of defective pricing audits with findings increased gradually from784 in 1987 to 1,070 in 1990 and then declined by 39 percent to 650 in1991. (See fig. 4.)
Page 7 GAOiNSIAD-92-184FS Status of Defective Pricing
B-248401
Figure 4: Number of Defective PricingAudits Completed 3500 Number of audits
3000
2500
2000 00 0
1500 "
1000 .......
* .. *. uu'
.:-
. e . ........
500
0
1987 1988 1989 1990 191
Fiscal year
All defective pricing audits
Audits with no defective pricing findings
...... Audits with defective pricing findings
The decreased frequency of identified defective pricing occurred both inprime contracts and in subcontracts. Figure 5 shows that in fiscal year1987, prime contract defective pricing occurred at a 48.9-percentfrequency; in fiscal year 1991, it dropped to 21.1 percent. A similar declineoccurred in subcontract defective pricing-from 50.1 percent in 1987 to22.6 percent in 1991. Also, for the fiscal years 1987-91, subcontract auditsshowed a slightly higher defective pricing frequency rate than primecontract audits.
Page 8 GAO/NSIAD-92-184FS Status of Defective Pricing

B-248401
'igure 5: Frequency of Defective Pricingn Prime Contract and Subcontract 60.0 Defective pricing frequency percentage,udlts
55.010.1 50.8
50.0 _"4.0
41.3 41.6
40.0
35.0
30.0
25.0 Mo
20.0
15.0
10.0
5.0
0
1987 1988 1989 1990 1991
Ficai year
SPrime contract audits
Subcontract audits
Zeasons for the Decline in The reasons, in part, for the $165.9 million decrease in the defectivehe Defective Pricing DCAA pricing DCAA reported between fiscal years 1990 and 1991 are the changesdentified in Fiscal Year 1991 that occurred (1) in the total dollar value of the contracts DCAA audited and
(2) in the frequency with which DCAA found defective pricing. The totaldollar value of the contracts DCAA audited for defective pricing declined by35.3 percent for prime contracts and by 18.5 percent for subcontracts(excluding the four outlier subcontracts). The frequency with which DCAAidentified defective pricing in completed prime contract audits declinedfrom 34.7 percent in fiscal year 1990 to 21.1 percent in fiscal year 1991.The frequency with which DCAA identified defective pricing in completedsubcontract audits declined from 35.3 percent in fiscal year 1990 to22.6 percent in fiscal year 1991.
Page 9 GAO/NSIAD-92-184FS Status of Defective Pricing

B-248401
A Small Number of DCAA's audit reports show that defective pricing is a more significantproblem for a relatively small number of contractors. For fiscal years
Contractors Were 1987-91, about 6 percent of the contractors audited accounted for about
Responsible for Most 80 percent of the $3.67 billion in defective pricing identified by DCAA.
of the Defective Pricing Further, the percent of contractors accounting for 80 percent of thedefective pricing decreased during the 5-year period, from about11 percent in fiscal year 1987 to less than 3 percent in fiscal year 1991.Between fiscal year 1990 and fiscal year 1991, the number of contractorsresponsible for 80 percent of the defective pricing dropped from 73 to 26,a decline of 64 percent.9 By comparison,the total number of contractorsaudited had risen from 812 to 954. (See fig. 6.)
Figure 6: Only a Few of the TotalContractors Audited Were Responsible Number of contractors auditedfor 80 Percent of Defective Pricing 1000
900
8oo
700
600
Soo
400
300
20
100
0
1987 1988 1989 1990 1991
Fiscal year
Total contractors audited
No. responsible for 80% of defective pricing
The 1991 group of contractors with 80 percent of the defective pricing alsoshows a degree of consistency with previous years. Of these 26 contractors,
')This analysis includes the four subcontract outliers for fiscal year 1991. If they were excluded, thenumber of contractors responsible for 80 percent of the defective pricing in 1991 would be 53.
Page 10 GAOINSIAD-92-184FS Status of Defective Pricing
B-248401
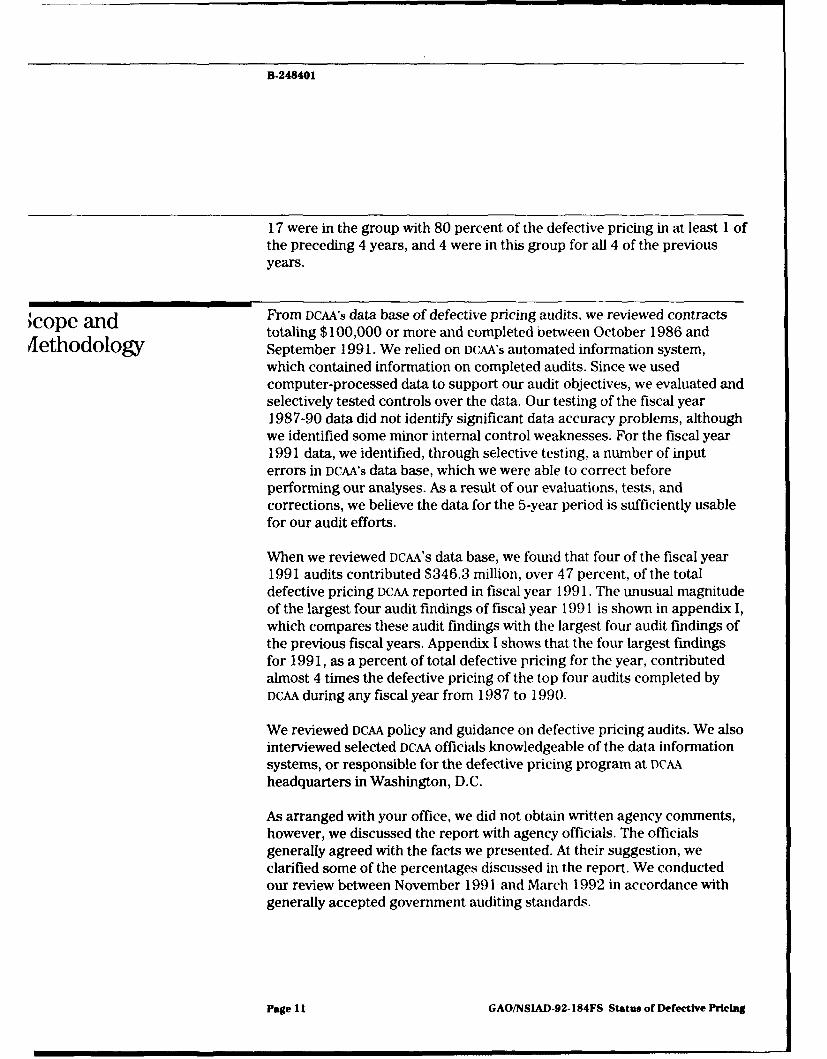
17 were in the group with 80 percent of the defective pricing in at least 1 ofthe preceding 4 years, and 4 were in this group for all 4 of the previousyears.
From DCAA's data base of defective pricing audits, we reviewed contracts
;cope and totaling $100,000 or more and completed between October 1986 and
4ethodology September 1991. We relied on DCAA's automated information system,which contained information on completed audits. Since we usedcomputer-processed data to support our audit objectives, we evaluated andselectively tested controls over the data. Our testing of the fiscal year1987-90 data did not identify significant data accuracy problems, althoughwe identified some minor internal control weaknesses. For the fiscal year1991 data, we identified, through selective testing, a number of inputerrors in DCAA's data base, which we were able to correct beforeperforming our analyses. As a result of our evaluations, tests, andcorrections, we believe the data for the 5-year period is sufficiently usablefor our audit efforts.
When we reviewed DCAA's data base, we found that four of the fiscal year1991 audits contributed $346.3 million, over 47 percent, of the totaldefective pricing DCAA reported in fiscal year 1991. The unusual magnitudeof the largest four audit findings of fiscal year 1991 is shown in appendix 1,which compares these audit findings with the largest four audit findings ofthe previous fiscal years. Appendix I shows that the four largest findingsfor 1991, as a percent of total defective pricing for the year, contributedalmost 4 times the defective pricing of the top four audits completed byDCAA during any fiscal year from 1987 to 1990.
We reviewed DCAA policy and guidance on defective pricing audits. We alsointerviewed selected DCAA officials knowledgeable of the data informationsystems, or responsible for the defective pricing program at DCAA
headquarters in Washington, D.C.
As arranged with your office, we did not obtain written agency comments,however, we discussed the report with agency officials. The officialsgenerally agreed with the facts we presented. At their suggestion, weclarified some of the percentages discussed in the report. We conductedour review between November 1991 and March 1992 in accordance withgenerally accepted government auditing standards.
Page 11 GAO/NSIAD-92-184FS Status of Defective Pricing

B-248401
Unless you publicly announced its contents earlier, we plan no furtherdistribution of this report until 30 days from the date of this letter. At thattime, we will send copies to the Secretary of Defense; the Directors of theDefense Logistics Agency and DCAA; the Director, Office of Managementand Budget; and interested congressional committees. Copies will also bemade available to others upon request.
Please contact me at (202) 275-8400 if you or your staff have anyquestions concerning this report. Other major contributors to this reportare listed in appendix II.
Sincerely yours,
Paul F. MathDirector, Research, Development,Acquisition, and Procurement Issues
Page 12 GAO/NSIAD-92.184FS Status of Defective Pricing
Page 13 GAOINSLWD-92-184FS Status of Defective Pricing
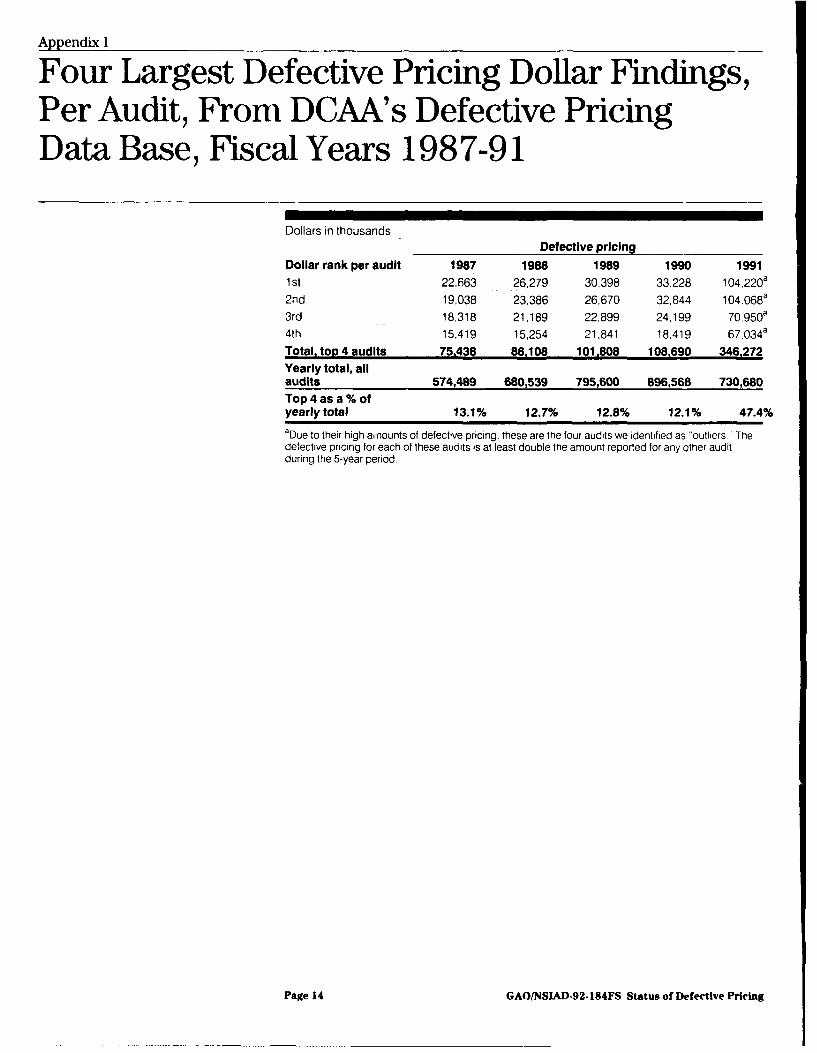
Appendix I
Four Largest Defective Pricing Dollar Findings,Per Audit, From DCAA's Defective PricingData Base, Fiscal Years 1987-91
Dollars in thousands
Defective pricingDollar rank per audit 1987 1988 1989 1990 19911 st 22,663 26,279 30,398 33,228 104,220a2nd 19,038 23,386 26,670 32,844 104,068a3rd 18,318 21,189 22,899 24,199 70,950a4th 15,419 15,254 21,841 18,419 67.034a
Total, top 4 audits 75.438 86,108 101.808 108.690 346.272Yearly total, allaudits 574,489 680,539 795,600 896,568 730,680Top 4 as a % ofyearly total 13.1% 12.7% 12.8% 12.1% 47.4%aDue to their high amounts of defective pricing, these are the four audits we identified as "outliers" Thedefective pricing for each of these audits is at least double the amount reported for any other auditduring the 5-year period.
Page 14 GAO/NSIAD-92-184FS Status of Defective Pricing
Appendix II
Major Contributors to This Report
National Security and Charles W. Thompson, Assistant Director
International A s John L. Carter, Assignment Manager
Division, Washington,D.C.
Seattle Regional Office wilam R. Swick, Regional Defense Issues ManagerNeil T. Asaba, Technical AdvisorDaniel C. Jacobsen, Evaluator-in-ChargeDawn H. Neifert, EvaluatorStanley G. Stenersen, EvaluatorRobert J. Aiken, Computer Analyst
(39695) Page 15 GAO/NSIAD-92-184FS Status of Defective Pricing