Embed Size (px)
Citation preview
Sterile Packaging: An Examination of Statistics and Sampling”
Introduction
• Principles of Risk Management
• Basics of sampling
• Statistical considerations for balancing
costs and risks
• Issues such as sterilization configuration
and data analysis
• Introduction to analysis of variance for
assuring sterile product in the field.
2
Principles of Risk Management
• Two primary principles of quality risk management
are:
– The evaluation of the risk to quality should be based on
scientific knowledge and ultimately link to the protection of
the patient; and
– The level of effort, formality and documentation of the quality
risk management process should be commensurate with the
level of risk.
• Sample size is a function of risk
3
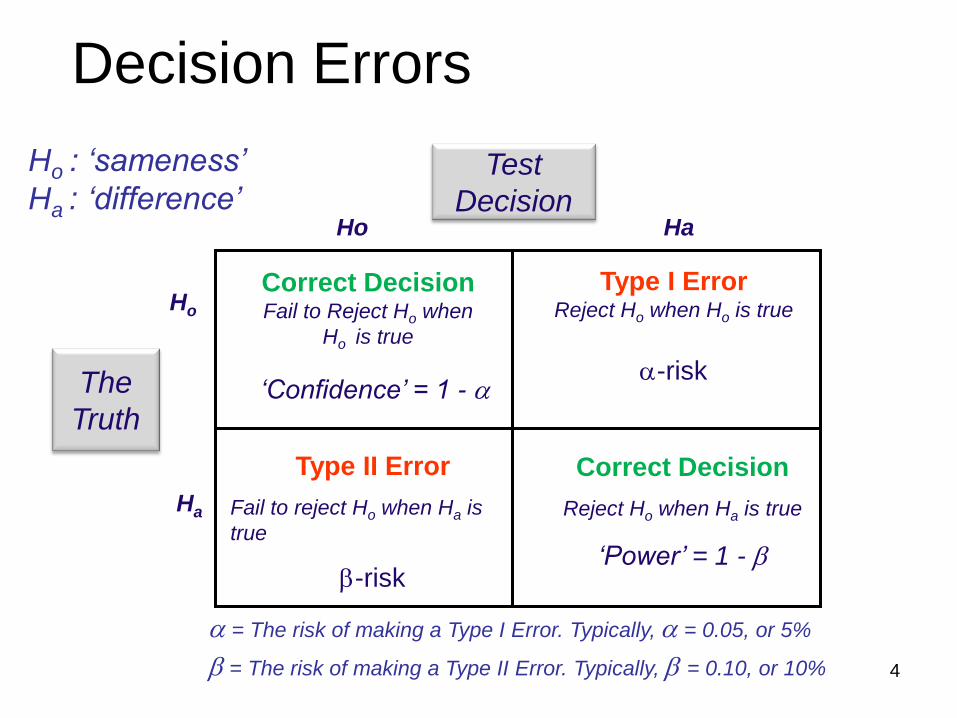
Ho : ‘sameness’
Ha : ‘difference’
Type I Error Reject Ho when Ho is true
a-risk
Type II Error
Fail to reject Ho when Ha is
true
b-risk
Correct Decision Fail to Reject Ho when
Ho is true
Correct Decision
Reject Ho when Ha is true
a = The risk of making a Type I Error. Typically, a = 0.05, or 5%
b = The risk of making a Type II Error. Typically, b = 0.10, or 10%
‘Confidence’ = 1 - a
‘Power’ = 1 - b
Decision Errors
Test
Decision
The
Truth
Ho Ha
Ho
Ha
4
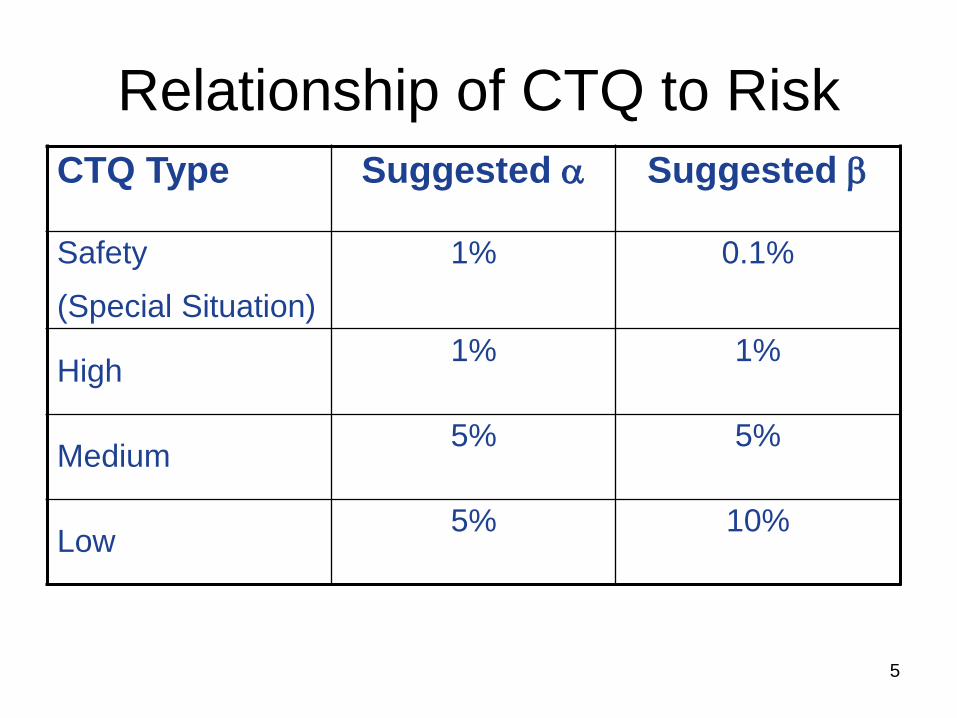
Relationship of CTQ to Risk
CTQ Type Suggested a Suggested b
Safety
(Special Situation)
1% 0.1%
High 1% 1%
Medium 5% 5%
Low 5% 10%
5
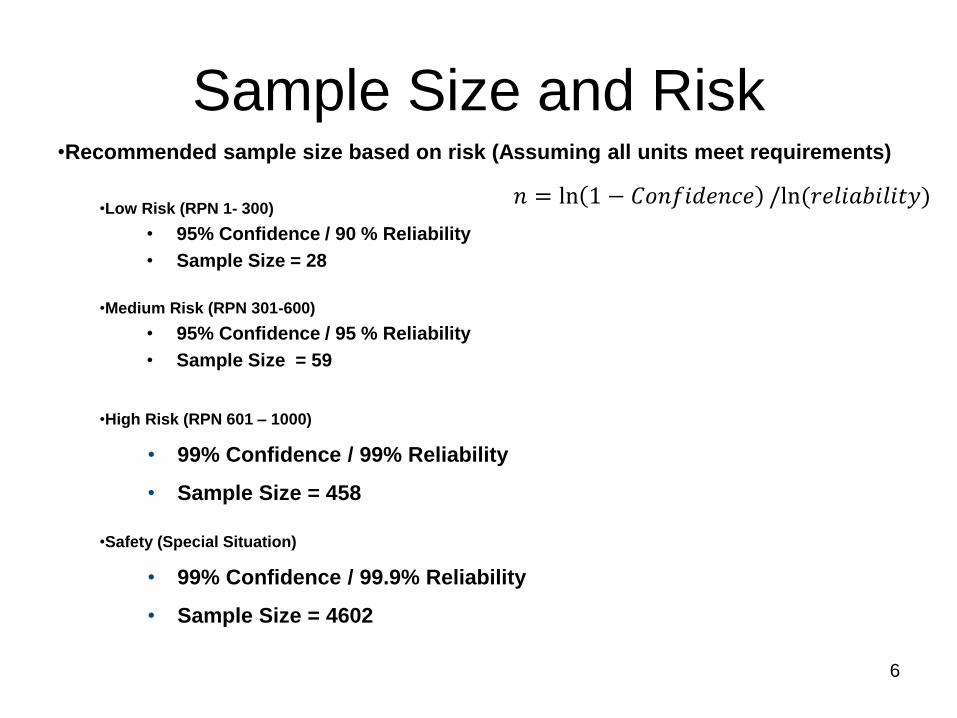
Sample Size and Risk •Recommended sample size based on risk (Assuming all units meet requirements)
•Low Risk (RPN 1- 300)
• 95% Confidence / 90 % Reliability
• Sample Size = 28
•Medium Risk (RPN 301-600)
• 95% Confidence / 95 % Reliability
• Sample Size = 59
•High Risk (RPN 601 – 1000)
• 99% Confidence / 99% Reliability
• Sample Size = 458
•Safety (Special Situation)
• 99% Confidence / 99.9% Reliability
• Sample Size = 4602
𝑛 = ln 1 − 𝐶𝑜𝑛𝑓𝑖𝑑𝑒𝑛𝑐𝑒 /ln(𝑟𝑒𝑙𝑖𝑎𝑏𝑖𝑙𝑖𝑡𝑦)
6
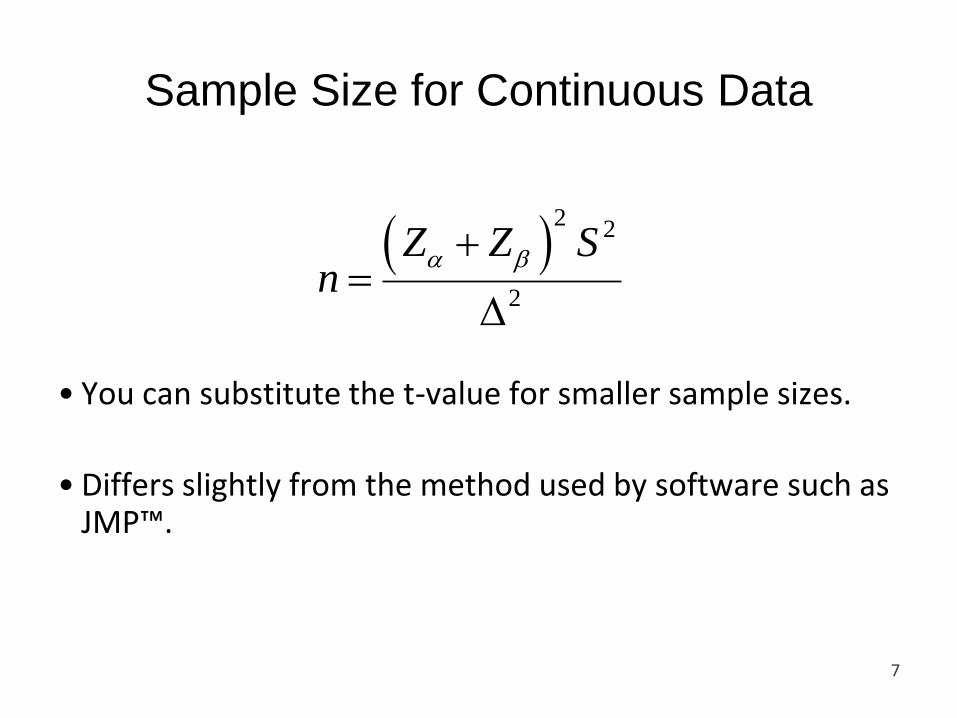
Sample Size for Continuous Data
2
2
2
Z Z Sn
a b
• You can substitute the t-value for smaller sample sizes.
• Differs slightly from the method used by software such as JMP™.
7
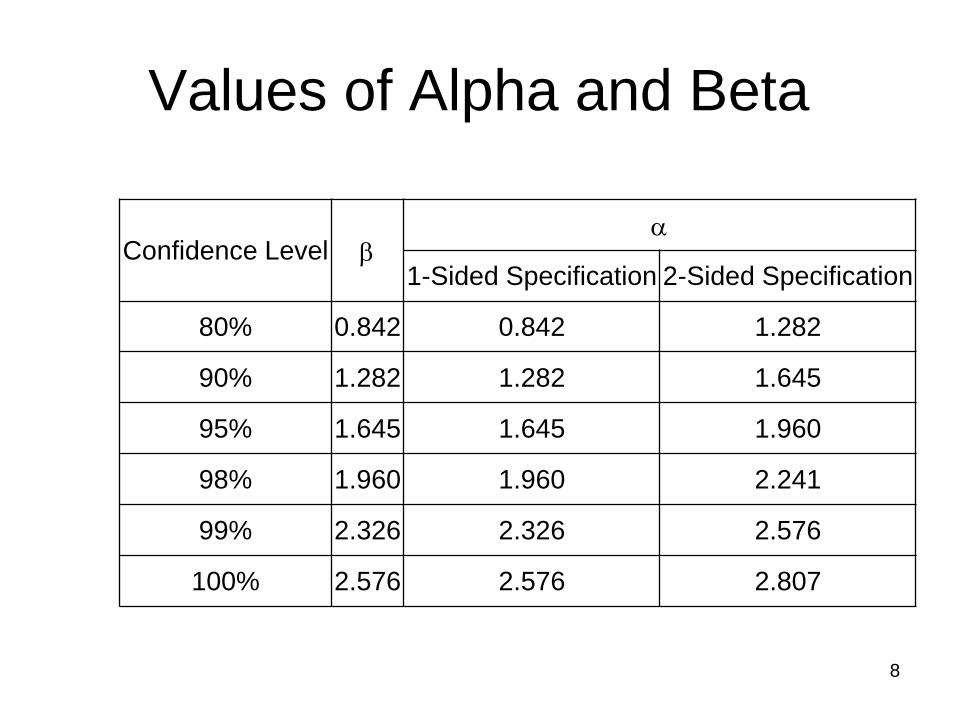
Values of Alpha and Beta
Confidence Level b a
1-Sided Specification 2-Sided Specification
80% 0.842 0.842 1.282
90% 1.282 1.282 1.645
95% 1.645 1.645 1.960
98% 1.960 1.960 2.241
99% 2.326 2.326 2.576
100% 2.576 2.576 2.807
8
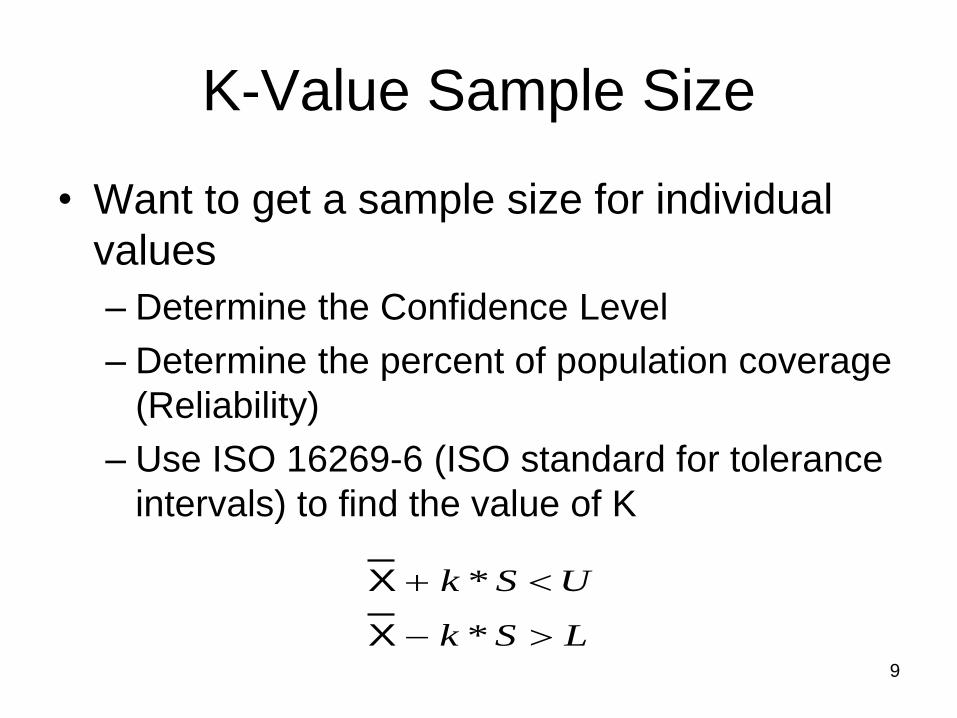
K-Value Sample Size
• Want to get a sample size for individual
values
– Determine the Confidence Level
– Determine the percent of population coverage
(Reliability)
– Use ISO 16269-6 (ISO standard for tolerance
intervals) to find the value of K
9
LSk
USk
*
*
X
X
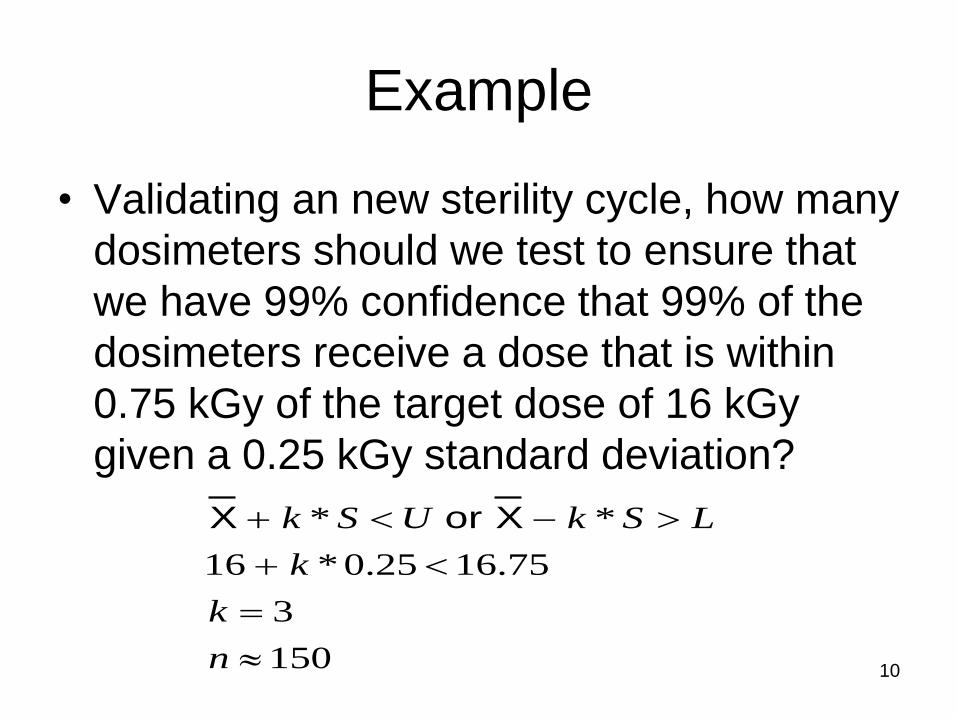
Example
• Validating an new sterility cycle, how many
dosimeters should we test to ensure that
we have 99% confidence that 99% of the
dosimeters receive a dose that is within
0.75 kGy of the target dose of 16 kGy
given a 0.25 kGy standard deviation?
10 150
3
75.1625.0*16
**
n
k
k
LSkUSk X or X
Sterility Assurance
• How do you know that your medical device
is sterile?
– Packaging validation studies?
– Dosimeters during sterilization?
– 100% Inspection?
• Statistically rationale sampling is required! 11
ANOVA and Field Sterility
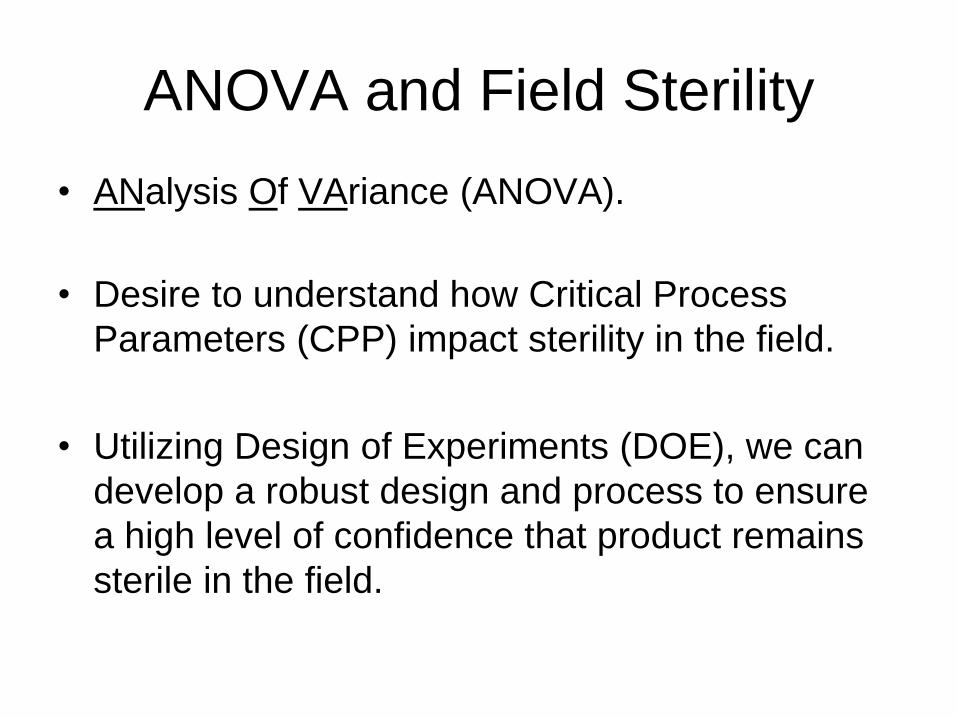
• ANalysis Of VAriance (ANOVA).
• Desire to understand how Critical Process
Parameters (CPP) impact sterility in the field.
• Utilizing Design of Experiments (DOE), we can
develop a robust design and process to ensure
a high level of confidence that product remains
sterile in the field.
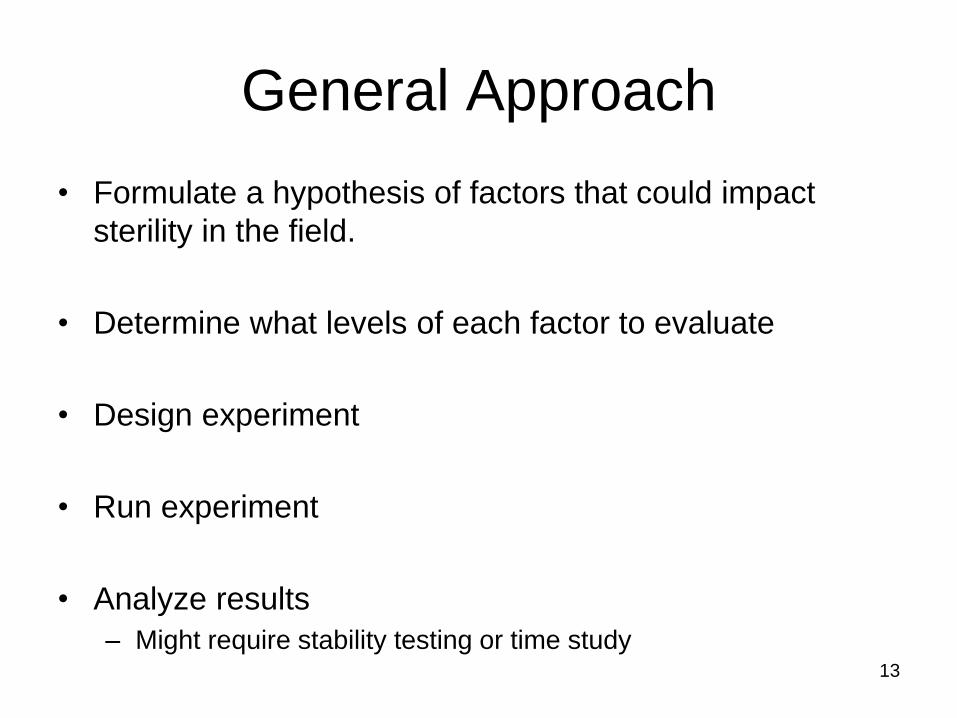
General Approach
• Formulate a hypothesis of factors that could impact
sterility in the field.
• Determine what levels of each factor to evaluate
• Design experiment
• Run experiment
• Analyze results
– Might require stability testing or time study
13
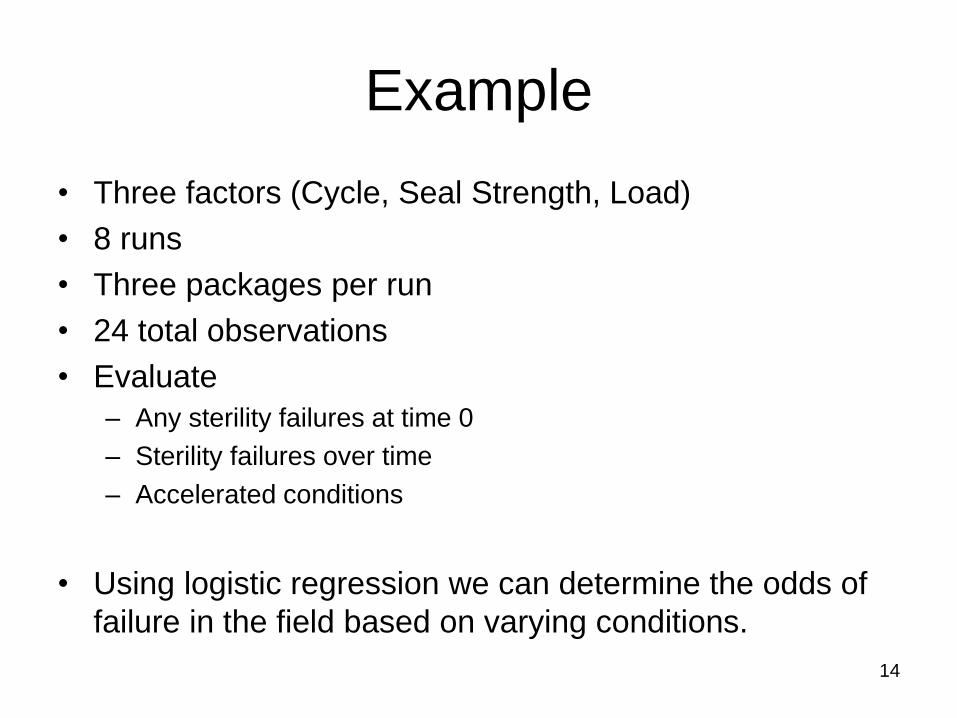
Example
• Three factors (Cycle, Seal Strength, Load)
• 8 runs
• Three packages per run
• 24 total observations
• Evaluate
– Any sterility failures at time 0
– Sterility failures over time
– Accelerated conditions
• Using logistic regression we can determine the odds of
failure in the field based on varying conditions.
14
Example
15
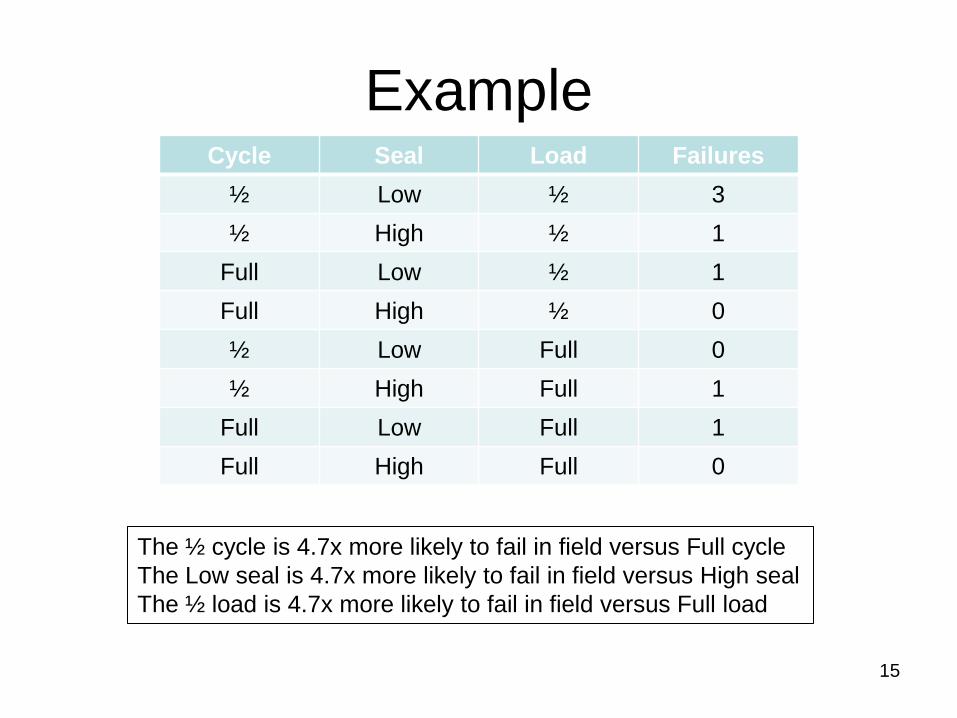
Cycle Seal Load Failures
½ Low ½ 3
½ High ½ 1
Full Low ½ 1
Full High ½ 0
½ Low Full 0
½ High Full 1
Full Low Full 1
Full High Full 0
The ½ cycle is 4.7x more likely to fail in field versus Full cycle
The Low seal is 4.7x more likely to fail in field versus High seal
The ½ load is 4.7x more likely to fail in field versus Full load
Packaging Validation Studies
• Typically optimizing settings to ensure
sterility barrier.
• Testing might include:
– Leak test
– Peel force
16
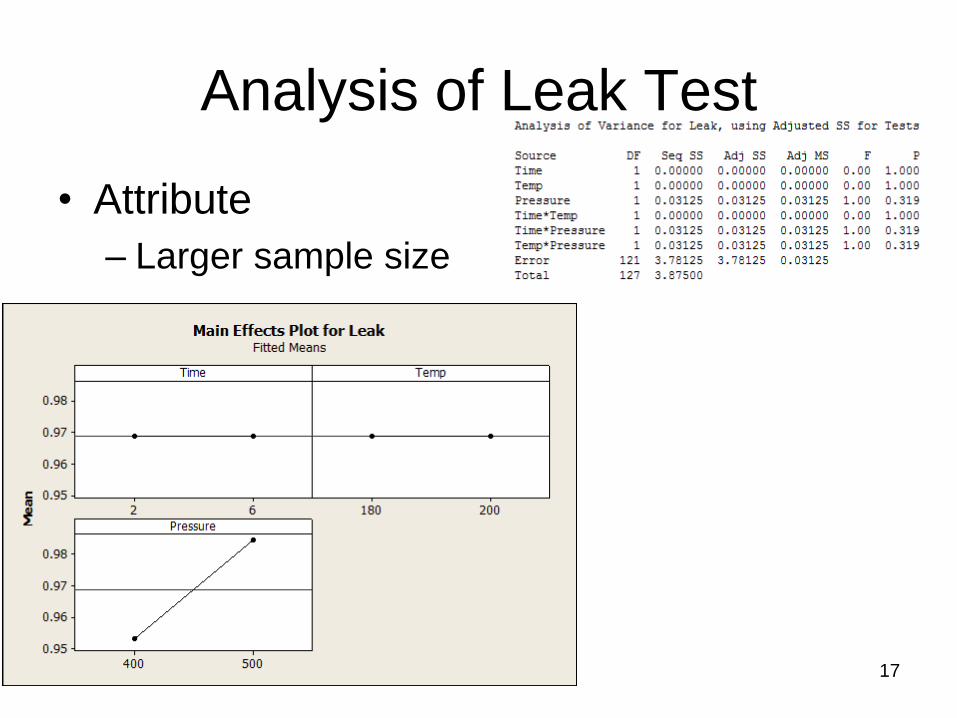
Analysis of Leak Test
• Attribute
– Larger sample size
17
Analysis of Tear Test
• Variable
– Smaller sample
– Correlated to leak?
• 3 Factor Study
– Time (2-6 Seconds)
– Temperature (180 – 200 Degrees)
– Pressure (400-500 PSI)
18
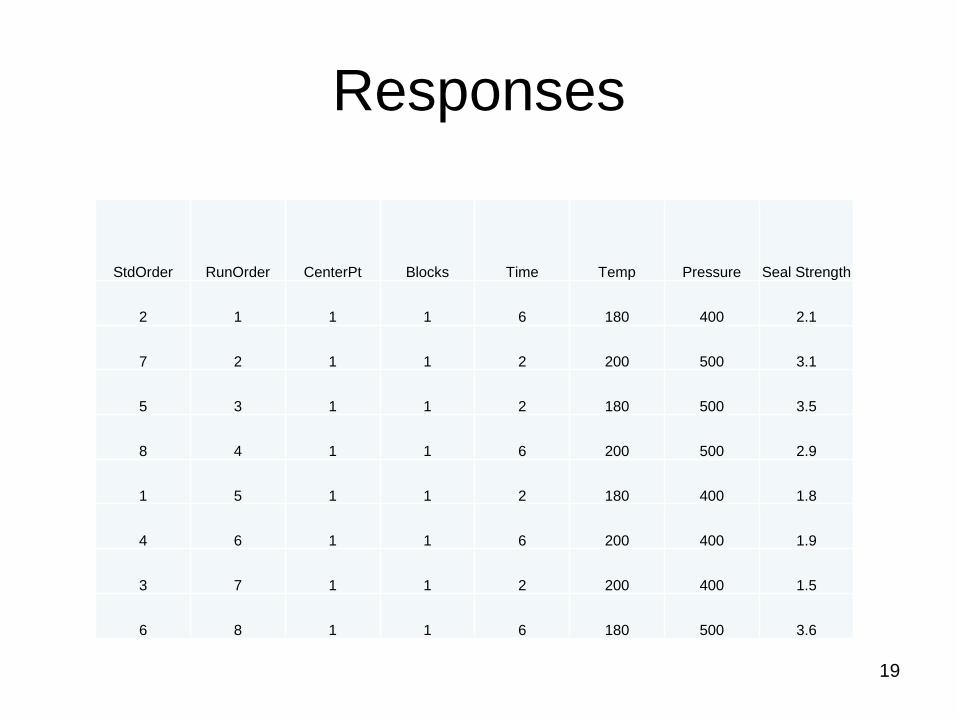
Responses
StdOrder RunOrder CenterPt Blocks Time Temp Pressure Seal Strength
2 1 1 1 6 180 400 2.1
7 2 1 1 2 200 500 3.1
5 3 1 1 2 180 500 3.5
8 4 1 1 6 200 500 2.9
1 5 1 1 2 180 400 1.8
4 6 1 1 6 200 400 1.9
3 7 1 1 2 200 400 1.5
6 8 1 1 6 180 500 3.6
19
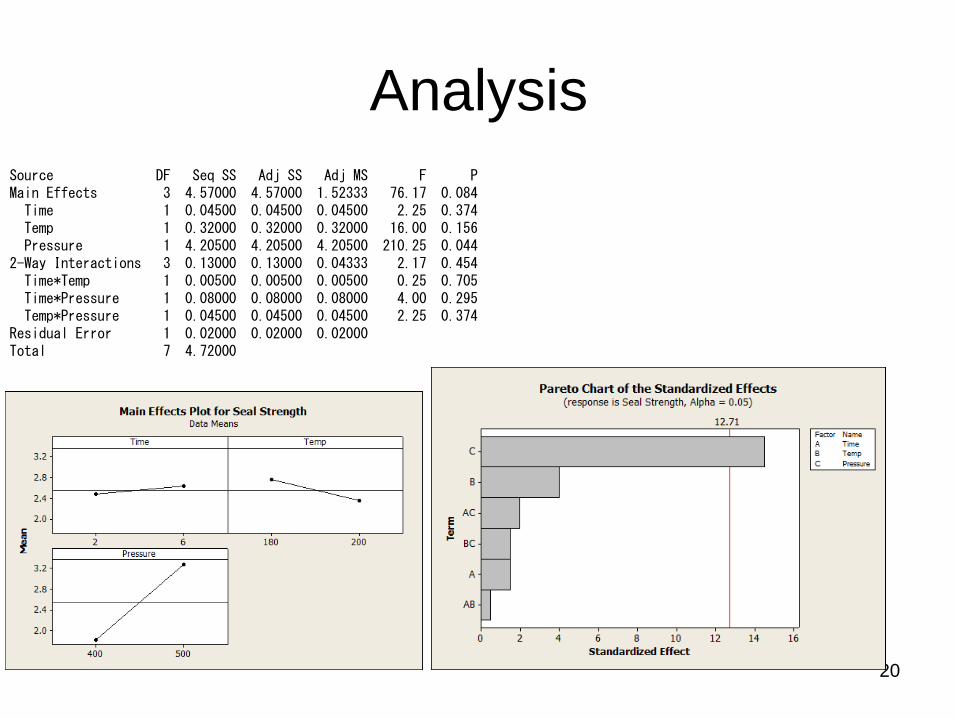
Analysis
20
Source DF Seq SS Adj SS Adj MS F P Main Effects 3 4.57000 4.57000 1.52333 76.17 0.084 Time 1 0.04500 0.04500 0.04500 2.25 0.374 Temp 1 0.32000 0.32000 0.32000 16.00 0.156 Pressure 1 4.20500 4.20500 4.20500 210.25 0.044 2-Way Interactions 3 0.13000 0.13000 0.04333 2.17 0.454 Time*Temp 1 0.00500 0.00500 0.00500 0.25 0.705 Time*Pressure 1 0.08000 0.08000 0.08000 4.00 0.295 Temp*Pressure 1 0.04500 0.04500 0.04500 2.25 0.374 Residual Error 1 0.02000 0.02000 0.02000 Total 7 4.72000
Configuration and Analysis
• A very complex issue is the configuration of the
device and the sterilization chamber.
• The device configuration and packaging
materials can be evaluated during packaging
validation
• Focus on the loading of the sterilization chamber
21
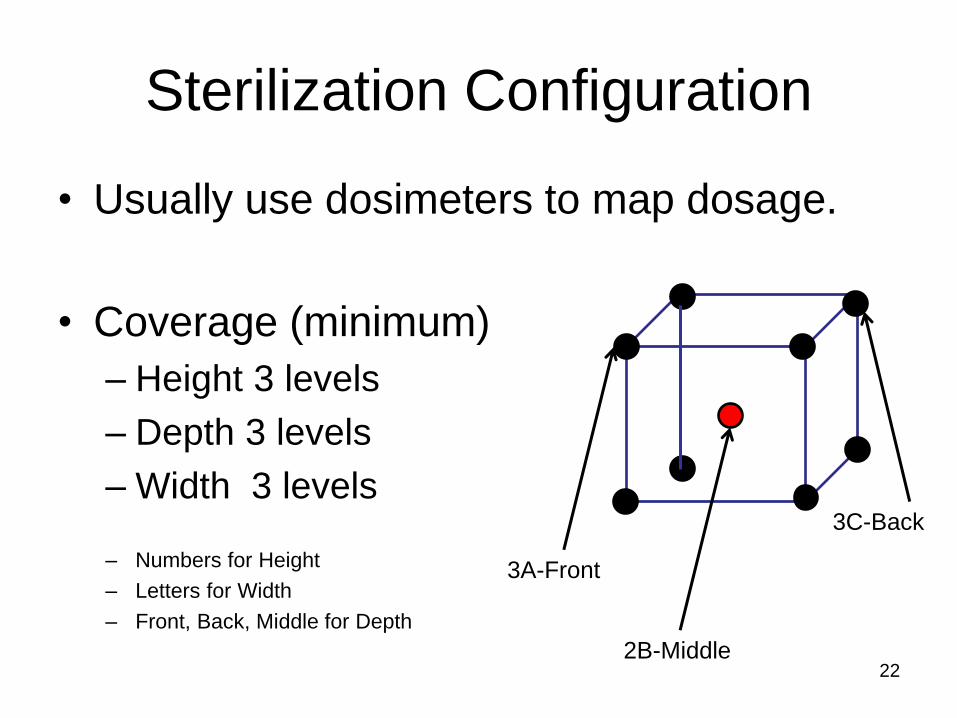
Sterilization Configuration
• Usually use dosimeters to map dosage.
• Coverage (minimum)
– Height 3 levels
– Depth 3 levels
– Width 3 levels
– Numbers for Height
– Letters for Width
– Front, Back, Middle for Depth
22 2B-Middle
3A-Front
3C-Back
Analysis
• Some lessons learned
– Not usually a linear mapping
– Dunnage matters!
– Run to run is fairly consistent with regard to
location
23
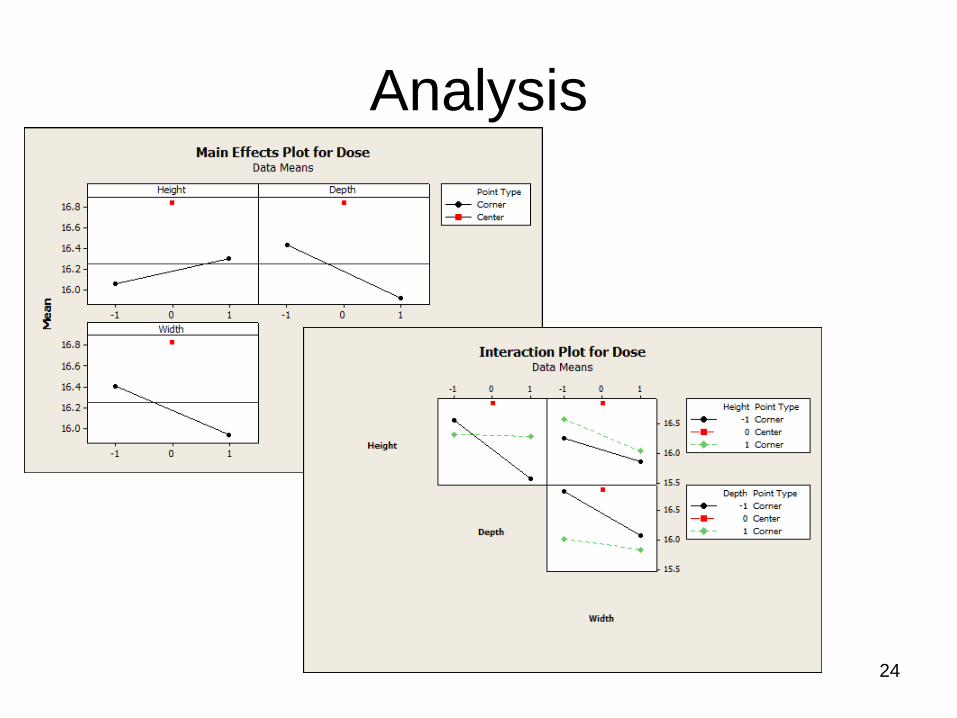
Analysis
24
Summary
• Sample size is related to risk. Higher the risk to the
patient, the larger the sample size.
• Sterility Assurance is established by validation.
• Field Sterility is established by packaging stability
studies.
• Statistical analysis can be employed to give “confidence”
about the configuration and sterilization results seen in a
run.
25