Embed Size (px)
Citation preview

2005 RPP Marsh Complex Bird and Amphibian Inventory Bird Studies Canada
MARSH BIRD, AMPHIBIAN AND ASSOCIATED HABITAT INVENTORIES AT RONDEAU PROVINCIAL PARK
Final Report of 2005 Project Activities
SStteevveenn TT..AA.. TTiimmmmeerrmmaannss RRyyaann WW.. AArrcchheerr
aanndd TTaarraa LL.. CCrreewwee
2005 RPP Marsh Complex Bird and Amphibian Inventory Bird Studies Canada
1
Table of Contents
Table of Contents..................................................................................................1 Acknowledgements...............................................................................................2 Introduction ...........................................................................................................3 Site Description and Sampling Frame...................................................................4 Methods ................................................................................................................5
MMP Monitoring ................................................................................................5 Selection and Characteristics of Routes and Stations ...................................5 Bird Survey Protocol ......................................................................................6 Amphibian Survey Protocol............................................................................6 Habitat Descriptions.......................................................................................7
Pitfall Trap and Visual Search Transect Surveying ...........................................7 Pitfall Trap Setup ...........................................................................................7 Pitfall Trap Monitoring ....................................................................................8 Visual Search Transect Surveying .................................................................8
Results..................................................................................................................9 MMP Bird General Summary.............................................................................9 MMP Anuran General Summary .......................................................................9 Stratified Bird and Habitat Summaries ............................................................10
West to East Stratified Gradient...................................................................10 North to South Stratified Gradient ................................................................11
Stratified Amphibian and Habitat Summaries ..................................................13 West to East Stratified Gradient...................................................................13 North to South Stratified Gradient ................................................................14
Amphibian Pitfall Survey Summaries ..............................................................14 MMP and Pitfall Transect Comparative Summary...........................................15 Amphibian Visual Transect Summary .............................................................15 Relative Status of RPP Wetland Biological Integrity as a Function of Bird and Anuran Community Metric Response to Disturbance......................................15
Discussion ..........................................................................................................16 Bird Species Assemblage and Relative Abundance........................................16 Spatial Patterns of Bird Species Richness and Densities in Relation to Habitat Composition ....................................................................................................17 Amphibian Species Assemblage and Calling Intensities .................................17 Spatial Patterns of Anuran Species Richness and Calling Intensity in Relation to Habitat Composition ....................................................................................18 Pitfall Trap Transect Amphibian Surveys ........................................................19 MMP and Pitfall Transect Methods Comparison .............................................19 Visual Transect Amphibian Survey..................................................................20 Project Costs ...................................................................................................20 Summary of Conclusions.................................................................................21 Literature Cited................................................................................................21
Figures and Tables .............................................................................................23 Appendix A .........................................................................................................49
2005 RPP Marsh Complex Bird and Amphibian Inventory Bird Studies Canada
2
Acknowledgements
We especially thank Brian Locke and Janice Gilbert of the Ontario Ministry of Natural Resources. Brian was instrumental in securing funds to support this project, while Janice provided constant guidance and understanding throughout the duration of the project period. We also thank Sandy Dobbyn for helping to facilitate access to the Park property and for advice and guidance on several aspects of project activities, especially those of pitfall trap surveys. Greg Dunn assisted with project preparation during initial stages of the project and provided inspiration during the field season. John Jefferies and Fergus Nicholl kindly assisted with pitfall trap surveys. Tom Nudds was instrumental in helping to gain animal care protocol approval and regulatory permission from the University of Guelph to capture (using pitfall traps), handle and release amphibians.

2005 RPP Marsh Complex Bird and Amphibian Inventory Bird Studies Canada
3
Introduction Numerous marsh dependent wildlife species are believed to be sensitive to habitat disturbances within and surrounding these aquatic environments, and many scientists and conservationists consider their populations to be at risk due to continued habitat degradation. For instance, marsh birds as a group are believed to be experiencing population declines due to habitat loss and degradation (Gibbs et al. 1992, Conway 1995, Melvin and Gibbs 1996). Further, concern for declining amphibian populations is recognized internationally (Heyer et al. 1994, Stebbins and Cohen 1995). Efforts to monitor and evaluate relative population status and community structure of marsh birds and amphibians across the Great Lakes basin are therefore essential to understanding how well marshes across the basin are functioning to maintain ecological integrity. The Marsh Monitoring Program (MMP) is a unique binational marsh bird and amphibian population monitoring initiative of Bird Studies Canada (BSC) that has successfully engaged volunteer naturalists since 1995 to measure the status and trends of wetland-dependent birds and amphibians, and has provided valuable information about the health and ecological integrity of Great Lakes coastal lacustrine and inland palustrine wetlands. Since the program’s inception, one of its primary objectives has been to contribute to the assessment and long term monitoring of priority wetland sites throughout the Great Lakes basin. During 2005, Bird Studies Canada was contracted by the Ontario Ministry of Natural Resources to participate in a biological inventory and assessment of marsh wetland habitats occurring within Rondeau Provincial Park (hereafter RPP) wetland complex. Specifically, BSC’s role was to implement its Marsh Monitoring Program bird and amphibian survey protocols to complete an inventory of breeding marsh dependent bird and anuran (frogs, toads) species occupying marsh habitats at RPP. The MMP protocol surveys strictly anurans, but not salamanders. Thus, in addition to overseeing MMP survey activities, BSC also implemented other known amphibian survey techniques in an effort to achieve as complete an inventory of all amphibian species present. Amphibian pitfall trapping and visual search transect surveys were also employed during the course of the spring, summer and early fall. Herein, we present the outcome of these collective survey activities with the primary goal of providing the most complete inventory of information derived from this one-year inventory. The specific objectives of our contribution to this project are as follows:
1) Summarize inventory of marsh bird, anuran, and salamander species occurrence and relative abundance temporally across survey periods, across west-east and north-south gradients, and overall for entire breeding period. Summarize habitat description data across survey locations and collectively for all locations surveyed at RPP.
2) Compare anuran species occurrence and relative density data collected through MMP and pitfall trapping, at both the scale of individual survey station locations, and at the scale of the entire RPP marsh complex.
2005 RPP Marsh Complex Bird and Amphibian Inventory Bird Studies Canada
4
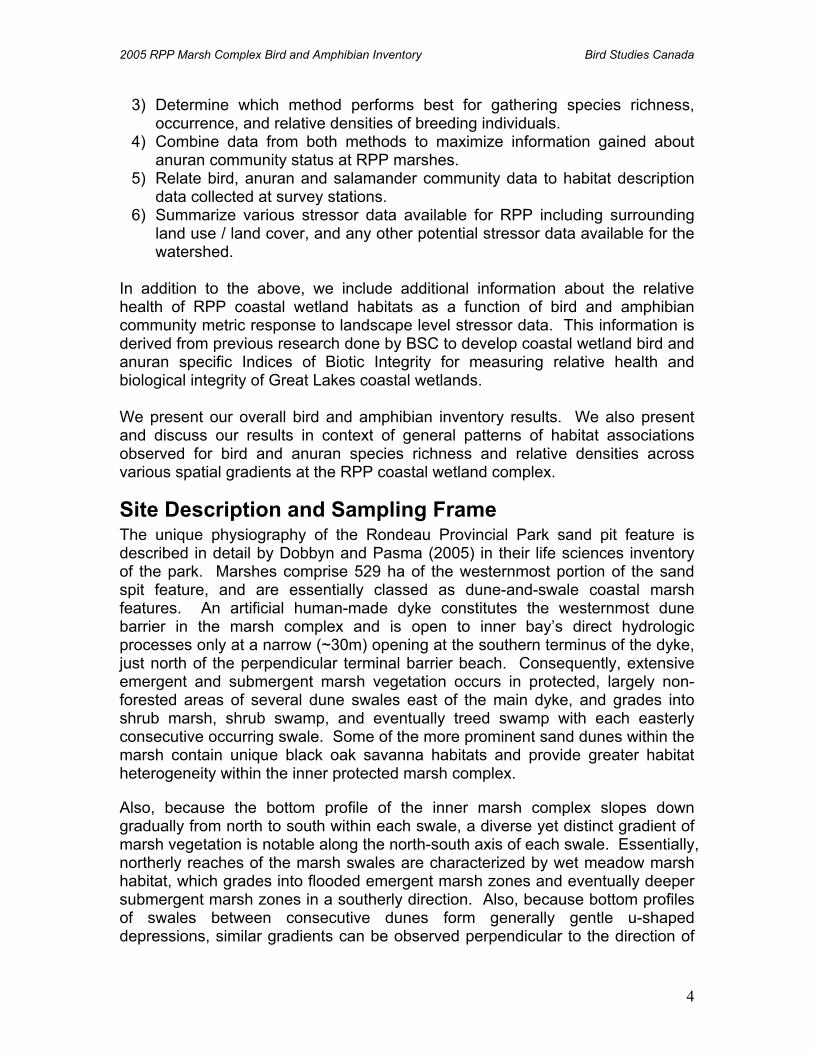
3) Determine which method performs best for gathering species richness, occurrence, and relative densities of breeding individuals.
4) Combine data from both methods to maximize information gained about anuran community status at RPP marshes.
5) Relate bird, anuran and salamander community data to habitat description data collected at survey stations.
6) Summarize various stressor data available for RPP including surrounding land use / land cover, and any other potential stressor data available for the watershed.
In addition to the above, we include additional information about the relative health of RPP coastal wetland habitats as a function of bird and amphibian community metric response to landscape level stressor data. This information is derived from previous research done by BSC to develop coastal wetland bird and anuran specific Indices of Biotic Integrity for measuring relative health and biological integrity of Great Lakes coastal wetlands. We present our overall bird and amphibian inventory results. We also present and discuss our results in context of general patterns of habitat associations observed for bird and anuran species richness and relative densities across various spatial gradients at the RPP coastal wetland complex.
Site Description and Sampling Frame The unique physiography of the Rondeau Provincial Park sand pit feature is described in detail by Dobbyn and Pasma (2005) in their life sciences inventory of the park. Marshes comprise 529 ha of the westernmost portion of the sand spit feature, and are essentially classed as dune-and-swale coastal marsh features. An artificial human-made dyke constitutes the westernmost dune barrier in the marsh complex and is open to inner bay’s direct hydrologic processes only at a narrow (~30m) opening at the southern terminus of the dyke, just north of the perpendicular terminal barrier beach. Consequently, extensive emergent and submergent marsh vegetation occurs in protected, largely non-forested areas of several dune swales east of the main dyke, and grades into shrub marsh, shrub swamp, and eventually treed swamp with each easterly consecutive occurring swale. Some of the more prominent sand dunes within the marsh contain unique black oak savanna habitats and provide greater habitat heterogeneity within the inner protected marsh complex.
Also, because the bottom profile of the inner marsh complex slopes down gradually from north to south within each swale, a diverse yet distinct gradient of marsh vegetation is notable along the north-south axis of each swale. Essentially, northerly reaches of the marsh swales are characterized by wet meadow marsh habitat, which grades into flooded emergent marsh zones and eventually deeper submergent marsh zones in a southerly direction. Also, because bottom profiles of swales between consecutive dunes form generally gentle u-shaped depressions, similar gradients can be observed perpendicular to the direction of

2005 RPP Marsh Complex Bird and Amphibian Inventory Bird Studies Canada
5
the dune-swale complex from the edges of these dunes to the deeper swale basins. Collectively, this results in great diversity of marsh plant life and unique zonations that support a diversity of marsh fauna. Also, as one moves in an easterly direction across the dune and swale marsh complex, the marsh grades from primarily emergent marsh habitat to grass/sedge and buttonbush swamp, and eventually to deciduous hardwood swamp.
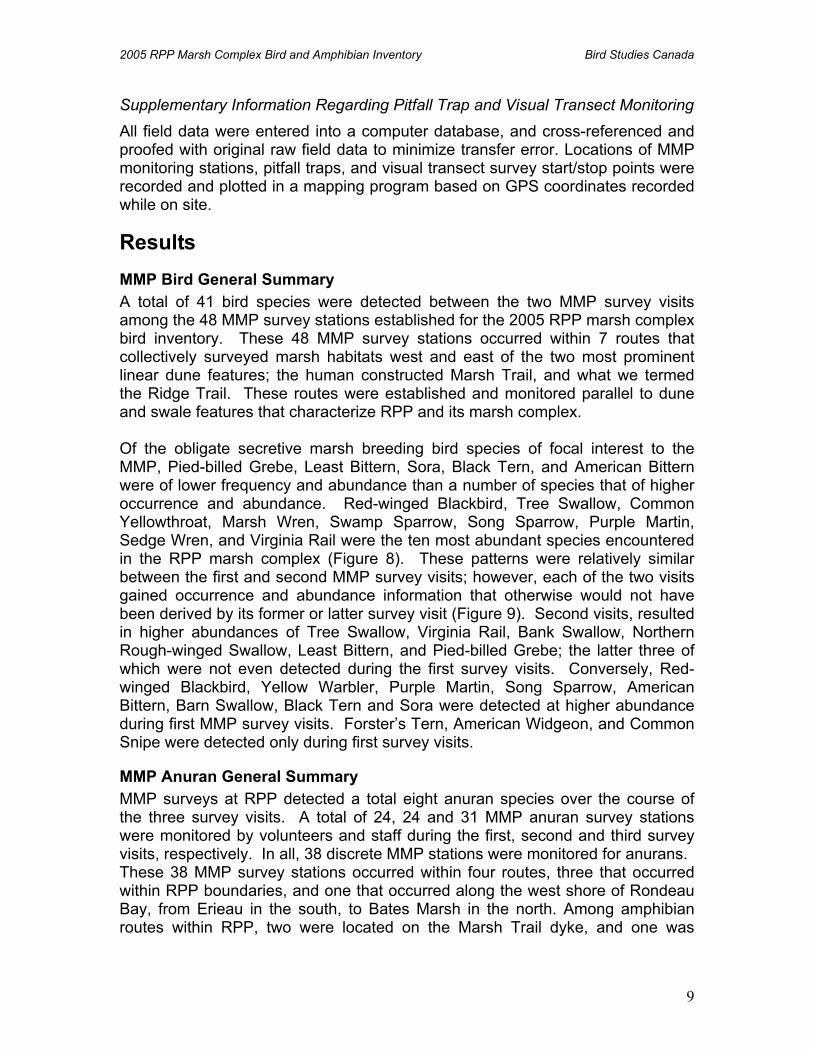
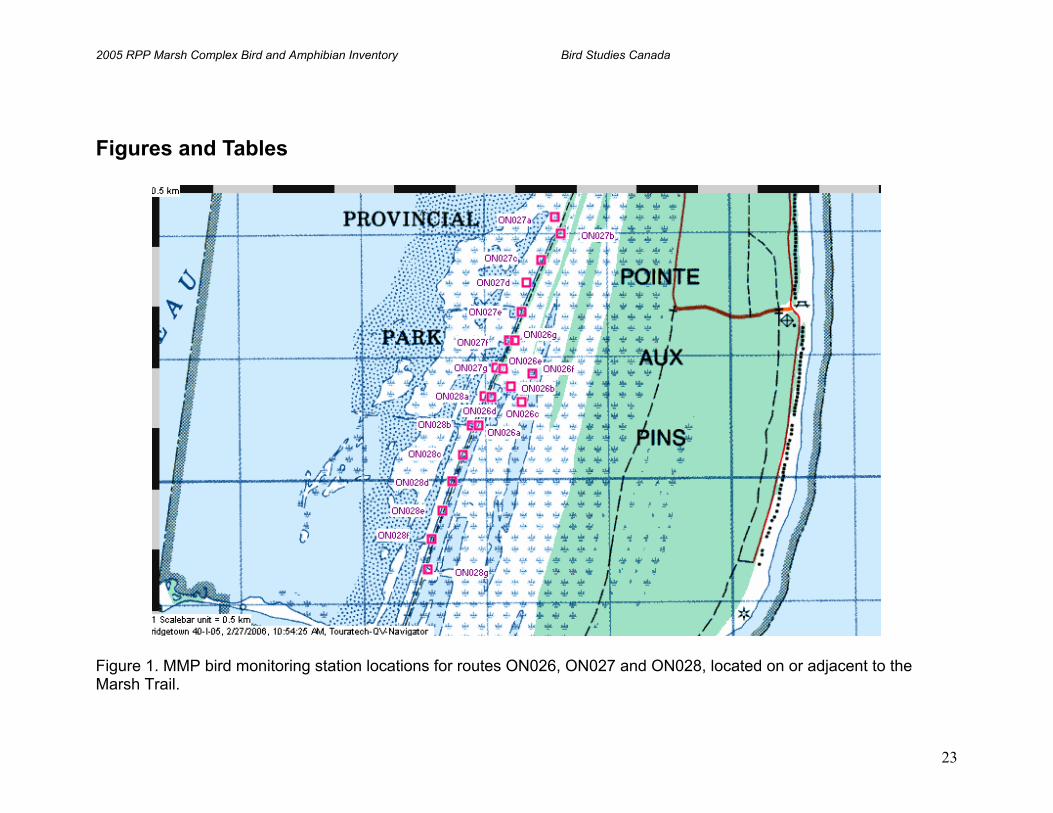
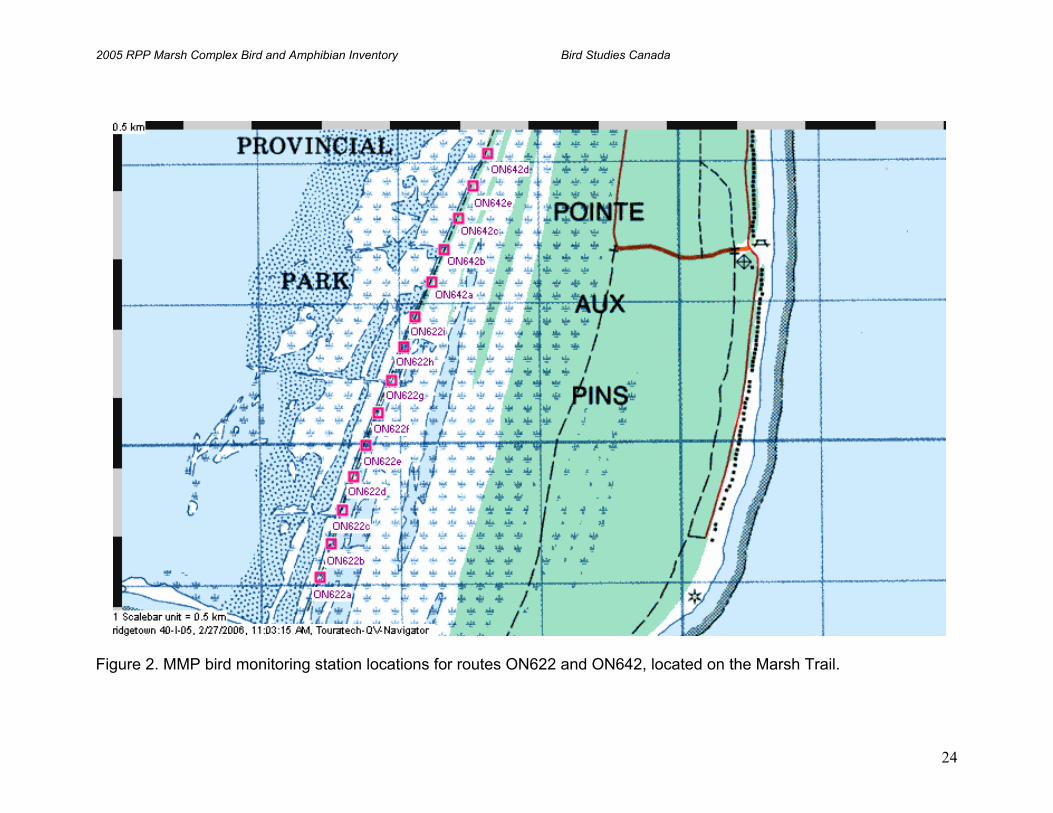
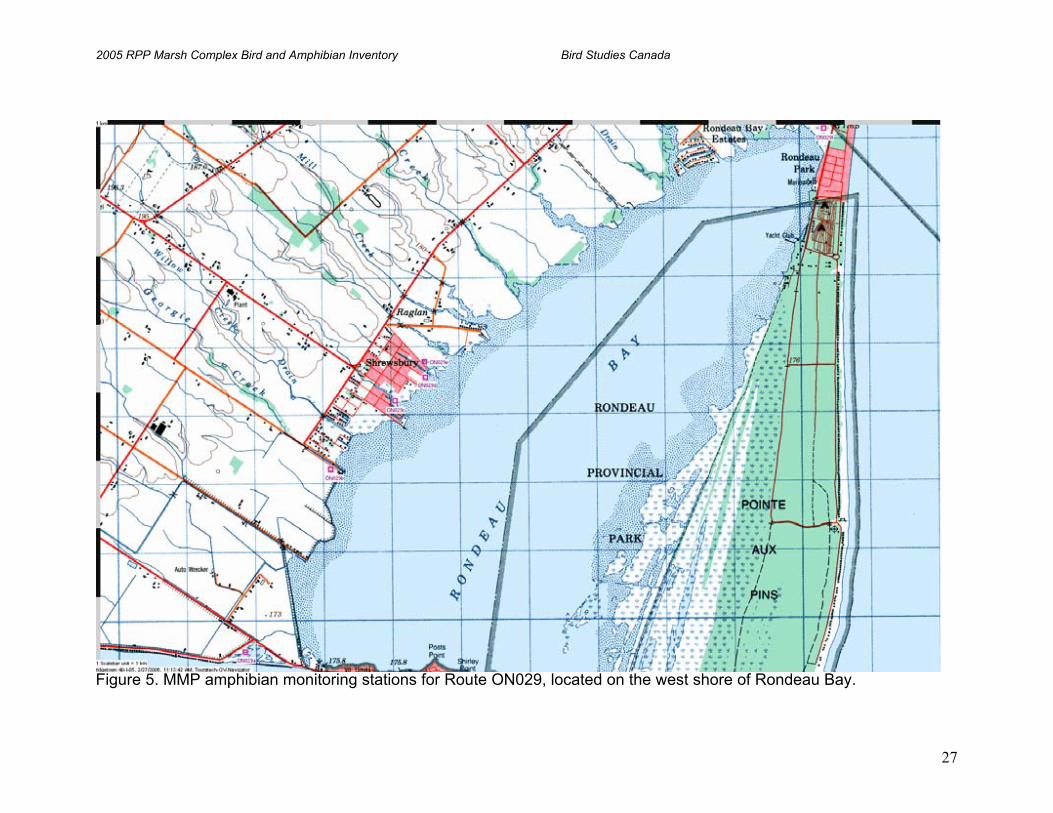
We based selection of monitoring routes for bird and amphibian monitoring activities in an effort to gain adequate representation of anuran and bird communities occupying these marsh habitats during spring and summer breeding periods. Following MMP protocols (see below), we positioned focal points for each monitoring station at roughly equal inter-station distances along linear sand dune features navigable by foot from their northerly sources, and navigable by canoe at their southerly extremes where dunes become less visible and less accessible by foot. We also established an anuran monitoring route along a sand dune comprised mainly of wooded swamp but adjacent to the easterly most portion of the marsh complex, such that observers could aurally detect anurans calling in this eastern marsh section and also fringing wooded swamp. Figures 1 through 5 show locations of bird and anuran monitoring stations surveyed during the 2005 field season.
We engaged survey efforts of MMP volunteers to assist in completion of anuran and bird monitoring of selected routes. These volunteer monitoring activities occurred at three of the four amphibian routes monitored at Rondeau, and at three of the seven bird routes monitored at Rondeau. Collectively, MMP activities gained good survey coverage of marsh habitats within Rondeau Provincial Park during the 2005 survey season.
Methods MMP Monitoring
Selection and Characteristics of Routes and Stations Upon registering with the MMP, volunteers received training kits that included detailed protocol instructions, field and summary data forms, instructional cassette tapes with examples of songs and calls of common marsh birds and amphibians, and a broadcast tape used to elicit calls from secretive wetland bird species. MMP volunteers were encouraged to and provided with some assistance to establish survey routes in marsh sites that are at least 1-ha in size. Each route consisted of one to eight monitoring stations depending on factors such as available time and marsh habitat size. Each marsh bird survey station was separated by at least 250 m (275 yd) to minimize duplicate counts of individuals. For amphibians, this distance was extended to 500 m (550 yd) because observers record all anurans heard both inside and beyond the 100 m station boundary (i.e., within hearing distance).

2005 RPP Marsh Complex Bird and Amphibian Inventory Bird Studies Canada
6
An MMP station was defined as a 100 m (110 yd) radius semicircle with marsh habitat covering greater than 50% of the semicircular area. Marsh habitat was defined as habitat regularly or periodically wet or flooded to a depth of up to two metres (six feet) where cattail, bulrush, burreed and other non-woody vegetation predominated. Counts were conducted from a focal point at each station – the surveyor stood at the midpoint of the 200 m (220 yd) semi-circular base and faced the arc of the station perimeter. Each focal point was permanently marked with a stake and metal tag to facilitate relocation within and between years.
Bird Survey Protocol Survey visits for birds were conducted twice each year between May 20 and July 5, with at least 10 days occurring between visits. Visits began after 18:00 h under appropriate survey conditions (i.e., warm, dry weather and little wind). A five-minute broadcast tape was played at each station during the first half of each 10-minute survey visit. The broadcast tape contained calls of the normally secretive Virginia Rail, Sora, Least Bittern, Common Moorhen, American Coot and Pied-billed Grebe and was used to elicit call responses from those species. During the count period, observers recorded onto a field map and data form, all birds heard and/or observed within the survey station. Aerial foragers were also counted and were defined as those species foraging within the station area to a height of 100 m (110 yd). Bird species flying through or detected outside the station were tallied separately.
Amphibian Survey Protocol Amphibians surveyed by MMP volunteer participants were calling frogs and toads that typically depend on marsh habitat during spring and summer breeding periods. MMP routes were surveyed for calling amphibians during three separate nights each year, between the beginning of April and the end of July, with at least 15 days occurring between visits. Because peak amphibian calling periods are more strongly associated with temperature and precipitation than with date, visits were scheduled to occur during three separate evenings according to minimum night air temperatures of 5 °C (41 °F), 10 °C, (50 °F), and 17 °C (63 °F), respectively. Amphibian surveys began one-half hour after sunset and ended before or at midnight. Visits were conducted during evenings with little wind, preferably in moist conditions with one of the above corresponding temperatures. During three-minute survey visits, observers assigned a Call Level Code to each species detected; for two of these levels, estimated numbers of individuals were also recorded. Call Level Code 1 was assigned if calls did not overlap and calling individuals could be discretely counted. Call Level Code 2 was assigned if calls of individuals sometimes overlapped, but numbers of individuals could still reasonably be estimated. Call Level Code 3 was assigned if so many individuals of a species were calling that overlap among calls seemed continuous (i.e., full chorus); a count estimate is impossible for Call Level Code 3 and thus is not required by the protocol.

2005 RPP Marsh Complex Bird and Amphibian Inventory Bird Studies Canada
7
MMP participants were asked to use their best judgment to distinguish whether each species detected was calling from inside the station boundary only, from outside the station boundary only, or from both inside and outside the station boundary. Combined with habitat information provided for each station by MMP surveyors, this modification enabled us to gain valuable data to examine amphibian habitat associations.
Habitat Descriptions MMP surveyors estimated proportional coverage of habitat characteristics for each MMP station. These descriptions were completed during mid- to late June, when plants were readily identified. Observers provided information about coverage of five general habitat types: herbaceous emergent plants; open water; exposed mud, rock or sand; trees; and shrubs. Percent coverage of the four most dominant types of emergent plants was also recorded, providing a more detailed assessment of this important component of wetland habitat. Observers recorded coverage of floating plants and estimated wetland size and permanency, and adjacent land use. In all figures portraying results of station habitat coverage, for conciseness, we report the grasses and sedges habitat category as ‘grasses’ and the rushes and bulrushes category as ‘rushes’.
Pitfall Trap and Visual Search Transect Surveying
Pitfall Trap Setup Pitfall traps were constructed using 11-L plastic buckets buried such that the top lips of the buckets were level with the surrounding ground surface. Each bucket was covered by a lid with a 20-cm diameter hole. Lids were used not only to prevent escape of amphibians once captured, but to help avoid desiccation of individuals by providing some shading. Desiccation of individuals was also prevented by placing a small amount of moist soil and litter at the bottom of each trap. This also helped to aid respiration of captured amphibians. The surface of the lid around the 20-cm hole was covered with surrounding ground debris to improve camouflage of the traps, and a small twig was placed in the trap to allow small mammal escape. Pitfall traps were situated according to the placement of each MMP monitoring station in both marsh and deciduous swamp habitats, with one transect of six replicate traps per station (Figure 6). In all, five transects were placed within each habitat type adjacent to monitoring stations. This was done in order to distribute sampling effort of pitfall trapping equally across all areas that were surveyed by MMP anuran surveys. Thus, a total of 30 pitfalls were constructed in both the forested and marsh habitat types. Traps were placed approximately 15 m apart along a north-south axis, perpendicular to the direction of monitoring at each associated monitoring station. Each transect was aligned such that the monitoring focal point was in line with the centre of the pitfall trap transect, and approximately 50 m in front of the focal point, perpendicularly.

2005 RPP Marsh Complex Bird and Amphibian Inventory Bird Studies Canada
8
Pitfall Trap Monitoring Pitfall traps were opened and checked during three survey periods (July 4-8, August 8-12 and September 25-28). The final survey period provided an estimate of the number of adults as they migrated back to upland habitat following breeding, and of juvenile recruitment as individuals began to move from breeding habitat in late August. Each survey period began by opening all traps on the first day. Each trap was then checked daily until they were closed after being checked during the morning of the last day. All captured amphibians were removed from each trap when checked. Once removed from the trap, each amphibian was identified to the species level and counted. Anurans were additionally examined for sex by means of examining the colour of the throat and size of the thumb. Afterward, each amphibian was measured to the nearest millimetre, and had one toe clipped with disinfected, sharp surgical scissors in order to identify recaptured individuals. For each individual of any given amphibian species, half of the third inner-most digit at the skeletal joint on the left hind foot was clipped. Amphibians were then released at a distance approximately 1 m from the trap in which they were captured. During periods when sampling did not occur (i.e., between each of the survey periods), each trap was completely covered by replacing the lids with holes with new, complete lids. This ensured that each trap was sealed, and that no capture and/or loss of individuals would occur during non-sampling periods of the study. Each trap was inspected to ensure that it was empty of captured individuals before being covered during non-survey periods. Following the conclusion of pitfall trap monitoring, all pitfall traps were removed, with each hole replaced with soil.
Visual Search Transect Surveying Visual search transect surveys were conducted during the September 25-28 sampling period within the marsh habitat at Rondeau Provincial Park. A total of six separate transect surveys were conducted. These locations were recommended by the Ontario Ministry of Natural Resources project manager due to the historical prevalence of amphibians in these areas (Figure 7). Each transect consisted of 100 m-long replicate sampled segments, each interspersed with a 100 m-long unsampled segment.
Transect surveys were performed by walking along the transect line for 100 m, while visually scanning for amphibians on the ground. Long sticks were used to search among the dense vegetation, in order to facilitate amphibian sightings. The walking duration for the initial replicate sampling segment was recorded and applied to each subsequent replicate so as to ensure a consistent monitoring effort between replicates. Each sighted amphibian was identified to the species level and recorded. If necessary, a dip net was used to temporarily capture amphibians to ensure accurate species identification.
2005 RPP Marsh Complex Bird and Amphibian Inventory Bird Studies Canada
9
Supplementary Information Regarding Pitfall Trap and Visual Transect Monitoring All field data were entered into a computer database, and cross-referenced and proofed with original raw field data to minimize transfer error. Locations of MMP monitoring stations, pitfall traps, and visual transect survey start/stop points were recorded and plotted in a mapping program based on GPS coordinates recorded while on site.
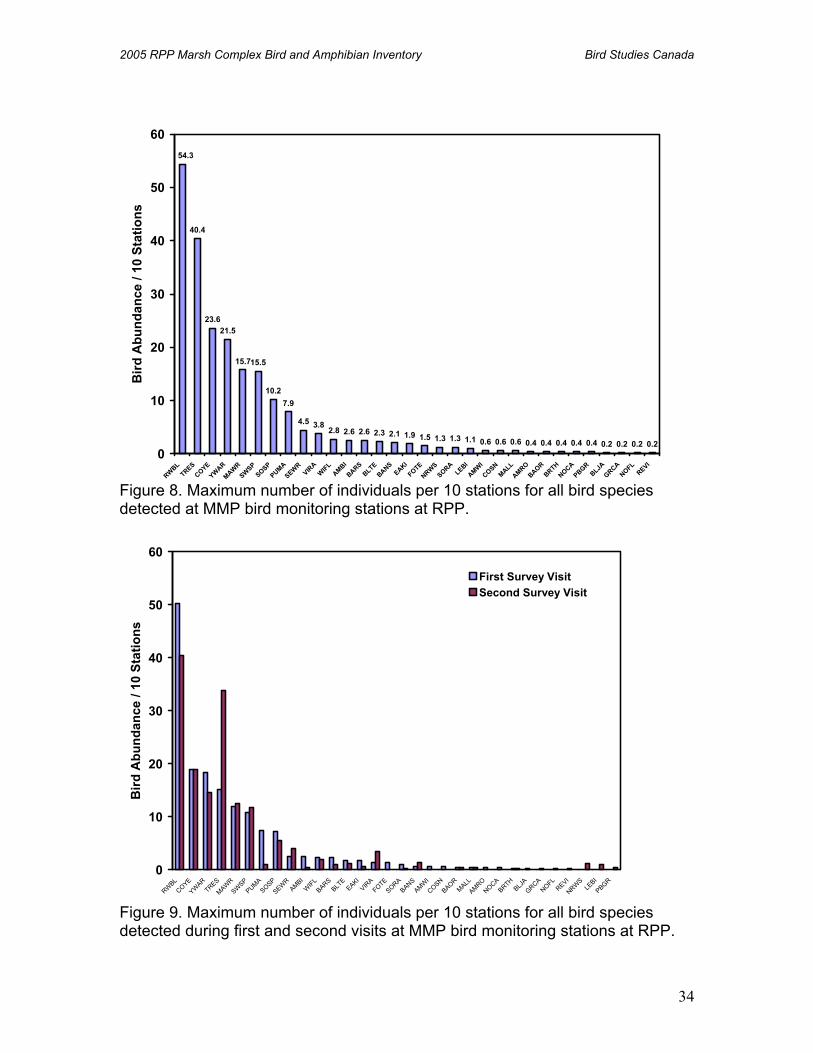
Results MMP Bird General Summary A total of 41 bird species were detected between the two MMP survey visits among the 48 MMP survey stations established for the 2005 RPP marsh complex bird inventory. These 48 MMP survey stations occurred within 7 routes that collectively surveyed marsh habitats west and east of the two most prominent linear dune features; the human constructed Marsh Trail, and what we termed the Ridge Trail. These routes were established and monitored parallel to dune and swale features that characterize RPP and its marsh complex. Of the obligate secretive marsh breeding bird species of focal interest to the MMP, Pied-billed Grebe, Least Bittern, Sora, Black Tern, and American Bittern were of lower frequency and abundance than a number of species that of higher occurrence and abundance. Red-winged Blackbird, Tree Swallow, Common Yellowthroat, Marsh Wren, Swamp Sparrow, Song Sparrow, Purple Martin, Sedge Wren, and Virginia Rail were the ten most abundant species encountered in the RPP marsh complex (Figure 8). These patterns were relatively similar between the first and second MMP survey visits; however, each of the two visits gained occurrence and abundance information that otherwise would not have been derived by its former or latter survey visit (Figure 9). Second visits, resulted in higher abundances of Tree Swallow, Virginia Rail, Bank Swallow, Northern Rough-winged Swallow, Least Bittern, and Pied-billed Grebe; the latter three of which were not even detected during the first survey visits. Conversely, Red-winged Blackbird, Yellow Warbler, Purple Martin, Song Sparrow, American Bittern, Barn Swallow, Black Tern and Sora were detected at higher abundance during first MMP survey visits. Forster’s Tern, American Widgeon, and Common Snipe were detected only during first survey visits.
MMP Anuran General Summary MMP surveys at RPP detected a total eight anuran species over the course of the three survey visits. A total of 24, 24 and 31 MMP anuran survey stations were monitored by volunteers and staff during the first, second and third survey visits, respectively. In all, 38 discrete MMP stations were monitored for anurans. These 38 MMP survey stations occurred within four routes, three that occurred within RPP boundaries, and one that occurred along the west shore of Rondeau Bay, from Erieau in the south, to Bates Marsh in the north. Among amphibian routes within RPP, two were located on the Marsh Trail dyke, and one was

2005 RPP Marsh Complex Bird and Amphibian Inventory Bird Studies Canada
10
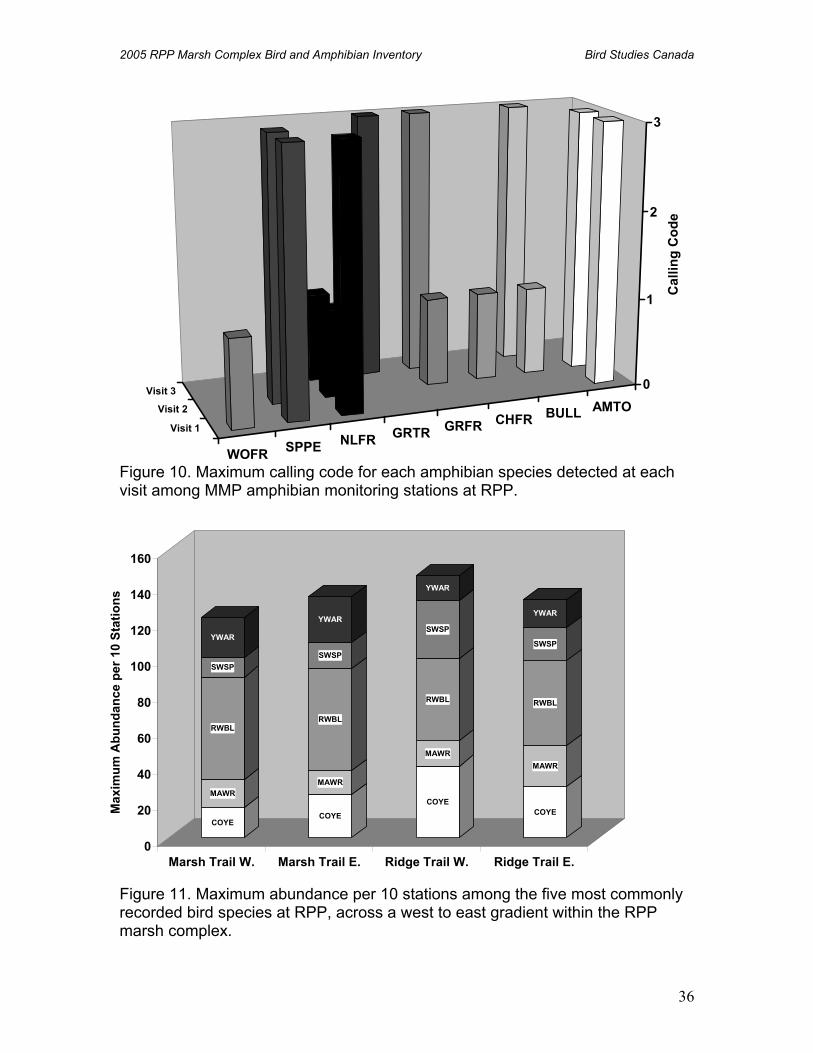
located along South Trail in deciduous swamp habitat adjacent to emergent marsh habitat to the west. Wood Frog, Spring Peeper, Northern Leopard Frog, and American Toad were detected during the first survey visit, all at full chorus (calling code 3) except for Wood Frog, which was recorded at only call code level 1 (Table 3). Second MMP survey visits detected Spring Peeper, Northern Leopard Frog, Green Frog, Chorus Frog, Bullfrog, and American Toad. Only Spring Peeper and American Toad were detected at full chorus during second survey visits; all other species detected were recorded at only call code level 1. Third survey visits detected Northern Leopard Frog, Gray Treefrog, Green Frog, and Bullfrog, each of which were recorded at full chorus except Northern Leopard Frog, which was recorded at Call Code 1 (Figure 10).
Stratified Bird and Habitat Summaries
West to East Stratified Gradient
Most Abundantly Occurring Species Red-winged Blackbird yielded the highest maximum number of birds per 10 stations recorded among the five most commonly recorded species for all four strata (n=56.8 for Marsh Trail West, n=56.9 for Marsh Trail East, n=46.0 for Ridge Trail West and n=47.1 for Marsh Trail East) (Figure 11). Yellow Warbler made up a greater proportion among these species west and east of Marsh Trail (n=22.1 and n=25.6 per 10 stations, respectively) than it did west and east of Ridge Trail (n=14.0 and n=15.7 per 10 stations, respectively). Conversely, Common Yellowthroat was more common west and east of Ridge Trail (n=40.0 and n=28.6 per 10 stations, respectively) than it was west and east of Marsh Trail (n=16.8 and n=24.4, respectively). Swamp Sparrow was also more common west and east of Ridge Trail than it was west and east of Marsh Trail, ranging from a maximum number per 10 stations of 32.2 at Ridge Trail West to 11.0 at Marsh Trail West. Marsh Wren abundance was similar across strata, but was highest east of Ridge Trail, with a maximum number per 10 stations of 22.9.
Focal Marsh Bird Species Focal marsh bird species populations ranged widely between strata (Figure 12). Virginia Rail had the highest maximum number per 10 stations at all strata except Marsh Trail West, where the maximum number was only 1.1, compared to 8.0 at Ridge Trail West. American Bittern was also highest at Ridge Trail West (n=4.0 per 10 stations), but yielded its lowest maximum at Ridge Trail East (n=1.4 per 10 stations). Black Tern was the second most abundant focal species at Ridge Trail West and Marsh Trail West (maximum numbers per 10 stations of 4.3 and 3.1, respectively), but had a maximum number of only 1.6 per 10 stations at Marsh Trail East, and was completely absent from Ridge Trail East. Sora was greatest in abundance at Marsh Trail East and Ridge Trail West (maximum numbers per 10 stations of 2.5 and 2.0, respectively), while being low in abundance at Marsh Trail West (n=0.5 per 10 stations), and completely absent

2005 RPP Marsh Complex Bird and Amphibian Inventory Bird Studies Canada
11
from Ridge Trail East. Least Bittern was most abundant at Marsh Trail West (n=2.1 per 10 stations) and was absent from Marsh Trail East and Ridge Trail West. Pied-billed Grebe was most abundant at Ridge Trail East (n=1.4 per 10 stations) but was absent from Marsh Trail West and Ridge Trail West.
Major Habitat Components Emergent herbaceous vegetation was the dominant habitat type among all four strata, with mean values of 89.3%, 88.9%, 96.0% and 83.3% for Marsh Trail West, Marsh Trail East, Ridge Trail West and Ridge Trail East, respectively (Figure 13). Among the Marsh Trail West and Marsh Trail East strata, open water was the second most common habitat type, with values of 8.3% and 8.4%, respectively. However, shrubs were the second most common habitat type east and west of Ridge Trail, with values of 3.0% for Ridge Trail East and 8.6% for Ridge Trail West. Open water accounted for 5.0% of habitat types west of Ridge Trail, while only accounting for 1.0% of habitat types east of Ridge Trail. Among all strata, trees were most common west of Ridge Trail, accounting for 3.1% of habitat types in that stratum. Dominant Emergent Herbaceous Vegetation Emergent herbaceous vegetation types varied widely in proportional coverage’s between the four strata at bird monitoring stations (Figure 14). West of Marsh Trail, cattails were clearly dominant, with a mean value of 57.2% of emergent vegetation types. Grasses/sedges and reeds followed, with values of 20.6% and 16.4%, respectively. However, east of Marsh Trail, grasses/sedges were dominant, with a mean value of 56.6%. Cattails were the second most dominant emergent vegetation type in this stratum, with 27.1% coverage, followed by reeds, with 9.1% coverage. Grasses/sedges were also largely dominant west of Ridge Trail, accounting for 58.0% of emergent vegetation coverage, a level very similar to that east of Marsh Trail. However, unlike Marsh Trail East, the second most dominant emergent vegetation type was reeds, at 21.0%. East of Ridge Trail, reeds were the dominant emergent vegetation type, with a mean value of 38.0%. Cattails closely followed at 31.4%. Among other emergent vegetation types, rushes/bulrushes accounted for the greatest percentage of emergent habitat east of Ridge Trail, with 7.7%, followed by that west of Ridge Trail, at 7.4%. North to South Stratified Gradient
Most Abundantly Occurring Species Red-winged Blackbird had the highest maximum number of individuals per 10 stations in both the North and South Zones, but was more abundant in the North Zone (n=154 per 10 stations) than for the South Zone (n=101 per 10 stations) (Figure 15). Common Yellowthroat and Yellow Warbler each had a maximum number per 10 stations of 70 in the North Zone, but were less abundant in the South Zone, with maximum numbers per 10 stations of 40 and 31, for Common Yellowthroat and Yellow Warbler, respectively. Swamp Sparrow also decreased from north (n=44 per 10 stations) to south (n=29 per 10 stations). Marsh Wren

2005 RPP Marsh Complex Bird and Amphibian Inventory Bird Studies Canada
12
was the only species among the five most common bird species to increase from north (n=29 per 10 stations) to south (n=45 per 10 stations).
Focal Marsh Bird Species Virginia Rail had the highest maximum number of individuals per 10 stations in the North Zone (n=13) but declined to 5 per 10 stations in the South Zone (Figure 16). By contrast, American Bittern had the highest maximum number of individuals per 10 stations in the South Zone, (n=7) whereas it occurred at 5 per 10 stations in the North Zone. Sora, the second most common focal marsh bird species in the North Zone (n=6 per 10 stations), was not recorded at all at bird monitoring stations in the South Zone. Black Tern maximum numbers per 10 stations increased slightly from 5 to 6 between the north and south zones. Least Bittern remained low in abundance in both strata, with maximum numbers per 10 stations of 3 and 2 for the North Zone and South Zone, respectively. Pied-billed Grebe was present only in the South Zone, with a maximum number per 10 stations of 2.
Major Habitat Components Emergent herbaceous vegetation was clearly dominant in the North Zone, as recorded at bird monitoring stations, with a mean station coverage of 91.6% (Figure 17). Open water and shrubs were the next most dominant habitat types, with 4.0 and 3.5% station coverage, respectively. By comparison, emergent herbaceous vegetation was also dominant in the South Zone, (84.5% station coverage), but a greater amount of open water occurred (12.5% station coverage) than in the North Zone. Shrubs accounted for 2.9% of station coverage in the South Zone.
Dominant Emergent Herbaceous Vegetation Among emergent herbaceous vegetation types, grasses/sedges were the most common in the North Zone, with a mean value of 45.6% mean coverage of emergents (Figure 18). This was followed by cattails, with 30.3% mean coverage of emergents, and reeds, with 17.1% mean coverage of emergents. Rushes/bulrushes made up a minor percentage of emergent vegetation types in the North Zone with 2.3 mean coverage. Cattails were much more dominant in the South Zone, where they amounted to a mean of 52.5% of emergent vegetation cover in stations. Comparatively, grasses/sedges accounted for 21.8 of mean emergent coverage. Mean reed coverage among emergents in the South Zone was similar to that in the North Zone, with a mean of 18.4%. Rushes/bulrushes were slightly more dominant among emergents in the South Zone, amounting to 4.0% of emergent vegetation types.

2005 RPP Marsh Complex Bird and Amphibian Inventory Bird Studies Canada
13
Stratified Amphibian and Habitat Summaries
West to East Stratified Gradient
Species Richness and Maximum Calling Code South Trail West had the highest species richness, with 7 species recorded, versus 3 for each of Marsh Trail West and Marsh Trail East (Figure 19). Spring Peeper yielded a calling code of 3 in all three strata. American Toad yielded a calling code of 3 in South Trail West, but reached a maximum of calling code of only 2 in Marsh Trail East and was absent from Marsh Trail West. Gray Treefrog had a maximum calling code of 3 at South Trail West but was absent both east and west of Marsh Trail. Northern Leopard Frog was detected at a maximum calling code of 2 in both South Trail West and Marsh Trail East, but reached a maximum of only 1 at Marsh Trail West. Chorus Frog, Bullfrog and Wood Frog were present only at South Trail West; each was detected at a maximum calling code of only 1.
Major Habitat Components Unlike the habitat composition estimates as recorded at bird monitoring stations, which found very similar levels of emergent herbaceous vegetation west and east of Marsh Trail, habitat composition estimates recorded at amphibian monitoring stations yielded particularly higher emergent herbaceous vegetation coverage east of Marsh Trail than west of the trail (Figure 20). Specifically, mean emergent vegetation coverage’s within stations were 80.3% for Marsh Trail East, versus 40.8% for Marsh Trail West. Open water had the second highest mean station coverage, although shrubs accounted for much greater land cover west of Marsh Trail (18.8% station coverage) than east (4.1% station coverage). Trees made up 2.5% station coverage west of Marsh Trail, but were completely absent east of the trail at amphibian monitoring stations.
Dominant Emergent Herbaceous Vegetation Emergent herbaceous vegetation station coverage varied widely between Marsh Trail West and Marsh Trail East (Figure 21). Cattails and reeds accounted for almost all emergent vegetation west of Marsh Trail, as recorded at amphibian monitoring stations, with mean values of 63.6% and 34.1% of emergent coverage, respectively. However, east of Marsh Trail, reeds were clearly dominant, with a mean value of 71.3% coverage within emergents. Grasses/sedges were the second most dominant emergent vegetation type, with 8.8% of emergent coverage. Cattails accounted for only 7.5% of emergent vegetation east of Marsh Trail. Among other emergent vegetation types east of Marsh Trail, wild rice accounted for 3.8% of emergent habitat, and rushes/bulrushes accounted for 3.3% of emergents.

2005 RPP Marsh Complex Bird and Amphibian Inventory Bird Studies Canada
14
North to South Stratified Gradient
Species Richness and Maximum Calling Code Six species were present in both the North and South Zones, but Bullfrog was detected only in the North Zone, while Wood Frog was detected only in the South Zone (Figure 22). Each of these species reached a maximum calling code of 1 in their respective strata. Spring Peeper and American Toad were detected at a maximum calling code of 3 for both the North and South zones. Gray Treefrog reached a maximum calling code of 3 in the North Zone, but only 2 in the South Zone. Northern Leopard Frog was detected at a maximum calling code of 2 for both strata. Chorus Frog achieved a maximum calling code of 1 in both strata.
Major Habitat Components Emergent herbaceous vegetation was dominant in both the north and south zones, as recorded at amphibian monitoring stations, but was comparatively less abundant for both zones as compared to that recorded at bird monitoring stations (Figure 23). In the North Zone, emergent vegetation and open water were equally abundant, at 47% station coverage for each. Shrubs accounted for 6.0% mean station coverage. In the South Zone, emergent vegetation and shrubs were the two most abundant habitat types; at 71.7% and 41.9% mean station coverage, respectively. Open water accounted for much less of all recorded habitat types in the South Zone (11.4% mean station coverage), than the North Zone. This is in contrast with habitat descriptions derived from bird monitoring stations, which found a greater amount of open water in the South Zone that in the North Zone. Trees made up 2.0% of mean station coverage in the South Zone, whereas they were completely absent from amphibian monitoring stations in the North Zone.
Dominant Emergent Herbaceous Vegetation Reeds were recorded as the dominant emergent vegetation type for both the North and South Zone, with mean values of 48.0 and 56.9% of emergent coverage, respectively (Figure 24). This is in contrast with emergent vegetation descriptions derived from bird monitoring stations, which found grasses/sedges and cattails to be the dominant emergent vegetation types for the North and South zones, respectively. In the North Zone, cattails were the second most abundant emergent vegetation type at 34% emergent coverage. Rushes/bulrushes made up 4.8% of emergent vegetation, while wild rice amounted to 4.0% of emergents. In the South Zone, cattails were the second most abundant type of emergent vegetation, with a mean coverage of 33.5%. Grass/sedge emergent coverage was higher in the South Zone (6.5%) than in the North Zone, but wild rice (1.0%) and rushes/bulrushes (0.7%) coverage’s were lower in the South Zone than in the North Zone.
Amphibian Pitfall Survey Summaries Amphibian pitfall trap surveys resulted in a total species richness of three anurans (American Toad, Northern Leopard Frog, Wood Frog) and one salamander (Blue-spotted Salamander). Pitfall surveys done during September

2005 RPP Marsh Complex Bird and Amphibian Inventory Bird Studies Canada
15
yielded the highest number of amphibian species as well as the most individuals for this method (Table 7, Figure 25). Species occurrence and abundance were similar for July and August pitfall survey periods. Wood Frog and Northern Leopard Frog were most commonly captured by pitfall trap surveys; the latter species was encountered most commonly at Marsh Trail pitfall transects, while the former species was encountered only at the South Trail forested swamp pitfall transect. American Toad and Blue-spotted Salamander were also most often encountered at the South Trail pitfall trap transect. Overall, the South Trail pitfall trap transect captured almost three times more individuals than did the Marsh Trail pitfall trap transect (Table 7). For any given survey period, South Trail pitfall transects always yielded more individuals and at least as many or more species than did pitfall transects at Marsh Trail.
MMP and Pitfall Transect Comparative Summary For each of the two routes where these methods were compared, MMP surveys consistently yielded higher species richness and frequencies of occurrence than did pitfall trap transect surveys (Figure 26). Overall, only three (and the same three) anuran species were detected at either the Marsh Trail or South Trail pitfall transects, whereas up to seven (at South Trail) species were detected by MMP surveys at routes corresponding to the same locations where pitfall trap transects were surveyed. Pitfall traps did yield one amphibian species (Blue-spotted Salamander) that is not detectable by MMP surveys, adding that species to the assemblage of known amphibians occupying the marsh complex and surrounding wooded habitats.
Amphibian Visual Transect Summary Table 8 presents results of the visual search transect surveys done at the RPP marsh habitat complex. Transect 6 yielded the highest number of individuals (6 Northern Leopard Frogs) observed. Four individuals were detected on Transect 3, all being Northern Leopard Frog as well. Two individuals each were recorded at Transects 4 and 5; one of the individuals recorded at Transect 4 was a snake species (Little Brown Snake). The single individual recorded at Transect 1 was also a Little Brown Snake. There were no individuals recorded at Transect 2. In all, of the 13 amphibian individuals recorded during the visual transect surveys, 12 were Northern Leopard Frog. No salamanders were recorded during visual transect surveys.
Relative Status of RPP Wetland Biological Integrity as a Function of Bird and Anuran Community Metric Response to Disturbance Previous investigations done by Bird Studies Canada to develop Indices of Biotic Integrity (IBI) have utilized marsh dependent bird and anuran community attribute responses to relative measures of landscape level disturbances to ascertain the condition of certain coastal marsh complexes relative to others across the Great Lakes basin. Figures 27 to 29 were derived from Crewe and Timmermans (2005) and indicate that the Rondeau Provincial Park wetland complex has varied from

2005 RPP Marsh Complex Bird and Amphibian Inventory Bird Studies Canada
16
‘fair’ to ‘good’ condition as a function of MMP bird and anuran data derived from temporal periods spanning high and low Great Lakes water level regimes. The selected bird and anuran metrics used to rank RPP wetland status were done though examinations of community attribute responses to surrounding land cover disturbances at various spatial scales (Table 9). Figure 27 represents wetland bird community based relative biological integrity of RPP wetlands during above average Great Lakes water levels as a function of metric responses to disturbance at both the scale of 500 m and 1000 m buffer of surrounding main lands. Figure 28 shows this for anuran community based IBIs of RPP during above average water levels at 500m, 1000m and 20 km mainland buffer scales. Figure 29 shows this for anuran community based IBIs of RPP during below average water levels at only the 1000m mainland buffer scales. These results show promise for the ability to use MMP survey data to measure the relative biological integrity of marsh complexes such as RPP, however further work is required to refine these IBIs and standardize their use across all hydrologic regimes, at the same spatial buffer scales, and within more restricted biomes (e.g., within only Lake Erie coastal wetlands).
Discussion Survey efforts to inventory bird and amphibian species richness and relative abundance at RPP during 2005 were completed by both volunteer MMP participants and BSC staff. Collectively, these efforts resulted in our ability to sample most of the representative habitats that occur within and adjacent to the marsh complex.
Bird Species Assemblage and Relative Abundance Bird surveys resulted in a diverse assemblage of species occupying various habitats represented across the dune and swale marsh complex. Noteworthy species that were detected include Black Tern, Forster’s Tern, Least Bittern, Sedge Wren, Common Snipe and Pied-billed Grebe. King Rail, American Woodcock and Prothonotary Warbler were observed during survey work, but not detected at standard MMP survey stations. King Rail was heard calling west of Marsh Trail and recorded once at N 42° 16’ 24.0” W 081° 52’ 44.7”. Prothonotary Warbler was observed during initial route setup at South Trail, and American Woodcock was observed during MMP surveys of Ridge Trail. Great Blue Heron was also a commonly observed species but not detected within MMP survey stations. During MMP surveys, Black Tern was noted to be breeding somewhere within the RPP marsh complex but not identified by MMP surveyors. Fortunately, principal investigators of this project (J. Gilbert and G. Dunn) located the approximate location of the Black Tern breeding colony (N 42° 16’ 31.9”, W 81° 52’ 27.0”) within floating wild rice mats west of marsh dyke exposed to the open embayment.

2005 RPP Marsh Complex Bird and Amphibian Inventory Bird Studies Canada
17
Spatial Patterns of Bird Species Richness and Densities in Relation to Habitat Composition Some interesting patterns of bird species occurrence and relative abundance were observed across both the west to east and north to south gradients of the RPP dune and swale marsh complex. Many of these patterns varied in concert with variability in marsh habitats recorded at these MMP survey stations. For example, Virginia Rail, Sora, Common Yellowthroat and Swamp Sparrow were more abundant in stations occurring east of Marsh Trail, where habitats were less exposed to open lake processes, where grasses and sedges were more predominant, and where cattail was less predominant. Pied-billed Grebe was detected only east of Marsh Trail, and American Bittern was most abundant at the two most interior routes of the marsh complex. Overall, abundance of focal marsh bird species was lower west of Marsh Trail in habitats exposed to scouring processes of the open embayment, which we attribute to higher monotypicity of cattail and overall lower heterogeneity of marsh habitats in these areas. Also, greater exposure to scouring by wave and wind action at the west portion of the marsh gradient limits development of certain plant communities such as grasses and sedges, and other woody plants. East of Marsh Trail, where there is greater protection from these processes, mosaics of higher diversity plant species and open water provide more microhabitats for various bird species.
Along the north to south gradient, similar shifts in habitat and bird species composition occurred. In the north zone, where there was a higher amount of grasses and sedges, less dominant cattail, and shallower and less open water, species such as Sora, Virginia Rail, Common Yellowthroat, Swamp Sparrow, and Sedge Wren were more abundant. These species prefer grass/sedge meadow habitats which characterize northern reaches of the RPP wetland complex. In southern zones, water depth is greater, open water patches are larger, and cattail is more dominant. Here, species such as Pied-billed Grebe, Marsh Wren, American Bittern and Black Tern were more common, and all of these species are known to be associated strongly with either cattail (e.g. Marsh Wren, American Bittern) or higher proportions of open water (e.g., Black Tern, Pied-billed Grebe) (Timmermans and McCracken 2004).
Amphibian Species Assemblage and Calling Intensities Eight anuran species were detected during MMP surveys at the RPP marsh complex and adjacent swamp. Fowler’s toad was not detected during MMP anuran surveys, but was detected during the first MMP bird survey visit, and specifically on the south beach barrier feature. Most species were detected during the second MMP survey visits, coinciding with the height of most species’ breeding seasons. Comparatively fewer anuran species were detected during the first and third MMP surveys. American Toad and Spring Peeper were the most commonly recorded anuran species, with full choruses of both species recorded during both the first and second MMP survey visits. This result highlights the ubiquitous nature of these species within the RPP marsh complex. Conversely, Wood Frog, Chorus Frog, Green Frog and Bullfrog were the least frequently

2005 RPP Marsh Complex Bird and Amphibian Inventory Bird Studies Canada
18
detected species. The infrequent detection of Wood Frog is likely explained by the fact that the timing of the first MMP survey visit missed the peak Wood Frog breeding period, which is known to be particularly short in duration. The infrequent detection of Chorus Frog in the RPP marsh complex underscores the fact that studies have shown a general decline in this species.
Spatial Patterns of Anuran Species Richness and Calling Intensity in Relation to Habitat Composition Distinct patterns in amphibian occurrence and relative abundance were found to occur across the west to east gradient of the RPP dune and swale marsh complex. Species richness, and relative abundance of most detected species, increased across the west to east gradient. Certain factors relating to the habitat characteristic differences across this gradient may explain our amphibian species richness and calling intensity observations. First, there is an increase in the heterogeneity of marsh habitats across the west to east gradients. The marsh habitat west of Marsh Trail, adjacent to the open embayment, is characterized as being primarily monotypic in vegetation composition. By contrast, the eastern region, comprising the interface between buttonbush marsh and deciduous hardwood swamp, provides a greater heterogeneity of habitats. For example, this region, west of South Trail, is characterized as having a greater amount of tree and shrub coverage than does areas immediately west or east of Marsh Trail. Second, the erosive effects of wind and wave action on marsh habitat west of Marsh Trail, due to proximity to the open embayment, are not suitable for significant amphibian presence. Areas east, and farther inland, are more protected from these effects, thereby providing more appropriate conditions for amphibian habitat. Third, water depths generally range from their highest levels at the west end of the marsh habitat complex, adjacent to Rondeau Bay, to their lowest levels at the east end of the complex. Fish, which are major predators of amphibians, are less likely to access shallow waters farther inland. Therefore, lower levels of fish predatory pressure in the eastern region of the marsh complex may afford more protection and hence proliferation of amphibian species richness and abundance. There were no notable differences in amphibian species assemblages across the north to south gradient in the RPP marsh complex. This is likely because of the relatively similar levels of heterogeneity of open water and emergent vegetation along Marsh Trail, in both the north and south strata. Similarly, levels of habitat heterogeneity were comparable along the west side of South Trail, in both the north and south strata. In general, the west to east dune and swale complex, grading from deeper and more exposed marsh to shallower, more diversified and wooded eastern regions favours higher diversity of amphibians at the RPP marsh complex and adjacent swamp habitats.

2005 RPP Marsh Complex Bird and Amphibian Inventory Bird Studies Canada
19
Pitfall Trap Transect Amphibian Surveys Amphibian species richness and abundance collected in pitfall traps varied temporally, and to a lesser extent, between transects. Wood Frog was found exclusively within the South Trail transect. This reflects its habitat preferences for shallow, vernal pools, as found in deciduous swamps. Northern Leopard Frog was only recorded within the Marsh Trail transect until September, when it was recorded within the South Trail transect. In addition, the number of Northern Leopard Frog individuals collected at the South Trail transect exceeded the number of individuals of this species collected at the Marsh Trail transect in September. This trend indicates that Northern Leopard Frog may have begun migration into wooded habitats from its primary emergent marsh habitat during September. Between survey periods, the September survey yielded the greatest number of collected individuals for both pitfall trap transects. However, collection totals were particularly high at the South Trail transect in September, with the presence of Northern Leopard Frog, and the increased collection numbers for Wood Frog and Blue-spotted Salamander. This highlights the increase in amphibian activity within the deciduous hardwood swamp and adjacent buttonbush marsh in September, especially for Northern Leopard Frog, Wood Frog and Blue-spotted Salamander. Between transects, the number of individuals collected was highest at the South Trail transect for all three months. This reflects the generally greater amphibian abundance found west of South Trail, as opposed to the area east of Marsh Trail. For each collected species, overall collection totals were highest for South Trail, except for Northern Leopard Frog, which was most commonly found in emergent marsh habitat. Spring Peeper, Green Frog and American Toad, which are known to inhabit the region west of South Trail through MMP surveys, were either completely absent, or were caught in low numbers, in pitfall traps in this region despite its relatively higher amphibian species richness and abundance.
MMP and Pitfall Transect Methods Comparison In general, a greater number of individuals were detected through aural MMP surveys than by pitfall trapping at both Marsh Trail and South Trail. This was especially evident at South Trail, where seven species were detected through MMP surveys, compared to four species collected in pitfall traps. Certain species were more likely to be detected by one or the other method. At both Marsh Trail and South Trail, American Toad was more likely to be detected by MMP surveys than by pitfall trapping. Spring Peeper, Bullfrog, Chorus Frog and Gray Treefrog, which were detected by MMP surveys, were completely absent from pitfall traps at both Marsh Trail and South Trail. This occurred despite the fact that Spring Peeper was detected at calling code 3 for both regions up until the second MMP survey visit. However, as pitfall trapping occurred later in the summer, the apparent lack of effectiveness of pitfall traps to collect Spring Peeper could be due to the relative absence of this species from the South Trail West region at the time of pitfall trapping.

2005 RPP Marsh Complex Bird and Amphibian Inventory Bird Studies Canada
20
In comparison, Wood Frog was more likely detected through the pitfall trap method. Blue-spotted Salamander, which does not call like anurans, was detected only through the pitfall trap method. The only species detected at similar levels between both methods was Northern Leopard Frog. This was true for both Marsh Trail and South Trail, where differences frequencies of occurrence between methods was only 1.25 and 1.00, respectively. When used collectively, these methods have the potential to detect a greater number of amphibian species than an individual method would alone. However, this scenario might not always be feasible. Between methods, the aural MMP surveys detected the greatest number of species, where almost twice as many species were recorded through the MMP surveys as through pitfall trap collections. It should be noted however, that pitfall trap collection results may have been higher if pitfall survey periods were conducted in early spring, coinciding with a more active breeding period for amphibians. Additionally, the use of drift fencing could potentially have increased the number of individuals collected in pitfall traps. Future studies involving the use of pitfall traps should begin monitoring activities in early spring, and potentially employ the use of drift fencing, to obtain a more accurate representation of amphibian occurrence and relative abundance.
Visual Transect Amphibian Survey Visual amphibian transect surveys did not gain any significant additional species inventory information not already gained through the MMP and pitfall trap surveys. Northern Leopard Frog was almost exclusively (92%) the only species encountered during visual transects, and was seen most frequently in transects done further south than ones done further north in the marsh complex. This is likely a result of much higher grass/sedge, cattail, and tree/shrub cover and density than areas further south with more standing water. Had visual surveys been done more intensively and repeatedly throughout the entire marsh complex during the entire survey season, this technique would most certainly have yielded considerably more observations. However, staff time costs may render this technique less feasible than MMP surveys, which adequately detect all or most anurans that occur in an area throughout the breeding season. Visual surveys also have the added advantage of detecting salamanders, but must be done during late winter/early spring which is the most likely time to encounter them in marsh habitats.
Project Costs Costs to complete all of the activities presented and reported on in this report were similar to those initially forecasted in the project budget. Actual material costs were slightly lower than budgeted, and staff time and travel costs were somewhat higher than budgeted. Overall, total project costs were $1,589.54 higher than total budgeted costs, and these additional expenses were provided in-kind by BSC to meet the project objectives and deliverables.

2005 RPP Marsh Complex Bird and Amphibian Inventory Bird Studies Canada
21
Summary of Conclusions The wetland complex at Rondeau Provincial Park is very unique in its physical structure and hydrological processes. It also is bordered by a significant amount of pristine buttonbush and deciduous hardwood swamp. Collectively, this provides considerable habitat complexity and connectivity, which is reflected in the diverse bird and amphibian community assemblages. For amphibians, these adjoined habitats provide ideal habitats to support all stages of their life cycle and minimizes influence of disturbances that affect so many other wetland habitats. The undulating dune and swale complex forms a somewhat linear mosaic of emergent and submergent aquatic zones, and the slight depth gradient that occurs along the north-south axes of these dunes and swales adds further habitat diversity such that bi-directional factors act to structure the marsh habitat communities and their dependent bird and amphibian communities. Fowler’s Toads, although detected incidentally during bird surveys at the south beach, were not a species targeted by this inventory, because independent and intensive surveys are being conducted for this species by RPP staff. In a broader context, the RPP wetland complex is considered to be in relatively ‘good’ condition in its resilience to broader landscape level disturbances, which was borne out by previous IBI work by BSC (Crewe and Timmermans 2005). However, further work is needed to ascertain more specifically how RPP wetland biotic integrity compares to Lake Erie only coastal marsh habitats. Rondeau PP is bordered by northern mainland that is largely under the influence of agricultural cash crop activities, and much of the natural forest and wetland areas have been altered for agricultural activities. For the time being, it appears that, based on our observations of bird and amphibian communities, the RPP wetland complex is functioning to sustain a healthy wetland environment. However, low presence and abundance of certain species, such as Bullfrog and Chorus Frog may be cause for concern. Conversely, presences of rare and sensitive species such as King Rail, Least Bittern, Pied-billed Grebe, and Black Tern may indicate otherwise. Lastly, it is important that at least a certain portion of the inner (east of Marsh Trail) marsh complex remains open to natural lake hydrologic regimes, because annually and seasonally changing water depths within the marsh help maintain habitat diversity and robustness for dependent bird and amphibian species, and reduce further encroachment of exotics such as Phragmites australis.
Literature Cited Conway, C.J. 1995. Virginia Rail (Rallus limicola). In The Birds of North
America. No. 173 (A. Poole and F. Gill, eds.). The Academy of Natural Sciences, Philadelphia, and the American Ornithologists’ Union, Washington D.C.

2005 RPP Marsh Complex Bird and Amphibian Inventory Bird Studies Canada
22
Crewe, T.L. and S.T.A. Timmermans. 2005. Assessing biological integrity of Great Lakes coastal wetlands using bird and amphibian communities. Technical report to Great Lakes Commission for project # Wetland3-EPA-01. 88pp.
Dobbyn, S. and L. Pasma. 2005. In prep. A life sciences inventory and evaluation of Rondeau Provincial Park. Draft March 2005. Ontario Parks, Ontario Ministry of Natural Resources.
Gibbs, J.P., Reid, F.A. and S.M. Melvin. 1992. Least Bittern (Ixobrychus exilis). In The Birds of North America. No. 17 (A. Poole and F. Gill, eds.). The Academy of Natural Sciences, Philadelphia, and the American Ornithologists’ Union, Washington D.C.
Heyer, W.R., Donnelly, M.A., McDiarmid, R.W., Hayek, L.C., and M.S. Foster.
1994. Measuring and Monitoring Biological Diversity: Standard Methods for Amphibians. Smithsonian Institution Press. Washington D.C. 364 pp.
Melvin, S.M., and J.P. Gibbs. 1996. Sora (Porzana carolina). In The Birds of
North America. No. 250 (A. Poole and F. Gill, eds.). The Academy of Natural Sciences, Philadelphia, and the American Ornithologists’ Union, Washington D.C.
Stebbins, R. C. and N.W. Cohen. 1995. A natural history of amphibians.
Princeton University Press, Princeton, New Jersey. 316 pp. Timmermans, S.T.A. and J. McCracken. 2004. Marsh Havens: improving marsh
habitat for birds in the Great Lakes basin. Published by Bird Studies Canada. 16pp.
2005 RPP Marsh Complex Bird and Amphibian Inventory Bird Studies Canada
23
Figures and Tables Figure 1. MMP bird monitoring station locations for routes ON026, ON027 and ON028, located on or adjacent to the Marsh Trail.
2005 RPP Marsh Complex Bird and Amphibian Inventory Bird Studies Canada
24
Figure 2. MMP bird monitoring station locations for routes ON622 and ON642, located on the Marsh Trail.
2005 RPP Marsh Complex Bird and Amphibian Inventory Bird Studies Canada
25
Figure 3. MMP bird monitoring stations located on the Ridge Trail.

2005 RPP Marsh Complex Bird and Amphibian Inventory Bird Studies Canada
26
Figure 4. MMP amphibian monitoring locations, located on the Marsh Trail and the South Trail, within RPP.
2005 RPP Marsh Complex Bird and Amphibian Inventory Bird Studies Canada
27
Figure 5. MMP amphibian monitoring stations for Route ON029, located on the west shore of Rondeau Bay.

2005 RPP Marsh Complex Bird and Amphibian Inventory Bird Studies Canada
28
Figure 6. Pitfall trap transect locations. Each transect contains 6 traps placed 15 m apart along a north-south axis. The locations of each transect’s Trap 1 are shown.

2005 RPP Marsh Complex Bird and Amphibian Inventory Bird Studies Canada
29
Figure 7. Visual search transect locations. Transect start and stop locations are shown, with the transect path shown in red.

2005 RPP Marsh Complex Bird and Amphibian Inventory Bird Studies Canada
30
Table 1. Bird species occurrence for first and second visits among MMP bird monitoring stations at RPP.
Species SpeciesVisit 1 Visit 2 Visit 1 Visit 2
AMBI LEBI -AMGO - MALLAMRO - MAWRAMWI - NOCA -BANS NOFL -BAOR NRWS -BARS PBGR -BBCU - PUMABLJA - RBGU -BLTE REVI -BOGU - RWBLBRTH SEWRCOSN - SORACOTE - SOSPCOYE SWSPEAKI TRESFOTE - VIRAGBHE WIFLGRCA WODUINBU - YWAR
Occurrence Occurrence

2005 RPP Marsh Complex Bird and Amphibian Inventory Bird Studies Canada
31
Table 2. Maximum number of each bird species recorded at each MMP monitoring station.
Route Station Species Max No. Route Station Species Max No. Route Station Species Max No.
ON026 A AMBI 1 ON026 F RWBL 5 ON027 E RWBL 6ON026 A FOTE 2 ON026 F SWSP 3 ON027 E SWSP 1ON026 A RWBL 9 ON026 F TRES 1 ON027 E TRES 2ON026 A TRES 3 ON026 F YWAR 4 ON027 E YWAR 2ON026 A YWAR 2 ON026 G EAKI 1 ON027 F MAWR 1ON026 B BLTE 1 ON026 G PUMA 1 ON027 F PUMA 1ON026 B COYE 3 ON026 G RWBL 6 ON027 F RWBL 3ON026 B RWBL 6 ON026 G SORA 1 ON027 F SWSP 2ON026 B SOSP 2 ON026 G SOSP 1 ON027 F TRES 2ON026 B VIRA 1 ON026 G SWSP 2 ON027 F YWAR 2ON026 B WIFL 1 ON026 G TRES 2 ON027 G MAWR 2ON026 B YWAR 1 ON026 G YWAR 2 ON027 G PUMA 9ON026 C COYE 1 ON027 A COYE 1 ON027 G RWBL 7ON026 C EAKI 1 ON027 A PUMA 2 ON027 G SWSP 2ON026 C MAWR 1 ON027 A RWBL 5 ON027 G TRES 1ON026 C RWBL 6 ON027 A SORA 1 ON027 G YWAR 3ON026 C SOSP 1 ON027 A SOSP 3 ON028 A COYE 1ON026 C SWSP 1 ON027 A TRES 3 ON028 A MAWR 2ON026 C TRES 2 ON027 A VIRA 1 ON028 A RWBL 6ON026 D AMWI 3 ON027 A YWAR 4 ON028 A SWSP 1ON026 D BANS 1 ON027 B AMRO 1 ON028 A YWAR 1ON026 D BLTE 3 ON027 B BANS 1 ON028 B AMBI 2ON026 D COYE 7 ON027 B COYE 2 ON028 B BLTE 1ON026 D FOTE 2 ON027 B NOCA 1 ON028 B MALL 1ON026 D MAWR 1 ON027 B RWBL 5 ON028 B MAWR 1ON026 D RWBL 6 ON027 B SORA 1 ON028 B RWBL 7ON026 D SORA 1 ON027 B SOSP 1 ON028 B SOSP 1ON026 D SOSP 2 ON027 B TRES 2 ON028 B TRES 2ON026 D SWSP 3 ON027 B WIFL 4 ON028 C AMRO 1ON026 D TRES 3 ON027 B YWAR 8 ON028 C BLTE 2ON026 D VIRA 2 ON027 C GRCA 1 ON028 C COYE 1ON026 D YWAR 1 ON027 C NOFL 1 ON028 C FOTE 1ON026 E BRTH 1 ON027 C PUMA 3 ON028 C MAWR 2ON026 E COYE 3 ON027 C RWBL 6 ON028 C RWBL 8ON026 E EAKI 1 ON027 C WIFL 2 ON028 C SOSP 2ON026 E FOTE 2 ON027 C YWAR 5 ON028 C SWSP 2ON026 E MALL 2 ON027 D COYE 1 ON028 C YWAR 2ON026 E RWBL 6 ON027 D LEBI 1 ON028 D COYE 1ON026 E SORA 1 ON027 D PUMA 5 ON028 D LEBI 1ON026 E SOSP 2 ON027 D RWBL 2 ON028 D MAWR 1ON026 E SWSP 2 ON027 D SOSP 2 ON028 D RWBL 8ON026 E TRES 3 ON027 D TRES 3 ON028 D SOSP 1ON026 E VIRA 2 ON027 D WIFL 1 ON028 D SWSP 1ON026 E WIFL 1 ON027 D YWAR 1 ON028 D TRES 1ON026 E YWAR 6 ON027 E COYE 3 ON028 D YWAR 3ON026 F BLJA 1 ON027 E EAKI 2 ON028 E RWBL 6ON026 F BRTH 1 ON027 E LEBI 1 ON028 E SOSP 2ON026 F EAKI 1 ON027 E MAWR 3 ON028 E SWSP 2ON026 F PUMA 3 ON027 E PUMA 11 ON028 E TRES 1

2005 RPP Marsh Complex Bird and Amphibian Inventory Bird Studies Canada
32
…Table 2 continued
Route Station Species Max No. Route Station Species Max No. Route Station Species Max No.
ON028 E YWAR 1 ON622 D TRES 1 ON640 A MAWR 4ON028 F BANS 4 ON622 D VIRA 1 ON640 A RWBL 6ON028 F COYE 2 ON622 D YWAR 3 ON640 A SOSP 3ON028 F MAWR 2 ON622 E COYE 4 ON640 A SWSP 3ON028 F PUMA 1 ON622 E MAWR 3 ON640 A TRES 1ON028 F RWBL 7 ON622 E RWBL 5 ON640 A YWAR 1ON028 F SEWR 1 ON622 E SEWR 1 ON640 B BARS 1ON028 F SOSP 2 ON622 E SOSP 2 ON640 B COYE 2ON028 F TRES 3 ON622 E YWAR 1 ON640 B LEBI 1ON028 F YWAR 4 ON622 F AMBI 1 ON640 B MAWR 5ON028 G AMBI 1 ON622 F COYE 3 ON640 B RWBL 6ON028 G BANS 2 ON622 F MAWR 3 ON640 B SWSP 2ON028 G COYE 1 ON622 F RWBL 5 ON640 B VIRA 1ON028 G MAWR 2 ON622 F SEWR 1 ON640 B YWAR 1ON028 G RWBL 9 ON622 F SOSP 1 ON640 C BARS 3ON028 G SOSP 2 ON622 F SWSP 2 ON640 C BLTE 1ON028 G TRES 1 ON622 F TRES 5 ON640 C COYE 2ON028 G YWAR 1 ON622 F VIRA 2 ON640 C MAWR 3ON622 A AMBI 1 ON622 F YWAR 3 ON640 C PBGR 1ON622 A COYE 2 ON622 G AMBI 1 ON640 C RWBL 3ON622 A MAWR 5 ON622 G COYE 3 ON640 C SWSP 2ON622 A RWBL 7 ON622 G MAWR 2 ON640 C TRES 2ON622 A SOSP 1 ON622 G PUMA 1 ON640 C YWAR 1ON622 A SWSP 1 ON622 G RWBL 7 ON640 D BANS 2ON622 A TRES 1 ON622 G SEWR 1 ON640 D BLTE 2ON622 A YWAR 1 ON622 G SOSP 2 ON640 D COYE 4ON622 B AMBI 1 ON622 G SWSP 3 ON640 D EAKI 1ON622 B COYE 3 ON622 G TRES 4 ON640 D MAWR 1ON622 B MAWR 3 ON622 G VIRA 1 ON640 D NRWS 3ON622 B RWBL 4 ON622 G YWAR 2 ON640 D RWBL 7ON622 B SOSP 2 ON622 H COYE 3 ON640 D SOSP 1ON622 B SWSP 3 ON622 H MAWR 2 ON640 D SWSP 3ON622 B TRES 1 ON622 H RWBL 7 ON640 D TRES 2ON622 B YWAR 3 ON622 H SEWR 2 ON640 D YWAR 2ON622 C COYE 3 ON622 H SOSP 2 ON640 E AMBI 1ON622 C MAWR 4 ON622 H SWSP 3 ON640 E COYE 4ON622 C NOCA 1 ON622 H TRES 3 ON640 E MAWR 2ON622 C RWBL 5 ON622 H YWAR 3 ON640 E RWBL 4ON622 C SEWR 1 ON622 I AMBI 1 ON640 E SEWR 1ON622 C SWSP 1 ON622 I COYE 3 ON640 E SOSP 4ON622 C TRES 1 ON622 I MAWR 2 ON640 E SWSP 2ON622 C YWAR 2 ON622 I RWBL 3 ON640 E TRES 2ON622 D BLTE 1 ON622 I SEWR 1 ON640 F BARS 5ON622 D COYE 4 ON622 I SOSP 1 ON640 F COYE 2ON622 D MAWR 3 ON622 I SWSP 2 ON640 F EAKI 1ON622 D PBGR 1 ON622 I TRES 11 ON640 F MAWR 3ON622 D RWBL 4 ON622 I YWAR 2 ON640 F RWBL 5ON622 D SOSP 1 ON640 A AMBI 1 ON640 F SOSP 1ON622 D SWSP 2 ON640 A COYE 1 ON640 F SWSP 1

2005 RPP Marsh Complex Bird and Amphibian Inventory Bird Studies Canada
33
…Table 2 continued
Route Station Species Max No. Route Station Species Max No.
ON640 F TRES 99 ON641 F YWAR 3ON640 F VIRA 1 ON642 A COYE 5ON640 F YWAR 1 ON642 A MAWR 3ON641 A COYE 3 ON642 A RWBL 4ON641 A MAWR 2 ON642 A SWSP 2ON641 A NRWS 2 ON642 A TRES 2ON641 A RWBL 2 ON642 A VIRA 1ON641 A SEWR 2 ON642 A YWAR 1ON641 A SOSP 1 ON642 B COYE 4ON641 A SWSP 3 ON642 B MAWR 2ON641 A TRES 6 ON642 B RWBL 5ON641 A VIRA 2 ON642 B SWSP 1ON641 A YWAR 2 ON642 B TRES 3ON641 B COYE 4 ON642 B YWAR 2ON641 B EAKI 1 ON642 C COYE 4ON641 B RWBL 5 ON642 C RWBL 4ON641 B SEWR 3 ON642 C SEWR 1ON641 B SORA 1 ON642 C WIFL 2ON641 B SWSP 4 ON642 C YWAR 3ON641 B TRES 2 ON642 D COYE 2ON641 B VIRA 2 ON642 D LEBI 1ON641 C BARS 1 ON642 D MAWR 1ON641 C COYE 5 ON642 D REVI 1ON641 C RWBL 4 ON642 D RWBL 5ON641 C SWSP 2 ON642 D SEWR 1ON641 C TRES 2 ON642 D YWAR 2ON641 C YWAR 1 ON642 E BAOR 2ON641 D BARS 1 ON642 E COYE 1ON641 D COYE 5 ON642 E RWBL 5ON641 D MAWR 2 ON642 E SEWR 2ON641 D RWBL 4 ON642 E SOSP 2ON641 D SEWR 1 ON642 E SWSP 2ON641 D SWSP 3 ON642 E TRES 2ON641 D TRES 4 ON642 E WIFL 2ON641 D YWAR 2 ON642 E YWAR 2ON641 E COSN 3ON641 E COYE 4ON641 E RWBL 2ON641 E VIRA 1ON641 E YWAR 4ON641 F AMBI 1ON641 F BARS 1ON641 F COYE 4ON641 F MAWR 1ON641 F NRWS 1ON641 F RWBL 8ON641 F SEWR 2ON641 F SWSP 4ON641 F TRES 1
2005 RPP Marsh Complex Bird and Amphibian Inventory Bird Studies Canada
34
Figure 8. Maximum number of individuals per 10 stations for all bird species detected at MMP bird monitoring stations at RPP. Figure 9. Maximum number of individuals per 10 stations for all bird species detected during first and second visits at MMP bird monitoring stations at RPP.
40.4
23.621.5
15.715.5
10.27.9
4.5 3.82.8 2.6 2.6 2.3 2.1 1.9 1.5 1.3 1.3 1.1 0.6 0.6 0.6 0.4 0.4 0.4 0.4 0.4 0.2 0.2 0.2 0.2
54.3
0
10
20
30
40
50
60
RWBLTRES
COYEYWAR
MAWRSWSP
SOSPPUMA
SEWRVIR
AWIFL
AMBI
BARSBLTE
BANSEAKI
FOTENRWS
SORALEBI
AMWI
COSNMALL
AMROBAOR
BRTHNOCA
PBGRBLJA
GRCANOFL
REVI
Bird
Abu
ndan
ce /
10 S
tatio
ns
0
10
20
30
40
50
60
RWBL
COYE
YWAR
TRES
MAWR
SWSP
PUMASOSP
SEWR
AMBIW
IFLBARS
BLTE
EAKIVIR
AFOTE
SORABANS
AMWI
COSNBAOR
MALL
AMRONOCA
BRTHBLJ
AGRCA
NOFLREVI
NRWS
LEBI
PBGR
Bird
Abu
ndan
ce /
10 S
tatio
ns
First Survey VisitSecond Survey Visit

2005 RPP Marsh Complex Bird and Amphibian Inventory Bird Studies Canada
35
Table 3. Amphibian species occurrence for each of the three MMP survey visits among stations monitored at RPP. Table 4. Maximum calling code for each amphibian species found at each MMP monitoring station.
Species Route Station Maximum Species Route Station Maximum Species Route Station MaximumCalling Code Calling Code Calling
AMTO ON149 A 1 GRFR ON029 E 1 NLFR ON623 F 1AMTO ON149 B 1 GRFR ON029 F 1 NLFR ON623 G 2AMTO ON149 C 1 GRTR ON227 G 1 NLFR ON623 H 2AMTO ON149 E 2 GRTR ON623 C 2 NLFR ON623 I 2AMTO ON149 F 1 GRTR ON623 D 2 NLFR ON623 J 2AMTO ON623 A 2 GRTR ON623 E 2 SPPE ON149 A 3AMTO ON623 B 2 GRTR ON623 F 1 SPPE ON149 B 3AMTO ON623 C 3 GRTR ON623 G 2 SPPE ON149 C 3AMTO ON623 D 3 GRTR ON623 H 2 SPPE ON149 D 3AMTO ON623 E 3 GRTR ON623 J 3 SPPE ON149 E 3AMTO ON623 F 3 NLFR ON029 A 1 SPPE ON149 F 3AMTO ON623 G 3 NLFR ON029 B 1 SPPE ON149 G 3AMTO ON623 H 3 NLFR ON029 C 1 SPPE ON149 H 3AMTO ON623 I 3 NLFR ON029 D 2 SPPE ON227 A 2AMTO ON623 J 2 NLFR ON029 E 3 SPPE ON227 B 1BULL ON029 A 1 NLFR ON029 F 3 SPPE ON227 C 2BULL ON029 B 3 NLFR ON149 A 2 SPPE ON227 G 3BULL ON029 C 1 NLFR ON149 B 2 SPPE ON227 H 1BULL ON029 D 2 NLFR ON149 C 2 SPPE ON227 J 3BULL ON029 E 3 NLFR ON149 D 2 SPPE ON623 A 3BULL ON029 F 1 NLFR ON149 E 2 SPPE ON623 B 3BULL ON227 F 1 NLFR ON149 F 2 SPPE ON623 C 3BULL ON227 G 1 NLFR ON149 G 1 SPPE ON623 D 3BULL ON623 I 1 NLFR ON227 F 1 SPPE ON623 E 3CHFR ON623 A 1 NLFR ON227 G 1 SPPE ON623 F 3CHFR ON623 F 1 NLFR ON227 H 1 SPPE ON623 G 3CHFR ON623 G 1 NLFR ON227 I 1 SPPE ON623 H 3GRFR ON029 A 3 NLFR ON227 J 1 SPPE ON623 I 3GRFR ON029 B 3 NLFR ON623 C 2 SPPE ON623 J 3GRFR ON029 C 2 NLFR ON623 D 2 WOFR ON623 C 1GRFR ON029 D 1 NLFR ON623 E 2
Species OccurrenceVisit 1 Visit 2 Visit 3
AMTO -BULL -CHFR - -GRFR -GRTR - -NLFRSPPE -WOFR - -
2005 RPP Marsh Complex Bird and Amphibian Inventory Bird Studies Canada
36
Figure 10. Maximum calling code for each amphibian species detected at each visit among MMP amphibian monitoring stations at RPP. Figure 11. Maximum abundance per 10 stations among the five most commonly recorded bird species at RPP, across a west to east gradient within the RPP marsh complex.
Visit 1
Visit 2
Visit 3AMTOBULLCHFRGRFRGRTRNLFRSPPEWOFR
0
1
2
3
Cal
ling
Cod
e
COYE
MAWR
RWBL
SWSP
YWAR
COYE
MAWR
RWBL
SWSP
YWAR
COYE
MAWR
RWBL
SWSP
YWAR
COYE
MAWR
RWBL
SWSP
YWAR
0
20
40
60
80
100
120
140
160
Max
imum
Abu
ndan
ce p
er 1
0 St
atio
ns
Marsh Trail W. Marsh Trail E. Ridge Trail W. Ridge Trail E.

2005 RPP Marsh Complex Bird and Amphibian Inventory Bird Studies Canada
37
Figure 12. Maximum abundance per 10 stations among focal marsh bird species across a west to east gradient within the RPP marsh complex. Figure 13. Habitat type composition at MMP bird monitoring stations across a west to east gradient within the RPP marsh complex.
Emergent
Open Water
Shrubs
Emergent
Open Water
TreesShrubs
Emergent
Open WaterShrubs
Emergent
Open WaterTrees
Shrubs
0
10
20
30
40
50
60
70
80
90
100
Hab
itat C
ompo
sitio
n (%
)
Marsh Trail W. Marsh Trail E. Ridge Trail W. Ridge Trail E.
AMBI
BLTE
LEBI
SORA
VIRA
AMBI
BLTE
PBGR
SORA
VIRA
AMBI
SORA
VIRA
AMBI
BLTE
LEBI
PBGR
SORA
VIRA
0
2
4
6
8
10
12
14
16
Max
imum
Abu
ndan
ce p
er 1
0 St
atio
ns
Marsh Trail W. Marsh Trail E. Ridge Trail W. Ridge Trail E.

2005 RPP Marsh Complex Bird and Amphibian Inventory Bird Studies Canada
38
Figure 14. Emergent vegetation composition at MMP bird monitoring stations across a west to east gradient within the RPP marsh complex. Figure 15. Maximum abundance per 10 stations among the five most commonly recorded bird species at RPP, across a north to south gradient within the RPP marsh complex.
Grasses
Cattails
Reeds
Other
Grasses
Rushes
Cattails
ReedsOther
Grasses
Rushes
Cattails
Reeds
Other
Grasses
Rushes
Cattails
Reeds
0
20
40
60
80
100
120Em
erge
nt V
eget
atio
n C
ompo
sitio
n (%
)
Marsh Trail W. Marsh Trail E. Ridge Trail W. Ridge Trail E.
COYE
MAWR
RWBL
SWSP
YWAR
COYE
MAWR
RWBL
SWSP
YWAR
0
50
100
150
200
250
300
350
400
Mea
n M
axim
um A
bund
ance
per
10
Stat
ions
North Zone South Zone
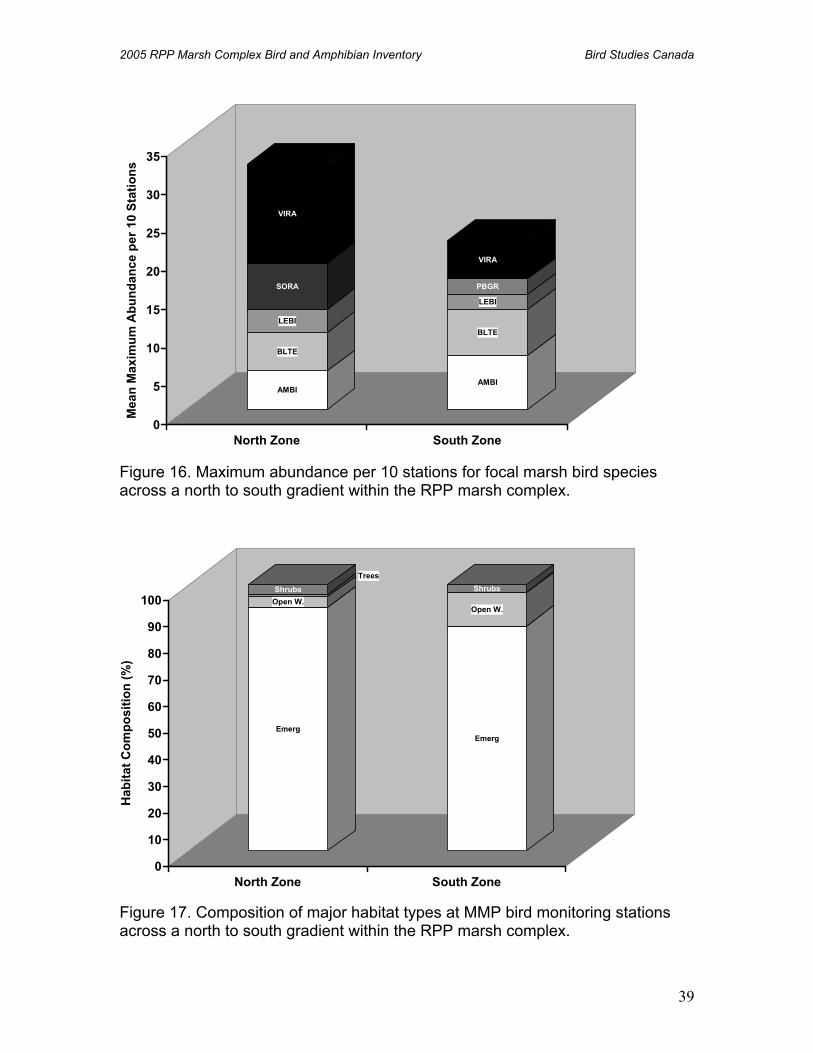
2005 RPP Marsh Complex Bird and Amphibian Inventory Bird Studies Canada
39
Figure 16. Maximum abundance per 10 stations for focal marsh bird species across a north to south gradient within the RPP marsh complex. Figure 17. Composition of major habitat types at MMP bird monitoring stations across a north to south gradient within the RPP marsh complex.
Emerg
Open W.
Trees
Shrubs
Emerg
Open W.
Shrubs
0
10
20
30
40
50
60
70
80
90
100
Hab
itat C
ompo
sitio
n (%
)
North Zone South Zone
AMBI
BLTE
LEBI
SORA
VIRA
AMBI
BLTE
LEBI
PBGR
VIRA
0
5
10
15
20
25
30
35
Mea
n M
axim
um A
bund
ance
per
10
Stat
ions
North Zone South Zone
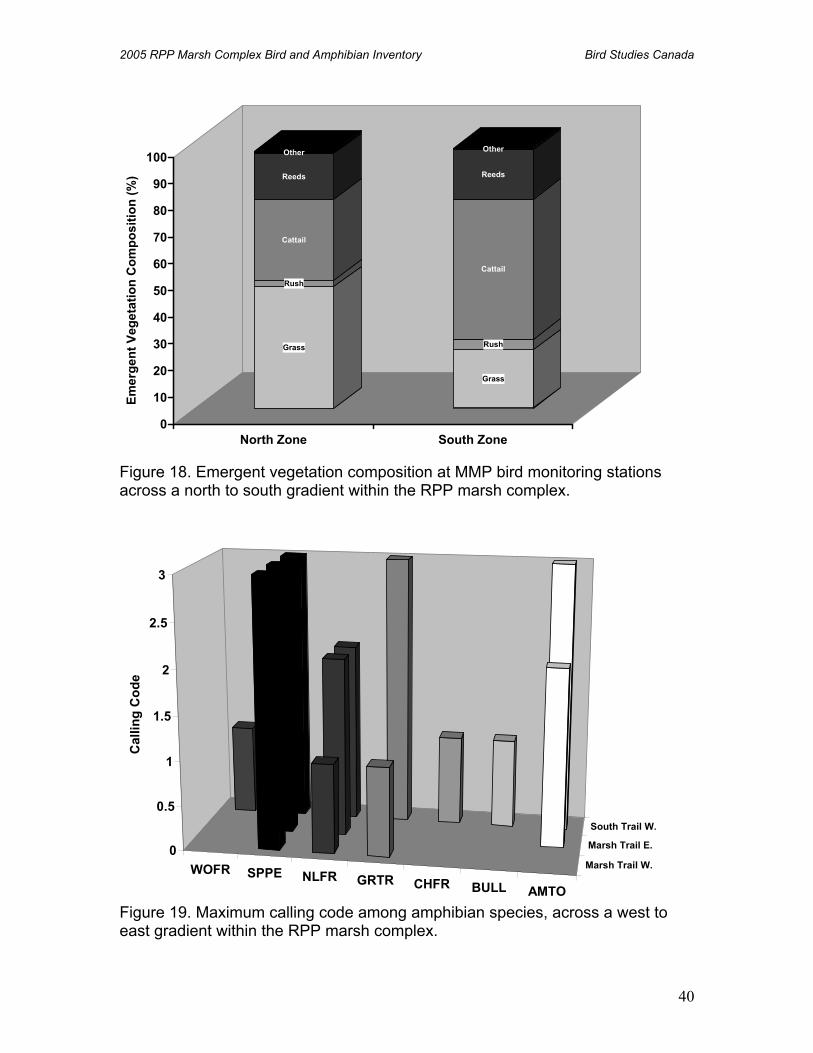
2005 RPP Marsh Complex Bird and Amphibian Inventory Bird Studies Canada
40
Figure 18. Emergent vegetation composition at MMP bird monitoring stations across a north to south gradient within the RPP marsh complex. Figure 19. Maximum calling code among amphibian species, across a west to east gradient within the RPP marsh complex.
Marsh Trail W.
Marsh Trail E.
South Trail W.
AMTOBULLCHFRGRTRNLFRSPPEWOFR0
0.5
1
1.5
2
2.5
3
Cal
ling
Cod
e
Grass
Rush
Cattail
Reeds
Other
Grass
Rush
Cattail
Reeds
Other
0
10
20
30
40
50
60
70
80
90
100
Emer
gent
Veg
etat
ion
Com
posi
tion
(%)
North Zone South Zone

2005 RPP Marsh Complex Bird and Amphibian Inventory Bird Studies Canada
41
Figure 20. Composition of major habitat types at MMP amphibian monitoring stations across a west to east gradient within the RPP marsh complex. Figure 21. Emergent vegetation composition at MMP amphibian monitoring stations across a west to east gradient within the RPP marsh complex.
Emergent
Open Water
Trees
Shrubs
Emergent
Open Water
Shrubs
0
10
20
30
40
50
60
70
80
90
100H
abita
t Com
posi
tion
(%)
Marsh Trail W. Marsh Trail E.
Cattail
Reeds
Wild R.
Grass
Rush
Arrowhead Cattail
Reeds
0
10
20
30
40
50
60
70
80
90
100
Emer
gent
Veg
etat
ion
Com
posi
tion
(%)
Marsh Trail W. Marsh Trail E.

2005 RPP Marsh Complex Bird and Amphibian Inventory Bird Studies Canada
42
Figure 22. Maximum calling code among amphibian species across a north to south gradient within the RPP marsh complex. Figure 23. Habitat type composition at MMP amphibian monitoring stations across a north to south gradient within the RPP marsh complex.
North Zone
South ZoneAMTO BULL CHFR GRTR NLFR SPPE WOFR
0
1
2
3C
allin
g C
ode
Emergent
Open Water
Shrubs
Emergent
Open Water
Trees
Shrubs
0
20
40
60
80
100
Hab
itat C
ompo
sitio
n (%
)
North Zone South Zone

2005 RPP Marsh Complex Bird and Amphibian Inventory Bird Studies Canada
43
Figure 24. Emergent vegetation composition at MMP amphibian monitoring stations across a north to south gradient within the RPP marsh complex. Table 5. MMP amphibian routes associated with pitfall trap transects. Each species’ maximum calling code is shown for each monitoring station.
Method Route Station Species Maximum Method Route Station Species MaximumCalling Code Calling Code
MMP ON149 A AMTO 1 MMP ON623 I BULL 1MMP ON149 B AMTO 1 MMP ON623 A CHFR 1MMP ON149 C AMTO 1 MMP ON623 F CHFR 1MMP ON149 E AMTO 2 MMP ON623 G CHFR 1MMP ON149 F AMTO 1 MMP ON623 C GRTR 2MMP ON149 A NLFR 2 MMP ON623 D GRTR 2MMP ON149 B NLFR 2 MMP ON623 E GRTR 2MMP ON149 C NLFR 2 MMP ON623 F GRTR 1MMP ON149 D NLFR 2 MMP ON623 G GRTR 2MMP ON149 E NLFR 2 MMP ON623 H GRTR 2MMP ON149 F NLFR 2 MMP ON623 J GRTR 3MMP ON149 G NLFR 1 MMP ON623 C NLFR 2MMP ON149 A SPPE 3 MMP ON623 D NLFR 2MMP ON149 B SPPE 3 MMP ON623 E NLFR 2MMP ON149 C SPPE 3 MMP ON623 F NLFR 1MMP ON149 D SPPE 3 MMP ON623 G NLFR 2MMP ON149 E SPPE 3 MMP ON623 H NLFR 2MMP ON149 F SPPE 3 MMP ON623 I NLFR 2MMP ON149 G SPPE 3 MMP ON623 J NLFR 2MMP ON149 H SPPE 3 MMP ON623 A SPPE 3MMP ON623 A AMTO 2 MMP ON623 B SPPE 3MMP ON623 B AMTO 2 MMP ON623 C SPPE 3MMP ON623 C AMTO 3 MMP ON623 D SPPE 3MMP ON623 D AMTO 3 MMP ON623 E SPPE 3MMP ON623 E AMTO 3 MMP ON623 F SPPE 3MMP ON623 F AMTO 3 MMP ON623 G SPPE 3MMP ON623 G AMTO 3 MMP ON623 H SPPE 3MMP ON623 H AMTO 3 MMP ON623 I SPPE 3MMP ON623 I AMTO 3 MMP ON623 J SPPE 3MMP ON623 J AMTO 2 MMP ON623 C WOFR 1
Wild R.Grass Rush
Arrowhead
Cattail
Reeds
Wild R.Grass
Rush
Cattail
Reeds
0
10
20
30
40
50
60
70
80
90
100
Emer
gent
Veg
etat
ion
Com
posi
tion
(%)
North Zone South Zone

2005 RPP Marsh Complex Bird and Amphibian Inventory Bird Studies Canada
44
Table 6. Abundance of amphibian species collected at pitfall traps. Each pitfall trap transect’s associated MMP amphibian monitoring route is shown. Table 7. Number of individuals per species collected at pitfall traps, per 100 trap nights, across pitfall trap transects. Within transect period, among-species, among-transect, and pitfall trap transect totals are shown for each collected species detected.
Species
Month Transect NLFR WOFR AMTO BSSA Among-Species Total
July Marsh Trail 2.08 0.00 0.42 0.00 2.50South Trail 0.00 3.33 0.42 0.83 4.58
July Total 2.08 3.33 0.83 0.83 7.08
August Marsh Trail 1.67 0.42 0.42 0.00 2.50South Trail 0.00 4.58 0.00 0.42 5.00
August Total 1.67 5.00 0.42 0.42 7.50
September Marsh Trail 3.33 0.00 0.00 1.11 4.44South Trail 5.56 7.78 0.56 3.33 17.22
September Total 8.89 7.78 0.56 4.44 21.67
Among-Transect Total 12.64 16.11 1.81 5.69 36.25Marsh Trail Total 7.08 0.42 0.83 1.11 9.44South Trail Total 5.56 15.69 0.97 4.58 26.81
Method Route Station Species Abundance
PITFALL ON149 D AMTO 1PITFALL ON149 E AMTO 1PITFALL ON149 F BSS 2PITFALL ON149 C NLFR 5PITFALL ON149 D NLFR 2PITFALL ON149 E NLFR 3PITFALL ON149 F NLFR 1PITFALL ON149 G NLFR 4PITFALL ON149 C WOFR 1PITFALL ON623 B AMTO 1PITFALL ON623 D AMTO 1PITFALL ON623 B BSS 4PITFALL ON623 D BSS 3PITFALL ON623 J BSS 2PITFALL ON623 B NLFR 3PITFALL ON623 F NLFR 1PITFALL ON623 H NLFR 3PITFALL ON623 J NLFR 3PITFALL ON623 B WOFR 7PITFALL ON623 D WOFR 7PITFALL ON623 F WOFR 3PITFALL ON623 H WOFR 6PITFALL ON623 J WOFR 10
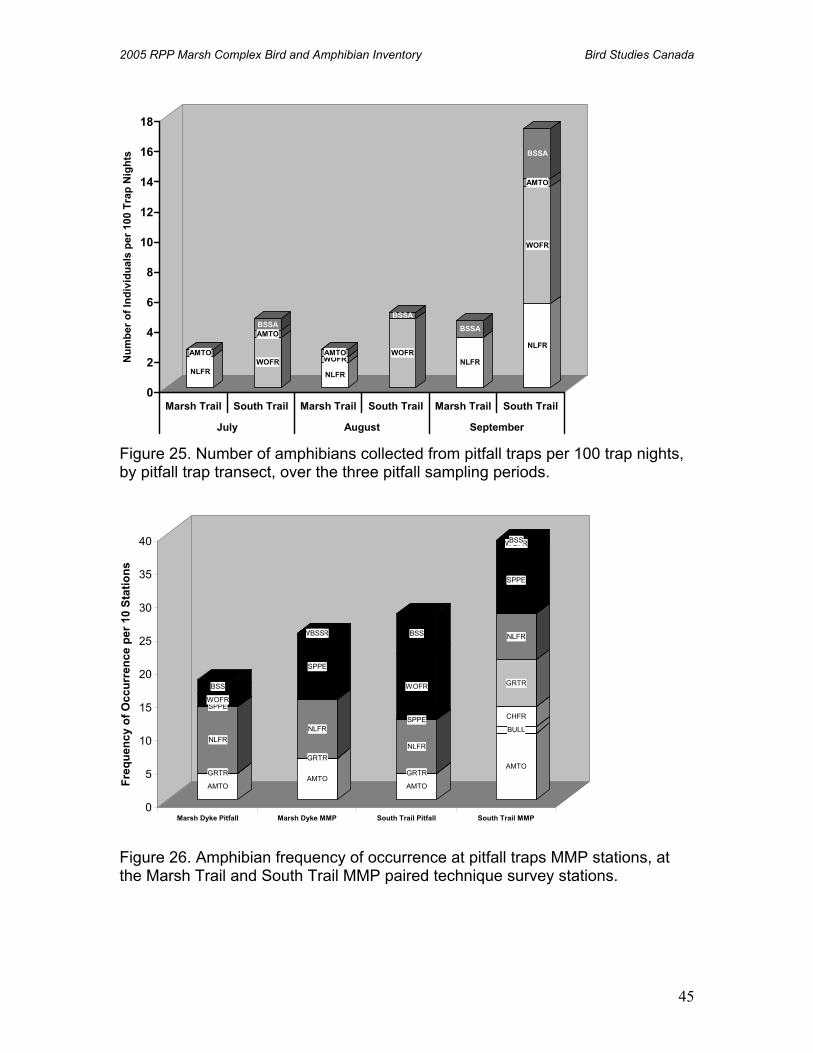
2005 RPP Marsh Complex Bird and Amphibian Inventory Bird Studies Canada
45
Figure 25. Number of amphibians collected from pitfall traps per 100 trap nights, by pitfall trap transect, over the three pitfall sampling periods. Figure 26. Amphibian frequency of occurrence at pitfall traps MMP stations, at the Marsh Trail and South Trail MMP paired technique survey stations.
NLFR
AMTOWOFR
AMTOBSSA
NLFR
WOFRAMTO WOFR
BSSA
NLFR
BSSA
NLFR
WOFR
AMTO
BSSA
0
2
4
6
8
10
12
14
16
18N
umbe
r of I
ndiv
idua
ls p
er 1
00 T
rap
Nig
hts
Marsh Trail South Trail Marsh Trail South Trail Marsh Trail South Trail
July August September
AMTO
BULLCHFRGRTR
NLFR
SPPEWOFR
BSS
AMTO
BULLCHFRGRTR
NLFR
SPPE
WOFRBSS
AMTO
BULLCHFRGRTR
NLFR
SPPE
WOFR
BSS
AMTO
BULL
CHFR
GRTR
NLFR
SPPE
WOFRBSS
0
5
10
15
20
25
30
35
40
Freq
uenc
y of
Occ
urre
nce
per 1
0 St
atio
ns
Marsh Dyke Pitfall Marsh Dyke MMP South Trail Pitfall South Trail MMP

2005 RPP Marsh Complex Bird and Amphibian Inventory Bird Studies Canada
46
Table 8. Number of individuals for each species recorded during visual transect surveys. Figure 27. Mean marsh bird IBI (500 m/1 km scale; ± standard deviation of resampled wetlands) of wetlands sampled during high Great Lakes water levels. Three wetland category rankings, determined through power analysis, are shown. Number of stations surveyed per site is located above wetland markers.
TransectNLFR WOFR AMTO BSSA Other Total
1 - - - - 1 12 - - - - - 03 4 - - - - 44 1 - - - 1 25 1 - 1 - - 26 6 - - - - 6
Number of Individuals
0
20
40
60
80
100
Riv
erM
arsh
Bay
2ar
aqui
oint
1C
reek
slan
dnd
eau
Pon
dR
iver
ngto
noi
nt 2
Cre
eksl
and
elee
2M
BS
2kt
horn
shaw
aM
arsh
Cre
ekon
d 1
Cla
i rke
gon
Poi
ntst
Bay
Riv
erit
Bay
oint
3D
unes
Cre
ekgo
nac
Cre
ekP
ond
oint
5gn
ers
hore
soo
tes
Riv
erbu
rgh
er B
ays
Bay
Mar
she
City
Bay
3M
arsh
ang
2B
MA
RSH
BIR
D IB
I
POOR
FAIR
EXCELLENT
VERY GOOD
GOOD

2005 RPP Marsh Complex Bird and Amphibian Inventory Bird Studies Canada
47
Figure 28. Mean amphibian IBI (500 m/1 km. 20 km-scale; ± standard deviation of resampled wetlands) of wetlands surveyed during high Great Lakes water levels. Four wetland category rankings, determined through power analysis, are shown. Number of stations surveyed per site is located above wetland markers. Figure 29. Mean amphibian IBI (1 km-scale; ± standard deviation of resampled wetlands) developed for wetlands surveyed during low Great Lakes water levels. Four wetland category rankings, determined through power analysis, are shown. Number of stations surveyed per site is located above wetland markers.
0
25
50
75
100R
attra
y M
arsh
Turk
ey P
oint
Big
Isla
nd M
arsh
Pre
squi
lle B
ay 4
Ron
deau
Bay
3P
resq
uille
Bay
3W
ye M
arsh
Long
Pon
d 1
Ron
deau
Pro
vinc
ial P
ark
1S
eagu
ll B
arE
mpi
re B
each
Men
tor M
arsh
Gra
nd R
iver
Mou
thW
ildfo
wl B
ayU
CM
BS
2E
ast B
ayLo
ng P
oint
1M
atch
edas
h B
ay 2
Indi
ana
Dun
esTu
scar
ora
Bay
Littl
e C
atar
aqui
Cre
ekC
harlo
ttenb
urgh
4W
hite
Riv
erB
uck
Pond
Lake
St.
Cla
irLo
ng P
oint
2To
bico
Mar
shP
ort M
cNic
holl
1P
oint
Pel
ee 2
Wau
kega
n A
rea
Illin
ois
Bea
ch S
tate
Par
k 1
Bel
levi
lle 2
wa
Nat
iona
l Wild
life
Ref
uge
RB
G- H
endr
ie V
alle
yM
agee
Mar
shB
ains
ville
Bay
2B
uckt
horn
Isla
ndR
onde
au P
rovi
ncia
l Par
k 2
Coo
tes
Par
adis
e 1
Met
zger
Mar
shLo
ng P
oint
3C
edar
Poi
nt N
atio
nal W
ildlif
eO
shaw
a S
econ
dC
ranb
erry
Mar
shP
enet
ang
Mar
sh 2
Har
sens
Isla
ndR
ouge
Riv
erB
ront
e C
reek
Sua
mic
o R
iver
Hum
berR
iver
WETLAND
AM
PHIB
IAN
IB
I VERY GOOD
GOOD
POOR
FAIR
0
25
50
75
100
Wilm
ot R
iver
mou
thB
ig Is
land
Sou
th B
ay 1
Hay
Bay
7W
est S
agin
aw B
ay 1
Rat
tray
Wye
Mar
shE
ast L
ake
6H
illman
Por
t Brit
ain
But
ton
Bay
2M
ento
r Mar
shB
uck
Pon
dM
atch
edas
h B
ay 2
Indi
ana
Dun
esW
ildfo
wl B
ayB
radd
ock
Bay
Ron
deau
Pro
vinc
ial P
ark
1Lo
ng P
oint
7Lo
ng P
ond
1E
ast S
agin
aw B
ay 5
Poi
nt P
elee
2B
radd
ock
Bay
-Cra
nber
ry P
ond
Cha
rlotte
nbur
gh 4
Em
pire
Bea
chLo
ng P
oint
3Tu
scar
ora
Bay
Long
Poi
nt 5
Long
Poi
nt 1
Sua
mic
o R
iver
Are
aTo
bico
Mar
shS
eagu
ll B
ar A
rea
Bay
field
Bay
1B
ig C
reek
Gra
nd R
iver
Mou
thR
onde
au B
ay 3
Coo
tes
Para
dise
1Lo
ng P
oint
2R
BG- H
endr
ie V
alle
yC
ranb
erry
Mar
shB
uckt
horn
Isla
ndC
edar
Poi
nt N
atio
nal W
ildlif
eH
arse
ns Is
land
Saw
guin
Cre
ek 7
Bai
nsvi
lle B
ay 2
Otta
wa
Nat
iona
l Wild
life
Met
zger
Long
Poi
nt 4
Hyd
ro M
arsh
Lake
St.
Cla
irLi
ttle
Cat
araq
ui C
reek
Otta
wa
Wild
life
Ref
uge
Rus
com
Sho
res
Por
t McN
icho
ll 1
Osh
awa
Seco
ndC
orbe
tt C
reek
Mou
thR
ouge
Riv
erIll
inoi
s Be
ach
Sta
te P
ark
1
Am
phib
ian
IBI
POOR
FAIR
GOOD
VERY GOOD

2005 RPP Marsh Complex Bird and Amphibian Inventory Bird Studies Canada
48
Table 9. Land cover areas (ha) within various buffer areas adjacent to RPP
Buffer Size Water Marsh Swamp Dense Forest Sparse Forest Beach/sand Dev. Land Idle Field Crop Land
500 m 489.0 287.1 327.5 307.7 3.9 11.3 0.0 0.0 1.41 km 1104.3 370.3 402.8 452.7 25.5 54.8 0.0 0.0 15.72 km 3281.8 464.7 409.1 503.2 62.2 88.0 0.0 0.5 48.620 km 101891.8 525.8 412.9 2365.3 201.1 172.4 175.6 873.1 47845.5
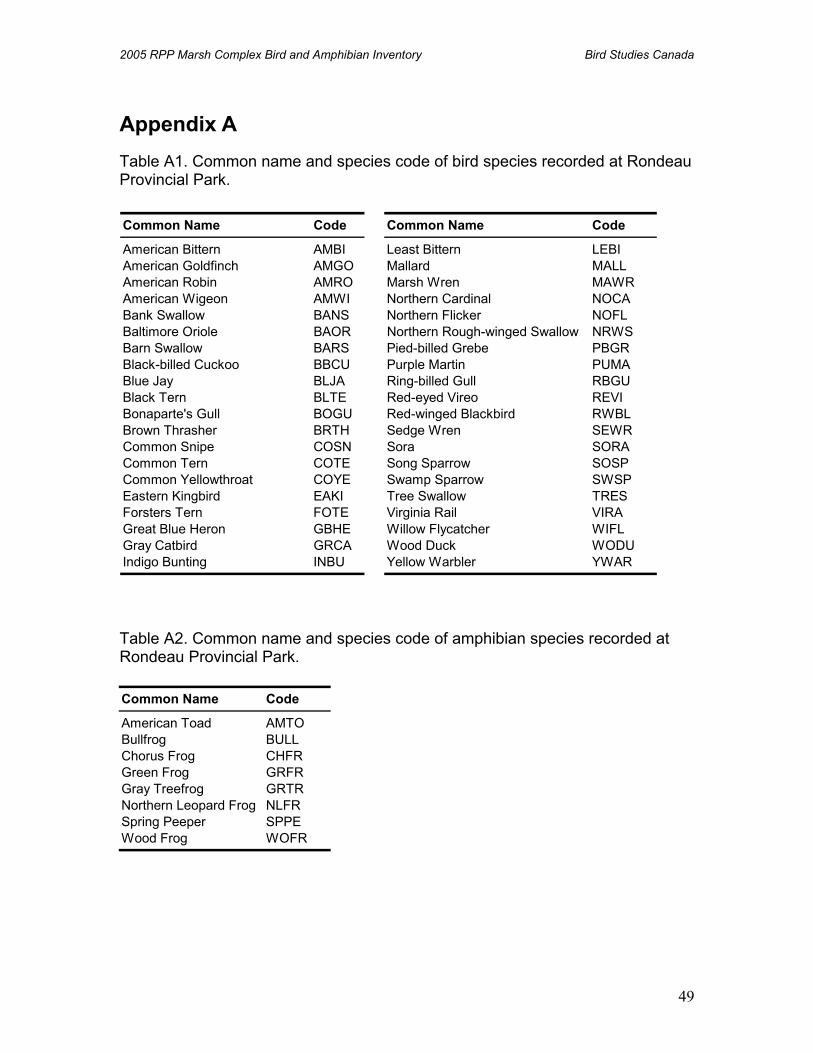
2005 RPP Marsh Complex Bird and Amphibian Inventory Bird Studies Canada
49
Appendix A Table A1. Common name and species code of bird species recorded at Rondeau Provincial Park. Table A2. Common name and species code of amphibian species recorded at Rondeau Provincial Park.
Common Name Code Common Name Code
American Bittern AMBI Least Bittern LEBIAmerican Goldfinch AMGO Mallard MALLAmerican Robin AMRO Marsh Wren MAWRAmerican Wigeon AMWI Northern Cardinal NOCABank Swallow BANS Northern Flicker NOFLBaltimore Oriole BAOR Northern Rough-winged Swallow NRWSBarn Swallow BARS Pied-billed Grebe PBGRBlack-billed Cuckoo BBCU Purple Martin PUMABlue Jay BLJA Ring-billed Gull RBGUBlack Tern BLTE Red-eyed Vireo REVIBonaparte's Gull BOGU Red-winged Blackbird RWBLBrown Thrasher BRTH Sedge Wren SEWRCommon Snipe COSN Sora SORACommon Tern COTE Song Sparrow SOSPCommon Yellowthroat COYE Swamp Sparrow SWSPEastern Kingbird EAKI Tree Swallow TRESForsters Tern FOTE Virginia Rail VIRAGreat Blue Heron GBHE Willow Flycatcher WIFLGray Catbird GRCA Wood Duck WODUIndigo Bunting INBU Yellow Warbler YWAR
Common Name Code
American Toad AMTOBullfrog BULLChorus Frog CHFRGreen Frog GRFRGray Treefrog GRTRNorthern Leopard Frog NLFRSpring Peeper SPPEWood Frog WOFR

2005 RPP Marsh Complex Bird and Amphibian Inventory Bird Studies Canada
50
Table A3. Maximum number of individuals for each bird species recorded through MMP surveys in each west to east stratum within the RPP marsh habitat complex.
Species Max. Number Species Max. Number Species Max. Number Species Max. Numberof Individuals of Individuals of Individuals of Individuals
AMBI 4 AMBI 6 AMBI 2 AMBI 1AMRO 1 AMRO 1 BARS 2 BANS 2BANS 4 AMWI 3 COYE 20 BARS 10BLTE 3 BANS 4 EAKI 1 BLTE 3COYE 32 BAOR 2 MAWR 7 COSN 3EAKI 2 BLJA 1 NRWS 3 COYE 20FOTE 1 BLTE 5 RWBL 23 EAKI 2GRCA 1 BRTH 2 SEWR 9 LEBI 1LEBI 4 COYE 39 SORA 1 MAWR 16MALL 1 EAKI 4 SOSP 5 NRWS 3MAWR 30 FOTE 6 SWSP 16 PBGR 1NOCA 1 MALL 2 TRES 15 RWBL 33NOFL 1 MAWR 21 VIRA 4 SOSP 5PUMA 33 NOCA 1 YWAR 7 SWSP 13REVI 1 PBGR 1 TRES 106RWBL 108 PUMA 4 VIRA 3SEWR 8 RWBL 91 YWAR 11SORA 1 SEWR 4SOSP 20 SORA 4SWSP 21 SOSP 18TRES 40 SWSP 23VIRA 2 TRES 29WIFL 3 VIRA 9YWAR 42 WIFL 10
YWAR 41
Marsh Trail West Ridge Trail EastRidge Trail WestMarsh Trail East

2005 RPP Marsh Complex Bird and Amphibian Inventory Bird Studies Canada
51
Table A4. Maximum number of individuals for each species recorded through MMP surveys in the north and south strata within the RPP marsh habitat complex.
Species Max. Number Species Max. Number
of Individuals of Individuals
AMBI 5 AMBI 7AMRO 1 AMRO 1AMWI 3 BANS 8BANS 2 BARS 4BAOR 2 BLTE 6BARS 8 COYE 40BLJA 1 EAKI 1BLTE 5 FOTE 1BRTH 2 LEBI 2COSN 3 MAWR 45COYE 71 NOCA 1EAKI 8 NRWS 3FOTE 6 PBGR 2GRCA 1 PUMA 2LEBI 3 RWBL 101MALL 3 SEWR 6MAWR 29 SOSP 26NOCA 1 SWSP 29NOFL 1 TRES 26NRWS 3 VIRA 5PUMA 35 YWAR 31REVI 1RWBL 154SEWR 15SORA 6SOSP 22SWSP 44TRES 164VIRA 13WIFL 13YWAR 70
North Zone South Zone

2005 RPP Marsh Complex Bird and Amphibian Inventory Bird Studies Canada
52
Table A5. Maximum number of individuals for each amphibian species recorded through MMP surveys in each west to east stratum within the RPP marsh habitat complex. Table A6. Maximum number of individuals for each amphibian species recorded through MMP surveys in the north and south strata within the RPP marsh habitat complex.
Species Max. Species Max. Species Max.Calling Code Calling Code Calling Code
BULL 1 AMTO 2 AMTO 3GRTR 1 NLFR 2 BULL 1NLFR 1 SPPE 3 CHFR 1SPPE 3 GRTR 3
NLFR 2SPPE 3WOFR 1
Marsh Trail West Marsh Trail East South Trail West
Species Max. Species Max.
Calling Code Calling Code
AMTO 3 AMTO 3BULL 1 CHFR 1CHFR 1 GRTR 2GRTR 3 NLFR 2NLFR 2 SPPE 3SPPE 3 WOFR 1
North Zone South Zone
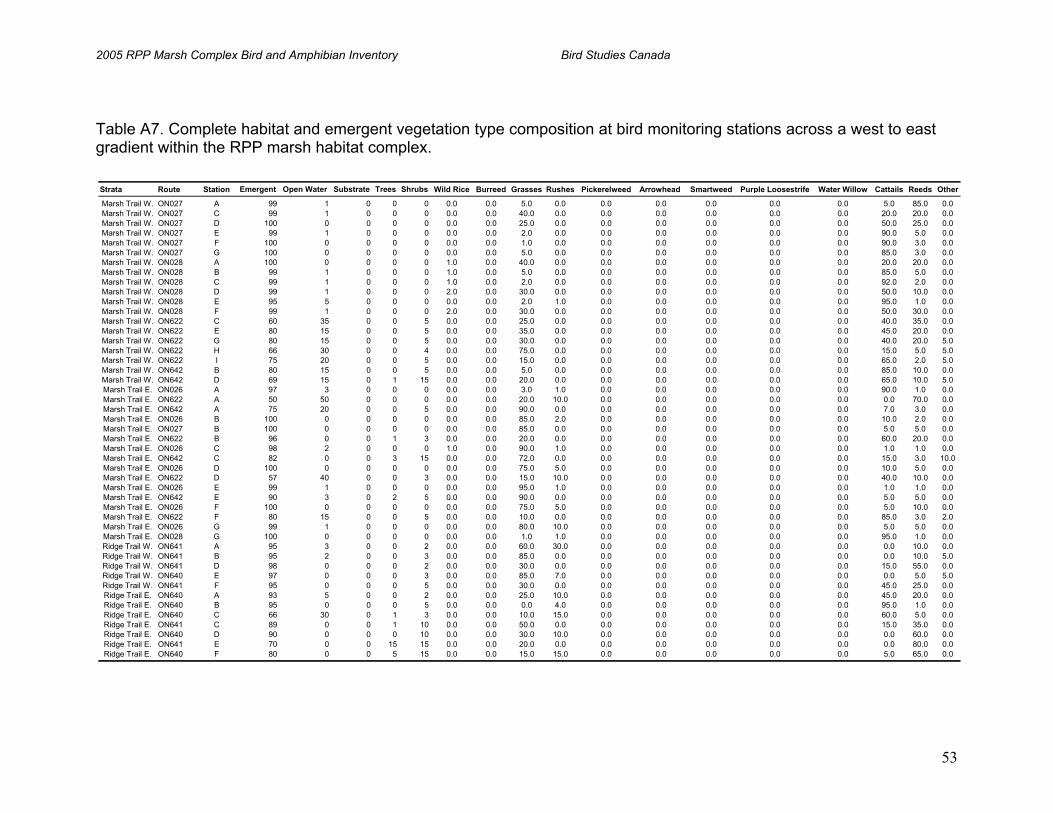
2005 RPP Marsh Complex Bird and Amphibian Inventory Bird Studies Canada
53
Table A7. Complete habitat and emergent vegetation type composition at bird monitoring stations across a west to east gradient within the RPP marsh habitat complex.
Strata Route Station Emergent Open Water Substrate Trees Shrubs Wild Rice Burreed Grasses Rushes Pickerelweed Arrowhead Smartweed Purple Loosestrife Water Willow Cattails Reeds Other
Marsh Trail W. ON027 A 99 1 0 0 0 0.0 0.0 5.0 0.0 0.0 0.0 0.0 0.0 0.0 5.0 85.0 0.0Marsh Trail W. ON027 C 99 1 0 0 0 0.0 0.0 40.0 0.0 0.0 0.0 0.0 0.0 0.0 20.0 20.0 0.0Marsh Trail W. ON027 D 100 0 0 0 0 0.0 0.0 25.0 0.0 0.0 0.0 0.0 0.0 0.0 50.0 25.0 0.0Marsh Trail W. ON027 E 99 1 0 0 0 0.0 0.0 2.0 0.0 0.0 0.0 0.0 0.0 0.0 90.0 5.0 0.0Marsh Trail W. ON027 F 100 0 0 0 0 0.0 0.0 1.0 0.0 0.0 0.0 0.0 0.0 0.0 90.0 3.0 0.0Marsh Trail W. ON027 G 100 0 0 0 0 0.0 0.0 5.0 0.0 0.0 0.0 0.0 0.0 0.0 85.0 3.0 0.0Marsh Trail W. ON028 A 100 0 0 0 0 1.0 0.0 40.0 0.0 0.0 0.0 0.0 0.0 0.0 20.0 20.0 0.0Marsh Trail W. ON028 B 99 1 0 0 0 1.0 0.0 5.0 0.0 0.0 0.0 0.0 0.0 0.0 85.0 5.0 0.0Marsh Trail W. ON028 C 99 1 0 0 0 1.0 0.0 2.0 0.0 0.0 0.0 0.0 0.0 0.0 92.0 2.0 0.0Marsh Trail W. ON028 D 99 1 0 0 0 2.0 0.0 30.0 0.0 0.0 0.0 0.0 0.0 0.0 50.0 10.0 0.0Marsh Trail W. ON028 E 95 5 0 0 0 0.0 0.0 2.0 1.0 0.0 0.0 0.0 0.0 0.0 95.0 1.0 0.0Marsh Trail W. ON028 F 99 1 0 0 0 2.0 0.0 30.0 0.0 0.0 0.0 0.0 0.0 0.0 50.0 30.0 0.0Marsh Trail W. ON622 C 60 35 0 0 5 0.0 0.0 25.0 0.0 0.0 0.0 0.0 0.0 0.0 40.0 35.0 0.0Marsh Trail W. ON622 E 80 15 0 0 5 0.0 0.0 35.0 0.0 0.0 0.0 0.0 0.0 0.0 45.0 20.0 0.0Marsh Trail W. ON622 G 80 15 0 0 5 0.0 0.0 30.0 0.0 0.0 0.0 0.0 0.0 0.0 40.0 20.0 5.0Marsh Trail W. ON622 H 66 30 0 0 4 0.0 0.0 75.0 0.0 0.0 0.0 0.0 0.0 0.0 15.0 5.0 5.0Marsh Trail W. ON622 I 75 20 0 0 5 0.0 0.0 15.0 0.0 0.0 0.0 0.0 0.0 0.0 65.0 2.0 5.0Marsh Trail W. ON642 B 80 15 0 0 5 0.0 0.0 5.0 0.0 0.0 0.0 0.0 0.0 0.0 85.0 10.0 0.0Marsh Trail W. ON642 D 69 15 0 1 15 0.0 0.0 20.0 0.0 0.0 0.0 0.0 0.0 0.0 65.0 10.0 5.0Marsh Trail E. ON026 A 97 3 0 0 0 0.0 0.0 3.0 1.0 0.0 0.0 0.0 0.0 0.0 90.0 1.0 0.0Marsh Trail E. ON622 A 50 50 0 0 0 0.0 0.0 20.0 10.0 0.0 0.0 0.0 0.0 0.0 0.0 70.0 0.0Marsh Trail E. ON642 A 75 20 0 0 5 0.0 0.0 90.0 0.0 0.0 0.0 0.0 0.0 0.0 7.0 3.0 0.0Marsh Trail E. ON026 B 100 0 0 0 0 0.0 0.0 85.0 2.0 0.0 0.0 0.0 0.0 0.0 10.0 2.0 0.0Marsh Trail E. ON027 B 100 0 0 0 0 0.0 0.0 85.0 0.0 0.0 0.0 0.0 0.0 0.0 5.0 5.0 0.0Marsh Trail E. ON622 B 96 0 0 1 3 0.0 0.0 20.0 0.0 0.0 0.0 0.0 0.0 0.0 60.0 20.0 0.0Marsh Trail E. ON026 C 98 2 0 0 0 1.0 0.0 90.0 1.0 0.0 0.0 0.0 0.0 0.0 1.0 1.0 0.0Marsh Trail E. ON642 C 82 0 0 3 15 0.0 0.0 72.0 0.0 0.0 0.0 0.0 0.0 0.0 15.0 3.0 10.0Marsh Trail E. ON026 D 100 0 0 0 0 0.0 0.0 75.0 5.0 0.0 0.0 0.0 0.0 0.0 10.0 5.0 0.0Marsh Trail E. ON622 D 57 40 0 0 3 0.0 0.0 15.0 10.0 0.0 0.0 0.0 0.0 0.0 40.0 10.0 0.0Marsh Trail E. ON026 E 99 1 0 0 0 0.0 0.0 95.0 1.0 0.0 0.0 0.0 0.0 0.0 1.0 1.0 0.0Marsh Trail E. ON642 E 90 3 0 2 5 0.0 0.0 90.0 0.0 0.0 0.0 0.0 0.0 0.0 5.0 5.0 0.0Marsh Trail E. ON026 F 100 0 0 0 0 0.0 0.0 75.0 5.0 0.0 0.0 0.0 0.0 0.0 5.0 10.0 0.0Marsh Trail E. ON622 F 80 15 0 0 5 0.0 0.0 10.0 0.0 0.0 0.0 0.0 0.0 0.0 85.0 3.0 2.0Marsh Trail E. ON026 G 99 1 0 0 0 0.0 0.0 80.0 10.0 0.0 0.0 0.0 0.0 0.0 5.0 5.0 0.0Marsh Trail E. ON028 G 100 0 0 0 0 0.0 0.0 1.0 1.0 0.0 0.0 0.0 0.0 0.0 95.0 1.0 0.0Ridge Trail W. ON641 A 95 3 0 0 2 0.0 0.0 60.0 30.0 0.0 0.0 0.0 0.0 0.0 0.0 10.0 0.0Ridge Trail W. ON641 B 95 2 0 0 3 0.0 0.0 85.0 0.0 0.0 0.0 0.0 0.0 0.0 0.0 10.0 5.0Ridge Trail W. ON641 D 98 0 0 0 2 0.0 0.0 30.0 0.0 0.0 0.0 0.0 0.0 0.0 15.0 55.0 0.0Ridge Trail W. ON640 E 97 0 0 0 3 0.0 0.0 85.0 7.0 0.0 0.0 0.0 0.0 0.0 0.0 5.0 5.0Ridge Trail W. ON641 F 95 0 0 0 5 0.0 0.0 30.0 0.0 0.0 0.0 0.0 0.0 0.0 45.0 25.0 0.0Ridge Trail E. ON640 A 93 5 0 0 2 0.0 0.0 25.0 10.0 0.0 0.0 0.0 0.0 0.0 45.0 20.0 0.0Ridge Trail E. ON640 B 95 0 0 0 5 0.0 0.0 0.0 4.0 0.0 0.0 0.0 0.0 0.0 95.0 1.0 0.0Ridge Trail E. ON640 C 66 30 0 1 3 0.0 0.0 10.0 15.0 0.0 0.0 0.0 0.0 0.0 60.0 5.0 0.0Ridge Trail E. ON641 C 89 0 0 1 10 0.0 0.0 50.0 0.0 0.0 0.0 0.0 0.0 0.0 15.0 35.0 0.0Ridge Trail E. ON640 D 90 0 0 0 10 0.0 0.0 30.0 10.0 0.0 0.0 0.0 0.0 0.0 0.0 60.0 0.0Ridge Trail E. ON641 E 70 0 0 15 15 0.0 0.0 20.0 0.0 0.0 0.0 0.0 0.0 0.0 0.0 80.0 0.0Ridge Trail E. ON640 F 80 0 0 5 15 0.0 0.0 15.0 15.0 0.0 0.0 0.0 0.0 0.0 5.0 65.0 0.0

2005 RPP Marsh Complex Bird and Amphibian Inventory Bird Studies Canada
54
Table A8. Complete habitat and emergent vegetation type composition at bird monitoring stations across a north to south gradient within the RPP marsh habitat complex.
Strata Route Station Emergent Open Water Substrate Trees Shrubs Wild Rice Burreed Grasses Rushes Pickerelweed Arrowhead Smartweed Purple Loosestrife Water Willow Cattails Reeds Other
North Zone ON026 A 97 3 0 0 0 0 0 3 1 0 0 0 0 0 90 1 0North Zone ON026 B 100 0 0 0 0 0 0 85 2 0 0 0 0 0 10 2 0North Zone ON026 C 98 2 0 0 0 1 0 90 1 0 0 0 0 0 1 1 0North Zone ON026 D 100 0 0 0 0 0 0 75 5 0 0 0 0 0 10 5 0North Zone ON026 E 99 1 0 0 0 0 0 95 1 0 0 0 0 0 1 1 0North Zone ON026 F 100 0 0 0 0 0 0 75 5 0 0 0 0 0 5 10 0North Zone ON026 G 99 1 0 0 0 0 0 80 10 0 0 0 0 0 5 5 0North Zone ON027 A 99 1 0 0 0 0 0 5 0 0 0 0 0 0 5 85 0North Zone ON027 B 100 0 0 0 0 0 0 85 0 0 0 0 0 0 5 5 0North Zone ON027 C 99 1 0 0 0 0 0 40 0 0 0 0 0 0 20 20 0North Zone ON027 D 100 0 0 0 0 0 0 25 0 0 0 0 0 0 50 25 0North Zone ON027 E 99 1 0 0 0 0 0 2 0 0 0 0 0 0 90 5 0North Zone ON027 F 100 0 0 0 0 0 0 1 0 0 0 0 0 0 90 3 0North Zone ON027 G 100 0 0 0 0 0 0 5 0 0 0 0 0 0 85 3 0North Zone ON028 A 100 0 0 0 0 1 0 40 0 0 0 0 0 0 20 20 0North Zone ON028 B 99 1 0 0 0 1 0 5 0 0 0 0 0 0 85 5 0North Zone ON622 H 66 30 0 0 4 0 0 75 0 0 0 0 0 0 15 5 5North Zone ON622 I 75 20 0 0 5 0 0 15 0 0 0 0 0 0 65 2 5North Zone ON640 F 80 0 0 5 15 0 0 15 15 0 0 0 0 0 5 65 0North Zone ON641 A 95 3 0 0 2 0 0 60 30 0 0 0 0 0 0 10 0North Zone ON641 B 95 2 0 0 3 0 0 85 0 0 0 0 0 0 0 10 5North Zone ON641 C 89 0 0 1 10 0 0 50 0 0 0 0 0 0 15 35 0North Zone ON641 D 98 0 0 0 2 0 0 30 0 0 0 0 0 0 15 55 0North Zone ON641 E 70 0 0 15 15 0 0 20 0 0 0 0 0 0 0 80 0North Zone ON641 F 95 0 0 0 5 0 0 30 0 0 0 0 0 0 45 25 0North Zone ON642 A 75 20 0 0 5 0 0 90 0 0 0 0 0 0 7 3 0North Zone ON642 B 80 15 0 0 5 0 0 5 0 0 0 0 0 0 85 10 0North Zone ON642 C 82 0 0 3 15 0 0 72 0 0 0 0 0 0 15 3 10North Zone ON642 D 69 15 0 1 15 0 0 20 0 0 0 0 0 0 65 10 5North Zone ON642 E 90 3 0 2 5 0 0 90 0 0 0 0 0 0 5 5 0South Zone ON028 C 99 1 0 0 0 1 0 2 0 0 0 0 0 0 92 2 0South Zone ON028 D 99 1 0 0 0 2 0 30 0 0 0 0 0 0 50 10 0South Zone ON028 E 95 5 0 0 0 0 0 2 1 0 0 0 0 0 95 1 0South Zone ON028 F 99 1 0 0 0 2 0 30 0 0 0 0 0 0 50 30 0South Zone ON028 G 100 0 0 0 0 0 0 1 1 0 0 0 0 0 95 1 0South Zone ON622 A 50 50 0 0 0 0 0 20 10 0 0 0 0 0 0 70 0South Zone ON622 B 96 0 0 1 3 0 0 20 0 0 0 0 0 0 60 20 0South Zone ON622 C 60 35 0 0 5 0 0 25 0 0 0 0 0 0 40 35 0South Zone ON622 D 57 40 0 0 3 0 0 15 10 0 0 0 0 0 40 10 0South Zone ON622 E 80 15 0 0 5 0 0 35 0 0 0 0 0 0 45 20 0South Zone ON622 F 80 15 0 0 5 0 0 10 0 0 0 0 0 0 85 3 2South Zone ON622 G 80 15 0 0 5 0 0 30 0 0 0 0 0 0 40 20 5South Zone ON640 A 93 5 0 0 2 0 0 25 10 0 0 0 0 0 45 20 0South Zone ON640 B 95 0 0 0 5 0 0 0 4 0 0 0 0 0 95 1 0South Zone ON640 C 66 30 0 1 3 0 0 10 15 0 0 0 0 0 60 5 0South Zone ON640 D 90 0 0 0 10 0 0 30 10 0 0 0 0 0 0 60 0South Zone ON640 E 97 0 0 0 3 0 0 85 7 0 0 0 0 0 0 5 5

2005 RPP Marsh Complex Bird and Amphibian Inventory Bird Studies Canada
55
Table A9. Complete habitat and emergent vegetation type composition at amphibian monitoring stations across a west to east gradient within the RPP marsh habitat complex. Table A10. Complete habitat and emergent vegetation type composition at amphibian monitoring stations across a north to south gradient within the RPP marsh habitat complex.
Strata Route Station Emergent Open Water Substrate Trees Shrubs Wild Rice Burreed Grasses Rushes Pickerelweed Arrowhead Smartweed Purple Loosestrife Water Willow Cattails Reeds Other
Marsh Trail E. ON149 A 50 0 0 10 40 0 0 10 0 0 0 0 0 0 10 80 0Marsh Trail E. ON149 B 50 0 0 10 40 0 0 10 6 0 0 0 0 0 10 80 0Marsh Trail E. ON149 C 60 0 0 0 40 0 0 10 0 0 0 0 0 0 0 90 0Marsh Trail E. ON149 D 90 0 0 0 10 0 0 10 0 0 0 0 0 0 0 80 0Marsh Trail E. ON149 E 50 40 0 0 10 10 0 20 0 0 0 0 0 0 10 50 0Marsh Trail E. ON149 F 50 40 0 0 10 10 0 0 10 0 0 0 0 0 10 80 0Marsh Trail E. ON149 G 20 80 0 0 0 10 0 0 0 0 10 0 0 0 10 50 0Marsh Trail E. ON149 H 20 80 0 0 0 0 0 10 10 0 0 0 0 0 10 60 0Marsh Trail W. ON227 A 60 40 0 0 0 0 0 5 0 0 0 0 0 0 35 60 0Marsh Trail W. ON227 B 70 28 0 0 2 0 0 0 1 0 0 0 0 0 80 19 0Marsh Trail W. ON227 C 91 3 0 0 6 0 0 0 0 0 0 0 0 0 80 20 0Marsh Trail W. ON227 D 97 2 0 0 1 0 0 0 0 0 0 0 0 0 15 85 0Marsh Trail W. ON227 E 99 1 0 0 0 0 0 0 0 0 0 0 0 0 95 5 0Marsh Trail W. ON227 F 90 0 0 0 10 0 0 0 0 0 0 0 0 0 85 10 0Marsh Trail W. ON227 G 55 35 0 0 10 0 0 0 4 0 2 0 0 0 55 40 0
Strata Route Station Emergent Open Water Substrate Trees Shrubs Wild Rice Burreed Grasses Rushes Pickerelweed Arrowhead Smartweed Purple Loosestrife Water Willow Cattails Reeds Other
North Zone ON149 F 50 40 0 0 10 10 0 0 10 0 0 0 0 0 10 80 0North Zone ON149 G 20 80 0 0 0 10 0 0 0 0 10 0 0 0 10 50 0North Zone ON149 H 20 80 0 0 0 0 0 10 10 0 0 0 0 0 10 60 0North Zone ON227 F 90 0 0 0 10 0 0 0 0 0 0 0 0 0 85 10 0North Zone ON227 G 55 35 0 0 10 0 0 0 4 0 2 0 0 0 55 40 0South Zone ON149 A 50 0 0 10 40 0 0 10 0 0 0 0 0 0 10 80 0South Zone ON149 B 50 0 0 10 40 0 0 10 6 0 0 0 0 0 10 80 0South Zone ON149 C 60 0 0 0 40 0 0 10 0 0 0 0 0 0 0 90 0South Zone ON149 D 90 0 0 0 10 0 0 10 0 0 0 0 0 0 0 80 0South Zone ON149 E 50 40 0 0 10 10 0 20 0 0 0 0 0 0 10 50 0South Zone ON227 A 60 40 0 0 0 0 0 5 0 0 0 0 0 0 35 60 0South Zone ON227 B 70 28 0 0 2 0 0 0 1 0 0 0 0 0 80 19 0South Zone ON227 C 91 3 0 0 6 0 0 0 0 0 0 0 0 0 80 20 0South Zone ON227 D 97 2 0 0 1 0 0 0 0 0 0 0 0 0 15 85 0South Zone ON227 E 99 1 0 0 0 0 0 0 0 0 0 0 0 0 95 5 0

2005 RPP Marsh Complex Bird and Amphibian Inventory Bird Studies Canada
56
Table A11. Complete pitfall trap results. SVL = snout to vent length; STL = snout to tail length.
Obs Date Time Start Time End Wind Cloud Precip. Route Station Trap UTM UTM Species SVL STL Sex Recapture(Beaufort Scale) (%) Type Easting (17) Northing (mm) (mm)
TC 5/7/2005 1130 1330 0 100 DRIZ ON622 C 1 427898 4680158 . . . . .TC 5/7/2005 1130 1330 0 100 DRIZ ON622 C 2 427902 4680173 . . . . .TC 5/7/2005 1130 1330 0 100 DRIZ ON622 C 3 427905 4680187 . . . . .TC 5/7/2005 1130 1330 0 100 DRIZ ON622 C 4 427912 4680200 . . . . .TC 5/7/2005 1130 1330 0 100 DRIZ ON622 C 5 427914 4680211 . . . . .TC 5/7/2005 1130 1330 0 100 DRIZ ON622 C 6 427918 4680219 . . . . .TC 5/7/2005 1130 1330 0 100 DRIZ ON622 D 1 428072 4680614 . . . . .TC 5/7/2005 1130 1330 0 100 DRIZ ON622 D 2 428074 4680625 . . . . .TC 5/7/2005 1130 1330 0 100 DRIZ ON622 D 3 428076 4680642 . . . . .TC 5/7/2005 1130 1330 0 100 DRIZ ON622 D 4 428083 4680657 . . . . .TC 5/7/2005 1130 1330 0 100 DRIZ ON622 D 5 428090 4680672 . . . . .TC 5/7/2005 1130 1330 0 100 DRIZ ON622 D 6 428093 4680688 . . . . .TC 5/7/2005 1130 1330 0 100 DRIZ ON622 E 1 428247 4681087 . . . . .TC 5/7/2005 1130 1330 0 100 DRIZ ON622 E 2 428251 4681104 . . . . .TC 5/7/2005 1130 1330 0 100 DRIZ ON622 E 3 428253 4681122 . . . . .TC 5/7/2005 1130 1330 0 100 DRIZ ON622 E 4 428260 4681137 . . . . .TC 5/7/2005 1130 1330 0 100 DRIZ ON622 E 5 428266 4681147 . . . . .TC 5/7/2005 1130 1330 0 100 DRIZ ON622 E 6 428271 4681163 . . . . .TC 5/7/2005 1130 1330 0 100 DRIZ ON622 F 1 428469 4681543 . . . . .TC 5/7/2005 1130 1330 0 100 DRIZ ON622 F 2 428474 4681553 . . . . .TC 5/7/2005 1130 1330 0 100 DRIZ ON622 F 3 428475 4681568 . . . . .TC 5/7/2005 1130 1330 0 100 DRIZ ON622 F 4 428482 4681588 . . . . .TC 5/7/2005 1130 1330 0 100 DRIZ ON622 F 5 428491 4681601 . . . . .TC 5/7/2005 1130 1330 0 100 DRIZ ON622 F 6 428495 4681613 . . . . .TC 5/7/2005 1130 1330 0 100 DRIZ ON622 G 1 428682 4682019 . . . . .TC 5/7/2005 1130 1330 0 100 DRIZ ON622 G 2 428682 4682042 . . . . .TC 5/7/2005 1130 1330 0 100 DRIZ ON622 G 3 428691 4682056 . . . . .TC 5/7/2005 1130 1330 0 100 DRIZ ON622 G 4 428695 4682068 . . . . .TC 5/7/2005 1130 1330 0 100 DRIZ ON622 G 5 428700 4682085 . . . . .TC 5/7/2005 1130 1330 0 100 DRIZ ON622 G 6 428706 4682098 NLFR 25.9 . unk n/aTC 5/7/2005 1130 1330 0 100 DRIZ ON622 G 6 428706 4682098 NLFR 28.7 . unk n/aTC 5/7/2005 1130 1330 0 100 DRIZ ON622 G 6 428706 4682098 NLFR 25.5 . unk n/aTC 5/7/2005 821 1030 0 100 DRIZ ON623 B 1 428755 4678935 . . . . .TC 5/7/2005 821 1030 0 100 DRIZ ON623 B 2 428763 4678949 . . . . .TC 5/7/2005 821 1030 0 100 DRIZ ON623 B 3 428787 4678946 . . . . .TC 5/7/2005 821 1030 0 100 DRIZ ON623 B 4 428770 4678969 . . . . .TC 5/7/2005 821 1030 0 100 DRIZ ON623 B 5 428772 4678983 . . . . .TC 5/7/2005 821 1030 0 100 DRIZ ON623 B 6 428778 4678995 . . . . .TC 5/7/2005 821 1030 0 100 DRIZ ON623 D 1 429078 4679839 . . . . .TC 5/7/2005 821 1030 0 100 DRIZ ON623 D 2 429077 4679846 . . . . .TC 5/7/2005 821 1030 0 100 DRIZ ON623 D 3 429073 4679866 . . . . .TC 5/7/2005 821 1030 0 100 DRIZ ON623 D 4 429077 4679880 . . . . .TC 5/7/2005 821 1030 0 100 DRIZ ON623 D 5 429089 4679896 . . . . .TC 5/7/2005 821 1030 0 100 DRIZ ON623 D 6 429086 4679910 . . . . .TC 5/7/2005 821 1030 0 100 DRIZ ON623 F 1 429308 4680835 . . . . .TC 5/7/2005 821 1030 0 100 DRIZ ON623 F 2 429304 4680831 . . . . .TC 5/7/2005 821 1030 0 100 DRIZ ON623 F 3 429306 4680832 . . . . .TC 5/7/2005 821 1030 0 100 DRIZ ON623 F 4 429305 4680834 . . . . .TC 5/7/2005 821 1030 0 100 DRIZ ON623 F 5 429307 4680843 . . . . .TC 5/7/2005 821 1030 0 100 DRIZ ON623 F 6 429305 4680872 . . . . .TC 5/7/2005 821 1030 0 100 DRIZ ON623 H 1 429501 4681751 . . . . .TC 5/7/2005 821 1030 0 100 DRIZ ON623 H 2 429495 4681764 . . . . .TC 5/7/2005 821 1030 0 100 DRIZ ON623 H 3 429510 4681768 . . . . .TC 5/7/2005 821 1030 0 100 DRIZ ON623 H 4 429508 4681800 . . . . .TC 5/7/2005 821 1030 0 100 DRIZ ON623 H 5 429511 4681817 . . . . .TC 5/7/2005 821 1030 0 100 DRIZ ON623 H 6 429508 4681845 . . . . .TC 5/7/2005 821 1030 0 100 DRIZ ON623 J 1 429633 4682732 WOFR 15.1 . unk n/aTC 5/7/2005 821 1030 0 100 DRIZ ON623 J 2 429618 4682764 . . . . .TC 5/7/2005 821 1030 0 100 DRIZ ON623 J 3 429623 4682781 . . . . .TC 5/7/2005 821 1030 0 100 DRIZ ON623 J 4 429618 4682796 . . . . .TC 5/7/2005 821 1030 0 100 DRIZ ON623 J 5 429612 4682816 . . . . .TC 5/7/2005 821 1030 0 100 DRIZ ON623 J 6 429614 4682840 . . . . .

2005 RPP Marsh Complex Bird and Amphibian Inventory Bird Studies Canada
57
…Table A11 continued
Obs Date Time Start Time End Wind Cloud Precip. Route Station Trap UTM UTM Species SVL STL Sex Recapture(Beaufort Scale) (%) Type Easting (17) Northing (mm) (mm)
TC 6/7/2005 1030 1130 2 90 NONE ON622 C 1 427898 4680158 NLFR 29 . unk n/aTC 6/7/2005 1030 1130 2 90 NONE ON622 C 2 427902 4680173 . . . . .TC 6/7/2005 1030 1130 2 90 NONE ON622 C 3 427905 4680187 WOFR 32 . unk n/aTC 6/7/2005 1030 1130 2 90 NONE ON622 C 4 427912 4680200 . . . . .TC 6/7/2005 1030 1130 2 90 NONE ON622 C 5 427914 4680211 . . . . .TC 6/7/2005 1030 1130 2 90 NONE ON622 C 6 427918 4680219 . . . . .TC 6/7/2005 1030 1130 2 90 NONE ON622 D 1 428072 4680614 . . . . .TC 6/7/2005 1030 1130 2 90 NONE ON622 D 2 428074 4680625 . . . . .TC 6/7/2005 1030 1130 2 90 NONE ON622 D 3 428076 4680642 AMTO 73 . F n/aTC 6/7/2005 1030 1130 2 90 NONE ON622 D 4 428083 4680657 . . . . .TC 6/7/2005 1030 1130 2 90 NONE ON622 D 5 428090 4680672 . . . . .TC 6/7/2005 1030 1130 2 90 NONE ON622 D 6 428093 4680688 . . . . .JJ 6/7/2005 1030 1130 2 90 NONE ON622 E 1 428247 4681087 . . . . .JJ 6/7/2005 1030 1130 2 90 NONE ON622 E 2 428251 4681104 . . . . .JJ 6/7/2005 1030 1130 2 90 NONE ON622 E 3 428253 4681122 . . . . .JJ 6/7/2005 1030 1130 2 90 NONE ON622 E 4 428260 4681137 . . . . .JJ 6/7/2005 1030 1130 2 90 NONE ON622 E 5 428266 4681147 . . . . .JJ 6/7/2005 1030 1130 2 90 NONE ON622 E 6 428271 4681163 . . . . .JJ 6/7/2005 1030 1130 2 90 NONE ON622 F 1 428469 4681543 . . . . .JJ 6/7/2005 1030 1130 2 90 NONE ON622 F 2 428474 4681553 . . . . .JJ 6/7/2005 1030 1130 2 90 NONE ON622 F 3 428475 4681568 . . . . .JJ 6/7/2005 1030 1130 2 90 NONE ON622 F 4 428482 4681588 . . . . .JJ 6/7/2005 1030 1130 2 90 NONE ON622 F 5 428491 4681601 . . . . .JJ 6/7/2005 1030 1130 2 90 NONE ON622 F 6 428495 4681613 . . . . .JJ 6/7/2005 1030 1130 2 90 NONE ON622 G 1 428682 4682019 . . . . .JJ 6/7/2005 1030 1130 2 90 NONE ON622 G 2 428682 4682042 . . . . .JJ 6/7/2005 1030 1130 2 90 NONE ON622 G 3 428691 4682056 . . . . .JJ 6/7/2005 1030 1130 2 90 NONE ON622 G 4 428695 4682068 . . . . .JJ 6/7/2005 1030 1130 2 90 NONE ON622 G 5 428700 4682085 . . . . .JJ 6/7/2005 1030 1130 2 90 NONE ON622 G 6 428706 4682098 . . . . .TC 6/7/2005 830 930 2 90 NONE ON623 B 1 428755 4678935 . . . . .TC 6/7/2005 830 930 2 90 NONE ON623 B 2 428763 4678949 . . . . .TC 6/7/2005 830 930 2 90 NONE ON623 B 3 428787 4678946 . . . . .TC 6/7/2005 830 930 2 90 NONE ON623 B 4 428770 4678969 BSSA 44 89 unk n/aTC 6/7/2005 830 930 2 90 NONE ON623 B 5 428772 4678983 . . . . .TC 6/7/2005 830 930 2 90 NONE ON623 B 6 428778 4678995 . . . . .TC 6/7/2005 830 930 2 90 NONE ON623 D 1 429078 4679839 . . . . .TC 6/7/2005 830 930 2 90 NONE ON623 D 2 429077 4679846 . . . . .TC 6/7/2005 830 930 2 90 NONE ON623 D 3 429073 4679866 . . . . .TC 6/7/2005 830 930 2 90 NONE ON623 D 4 429077 4679880 . . . . .TC 6/7/2005 830 930 2 90 NONE ON623 D 5 429089 4679896 . . . . .TC 6/7/2005 830 930 2 90 NONE ON623 D 6 429086 4679910 . . . . .TC 6/7/2005 830 930 2 90 NONE ON623 F 1 429308 4680835 . . . . .TC 6/7/2005 830 930 2 90 NONE ON623 F 2 429304 4680831 . . . . .TC 6/7/2005 830 930 2 90 NONE ON623 F 3 429306 4680832 . . . . .TC 6/7/2005 830 930 2 90 NONE ON623 F 4 429305 4680834 . . . . .TC 6/7/2005 830 930 2 90 NONE ON623 F 5 429307 4680843 . . . . .TC 6/7/2005 830 930 2 90 NONE ON623 F 6 429305 4680872 . . . . .TC 6/7/2005 830 930 2 90 NONE ON623 H 1 429501 4681751 . . . . .TC 6/7/2005 830 930 2 90 NONE ON623 H 2 429495 4681764 . . . . .TC 6/7/2005 830 930 2 90 NONE ON623 H 3 429510 4681768 . . . . .TC 6/7/2005 830 930 2 90 NONE ON623 H 4 429508 4681800 . . . . .TC 6/7/2005 830 930 2 90 NONE ON623 H 5 429511 4681817 . . . . .TC 6/7/2005 830 930 2 90 NONE ON623 H 6 429508 4681845 . . . . .TC 6/7/2005 830 930 2 90 NONE ON623 J 1 429633 4682732 . . . . .TC 6/7/2005 830 930 2 90 NONE ON623 J 2 429618 4682764 . . . . .TC 6/7/2005 830 930 2 90 NONE ON623 J 3 429623 4682781 . . . . .TC 6/7/2005 830 930 2 90 NONE ON623 J 4 429618 4682796 WOFR 21 . unk n/aTC 6/7/2005 830 930 2 90 NONE ON623 J 5 429612 4682816 . . . . .TC 6/7/2005 830 930 2 90 NONE ON623 J 6 429614 4682840 . . . . .TC 7/7/2005 800 930 3 40 NONE ON622 C 1 427898 4680158 . . . . .TC 7/7/2005 800 930 3 40 NONE ON622 C 2 427902 4680173 . . . . .
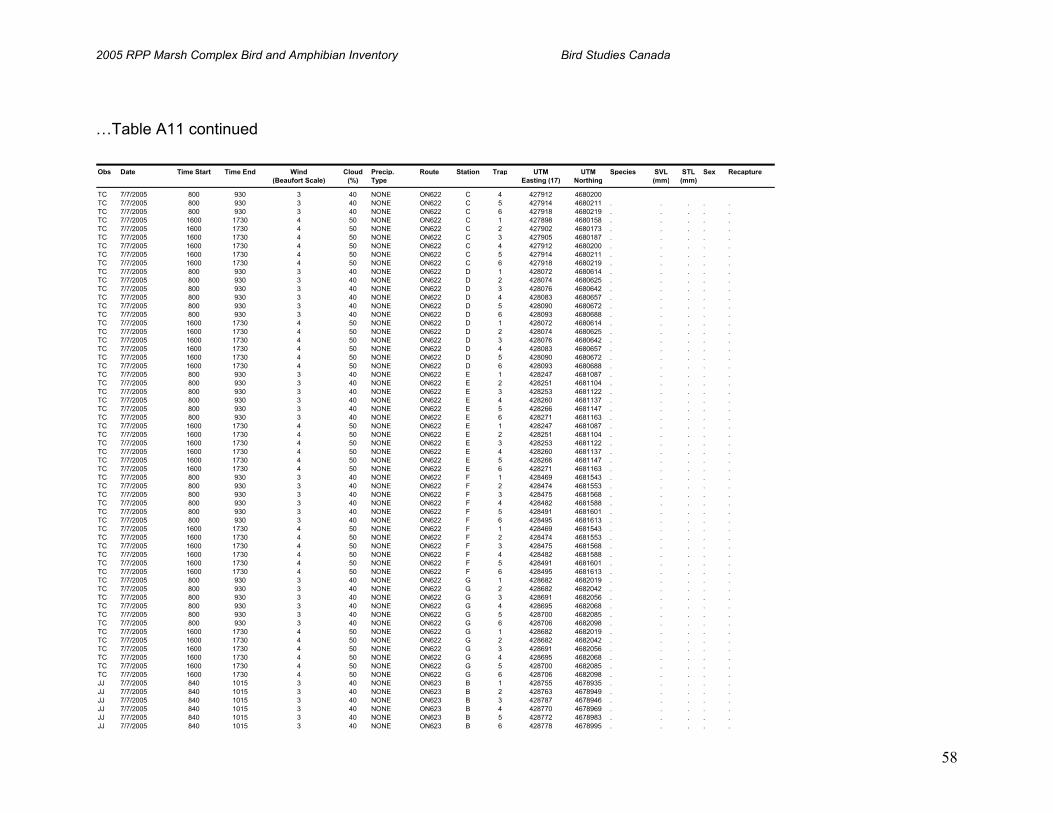
2005 RPP Marsh Complex Bird and Amphibian Inventory Bird Studies Canada
58
…Table A11 continued
Obs Date Time Start Time End Wind Cloud Precip. Route Station Trap UTM UTM Species SVL STL Sex Recapture(Beaufort Scale) (%) Type Easting (17) Northing (mm) (mm)
TC 7/7/2005 800 930 3 40 NONE ON622 C 4 427912 4680200TC 7/7/2005 800 930 3 40 NONE ON622 C 5 427914 4680211 . . . . .TC 7/7/2005 800 930 3 40 NONE ON622 C 6 427918 4680219 . . . . .TC 7/7/2005 1600 1730 4 50 NONE ON622 C 1 427898 4680158 . . . . .TC 7/7/2005 1600 1730 4 50 NONE ON622 C 2 427902 4680173 . . . . .TC 7/7/2005 1600 1730 4 50 NONE ON622 C 3 427905 4680187 . . . . .TC 7/7/2005 1600 1730 4 50 NONE ON622 C 4 427912 4680200 . . . . .TC 7/7/2005 1600 1730 4 50 NONE ON622 C 5 427914 4680211 . . . . .TC 7/7/2005 1600 1730 4 50 NONE ON622 C 6 427918 4680219 . . . . .TC 7/7/2005 800 930 3 40 NONE ON622 D 1 428072 4680614 . . . . .TC 7/7/2005 800 930 3 40 NONE ON622 D 2 428074 4680625 . . . . .TC 7/7/2005 800 930 3 40 NONE ON622 D 3 428076 4680642 . . . . .TC 7/7/2005 800 930 3 40 NONE ON622 D 4 428083 4680657 . . . . .TC 7/7/2005 800 930 3 40 NONE ON622 D 5 428090 4680672 . . . . .TC 7/7/2005 800 930 3 40 NONE ON622 D 6 428093 4680688 . . . . .TC 7/7/2005 1600 1730 4 50 NONE ON622 D 1 428072 4680614 . . . . .TC 7/7/2005 1600 1730 4 50 NONE ON622 D 2 428074 4680625 . . . . .TC 7/7/2005 1600 1730 4 50 NONE ON622 D 3 428076 4680642 . . . . .TC 7/7/2005 1600 1730 4 50 NONE ON622 D 4 428083 4680657 . . . . .TC 7/7/2005 1600 1730 4 50 NONE ON622 D 5 428090 4680672 . . . . .TC 7/7/2005 1600 1730 4 50 NONE ON622 D 6 428093 4680688 . . . . .TC 7/7/2005 800 930 3 40 NONE ON622 E 1 428247 4681087 . . . . .TC 7/7/2005 800 930 3 40 NONE ON622 E 2 428251 4681104 . . . . .TC 7/7/2005 800 930 3 40 NONE ON622 E 3 428253 4681122 . . . . .TC 7/7/2005 800 930 3 40 NONE ON622 E 4 428260 4681137 . . . . .TC 7/7/2005 800 930 3 40 NONE ON622 E 5 428266 4681147 . . . . .TC 7/7/2005 800 930 3 40 NONE ON622 E 6 428271 4681163 . . . . .TC 7/7/2005 1600 1730 4 50 NONE ON622 E 1 428247 4681087 . . . . .TC 7/7/2005 1600 1730 4 50 NONE ON622 E 2 428251 4681104 . . . . .TC 7/7/2005 1600 1730 4 50 NONE ON622 E 3 428253 4681122 . . . . .TC 7/7/2005 1600 1730 4 50 NONE ON622 E 4 428260 4681137 . . . . .TC 7/7/2005 1600 1730 4 50 NONE ON622 E 5 428266 4681147 . . . . .TC 7/7/2005 1600 1730 4 50 NONE ON622 E 6 428271 4681163 . . . . .TC 7/7/2005 800 930 3 40 NONE ON622 F 1 428469 4681543 . . . . .TC 7/7/2005 800 930 3 40 NONE ON622 F 2 428474 4681553 . . . . .TC 7/7/2005 800 930 3 40 NONE ON622 F 3 428475 4681568 . . . . .TC 7/7/2005 800 930 3 40 NONE ON622 F 4 428482 4681588 . . . . .TC 7/7/2005 800 930 3 40 NONE ON622 F 5 428491 4681601 . . . . .TC 7/7/2005 800 930 3 40 NONE ON622 F 6 428495 4681613 . . . . .TC 7/7/2005 1600 1730 4 50 NONE ON622 F 1 428469 4681543 . . . . .TC 7/7/2005 1600 1730 4 50 NONE ON622 F 2 428474 4681553 . . . . .TC 7/7/2005 1600 1730 4 50 NONE ON622 F 3 428475 4681568 . . . . .TC 7/7/2005 1600 1730 4 50 NONE ON622 F 4 428482 4681588 . . . . .TC 7/7/2005 1600 1730 4 50 NONE ON622 F 5 428491 4681601 . . . . .TC 7/7/2005 1600 1730 4 50 NONE ON622 F 6 428495 4681613 . . . . .TC 7/7/2005 800 930 3 40 NONE ON622 G 1 428682 4682019 . . . . .TC 7/7/2005 800 930 3 40 NONE ON622 G 2 428682 4682042 . . . . .TC 7/7/2005 800 930 3 40 NONE ON622 G 3 428691 4682056 . . . . .TC 7/7/2005 800 930 3 40 NONE ON622 G 4 428695 4682068 . . . . .TC 7/7/2005 800 930 3 40 NONE ON622 G 5 428700 4682085 . . . . .TC 7/7/2005 800 930 3 40 NONE ON622 G 6 428706 4682098 . . . . .TC 7/7/2005 1600 1730 4 50 NONE ON622 G 1 428682 4682019 . . . . .TC 7/7/2005 1600 1730 4 50 NONE ON622 G 2 428682 4682042 . . . . .TC 7/7/2005 1600 1730 4 50 NONE ON622 G 3 428691 4682056 . . . . .TC 7/7/2005 1600 1730 4 50 NONE ON622 G 4 428695 4682068 . . . . .TC 7/7/2005 1600 1730 4 50 NONE ON622 G 5 428700 4682085 . . . . .TC 7/7/2005 1600 1730 4 50 NONE ON622 G 6 428706 4682098 . . . . .JJ 7/7/2005 840 1015 3 40 NONE ON623 B 1 428755 4678935 . . . . .JJ 7/7/2005 840 1015 3 40 NONE ON623 B 2 428763 4678949 . . . . .JJ 7/7/2005 840 1015 3 40 NONE ON623 B 3 428787 4678946 . . . . .JJ 7/7/2005 840 1015 3 40 NONE ON623 B 4 428770 4678969 . . . . .JJ 7/7/2005 840 1015 3 40 NONE ON623 B 5 428772 4678983 . . . . .JJ 7/7/2005 840 1015 3 40 NONE ON623 B 6 428778 4678995 . . . . .

2005 RPP Marsh Complex Bird and Amphibian Inventory Bird Studies Canada
59
…Table A11 continued
Obs Date Time Start Time End Wind Cloud Precip. Route Station Trap UTM UTM Species SVL STL Sex Recapture(Beaufort Scale) (%) Type Easting (17) Northing (mm) (mm)
TC 8/7/2005 830 1015 2 10 NONE ON622 D 4 428083 4680657 . . . . .TC 8/7/2005 830 1015 2 10 NONE ON622 D 5 428090 4680672 . . . . .TC 8/7/2005 830 1015 2 10 NONE ON622 D 6 428093 4680688 . . . . .TC 8/7/2005 830 1015 2 10 NONE ON622 E 1 428247 4681087 . . . . .TC 8/7/2005 830 1015 2 10 NONE ON622 E 2 428251 4681104 . . . . .TC 8/7/2005 830 1015 2 10 NONE ON622 E 3 428253 4681122 . . . . .TC 8/7/2005 830 1015 2 10 NONE ON622 E 4 428260 4681137 . . . . .TC 8/7/2005 830 1015 2 10 NONE ON622 E 5 428266 4681147 . . . . .TC 8/7/2005 830 1015 2 10 NONE ON622 E 6 428271 4681163 . . . . .TC 8/7/2005 830 1015 2 10 NONE ON622 F 1 428469 4681543 . . . . .TC 8/7/2005 830 1015 2 10 NONE ON622 F 2 428474 4681553 . . . . .TC 8/7/2005 830 1015 2 10 NONE ON622 F 3 428475 4681568 . . . . .TC 8/7/2005 830 1015 2 10 NONE ON622 F 4 428482 4681588 . . . . .TC 8/7/2005 830 1015 2 10 NONE ON622 F 5 428491 4681601 . . . . .TC 8/7/2005 830 1015 2 10 NONE ON622 F 6 428495 4681613 . . . . .TC 8/7/2005 830 1015 2 10 NONE ON622 G 1 428682 4682019 . . . . .TC 8/7/2005 830 1015 2 10 NONE ON622 G 2 428682 4682042 . . . . .TC 8/7/2005 830 1015 2 10 NONE ON622 G 3 428691 4682056 . . . . .TC 8/7/2005 830 1015 2 10 NONE ON622 G 4 428695 4682068 . . . . .TC 8/7/2005 830 1015 2 10 NONE ON622 G 5 428700 4682085 . . . . .TC 8/7/2005 830 1015 2 10 NONE ON622 G 6 428706 4682098 . . . . .JJ 8/7/2005 830 1015 2 10 NONE ON623 B 1 428755 4678935 . . . . .JJ 8/7/2005 830 1015 2 10 NONE ON623 B 2 428763 4678949 . . . . .JJ 8/7/2005 830 1015 2 10 NONE ON623 B 3 428787 4678946 . . . . .JJ 8/7/2005 830 1015 2 10 NONE ON623 B 4 428770 4678969 . . . . .JJ 8/7/2005 830 1015 2 10 NONE ON623 B 5 428772 4678983 . . . . .JJ 8/7/2005 830 1015 2 10 NONE ON623 B 6 428778 4678995 . . . . .JJ 8/7/2005 830 1015 2 10 NONE ON623 D 1 429078 4679839 . . . . .JJ 8/7/2005 830 1015 2 10 NONE ON623 D 2 429077 4679846 . . . . .JJ 8/7/2005 830 1015 2 10 NONE ON623 D 3 429073 4679866 . . . . .JJ 8/7/2005 830 1015 2 10 NONE ON623 D 4 429077 4679880 . . . . .JJ 8/7/2005 830 1015 2 10 NONE ON623 D 5 429089 4679896 . . . . .JJ 8/7/2005 830 1015 2 10 NONE ON623 D 6 429086 4679910 . . . . .JJ 8/7/2005 830 1015 2 10 NONE ON623 F 1 429308 4680835 . . . . .JJ 8/7/2005 830 1015 2 10 NONE ON623 F 2 429304 4680831 . . . . .JJ 8/7/2005 830 1015 2 10 NONE ON623 F 3 429306 4680832 . . . . .JJ 8/7/2005 830 1015 2 10 NONE ON623 F 4 429305 4680834 . . . . .JJ 8/7/2005 830 1015 2 10 NONE ON623 F 5 429307 4680843 . . . . .JJ 8/7/2005 830 1015 2 10 NONE ON623 F 6 429305 4680872 . . . . .JJ 8/7/2005 830 1015 2 10 NONE ON623 H 1 429501 4681751 . . . . .JJ 8/7/2005 830 1015 2 10 NONE ON623 H 2 429495 4681764 . . . . .JJ 8/7/2005 830 1015 2 10 NONE ON623 H 3 429510 4681768 . . . . .JJ 8/7/2005 830 1015 2 10 NONE ON623 H 4 429508 4681800 . . . . .JJ 8/7/2005 830 1015 2 10 NONE ON623 H 5 429511 4681817 . . . . .JJ 8/7/2005 830 1015 2 10 NONE ON623 H 6 429508 4681845 WOFR 19.5 . unk .JJ 8/7/2005 830 1015 2 10 NONE ON623 H 6 429508 4681845 WOFR 18 . unk .JJ 8/7/2005 830 1015 2 10 NONE ON623 J 1 429633 4682732 WOFR 19 . unk .JJ 8/7/2005 830 1015 2 10 NONE ON623 J 2 429618 4682764 WOFR 19 . unk .JJ 8/7/2005 830 1015 2 10 NONE ON623 J 2 429618 4682764 WOFR 20 . unk .JJ 8/7/2005 830 1015 2 10 NONE ON623 J 3 429623 4682781 . . . . .JJ 8/7/2005 830 1015 2 10 NONE ON623 J 4 429618 4682796 WOFR 17.5 . unk .JJ 8/7/2005 830 1015 2 10 NONE ON623 J 5 429612 4682816 WOFR 18.5 . unk .JJ 8/7/2005 830 1015 2 10 NONE ON623 J 5 429612 4682816 WOFR 18 . unk .JJ 8/7/2005 830 1015 2 10 NONE ON623 J 6 429614 4682840 . . . . .TC 9/8/2005 900 1030 3 0 NONE ON622 C 1 427898 4680158 . . . . .TC 9/8/2005 900 1030 3 0 NONE ON622 C 2 427902 4680173 . . . . .TC 9/8/2005 900 1030 3 0 NONE ON622 C 3 427905 4680187 . . . . .TC 9/8/2005 900 1030 3 0 NONE ON622 C 4 427912 4680200 . . . . .TC 9/8/2005 900 1030 3 0 NONE ON622 C 5 427914 4680211 . . . . .TC 9/8/2005 900 1030 3 0 NONE ON622 C 6 427918 4680219 . . . . .TC 9/8/2005 900 1030 3 0 NONE ON622 D 1 428072 4680614 . . . . .TC 9/8/2005 900 1030 3 0 NONE ON622 D 2 428074 4680625 . . . . .TC 9/8/2005 900 1030 3 0 NONE ON622 D 3 428076 4680642 . . . . .

2005 RPP Marsh Complex Bird and Amphibian Inventory Bird Studies Canada
60
…Table A11 continued
Obs Date Time Start Time End Wind Cloud Precip. Route Station Trap UTM UTM Species SVL STL Sex Recapture(Beaufort Scale) (%) Type Easting (17) Northing (mm) (mm)
TC 10/8/2005 900 1030 3 0 DAMP(haze) ON622 E 1 428247 4681087 . . . . .TC 10/8/2005 900 1030 3 0 DAMP(haze) ON622 E 2 428251 4681104 . . . . .TC 10/8/2005 900 1030 3 0 DAMP(haze) ON622 E 3 428253 4681122 . . . . .TC 10/8/2005 900 1030 3 0 DAMP(haze) ON622 E 4 428260 4681137 . . . . .TC 10/8/2005 900 1030 3 0 DAMP(haze) ON622 E 5 428266 4681147 . . . . .TC 10/8/2005 900 1030 3 0 DAMP(haze) ON622 E 6 428271 4681163 . . . . .TC 10/8/2005 900 1030 3 0 DAMP(haze) ON622 F 1 428469 4681543 . . . . .TC 10/8/2005 900 1030 3 0 DAMP(haze) ON622 F 2 428474 4681553 NLFR 42 . unk NTC 10/8/2005 900 1030 3 0 DAMP(haze) ON622 F 3 428475 4681568 . . . . .TC 10/8/2005 900 1030 3 0 DAMP(haze) ON622 F 4 428482 4681588 . . . . .TC 10/8/2005 900 1030 3 0 DAMP(haze) ON622 F 5 428491 4681601 . . . . .TC 10/8/2005 900 1030 3 0 DAMP(haze) ON622 F 6 428495 4681613 . . . . .TC 10/8/2005 900 1030 3 0 DAMP(haze) ON622 G 1 428682 4682019 . . . . .TC 10/8/2005 900 1030 3 0 DAMP(haze) ON622 G 2 428682 4682042 . . . . .TC 10/8/2005 900 1030 3 0 DAMP(haze) ON622 G 3 428691 4682056 . . . . .TC 10/8/2005 900 1030 3 0 DAMP(haze) ON622 G 4 428695 4682068 . . . . .TC 10/8/2005 900 1030 3 0 DAMP(haze) ON622 G 5 428700 4682085 . . . . .TC 10/8/2005 900 1030 3 0 DAMP(haze) ON622 G 6 428706 4682098 . . . . .TC 10/8/2005 1100 1230 3 0 NONE ON623 B 1 428755 4678935 AMTO 29.5 . unk NTC 10/8/2005 1100 1230 3 0 NONE ON623 B 2 428763 4678949 . . . . .TC 10/8/2005 1100 1230 3 0 NONE ON623 B 3 428787 4678946 . . . . .TC 10/8/2005 1100 1230 3 0 NONE ON623 B 4 428770 4678969 . . . . .TC 10/8/2005 1100 1230 3 0 NONE ON623 B 5 428772 4678983 . . . . .TC 10/8/2005 1100 1230 3 0 NONE ON623 B 6 428778 4678995 . . . . .TC 10/8/2005 1100 1230 3 0 NONE ON623 D 1 429078 4679839 . . . . .TC 10/8/2005 1100 1230 3 0 NONE ON623 D 2 429077 4679846 . . . . .TC 10/8/2005 1100 1230 3 0 NONE ON623 D 3 429073 4679866 . . . . .TC 10/8/2005 1100 1230 3 0 NONE ON623 D 4 429077 4679880 . . . . .TC 10/8/2005 1100 1230 3 0 NONE ON623 D 5 429089 4679896 . . . . .TC 10/8/2005 1100 1230 3 0 NONE ON623 D 6 429086 4679910 . . . . .TC 10/8/2005 1100 1230 3 0 NONE ON623 F 1 429308 4680835 . . . . .TC 10/8/2005 1100 1230 3 0 NONE ON623 F 2 429304 4680831 . . . . .TC 10/8/2005 1100 1230 3 0 NONE ON623 F 3 429306 4680832 . . . . .TC 10/8/2005 1100 1230 3 0 NONE ON623 F 4 429305 4680834 . . . . .TC 10/8/2005 1100 1230 3 0 NONE ON623 F 5 429307 4680843 . . . . .TC 10/8/2005 1100 1230 3 0 NONE ON623 F 6 429305 4680872 . . . . .TC 10/8/2005 1100 1230 3 0 NONE ON623 H 1 429501 4681751 . . . . .TC 10/8/2005 1100 1230 3 0 NONE ON623 H 2 429495 4681764 . . . . .TC 10/8/2005 1100 1230 3 0 NONE ON623 H 3 429510 4681768 . . . . .TC 10/8/2005 1100 1230 3 0 NONE ON623 H 4 429508 4681800 . . . . .TC 10/8/2005 1100 1230 3 0 NONE ON623 H 5 429511 4681817 . . . . .TC 10/8/2005 1100 1230 3 0 NONE ON623 H 6 429508 4681845 . . . . .TC 10/8/2005 1100 1230 3 0 NONE ON623 J 1 429633 4682732 . . . . .TC 10/8/2005 1100 1230 3 0 NONE ON623 J 2 429618 4682764 . . . . .TC 10/8/2005 1100 1230 3 0 NONE ON623 J 3 429623 4682781 . . . . .TC 10/8/2005 1100 1230 3 0 NONE ON623 J 4 429618 4682796 . . . . .TC 10/8/2005 1100 1230 3 0 NONE ON623 J 5 429612 4682816 . . . . .TC 10/8/2005 1100 1230 3 0 NONE ON623 J 6 429614 4682840 . . . . .TC 11/8/2005 830 1000 4 70 NONE ON622 C 1 427898 4680158 . . . . .TC 11/8/2005 830 1000 4 70 NONE ON622 C 2 427902 4680173 . . . . .TC 11/8/2005 830 1000 4 70 NONE ON622 C 3 427905 4680187 . . . . .TC 11/8/2005 830 1000 4 70 NONE ON622 C 4 427912 4680200 . . . . .TC 11/8/2005 830 1000 4 70 NONE ON622 C 5 427914 4680211 . . . . .TC 11/8/2005 830 1000 4 70 NONE ON622 C 6 427918 4680219 . . . . .TC 11/8/2005 830 1000 4 70 NONE ON622 D 1 428072 4680614 NLFR 38 . unk NTC 11/8/2005 830 1000 4 70 NONE ON622 D 2 428074 4680625 . . . . .TC 11/8/2005 830 1000 4 70 NONE ON622 D 3 428076 4680642 . . . . .TC 11/8/2005 830 1000 4 70 NONE ON622 D 4 428083 4680657 . . . . .TC 11/8/2005 830 1000 4 70 NONE ON622 D 5 428090 4680672 . . . . .TC 11/8/2005 830 1000 4 70 NONE ON622 D 6 428093 4680688 . . . . .TC 11/8/2005 830 1000 4 70 NONE ON622 E 1 428247 4681087 . . . . .TC 11/8/2005 830 1000 4 70 NONE ON622 E 2 428251 4681104 . . . . .TC 11/8/2005 830 1000 4 70 NONE ON622 E 3 428253 4681122 . . . . .
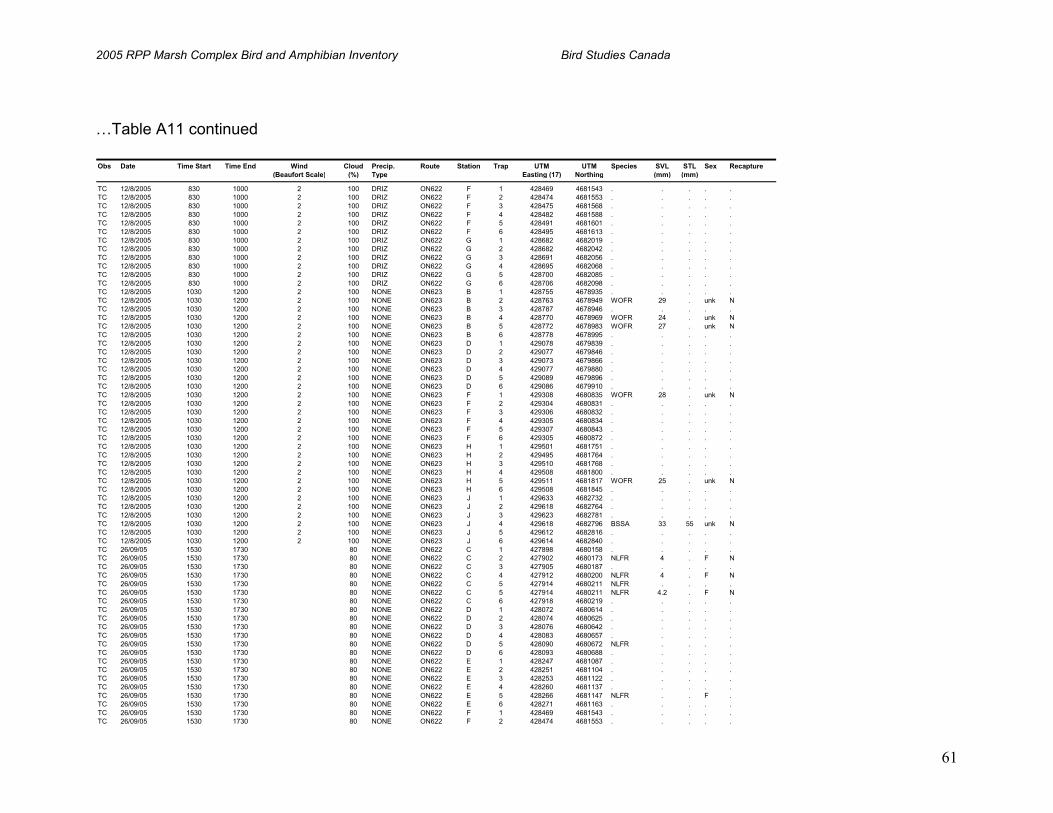
2005 RPP Marsh Complex Bird and Amphibian Inventory Bird Studies Canada
61
…Table A11 continued
Obs Date Time Start Time End Wind Cloud Precip. Route Station Trap UTM UTM Species SVL STL Sex Recapture(Beaufort Scale) (%) Type Easting (17) Northing (mm) (mm)
TC 12/8/2005 830 1000 2 100 DRIZ ON622 F 1 428469 4681543 . . . . .TC 12/8/2005 830 1000 2 100 DRIZ ON622 F 2 428474 4681553 . . . . .TC 12/8/2005 830 1000 2 100 DRIZ ON622 F 3 428475 4681568 . . . . .TC 12/8/2005 830 1000 2 100 DRIZ ON622 F 4 428482 4681588 . . . . .TC 12/8/2005 830 1000 2 100 DRIZ ON622 F 5 428491 4681601 . . . . .TC 12/8/2005 830 1000 2 100 DRIZ ON622 F 6 428495 4681613 . . . . .TC 12/8/2005 830 1000 2 100 DRIZ ON622 G 1 428682 4682019 . . . . .TC 12/8/2005 830 1000 2 100 DRIZ ON622 G 2 428682 4682042 . . . . .TC 12/8/2005 830 1000 2 100 DRIZ ON622 G 3 428691 4682056 . . . . .TC 12/8/2005 830 1000 2 100 DRIZ ON622 G 4 428695 4682068 . . . . .TC 12/8/2005 830 1000 2 100 DRIZ ON622 G 5 428700 4682085 . . . . .TC 12/8/2005 830 1000 2 100 DRIZ ON622 G 6 428706 4682098 . . . . .TC 12/8/2005 1030 1200 2 100 NONE ON623 B 1 428755 4678935 . . . . .TC 12/8/2005 1030 1200 2 100 NONE ON623 B 2 428763 4678949 WOFR 29 . unk NTC 12/8/2005 1030 1200 2 100 NONE ON623 B 3 428787 4678946 . . . . .TC 12/8/2005 1030 1200 2 100 NONE ON623 B 4 428770 4678969 WOFR 24 . unk NTC 12/8/2005 1030 1200 2 100 NONE ON623 B 5 428772 4678983 WOFR 27 . unk NTC 12/8/2005 1030 1200 2 100 NONE ON623 B 6 428778 4678995 . . . . .TC 12/8/2005 1030 1200 2 100 NONE ON623 D 1 429078 4679839 . . . . .TC 12/8/2005 1030 1200 2 100 NONE ON623 D 2 429077 4679846 . . . . .TC 12/8/2005 1030 1200 2 100 NONE ON623 D 3 429073 4679866 . . . . .TC 12/8/2005 1030 1200 2 100 NONE ON623 D 4 429077 4679880 . . . . .TC 12/8/2005 1030 1200 2 100 NONE ON623 D 5 429089 4679896 . . . . .TC 12/8/2005 1030 1200 2 100 NONE ON623 D 6 429086 4679910 . . . . .TC 12/8/2005 1030 1200 2 100 NONE ON623 F 1 429308 4680835 WOFR 28 . unk NTC 12/8/2005 1030 1200 2 100 NONE ON623 F 2 429304 4680831 . . . . .TC 12/8/2005 1030 1200 2 100 NONE ON623 F 3 429306 4680832 . . . . .TC 12/8/2005 1030 1200 2 100 NONE ON623 F 4 429305 4680834 . . . . .TC 12/8/2005 1030 1200 2 100 NONE ON623 F 5 429307 4680843 . . . . .TC 12/8/2005 1030 1200 2 100 NONE ON623 F 6 429305 4680872 . . . . .TC 12/8/2005 1030 1200 2 100 NONE ON623 H 1 429501 4681751 . . . . .TC 12/8/2005 1030 1200 2 100 NONE ON623 H 2 429495 4681764 . . . . .TC 12/8/2005 1030 1200 2 100 NONE ON623 H 3 429510 4681768 . . . . .TC 12/8/2005 1030 1200 2 100 NONE ON623 H 4 429508 4681800 . . . . .TC 12/8/2005 1030 1200 2 100 NONE ON623 H 5 429511 4681817 WOFR 25 . unk NTC 12/8/2005 1030 1200 2 100 NONE ON623 H 6 429508 4681845 . . . . .TC 12/8/2005 1030 1200 2 100 NONE ON623 J 1 429633 4682732 . . . . .TC 12/8/2005 1030 1200 2 100 NONE ON623 J 2 429618 4682764 . . . . .TC 12/8/2005 1030 1200 2 100 NONE ON623 J 3 429623 4682781 . . . . .TC 12/8/2005 1030 1200 2 100 NONE ON623 J 4 429618 4682796 BSSA 33 55 unk NTC 12/8/2005 1030 1200 2 100 NONE ON623 J 5 429612 4682816 . . . . .TC 12/8/2005 1030 1200 2 100 NONE ON623 J 6 429614 4682840 . . . . .TC 26/09/05 1530 1730 80 NONE ON622 C 1 427898 4680158 . . . . .TC 26/09/05 1530 1730 80 NONE ON622 C 2 427902 4680173 NLFR 4 . F NTC 26/09/05 1530 1730 80 NONE ON622 C 3 427905 4680187 . . . . .TC 26/09/05 1530 1730 80 NONE ON622 C 4 427912 4680200 NLFR 4 . F NTC 26/09/05 1530 1730 80 NONE ON622 C 5 427914 4680211 NLFR . . . .TC 26/09/05 1530 1730 80 NONE ON622 C 5 427914 4680211 NLFR 4.2 . F NTC 26/09/05 1530 1730 80 NONE ON622 C 6 427918 4680219 . . . . .TC 26/09/05 1530 1730 80 NONE ON622 D 1 428072 4680614 . . . . .TC 26/09/05 1530 1730 80 NONE ON622 D 2 428074 4680625 . . . . .TC 26/09/05 1530 1730 80 NONE ON622 D 3 428076 4680642 . . . . .TC 26/09/05 1530 1730 80 NONE ON622 D 4 428083 4680657 . . . . .TC 26/09/05 1530 1730 80 NONE ON622 D 5 428090 4680672 NLFR . . . .TC 26/09/05 1530 1730 80 NONE ON622 D 6 428093 4680688 . . . . .TC 26/09/05 1530 1730 80 NONE ON622 E 1 428247 4681087 . . . . .TC 26/09/05 1530 1730 80 NONE ON622 E 2 428251 4681104 . . . . .TC 26/09/05 1530 1730 80 NONE ON622 E 3 428253 4681122 . . . . .TC 26/09/05 1530 1730 80 NONE ON622 E 4 428260 4681137 . . . . .TC 26/09/05 1530 1730 80 NONE ON622 E 5 428266 4681147 NLFR . . F .TC 26/09/05 1530 1730 80 NONE ON622 E 6 428271 4681163 . . . . .TC 26/09/05 1530 1730 80 NONE ON622 F 1 428469 4681543 . . . . .TC 26/09/05 1530 1730 80 NONE ON622 F 2 428474 4681553 . . . . .

2005 RPP Marsh Complex Bird and Amphibian Inventory Bird Studies Canada
62
…Table A11 continued
Obs Date Time Start Time End Wind Cloud Precip. Route Station Trap UTM UTM Species SVL STL Sex Recapture(Beaufort Scale) (%) Type Easting (17) Northing (mm) (mm)
TC 26/09/05 1530 1730 80 NONE ON622 F 3 428475 4681568 BSSA 4.1 7 . NTC 26/09/05 1530 1730 80 NONE ON622 F 4 428482 4681588 BSSA 5.9 10.3 . NTC 26/09/05 1530 1730 80 NONE ON622 F 5 428491 4681601 . . . . .TC 26/09/05 1530 1730 80 NONE ON622 F 6 428495 4681613 . . . . .TC 26/09/05 1530 1730 80 NONE ON622 G 1 428682 4682019 . . . . .TC 26/09/05 1530 1730 80 NONE ON622 G 2 428682 4682042 . . . . .TC 26/09/05 1530 1730 80 NONE ON622 G 3 428691 4682056 . . . . .TC 26/09/05 1530 1730 80 NONE ON622 G 4 428695 4682068 . . . . .TC 26/09/05 1530 1730 80 NONE ON622 G 5 428700 4682085 . . . . .TC 26/09/05 1530 1730 80 NONE ON622 G 6 428706 4682098 . . . . .TC 26/9/05 900 1300 100 DRIZ ON623 B 1 428755 4678935 BSSA 3.7 5.9 . NTC 26/9/05 900 1300 100 DRIZ ON623 B 1 428755 4678935 NLFR 3.9 . . NTC 26/9/05 900 1300 100 DRIZ ON623 B 1 428755 4678935 WOFR 3 . . NTC 26/9/05 900 1300 100 DRIZ ON623 B 1 428755 4678935 WOFR 3.1 . . NTC 26/9/05 900 1300 100 DRIZ ON623 B 1 428755 4678935 NLFR 4.1 . . NTC 26/9/05 900 1300 100 DRIZ ON623 B 2 428763 4678949 WOFR 3.9 . M NTC 26/9/05 900 1300 100 DRIZ ON623 B 3 428787 4678946 . . . . .TC 26/9/05 900 1300 100 DRIZ ON623 B 4 428770 4678969 . . . . .TC 26/9/05 900 1300 100 DRIZ ON623 B 5 428772 4678983 NLFR 3.8 . M? NTC 26/9/05 900 1300 100 DRIZ ON623 B 6 428778 4678995 WOFR 4.1 . M NTC 26/9/05 900 1300 100 DRIZ ON623 D 1 429078 4679839 AMTO 3.9 . F NTC 26/9/05 900 1300 100 DRIZ ON623 D 1 429078 4679839 WOFR 2.8 . . NTC 26/9/05 900 1300 100 DRIZ ON623 D 1 429078 4679839 BSSA 3.7 6.4 . NTC 26/9/05 900 1300 100 DRIZ ON623 D 2 429077 4679846 WOFR 4 . M NTC 26/9/05 900 1300 100 DRIZ ON623 D 2 429077 4679846 BSSA 4.7 8.3 M NTC 26/9/05 900 1300 100 DRIZ ON623 D 3 429073 4679866 . . . . .TC 26/9/05 900 1300 100 DRIZ ON623 D 4 429077 4679880 . . . . .TC 26/9/05 900 1300 100 DRIZ ON623 D 5 429089 4679896 . . . . .TC 26/9/05 900 1300 100 DRIZ ON623 D 6 429086 4679910 WOFR 2.7 . . NTC 26/9/05 900 1300 100 DRIZ ON623 D 6 429086 4679910 BSSA 5.8 8.1 . NTC 26/9/05 900 1300 100 DRIZ ON623 F 1 429308 4680835 WOFR 3 . . NTC 26/9/05 900 1300 100 DRIZ ON623 F 2 429304 4680831 . . . . .TC 26/9/05 900 1300 100 DRIZ ON623 F 3 429306 4680832 . . . . .TC 26/9/05 900 1300 100 DRIZ ON623 F 4 429305 4680834 . . . . .TC 26/9/05 900 1300 100 DRIZ ON623 F 5 429307 4680843 NLFR 4.1 . F NTC 26/9/05 900 1300 100 DRIZ ON623 F 6 429305 4680872 . . . . .TC 26/9/05 900 1300 100 DRIZ ON623 H 1 429501 4681751 . . . . .TC 26/9/05 900 1300 100 DRIZ ON623 H 2 429495 4681764 . . . . .TC 26/9/05 900 1300 100 DRIZ ON623 H 3 429510 4681768 NLFR 4.2 . M NTC 26/9/05 900 1300 100 DRIZ ON623 H 3 429510 4681768 WOFR 3.6 . M NTC 26/9/05 900 1300 100 DRIZ ON623 H 3 429510 4681768 WOFR 2.4 . . NTC 26/9/05 900 1300 100 DRIZ ON623 H 4 429508 4681800 NLFR 3.5 . . NTC 26/9/05 900 1300 100 DRIZ ON623 H 5 429511 4681817 . . . . .TC 26/9/05 900 1300 100 DRIZ ON623 H 6 429508 4681845 NLFR . . . .TC 26/9/05 900 1300 100 DRIZ ON623 H 6 429508 4681845 WOFR 3 . . NTC 26/9/05 900 1300 100 DRIZ ON623 J 1 429633 4682732 WOFR 3.5 . M NTC 26/9/05 900 1300 100 DRIZ ON623 J 2 429618 4682764 NLFR 3.6 . F NTC 26/9/05 900 1300 100 DRIZ ON623 J 3 429623 4682781 . . . . .TC 26/9/05 900 1300 100 DRIZ ON623 J 4 429618 4682796 NLFR 4.1 . F NTC 26/9/05 900 1300 100 DRIZ ON623 J 5 429612 4682816 . . . . .TC 26/9/05 900 1300 100 DRIZ ON623 J 6 429614 4682840 NLFR 3.9 . M NTC 27/09/05 1030 1200 2 0 NONE ON622 C 1 427898 4680158 . . . . .TC 27/09/05 1030 1200 2 0 NONE ON622 C 2 427902 4680173 . . . . .TC 27/09/05 1030 1200 2 0 NONE ON622 C 3 427905 4680187 . . . . .TC 27/09/05 1030 1200 2 0 NONE ON622 C 4 427912 4680200 . . . . .TC 27/09/05 1030 1200 2 0 NONE ON622 C 5 427914 4680211 . . . . .TC 27/09/05 1030 1200 2 0 NONE ON622 C 6 427918 4680219 . . . . .

2005 RPP Marsh Complex Bird and Amphibian Inventory Bird Studies Canada
63
…Table A11 continued
Obs Date Time Start Time End Wind Cloud Precip. Route Station Trap UTM UTM Species SVL STL Sex Recapture(Beaufort Scale) (%) Type Easting (17) Northing (mm) (mm)
TC 27/09/05 1030 1200 2 0 NONE ON622 D 1 428072 4680614 . . . . .TC 27/09/05 1030 1200 2 0 NONE ON622 D 2 428074 4680625 . . . . .TC 27/09/05 1030 1200 2 0 NONE ON622 D 3 428076 4680642 . . . . .TC 27/09/05 1030 1200 2 0 NONE ON622 D 4 428083 4680657 . . . . .TC 27/09/05 1030 1200 2 0 NONE ON622 D 5 428090 4680672 . . . . .TC 27/09/05 1030 1200 2 0 NONE ON622 D 6 428093 4680688 . . . . .TC 27/09/05 1030 1200 2 0 NONE ON622 E 1 428247 4681087 . . . . .TC 27/09/05 1030 1200 2 0 NONE ON622 E 2 428251 4681104 . . . . .TC 27/09/05 1030 1200 2 0 NONE ON622 E 3 428253 4681122 . . . . .TC 27/09/05 1030 1200 2 0 NONE ON622 E 4 428260 4681137 . . . . .TC 27/09/05 1030 1200 2 0 NONE ON622 E 5 428266 4681147 . . . . .TC 27/09/05 1030 1200 2 0 NONE ON622 E 6 428271 4681163 . . . . .TC 27/09/05 1030 1200 2 0 NONE ON622 F 1 428469 4681543 . . . . .TC 27/09/05 1030 1200 2 0 NONE ON622 F 2 428474 4681553 . . . . .TC 27/09/05 1030 1200 2 0 NONE ON622 F 3 428475 4681568 . . . . .TC 27/09/05 1030 1200 2 0 NONE ON622 F 4 428482 4681588 . . . . .TC 27/09/05 1030 1200 2 0 NONE ON622 F 5 428491 4681601 . . . . .TC 27/09/05 1030 1200 2 0 NONE ON622 F 6 428495 4681613 . . . . .TC 27/09/05 1030 1200 2 0 NONE ON622 G 1 428682 4682019 . . . . .TC 27/09/05 1030 1200 2 0 NONE ON622 G 2 428682 4682042 . . . . .TC 27/09/05 1030 1200 2 0 NONE ON622 G 3 428691 4682056 . . . . .TC 27/09/05 1030 1200 2 0 NONE ON622 G 4 428695 4682068 . . . . .TC 27/09/05 1030 1200 2 0 NONE ON622 G 5 428700 4682085 . . . . .TC 27/09/05 1030 1200 2 0 NONE ON622 G 6 428706 4682098 . . . . .TC 27/09/05 1030 1200 2 0 NONE ON623 B 2 428763 4678949 . . . . .TC 27/09/05 1030 1200 2 0 NONE ON623 B 3 428787 4678946 . . . . .TC 27/09/05 1030 1200 2 0 NONE ON623 B 4 428770 4678969 . . . . .TC 27/09/05 1030 1200 2 0 NONE ON623 B 5 428772 4678983 . . . . .TC 27/09/05 1030 1200 2 0 NONE ON623 B 6 428778 4678995 . . . . .TC 27/09/05 1300 1430 2 0 NONE ON623 B 1 428755 4678935 . . . . .TC 27/09/05 1030 1200 2 0 NONE ON623 D 1 429078 4679839 . . . . .TC 27/09/05 1030 1200 2 0 NONE ON623 D 2 429077 4679846 WOFR 3.2 . . NTC 27/09/05 1030 1200 2 0 NONE ON623 D 3 429073 4679866 . . . . .TC 27/09/05 1030 1200 2 0 NONE ON623 D 4 429077 4679880 WOFR 2.8 . . NTC 27/09/05 1030 1200 2 0 NONE ON623 D 5 429089 4679896 . . . . .TC 27/09/05 1030 1200 2 0 NONE ON623 D 6 429086 4679910 . . . . .TC 27/09/05 1030 1200 2 0 NONE ON623 F 1 429308 4680835 . . . . .TC 27/09/05 1030 1200 2 0 NONE ON623 F 2 429304 4680831 . . . . .TC 27/09/05 1030 1200 2 0 NONE ON623 F 3 429306 4680832 . . . . .TC 27/09/05 1030 1200 2 0 NONE ON623 F 4 429305 4680834 . . . . .TC 27/09/05 1030 1200 2 0 NONE ON623 F 5 429307 4680843 . . . . .TC 27/09/05 1030 1200 2 0 NONE ON623 F 6 429305 4680872 . . . . .TC 27/09/05 1030 1200 2 0 NONE ON623 H 1 429501 4681751 . . . . .TC 27/09/05 1030 1200 2 0 NONE ON623 H 2 429495 4681764 . . . . .TC 27/09/05 1030 1200 2 0 NONE ON623 H 3 429510 4681768 . . . . .TC 27/09/05 1030 1200 2 0 NONE ON623 H 4 429508 4681800 . . . . .TC 27/09/05 1030 1200 2 0 NONE ON623 H 5 429511 4681817 . . . . .TC 27/09/05 1030 1200 2 0 NONE ON623 H 6 429508 4681845 . . . . .TC 27/09/05 1030 1200 2 0 NONE ON623 J 1 429633 4682732 . . . . .TC 27/09/05 1030 1200 2 0 NONE ON623 J 2 429618 4682764 . . . . .TC 27/09/05 1030 1200 2 0 NONE ON623 J 3 429623 4682781 . . . . .TC 27/09/05 1030 1200 2 0 NONE ON623 J 4 429618 4682796 . . . . .TC 27/09/05 1030 1200 2 0 NONE ON623 J 5 429612 4682816 . . . . .TC 27/09/05 1030 1200 2 0 NONE ON623 J 6 429614 4682840 . . . . .TC 28/09/05 1400 1600 2 20 NONE ON622 C 1 427898 4680158 . . . . .TC 28/09/05 1400 1600 2 20 NONE ON622 C 2 427902 4680173 . . . . .TC 28/09/05 1400 1600 2 20 NONE ON622 C 3 427905 4680187 . . . . .TC 28/09/05 1400 1600 2 20 NONE ON622 C 4 427912 4680200 . . . . .TC 28/09/05 1400 1600 2 20 NONE ON622 C 5 427914 4680211 . . . . .TC 28/09/05 1400 1600 2 20 NONE ON622 C 6 427918 4680219 . . . . .TC 28/09/05 1400 1600 2 20 NONE ON622 D 1 428072 4680614 . . . . .TC 28/09/05 1400 1600 2 20 NONE ON622 D 2 428074 4680625 . . . . .TC 28/09/05 1400 1600 2 20 NONE ON622 D 3 428076 4680642 . . . . .

2005 RPP Marsh Complex Bird and Amphibian Inventory Bird Studies Canada
64
…Table A11 continued
Obs Date Time Start Time End Wind Cloud Precip. Route Station Trap UTM UTM Species SVL STL Sex Recapture(Beaufort Scale) (%) Type Easting (17) Northing (mm) (mm)
TC 28/09/05 1400 1600 2 20 NONE ON622 D 4 428083 4680657 . . . . .TC 28/09/05 1400 1600 2 20 NONE ON622 D 5 428090 4680672 . . . . .TC 28/09/05 1400 1600 2 20 NONE ON622 D 6 428093 4680688 . . . . .TC 28/09/05 1400 1600 2 20 NONE ON622 E 1 428247 4681087 . . . . .TC 28/09/05 1400 1600 2 20 NONE ON622 E 2 428251 4681104 . . . . .TC 28/09/05 1400 1600 2 20 NONE ON622 E 3 428253 4681122 . . . . .TC 28/09/05 1400 1600 2 20 NONE ON622 E 4 428260 4681137 . . . . .TC 28/09/05 1400 1600 2 20 NONE ON622 E 5 428266 4681147 . . . . .TC 28/09/05 1400 1600 2 20 NONE ON622 E 6 428271 4681163 . . . . .TC 28/09/05 1400 1600 2 20 NONE ON622 F 1 428469 4681543 . . . . .TC 28/09/05 1400 1600 2 20 NONE ON622 F 2 428474 4681553 . . . . .TC 28/09/05 1400 1600 2 20 NONE ON622 F 3 428475 4681568 . . . . .TC 28/09/05 1400 1600 2 20 NONE ON622 F 4 428482 4681588 . . . . .TC 28/09/05 1400 1600 2 20 NONE ON622 F 5 428491 4681601 . . . . .TC 28/09/05 1400 1600 2 20 NONE ON622 F 6 428495 4681613 . . . . .TC 28/09/05 1400 1600 2 20 NONE ON622 G 1 428682 4682019 . . . . .TC 28/09/05 1400 1600 2 20 NONE ON622 G 2 428682 4682042 . . . . .TC 28/09/05 1400 1600 2 20 NONE ON622 G 3 428691 4682056 . . . . .TC 28/09/05 1400 1600 2 20 NONE ON622 G 4 428695 4682068 . . . . .TC 28/09/05 1400 1600 2 20 NONE ON622 G 5 428700 4682085 . . . . .TC 28/09/05 1400 1600 2 20 NONE ON622 G 6 428706 4682098 . . . . .TC 28/09/05 930 1130 2 20 NONE ON623 B 1 428755 4678935 . . . . .TC 28/09/05 930 1130 2 20 NONE ON623 B 2 428763 4678949 . . . . .TC 28/09/05 930 1130 2 20 NONE ON623 B 3 428787 4678946 . . . . .TC 28/09/05 930 1130 2 20 NONE ON623 B 4 428770 4678969 . . . . .TC 28/09/05 930 1130 2 20 NONE ON623 B 5 428772 4678983 BSSA 4 6.9 . NTC 28/09/05 930 1130 2 20 NONE ON623 B 5 428772 4678983 BSSA 5.6 9.6 . NTC 28/09/05 930 1130 2 20 NONE ON623 B 6 428778 4678995 . . . . .TC 28/09/05 930 1130 2 20 NONE ON623 D 1 429078 4679839 . . . . .TC 28/09/05 930 1130 2 20 NONE ON623 D 2 429077 4679846 . . . . .TC 28/09/05 930 1130 2 20 NONE ON623 D 3 429073 4679866 . . . . .TC 28/09/05 930 1130 2 20 NONE ON623 D 4 429077 4679880 . . . . .TC 28/09/05 930 1130 2 20 NONE ON623 D 5 429089 4679896 . . . . .TC 28/09/05 930 1130 2 20 NONE ON623 D 6 429086 4679910 . . . . .TC 28/09/05 930 1130 2 20 NONE ON623 F 1 429308 4680835 . . . . .TC 28/09/05 930 1130 2 20 NONE ON623 F 2 429304 4680831 . . . . .TC 28/09/05 930 1130 2 20 NONE ON623 F 3 429306 4680832 . . . . .TC 28/09/05 930 1130 2 20 NONE ON623 F 4 429305 4680834 . . . . .TC 28/09/05 930 1130 2 20 NONE ON623 F 5 429307 4680843 . . . . .TC 28/09/05 930 1130 2 20 NONE ON623 F 6 429305 4680872 . . . . .TC 28/09/05 930 1130 2 20 NONE ON623 H 1 429501 4681751 . . . . .TC 28/09/05 930 1130 2 20 NONE ON623 H 2 429495 4681764 . . . . .TC 28/09/05 930 1130 2 20 NONE ON623 H 3 429510 4681768 . . . . .TC 28/09/05 930 1130 2 20 NONE ON623 H 4 429508 4681800 . . . . .TC 28/09/05 930 1130 2 20 NONE ON623 H 5 429511 4681817 . . . . .TC 28/09/05 930 1130 2 20 NONE ON623 H 6 429508 4681845 . . . . .TC 28/09/05 930 1130 2 20 NONE ON623 J 1 429633 4682732 . . . . .TC 28/09/05 930 1130 2 20 NONE ON623 J 2 429618 4682764 . . . . .TC 28/09/05 930 1130 2 20 NONE ON623 J 3 429623 4682781 . . . . .TC 28/09/05 930 1130 2 20 NONE ON623 J 4 429618 4682796 . . . . .TC 28/09/05 930 1130 2 20 NONE ON623 J 5 429612 4682816 . . . . .TC 28/09/05 930 1130 2 20 NONE ON623 J 6 429614 4682840 . . . . .

2005 RPP Marsh Complex Bird and Amphibian Inventory Bird Studies Canada
65
Table A12. Complete visual transect survey results.
yp
Observor Date Start Time End Time Wind Cloud Precip. Transect UTM UTM Distance Observations Number of(Beaufort Scale) (%) Type Easting (17) Northing Individuals
TC 26/09/05 1735 1810 4 90 DRIZ 1 428621 4682066 0-100m Nothing 0TC 26/09/05 1810 1819 4 90 DRIZ 1 428572 4681979 100-200 Little Brown snake at 105m 1TC 26/09/05 1819 1832 4 90 DRIZ 1 428540 4681884 200-300 Nothing 0TC 26/09/05 1832 1840 4 90 DRIZ 1 428499 4681797 300-400 Nothing 0TC 26/09/05 1840 1849 4 90 DRIZ 1 428458 4681701 400-500 AMTO at 454m 1TC 26/09/05 1849 1858 4 90 DRIZ 1 428418 4681606 500-600 Nothing 0TC 26/09/05 1858 1906 4 90 DRIZ 1 428377 4681511 600-700 Nothing 0TC 26/09/05 1906 1916 4 90 DRIZ 1 428336 4681416 700-800 Nothing 0TC 26/09/05 1916 1925 4 90 DRIZ 1 428296 4681321 800-900 Nothing 0RA 26/09/05 1553 1606 4 90 DRIZ 3 427652 4679771 0-100m NLFR at 87m 1RA 26/09/05 1606 1618 4 90 DRIZ 3 427686 4679861 100-200 Nothing 0RA 26/09/05 1618 1630 4 90 DRIZ 3 427719 4679957 200-300 Nothing 0RA 26/09/05 1630 1641 4 90 DRIZ 3 427751 4680052 300-400 Nothing 0RA 26/09/05 1641 1652 4 90 DRIZ 3 427784 4680147 400-500 Nothing 0RA 26/09/05 1652 1704 4 90 DRIZ 3 427809 4680242 500-600 NLFR at 576m 1RA 26/09/05 1704 1712 4 90 DRIZ 3 427849 4680330 600-700 Nothing 0RA 26/09/05 1712 1722 4 90 DRIZ 3 427890 4680417 700-800 Nothing 0RA 26/09/05 1722 1727 4 90 DRIZ 3 427931 4680512 800-900 Nothing 0RA 26/09/05 1727 1744 4 90 DRIZ 3 427971 4680607 900-1000 Nothing 0RA 26/09/05 1744 1855 4 90 DRIZ 3 428012 4680694 1000-1200 NLFR at 1120 1RA 26/09/05 1744 1855 4 90 DRIZ 3 428044 4680790 1000-1200 NLFR at 1130 1RA 27/09/05 915 930 3 80 NONE 2 428765 4681337 0-100m Nothing 0RA 27/09/05 930 939 3 80 NONE 2 428750 4681437 100-200m Nothing 0RA 27/09/05 939 950 3 80 NONE 2 428775 4681532 200-300m Nothing 0RA 27/09/05 950 1006 3 80 NONE 2 428800 4681627 300-400m Nothing 0RA 27/09/05 1006 1021 3 80 NONE 2 428816 4681722 400-500m Nothing 0RA 27/09/05 1021 1039 3 80 NONE 2 428841 4681818 500-600m Nothing 0TC 28/09/05 1444 1451 4 85 NONE 4 428052 4680790 0-100m Little Brown Snake at 80m 1TC 28/09/05 1451 1503 4 85 NONE 4 428139 4680749 100-200 Nothing 0TC 28/09/05 1503 1517 4 85 NONE 4 428226 4680709 200-300 NLFR at 220m 1TC 28/09/05 1519 1523 4 85 NONE 5 428290 4680692 0-100m Nothing 0TC 28/09/05 1523 1534 4 85 NONE 5 428323 4680787 100-200 NLFR at 135m 1TC 28/09/05 1534 1545 4 85 NONE 5 428371 4680875 200-300 AMTO at 210m 1TC 28/09/05 1458 1507 4 85 NONE 6 428282 4680668 0-100m NLFR at 2m 1TC 28/09/05 1458 1507 4 85 NONE 6 428282 4680652 0-100m NLFR at 12m 1TC 28/09/05 1458 1507 4 85 NONE 6 428281 4680637 0-100m NLFR at 26m 1TC 28/09/05 1458 1507 4 85 NONE 6 428273 4680597 0-100m NLFR at 61m 1TC 28/09/05 1458 1507 4 85 NONE 6 428273 4680592 0-100m NLFR at 65m 1TC 28/09/05 1458 1507 4 85 NONE 6 428248 4680509 100-200 NLFR at 153m 1