Embed Size (px)
Citation preview
Strategic Plan for Agricultural and Rural Statistics
2016 – 2025
Department of Planning and Cooperation, Ministry of Agriculture and Forestry
Lao PDR

SPARS
STRATEGIC PLAN FOR AGRICULTURAL AND
RURAL STATISTICS
LAO PDR
2016-2025
MINISTRY OF AGRICULTURE AND FORESTRY, LAO PDR
June 2016

TABLE OF CONTENTS
i
TABLE OF CONTENTS
TABLE OF CONTENTS ....................................................................................................................................................................... i FOREWORD. ......................................................................................................................................................................................... iii ACRONYMS… ....................................................................................................................................................................................... iv ACKNOWLEDGEMENTS ................................................................................................................................................................. vi EXECUTIVE SUMMARY .................................................................................................................................................................. vii CHAPTER 1…………………………………………………………………..…………………………………………………………………..1 BACKGROUND...................................................................................................................................................................................... 1 1.1 Rationale ................................................................................................................................................................................ 1 1.2 SPARS development process ......................................................................................................................................... 2 1.3 Administrative structure of Lao PDR ........................................................................................................................ 3 1.4 Policy context and demand for agricultural and rural statistics ................................................................... 5
1.4.1 Overview of the agricultural sector in Lao PDR ..................................................................................... 5 1.4.2 Agricultural sector development strategy ............................................................................................... 6 1.4.3 National Socio-Economic Development Plans ........................................................................................ 7 1.4.4 Sustainable Development Goals ................................................................................................................... 9
1.5 Framework for the collection of statistics in Lao PDR....................................................................................... 9 1.6 Integration of agricultural and rural statistics into the NSDS ..................................................................... 10 1.7 Action plan to improve agricultural and rural statistics ................................................................................ 12 1.8 Key stakeholders ............................................................................................................................................................. 12 CHAPTER 2 16 EVALUATION ..................................................................................................................................................................................... 16 2.1 Assessment of statistics outputs ............................................................................................................................... 16
2.1.1 Censuses ............................................................................................................................................................... 16 2.1.2 Crop statistics .................................................................................................................................................... 17 2.1.3 Livestock statistics ........................................................................................................................................... 18 2.1.4 Fisheries and aquaculture statistics ......................................................................................................... 19 2.1.5 Forestry statistics ............................................................................................................................................. 19 2.1.6 Agricultural markets and prices statistics ............................................................................................. 20 2.1.7 Water and environment statistics ............................................................................................................. 20 2.1.8 Food security and nutrition statistics ...................................................................................................... 20 2.1.9 Rural development statistics ....................................................................................................................... 20 2.1.10 Other agriculture related statistics .......................................................................................................... 21
2.2 Data dissemination ......................................................................................................................................................... 22 2.3 Assessment of user satisfaction and needs .......................................................................................................... 23 2.4 Capacity assessment ...................................................................................................................................................... 25 2.5 SWOT analysis .................................................................................................................................................................. 28 CHAPTER 3 30 PLANNING 30 3.1 Vision and mission .......................................................................................................................................................... 31 3.2 Strategic goals and outputs ......................................................................................................................................... 31 3.3 Implementation ................................................................................................................................................................ 32
3.3.1 Implementation arrangements .................................................................................................................. 32 3.3.2 Action plan .......................................................................................................................................................... 32 3.3.3 Calendar of censuses and surveys .............................................................................................................. 33 3.3.4 Data release calendar .................................................................................................................................... 34 3.3.5 Advocacy-communication plan .................................................................................................................. 34 3.3.6 Monitoring and evaluation plan ................................................................................................................ 35 3.3.7 Financing ............................................................................................................................................................. 36
REFERENCES ..................................................................................................................................................................................... 39
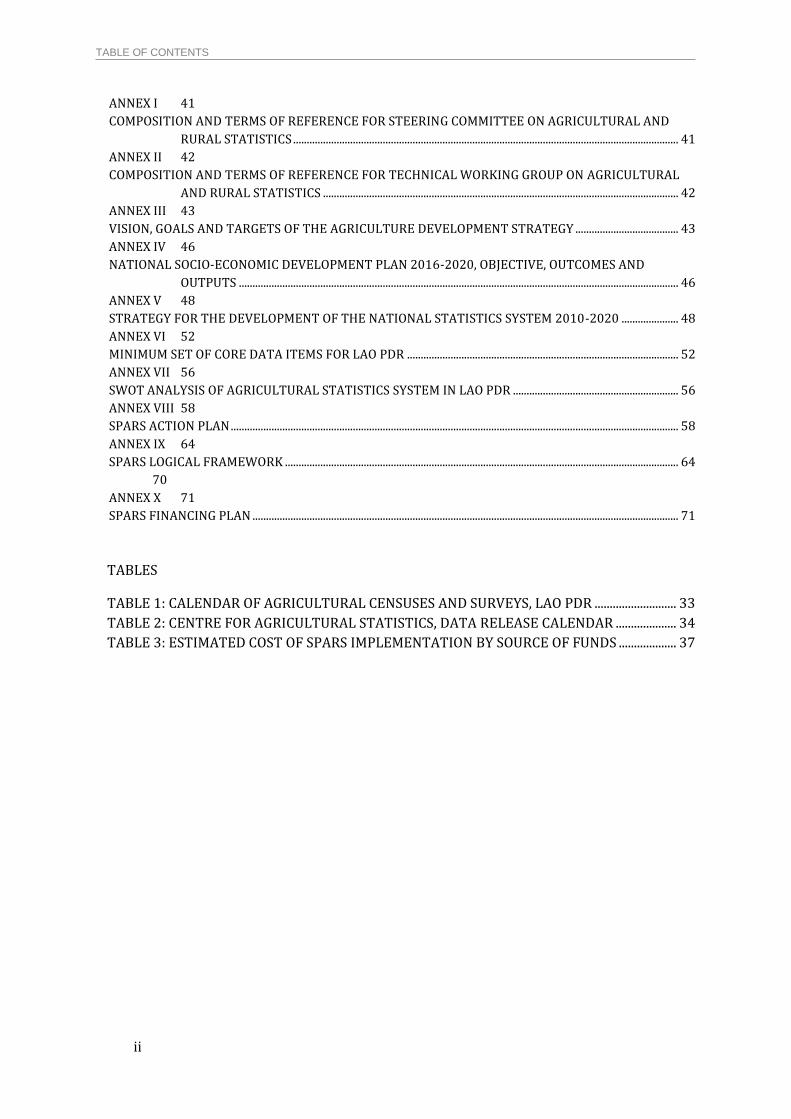
TABLE OF CONTENTS
ii
ANNEX I 41 COMPOSITION AND TERMS OF REFERENCE FOR STEERING COMMITTEE ON AGRICULTURAL AND
RURAL STATISTICS .............................................................................................................................................. 41 ANNEX II 42 COMPOSITION AND TERMS OF REFERENCE FOR TECHNICAL WORKING GROUP ON AGRICULTURAL
AND RURAL STATISTICS ................................................................................................................................... 42 ANNEX III 43 VISION, GOALS AND TARGETS OF THE AGRICULTURE DEVELOPMENT STRATEGY ...................................... 43 ANNEX IV 46 NATIONAL SOCIO-ECONOMIC DEVELOPMENT PLAN 2016-2020, OBJECTIVE, OUTCOMES AND
OUTPUTS .................................................................................................................................................................. 46 ANNEX V 48 STRATEGY FOR THE DEVELOPMENT OF THE NATIONAL STATISTICS SYSTEM 2010-2020 ..................... 48 ANNEX VI 52 MINIMUM SET OF CORE DATA ITEMS FOR LAO PDR .................................................................................................... 52 ANNEX VII 56 SWOT ANALYSIS OF AGRICULTURAL STATISTICS SYSTEM IN LAO PDR ............................................................. 56 ANNEX VIII 58 SPARS ACTION PLAN ..................................................................................................................................................................... 58 ANNEX IX 64 SPARS LOGICAL FRAMEWORK ................................................................................................................................................. 64 70 ANNEX X 71 SPARS FINANCING PLAN ............................................................................................................................................................. 71
TABLES
TABLE 1: CALENDAR OF AGRICULTURAL CENSUSES AND SURVEYS, LAO PDR ........................... 33
TABLE 2: CENTRE FOR AGRICULTURAL STATISTICS, DATA RELEASE CALENDAR .................... 34
TABLE 3: ESTIMATED COST OF SPARS IMPLEMENTATION BY SOURCE OF FUNDS ................... 37
FOREWARD
iii
FOREWORD
Lao PDR has embarked on an ambitious programme of agricultural development based on
the principle of sustained growth with equity, with a view to graduating from Least Developed
Country status by 2020. In the agricultural sector, the main aim is to improve food security
through increased agricultural productivity, to eliminate shifting cultivation, to provide
employment to the landless and those who have been re-settled, and to protect forests and
reforest degraded areas. With the emphasis on further developing the agricultural sector,
agricultural and rural statistics are assuming increasing importance.
The formulation of the National Strategy for the Development of Statistics, 2010-2020
(NSDS) was an important step in strengthening the foundation for the development of a sound
national statistics system in Lao PDR. The NSDS is a strategic statistical planning process which
provides a long-term vision for statistical development in a country and an action plan to build a
comprehensive national statistics system. The NSDS for Lao PDR seeks to make available regular
economic, social and environment statistics that are comprehensive, timely, reliable and
transparent, and that serve the purpose of monitoring and evaluating the progress of the National
Socio-Economic Development Plans. The NSDS covers statistics in all sectors, including
agriculture.
Under the Statistics Law, the primary responsibility for agricultural statistics in Lao PDR
rests with the Ministry of Agriculture and Forestry. The NSDS includes a number of measures to
improve agricultural statistics, but it is recognized that a more detailed strategy is needed to
guide the development of agricultural and rural statistics within the framework of the NSDS. The
Strategic Plan for Agricultural and Rural Statistics (SPARS) for Lao PDR, presented in this
document, serves that need.
The SPARS covers the ten-year period 2016 to 2025, with emphasis on the last five years of
the NSDS, 2016 to 2020. A results-based management approach is used for the SPARS, with the
identification of outputs and activities needed to achieve defined strategic goals for the
agricultural and rural statistics system. A monitoring and evaluation system is provided. A
financing strategy for improving agricultural and rural statistics is also presented.
The SPARS document has been prepared by the Food and Agriculture Organization of the
United Nations (FAO) in collaboration with the Lao Statistics Bureau and the Ministry of
Agriculture and Forestry, and in consultation with all key stakeholders. I thank the international
community for their support for this work.
MAF looks forward to work beginning on implementing the SPARS and is sure that this will
lead to significant improvements in the quality of agricultural and rural statistics in Lao PDR.
Minister for Agriculture and Forestry
ACRONYMS
iv
ACRONYMS
ADB Asian Development Bank
AFD Agence Française de Développement
AFSIS ASEAN Food Security Information System
ARS Action Plan for Improving Agricultural and Rural Statistics
ASEAN Association of Southeast Asian Nations
CAS Centre for Agricultural Statistics, Ministry of Agriculture and Forestry
CPH Census of Population and Housing
CPI Consumer Price Index
CSPro Census and Survey Processing System (a software package)
DAEC Department of Agricultural Extension and Cooperatives, Ministry of Agriculture and Forestry
DAFO District Agriculture and Forestry Office
DALAM Department of Agricultural Land Management, Ministry of Agriculture and Forestry
DLF Department of Livestock and Fisheries, Ministry of Agriculture and Forestry
DOA Department of Agriculture, Ministry of Agriculture and Forestry
DOF Department of Forestry, Ministry of Agriculture and Forestry
DOFI Department of Forest Inspection
DOI Department of Irrigation, Ministry of Agriculture and Forestry
DOPC Department of Planning and Cooperation, Ministry of Agriculture and Forestry
ESCAP Economic and Social Commission for Asia and the Pacific
FAO Food and Agricultural Organization of the United Nations
GDP Gross Domestic Product
GIS Geographic Information System
GIZ Gesellschaft für Internationale Zusammenarbeit
GS Global Strategy to Improve Agricultural and Rural Statistics
Ha Hectares
HS Harmonized Commodity Description and Coding System
ICT Information and Communication Technology
IdCA In-depth Country Assessment
IFAD International Fund for Agricultural Development
JICA Japan International Cooperation Agency
Kcal Kilocalories
KOICA Korea International Cooperation Agency
ACRONYMS
v
Lao PDR Lao People’s Democratic Republic
LCA 2010/11 Lao Census of Agriculture 2010/11
LECS Lao Expenditure and Consumption Survey
LNADA Lao PDR National Data Archive
LSB Lao Statistics Bureau, Ministry of Planning and Investment
M&E Monitoring and Evaluation
MDG Millennium Development Goal
MAF Ministry of Agriculture and Forestry
MONRE Ministry of Environment and Natural Resources
MOIC Ministry of Industry and Commerce
MPI Ministry of Planning and Investment
NAFRI National Agriculture and Forestry Research Institute, Ministry of Agriculture and Forestry
NSDS National Strategy for the Development of Statistics
NSEDP National Socio-Economic Development Plan
NUOL National University of Laos
OECD Organisation for Economic Co-operation and Development
PAFO Provincial Agriculture and Forestry Office
PARIS21 Partnership in Statistics for Development in the 21st Century
SCA Steering Committee on Agricultural and Rural Statistics
SDC Swiss Agency for Development and Cooperation
SDG Sustainable Development Goal
SIAP Statistical Institute for Asia and the Pacific
Sida Swedish International Development Agency
SNA United Nations System of National Accounts
SPARS Strategic Plan for Agricultural and Rural Statistics
SPSS Statistical Package for Social Sciences (a software package)
SWOT Strengths, Weaknesses, Opportunities, Threats
TWA Technical Working Group on Agricultural and Rural Statistics
UNDP United Nations Development Programme
VEW Village Extension Worker
WP NSDS Work Programme
ACKNOWLEDGEMENTS
vi
ACKNOWLEDGEMENTS
This document, the Strategic Plan for Agricultural and Rural Statistics (SPARS) for Lao PDR,
has been produced as part of the Global Strategy to Improve Agricultural and Rural Statistics
activities in Lao PDR, under the direction of the Asia-Pacific Regional Office for the Global Strategy
in Bangkok. A consultant provided by the Food and Agriculture Organization of the United
Nations (FAO), Mr J.A. Colwell, is the principal author of this report. The consultant worked in
collaboration with officers of the Centre for Agricultural Statistics (CAS) in the Ministry of
Agriculture and Forestry (MAF), as well as with other departments of MAF and the Lao Statistics
Bureau (LSB). Special thanks are due to Dr Phouang Parisak Pravongviengkham, Vice-Minister of
MAF, Mr Xaypladeth Choulamany, Director-General, Department of Planning and Cooperation
(DOPC) in MAF, Mr. Savanh Hanephom, Deputy Director-General of DOPC, and Ms. Phonesaly
Souksavath, Deputy Head of LSB for their contributions to the SPARS strategic planning process.
Ms. Vivanh Souvannamethy, Director, CAS and her staff also provided valuable inputs to the
preparation of this document. Thanks are also due to Mr. Boundeth Southavilay, FAO National
Consultant. The support provided by Mr. Stephen Rudgard, FAO Representative, Lao PDR, is also
acknowledged.
EXECUTIVE SUMMARY
vii
EXECUTIVE SUMMARY
Background
The Global Strategy to Improve Agricultural and Rural Statistics (GS) is an international effort
aimed at providing a framework to enable national statistical systems to produce the agricultural
and rural data needed for decision making. One of the main elements of the GS is integrating
agriculture into the national statistics system, and it is recommended that each country develop
a Strategic Plan for Agricultural and Rural Statistics (SPARS) within the framework of the National
Strategy for the Development of Statistics (NSDS). The NSDS is a strategic planning process
providing countries with a guide for the long-term improvement in the quality of official statistics.
The SPARS provides the agricultural and rural statistics component of the NSDS. The NSDS for
Lao PDR covering the period 2010-2020 is already being implemented. The present document
presents the SPARS for Lao PDR for the period 2016-2025.
The SPARS has been developed in accordance with the NSDS methodology. There were three
phases in the design of the SPARS. The launching phase covered the initial preparations for the
SPARS design and the establishment of the necessary administrative structures, including a
steering committee and a technical working group. The assessing phase involved evaluating the
current agricultural and rural statistics system and assessing the country’s capacity to improve
the statistics. An in-depth country assessment carried out under the GS served as the foundation
of this phase. The planning phase involved illustrating the SPARS itself.
For the purpose of the SPARS, agriculture covers crops, livestock, fisheries and forestry.
Agricultural and rural statistics cover agricultural production activities, as well as rural
development statistics such as employment, socio-economic characteristics and access to
services.
Policy context and demand for agricultural and rural data
Rice is the dominant crop in Lao PDR and is crucial to the economy and the country’s food security.
Cropping is becoming more diversified: maize, sugar cane, vegetables, fruit, cassava, groundnut,
tobacco, coffee, rubber and sesame are other important crops. Cattle are becoming increasingly
important. Pig raising is prevalent in upland areas. Many households raise a few chickens or ducks.
Fishing is an important secondary activity for many households. Aquaculture is becoming
increasingly important. Timber and non-timber forest products provide a wide range of
subsistence needs, as well as providing a source of income.
The Government of Lao PDR has developed a ten-year strategy for the development of the
agricultural sector for the period 2016 to 2025 and a vision for the sector to 2030. The vision is
to ensure food security and develop an efficient and competitive agricultural sector. The goals are
EXECUTIVE SUMMARY
viii
to: produce a stable supply of agricultural products; ensure production of safe food in an
environmentally friendly manner; and create employment and increase rural incomes.
Five-yearly National Socio-Economic Development Plans (NSEDPs) are formulated to guide the
development of the national economy. The Eighth NSEDP for 2016-2020 continues the emphasis
on economic growth and sustainable development, strengthening human resource capacity,
maintaining stability and widening international cooperation in order to achieve the objective of
graduating from Least Developed Country status by 2020. Agricultural and forestry elements in
NSEDP 2016-2020 are based on the agricultural development strategy.
Framework for the collection of agricultural and rural statistics
The Statistics Law of Lao PDR was enacted in June 2010. The Law provides for a partially
decentralized statistical system. The Lao Statistics Bureau (LSB) produces major national
statistics, while each line ministry compiles statistics for its sector under guidance from LSB. In
the Ministry of Agriculture and Forestry (MAF), the Centre for Agricultural Statistics (CAS)
oversees all agricultural statistics, in collaboration with MAF’s technical departments, provinces
and districts. Most agricultural statistics are compiled using administrative reporting, with
reported data being transmitted from the villages through the various administrative levels to
MAF’s central office.
The NSDS has seven goals, nine objectives and four strategies. Agricultural statistics activities
under this framework include compiling the required indicators, harmonizing concepts and
methodologies, improving data collection methodologies, conducting agricultural censuses and
surveys, building staff capacity, improving coordination in data collection, and improving data
dissemination. In 2013, MAF prepared an action plan to improve agricultural and rural statistics.
Capacity assessment
The NSDS for Lao PDR highlights human resource weaknesses in statistics and recommends
increases in statistical staff, as well as further statistical capacity building efforts in LSB and the
line ministries to upgrade skills to international standard. Staff numbers in LSB have more than
doubled since 2010. Only two LSB staff work part-time on agricultural statistics.
In MAF, CAS currently has 14 staff. Most have some experience in census/survey work. All have
basic computer skills; some have exposure to database, statistical analysis and mapping software.
Further capacity building is needed, especially in data processing, data management, data
analysis, report writing, and data dissemination. Statistics units in MAF’s technical departments
usually have one or two staff. Most have no formal training in statistics. Provinces and districts
also have agricultural statistics staff, who also need training.
Information and communication technology (ICT) for agricultural statistics needs to be
strengthened at all levels. Infrastructure to connect MAF’s central office with provinces, districts
and villages needs to be upgraded to improve the capacity to collect, analyze, store and share
agricultural information. Internet services need to be improved. There are several on-line
databases available that contain agricultural statistics, including Lao DECIDE. LSB also has some
agricultural statistics on its website. CAS does not have a website.
EXECUTIVE SUMMARY
ix
Assessment of statistical methodology and data quality
The national statistics system in Lao PDR is comprehensive. LSB prepares annual national
accounts, and conducts decennial censuses of population and housing and five-yearly
expenditure/consumption surveys. LSB and MAF have collaborated on two agricultural censuses:
in 1998/99 and 2010/11.
The administrative reporting system provides data on: planted area, harvested area, yield and
production for 33 crops; number of cattle, buffaloes, pigs, goats/sheep and poultry; production of
capture and culture fisheries; and seed collection, seedlings, forest area planted and reforested
area. Sample survey, crop cutting and remote sensing methodologies have been tested but not
implemented on an ongoing basis. No livestock production data are available.
The Government of Lao PDR acknowledges the weaknesses in the administrative reporting
system. Reporting procedures and questionnaires are not standardized, statistical concepts are
not clearly defined, there is no control or supervision of the data reporting, and the data lack
objectivity. However, administrative reporting will continue to be the core of the agricultural
statistics system in Lao PDR for some time to come because of budget and manpower shortages.
Work is needed to improve the reporting system, while progressively introducing sample surveys
to supplement the administrative data. Farm-gate price collections are also needed.
Agricultural statistics are published in the Agricultural Statistics Yearbook, released by CAS in the
middle of each year. These are the only published agricultural statistics in Lao PDR. No data are
made available on the Internet. A more extensive data dissemination programme is needed,
including seasonal crop reports and crop forecasts.
Main elements of the SPARS for Lao PDR
The SPARS for Lao PDR has been designed to link with the national development plans. The SPARS
covers the period 2016-2025, which corresponds to the ten-year period of the agricultural sector
development plan. The first five years of the SPARS, 2016-2020, correspond to the period of the
current NSEDP.
The SPARS has been integrated into the NSDS and the existing action plan for agricultural and
rural statistics. The three SPARS strategic goals are the same as the first three NSDS strategies
(one NSDS strategy is not applicable to agriculture). Also, SPARS outputs are the same as in the
action plan. Sub-outputs have been defined to provide more information on the work to be carried
out under the SPARS.
The vision of the SPARS is:
A sustainable system for agricultural and rural statistics that meets international standards,
supporting informed decision making in the agricultural sector.
The mission of the SPARS is:
To implement a systematic agricultural and rural statistics system that provides comprehensive,
timely, transparent and reliable data using up-to-date methods for the collection, processing and
EXECUTIVE SUMMARY
x
dissemination of statistics.
The strategic goals and outputs are:
Goal 1: Improving regulation and institutional frameworks for agricultural and rural statistics.
Output 1.1. Effective coordination mechanisms among agricultural and rural statistics
stakeholders.
Output 1.2. Adequate number of trained staff on agricultural and rural statistics hired.
Goal 2: |Developing statistical infrastructure for agricultural and rural statistics.
Output 2.1. Adequate training programmes developed and implemented.
Output 2.2. Adequate data collection equipment and support mechanisms available.
Goal 3: Managing and developing agricultural and rural statistics.
Output 3.1. Uniform standards, concepts and methods on agricultural and rural statistics
developed and applied across all districts and government agencies.
Output 3.2. Good and appropriate data collection methods adopted.
Sub-outputs
3.2.1 Required agricultural and rural indicators are produced and additional indicators
developed.
3.2.2 Sound methodology for the estimation of value added for the agricultural sector
developed and implemented.
3.2.3 Improved administrative reporting system for agricultural and rural statistics
implemented.
3.2.4 Master sample frame for agricultural surveys established.
3.2.5 Third agricultural census conducted and results disseminated.
3.2.6 Regular crop condition reports prepared and disseminated.
3.2.7 Improved system for crop production statistics implemented.
3.2.8 Programme of agricultural sample surveys implemented and results disseminated.
3.2.9 Statistical system for agricultural price statistics implemented.
3.2.10 Improved food balance sheets published.
Output 3.3. Data dissemination system developed and applied.
SPARS implementation
The action plan for the implementation of the SPARS showing detailed activities for the first two
years (2016 and 2017), and a broad description of activities for the remaining years, is shown in
Annex VIII. A calendar of censuses and surveys for agricultural and rural statistics is shown in
Table 1. A data release calendar is shown in Table 2. Key elements of the action plan are:
Reorganize statistics units in MAF to provide a more effective statistical service, and
develop and implement training programmes for MAF statistical staff at all levels;
Develop and implement an ICT plan for agricultural and rural statistics in MAF, with
emphasis on improving data transfer from local to central levels;
EXECUTIVE SUMMARY
xi
Develop a manual on statistical standards, concepts and methods for agricultural
statistics;
Evaluate the existing administrative reporting system for agricultural statistics, and
develop and implement improved reporting mechanisms;
Conduct the third agricultural census in 2019;
Prepare and publish regular crop condition reports;
Introduce regular crop cutting surveys for use in estimating rice production statistics;
Conduct regular agricultural sample surveys to supplement data from the
administrative reporting system;
Develop and implement a system for regular agricultural prices statistics; and
Develop and implement a data dissemination plan for agricultural and rural statistics.
The indicative cost of the SPARS implementation for the first five years (2016-2020) is
51.1 billion kips excluding salaries (see Annex X). The day-to-day running costs will be financed
by the government and this will require increasing levels of government funding. External
resources required over the first five years are estimated at US$ 5.3 million. This will be used for
the development of new statistical methodologies, staff training and equipment. External support
will also be needed for the agricultural census. The availability of funds under various
international statistical capacity building programmes, such as the GS, should be explored.
A monitoring and evaluation (M&E) plan for the SPARS implementation is shown in Annex IX.
CAS will have primary responsibility for implementing the SPARS. It will prepare an annual
progress report, including an updated action plan and financing plan for the following year, for
endorsement by the steering committee. A mid-term evaluation will be carried out in 2020,
coinciding with the final evaluation of the NSDS. A final SPARS evaluation will be undertaken in
2025.
The SPARS also includes an advocacy-communication plan for agricultural and rural statistics.
The inclusive approach used in the SPARS development has raised awareness of the need for the
SPARS and for improving the quality of agricultural and rural statistics. Improving the range,
timeliness, quality, accessibility, technical documentation and analysis of the statistics will help
to promote their use. Dissemination workshops will also help in this regard.

xii
STRATEGIC PLAN FOR AGRICULTURAL AND RURAL STATISTICS, LAO PDR
1
CHAPTER 1
BACKGROUND
1.1 Rationale
In many countries, agriculture is an important contributor to the national economy, and
plays a key role in food security, employment and household incomes. In these circumstances, the
need for high quality agricultural and rural statistics to be generated and made available is
paramount to facilitate evidence-based planning and policy making. In recent years, there has
been a decline in the availability and quality of agricultural and rural statistics. The need to
monitor the Millennium Development Goals (MDGs) and the emerging issues in agriculture, such
as the environment, global warming, and the use of food crops for biofuels, has led to a renewed
commitment by the international community on improving agricultural and rural statistics.
The Global Strategy to Improve Agricultural and Rural Statistics (GS) (World Bank et al,
2010)1 is a key initiative in this regard. The GS aims to provide a framework to enable national
and international statistical systems to produce the basic agricultural and rural information
needed for decision making. The GS has three main pillars: (i) establishing a minimum set of core
data required to meet current and emerging needs; (ii) integrating agriculture into national
statistics systems; and (iii) building capacity to ensure sustainable agricultural statistics systems
through governance and research.
The second pillar recommends that each country design and implement a Strategic Plan for
Agricultural and Rural Statistics (SPARS) within the framework of the National Strategy for the
Development of Statistics (NSDS). The NSDS is a strategic planning process being promoted by the
Partnership in Statistics for Development in the 21st Century (PARIS21) and aims to provide
countries with a guide for the long-term improvement in the quality of official statistics. SPARS
provides a strategy for the development of the agricultural and rural statistics system as a
component of the NSDS. The NSDS for Lao PDR was prepared in 2010, covering the period 2010-
2020. The present document presents the SPARS for Lao PDR for the period 2016-2025.
For the purpose of the SPARS, agriculture covers crops, livestock, fisheries and forestry, and
includes the economic, social and environmental dimensions of agricultural and rural
development. Agricultural and rural statistics cover agricultural production activities, as well as
development aspects in rural areas such as employment, socio-economic characteristics and
access to services.
The need for countries to develop a SPARS arises because the coverage of agricultural and
rural statistics in the NSDS is often limited. Agricultural statistics are quite weak in many
countries because of the reliance on administrative reporting systems. There are often
organizational weaknesses in the collection or reporting of data, in addition to duplication in data
collection, methodological weaknesses, and a shortage of financial resources for censuses and
1 See http://www.fao.org/docrep/015/am082e/am082e00.pdf.
STRATEGIC PLAN FOR AGRICULTURAL AND RURAL STATISTICS, LAO PDR
2
sample surveys. The SPARS process aims to build on the overall statistical strategy given in the
NSDS to guide the future development of agricultural and rural statistics. It aims to evaluate the
existing agricultural and rural statistics system, assess data quality, identify data gaps, and
determine programmes and interventions needed to improve statistics. The SPARS also helps in
coordinating and financing agricultural and rural statistics development activities.
In Lao PDR, most agricultural statistics are compiled using administrative reporting
systems and suffer from the weaknesses inherent in such systems. The Government of Lao PDR
is aware of these shortcomings and the effect this has on agricultural planning and policy making.
However, because of funding shortages, it is foreseen that administrative reporting will continue
to be the basis of the agricultural statistics system in Lao PDR for some time to come, with regular
sample surveys conducted to supplement, and eventually replace, data from the administrative
reporting system. In these circumstances, it is important to have a long-term strategy to gradually
introduce new methodologies and improve data quality. SPARS serves that purpose.
The Food and Agriculture Organization of the United Nations (FAO) has been implementing
the GS in the Asia-Pacific region in partnership with the Economic and Social Commission for Asia
and the Pacific (ESCAP), the Statistical Institute for Asia and the Pacific (SIAP) and the Asian
Development Bank (ADB). Lao PDR was selected as a priority country for implementation of the
GS. The first step was to carry out an in-depth country assessment (IdCA) of the agricultural and
rural statistics system in Lao PDR (FAO, 2015a). This was completed in August 2015. The results
of the IdCA provided an important input to the development of the SPARS.
The IdCA identified major areas of agricultural and rural statistics in Lao PDR needing
technical assistance. A country proposal for short-term technical assistance was prepared. Funds
were made available under the GS programme for two priority activities: (i) improving the
administrative reporting system for agricultural statistics; and (ii) preparing the SPARS for Lao
PDR. The current document is the result of the second activity.
1.2 SPARS development process
The development of the SPARS for Lao PDR and the preparation of this document were
carried out between July 2015 and June 2016. There are three phases in developing a country’s
SPARS: (i) the launching phase; (ii) the assessing phase; and (iii) the planning phase.
(1) Launching phase
The launching phase covers the initial preparations for designing the SPARS. The first step
is for the national authorities to acknowledge the importance of agricultural and rural statistics
for development planning and to recognize the need for a strategic approach to developing the
agricultural and rural statistics system. Administrative structures are created for the SPARS
design process, including establishing the SPARS design team, putting in place management
procedures for the design work, and identifying stakeholders. The final step in the launching
phase is the preparation of a roadmap for the SPARS development.
In Lao PDR, a Steering Committee on Agricultural and Rural Statistics (SCA) was established
to provide overall direction for the SPARS development. The composition and Terms of Reference
STRATEGIC PLAN FOR AGRICULTURAL AND RURAL STATISTICS, LAO PDR
3
of the SCA are given in Annex I. The Centre for Agricultural Statistics (CAS) in the Ministry of
Agriculture and Forestry (MAF) led the SPARS preparation. A Technical Working Group on
Agricultural and Rural Statistics (TWA), with representatives from the Lao Statistics Bureau (LSB)
and MAF line departments, was established to support CAS in this work. See Annex II for the
composition and Terms of Reference of the TWA. National and international consultants were
also recruited to support the SPARS development work.
The roadmap for SPARS development in Lao PDR was prepared in August 2015
(FAO, 2015b). It illustrated the process for SPARS development in Lao PDR, including necessary
organizational arrangements. A timetable of work to be done in preparing the SPARS was also
presented. The roadmap also identified the agricultural and rural statistics stakeholders and
provided a budget and sources of funding for the SPARS development work.
Details on the launching phase are presented in this chapter.
(2) Assessing phase
The assessing phase involves reviewing the current status of the agricultural and rural
statistics system and identifying data gaps and weaknesses, with particular reference to data
needs for national development plans. It also assesses the country’s capacity to improve
agricultural and rural statistics. In Lao PDR, the IdCA formed the basis for this phase of the work.
The results of the assessing phase are presented in Chapter 2.
(3) Planning phase
The planning phase involves illustrating the strategic plan itself. This includes defining its
vision, mission, strategic goals, outputs and activities. These activities are presented in the action
plan, together with an associated financing plan. A monitoring and evaluation (M&E) plan is also
developed to help in monitoring, reviewing, reporting and evaluating SPARS implementation. The
results of the planning phase are presented in Chapter 3.
1.3 Administrative structure of Lao PDR
Administratively, Lao PDR is divided into provinces, districts, kumbans and villages. There
have been many administrative changes over the years. The following describes the situation as
of July 2015.
National government. Lao PDR is a unitary state headed by the President with an elected
National Assembly. There are 18 ministries, the most important in the agricultural field being the
Ministry of Agriculture and Forestry (MAF), which is responsible for crops, livestock, fisheries
and forestry, and the Ministry of Planning and Investment (MPI) which includes the country’s
national statistics office, LSB.
Provinces. There are 17 provinces and one municipality (Vientiane Capital). Xaysomboun
Province is a new province established in December 2013. Provinces are administered by a
Provincial Governor (Municipal Governor for Vientiane Capital), appointed by the national
STRATEGIC PLAN FOR AGRICULTURAL AND RURAL STATISTICS, LAO PDR
4
government. Most national government ministries have offices at the provincial level, including
MAF and MPI.
Districts. There are currently 148 districts in Lao PDR. There have been considerable
changes over the years. The number of districts per province varies from 4 in Sekong Province to
15 in Savannakhet Province. Districts are administered by a District Governor, appointed by the
national government. Most national government ministries have offices at the district level,
including MAF and MPI.
Kumbans. The kumban, or village development cluster, is a relatively new administrative
unit established in 2007 to facilitate communication between districts and villages and to provide
people in rural areas with better access to services. There is an average of nine villages per
kumban. Kumban committees, consisting of district and village officials, are appointed and meet
at least monthly.
Villages. There has been some consolidation of villages in recent years. In March 1999, there
were 11 251 villages in the country. This had fallen to 8 662 by March 2011, consisting of 1 362
urban villages and 7 300 rural villages. The average rural village contains about 100 households.
A village head is elected by the people of the village. Often, the village head has an office with some
support staff.
Under the government’s “three builds” strategy, provinces are the strategic planning units
in the country; districts are the planning and budgeting units; and villages are the implementation
units. With the move to more decentralization of public administration and the creation of
kumbans, planning is becoming more localized.
In designing statistical systems, attention is given to providing the geographical
disaggregation necessary to meet policy and planning needs. In Lao PDR, the strongest need is for
statistical information at the national and provincial levels, and most statistical systems,
especially sample surveys, are designed accordingly. There is a demand for data at the district
level, but the large number of districts makes this difficult without using very large samples.
Increasing interest for kumban-level data can be expected, but this data can only be provided
from censuses and administrative reporting systems.
Provinces are often grouped into three regions: Northern Region, Central Region and
Southern Region. For agricultural planning purposes, Lao PDR has been divided into six agro-
ecological zones: Mekong Corridor, Central Southern Highlands, Vientiane Plain, Bolaven Plateau,
Northern Highland and Northern Lowland. These do not align with provincial boundaries.
STRATEGIC PLAN FOR AGRICULTURAL AND RURAL STATISTICS, LAO PDR
5
1.4 Policy context and demand for agricultural and rural statistics
1.4.1 Overview of the agricultural sector in Lao PDR2
Lao PDR has an area of 236 800 square km, about two-thirds of which are mountainous.
The main lowland areas are along the Mekong corridor in the central and south of the country.
Only 6 percent of the land area is arable. The climate is tropical with two distinct seasons: the wet
season bringing south-west monsoon rains from mid-May to mid-October; and the dry season
covering the rest of the year. Flooding is common during the wet season.
Lao PDR has achieved high economic growth rates over the last decade. In 2013/14, the
economy grew by 8.1 percent. Agriculture contributed 24 percent of Gross Domestic Product
(GDP) in 2014, down from 35 percent in 2009. Farm sizes are small: in 2010/11, the average area
of agricultural land per farm household was 2.1 ha. The population of Lao PDR was 6.8 million in
2014, of which 64 percent lived in rural areas. Three-quarters of the labour force works in
agriculture.
Rice is the dominant crop and is crucial to the economy and food security of Lao PDR. In
2010/11, 724 000 farm households grew rice, amounting to 71 percent of all households in the
country. The total area of rice planted in 2015 was 985 000 ha: 769 000 ha of wet season lowland
rice, 117 000 ha of upland rice, and 99 000 ha of dry season rice. One in eight rice farmers plant
a dry season rice crop. Rice production in the country has more than doubled in the last 20 years
– production in 2013 was 4.1 million tonnes – and Lao PDR is now self-sufficient in rice at the
national level. Over 90 percent of rice grown in Lao PDR is of the glutinous variety.
Cropping is becoming more diversified in response to the opening up of new markets. After
rice, maize is the most common temporary crop, especially in the north of the country. In 2010/11,
there were 187 000 maize growers in the country. The area under sugar cane more than doubled
between 1998/99 and 2010/11. Vegetable crops are also common, often planted in small kitchen
gardens or on river banks. In 2010/11, 317 000 farm households grew some vegetables, which
accounts for 41 percent of all farm households. The most commonly grown vegetables are chili,
cabbage, cucumber, onion and melon. Cassava, groundnut, tobacco and sesame are other
important temporary crops.
Coffee is grown on the Bolaven Plateau and in other southern provinces. Coffee exports
were worth US$ 60 million in 2012. The rubber industry has seen rapid growth in recent years.
In 2010/11, there were 49 000 farm households growing rubber, compared with almost none ten
years earlier. Fruit trees are common but usually only grown on bunds, roadsides and as scattered
trees around the farm. The most common fruit trees are mango, banana, jackfruit and tamarind.
Cattle are becoming increasingly important in Lao PDR, with 38 percent of all farm
households in the country now raising them. The number of cattle in 2012 was 1.7 million, up
2 Main sources of the data (see References): FAOSTAT (FAO’s online database http://faostat.fao.org); MAF, 2012; MAF, 2014c; UNICEF; World Bank.
STRATEGIC PLAN FOR AGRICULTURAL AND RURAL STATISTICS, LAO PDR
6
from 1.4 million five years earlier. Buffaloes are kept for use as draught animals, especially in the
south. Pig raising is common in upland areas. Many households raise a few chickens or ducks.
Fisheries activities in Lao PDR are concentrated in areas along the Mekong River and its
tributaries. Fishing as a full-time occupation is rare, but fishing is an important secondary activity
for many farm households, either as a source of extra income or to supplement the family’s food
supply. Two-thirds of farm households in the country engage in capture fisheries. The production
of capture fisheries in 2015 was estimated at 63 000 tonnes. Aquaculture is becoming
increasingly important. In 2010/11, 68 000 farm households were engaged in aquaculture. The
aquaculture fish production in 2015 was estimated at 96 000 tonnes, up from 63 000 tonnes in
2007.
Two-thirds of the land area of Lao PDR is forest covered. Timber and non-timber forest
products provide for a wide range of subsistence needs, as well as being a source of food and
income in rural areas. Forestry is also an important export earner. Nearly 70 percent of farm
households exploit public forest land in some way; half of the farm households collect food
products from the forest. Over 200 000 farm households sell some forestry products obtained
from public forest land.
Lao PDR has made good progress in reducing poverty, but it is still widespread in rural
areas. In 2008, 34 percent of the population was living on less than the international poverty line
of US$ 1.25 per day, down from 44 percent in 2002. Food insecurity and vulnerability are
prevalent: in 2010-12, 28 percent of the population was undernourished, down from 33 percent
in 2004-06. Most of the food insecure live in rural areas. In 2008-2012, 27 percent of children
aged less than five years were underweight, 44 percent were stunted, and 6 percent were wasted.
The staple food of Lao PDR is rice. In 2011, cereals (mainly rice) constituted 67 percent of
the country’s energy intake. Only 5.6 percent came from meat products. The per capita food
supply is 2 356 Kcal per day.
1.4.2 Agricultural sector development strategy
The Agriculture Development Strategy to 2025 and Vision to 2030 (MAF, 2015) sets out the
national strategy for the development of the agricultural sector. The vision, goals and targets of
the strategy are shown in Annex III. Essentially, the vision is to ensure food security and develop
an efficient and competitive agricultural sector. The three goals relate to: (i) producing a stable
supply of agricultural products; (ii) ensuring production of safe food in an environmentally
friendly manner; and (iii) creating employment, generating rural income, and reducing the gap
between urban and rural areas.
The aim for 2020 is for GDP for the agriculture/forestry sector to grow by 3.4 percent a
year. Per capita energy intake will be 2 600 Kcal per day. Cereals should represent 62 percent of
Kcal intake, compared with 10 percent for meat, eggs and fish, and 6 percent for vegetables, fruit
and beans. Paddy production should reach 4.7 million tonnes a year, of which 1.0 million tonnes
should be for export. Annual production of other major crops should be: maize 1.3 million tonnes;
coffee 120 000 tonnes; sugar cane 2.15 million tonnes; and cassava 1.5 million tonnes. Livestock
STRATEGIC PLAN FOR AGRICULTURAL AND RURAL STATISTICS, LAO PDR
7
products should increase to 263 000 tonnes annually, and annual fish production should be
225 000 tonnes.
By 2025, daily per capita energy intake should be maintained at 2 600 Kcal. Cereals will fall
to 54 percent of total energy intake; meat, eggs and fish will increase to 13 percent; and vegetables,
fruit and beans will rise to 8 percent. By 2025, annual paddy production should be at least 5
million tonnes, including 1.5 million tonnes for export. Maize production should reach 1.4 million
tonnes a year, coffee 280 000 tonnes, sugar cane 2.4 million tonnes, and cassava 1.6 million
tonnes. Meat production will be 414 000 tonnes a year, and fish production will be 297 000
tonnes a year.
1.4.3 National Socio-Economic Development Plans
In the 1980s, Lao PDR embarked on a programme of economic development based on
achieving sustained growth with equity, with a view to graduating from Least Developed Country
status by 2020. Five-yearly National Socio-Economic Development Plans (NSEDPs) are prepared
to implement this programme. The Seventh NSEDP (MPI, 2011) covered the period 2011 to 2015.
The Eighth NSEDP for 2016-2020 is currently under preparation. Reference is made in this
document to the NSEDP draft of 24 November 2015 (MPI, 2015, unpublished).
NSEDP 2011-2015 continued the emphasis on socio-economic development,
industrialization and modernization initiated in previous plans. The main targets of NSEDP 2011-
2015 were to: maintain stable economic growth of more than 8 percent per year and achieve
annual GDP per capita of US$ 1 700 by 2015; achieve the MDG targets by 2015; ensure sustainable
development by integrating economic development with socio-cultural development and
environmental protection; and support international integration. Good economic growth was
recorded during the plan period with an average GDP growth rate of 7.9 percent per year. GDP
per capita is expected to be US$ 1 800 by 2015.
In the agricultural sector, the main aims of NSEDP 2011-2015 were to: improve food
security and encourage commercial agriculture for domestic consumption and exports; increase
agricultural productivity through improved scientific and technological methods; eliminate
shifting cultivation; provide employment to the landless and those who have been re-settled;
protect forests and reforest degraded areas; and establish comprehensive irrigation systems. GDP
growth rates of about 3.0 percent per year for the agricultural sector were achieved during the
plan period, short of the 3.5 percent target.
For crops, rice production reached 4.1 million tonnes by 2015, just short of the target. Dry
season rice production fell well short of the target because of poor rainfall and weaknesses in
irrigation facilities. Production of other crops increased satisfactorily during the plan period,
especially maize, taro, cassava, fruit and vegetables. Coffee production increased sharply,
exceeding the plan’s target. Production of sugar cane, tobacco and cotton were slightly below
target. For livestock and fisheries, meat production in 2015 was just short of the target of 379 100
tonnes. Livestock populations generally met the targets. The commercial livestock sector has
developed in line with the targets. Animal health continues to be a problem, although vaccination
rates exceeded the targets. Aquaculture is becoming more important. For forestry, targets set for
increasing forest cover, regenerating natural forests, and reforestation were not met.
STRATEGIC PLAN FOR AGRICULTURAL AND RURAL STATISTICS, LAO PDR
8
NSEDP 2016-2020 continues the emphasis on economic growth, sustainable industrial
development, strengthening human resource capacity, maintaining stability, and widening
international cooperation. The objective, outcomes and outputs of NSEDP 2016-2020 are shown
in Annex IV. Agricultural and forestry are covered under a number of outputs based on the
Agriculture Development Strategy, as outlined in the following paragraphs.
Outcome 1, Output 1: Sustained and inclusive economic growth includes: further
developing the agricultural sector to provide sustainable production of food; expanding
agricultural production; improving productivity by modernizing agricultural production
techniques; and sustainably managing forest resources. Priority will be given to promoting
organic agriculture, marketing, agricultural processing, and irrigation. Modern milling and
processing facilities will also be developed. Livestock and fisheries production is expected to
increase. Targets have been set for forest planting and restoration, as well as for reduction in
emissions from deforestation. Steps will be taken to effectively manage agricultural land.
Agricultural credit will be more widely available.
Outcome 1, Output 4: Balanced regional and local development provides a development
plan for each region according to its characteristics. In the Northern Region, the aim is to promote
suitable crops, such as cassava, potatoes, fruit and vegetables, and to develop the cultivation of
high value wood trees and processing industries for rubber, sugar cane and forest products. In
the Central Region, priority areas for rice cultivation have been identified and emphasis will be
given to improving irrigation facilities. To meet market needs, livestock and aquaculture will also
be promoted. In the Southern Region, rice will be promoted in lowland areas and industrial crops
such as coffee have been identified for agro-processing and export in suitable areas. Aquaculture
will also expand.
Outcome 1, Output 5: Improved public/private labour force capacity envisages mobilizing
financial and technical resources to improve the skills of the labour force in Lao PDR. This
includes capacity building in agricultural statistics.
Outcome 2, Output 2: Ensured food security and reduced incidences of malnutrition sets a
target for daily energy intake and provides for improved nutrition and food safety. It also covers
measures to increase food production and boost agricultural productivity.
Outcome 3, Output 1: Environmental protection and sustainable natural resources
management relates to improving the management, protection and restoration of forest and land
resources. It also covers water resources management.
Outcome 3, Output 2: Preparedness for natural disasters and risk mitigation relates to
managing and preventing natural disasters, as well as strengthening the capacity to adapt to
climate change.
Outcome 3, Output 3: Reduced instability of agricultural production focuses on ensuring
stable supplies, markets and prices for agricultural products.
Cross-cutting outputs include the management and application of Information and
Communication Technology (ICT). This includes developing the basic infrastructure for
STRATEGIC PLAN FOR AGRICULTURAL AND RURAL STATISTICS, LAO PDR
9
telecommunications and electronic information, developing e-government, improving Internet
services, training in the application of technology, and increasing access to ICT services.
1.4.4 Sustainable Development Goals
The 2030 Agenda for Sustainable Development adopted by the United Nations General
Assembly in 2015 includes 17 Sustainable Development Goals (SDGs) and their associated 169
targets3. Of direct concern to agricultural and rural development are:
Goal 2: end hunger, achieve food security and improved nutrition and promote
sustainable agriculture;
Goal 12: ensure sustainable consumption and production patterns; and
Goal 15: protect, restore and promote sustainable use of terrestrial ecosystems,
sustainably manage forests, combat desertification, halt and reverse land degradation
and halt biodiversity loss.
Other goals of interest to agricultural and rural development include: Goal 5 (achieve
gender equality and empower all women and girls); and Goal 6 (ensure availability and
sustainable management of water and sanitation for all).
1.5 Framework for the collection of statistics in Lao PDR
Up until 2010, the statistical system in Lao PDR operated under a decree governing the
organizational structure and operation of statistical activities in the country. The Department of
Statistics under MPI performed the role of the national statistics office. A Statistics Law was
enacted in June 2010. This upgraded the Department of Statistics to become the Lao Statistics
Bureau (LSB), with the status equivalent to a sub-ministry. The Statistics Law provides for a
partially decentralized statistical system.
Under the Statistics Law, LSB is responsible for: overseeing the development of the national
statistics system in Lao PDR including determining policies, strategies and guidelines for national
statistics; managing and implementing national statistical activities and disseminating official
statistics; training statistical staff in LSB and other agencies; and coordinating with line ministries,
agencies and provincial authorities to ensure the use of sound statistical methodologies in
statistical activities. LSB conducts censuses and major national sample surveys, and compiles
other national statistics such as the national accounts.
Each line ministry is given responsibility for collecting and disseminating statistics in its
sector, under guidance from LSB. MAF is responsible for agricultural statistics. In particular, it is
required to: implement statistical activities in the agricultural sector; provide data to LSB as
needed, especially for compiling the national accounts; train statistical personnel in the
agricultural sector; ensure sound statistical methodologies in statistical work in the sector; work
with other agencies to provide harmonization in statistical work; collaborate with international
agencies on agricultural statistics; and publish and disseminate agricultural statistics.
3 See https://sustainabledevelopment.un.org/?menu=1300.
STRATEGIC PLAN FOR AGRICULTURAL AND RURAL STATISTICS, LAO PDR
10
The Statistics Law describes the national statistics system as having two sub-systems: a
“vertical” sub-system, represented by LSB and its offices in the provinces and districts; and a
“horizontal” sub-system consisting of the line ministries and their statistical activities in
provinces and districts. Provinces and districts can also undertake their own statistical activities
provided they are approved by LSB.
The Statistics Law states that a Statistics Council might be established to formally oversee
the statistical system in Lao PDR if the government considers it necessary. This body has not been
formed.
In December 2014, the Minister for Agriculture and Forestry issued a Decision on
Agricultural Statistics (MAF, 2014b) defining the principles, regulations and measures regarding
the production, management and publication of agricultural statistics in MAF under the Statistics
Law. CAS is designated as the lead agency responsible for the overall management of agricultural
statistics in Lao PDR. Specifically, CAS is to: undertake agricultural surveys; disseminate
agricultural statistics, especially through the Agricultural Statistics Yearbook; collaborate with
relevant agencies to develop sound and uniform statistical methodologies; coordinate assistance
and cooperation in all aspects of agricultural statistics; and oversee management of agricultural
statistics databases. CAS is also to act as an agricultural statistics inspection agency to monitor,
check and evaluate the collection of agricultural statistics. The Decision also sets out the
responsibilities of MAF’s technical departments, provinces, districts and villages for compiling
agricultural statistics. It also lists the indicators to be published in the Agricultural Statistics
Yearbook (see Section 2.1).
There has been considerable international support for the development of statistics in
Lao PDR. The Swedish International Development Agency (Sida) provided support for LSB and
its predecessor organizations from 1991 to 2011. During that time, it helped to develop the
national statistics system in Lao PDR, providing the systematic collection and dissemination of
key national statistics. The World Bank is currently funding a project in LSB covering the period
2013-2017 to further develop the capacity of LSB to produce economic and poverty statistics.
Various agencies have provided support for agricultural statistics over the past 20 years.
1.6 Integration of agricultural and rural statistics into the NSDS
To support the Statistics Law, an NSDS for Lao PDR was formulated in 2010 (LSB, 2010).
The NSDS covers the period 2010 to 2020.
The NSDS notes that the national statistics system in Lao PDR has improved over the years,
particularly in regards to the greater awareness of the importance of statistics, the range and
quality of statistics produced and disseminated, better statistical coordination, and improved
skills of statistical staff. However, some weaknesses were identified. There are still data gaps and
methodological weaknesses. There is also a need for more and better trained statistical staff and
better application of technology.
The NSDS has seven goals, nine objectives, four strategies and 12 work programmes (WPs)
(see Annex V). Activities have been outlined for each WP.
STRATEGIC PLAN FOR AGRICULTURAL AND RURAL STATISTICS, LAO PDR
11
The essential elements of the seven goals are to: (1) provide reliable and timely statistics
to serve user needs; (2) ensure that statistical activities comply with international standards;
(3) further build the knowledge and capacity of statistical staff; (4) establish effective
coordination mechanisms; (5) encourage the use and analysis of statistics; (6) expand statistical
cooperation with neighbouring countries; and (7) ensure support in society for statistical work.
The nine objectives relate to: (1) upgrading the organizational structure for statistics;
(2) strengthening the vertical/horizontal mechanisms for the provision of statistics;
(3) increasing numbers of statistical staff; (4) strengthening line ministries in the provision of
statistics; (5) providing more comprehensive statistics; (6) implementing a programme of sample
surveys; (7) building statistical capacity; (8) developing registration statistics; and (9) making
better use of ICT facilities. These objectives are relevant to agricultural and rural statistics,
especially: better coordinating agricultural statistics activities (Objective 2); strengthening MAF
statistical capability (Objectives 3 and 4); providing more comprehensive agricultural and rural
statistics (Objective 5); conducting agricultural censuses and surveys (Objective 6); training of
statistical staff in MAF (Objective 7); linking the reporting of agricultural statistics to the
registration system (Objective 8); and making better use of ICT facilities for the reporting and
transmission of agricultural data (Objective 9).
The four strategies are: (1) improving regulation and institutional frameworks;
(2) developing statistical infrastructure; (3) management and development of data; and
(4) ensuring statistical activities. WPs 1-6 under Strategy (1) cover elements related to
organizational structure and coordination. WPs 7-8 under Strategy (2) cover infrastructure
issues such as the use of ICT facilities and training. WPs 11-12 under Strategy (4) cover data
security and confidentiality, as well as international relationships. Of most importance to
agricultural and rural statistics are WPs 9-10 under Strategy (3), which relate to the development
of sector indicators and the dissemination of data.
Under WP 9, the NSDS specifies the following agricultural statistics activities:
Produce statistics to support calculations of the required indicators at the national,
provincial and local levels and further develop the indicators;
Collect data by various methods – administrative records, agricultural censuses and
sample surveys – to ensure completeness and accuracy in statistics for the agricultural
sector, and conduct ad-hoc surveys as required, such as on the impacts of natural
disasters;
Systematize data collection and harmonize methodologies, techniques and definitions
during compilation;
Conduct agricultural sample surveys needed for policy making, development planning
and agricultural sector research, including surveys for rice and other crops, livestock
and poultry, and forestry;
Enhance knowledge and build capacity of staff at the ministry, province and district
levels, especially in data collection, data processing and data management;
Establish a data transfer system from local to central levels to ensure that data are
transmitted in a timely, complete, accurate and statistically verifiable manner;
STRATEGIC PLAN FOR AGRICULTURAL AND RURAL STATISTICS, LAO PDR
12
Estimate crop, livestock, fisheries and forestry production, and calculate value added for
the agricultural sector;
Improve coordination and cooperation among government organizations involved in
agricultural statistics work from central to local levels;
Allocate funds for agricultural censuses and surveys; and
Build a database for agricultural statistics and document data collections.
Under WP 10, dissemination activities include: determining a statistical release schedule;
preparing manuals to document data; improving and expanding modes of dissemination to
increase the scope and timeliness of data release, especially via the Internet; making wider use of
geographic information systems (GIS) in the dissemination of data; establishing data
dissemination teams; and conducting user satisfaction surveys. These will be important elements
of the SPARS.
1.7 Action plan to improve agricultural and rural statistics
As part of implementing the GS in Lao PDR, MAF has prepared an Action Plan for Improving
Agricultural and Rural Statistics (ARS) (MAF, 2014a). The ARS identifies seven outputs:
(1) Effective coordination mechanisms among agricultural and rural statistics
stakeholders.
(2) Uniform standards, concepts and methods on agricultural and rural statistics are
developed and applied across all districts and government agencies.
(3) Adequate training programmes are developed and implemented.
(4) Adequate number of staff trained in agricultural and rural statistics are hired.
(5) Adequate data collection equipment and support mechanisms are available.
(6) Data dissemination system is developed and applied.
(7) Good and appropriate data collection methods are adopted.
A work plan and schedule of activities for the period 2013 to 2020 is also included. Work
has not yet started on implementing the plan.
The SPARS will build on the framework for improving agricultural and rural statistics
provided by the ARS. The SPARS will contribute more information on integrating agricultural
statistics into the national statistics system, the cost of implementing the plan, sources of funding,
and technical aspects of statistics improvement work.
1.8 Key stakeholders
The major stakeholders for agricultural and rural statistics in Lao PDR are MAF and LSB.
Other stakeholders include the various data users, including government agencies, the private
sector, the development community and academic/research institutes.
STRATEGIC PLAN FOR AGRICULTURAL AND RURAL STATISTICS, LAO PDR
13
Lao Statistics Bureau (LSB)
LSB is divided into four departments. The Department of Economic Statistics produces
statistics on agriculture, GDP, industry, prices, investment, trade, transport and tourism. The
Department of Social Statistics produces statistics on population, labour, education, health,
culture and the environment. The Department of Data Services is responsible for data
dissemination, information technology, statistical methodologies and human resource
development. The Department of Administration is responsible for statistical coordination,
personnel, budget/finance and other LSB administrative functions.
A Provincial Statistics Centre is located in each province (as well as in Vientiane Capital),
each with 10-20 staff. The main responsibility of the centres is to oversee the implementation of
LSB statistical activities in the provinces, including censuses, surveys and administrative
reporting systems. The centres also compile provincial-level statistics such as national accounts
under the technical direction of LSB, prepare provincial-level statistical reports for submission to
LSB, and disseminate statistics in the province.
A District Statistics Centre is located in each district, usually with only a few staff. The main
responsibility of the centres is to oversee data collection work for LSB in the districts. The centres
also train local officials in the collection of data and prepare district-level reports for submission
to provincial statistics centres.
LSB does not have its own field workers to carry out data collection work. Much of the
administrative data emanates from the village head. For censuses and surveys, LSB recruits and
trains enumerators such as teachers, students, police officers and military personnel.
Ministry of Agriculture and Forestry (MAF)
MAF is the highest agricultural policy making body in Lao PDR responsible for the
formulation and implementation of national agricultural policies and development plans. The
technical departments of MAF are:
Department of Planning and Cooperation (DOPC), which includes CAS
Department of Agriculture (DOA)
Department of Livestock and Fisheries (DLF)
Department of Forestry (DOF)
Department of Forest Inspection (DOFI)
Department of Irrigation (DOI)
Department of Agricultural Extension and Cooperatives (DAEC)
Department of Agricultural Land Management (DALAM)
As well as CAS, there are also statistics units in the Planning and Cooperation Division of
each of MAF’s technical departments. Each technical department is responsible for compiling
statistics for its sub-sector based on administrative reports from lower-level administrative units.
CAS gathers the statistics from each department to produce the statistics for the agricultural
STRATEGIC PLAN FOR AGRICULTURAL AND RURAL STATISTICS, LAO PDR
14
sector as a whole for publication in the Agricultural Statistics Yearbook. CAS also produces
agricultural data to meet international obligations such as for the ASEAN Food Security
Information System (AFSIS).
There is a Provincial Agriculture and Forestry Office (PAFO) in each province (as well as in
Vientiane Capital). PAFOs are divided into divisions corresponding to the MAF departments.
Statistical work is carried out in the Planning and Statistics Division. Usually, a PAFO has two or
three full-time statistical staff.
A District Agriculture and Forestry Office (DAFO) is located in each district. DAFOs usually
have 15-20 staff and are divided into units similar to the PAFOs. The Planning and Statistics Units
usually only have two or three staff, none of whom work full-time on statistics.
Agricultural extension services in Lao PDR are provided by DAEC. DAEC has an office under
the PAFO in each province (and Vientiane Capital), staffed with specialists in each field (crops,
livestock, fisheries, forestry, and rural development). DAEC also has an office in each DAFO,
staffed with extension generalists called Farming Systems Extension Workers. In 2009, there
were almost a thousand extension workers around the country. There are no government
extension staff at the village level. However, Village Extension Workers (VEWs) are selected from
within the village to help farmers. VEWs receive support from district DAEC staff. The village
extension system is not fully operational.
Also under MAF is the National Agriculture and Forestry Research Institute (NAFRI), which
coordinates all agricultural and forestry research in Lao PDR and informs the policy debate on
key agricultural and forestry issues. NAFRI establishes priorities for agricultural research in Lao
PDR to reflect the policy focus of MAF. Current areas of interest include improving agricultural
productivity, land use, and land management. The NAFRI website 4 provides information on
research results, surveys, training/extension materials, working papers and policy reports.
NAFRI is the main source of technology generation in Lao PDR and undertakes some extension
related activities in collaboration with DAEC.
There are five agricultural colleges in Lao PDR, all under MAF. These are the Luang Prabang
Agriculture and Forestry College, the Thangone Irrigation College in Vientiane, the Borikhamxay
Agriculture and Forestry College, the Savannakhet Agriculture and Forestry College, and the
Champasack Agriculture and Forestry College. The colleges are the main source of qualified
agricultural staff for MAF. No courses in agricultural statistics are provided.
Other stakeholders
MPI is responsible for formulating national economic plans and promoting foreign
investment. The Ministry of Environment and Natural Resources (MONRE) is responsible for
water resources management, disaster management and climate change, forest conservation,
meteorology and hydrology. The Ministry of Industry and Commerce (MOIC) is responsible for
regulating and promoting manufacturing, trade and import/export activity. This includes agro-
processing. MOIC also collects some price data and compiles the exports/imports statistics. The
4 See http://web.nafri.org.la.
STRATEGIC PLAN FOR AGRICULTURAL AND RURAL STATISTICS, LAO PDR
15
Ministry of Health has an interest in food security and nutrition matters. The Bank of Lao PDR, as
the country’s central bank, is also a major stakeholder. The National University of Laos (NUOL)
has a Faculty of Agriculture.
The international development community is also an important player in agricultural and
rural statistics. The World Bank, FAO, the United Nations Development Programme (UNDP), the
International Fund for Agricultural Development (IFAD), and ADB are all active in Lao PDR.
Bilateral donors who have recently worked in agricultural statistics in Lao PDR include the Swiss
Agency for Development and Cooperation (SDC), the Australian development agency AusAID, the
German development agency Gesellschaft für Internationale Zusammenarbeit (GIZ), the Agence
Française de Développement (AFD), the Japan International Cooperation Agency (JICA), the
Korea International Cooperation Agency (KOICA), and Sida.
In recent years, there has been increasing private sector investment in agriculture,
especially foreign enterprises. Accordingly, the private sector has become an increasingly
important user of agricultural statistics.
STRATEGIC PLAN FOR AGRICULTURAL AND RURAL STATISTICS, LAO PDR
16
CHAPTER 2
EVALUATION
In Chapter 1, information on the launching phase of the SPARS in Lao PDR was presented.
Agricultural sector development issues were pressented, and the need for agricultural and rural
statistics to monitor progress in national development plans was highlighted. The framework for
the collection of statistics in Lao PDR and the integration of agricultural and rural statistics into
the national statistics system was outlined. Key stakeholders were also identified. Chapter 2
presents the results of the assessing phase of the SPARS development, in which the current
agricultural and rural statistics system is evaluated, data gaps and weaknesses are identified, and
the country’s capacity to improve agricultural and rural statistics is examined. This provides the
basis for determining what action is needed to improve statistics and how the SPARS should be
designed to achieve this end. Much of the material in this chapter is taken from the IdCA report.
2.1 Assessment of statistics outputs
2.1.1 Censuses
The Statistics Law stipulates that LSB will conduct a census of population and housing every
ten years. The most recent censuses were in 2005 and 2015. The Census of Population and
Housing 2015 (CPH 2015) was undertaken in March 2015. Results are not yet available. The
censuses have been carried out according to international standards and the data are of high
quality. Data are collected on the demographic, literacy, educational, labour force and other
characteristics of the population, as well as housing characteristics.
According to the Statistics Law, an agricultural census is to be conducted every ten years.
Two agricultural censuses have been conducted to date: in 1998/99 and 2010/11. The censuses
were based on FAO guidelines and the data are of high quality. The agricultural censuses provided
structural data such as land use, area under crops by crop type, livestock numbers by type, and
farm mechanization. The 1998/99 census was conducted by LSB in collaboration with MAF, with
financial support from Sida and technical assistance provided by Statistics Sweden. For the Lao
Census of Agriculture 2010/11 (LCA 2010/11), MAF had primary responsibility for conducting the
census. LSB provided some technical assistance. Technical support was also provided by FAO.
Financial support was provided by SDC, IFAD, ADB, AusAID, GIZ and AFD.
Data from LCA 2010/11 were released in the report Lao Census of Agriculture 2010/11,
Highlights (MAF, 2012). The report provided data at national and provincial levels. District-level
data are available on request. Census data files were also made available to selected users. An
analytical report on LCA 2010/11 was also published (FAO, 2014a), focusing on six themes:
composition and structure of farm households; land use, cropping patterns and agricultural
performance; forestry, aquaculture and fisheries; village-level infrastructure and development
constraints; livestock and poultry production; and gender dimensions of agriculture.
STRATEGIC PLAN FOR AGRICULTURAL AND RURAL STATISTICS, LAO PDR
17
LCA 2010/11 data are also available on Lao DECIDE (see Section 2.2). Work is under way on the
preparation of an Agricultural Atlas, based on data from LCA 2010/11.
The only economic census in Lao PDR was conducted in 2006. The census covered most
economic entities, except for household agricultural units, and collected data on location of
activities, size, economic activities, economic structure, employment, skills of employees, capital
structure, and access to technology.
2.1.2 Crop statistics
MAF compiles crop area, yield and production statistics using administrative reports
transmitted from villages to districts to provinces to MAF’s technical departments to CAS. The
Ministerial Decision on Agricultural Statistics sets out the schedule for the reporting of crop and
other agricultural statistics. Three types of reports are provided: data for publication in the
Agricultural Statistics Yearbook; data for calculating GDP; and data for general monitoring purposes,
including weekly reports. In all, 90 reports per year are submitted. The reporting schedule is not
always followed.
Weekly meetings are held at each level to review the weekly reports. Village heads attend a
meeting in the kumban where they submit the weekly report to DAFO representatives. Each DAFO
reviews the outcome of the kumban meetings and prepares a district report, which is hand-
delivered or faxed to the PAFO. Each PAFO reviews the district reports and prepares a province
report for each technical department in MAF. These reports are usually forwarded by fax. At the
central level, MAF holds a weekly meeting of all technical departments to review agricultural
conditions nationally.
The only crop data reported are area planted, area harvested, production and yield for each
major crop, as stipulated in the Ministerial Decision on Agricultural Statistics. The crops reported
are:
Rice: lowland rainfed, upland rainfed, dry season.
Other temporary crops: maize, sweet corn, soya bean, mung bean, groundnut, black/red
bean, cassava, sweet potato, potato, yam, taro, sesame, Job’s tears, tobacco, cotton, sugar
cane, leafy vegetables, tuber vegetables, fruit-bearing vegetables, watermelon, and
cantaloupe/other melons.
Permanent crops: coffee, tea, cardamom, banana, pineapple, papaya, and lemon.
Villages use different methods to obtain the crop statistics. Sometimes, the village head
summons households to report on the data required. In other cases, the data are based on the
village head’s own estimation or judgement. Sometimes, district staff go to villages to help collect
data from each household. It is acknowledged that some data, especially crop production, are not
always reported by villages, but estimated by the districts. Recently, LSB has introduced a new
village book in some villages that provides a wide range of socio-economic data, including crop
data. The village head updates the village book annually, but this is not usually coordinated with
the reporting for MAF.
STRATEGIC PLAN FOR AGRICULTURAL AND RURAL STATISTICS, LAO PDR
18
The weaknesses in the statistical system for crops are well known: the statistics lack
objectivity; concepts and definitions are not well-defined; there are no standard reporting forms;
data collection and reporting procedures at the village level are not standardized; and the
transmission of data is not always timely. Currently, it is not feasible to replace the existing
administrative reporting with censuses and sample surveys, because of budget and manpower
shortages. Administrative reporting will continue to be the core of the agricultural statistics
system in Lao PDR, at least for crop area data. In the short term, priority should be given to
improving the reporting system by implementing uniform standards, definitions, data reporting
methods and reporting forms, as well as introducing effective management, coordination,
supervision and quality control mechanisms.
Currently, CAS has no control over data reporting at any level; its role is limited to publishing
data received from the technical departments. CAS should have a major role in the overall
management of the agricultural statistics system in accordance with the Ministerial Decision on
Agricultural Statistics. Statistical responsibilities at each level also need to be clearly defined and
mechanisms put in place to supervise and control the data reporting operation.
CAS has had some experience in crop sample surveys, with support from various donors.
These have included: the 1994 and 1995 rice production surveys, which included the use of crop
cutting methods; other crop cutting surveys; the 2008 rice assessment survey; and the 2013 pilot
land survey, which was based on area sampling using Google Maps to estimate the area of
agricultural land and crops. CAS recently worked in one province on evaluating the use of satellite
imagery in an area sample approach to estimate the area of rice planted. Despite the success of
the various sample survey initiatives, none have led to real changes in the methodology for crop
statistics. The crop cutting methodology is well-established and widely used around the world; it
should also be used in Lao PDR, certainly for rice, but also eventually for other crops.
One possible application of sample surveys is to validate the existing administrative data.
For example, initially, crop cutting surveys might be used to assess the quality of the reported
yield and production data. Periodic surveys could also be conducted to validate reported crop
area data. Sample surveys could also be used in conjunction with the administrative reporting
system itself – for example, to report data for a sample of villages only. This would enable the
administrative reporting operation to be more closely supervised and controlled.
Information on crop conditions and crop losses due to flooding, drought and pests are
included in the weekly reports. However, no crop condition reports as such are prepared or
disseminated. Also, no formal crop production forecasting is done. There have been some training
initiatives in this area and some unofficial rice production forecasts have been prepared, but this
work has not been regularized. This is an important area for further work in MAF.
2.1.3 Livestock statistics
Livestock statistics are prepared based on the administrative reporting system described
in Section 2.1.2. Data are transmitted through the various administrative levels. Livestock
information is reported irregularly and is limited to data on the number of cattle, buffaloes, pigs,
goats/sheep, and poultry according to the specifications given in the Ministerial Decision on
STRATEGIC PLAN FOR AGRICULTURAL AND RURAL STATISTICS, LAO PDR
19
Agricultural Statistics. Livestock statistics have the same administrative reporting weaknesses as
crop statistics.
DLF releases some livestock production data based on assumptions about slaughtering
rates, milk yields and productivity of layers. These data are not formally published. To improve
this estimation, periodic sample surveys should be conducted to measure basic livestock
production parameters. CAS has some experience with these types of surveys. The agricultural
censuses provide baseline data which could also be useful in estimating current livestock
statistics.
2.1.4 Fisheries and aquaculture statistics
Fisheries statistics are prepared based on the administrative reporting system described in
Section 2.1.2. The only two data items reported are the production of capture and culture fisheries.
Village heads find it difficult to report fisheries information and the data may not be of high
quality. Improved data collection methods are needed.
Some fisheries related information was collected in LCA 2010/11, including whether the
household had any aquaculture facilities and whether it was engaged in capture fisheries. Data
were also collected on: types of aquaculture production facility (rice-cum-fish culture, pond, cage,
tank, other); area of aquaculture; whether aquaculture products were sold; where capture fishing
was done (river, lake/reservoir, swamp/seasonal floodplain, rice field, irrigation canal, village
pond, other); and whether capture fisheries products were sold. Most fisheries activities are
carried out by households; therefore, a periodic household fisheries survey would be useful for
compiling fisheries statistics.
2.1.5 Forestry statistics
DOF is responsible for the collection of forestry data. Data are provided on quantity of tree
seeds collected, number of seedlings produced, area planted to trees, and area of forest
regenerated. The data are obtained from provincial reports and are not considered of high quality.
Provinces also provide data on timber production, based on reports submitted by loggers. These
data are also not considered reliable: there are no consistent procedures for reporting data,
loggers often do not maintain good records, and data reported are not always complete.
No data are available on the collection of firewood or non-timber forest products, apart
from data from LCA 2010/11, which collected data on whether the household exploited public
forests and, if so, what forest products were extracted (timber, fuel wood, bamboo, mushrooms,
fruit and vegetables, other) and whether any of those products were sold. Periodic household
forestry surveys would help in compiling forestry statistics.
Data on exports of timber products are compiled by MOIC based on Customs Department
data.
STRATEGIC PLAN FOR AGRICULTURAL AND RURAL STATISTICS, LAO PDR
20
2.1.6 Agricultural markets and prices statistics
LSB compiles the Consumer Price Index (CPI) every month. Data are collected for 245 items
from 18 markets in 12 provinces. The base year is 2010. Data presented include the CPI for each
of 12 groups, as well as average market prices for major crop, livestock and fisheries products. It
is planned to expand the coverage of the CPI to cover all provinces.
The NSDS mentions the need for LSB to develop producer price data for main products, in
coordination with concerned agencies. It has been agreed that MAF should have responsibility
for the collection of agricultural producer prices. CAS has instituted farm-gate price collection,
but the data are difficult to collect, are not regularly submitted, and are not disseminated. A sound
and workable system for the collection of farm-gate prices should be developed.
2.1.7 Water and environment statistics
The NSDS highlights the lack of statistics on the environment in Lao PDR and the need to
develop statistics in this field in accordance with international standards.
Irrigation data are reported as part of MAF’s administrative reporting system. The data
reported are: area irrigated by season, number of facilities and area irrigated by type of facility
(irrigation dams, reservoirs, pumps, gates and dykes, temporary weirs, and gabions). The area data
are thought to relate more to the command area of irrigation projects rather than actual area
irrigated. No data are provided on the use of irrigation for specific crops.
MONRE monitors and coordinates the environment nationally and has compiled various
environmental data, including greenhouse gas emissions from agriculture. Some limited
environmental data were collected in the agricultural censuses.
2.1.8 Food security and nutrition statistics
The five-yearly Lao Expenditure and Consumption Survey (LECS) provides information to
help measure the prevalence of undernourishment. Several nutrition and food security surveys
have also been undertaken. In 2012, CAS undertook the Food Security Risk and Vulnerability
Survey, funded by AusAID. In the same year, LSB carried out the Lao Social Indicator Survey. LSB
has also recently undertaken a Baseline Survey on Food Security and Nutrition in five provinces.
2.1.9 Rural development statistics
Rural development statistics cover the characteristics of the rural population, including
employment in agricultural and non-agricultural jobs, socio-economic status, housing conditions,
and access to services such as water, electricity, communications infrastructure and transport
facilities. The primary sources of data for rural development statistics are population and housing
censuses and other national household surveys such as LECS.
For CPH 2005, the urban/rural status of each village was defined according to certain
criteria relating to population, vicinity to a district or provincial capital, road access, availability
STRATEGIC PLAN FOR AGRICULTURAL AND RURAL STATISTICS, LAO PDR
21
of services, and presence of a market. Rural villages were divided into two categories: those with
year-round road access and those without year-round road access. The urban/rural classification
enables the population and housing censuses and other household surveys to be tabulated for
rural areas, providing the basis for generating rural development statistics. CPH 2005 provided
data on housing conditions, access to services, demographic characteristics, labour force
characteristics, literacy and educational attainment for rural villages. LECS provides data on
household expenditure, consumption and nutrition for rural villages. LCA 2010/11 provided data
on rural infrastructure and services.
There are also other sources of rural development statistics: data on rural roads are
available from the relevant transport authorities; data on area equipped for irrigation are
available from MAF.
2.1.10 Other agriculture related statistics
Cost of production. No cost of agricultural production surveys have been undertaken in Lao
PDR. Cost of production data are needed for each agricultural production activity.
National accounts. LSB compiles national accounts statistics for Lao PDR annually based on
the United Nations System of National Accounts (SNA). To compile the national accounts for the
agricultural sector, production data are obtained from MAF, input data are derived from LECS,
and price data are obtained from various sources. The quality of national accounts for the
agricultural sector is affected by weaknesses and gaps in the agricultural statistics.
Lao Expenditure and Consumption Survey (LECS). LSB conducts a LECS approximately
every five years. The fifth and most recent survey was in 2012/13. It collected data on socio-
economic characteristics of households, access to services, household expenditure, household
consumption, and nutrition. LECS also includes an agricultural module; for LECS 2008/09, it
included: area, production and yield for each crop; disposal of crop produce; number of livestock
and poultry by type; additions/subtractions to livestock herds; details of capture and culture
fisheries; and exploitation of own and public forest land.
International trade statistics. MOIC compiles statistics on exports and imports based on
information obtained from the Customs Department of the Ministry of Finance. Data are available
annually. The quality of the export data is considered to be quite good, except for mineral and
wood related products, which may be understated. Import data might also be understated. The
trade statistics are not based on the Harmonized Commodity Description and Coding System (HS).
Labour force survey. LSB, in collaboration with the Ministry of Labour, Social and Welfare,
conducted a household labour force survey in 2010. This was the first survey of its type
undertaken in Lao PDR, and was designed to measure demographic characteristics, education
and training, employment, unemployment, non-economic activities, and migration.
Food balance sheet. CAS compiles a food balance sheet for Lao PDR every year using data
from various sources, including MAF’s own agricultural production data, nutrition data from the
Ministry of Health, food consumption data from LECS, and export/import data from MOIC. There
STRATEGIC PLAN FOR AGRICULTURAL AND RURAL STATISTICS, LAO PDR
22
are weaknesses in data on stocks, post-harvest losses and domestic utilization of food products.
CAS does not formally publish the food balance sheets.
Food stocks. There are no data on food stocks in Lao PDR. There is no national rice reserve
in the country. At any time, there are stocks of rice held by households, rice millers, wholesalers
and retailers.
Land use. Some statistics on land use were provided by the two agricultural censuses. The
data were based on FAO guidelines and referred to the main use of the farm household’s land.
DOF has provided land use data for 1982, 1992 and 2002, using remote sensing. Agricultural land
was divided into: rice paddy, agricultural plantation, and other agricultural land.
Agro-processing statistics. There are no formal statistics on agro-processing, apart from
export data.
2.2 Data dissemination
LSB issues the Statistical Yearbook in the middle of each year. The Yearbook contains a
range of economic and social data, including data on agriculture obtained from MAF. LSB shows
some statistics on its website, including agricultural statistics.
CAS’s only regular agricultural statistics release is the Agricultural Statistics Yearbook,
issued in the middle of each year. The 2015 issue presents crop data for the 2014 wet season and
the 2013/14 dry season. This is too late for most users. There is little commentary in the Yearbook
to help users interpret and analyze the data. DOA issues three crop reports a year: a wet season
report early in the year showing data for the previous year (the 2015 issue shows data for the
2014 wet season); a dry season report in August/September providing data for the most recent
dry season (the 2015 issue shows data for the 2014/15 dry season); and a combined report in
April each year, showing data similar to the Agricultural Statistics Yearbook. There may be
discrepancies in the CAS and DOA data. The roles of CAS and DOA in data dissemination should
be clarified.
There are several online databases available in Lao PDR showing agricultural statistics. Lao
DECIDE5 is a government initiative to provide key national databases and tools to enable users to
tabulate and map data. Village-level data from LCA 2010/11 are shown. Further facilities for
analyzing agricultural census data are being developed. Lao Info is a database of socio-economic
indicators for Lao PDR maintained by LSB based on DevInfo6, the United Nations database system
used for monitoring the MDGs. So far, little data are available on Lao Info. In 2013, a DevInfo
application was developed to provide district-level tables from LCA 2010/11. Agricultural data
for Lao PDR are also shown on a number of international databases, including AFSIS and FAO’s
online database, FAOSTAT7.
5 See http://www.decide.la. 6 See http://www.devinfo.org. 7 See http://faostat.fao.org.
STRATEGIC PLAN FOR AGRICULTURAL AND RURAL STATISTICS, LAO PDR
23
An important element in data dissemination is the Lao PDR National Data Archive
(LNADA) 8 . LNADA is a web-based data repository system maintained by LSB providing
documentation and metadata on all major national statistical collections, including the
methodology, sample design, data collection, data processing, and data collected. LCA 2010/11 is
included in LNADA.
A data dissemination system is needed in CAS to provide a wider range of more timely
statistics. A monthly crop condition report should be issued. CAS should also disseminate price
data, as well as food balance sheets. Most data releases can be done via the Internet. CAS will need
to develop a website for this purpose. A data release calendar is also needed.
2.3 Assessment of user satisfaction and needs
Agricultural and rural statistics have many uses. Governments need statistics to measure
the performance of the agricultural sector, to plan and monitor development programmes, and to
compile the national accounts. The international development community needs statistics to help
plan and implement development programmes. Institutes such as NAFRI and NUOL need data for
agricultural research and analysis. The private sector needs information to help in their
commercial operations. The farmers themselves are also potential users of agricultural statistics,
especially market related data, to help make decisions about their farm operations.
The most important user of agricultural and rural statistics is the government. In Lao PDR,
MAF and its technical departments are the principal users. MPI and the Bank of Lao PDR are other
important users, along with MONRE and MOIC. The Ministry of Health is an important user of
food security statistics. Under the former central planning system, the main government needs
were for data on agricultural production and farm operations; now, the emphasis is on market
issues, sustainable development, food security and rural development.
LSB and MAF acknowledge the weaknesses in basic agricultural statistics from the
administrative reporting system and the need for improvements in the reporting procedures.
There are also major data gaps, especially on agricultural prices, livestock production, land and
water management, the environment, cost of production, and forest management. The SPARS is
designed to address those issues.
The GS initiative provides a mechanism for countries to identify data of most importance
for agricultural policy making and planning. Under the first GS pillar (see Section 1.1), it is
recommended that countries determine a minimum set of core data to provide internationally
comparable indicators. The core items in the GS are based on their importance to global
agricultural production. Economic data are presented under nine headings (output, trade, stocks,
inputs, agro-processing, prices, final expenditure, rural infrastructure, and international
transfer). Social data cover demographic and economic activity items. Environmental data
include soil degradation, water pollution and agricultural emissions. In the GS, the core data are
limited to eight core crops (wheat, maize, barley, sorghum, rice, sugar cane, soya bean and cotton)
and five core livestock types (cattle, sheep, pigs, goats and poultry). The GS recommends that each
country select core items appropriate for its agricultural situation. In Lao PDR, the core crops
8 See http://www.nsc.gov.la/nada/index.php/home.
STRATEGIC PLAN FOR AGRICULTURAL AND RURAL STATISTICS, LAO PDR
24
have been identified as: rice, maize, sugar cane, soya bean and cotton. The core livestock types
are: cattle, pigs, goats and poultry.
The minimum set of core data items for Lao PDR is shown in Annex VI, together with the
required frequency and sources for each data item. This provides a good basis for identifying data
needs, gaps and priorities to help in developing the SPARS action plan, with emphasis given to
improving the statistics for the core crop and livestock items.
Key data needs can also be identified by reference to the indicators for the M&E systems
for the Agriculture Development Strategy. These include:
GDP separately for the agriculture, livestock, fisheries and forestry sub-sectors;
daily per capita energy intake;
per capita consumption of major food groups;
production of each crop type;
production of rice according to glutinous/non-glutinous varieties;
rice exports;
rice stocks; and
production of meat, fish and eggs.
The indicators for monitoring the NSEDP and SDGs also help to identify needs for
agricultural and rural statistics. At the time of preparation of this SPARS, the M&E system for
NSEDP 2016-2020 had not yet been finalized. For the SDGs, draft indicators have been
preparedand the availability of the necessary data to measure those indicators in Lao PDR is being
reviewed. It is expected that data needs for the NSEDP and the SDGs will be similar to those
required to monitor the Agriculture Development Strategy.
The agricultural censuses have provided valuable data on the structure of agricultural
holdings in Lao PDR. The agricultural sector in Lao PDR is undergoing rapid change, especially
with increasing farm mechanization, better access to markets, and changes in cropping patterns.
Users stress the need for agricultural censuses to be repeated, at least once every ten years, to
measure those changes. There is a strong argument for bringing forward the date of the next
agricultural census to 2019 (from 2021) to provide data in time to help in preparing the next
round of development plans; that is, agricultural census data would be available in 2020, in time
to review NSEDP 2016-2020 and to prepare NSEDP 2021-2025. In the future, agricultural
censuses should be undertaken in years ending in “9”.
There is a growing awareness in Lao PDR of the importance of agricultural research in
support government policy making. Agricultural censuses and other household surveys are
valuable for this purpose because they enable analysis of household-level data. The two
agricultural censuses are the only national household-based agricultural surveys conducted to
date in Lao PDR. Implementing a regular programme of household surveys will provide greater
opportunities for analysis and research.
Farmers in Lao PDR will increasingly demand statistical information to help manage farm
operations. With the emphasis on marketing and exports, farmers need to be aware of the market
STRATEGIC PLAN FOR AGRICULTURAL AND RURAL STATISTICS, LAO PDR
25
situation, and some countries establish market information systems for this purpose. In the long
run, farmers might also need other information on crop plantings, weather, stocks, international
trends and exchange rates. These needs should be recognized in developing statistical systems.
There is general support in Lao PDR for the decentralized statistical system and the role of
line ministries, including MAF, in the collection and dissemination of statistics. There is also
recognition of the need for data collecting agencies to work closely with LSB to ensure a
coordinated and integrated national statistics system. For agriculture, there is some duplication
in data collection between LSB and the different departments in MAF, and data are not always
consistent. This makes it difficult for users, and needs to be addressed in the SPARS action plan.
2.4 Capacity assessment
Budget
The NSDS estimates the cost of the national statistics system in Lao PDR as approximately
21.8 billion kips per year, excluding salaries. This includes 15.0 billion kips per year for survey
expenses, of which only 3.7 billion kips are expected to be available from the government budget.
Donor assistance for major statistical activities will continue to be needed for the immediate
future.
In LSB, the budget for staffing has risen in recent years as staff numbers have increased.
Within MAF, funds are provided for staffing CAS and the departments’ statistical units, but there
is little funding for data collection, training or data dissemination. The government also funds
statistical staff in the provinces and districts but there is little funding for field or data collection
activities.
The development of new statistical methodologies for agricultural statistics in Lao PDR has
largely been driven by funds from donor agencies. Usually, activities initiated under international
projects were not able to be sustained after the projects ended. For LCA 2010/11, the government
made a contribution of US$ 211 000 plus other in-kind costs such as staffing and office expenses.
It is expected that the government share of funding for major statistical activities will gradually
increase.
Human resources
Technical staff in LSB have good working knowledge of all aspects of the design, collection
and processing of censuses and surveys as a result of the long-running Sida statistics project and
the participation of staff in domestic and international training and study tours. The NSDS notes
that the number of statistical staff in LSB and in other agencies is low compared to other countries,
and this is considered an impediment to further developing the statistical system. The NSDS
recommends increasing the number of staff in LSB from 59 in 2010 to 160 by 2015 and to 200 by
2020. By April 2015, the number had increased to 129. Of these, only two staff worked part-time
on agricultural statistics. The NSDS recognizes that capacity building will be needed for new staff.
Existing staff should also be encouraged to enhance their educational qualifications. It is
STRATEGIC PLAN FOR AGRICULTURAL AND RURAL STATISTICS, LAO PDR
26
envisaged that over the period 2010-2020, 30 LSB staff will receive a diploma or
bachelor/masters degree and three will obtain a doctoral degree.
The NSDS recommends that there should be 6-10 statistical staff in each ministry. It also
identifies the need to enhance knowledge and build the capacity of statistical staff in MAF and
other line ministries. There are currently 13 staff in CAS and one or more statistical staff in each
technical department. This exceeds the NSDS recommendation, but is appropriate given the
importance and scope of the agricultural sector.
Organizationally, CAS is a centre under DOPC, headed by a director. It reports to a Deputy
Director-General of DOPC. The 13 staff consist of 10 permanent officers, two temporary officers
and one volunteer. There is recognition in MAF that upgrading CAS – perhaps to a department –
would help to give the unit the authority to better manage the agricultural statistics system in
technical agencies, PAFOs and DAFOs. MAF is considering this matter. With or without an upgrade,
CAS should be reorganized to more effectively carry out its role. Specialist units may be needed
for statistical standards, administrative reporting, sample surveys, data processing, training and
data dissemination.
Only two officers in CAS have a degree from a foreign university. The degrees are not in
statistics. Others have degrees from NUOL. Some officers have attended international training
courses, including the basic statistics course in SIAP. Two attended a three-month course in crop
forecasting at FAO. Some officers have attended international statistical meetings abroad.
The various international project activities over the last 20 years have provided good
experience for CAS staff in agricultural census and survey work. However, the officers with the
most experience have moved into senior positions and are approaching retirement. The majority
of CAS staff have been recruited in the last 5-10 years. The next generation of statisticians needs
to be developed to take the agricultural statistics system forward.
The recent agricultural census provided CAS staff with experience in all aspects of
conducting a census. Six CAS staff were assigned to the Agricultural Census Office for a two-year
period where they worked on the planning, design and development of the census, including
questionnaire design, pilot testing, budget planning and field organization. They also trained field
staff, performed the role of provincial census coordinators, supervised the census data entry and
editing, and prepared and disseminated census output. Training was provided throughout the
various phases of the census.
CAS staff have good general computer skills and all are familiar with Microsoft Word and
Excel. Some have limited capacity in using Microsoft Access. Some have been trained in SPSS but
have not worked with this software. Most staff are familiar with GIS and have some experience in
statistical mapping work. Further capacity building is needed in CAS, particularly in data
processing and data management, data analysis and report writing, and data dissemination,
especially electronic dissemination.
Statistics Units in MAF technical departments usually have one or two staff. Most statistical
staff have no formal education or training in statistics. Training is needed in statistical methods,
data processing and data management.
STRATEGIC PLAN FOR AGRICULTURAL AND RURAL STATISTICS, LAO PDR
27
The NSDS recognizes the need for building the capacity of statistical staff in PAFOs and
DAFOs. Most of these staff have no formal education or training in statistics. As well as general
statistical training, they should also be given training specific to their responsibilities in managing
and supervising data reporting activities as part of an improved administrative reporting system.
Village officials should also be given training relevant to their statistical responsibilities.
The development of a long-term training programme for agricultural statistics officers in
MAF is an important output of the SPARS. Over the next ten years, the aim for some CAS staff is
to provide opportunities for them to receive a diploma or bachelor/master/doctoral degree in
statistics from universities in the region. These staff can then pass on specialist knowledge
through in-country training. Consideration should be given to establishing an Agricultural
Statistics Training Unit in CAS or elsewhere to provide training to staff at all levels. Links might
be established with one or more of the agricultural colleges to support this training. NAFRI might
also have a role to play in this training.
Another area for capacity building in agricultural and rural statistics is to increase
awareness amongst users of how data can be used for planning and policy making. The SPARS
should include activities aimed at raising statistical awareness, especially amongst senior-level
officers in MAF.
Use of information and communication technology
The NSDS highlights the need for improving the ICT infrastructure for an effective national
statistics system. It recommends that ICT equipment be upgraded and suitably maintained at all
levels to ensure efficient and effective statistical production, and that software such as SQL Server,
SPSS, STATA and ArcView be upgraded to help in data processing, analysis, storage and
dissemination. Improvements in networking between the central and local levels were also
foreseen, to facilitate statistical coordination and data exchange and to improve data
management.
NAFRI is currently overseeing ICT development in MAF within the framework of the overall
e-government strategy. This envisages the development of the necessary infrastructure to
connect central-level government agencies with provinces, districts and villages, and training of
users and information services personnel to effectively use those services. In MAF, the aim is to
integrate ICT facilities and improve the capacity to collect, analyze, store and share agricultural
information. The improvement in communication facilities in the country also opens up
possibilities for the use of tablet computers or mobile phones in data collection work.
Adequate computer facilities are available in LSB and CAS. In CAS, the computers are not
fully networked but all have an internet connection. Computer facilities in PAFOs are also good,
and they all have internet access. DAFO staff have some access to computers but only some have
internet access. Computer facilities are generally not available at the village level.
LSB processes its censuses and surveys using SQL Server and Microsoft Access. It has no
experience in CSPro. Tables are usually prepared using SPSS. To date, all LSB census/survey
processing work has been done centrally. As computer networks and staff skills improve in the
provincial statistics centres, future data entry, and even much of the editing, could be done in the

STRATEGIC PLAN FOR AGRICULTURAL AND RURAL STATISTICS, LAO PDR
28
provinces. LCA 2010/11 planned to use scanning for data capture, but it was decided that
keyboard data entry was more suitable. In Lao PDR, computers are cheap, the technology is
uncomplicated, labour costs are low, and experienced operators are readily available. The data
entry for LCA 2010/11 was done by a private contractor, which worked well.
Physical infrastructure
In Lao PDR, there are only a limited number of telephone landlines, but mobile phone use
is high with an estimated 90 percent penetration rate. Mobile phone service is good, even in rural
and remote areas, which provides opportunities to improve the collection and transmission of
statistical information. In the LCA 2010/11, good use was made of mobile phone services to
manage and supervise the data collection work.
Internet use in Lao PDR is still quite low. However, with the availability of cheap
smartphones, the demand for the internet is growing and internet services are becoming
increasingly available, even in small towns. By 2015, 3G internet services were available in all
district headquarters.
The road network in Lao PDR has improved considerably over the last 15 years. There are
now sealed road connections to all provincial capitals (except Phonesaly) and most district
capitals. Road connections to villages have also improved. However, a third of villages do not have
year-round road access, and one in ten have no road access at all. The improvement in roads has
made data collection easier. Few vehicles are available in MAF for statistical work, though
government officers usually have access to a motor vehicle of some sort, often a motor cycle. The
government practice for data collection and other field activities is to pay field staff an allowance
when they use their own vehicle for official work.
2.5 SWOT analysis
SWOT (strengths, weaknesses, opportunities, threats) analysis is a useful tool in assessing
the existing agricultural statistics system in Lao PDR and planning its future development. In
particular, it identifies:
the weaknesses in the current agricultural statistics system;
the organizational and administrative strengths that exist within LSB and MAF to help
overcome those weaknesses;
the external factors that provide opportunities to improve the statistical system; and
the external factors that represent threats to making those improvements.
A SWOT analysis was carried out for the agricultural statistics system as a whole, as well as
for three sub-sectors: crops, livestock and fisheries, and forestry. Results are shown in Annex VII,
and are summarized below.
The main strengths are the availability of the ARS, which provides a framework for the
development of agricultural statistics, and the Ministerial Decision on Agricultural Statistics, which
establishes the responsibilities of all parties in the production, management and dissemination
STRATEGIC PLAN FOR AGRICULTURAL AND RURAL STATISTICS, LAO PDR
29
of agricultural statistics. The presence of a well-staffed CAS provides a good base for improving
statistics. The statistical units in technical departments, PAFOs and DAFOs provide useful
resources for agricultural statistics activities. MAF and LSB have successfully conducted two
agricultural censuses, leading to attainment of valuable experience for introducing improved
methodologies in agricultural statistics, especially sample surveys.
The main weakness is the reliance on administrative reporting for most current
agricultural statistics. This methodology is not statistically sound and data are not always of high
quality. The crop cutting methodology is not used for crop production statistics. No livestock
production data are available. It is difficult to report reliable fisheries and forestry data.
Agricultural statistics are not widely disseminated and data are usually made available too late
for useful planning and policy making. Available technology is not fully utilized. Skill shortages in
statistics exist at all levels.
Good opportunities are provided by a government priority on statistics, as reflected in the
adoption of the Statistics Law, the upgrading of LSB, and the increase in LSB staff. The Statistics
Law clearly defines the scope of agricultural statistics and the relationship between MAF and LSB
at all levels. The NSDS provides a long-term vision for the overall development of statistics,
including agricultural statistics. The GS initiative also provides opportunities to tap into strong
donor interest in agricultural and rural statistics. Agriculture continues to be one of Lao PDR’s
key economic sectors and is given high priority in the NSEDP, which focuses attention on the need
for reliable agricultural statistics.
As in many countries, the main threat to efforts to improve the agricultural statistics system
is the lack of funds. The planned introduction of new methodologies involving more household
data collection and use of technology is likely to be constrained by funding shortages. There might
also be some institutional resistance to introducing new statistical methodologies. Frequent
changes to administrative units also make it difficult to keep sample frames up-to-date.
STRATEGIC PLAN FOR AGRICULTURAL AND RURAL STATISTICS, LAO PDR
30
CHAPTER 3
PLANNING
In Chapter 2, the agricultural and rural statistics system in Lao PDR was described and the
data collection methodologies evaluated. User needs for agricultural and rural statistics were
assessed against the background of the national development plans, and data gaps were identified.
The national capability to produce the required statistics was also assessed. This sets the scene
for the formulation of the SPARS, which is presented in this chapter.
The SPARS for Lao PDR has been prepared based on the NSDS methodology (PARIS21, 2004;
PARIS21, 2007), using FAO guidelines for the development of a SPARS (FAO, 2014b). The SPARS
has several elements:
The vision for the agricultural and rural statistics system provides a concise statement
of the desired future state of agricultural and rural statistics in the country.
The mission statement concisely outlines how the government will go about realizing
the defined vision.
The strategic goals show the overall accomplishments to be achieved.
The outputs show what will be produced to achieve the stated goals.
The activities describe the specific actions necessary to deliver the stated outputs.
The SPARS activities are presented in an action plan, which sets out what needs to be done,
by whom, when, and at what cost. A calendar of censuses and surveys is also prepared to support
the action plan. A financing strategy for the action plan is also provided, including the use of
national and external funding sources. An M&E plan for monitoring, reviewing, reporting and
evaluating the implementation of the SPARS is also presented.
The development of the SPARS in Lao PDR took into account the need to integrate it into
the NSDS framework and the existing action plan for agricultural and rural statistics that is part
of the ARS. As noted in Section 1.6, the NSDS for Lao PDR has seven goals, nine objectives and four
strategies. The SPARS has been integrated into the NSDS at the strategy level. There are no specific
SPARS activities under the fourth NSDS strategy. The remaining three NSDS strategies have been
defined as the SPARS strategic goals.
In formulating the SPARS, the aim was to further develop the ARS, rather than produce a
whole new action plan. The ARS specifies the impact and outcome, and defines seven outputs and
associated activities. The ARS impact and outcome statements have been modified to fit in with
the SPARS concepts of vision and mission. The SPARS outputs are the same as the seven ARS
outputs, organized under the appropriate strategic goal.
In the ARS, all statistical development work is covered under the output “good and
appropriate data collection methods are adopted”. The SPARS aims to provide more technical
detail on the required statistical development work. Therefore, in the SPARS, this output has been
STRATEGIC PLAN FOR AGRICULTURAL AND RURAL STATISTICS, LAO PDR
31
sub-divided into ten sub-outputs corresponding to specific areas of statistical development, such
as the agricultural census and agricultural prices. The activities under each output in the SPARS
action plan are based on the ARS, but provide more detail on the work to be carried out. The
timetable of activities given in the ARS has been revised.
3.1 Vision and mission
Vision
Mission statement
3.2 Strategic goals and outputs
Goal 1: Improving regulation and institutional frameworks for agricultural and rural
statistics.
Output 1.1. Effective coordination mechanisms among agricultural and rural statistics
stakeholders established.
Output 1.2. Adequate number staff in agricultural and rural statistics hired.
Goal 2: Developing statistical infrastructure for agricultural and rural statistics.
Output 2.1. Adequate training programmes developed and implemented.
Output 2.2. Adequate data collection equipment and support mechanisms made available.
Goal 3: Managing and developing agricultural and rural statistics.
Output 3.1. Uniform standards, concepts and methods for agricultural and rural statistics
developed and applied across all districts and government agencies.
Output 3.2. Good and appropriate data collection methods adopted.
Sub-outputs
3.2.1 Required agricultural and rural indicators are produced and additional indicators
developed.
3.2.2 Sound methodology for the estimation of value added for the agricultural sector is
developed and implemented.
3.2.3 Improved administrative reporting system for agricultural and rural statistics
implemented.
A sustainable system for agricultural and rural statistics that meets international standards, supporting informed decision making in the agricultural sector.
To implement a sustainable agricultural and rural statistics system that provides comprehensive, timely, transparent and reliable data using up-to-date methods for the collection, processing and dissemination of statistics.
STRATEGIC PLAN FOR AGRICULTURAL AND RURAL STATISTICS, LAO PDR
32
3.2.4 Master sample frame for agricultural surveys established.
3.2.5 Third agricultural census conducted and results disseminated.
3.2.6 Regular crop condition reports prepared and disseminated.
3.2.7 Improved system for crop production statistics implemented.
3.2.8 Programme of agricultural sample surveys implemented and results disseminated.
3.2.9 Statistical system for agricultural prices implemented.
3.2.10 Improved food balance sheets published.
Output 3.3. Data dissemination system developed and applied.
3.3 Implementation
3.3.1 Implementation arrangements
CAS will have the primary responsibility for implementing the SPARS. A SPARS coordinator
will be appointed from within CAS to oversee the SPARS implementation, under the overall
guidance of the SCA and the technical direction of the TWA. LSB will provide technical support to
CAS as needed. CAS will collaborate with MAF’s technical departments, PAFOs and DAFOs in
carrying out SPARS activities.
3.3.2 Action plan
The action plan for implementing the SPARS is illustrated in Annex VIII. It shows activities
for each output and sub-output, together with who is responsible for the activity, when the
activity is scheduled, and the inter-relationships between activities. For the first two years of the
SPARS implementation (2016 and 2017), the action plan details activities undertaken in each
quarter. For the remaining years, only a broad description of activities for each year is given.
Detailed annual action plans will be prepared as part of the SPARS annual reports for
endorsement by the SCA.
The main activities in 2016 and 2017 will be:
Output 1.1. Review LSB and MAF field practices; develop coordination proposals; and
revise the agricultural component of the village book.
Output 1.2. Review the organizational structure of CAS and statistics units in MAF
technical departments; and prepare functional statements and job descriptions.
Output 2.1. Prepare staff development plans for agricultural statistics staff in CAS, MAF’s
technical departments, PAFOs and DAFOs; and evaluate options for in-country training
including NUOL, agricultural colleges, NAFRI and CAS.
Output 2.2. Evaluate the local to central level data transfer system and prepare an ICT
plan for improving data transfer.
Output 3.1. Evaluate and document the administrative reporting system; review
concepts and methods used for data reporting; and prepare a manual on standards,
concepts and methods in agricultural statistics.
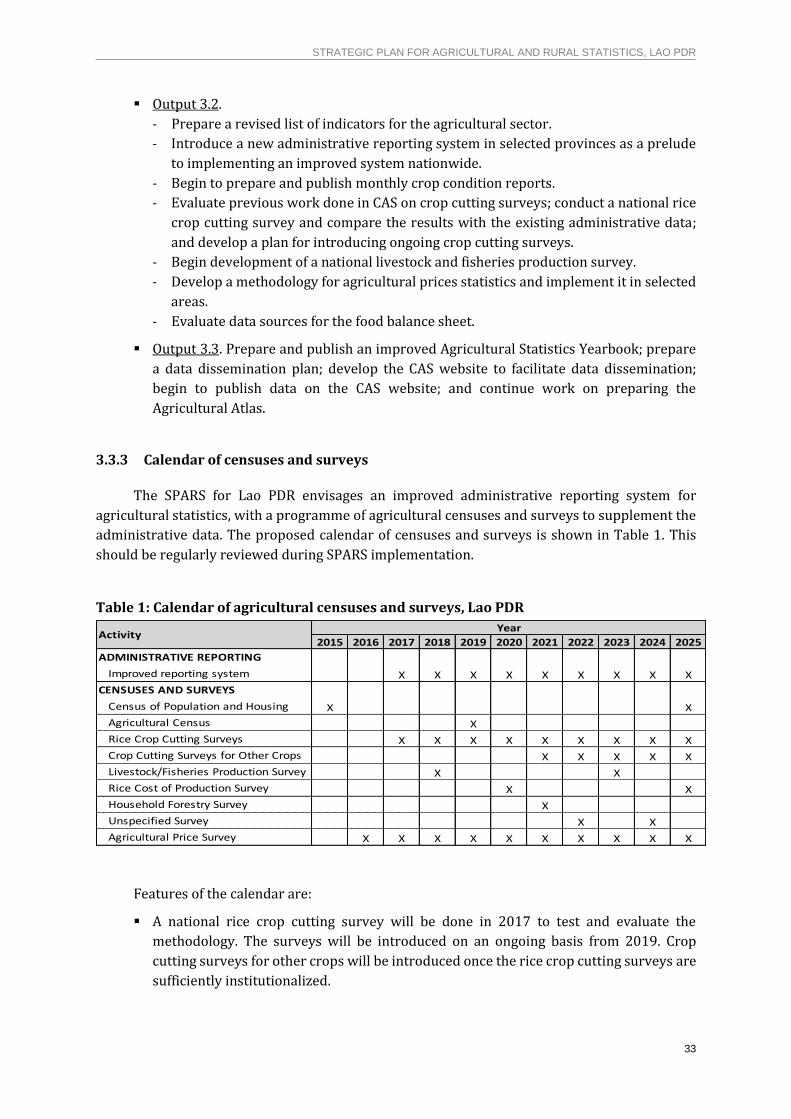
STRATEGIC PLAN FOR AGRICULTURAL AND RURAL STATISTICS, LAO PDR
33
Output 3.2.
- Prepare a revised list of indicators for the agricultural sector.
- Introduce a new administrative reporting system in selected provinces as a prelude
to implementing an improved system nationwide.
- Begin to prepare and publish monthly crop condition reports.
- Evaluate previous work done in CAS on crop cutting surveys; conduct a national rice
crop cutting survey and compare the results with the existing administrative data;
and develop a plan for introducing ongoing crop cutting surveys.
- Begin development of a national livestock and fisheries production survey.
- Develop a methodology for agricultural prices statistics and implement it in selected
areas.
- Evaluate data sources for the food balance sheet.
Output 3.3. Prepare and publish an improved Agricultural Statistics Yearbook; prepare
a data dissemination plan; develop the CAS website to facilitate data dissemination;
begin to publish data on the CAS website; and continue work on preparing the
Agricultural Atlas.
3.3.3 Calendar of censuses and surveys
The SPARS for Lao PDR envisages an improved administrative reporting system for
agricultural statistics, with a programme of agricultural censuses and surveys to supplement the
administrative data. The proposed calendar of censuses and surveys is shown in Table 1. This
should be regularly reviewed during SPARS implementation.
Table 1: Calendar of agricultural censuses and surveys, Lao PDR
Features of the calendar are:
A national rice crop cutting survey will be done in 2017 to test and evaluate the
methodology. The surveys will be introduced on an ongoing basis from 2019. Crop
cutting surveys for other crops will be introduced once the rice crop cutting surveys are
sufficiently institutionalized.
2015 2016 2017 2018 2019 2020 2021 2022 2023 2024 2025
ADMINISTRATIVE REPORTING
Improved reporting system X X X X X X X X X
CENSUSES AND SURVEYS
Census of Population and Housing X X
Agricultural Census X
Rice Crop Cutting Surveys X X X X X X X X X
Crop Cutting Surveys for Other Crops X X X X X
Livestock/Fisheries Production Survey X X
Rice Cost of Production Survey X X
Household Forestry Survey X
Unspecified Survey X X
Agricultural Price Survey X X X X X X X X X X
ActivityYear
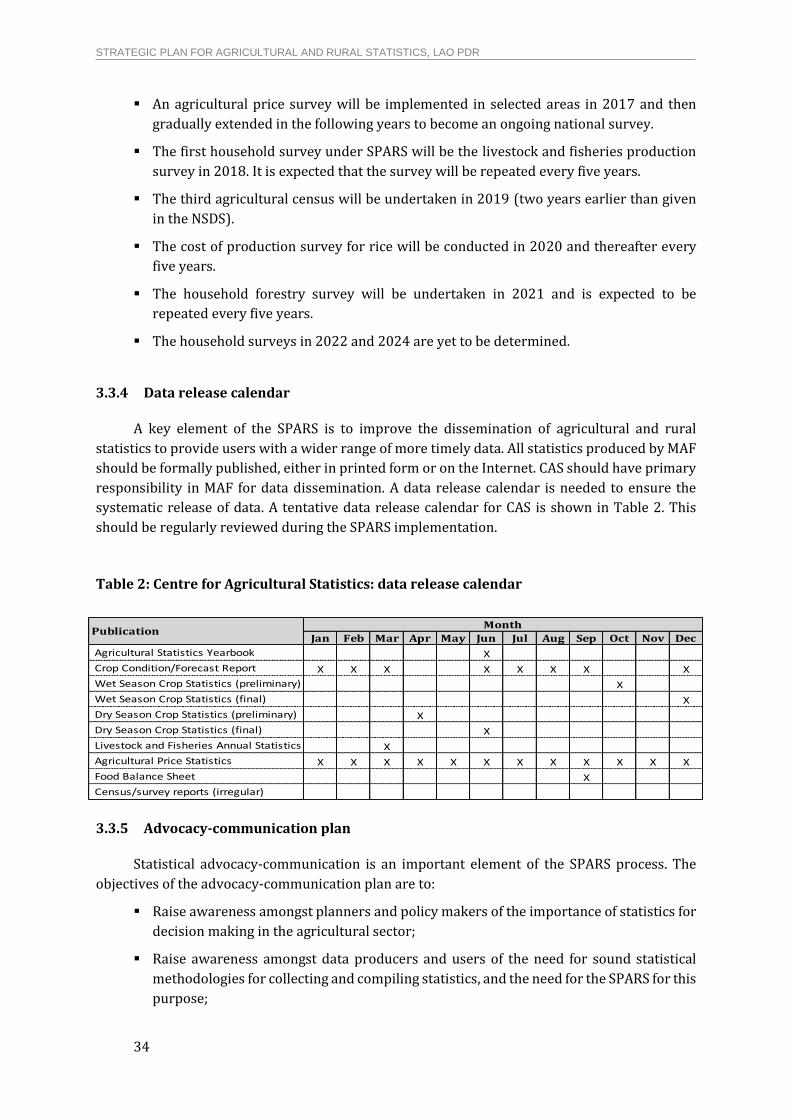
STRATEGIC PLAN FOR AGRICULTURAL AND RURAL STATISTICS, LAO PDR
34
An agricultural price survey will be implemented in selected areas in 2017 and then
gradually extended in the following years to become an ongoing national survey.
The first household survey under SPARS will be the livestock and fisheries production
survey in 2018. It is expected that the survey will be repeated every five years.
The third agricultural census will be undertaken in 2019 (two years earlier than given
in the NSDS).
The cost of production survey for rice will be conducted in 2020 and thereafter every
five years.
The household forestry survey will be undertaken in 2021 and is expected to be
repeated every five years.
The household surveys in 2022 and 2024 are yet to be determined.
3.3.4 Data release calendar
A key element of the SPARS is to improve the dissemination of agricultural and rural
statistics to provide users with a wider range of more timely data. All statistics produced by MAF
should be formally published, either in printed form or on the Internet. CAS should have primary
responsibility in MAF for data dissemination. A data release calendar is needed to ensure the
systematic release of data. A tentative data release calendar for CAS is shown in Table 2. This
should be regularly reviewed during the SPARS implementation.
Table 2: Centre for Agricultural Statistics: data release calendar
3.3.5 Advocacy-communication plan
Statistical advocacy-communication is an important element of the SPARS process. The
objectives of the advocacy-communication plan are to:
Raise awareness amongst planners and policy makers of the importance of statistics for
decision making in the agricultural sector;
Raise awareness amongst data producers and users of the need for sound statistical
methodologies for collecting and compiling statistics, and the need for the SPARS for this
purpose;
Jan Feb Mar Apr May Jun Jul Aug Sep Oct Nov Dec
Agricultural Statistics Yearbook X
Crop Condition/Forecast Report X X X X X X X X
Wet Season Crop Statistics (preliminary) X
Wet Season Crop Statistics (final) X
Dry Season Crop Statistics (preliminary) X
Dry Season Crop Statistics (final) X
Livestock and Fisheries Annual Statistics X
Agricultural Price Statistics X X X X X X X X X X X X
Food Balance Sheet X
Census/survey reports (irregular)
PublicationMonth
STRATEGIC PLAN FOR AGRICULTURAL AND RURAL STATISTICS, LAO PDR
35
Promote public confidence in the agricultural and rural statistics system and provide
assurances about the quality and objectivity of the data provided; and
Help in obtaining high-level commitment for the allocation of sufficient national
resources to implement the SPARS.
Advocacy is implicit in many of the SPARS initiatives. Steps taken to improve the range,
timeliness, quality and accessibility of agricultural and rural statistics should by themselves lead
to a greater awareness of the statistics and better use of the data. The SPARS approach in
developing the agricultural and rural statistics system in the context of national development
plans also reinforces the links between statistics and planning, the relevance of statistics to the
key policy issues, and the need for evidence-based planning and policy making. The inclusive
approach used in the SPARS development process has already helped to promote the need for the
SPARS and the importance of improving the quality of agricultural and rural statistics.
Specific advocacy-communication related activities in the SPARS action plan are:
Participation in the Sector Working Group on Agriculture and Rural Development. This
will help to raise awareness of the SPARS initiative amongst donors. A SPARS
presentation has already been made to this Working Group.
Formation of the SCA. This will provide high-level support for the SPARS
implementation and help in securing funding for the SPARS activities.
Creation of the TWA. This will be useful in bringing together technical experts from all
concerned agencies and addressing technical problems in the development of
agricultural and rural statistics.
Consultation with provincial, district and village officials. Local officials will be actively
involved in improving the administrative reporting system. These are the key people
needed for improving data quality and a strong message will be provided on the need
for sound and objective statistical practices.
Development of the CAS website and agricultural statistics database. Apart from data
dissemination, the website will also be useful for SPARS advocacy purposes. Materials
such as SPARS information bulletins will be shown on the website to help make users
aware of statistical developments and results.
Improved analysis of data in statistical releases. This will make it easier for users to
understand and interpret the data. Documenting data collections in statistical releases
and on the CAS website will also help in this regard.
Holding dissemination workshops for all major statistical releases. This will provide the
opportunity to work with users to ensure data are fully utilized. Policy analysis
workshops will also be held.
3.3.6 Monitoring and evaluation plan
An M&E plan is needed to ensure the successful implementation of the SPARS. The main
objectives of the M&E system are to ensure that the strategic goals of SPARS are achieved and to
track SPARS inputs, activities and outputs. In this way, stakeholders will be able to assess whether
STRATEGIC PLAN FOR AGRICULTURAL AND RURAL STATISTICS, LAO PDR
36
the SPARS implementation is on course, and the SCA will be able to take corrective action to
ensure that performance targets are met.
The M&E system for the SPARS in Lao PDR is based on a logical framework, and is given in
Annex IX. The logical framework sets out the SPARS vision, goals, outputs and activities, and
shows the assumptions/risks associated with implementing the strategy. Indicators are defined
for each element to measure the success of the SPARS implementation. For each indicator, the
status in the baseline year (2015) is shown, together with targets for the end of the NSDS (2020)
and for the end of the SPARS (2025). Data sources for the indicators are also shown.
CAS will prepare an annual report to provide an update on progress in implementing the
SPARS action plan, highlighting issues that could affect the delivery of outputs or the achievement
of the strategic goals. The report will include information on:
Activities carried out and outputs produced during the year;
Progress on the action plan and whether timetables are being met;
Funding of SPARS activities during the year;
An updated action plan and financing plan for the following year; and
Problems/issues that need to be addressed, as well as proposed solutions.
The annual report will be submitted to the SCA for consideration at its annual meeting. The
SCA should review progress and endorse the action plan and financing plan for the following year.
A mid-term evaluation will be carried out in 2020, coinciding with the final evaluation of
the NSDS. CAS, with support from the TWA and national/international consultants as needed, will
prepare a mid-term evaluation report. The report will assess the SPARS performance against the
targets for 2020, taking into account the final evaluation of the NSDS. Adjustments to the inputs,
activities or outputs necessary to achieve the SPARS goals will be proposed.
A final evaluation will be undertaken in 2025. CAS, with support from the TWA,
national/international consultants and other personnel as needed, will prepare the final
evaluation report. The report will assess the achievements of the SPARS against the targets, and
the contribution of the SPARS towards the strategic goals and vision for agricultural and rural
statistics. The final evaluation should also document lessons learned and make recommendations
on further developments in the agricultural and rural statistics system.
3.3.7 Financing
To successfully implement the SPARS action plan, it will be necessary to mobilize
considerable resources, both national and external. The costs of staffing and other overheads in
MAF’s various statistical units will be financed by the government. External resources will be used
for technical assistance, the development of new statistical methodologies, staff training and
equipment. External support will also be needed to help introduce new data collections, but the
government will progressively take over the costs of these collections as they become part of the
regular data collection programme. External resources will also be required for the once per 10
years agricultural census.
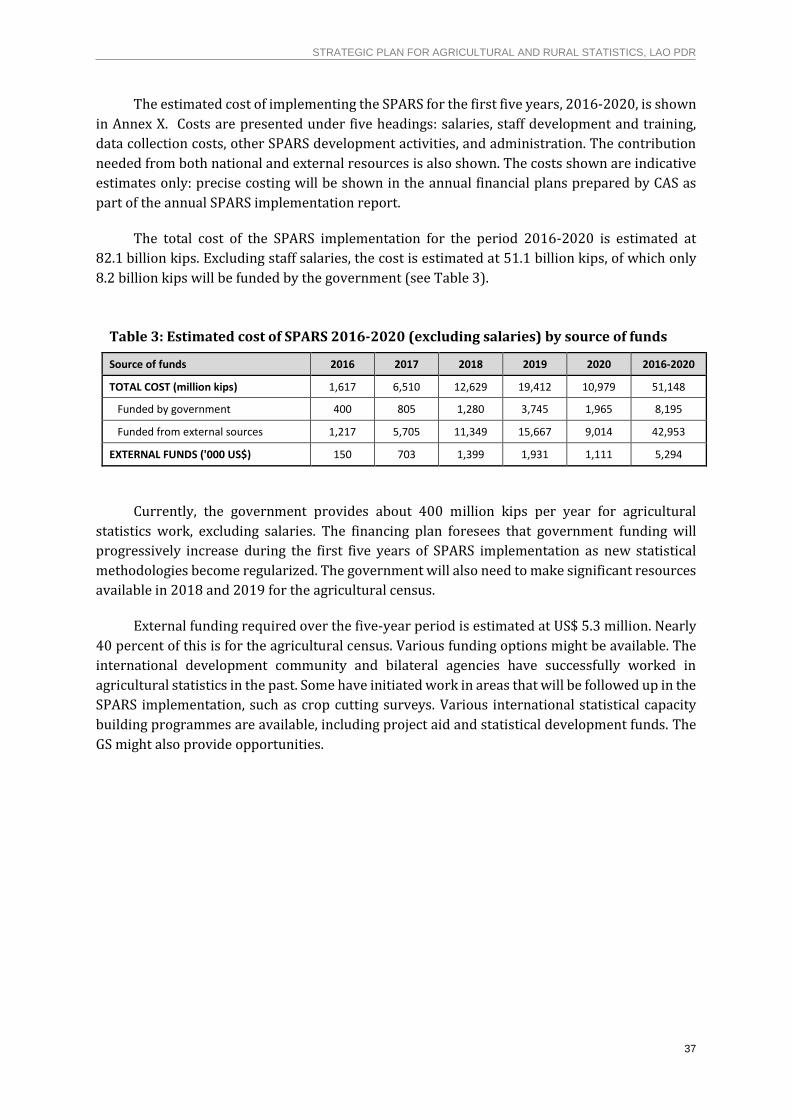
STRATEGIC PLAN FOR AGRICULTURAL AND RURAL STATISTICS, LAO PDR
37
The estimated cost of implementing the SPARS for the first five years, 2016-2020, is shown
in Annex X. Costs are presented under five headings: salaries, staff development and training,
data collection costs, other SPARS development activities, and administration. The contribution
needed from both national and external resources is also shown. The costs shown are indicative
estimates only: precise costing will be shown in the annual financial plans prepared by CAS as
part of the annual SPARS implementation report.
The total cost of the SPARS implementation for the period 2016-2020 is estimated at
82.1 billion kips. Excluding staff salaries, the cost is estimated at 51.1 billion kips, of which only
8.2 billion kips will be funded by the government (see Table 3).
Table 3: Estimated cost of SPARS 2016-2020 (excluding salaries) by source of funds
Source of funds 2016 2017 2018 2019 2020 2016-2020
TOTAL COST (million kips) 1,617 6,510 12,629 19,412 10,979 51,148
Funded by government 400 805 1,280 3,745 1,965 8,195
Funded from external sources 1,217 5,705 11,349 15,667 9,014 42,953
EXTERNAL FUNDS ('000 US$) 150 703 1,399 1,931 1,111 5,294
Currently, the government provides about 400 million kips per year for agricultural
statistics work, excluding salaries. The financing plan foresees that government funding will
progressively increase during the first five years of SPARS implementation as new statistical
methodologies become regularized. The government will also need to make significant resources
available in 2018 and 2019 for the agricultural census.
External funding required over the five-year period is estimated at US$ 5.3 million. Nearly
40 percent of this is for the agricultural census. Various funding options might be available. The
international development community and bilateral agencies have successfully worked in
agricultural statistics in the past. Some have initiated work in areas that will be followed up in the
SPARS implementation, such as crop cutting surveys. Various international statistical capacity
building programmes are available, including project aid and statistical development funds. The
GS might also provide opportunities.

STRATEGIC PLAN FOR AGRICULTURAL AND RURAL STATISTICS, LAO PDR
38
REFERENCES
39
REFERENCES
Colwell, J., 1997. Looking into Agricultural Statistics; Experiences from Asia and the Pacific, CGPRT Centre, Bogor.
FAO, 2014a. Lao Census of Agriculture 2010/11, Analysis of Selected Themes, FAO, Vientiane.
FAO, 2014b. Strategic Plans for Agricultural and Rural Statistics, Guidelines, FAO, Rome.
FAO, 2015a. Global Strategy to Improve Agricultural and Rural Statistics, Report of In-depth
Country Assessment, Lao PDR, unpublished.
FAO, 2015b. Roadmap for the Strategic Plan for Agricultural and Rural Statistics, Lao PDR,
unpublished.
FAO,ESCAP and ADB, 2013. Asia-Pacific Regional Action Plan to Improve Agricultural and Rural
Statistics, FAO, Bangkok.
FAO, United Nations and World Bank, 2012. Action Plan of the Global Strategy to Improve
Agricultural and Rural Statistics, FAO, Rome.
Lao Statistics Bureau (then known as Department of Statistics), 2010. The Strategy for the
Development of the National Statistical System, 2010-2020, Vientiane, Lao PDR
Lao Statistics Bureau, 2012. Statistical Yearbook, 2012. Vientiane, Lao PDR
Ministry of Agriculture and Forestry, Lao PDR, 2012. Lao Census of Agriculture 2010/11,
Highlights, Vientiane, Lao PDR.
Ministry of Agriculture and Forestry, Lao PDR, 2014a. Action Plan for Improving Agricultural
and Rural Statistics, Lao PDR, 2013-2020, Vientiane, Lao PDR.
Ministry of Agriculture and Forestry, Lao PDR, 2014b. Decision of the Minister for
Agriculture and Forestry on the Production, Management and Publication of Agricultural
Statistics, Vientiane, Lao PDR.
Ministry of Agriculture and Forestry, Lao PDR, 2014c. Agricultural Statistics Yearbook 2013,
Vientiane, Lao PDR.
Ministry of Agriculture and Forestry, Lao PDR, 2015. Agriculture Development Strategy to
2025 and Vision to 2030, Vientiane, Lao PDR.
Ministry of Planning and Investment, Lao PDR, 2011. The Seventh Five-Year National Socio-
Economic Development Plan 2011-2015, Vientiane, Lao PDR.
Ministry of Planning and Investment, Lao PDR, draft 24 November 2015 – not yet published.
Five-Year National Socio-Economic Development Plan VIII (2016-2020).
National Assembly, Lao PDR, 2010. Statistics Law (unofficial translation), Number Order
03/NA, unpublished.
PARIS21, 2004. A Guide to Designing a National Strategy for the Development of Statistics, PARIS21 Secretariat, Paris
REFERENCES
40
PARIS21, 2007. National Strategies for the Development of Statistics: Some Issues in Design and
Implementation Planning; Document Series No. 4, OECD, Paris.
World Bank, FAO and the United Nations, 2010. Global Strategy to Improve Agricultural and
Rural Statistics, Report No. 56719-GLB, World Bank, Washington DC.
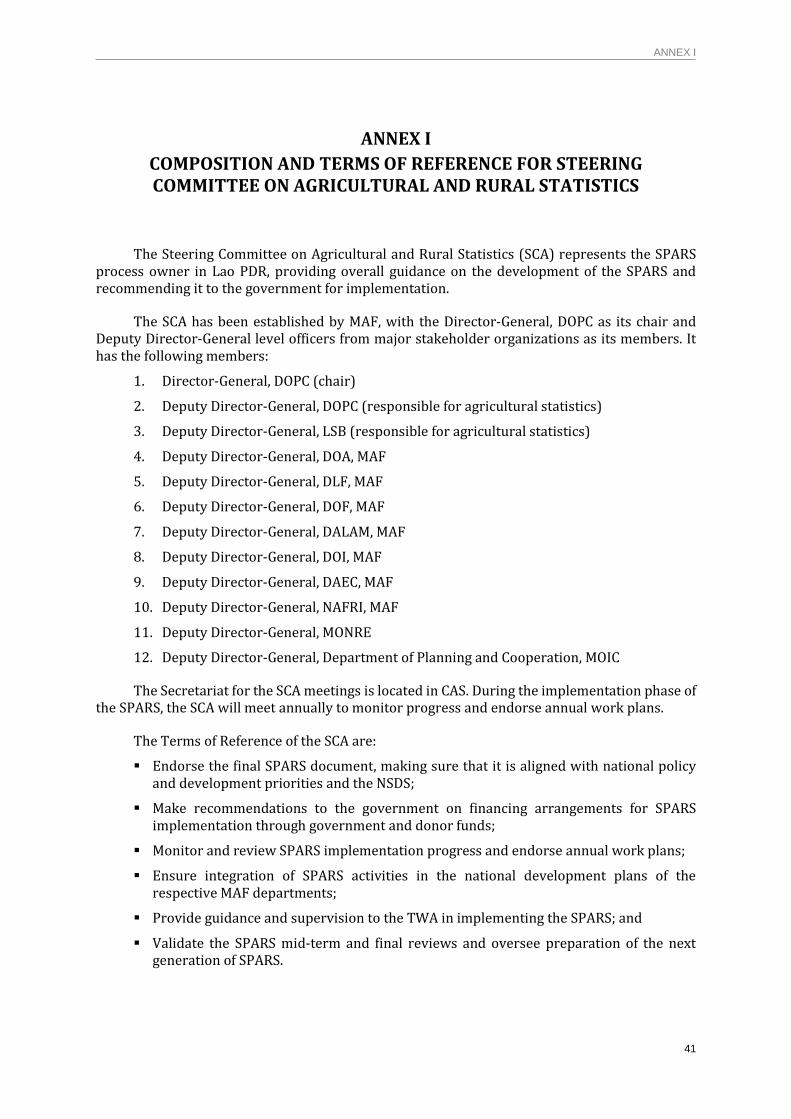
ANNEX I
41
ANNEX I
COMPOSITION AND TERMS OF REFERENCE FOR STEERING COMMITTEE ON AGRICULTURAL AND RURAL STATISTICS
The Steering Committee on Agricultural and Rural Statistics (SCA) represents the SPARS process owner in Lao PDR, providing overall guidance on the development of the SPARS and recommending it to the government for implementation.
The SCA has been established by MAF, with the Director-General, DOPC as its chair and Deputy Director-General level officers from major stakeholder organizations as its members. It has the following members:
1. Director-General, DOPC (chair)
2. Deputy Director-General, DOPC (responsible for agricultural statistics)
3. Deputy Director-General, LSB (responsible for agricultural statistics)
4. Deputy Director-General, DOA, MAF
5. Deputy Director-General, DLF, MAF
6. Deputy Director-General, DOF, MAF
7. Deputy Director-General, DALAM, MAF
8. Deputy Director-General, DOI, MAF
9. Deputy Director-General, DAEC, MAF
10. Deputy Director-General, NAFRI, MAF
11. Deputy Director-General, MONRE
12. Deputy Director-General, Department of Planning and Cooperation, MOIC
The Secretariat for the SCA meetings is located in CAS. During the implementation phase of the SPARS, the SCA will meet annually to monitor progress and endorse annual work plans.
The Terms of Reference of the SCA are:
Endorse the final SPARS document, making sure that it is aligned with national policy and development priorities and the NSDS;
Make recommendations to the government on financing arrangements for SPARS implementation through government and donor funds;
Monitor and review SPARS implementation progress and endorse annual work plans;
Ensure integration of SPARS activities in the national development plans of the respective MAF departments;
Provide guidance and supervision to the TWA in implementing the SPARS; and
Validate the SPARS mid-term and final reviews and oversee preparation of the next generation of SPARS.
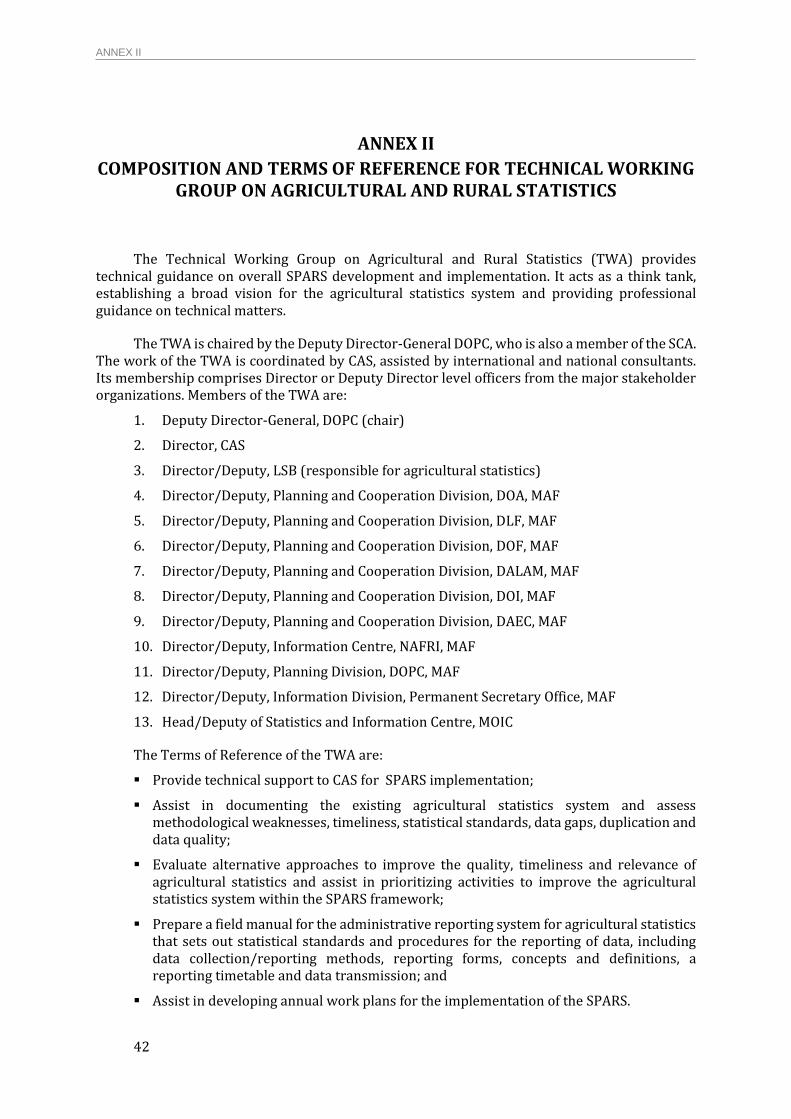
ANNEX II
42
ANNEX II
COMPOSITION AND TERMS OF REFERENCE FOR TECHNICAL WORKING GROUP ON AGRICULTURAL AND RURAL STATISTICS
The Technical Working Group on Agricultural and Rural Statistics (TWA) provides technical guidance on overall SPARS development and implementation. It acts as a think tank, establishing a broad vision for the agricultural statistics system and providing professional guidance on technical matters.
The TWA is chaired by the Deputy Director-General DOPC, who is also a member of the SCA. The work of the TWA is coordinated by CAS, assisted by international and national consultants. Its membership comprises Director or Deputy Director level officers from the major stakeholder organizations. Members of the TWA are:
1. Deputy Director-General, DOPC (chair)
2. Director, CAS
3. Director/Deputy, LSB (responsible for agricultural statistics)
4. Director/Deputy, Planning and Cooperation Division, DOA, MAF
5. Director/Deputy, Planning and Cooperation Division, DLF, MAF
6. Director/Deputy, Planning and Cooperation Division, DOF, MAF
7. Director/Deputy, Planning and Cooperation Division, DALAM, MAF
8. Director/Deputy, Planning and Cooperation Division, DOI, MAF
9. Director/Deputy, Planning and Cooperation Division, DAEC, MAF
10. Director/Deputy, Information Centre, NAFRI, MAF
11. Director/Deputy, Planning Division, DOPC, MAF
12. Director/Deputy, Information Division, Permanent Secretary Office, MAF
13. Head/Deputy of Statistics and Information Centre, MOIC
The Terms of Reference of the TWA are:
Provide technical support to CAS for SPARS implementation;
Assist in documenting the existing agricultural statistics system and assess methodological weaknesses, timeliness, statistical standards, data gaps, duplication and data quality;
Evaluate alternative approaches to improve the quality, timeliness and relevance of agricultural statistics and assist in prioritizing activities to improve the agricultural statistics system within the SPARS framework;
Prepare a field manual for the administrative reporting system for agricultural statistics that sets out statistical standards and procedures for the reporting of data, including data collection/reporting methods, reporting forms, concepts and definitions, a reporting timetable and data transmission; and
Assist in developing annual work plans for the implementation of the SPARS.
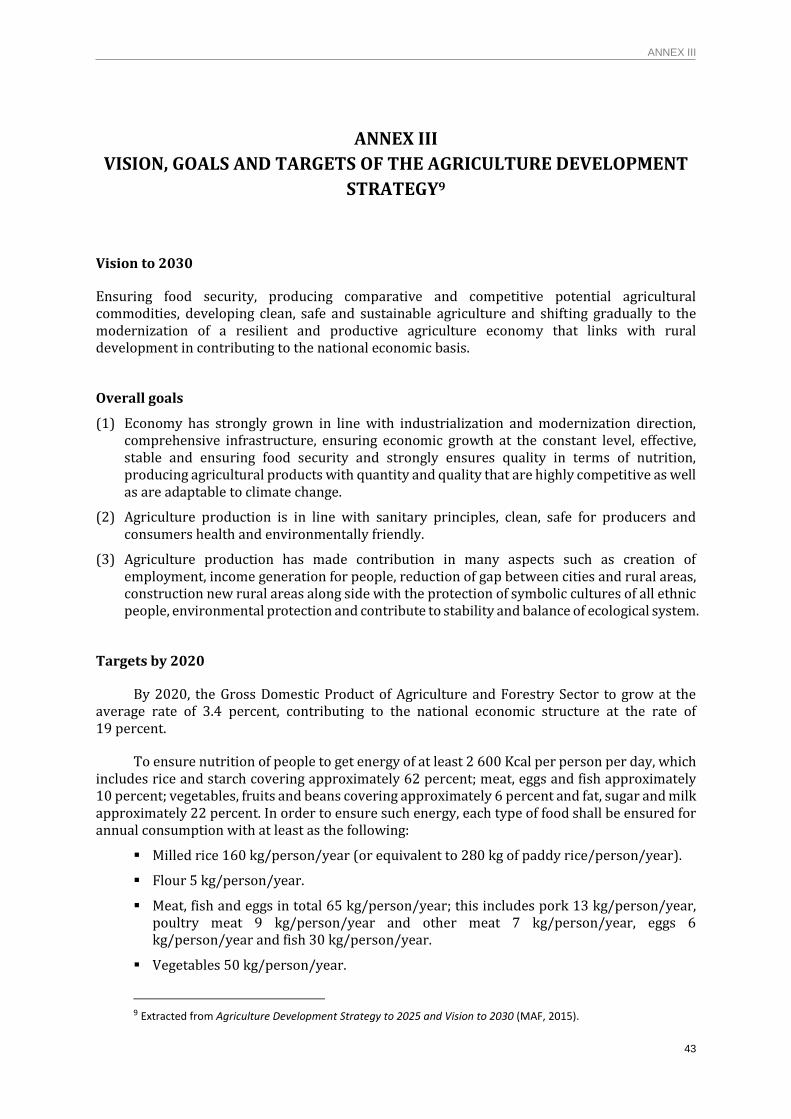
ANNEX III
43
ANNEX III
VISION, GOALS AND TARGETS OF THE AGRICULTURE DEVELOPMENT
STRATEGY9
Vision to 2030
Ensuring food security, producing comparative and competitive potential agricultural commodities, developing clean, safe and sustainable agriculture and shifting gradually to the modernization of a resilient and productive agriculture economy that links with rural development in contributing to the national economic basis.
Overall goals
(1) Economy has strongly grown in line with industrialization and modernization direction, comprehensive infrastructure, ensuring economic growth at the constant level, effective, stable and ensuring food security and strongly ensures quality in terms of nutrition, producing agricultural products with quantity and quality that are highly competitive as well as are adaptable to climate change.
(2) Agriculture production is in line with sanitary principles, clean, safe for producers and consumers health and environmentally friendly.
(3) Agriculture production has made contribution in many aspects such as creation of employment, income generation for people, reduction of gap between cities and rural areas, construction new rural areas along side with the protection of symbolic cultures of all ethnic people, environmental protection and contribute to stability and balance of ecological system.
Targets by 2020
By 2020, the Gross Domestic Product of Agriculture and Forestry Sector to grow at the average rate of 3.4 percent, contributing to the national economic structure at the rate of 19 percent.
To ensure nutrition of people to get energy of at least 2 600 Kcal per person per day, which includes rice and starch covering approximately 62 percent; meat, eggs and fish approximately 10 percent; vegetables, fruits and beans covering approximately 6 percent and fat, sugar and milk approximately 22 percent. In order to ensure such energy, each type of food shall be ensured for annual consumption with at least as the following:
Milled rice 160 kg/person/year (or equivalent to 280 kg of paddy rice/person/year).
Flour 5 kg/person/year.
Meat, fish and eggs in total 65 kg/person/year; this includes pork 13 kg/person/year, poultry meat 9 kg/person/year and other meat 7 kg/person/year, eggs 6 kg/person/year and fish 30 kg/person/year.
Vegetables 50 kg/person/year.
9 Extracted from Agriculture Development Strategy to 2025 and Vision to 2030 (MAF, 2015).
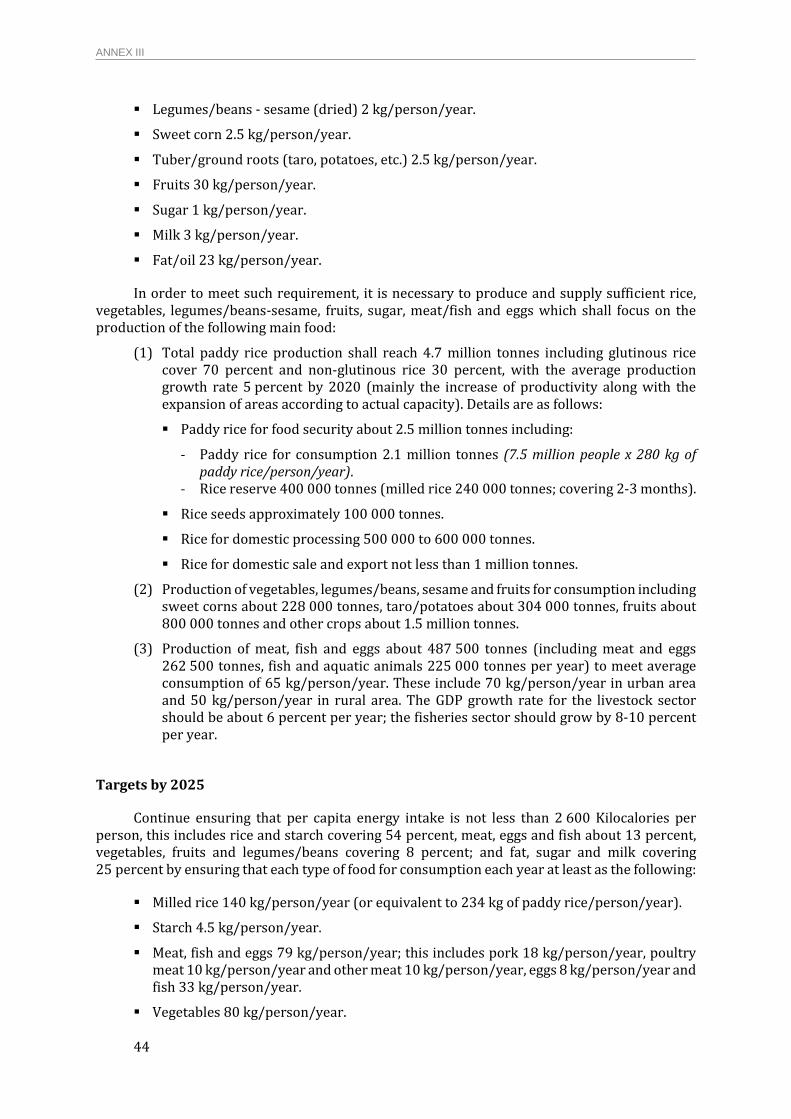
ANNEX III
44
Legumes/beans - sesame (dried) 2 kg/person/year.
Sweet corn 2.5 kg/person/year.
Tuber/ground roots (taro, potatoes, etc.) 2.5 kg/person/year.
Fruits 30 kg/person/year.
Sugar 1 kg/person/year.
Milk 3 kg/person/year.
Fat/oil 23 kg/person/year.
In order to meet such requirement, it is necessary to produce and supply sufficient rice, vegetables, legumes/beans-sesame, fruits, sugar, meat/fish and eggs which shall focus on the production of the following main food:
(1) Total paddy rice production shall reach 4.7 million tonnes including glutinous rice cover 70 percent and non-glutinous rice 30 percent, with the average production growth rate 5 percent by 2020 (mainly the increase of productivity along with the expansion of areas according to actual capacity). Details are as follows:
Paddy rice for food security about 2.5 million tonnes including:
- Paddy rice for consumption 2.1 million tonnes (7.5 million people x 280 kg of paddy rice/person/year).
- Rice reserve 400 000 tonnes (milled rice 240 000 tonnes; covering 2-3 months).
Rice seeds approximately 100 000 tonnes.
Rice for domestic processing 500 000 to 600 000 tonnes.
Rice for domestic sale and export not less than 1 million tonnes.
(2) Production of vegetables, legumes/beans, sesame and fruits for consumption including sweet corns about 228 000 tonnes, taro/potatoes about 304 000 tonnes, fruits about 800 000 tonnes and other crops about 1.5 million tonnes.
(3) Production of meat, fish and eggs about 487 500 tonnes (including meat and eggs 262 500 tonnes, fish and aquatic animals 225 000 tonnes per year) to meet average consumption of 65 kg/person/year. These include 70 kg/person/year in urban area and 50 kg/person/year in rural area. The GDP growth rate for the livestock sector should be about 6 percent per year; the fisheries sector should grow by 8-10 percent per year.
Targets by 2025
Continue ensuring that per capita energy intake is not less than 2 600 Kilocalories per person, this includes rice and starch covering 54 percent, meat, eggs and fish about 13 percent, vegetables, fruits and legumes/beans covering 8 percent; and fat, sugar and milk covering 25 percent by ensuring that each type of food for consumption each year at least as the following:
Milled rice 140 kg/person/year (or equivalent to 234 kg of paddy rice/person/year).
Starch 4.5 kg/person/year.
Meat, fish and eggs 79 kg/person/year; this includes pork 18 kg/person/year, poultry meat 10 kg/person/year and other meat 10 kg/person/year, eggs 8 kg/person/year and fish 33 kg/person/year.
Vegetables 80 kg/person/year.
ANNEX III
45
Legumes/beans - sesame (dried) 2 kg/person/year.
Sweet corn 2 kg/person/year.
Tuber/ground roots (taro, potatoes, etc.) 2.1 kg/person/year.
Fruits 40 kg/person/year.
Sugar 1.5 kg/person/year.
Milk 5 kg/person/year.
Fat/oil 25 kg/person/year.
In order to meet such requirement, the following is needed:
(1) Total paddy rice production shall reach 5 million tonnes of which glutinous rice 70 percent and non-glutinous rice 30 percent with the following details:
Rice for food security about 2.5 million tonnes (paddy) including:
- Paddy rice for consumption about 2.1 million tonnes (9 million people x 234 kg of paddy rice/person/year).
- Rice reserve 400 000 tonnes (or milled rice 240 000 tonnes; self-sufficient 2-3 months).
- Rice seeds about 100 000 tonnes.
Paddy rice for domestic processing about 500 000 to 600 000 tonnes
Paddy rice for domestic sale and export at least 1.5 million tonnes.
(2) Production of vegetables, legumes/beans-sesame and fruits for consumption including sweet corns about 306 000 tonnes, beans and taro, potatoes about 327 000 tonnes, fruits about 825 000 tonnes and other crops about 1.57 million tonnes.
(3) Production of meat, eggs and eggs about 711 000 tonnes (including meat and eggs 414 000 tonnes, fish and aquatic animals 297 000 tonnes per year) to meet total average consumption rate 79 kg per person per year.
ANNEX V
46
ANNEX IV
NATIONAL SOCIO-ECONOMIC DEVELOPMENT PLAN 2016-2020,
OBJECTIVE, OUTCOMES AND OUTPUTS10
Overall objective
Continued political stability, peace and order in the society; the poverty of the people is reduced significantly in all areas; the country is developed out of the status of Least Developed Country by 2020 through continuous, inclusive and sustainable growth; maximum effective management and utilization of natural resources; the development enhanced through the national potentials and advantages; participated in regional and international integration with ownership.
Outcomes and outputs
Outcome 1: Continued, firm and inclusive growth by consolidating strong economic foundations and reducing economic vulnerability.
Output 1 – Sustained and inclusive economic growth
Output 2 – Macro-economic stability
Output 3 – Integrated development planning and budgeting
Output 4 – Balanced regional and local development
Output 5 – Improved public/private labour force capacity
Output 6 – Local entrepreneurs are competitive in domestic and global markets
Output 7 – Regional and international cooperation and integration
Outcome 2: Human resources are developed and the capacities of the public and private sectors is upgraded; poverty in all ethnic groups is reduced, all ethnic groups and both genders have access to quality education and health services; the unique culture of the nation is protected and consolidated; political stability, social peace and order, justice and transparency are maintained.
Output 1 – Improved living standards through poverty reduction
Output 2 – Ensured food security and reduced incidences of malnutrition
Output 3 – Access to high quality education
Output 4 – Access to high quality health care and preventative medicine
Output 5 – Enhanced social welfare
Output 6 – Protection of traditions and culture
Output 7 – Ensured political stability, order, justice and gender equality
10 Extracted from Five-Year National Socio-Economic Development Plan VIII (2016-2020) – 24 November 2015 draft.
ANNEX V
47
Outcome 3: Natural resources and the environment are effectively protected and utilized according to green-growth and sustainable principles; there is readiness to coping with natural disasters and the effects of climate change and for reconstruction following natural disasters.
Output 1 – Environmental protection and sustainable natural resources management
Output 2 – Preparedness for natural disasters and risk mitigation
Output 3 – Reduced instability agricultural production
Priority cross-cutting outputs
(1) Promote local innovation and use of science, technology and telecommunications and management and application of ICT.
(2) Promote and develop gender equality, juvenile and youth.
(3) Enhance effectiveness for the public governance and administration.
ANNEX V
48
ANNEX V
STRATEGY FOR THE DEVELOPMENT OF THE NATIONAL STATISTICS
SYSTEM 2010-202011
Vision
Strengthen the development of the national statistical system to attain the international standard while maintaining coherence with the Party and the Government’s polices to assure good national statistics.
Ensure the comprehensive, timely, transparent and reliable supply of good quality socio-economic and environment statistics to meet the increasing demand from the Party, Government and other statistics users; to serve as an indication for monitoring, evaluation and formulation of socio-economic development; and for monitoring progress of the MDGs by 2015 and graduation from Least Developed Country status by 2020.
Goals
(1) To provide good quality, reliable, and timely statistics to serve and facilitate planning and decision making activities of policy makers, plan formulators and domestic as well as foreign researchers.
(2) To develop the national statistical system to guarantee that all statistical activities ranging from production to dissemination are comparable and in compliance with international standards. In other words, it is to ensure that actual situation of the country is reflected scientifically as a result of technical efforts.
(3) To build and enhance knowledge and capacity of staff and statisticians in the nationwide national statistical system, so that they can become more skilful in statistics to meet statistical development needs in each time period.
(4) To establish an efficient and effective coordination mechanism which will make the cooperation between horizontal and vertical organizational systems become realized and systematic particularly in term of collecting, summarizing, analyzing data, building databases, exchanging and disseminating data. In addition, this is to avoid duplication that can lead to a waste of time and budget, specifically those activities under government.
(5) To encourage, support, and provide assistance to all data producers to produce high quality statistics through raising their awareness of the core value, role and duty, right and responsibility in supplying statistics to allow users make use of data most effectively, conveniently, and punctually. To encourage studies and analysis of data to avoid use inconsistent with statistical principles.
(6) To expand statistical cooperation with neighbouring countries and countries in ASEAN, the Asian region, and the rest of the world based on the direction given by the leading party and government in opening for mutually beneficial cooperation.
11 Extracted from The Strategy for the Development of the National Statistical System, 2010-2020 (LSB, 2010).
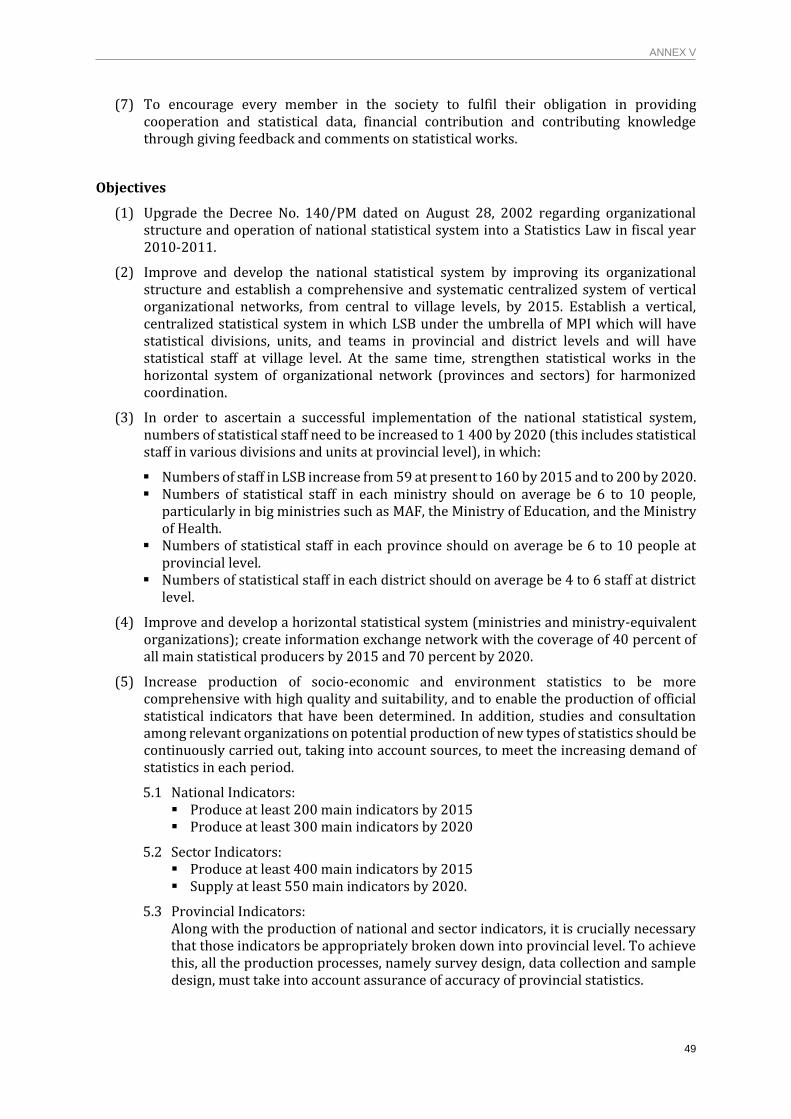
ANNEX V
49
(7) To encourage every member in the society to fulfil their obligation in providing cooperation and statistical data, financial contribution and contributing knowledge through giving feedback and comments on statistical works.
Objectives
(1) Upgrade the Decree No. 140/PM dated on August 28, 2002 regarding organizational structure and operation of national statistical system into a Statistics Law in fiscal year 2010-2011.
(2) Improve and develop the national statistical system by improving its organizational structure and establish a comprehensive and systematic centralized system of vertical organizational networks, from central to village levels, by 2015. Establish a vertical, centralized statistical system in which LSB under the umbrella of MPI which will have statistical divisions, units, and teams in provincial and district levels and will have statistical staff at village level. At the same time, strengthen statistical works in the horizontal system of organizational network (provinces and sectors) for harmonized coordination.
(3) In order to ascertain a successful implementation of the national statistical system, numbers of statistical staff need to be increased to 1 400 by 2020 (this includes statistical staff in various divisions and units at provincial level), in which:
Numbers of staff in LSB increase from 59 at present to 160 by 2015 and to 200 by 2020. Numbers of statistical staff in each ministry should on average be 6 to 10 people,
particularly in big ministries such as MAF, the Ministry of Education, and the Ministry of Health.
Numbers of statistical staff in each province should on average be 6 to 10 people at provincial level.
Numbers of statistical staff in each district should on average be 4 to 6 staff at district level.
(4) Improve and develop a horizontal statistical system (ministries and ministry-equivalent organizations); create information exchange network with the coverage of 40 percent of all main statistical producers by 2015 and 70 percent by 2020.
(5) Increase production of socio-economic and environment statistics to be more comprehensive with high quality and suitability, and to enable the production of official statistical indicators that have been determined. In addition, studies and consultation among relevant organizations on potential production of new types of statistics should be continuously carried out, taking into account sources, to meet the increasing demand of statistics in each period.
5.1 National Indicators: Produce at least 200 main indicators by 2015 Produce at least 300 main indicators by 2020
5.2 Sector Indicators: Produce at least 400 main indicators by 2015 Supply at least 550 main indicators by 2020.
5.3 Provincial Indicators: Along with the production of national and sector indicators, it is crucially necessary that those indicators be appropriately broken down into provincial level. To achieve this, all the production processes, namely survey design, data collection and sample design, must take into account assurance of accuracy of provincial statistics.
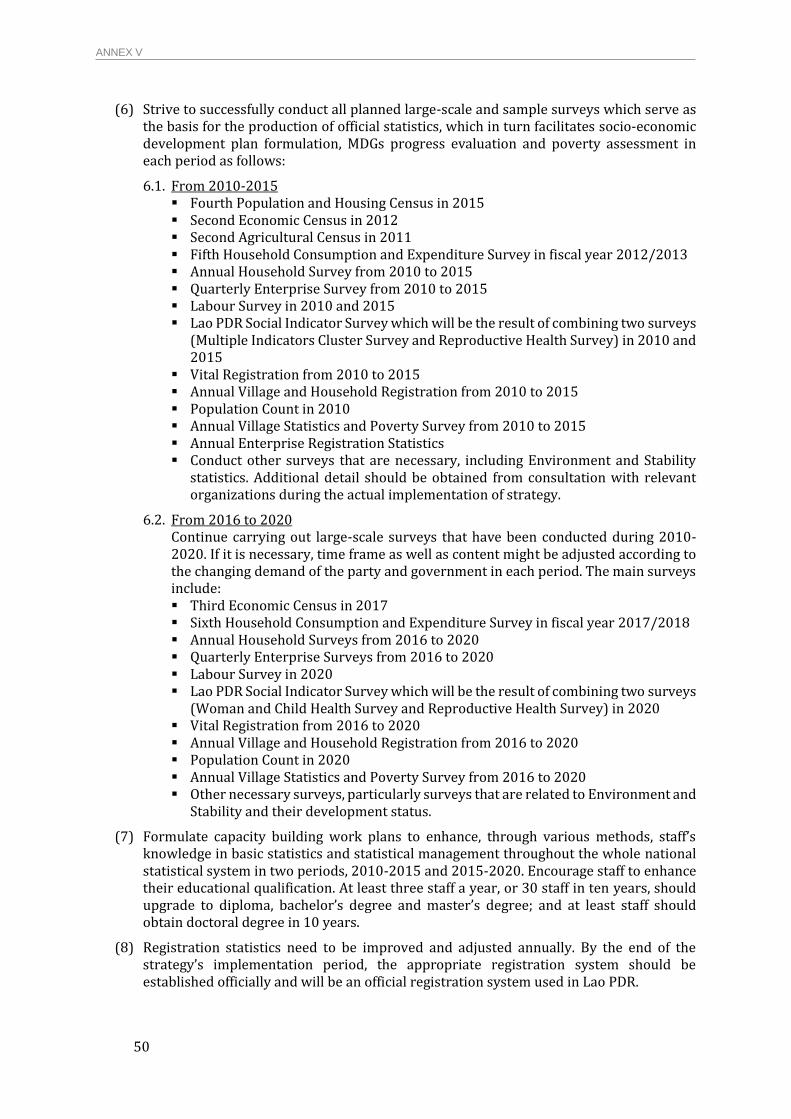
ANNEX V
50
(6) Strive to successfully conduct all planned large-scale and sample surveys which serve as the basis for the production of official statistics, which in turn facilitates socio-economic development plan formulation, MDGs progress evaluation and poverty assessment in each period as follows:
6.1. From 2010-2015 Fourth Population and Housing Census in 2015 Second Economic Census in 2012 Second Agricultural Census in 2011 Fifth Household Consumption and Expenditure Survey in fiscal year 2012/2013 Annual Household Survey from 2010 to 2015 Quarterly Enterprise Survey from 2010 to 2015 Labour Survey in 2010 and 2015 Lao PDR Social Indicator Survey which will be the result of combining two surveys
(Multiple Indicators Cluster Survey and Reproductive Health Survey) in 2010 and 2015
Vital Registration from 2010 to 2015 Annual Village and Household Registration from 2010 to 2015 Population Count in 2010 Annual Village Statistics and Poverty Survey from 2010 to 2015 Annual Enterprise Registration Statistics Conduct other surveys that are necessary, including Environment and Stability
statistics. Additional detail should be obtained from consultation with relevant organizations during the actual implementation of strategy.
6.2. From 2016 to 2020 Continue carrying out large-scale surveys that have been conducted during 2010-2020. If it is necessary, time frame as well as content might be adjusted according to the changing demand of the party and government in each period. The main surveys include: Third Economic Census in 2017 Sixth Household Consumption and Expenditure Survey in fiscal year 2017/2018 Annual Household Surveys from 2016 to 2020 Quarterly Enterprise Surveys from 2016 to 2020 Labour Survey in 2020 Lao PDR Social Indicator Survey which will be the result of combining two surveys
(Woman and Child Health Survey and Reproductive Health Survey) in 2020 Vital Registration from 2016 to 2020 Annual Village and Household Registration from 2016 to 2020 Population Count in 2020 Annual Village Statistics and Poverty Survey from 2016 to 2020 Other necessary surveys, particularly surveys that are related to Environment and
Stability and their development status.
(7) Formulate capacity building work plans to enhance, through various methods, staff’s knowledge in basic statistics and statistical management throughout the whole national statistical system in two periods, 2010-2015 and 2015-2020. Encourage staff to enhance their educational qualification. At least three staff a year, or 30 staff in ten years, should upgrade to diploma, bachelor’s degree and master’s degree; and at least staff should obtain doctoral degree in 10 years.
(8) Registration statistics need to be improved and adjusted annually. By the end of the strategy’s implementation period, the appropriate registration system should be established officially and will be an official registration system used in Lao PDR.
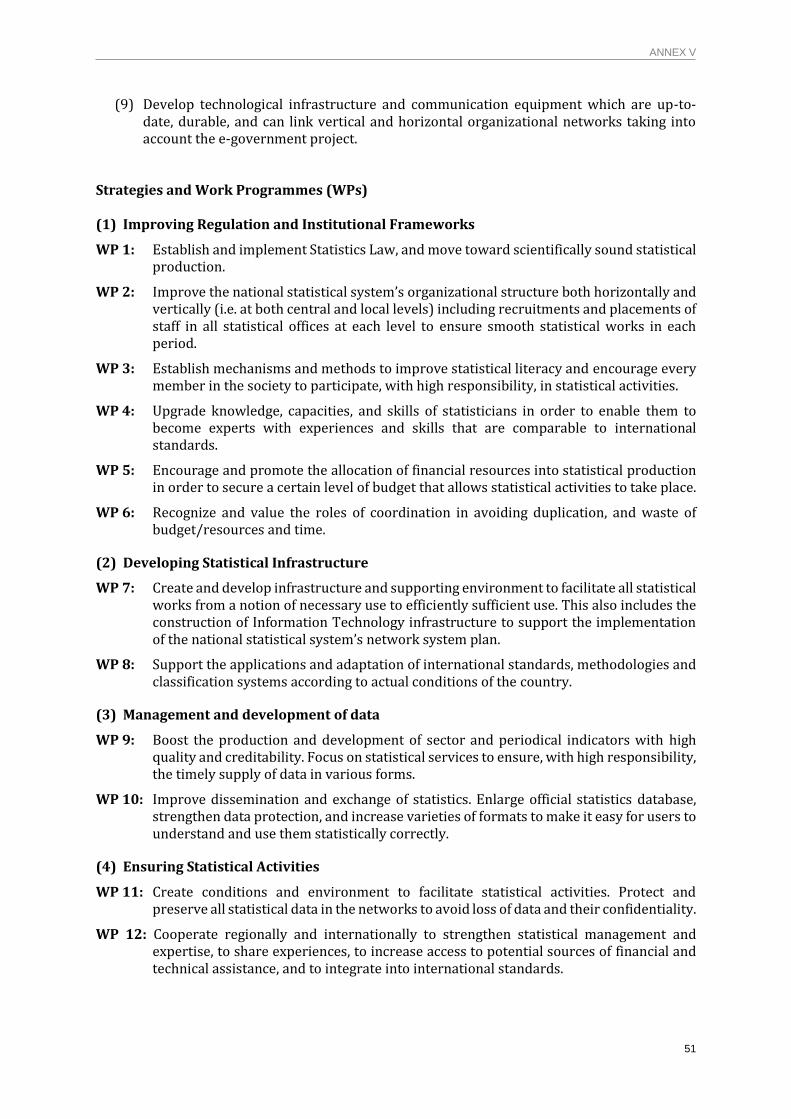
ANNEX V
51
(9) Develop technological infrastructure and communication equipment which are up-to-date, durable, and can link vertical and horizontal organizational networks taking into account the e-government project.
Strategies and Work Programmes (WPs)
(1) Improving Regulation and Institutional Frameworks
WP 1: Establish and implement Statistics Law, and move toward scientifically sound statistical production.
WP 2: Improve the national statistical system’s organizational structure both horizontally and vertically (i.e. at both central and local levels) including recruitments and placements of staff in all statistical offices at each level to ensure smooth statistical works in each period.
WP 3: Establish mechanisms and methods to improve statistical literacy and encourage every member in the society to participate, with high responsibility, in statistical activities.
WP 4: Upgrade knowledge, capacities, and skills of statisticians in order to enable them to become experts with experiences and skills that are comparable to international standards.
WP 5: Encourage and promote the allocation of financial resources into statistical production in order to secure a certain level of budget that allows statistical activities to take place.
WP 6: Recognize and value the roles of coordination in avoiding duplication, and waste of budget/resources and time.
(2) Developing Statistical Infrastructure
WP 7: Create and develop infrastructure and supporting environment to facilitate all statistical works from a notion of necessary use to efficiently sufficient use. This also includes the construction of Information Technology infrastructure to support the implementation of the national statistical system’s network system plan.
WP 8: Support the applications and adaptation of international standards, methodologies and classification systems according to actual conditions of the country.
(3) Management and development of data
WP 9: Boost the production and development of sector and periodical indicators with high quality and creditability. Focus on statistical services to ensure, with high responsibility, the timely supply of data in various forms.
WP 10: Improve dissemination and exchange of statistics. Enlarge official statistics database, strengthen data protection, and increase varieties of formats to make it easy for users to understand and use them statistically correctly.
(4) Ensuring Statistical Activities
WP 11: Create conditions and environment to facilitate statistical activities. Protect and preserve all statistical data in the networks to avoid loss of data and their confidentiality.
WP 12: Cooperate regionally and internationally to strengthen statistical management and expertise, to share experiences, to increase access to potential sources of financial and technical assistance, and to integrate into international standards.
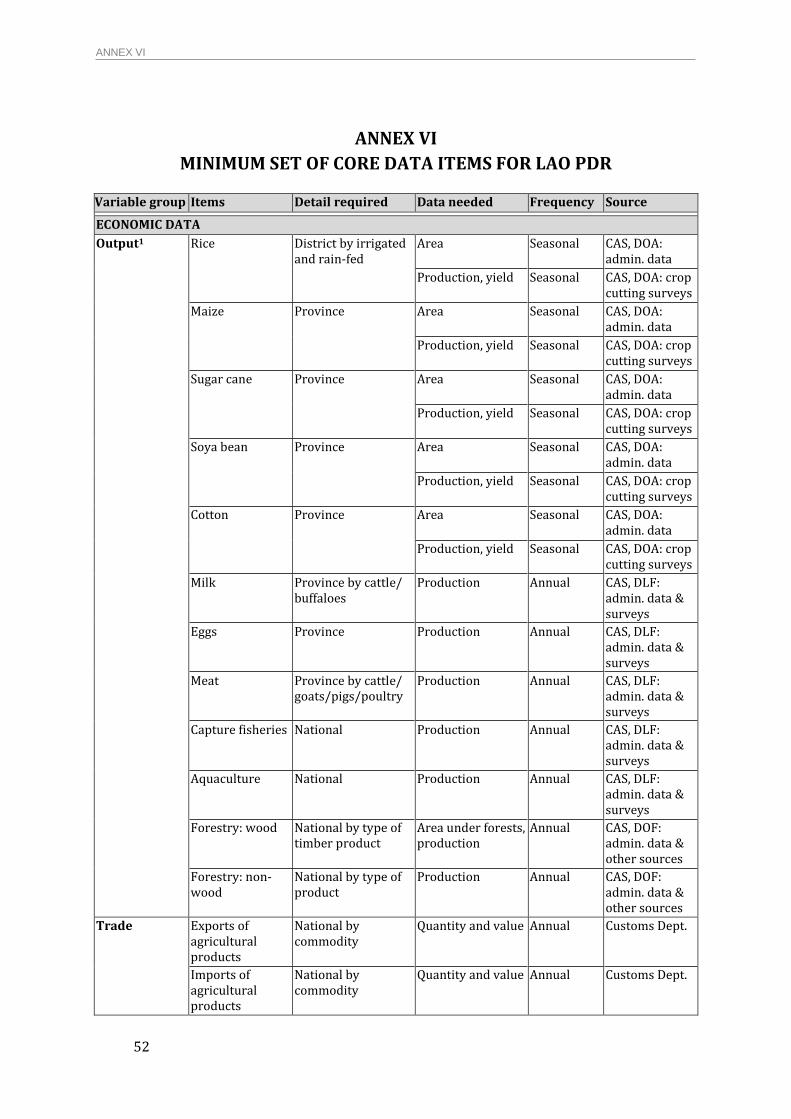
ANNEX VI
52
ANNEX VI
MINIMUM SET OF CORE DATA ITEMS FOR LAO PDR
Variable group Items Detail required Data needed Frequency Source
ECONOMIC DATA
Output1
Rice District by irrigated
and rain-fed Area Seasonal CAS, DOA:
admin. data
Production, yield Seasonal CAS, DOA: crop cutting surveys
Maize Province Area Seasonal CAS, DOA: admin. data
Production, yield Seasonal CAS, DOA: crop cutting surveys
Sugar cane Province Area Seasonal CAS, DOA: admin. data
Production, yield Seasonal CAS, DOA: crop cutting surveys
Soya bean Province Area Seasonal CAS, DOA: admin. data
Production, yield Seasonal CAS, DOA: crop cutting surveys
Cotton Province Area Seasonal CAS, DOA: admin. data
Production, yield Seasonal CAS, DOA: crop cutting surveys
Milk Province by cattle/ buffaloes
Production Annual CAS, DLF: admin. data & surveys
Eggs Province Production Annual CAS, DLF: admin. data & surveys CAS/DLF: admin. data & surveys
Meat Province by cattle/ goats/pigs/poultry
Production Annual CAS, DLF: admin. data & surveys CAS/DLF: admin. data & surveys CAS/DLF: admin. data & surveys
Capture fisheries National Production Annual CAS, DLF: admin. data & surveys
Aquaculture National Production Annual CAS, DLF: admin. data & surveys
Forestry: wood National by type of timber product
Area under forests, production
Annual CAS, DOF: admin. data & other sources
Forestry: non-wood
National by type of product
Production Annual CAS, DOF: admin. data & other sources MAF admin. data & regular surveys
Trade Exports of agricultural products
National by commodity
Quantity and value Annual Customs Dept.
Imports of agricultural products
National by commodity
Quantity and value Annual Customs Dept.
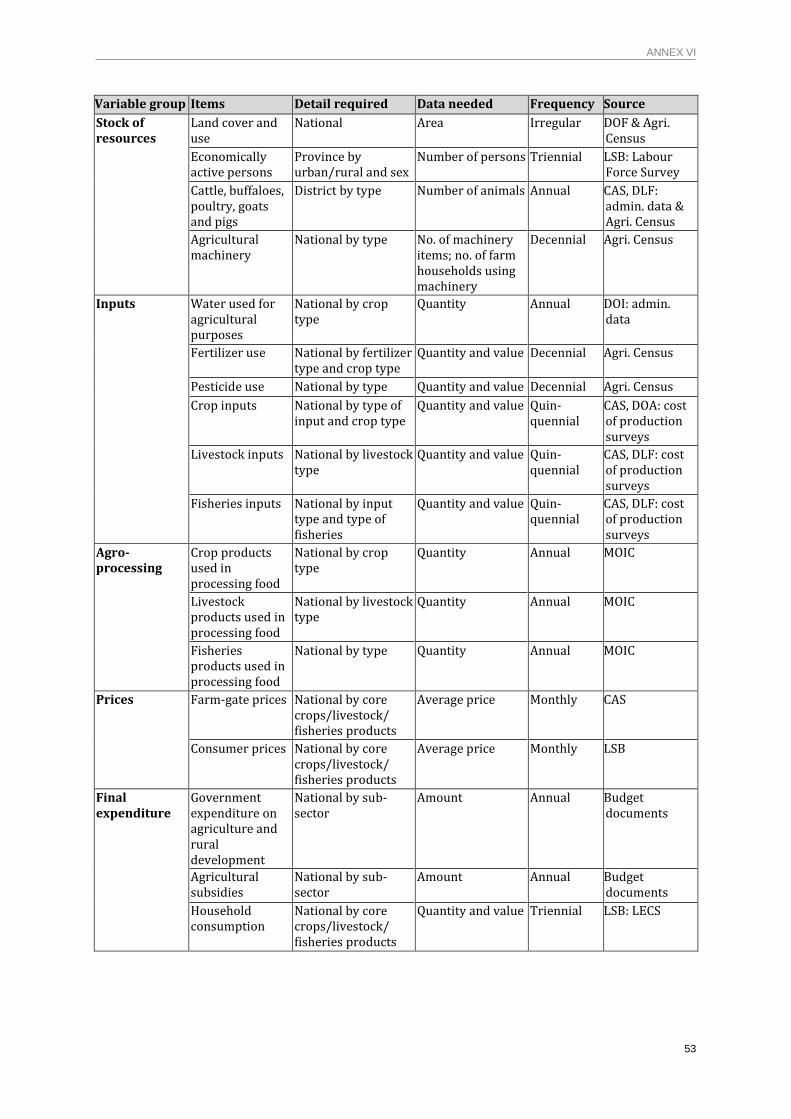
ANNEX VI
53
Variable group Items Detail required Data needed Frequency Source
Stock of resources
Land cover and use
National Area Irregular DOF & Agri. Census
Economically active persons
Province by urban/rural and sex
Number of persons Triennial LSB: Labour Force Survey
Cattle, buffaloes, poultry, goats and pigs
District by type Number of animals Annual CAS, DLF: admin. data & Agri. Census
Agricultural machinery
National by type No. of machinery items; no. of farm households using machinery
Decennial Agri. Census
Inputs
Water used for agricultural purposes
National by crop type
Quantity Annual DOI: admin. data
Fertilizer use National by fertilizer type and crop type
Quantity and value Decennial Agri. Census
Pesticide use National by type Quantity and value Decennial Agri. Census
Crop inputs National by type of input and crop type
Quantity and value Quin- quennial
CAS, DOA: cost of production surveys
Livestock inputs National by livestock type
Quantity and value Quin- quennial
CAS, DLF: cost of production surveys
Fisheries inputs National by input type and type of fisheries
Quantity and value Quin- quennial
CAS, DLF: cost of production surveys
Agro-processing
Crop products used in processing food
National by crop type
Quantity Annual MOIC
Livestock products used in processing food
National by livestock type
Quantity Annual MOIC
Fisheries products used in processing food
National by type Quantity Annual MOIC
Prices
Farm-gate prices National by core crops/livestock/ fisheries products
Average price Monthly CAS
Consumer prices National by core crops/livestock/ fisheries products
Average price Monthly LSB
Final expenditure
Government expenditure on agriculture and rural development
National by sub-sector
Amount Annual Budget documents
Agricultural subsidies
National by sub-sector
Amount Annual Budget documents
Household consumption
National by core crops/livestock/ fisheries products
Quantity and value Triennial LSB: LECS
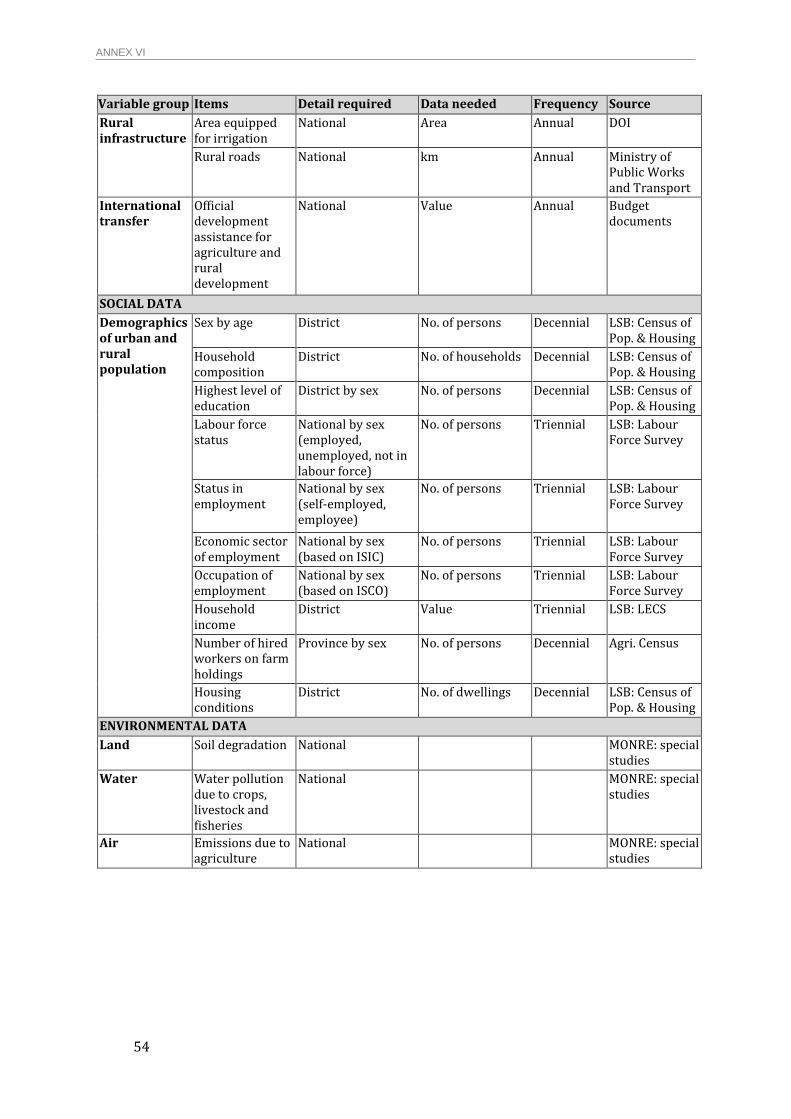
ANNEX VI
54
Variable group Items Detail required Data needed Frequency Source
Rural infrastructure
Area equipped for irrigation
National Area Annual DOI
Rural roads National km Annual Ministry of Public Works and Transport
International transfer
Official development assistance for agriculture and rural development
National Value Annual Budget documents
SOCIAL DATA
Demographics of urban and rural population
Sex by age District No. of persons Decennial LSB: Census of Pop. & Housing
Household composition
District No. of households Decennial LSB: Census of Pop. & Housing LSB: Census of pop. & housing
Highest level of education
District by sex No. of persons Decennial LSB: Census of Pop. & Housing LSB: Census of pop. & housing
Labour force status
National by sex (employed, unemployed, not in labour force)
No. of persons Triennial LSB: Labour Force Survey
Status in employment
National by sex (self-employed, employee)
No. of persons Triennial LSB: Labour Force Survey
Economic sector of employment
National by sex (based on ISIC)
No. of persons Triennial LSB: Labour Force Survey
Occupation of employment
National by sex (based on ISCO)
No. of persons Triennial LSB: Labour Force Survey
Household income
District Value Triennial LSB: LECS
Number of hired workers on farm holdings
Province by sex No. of persons Decennial Agri. Census
Housing conditions
District No. of dwellings Decennial LSB: Census of Pop. & Housing
ENVIRONMENTAL DATA
Land Soil degradation National MONRE: special studies
Water Water pollution due to crops, livestock and fisheries
National MONRE: special studies
Air Emissions due to agriculture
National MONRE: special studies
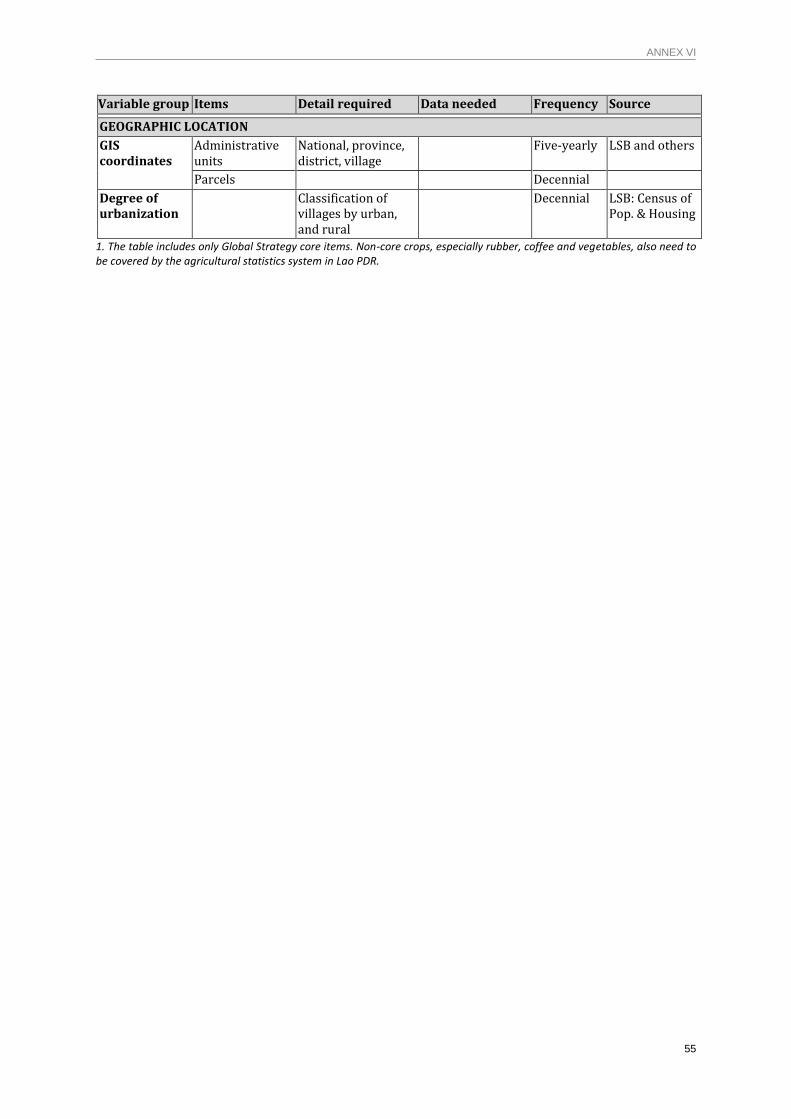
ANNEX VI
55
Variable group Items Detail required Data needed Frequency Source
GEOGRAPHIC LOCATION
GIS coordinates
Administrative units
National, province, district, village
Five-yearly LSB and others
Parcels Decennial
Degree of urbanization
Classification of villages by urban, and rural
Decennial LSB: Census of Pop. & Housing
1. The table includes only Global Strategy core items. Non-core crops, especially rubber, coffee and vegetables, also need to be covered by the agricultural statistics system in Lao PDR.
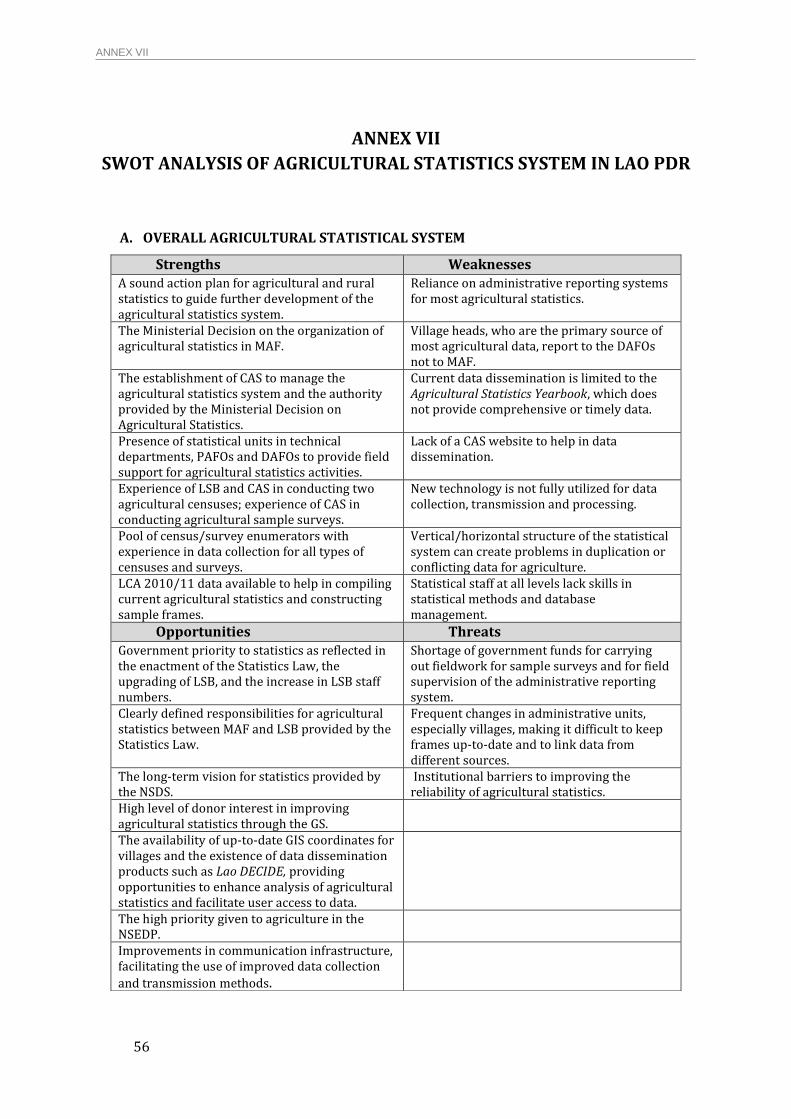
ANNEX VII
56
ANNEX VII
SWOT ANALYSIS OF AGRICULTURAL STATISTICS SYSTEM IN LAO PDR
A. OVERALL AGRICULTURAL STATISTICAL SYSTEM
Strengths Weaknesses A sound action plan for agricultural and rural statistics to guide further development of the agricultural statistics system.
Reliance on administrative reporting systems for most agricultural statistics.
The Ministerial Decision on the organization of agricultural statistics in MAF.
Village heads, who are the primary source of most agricultural data, report to the DAFOs not to MAF.
The establishment of CAS to manage the agricultural statistics system and the authority provided by the Ministerial Decision on Agricultural Statistics.
Current data dissemination is limited to the Agricultural Statistics Yearbook, which does not provide comprehensive or timely data.
Presence of statistical units in technical departments, PAFOs and DAFOs to provide field support for agricultural statistics activities.
Lack of a CAS website to help in data dissemination.
Experience of LSB and CAS in conducting two agricultural censuses; experience of CAS in conducting agricultural sample surveys.
New technology is not fully utilized for data collection, transmission and processing.
Pool of census/survey enumerators with experience in data collection for all types of censuses and surveys.
Vertical/horizontal structure of the statistical system can create problems in duplication or conflicting data for agriculture.
LCA 2010/11 data available to help in compiling current agricultural statistics and constructing sample frames.
Statistical staff at all levels lack skills in statistical methods and database management.
Opportunities Threats Government priority to statistics as reflected in the enactment of the Statistics Law, the upgrading of LSB, and the increase in LSB staff numbers.
Shortage of government funds for carrying out fieldwork for sample surveys and for field supervision of the administrative reporting system.
Clearly defined responsibilities for agricultural statistics between MAF and LSB provided by the Statistics Law.
Frequent changes in administrative units, especially villages, making it difficult to keep frames up-to-date and to link data from different sources.
The long-term vision for statistics provided by the NSDS.
Institutional barriers to improving the reliability of agricultural statistics.
High level of donor interest in improving agricultural statistics through the GS.
The availability of up-to-date GIS coordinates for villages and the existence of data dissemination products such as Lao DECIDE, providing opportunities to enhance analysis of agricultural statistics and facilitate user access to data.
The high priority given to agriculture in the NSEDP.
Improvements in communication infrastructure, facilitating the use of improved data collection
and transmission methods.
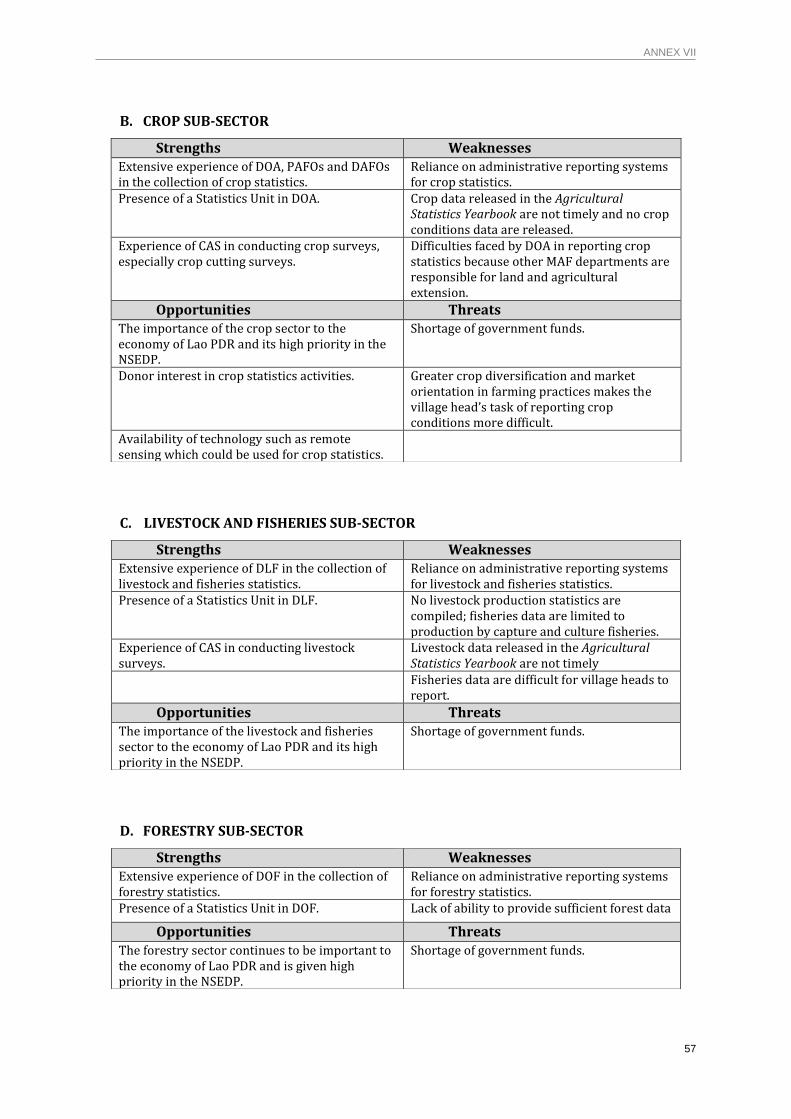
ANNEX VII
57
B. CROP SUB-SECTOR
C. LIVESTOCK AND FISHERIES SUB-SECTOR
D. FORESTRY SUB-SECTOR
Strengths Weaknesses Extensive experience of DOA, PAFOs and DAFOs in the collection of crop statistics.
Reliance on administrative reporting systems for crop statistics.
Presence of a Statistics Unit in DOA. Crop data released in the Agricultural Statistics Yearbook are not timely and no crop conditions data are released.
Experience of CAS in conducting crop surveys, especially crop cutting surveys.
Difficulties faced by DOA in reporting crop statistics because other MAF departments are responsible for land and agricultural extension.
Opportunities Threats The importance of the crop sector to the economy of Lao PDR and its high priority in the NSEDP.
Shortage of government funds.
Donor interest in crop statistics activities. Greater crop diversification and market orientation in farming practices makes the village head’s task of reporting crop conditions more difficult.
Availability of technology such as remote sensing which could be used for crop statistics.
Strengths Weaknesses Extensive experience of DLF in the collection of livestock and fisheries statistics.
Reliance on administrative reporting systems for livestock and fisheries statistics.
Presence of a Statistics Unit in DLF. No livestock production statistics are compiled; fisheries data are limited to production by capture and culture fisheries.
Experience of CAS in conducting livestock surveys.
Livestock data released in the Agricultural Statistics Yearbook are not timely
Fisheries data are difficult for village heads to report.
Opportunities Threats The importance of the livestock and fisheries sector to the economy of Lao PDR and its high priority in the NSEDP.
Shortage of government funds.
Strengths Weaknesses Extensive experience of DOF in the collection of forestry statistics.
Reliance on administrative reporting systems for forestry statistics.
Presence of a Statistics Unit in DOF. Lack of ability to provide sufficient forest data .
Opportunities Threats The forestry sector continues to be important to the economy of Lao PDR and is given high priority in the NSEDP.
Shortage of government funds.
ANNEX VIII
58
ANNEX VIII
SPARS ACTION PLAN
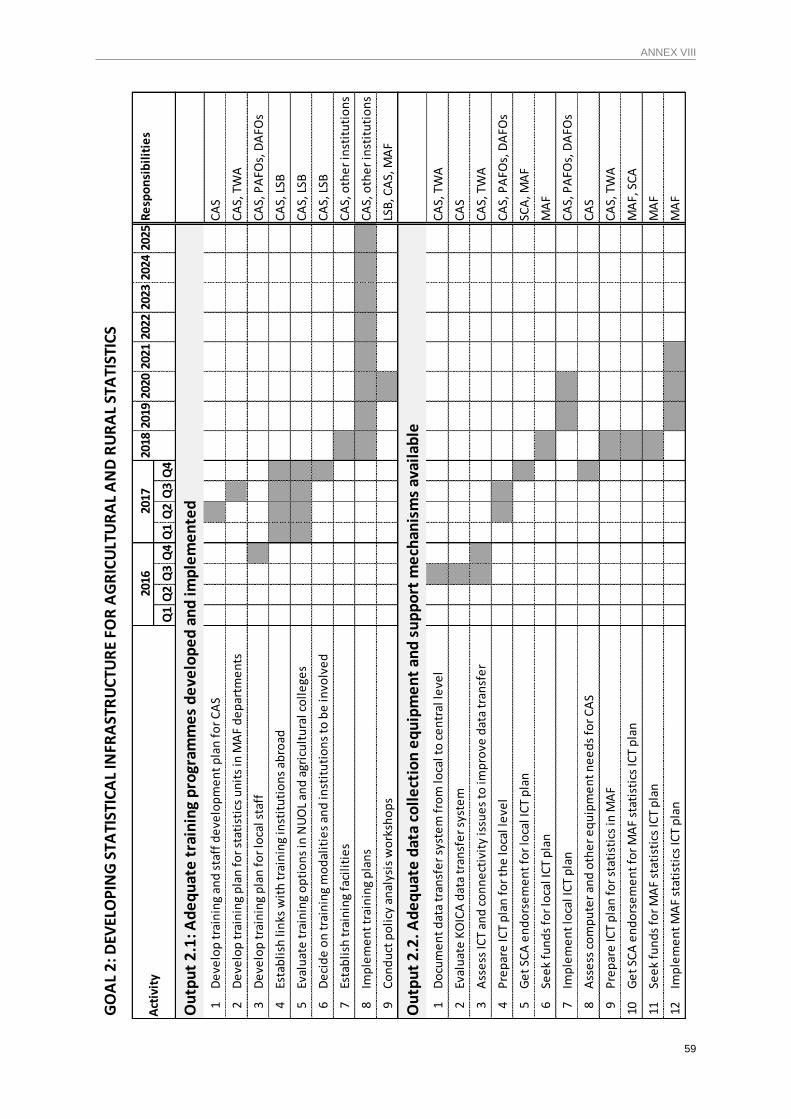
ANNEX VIII
59
2018
2019
2020
2021
2022
2023
2024
2025
Re
spo
nsi
bil
itie
s
Q1
Q2
Q3
Q4
Q1
Q2
Q3
Q4
1D
eve
lop
tra
inin
g an
d s
taff
de
velo
pm
en
t p
lan
fo
r C
AS
CA
S
2D
eve
lop
tra
inin
g p
lan
fo
r st
atis
tics
un
its
in M
AF
de
par
tme
nts
CA
S, T
WA
3D
eve
lop
tra
inin
g p
lan
fo
r lo
cal s
taff
CA
S, P
AFO
s, D
AFO
s
4Es
tab
lish
lin
ks w
ith
tra
inin
g in
stit
uti
on
s ab
road
CA
S, L
SB
5Ev
alu
ate
tra
inin
g o
pti
on
s in
NU
OL
and
agr
icu
ltu
ral c
oll
ege
s C
AS,
LSB
6D
eci
de
on
tra
inin
g m
od
alit
ies
and
inst
itu
tio
ns
to b
e in
volv
ed
CA
S, L
SB
7Es
tab
lish
tra
inin
g fa
cili
tie
s
CA
S, o
the
r in
stit
uti
on
s
8Im
ple
me
nt
trai
nin
g p
lan
sC
AS,
oth
er
inst
itu
tio
ns
9C
on
du
ct p
oli
cy a
nal
ysis
wo
rksh
op
s LS
B, C
AS,
MA
F
1D
ocu
me
nt
dat
a tr
ansf
er
syst
em
fro
m lo
cal t
o c
en
tral
leve
lC
AS,
TW
A
2Ev
alu
ate
KO
ICA
dat
a tr
ansf
er
syst
em
CA
S
3A
sse
ss IC
T an
d c
on
ne
ctiv
ity
issu
es
to im
pro
ve d
ata
tran
sfe
rC
AS,
TW
A
4P
rep
are
ICT
pla
n f
or
the
loca
l le
vel
CA
S, P
AFO
s, D
AFO
s
5G
et
SCA
en
do
rse
me
nt
for
loca
l IC
T p
lan
SC
A, M
AF
6Se
ek
fun
ds
for
loca
l IC
T p
lan
MA
F
7Im
ple
me
nt
loca
l IC
T p
lan
CA
S, P
AFO
s, D
AFO
s
8A
sse
ss c
om
pu
ter
and
oth
er
eq
uip
me
nt
ne
ed
s fo
r C
AS
CA
S
9P
rep
are
ICT
pla
n f
or
stat
isti
cs in
MA
F C
AS,
TW
A
10G
et
SCA
en
do
rse
me
nt
for
MA
F st
atis
tics
ICT
pla
n
MA
F, S
CA
11Se
ek
fun
ds
for
MA
F st
atis
tics
ICT
pla
nM
AF
12Im
ple
me
nt
MA
F st
atis
tics
ICT
pla
nM
AF
Ou
tpu
t 2
.2. A
de
qu
ate
dat
a co
lle
ctio
n e
qu
ipm
en
t an
d s
up
po
rt m
ech
anis
ms
avai
lab
le
GO
AL
2: D
EVEL
OP
ING
STA
TIST
ICA
L IN
FRA
STR
UC
TUR
E FO
R A
GR
ICU
LTU
RA
L A
ND
RU
RA
L ST
ATI
STIC
S
Act
ivit
y20
1620
17
Ou
tpu
t 2
.1: A
de
qu
ate
tra
inin
g p
rogr
amm
es
de
velo
pe
d a
nd
imp
lem
en
ted
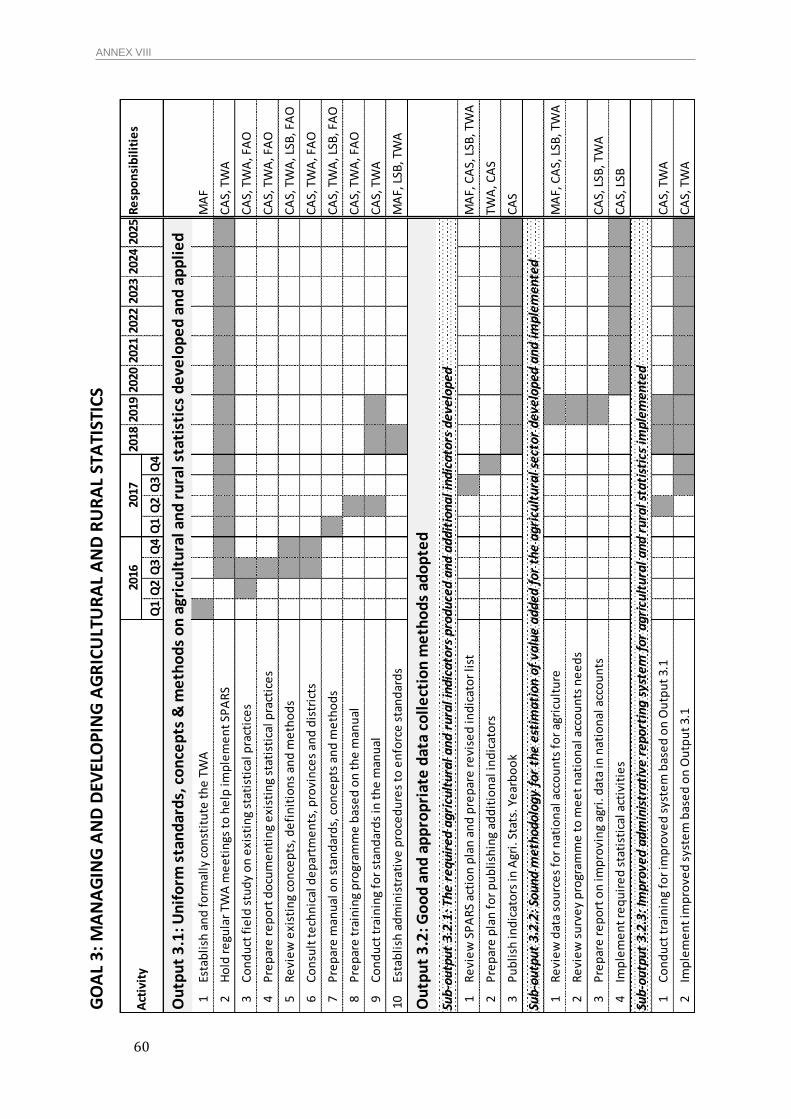
ANNEX VIII
60
2018
2019
2020
2021
2022
2023
2024
2025
Re
spo
nsi
bil
itie
s
Q1
Q2
Q3
Q4
Q1
Q2
Q3
Q4
1Es
tab
lish
an
d f
orm
ally
co
nst
itu
te t
he
TW
AM
AF
2H
old
re
gula
r TW
A m
ee
tin
gs t
o h
elp
imp
lem
en
t SP
AR
S C
AS,
TW
A
3C
on
du
ct f
ield
stu
dy
on
exi
stin
g st
atis
tica
l pra
ctic
es
CA
S, T
WA
, FA
O
4P
rep
are
re
po
rt d
ocu
me
nti
ng
exi
stin
g st
atis
tica
l pra
ctic
es
CA
S, T
WA
, FA
O
5R
evi
ew
exi
stin
g co
nce
pts
, de
fin
itio
ns
and
me
tho
ds
CA
S, T
WA
, LSB
, FA
O
6C
on
sult
te
chn
ical
de
par
tme
nts
, pro
vin
ces
and
dis
tric
ts
CA
S, T
WA
, FA
O
7P
rep
are
man
ual
on
sta
nd
ard
s, c
on
cep
ts a
nd
me
tho
ds
CA
S, T
WA
, LSB
, FA
O
8P
rep
are
tra
inin
g p
rogr
amm
e b
ase
d o
n t
he
man
ual
CA
S, T
WA
, FA
O
9C
on
du
ct t
rain
ing
for
stan
dar
ds
in t
he
man
ual
CA
S, T
WA
10Es
tab
lish
ad
min
istr
ativ
e p
roce
du
res
to e
nfo
rce
sta
nd
ard
sM
AF,
LSB
, TW
A
1R
evi
ew
SP
AR
S ac
tio
n p
lan
an
d p
rep
are
re
vise
d in
dic
ato
r li
stM
AF,
CA
S, L
SB, T
WA
2P
rep
are
pla
n f
or
pu
bli
shin
g ad
dit
ion
al in
dic
ato
rsTW
A, C
AS
3P
ub
lish
ind
icat
ors
in A
gri.
Sta
ts. Y
ear
bo
ok
CA
S
1R
evi
ew
dat
a so
urc
es
for
nat
ion
al a
cco
un
ts f
or
agri
cult
ure
MA
F, C
AS,
LSB
, TW
A
2R
evi
ew
su
rve
y p
rogr
amm
e t
o m
ee
t n
atio
nal
acc
ou
nts
ne
ed
s
3P
rep
are
re
po
rt o
n im
pro
vin
g ag
ri. d
ata
in n
atio
nal
acc
ou
nts
CA
S, L
SB, T
WA
4Im
ple
me
nt
req
uir
ed
sta
tist
ical
act
ivit
ies
CA
S, L
SB
1C
on
du
ct t
rain
ing
for
imp
rove
d s
yste
m b
ase
d o
n O
utp
ut
3.1
CA
S, T
WA
2Im
ple
me
nt
imp
rove
d s
yste
m b
ase
d o
n O
utp
ut
3.1
CA
S, T
WA
Ou
tpu
t 3
.2: G
oo
d a
nd
ap
pro
pri
ate
dat
a co
lle
ctio
n m
eth
od
s ad
op
ted
GO
AL
3:
MA
NA
GIN
G A
ND
DEV
ELO
PIN
G A
GR
ICU
LTU
RA
L A
ND
RU
RA
L ST
ATI
STIC
S
Sub-
outp
ut 3
.2.3
: Im
prov
ed a
dmin
istr
ativ
e re
port
ing
syst
em f
or a
gric
ultu
ral a
nd r
ural
sta
tist
ics
impl
emen
ted
2016
2017
Act
ivit
y
Ou
tpu
t 3
.1: U
nif
orm
sta
nd
ard
s, c
on
cep
ts &
me
tho
ds
on
agr
icu
ltu
ral a
nd
ru
ral s
tati
stic
s d
eve
lop
ed
an
d a
pp
lie
d
Sub-
outp
ut 3
.2.1
: The
req
uire
d ag
ricu
ltur
al a
nd r
ural
indi
cato
rs p
rodu
ced
and
addi
tion
al in
dica
tors
dev
elop
ed
Sub-
outp
ut 3
.2.2
: Sou
nd m
etho
dolo
gy f
or t
he e
stim
atio
n of
val
ue a
dded
for
the
agr
icul
tura
l sec
tor
deve
lope
d an
d im
plem
ente
d
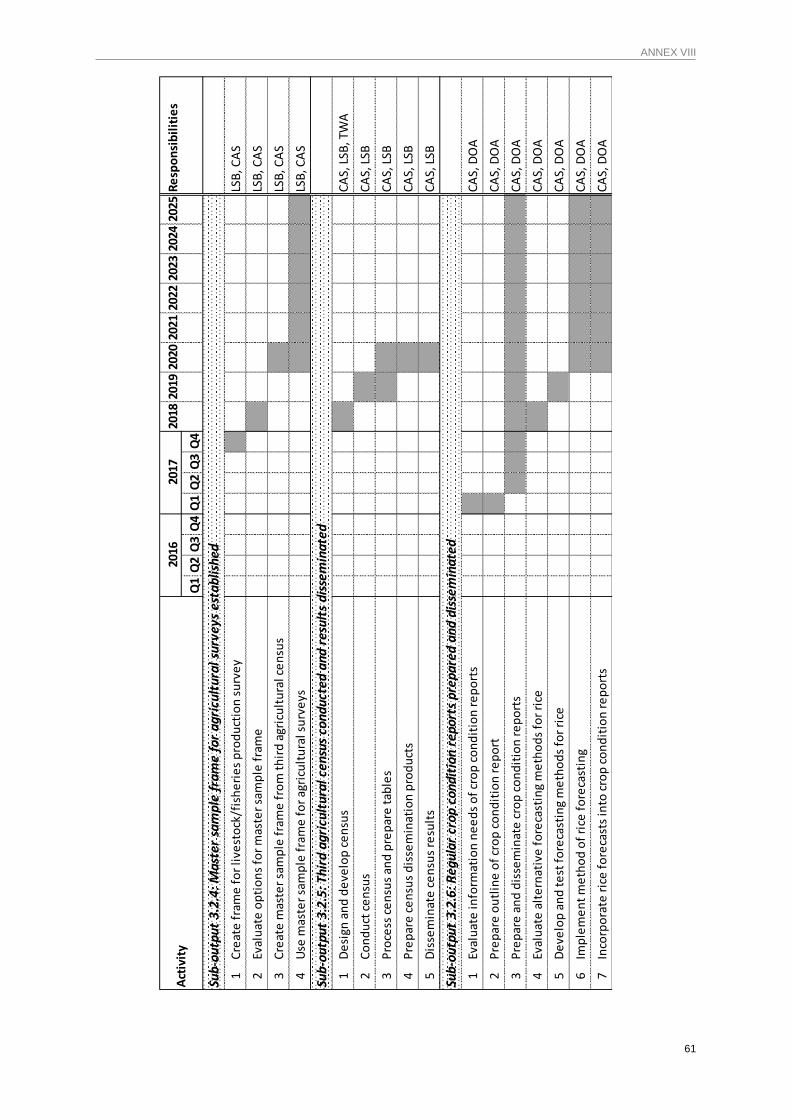
ANNEX VIII
61
2018
2019
2020
2021
2022
2023
2024
2025
Re
spo
nsi
bil
itie
s
Q1
Q2
Q3
Q4
Q1
Q2
Q3
Q4
1C
reat
e f
ram
e f
or
live
sto
ck/f
ish
eri
es
pro
du
ctio
n s
urv
ey
LSB
, CA
S
2Ev
alu
ate
op
tio
ns
for
mas
ter
sam
ple
fra
me
LSB
, CA
S
3C
reat
e m
aste
r sa
mp
le f
ram
e f
rom
th
ird
agr
icu
ltu
ral c
en
sus
LSB
, CA
S
4U
se m
aste
r sa
mp
le f
ram
e f
or
agri
cult
ura
l su
rve
ysLS
B, C
AS
1D
esi
gn a
nd
de
velo
p c
en
sus
CA
S, L
SB, T
WA
2C
on
du
ct c
en
sus
CA
S, L
SB
3P
roce
ss c
en
sus
and
pre
par
e t
able
sC
AS,
LSB
4P
rep
are
ce
nsu
s d
isse
min
atio
n p
rod
uct
sC
AS,
LSB
5D
isse
min
ate
ce
nsu
s re
sult
sC
AS,
LSB
1Ev
alu
ate
info
rmat
ion
ne
ed
s o
f cr
op
co
nd
itio
n r
ep
ort
sC
AS,
DO
A
2P
rep
are
ou
tlin
e o
f cr
op
co
nd
itio
n r
ep
ort
CA
S, D
OA
3P
rep
are
an
d d
isse
min
ate
cro
p c
on
dit
ion
re
po
rts
CA
S, D
OA
4Ev
alu
ate
alt
ern
ativ
e f
ore
cast
ing
me
tho
ds
for
rice
CA
S, D
OA
5D
eve
lop
an
d t
est
fo
reca
stin
g m
eth
od
s fo
r ri
ceC
AS,
DO
A
6Im
ple
me
nt
me
tho
d o
f ri
ce f
ore
cast
ing
CA
S, D
OA
7In
corp
ora
te r
ice
fo
reca
sts
into
cro
p c
on
dit
ion
re
po
rts
CA
S, D
OA
Sub-
outp
ut 3
.2.4
: Mas
ter
sam
ple
fram
e fo
r ag
ricu
ltur
al s
urve
ys e
stab
lishe
d
Sub-
outp
ut 3
.2.6
: Reg
ular
cro
p co
ndit
ion
repo
rts
prep
ared
and
dis
sem
inat
ed
Sub-
outp
ut 3
.2.5
: Thi
rd a
gric
ultu
ral c
ensu
s co
nduc
ted
and
resu
lts
diss
emin
ated
Act
ivit
y20
1620
17
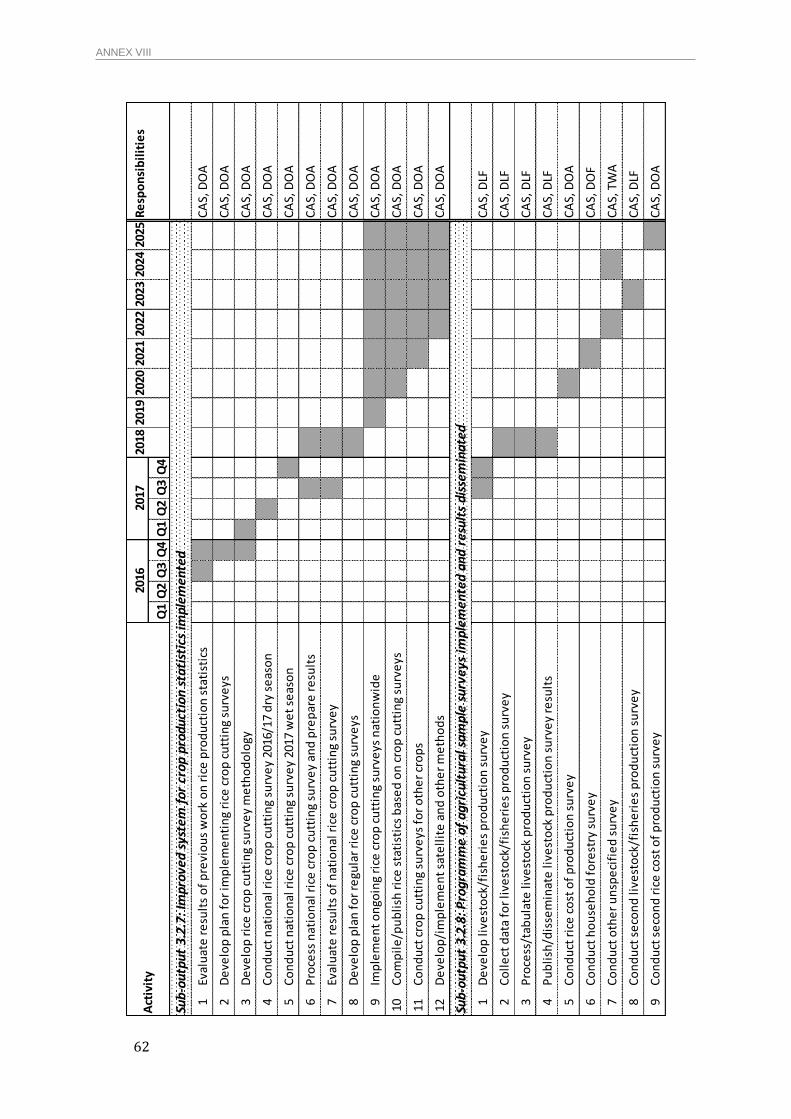
ANNEX VIII
62
2018
2019
2020
2021
2022
2023
2024
2025
Re
spo
nsi
bil
itie
s
Q1
Q2
Q3
Q4
Q1
Q2
Q3
Q4
1Ev
alu
ate
re
sult
s o
f p
revi
ou
s w
ork
on
ric
e p
rod
uct
ion
sta
tist
ics
CA
S, D
OA
2D
eve
lop
pla
n f
or
imp
lem
en
tin
g ri
ce c
rop
cu
ttin
g su
rve
ysC
AS,
DO
A
3D
eve
lop
ric
e c
rop
cu
ttin
g su
rve
y m
eth
od
olo
gy
CA
S, D
OA
4C
on
du
ct n
atio
nal
ric
e c
rop
cu
ttin
g su
rve
y 20
16/1
7 d
ry s
eas
on
CA
S, D
OA
5C
on
du
ct n
atio
nal
ric
e c
rop
cu
ttin
g su
rve
y 20
17 w
et
seas
on
CA
S, D
OA
6P
roce
ss n
atio
nal
ric
e c
rop
cu
ttin
g su
rve
y an
d p
rep
are
re
sult
sC
AS,
DO
A
7Ev
alu
ate
re
sult
s o
f n
atio
nal
ric
e c
rop
cu
ttin
g su
rve
yC
AS,
DO
A
8D
eve
lop
pla
n f
or
regu
lar
rice
cro
p c
utt
ing
surv
eys
CA
S, D
OA
9Im
ple
me
nt
on
goin
g ri
ce c
rop
cu
ttin
g su
rve
ys n
atio
nw
ide
CA
S, D
OA
10C
om
pil
e/p
ub
lish
ric
e s
tati
stic
s b
ase
d o
n c
rop
cu
ttin
g su
rve
ysC
AS,
DO
A
11C
on
du
ct c
rop
cu
ttin
g su
rve
ys f
or
oth
er
cro
ps
CA
S, D
OA
12D
eve
lop
/im
ple
me
nt
sate
llit
e a
nd
oth
er
me
tho
ds
CA
S, D
OA
1D
eve
lop
live
sto
ck/f
ish
eri
es
pro
du
ctio
n s
urv
ey
CA
S, D
LF
2C
oll
ect
dat
a fo
r li
vest
ock
/fis
he
rie
s p
rod
uct
ion
su
rve
yC
AS,
DLF
3P
roce
ss/t
abu
late
live
sto
ck p
rod
uct
ion
su
rve
yC
AS,
DLF
4P
ub
lish
/dis
sem
inat
e li
vest
ock
pro
du
ctio
n s
urv
ey
resu
lts
CA
S, D
LF
5C
on
du
ct r
ice
co
st o
f p
rod
uct
ion
su
rve
yC
AS,
DO
A
6C
on
du
ct h
ou
seh
old
fo
rest
ry s
urv
ey
CA
S, D
OF
7C
on
du
ct o
the
r u
nsp
eci
fie
d s
urv
ey
CA
S, T
WA
8C
on
du
ct s
eco
nd
live
sto
ck/f
ish
eri
es
pro
du
ctio
n s
urv
ey
CA
S, D
LF
9C
on
du
ct s
eco
nd
ric
e c
ost
of
pro
du
ctio
n s
urv
ey
CA
S, D
OA
Sub-
outp
ut 3
.2.8
: Pro
gram
me
of a
gric
ultu
ral s
ampl
e su
rvey
s im
plem
ente
d an
d re
sult
s di
ssem
inat
ed
Act
ivit
y20
1620
17
Sub-
outp
ut 3
.2.7
: Im
prov
ed s
yste
m f
or c
rop
prod
ucti
on s
tati
stic
s im
plem
ente
d
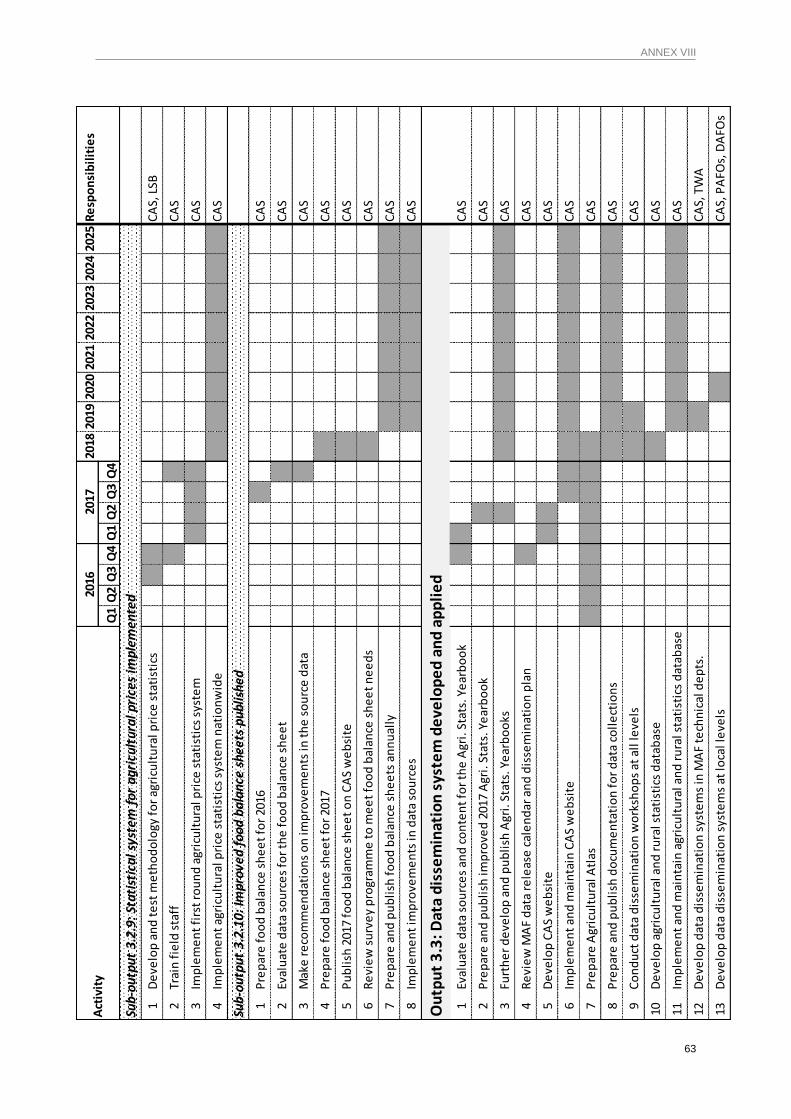
ANNEX VIII
63
2018
2019
2020
2021
2022
2023
2024
2025
Re
spo
nsi
bil
itie
s
Q1
Q2
Q3
Q4
Q1
Q2
Q3
Q4
1D
eve
lop
an
d t
est
me
tho
do
logy
fo
r ag
ricu
ltu
ral p
rice
sta
tist
ics
CA
S, L
SB
2Tr
ain
fie
ld s
taff
CA
S
3Im
ple
me
nt
firs
t ro
un
d a
gric
ult
ura
l pri
ce s
tati
stic
s sy
ste
mC
AS
4Im
ple
me
nt
agri
cult
ura
l pri
ce s
tati
stic
s sy
ste
m n
atio
nw
ide
CA
S
1P
rep
are
fo
od
bal
ance
sh
ee
t fo
r 20
16C
AS
2Ev
alu
ate
dat
a so
urc
es
for
the
fo
od
bal
ance
sh
ee
tC
AS
3M
ake
re
com
me
nd
atio
ns
on
imp
rove
me
nts
in t
he
so
urc
e d
ata
CA
S
4P
rep
are
fo
od
bal
ance
sh
ee
t fo
r 20
17C
AS
5P
ub
lish
201
7 fo
od
bal
ance
sh
ee
t o
n C
AS
we
bsi
teC
AS
6R
evi
ew
su
rve
y p
rogr
amm
e t
o m
ee
t fo
od
bal
ance
sh
ee
t n
ee
ds
CA
S
7P
rep
are
an
d p
ub
lish
fo
od
bal
ance
sh
ee
ts a
nn
ual
lyC
AS
8Im
ple
me
nt
imp
rove
me
nts
in d
ata
sou
rce
sC
AS
1Ev
alu
ate
dat
a so
urc
es
and
co
nte
nt
for
the
Agr
i. S
tats
. Ye
arb
oo
kC
AS
2P
rep
are
an
d p
ub
lish
imp
rove
d 2
017
Agr
i. S
tats
. Ye
arb
oo
kC
AS
3Fu
rth
er
de
velo
p a
nd
pu
bli
sh A
gri.
Sta
ts. Y
ear
bo
oks
CA
S
4R
evi
ew
MA
F d
ata
rele
ase
cal
en
dar
an
d d
isse
min
atio
n p
lan
CA
S
5D
eve
lop
CA
S w
eb
site
C
AS
6Im
ple
me
nt
and
mai
nta
in C
AS
we
bsi
teC
AS
7P
rep
are
Agr
icu
ltu
ral A
tlas
CA
S
8P
rep
are
an
d p
ub
lish
do
cum
en
tati
on
fo
r d
ata
coll
ect
ion
sC
AS
9C
on
du
ct d
ata
dis
sem
inat
ion
wo
rksh
op
s at
all
leve
lsC
AS
10D
eve
lop
agr
icu
ltu
ral a
nd
ru
ral s
tati
stic
s d
atab
ase
CA
S
11Im
ple
me
nt
and
mai
nta
in a
gric
ult
ura
l an
d r
ura
l sta
tist
ics
dat
abas
eC
AS
12D
eve
lop
dat
a d
isse
min
atio
n s
yste
ms
in M
AF
tech
nic
al d
ep
ts.
CA
S, T
WA
13D
eve
lop
dat
a d
isse
min
atio
n s
yste
ms
at lo
cal l
eve
lsC
AS,
PA
FOs,
DA
FOs
Ou
tpu
t 3
.3: D
ata
dis
sem
inat
ion
sys
tem
de
velo
pe
d a
nd
ap
pli
ed
Sub-
outp
ut 3
.2.1
0: Im
prov
ed f
ood
bala
nce
shee
ts p
ublis
hed
Sub-
outp
ut 3
.2.9
: Sta
tist
ical
sys
tem
for
agr
icul
tura
l pri
ces
impl
emen
ted
Act
ivit
y20
1620
17
ANNEX IX
64
ANNEX IX
SPARS LOGICAL FRAMEWORK
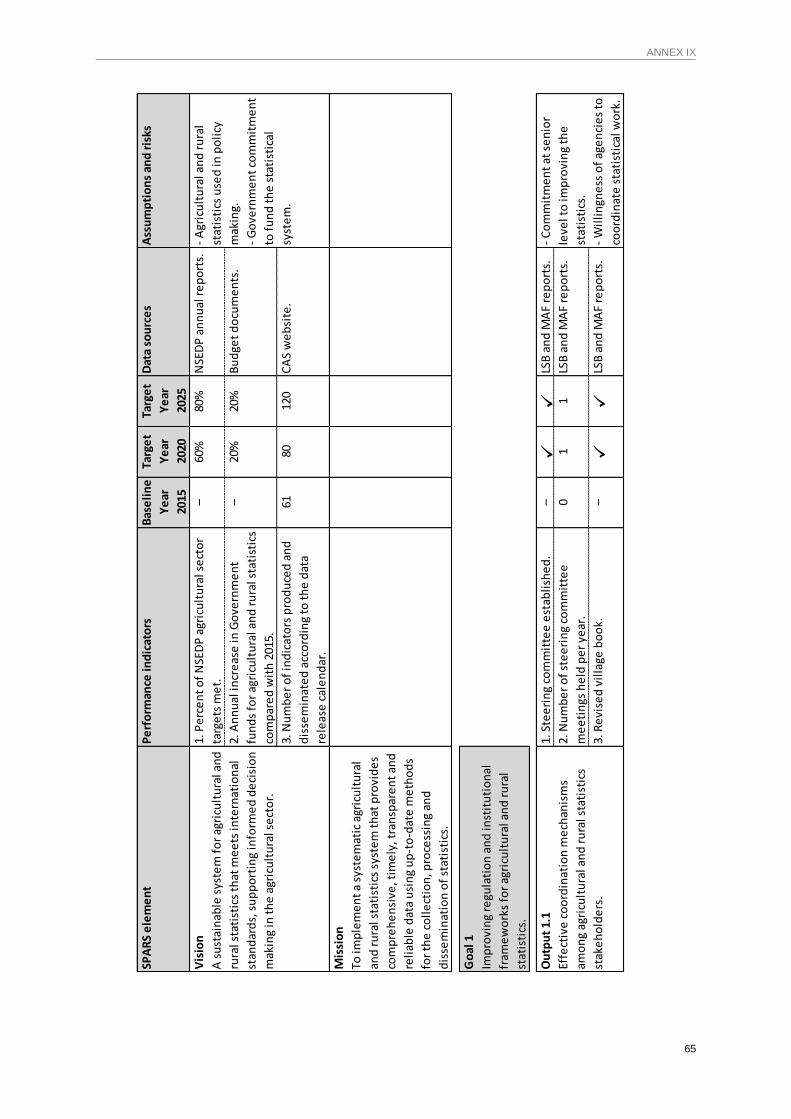
ANNEX IX
65
SPA
RS
ele
me
nt
Pe
rfo
rman
ce in
dic
ato
rsB
ase
lin
e
Ye
ar
2015
Targ
et
Ye
ar
2020
Targ
et
Ye
ar
2025
Dat
a so
urc
es
Ass
um
pti
on
s an
d r
isks
1. P
erc
en
t o
f N
SED
P a
gric
ult
ura
l se
cto
r
targ
ets
me
t.
–60
%80
%N
SED
P a
nn
ual
re
po
rts.
2. A
nn
ual
incr
eas
e in
Go
vern
me
nt
fun
ds
for
agri
cult
ura
l an
d r
ura
l sta
tist
ics
com
par
ed
wit
h 2
015.
–20
%20
%B
ud
get
do
cum
en
ts.
3. N
um
be
r o
f in
dic
ato
rs p
rod
uce
d a
nd
dis
sem
inat
ed
acc
ord
ing
to t
he
dat
a
rele
ase
cal
en
dar
.
6180
120
CA
S w
eb
site
.
Go
al 1
Imp
rovi
ng
regu
lati
on
an
d in
stit
uti
on
al
fram
ew
ork
s fo
r ag
ricu
ltu
ral a
nd
ru
ral
stat
isti
cs.
1. S
tee
rin
g co
mm
itte
e e
stab
lish
ed
.–
LSB
an
d M
AF
rep
ort
s.
2. N
um
be
r o
f st
ee
rin
g co
mm
itte
e
me
eti
ngs
he
ld p
er
year
.
01
1LS
B a
nd
MA
F re
po
rts.
3. R
evi
sed
vil
lage
bo
ok.
–
LS
B a
nd
MA
F re
po
rts.
Vis
ion
A s
ust
ain
able
sys
tem
fo
r ag
ricu
ltu
ral a
nd
rura
l sta
tist
ics
that
me
ets
inte
rnat
ion
al
stan
dar
ds,
su
pp
ort
ing
info
rme
d d
eci
sio
n
mak
ing
in t
he
agr
icu
ltu
ral s
ect
or.
- A
gric
ult
ura
l an
d r
ura
l
stat
isti
cs u
sed
in p
oli
cy
mak
ing.
- G
ove
rnm
en
t co
mm
itm
en
t
to f
un
d t
he
sta
tist
ical
syst
em
.
Mis
sio
n
To im
ple
me
nt
a sy
ste
mat
ic a
gric
ult
ura
l
and
ru
ral s
tati
stic
s sy
ste
m t
hat
pro
vid
es
com
pre
he
nsi
ve, t
ime
ly, t
ran
spar
en
t an
d
reli
able
dat
a u
sin
g u
p-t
o-d
ate
me
tho
ds
for
the
co
lle
ctio
n, p
roce
ssin
g an
d
dis
sem
inat
ion
of
stat
isti
cs.
Ou
tpu
t 1.
1
Effe
ctiv
e c
oo
rdin
atio
n m
ech
anis
ms
amo
ng
agri
cult
ura
l an
d r
ura
l sta
tist
ics
stak
eh
old
ers
.
- C
om
mit
me
nt
at s
en
ior
leve
l to
imp
rovi
ng
the
stat
isti
cs.
- W
illi
ngn
ess
of
age
nci
es
to
coo
rdin
ate
sta
tist
ical
wo
rk.
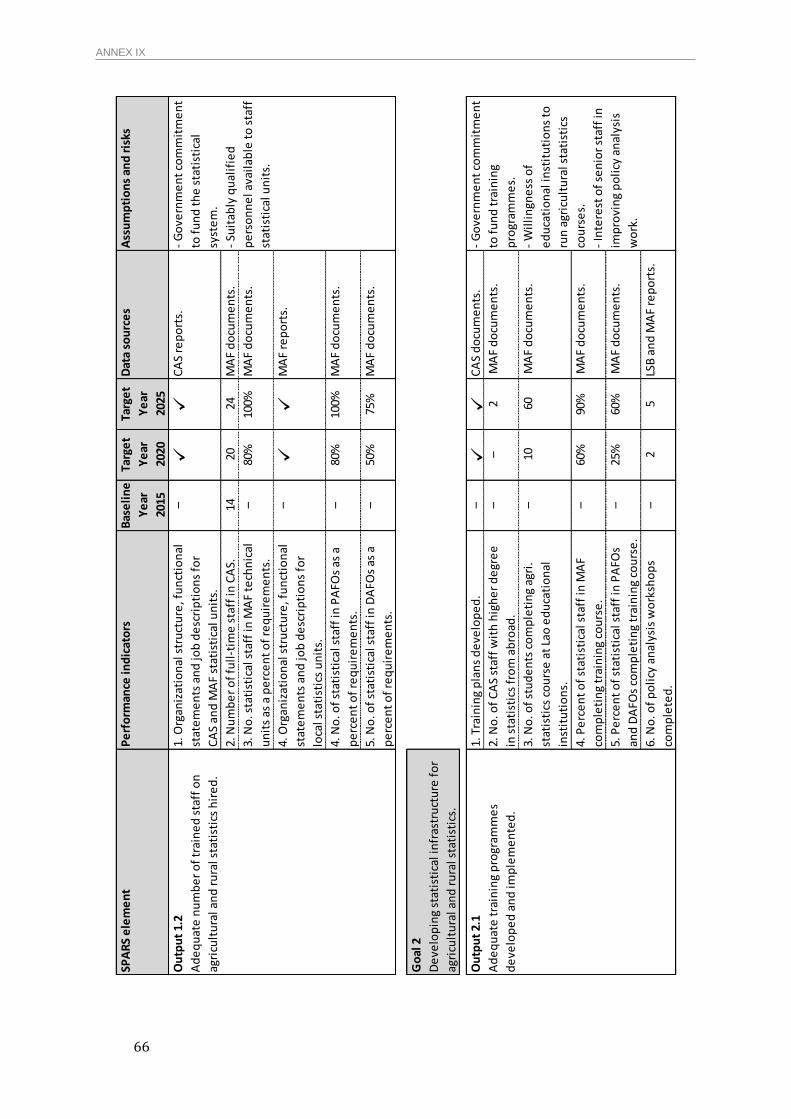
ANNEX IX
66
SPA
RS
ele
me
nt
Pe
rfo
rman
ce in
dic
ato
rsB
ase
lin
e
Ye
ar
2015
Targ
et
Ye
ar
2020
Targ
et
Ye
ar
2025
Dat
a so
urc
es
Ass
um
pti
on
s an
d r
isks
1. O
rgan
izat
ion
al s
tru
ctu
re, f
un
ctio
nal
stat
em
en
ts a
nd
job
de
scri
pti
on
s fo
r
CA
S an
d M
AF
stat
isti
cal u
nit
s.
–
C
AS
rep
ort
s.
2. N
um
be
r o
f fu
ll-t
ime
sta
ff in
CA
S.14
2024
MA
F d
ocu
me
nts
.
3. N
o. s
tati
stic
al s
taff
in M
AF
tech
nic
al
un
its
as a
pe
rce
nt
of
req
uir
em
en
ts.
–80
%10
0%M
AF
do
cum
en
ts.
4. O
rgan
izat
ion
al s
tru
ctu
re, f
un
ctio
nal
stat
em
en
ts a
nd
job
de
scri
pti
on
s fo
r
loca
l sta
tist
ics
un
its.
–
M
AF
rep
ort
s.
4. N
o. o
f st
atis
tica
l sta
ff in
PA
FOs
as a
pe
rce
nt
of
req
uir
em
en
ts.
–80
%10
0%M
AF
do
cum
en
ts.
5. N
o. o
f st
atis
tica
l sta
ff in
DA
FOs
as a
pe
rce
nt
of
req
uir
em
en
ts.
–50
%75
%M
AF
do
cum
en
ts.
Go
al 2
De
velo
pin
g st
atis
tica
l in
fras
tru
ctu
re f
or
agri
cult
ura
l an
d r
ura
l sta
tist
ics.
1. T
rain
ing
pla
ns
de
velo
pe
d.
–
C
AS
do
cum
en
ts.
2. N
o. o
f C
AS
staf
f w
ith
hig
he
r d
egr
ee
in s
tati
stic
s fr
om
ab
road
.
––
2 M
AF
do
cum
en
ts.
3. N
o. o
f st
ud
en
ts c
om
ple
tin
g ag
ri.
stat
isti
cs c
ou
rse
at
Lao
ed
uca
tio
nal
inst
itu
tio
ns.
–10
60 M
AF
do
cum
en
ts.
4. P
erc
en
t o
f st
atis
tica
l sta
ff in
MA
F
com
ple
tin
g tr
ain
ing
cou
rse
.
–60
%90
% M
AF
do
cum
en
ts.
5. P
erc
en
t o
f st
atis
tica
l sta
ff in
PA
FOs
and
DA
FOs
com
ple
tin
g tr
ain
ing
cou
rse
.
–25
%60
% M
AF
do
cum
en
ts.
6. N
o. o
f p
oli
cy a
nal
ysis
wo
rksh
op
s
com
ple
ted
.
–2
5LS
B a
nd
MA
F re
po
rts.
Ou
tpu
t 2.
1
Ad
eq
uat
e t
rain
ing
pro
gram
me
s
de
velo
pe
d a
nd
imp
lem
en
ted
.
- G
ove
rnm
en
t co
mm
itm
en
t
to f
un
d t
rain
ing
pro
gram
me
s.
- W
illi
ngn
ess
of
ed
uca
tio
nal
inst
itu
tio
ns
to
run
agr
icu
ltu
ral s
tati
stic
s
cou
rse
s.
- In
tere
st o
f se
nio
r st
aff
in
imp
rovi
ng
po
licy
an
alys
is
wo
rk.
Ou
tpu
t 1.
2
Ad
eq
uat
e n
um
be
r o
f tr
ain
ed
sta
ff o
n
agri
cult
ura
l an
d r
ura
l sta
tist
ics
hir
ed
.
- G
ove
rnm
en
t co
mm
itm
en
t
to f
un
d t
he
sta
tist
ical
syst
em
.
- Su
itab
ly q
ual
ifie
d
pe
rso
nn
el a
vail
able
to
sta
ff
stat
isti
cal u
nit
s.
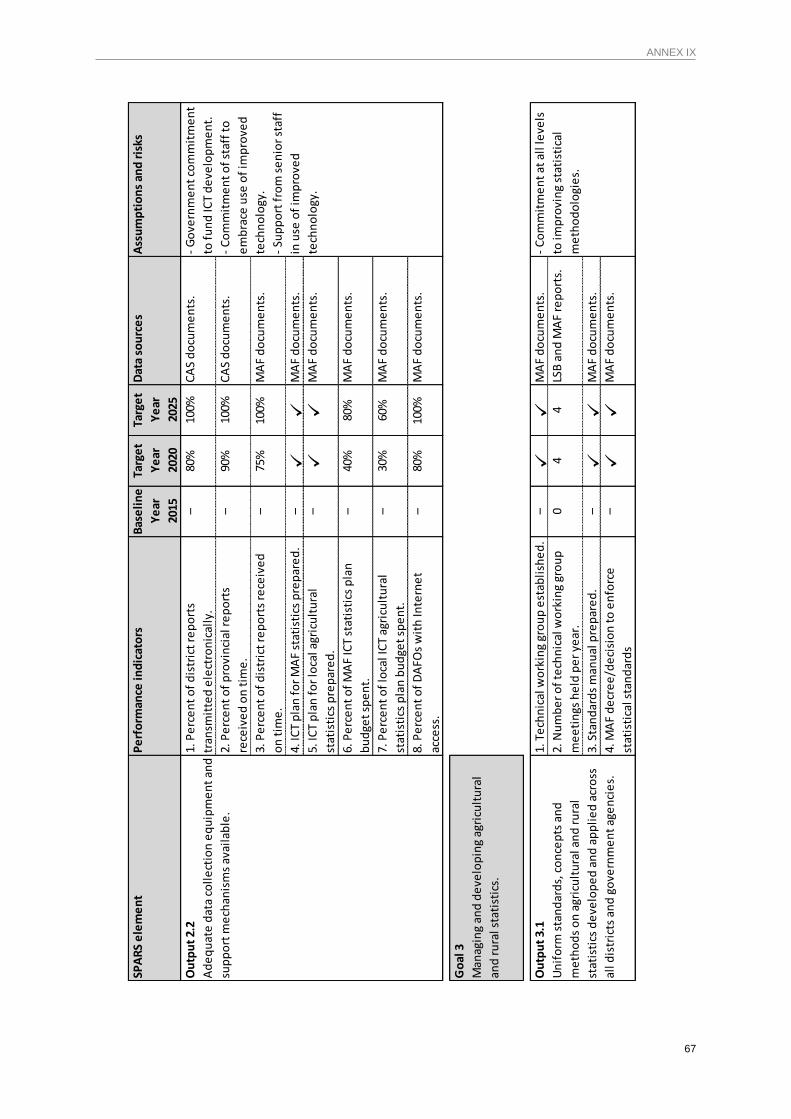
ANNEX IX
67
SPA
RS
ele
me
nt
Pe
rfo
rman
ce in
dic
ato
rsB
ase
lin
e
Ye
ar
2015
Targ
et
Ye
ar
2020
Targ
et
Ye
ar
2025
Dat
a so
urc
es
Ass
um
pti
on
s an
d r
isks
1. P
erc
en
t o
f d
istr
ict
rep
ort
s
tran
smit
ted
ele
ctro
nic
ally
.
–80
%10
0%C
AS
do
cum
en
ts.
2. P
erc
en
t o
f p
rovi
nci
al r
ep
ort
s
rece
ive
d o
n t
ime
.
–90
%10
0%C
AS
do
cum
en
ts.
3. P
erc
en
t o
f d
istr
ict
rep
ort
s re
ceiv
ed
on
tim
e.
–75
%10
0%M
AF
do
cum
en
ts.
4. IC
T p
lan
fo
r M
AF
stat
isti
cs p
rep
are
d.
–
M
AF
do
cum
en
ts.
5. IC
T p
lan
fo
r lo
cal a
gric
ult
ura
l
stat
isti
cs p
rep
are
d.
–
M
AF
do
cum
en
ts.
6. P
erc
en
t o
f M
AF
ICT
stat
isti
cs p
lan
bu
dge
t sp
en
t.
–40
%80
%M
AF
do
cum
en
ts.
7. P
erc
en
t o
f lo
cal I
CT
agri
cult
ura
l
stat
isti
cs p
lan
bu
dge
t sp
en
t.
–30
%60
%M
AF
do
cum
en
ts.
8. P
erc
en
t o
f D
AFO
s w
ith
Inte
rne
t
acce
ss.
–80
%10
0%M
AF
do
cum
en
ts.
Go
al 3
Man
agin
g an
d d
eve
lop
ing
agri
cult
ura
l
and
ru
ral s
tati
stic
s.
1. T
ech
nic
al w
ork
ing
gro
up
est
abli
she
d.
–
M
AF
do
cum
en
ts.
2. N
um
be
r o
f te
chn
ical
wo
rkin
g gr
ou
p
me
eti
ngs
he
ld p
er
year
.
04
4LS
B a
nd
MA
F re
po
rts.
3. S
tan
dar
ds
man
ual
pre
par
ed
.–
MA
F d
ocu
me
nts
.
4. M
AF
de
cre
e/d
eci
sio
n t
o e
nfo
rce
stat
isti
cal s
tan
dar
ds
–
M
AF
do
cum
en
ts.
Ou
tpu
t 2.
2
Ad
eq
uat
e d
ata
coll
ect
ion
eq
uip
me
nt
and
sup
po
rt m
ech
anis
ms
avai
lab
le.
- G
ove
rnm
en
t co
mm
itm
en
t
to f
un
d IC
T d
eve
lop
me
nt.
- C
om
mit
me
nt
of
staf
f to
em
bra
ce u
se o
f im
pro
ved
tech
no
logy
.
- Su
pp
ort
fro
m s
en
ior
staf
f
in u
se o
f im
pro
ved
tech
no
logy
.
Ou
tpu
t 3.
1
Un
ifo
rm s
tan
dar
ds,
co
nce
pts
an
d
me
tho
ds
on
agr
icu
ltu
ral a
nd
ru
ral
stat
isti
cs d
eve
lop
ed
an
d a
pp
lie
d a
cro
ss
all d
istr
icts
an
d g
ove
rnm
en
t ag
en
cie
s.
- C
om
mit
me
nt
at a
ll le
vels
to im
pro
vin
g st
atis
tica
l
me
tho
do
logi
es.
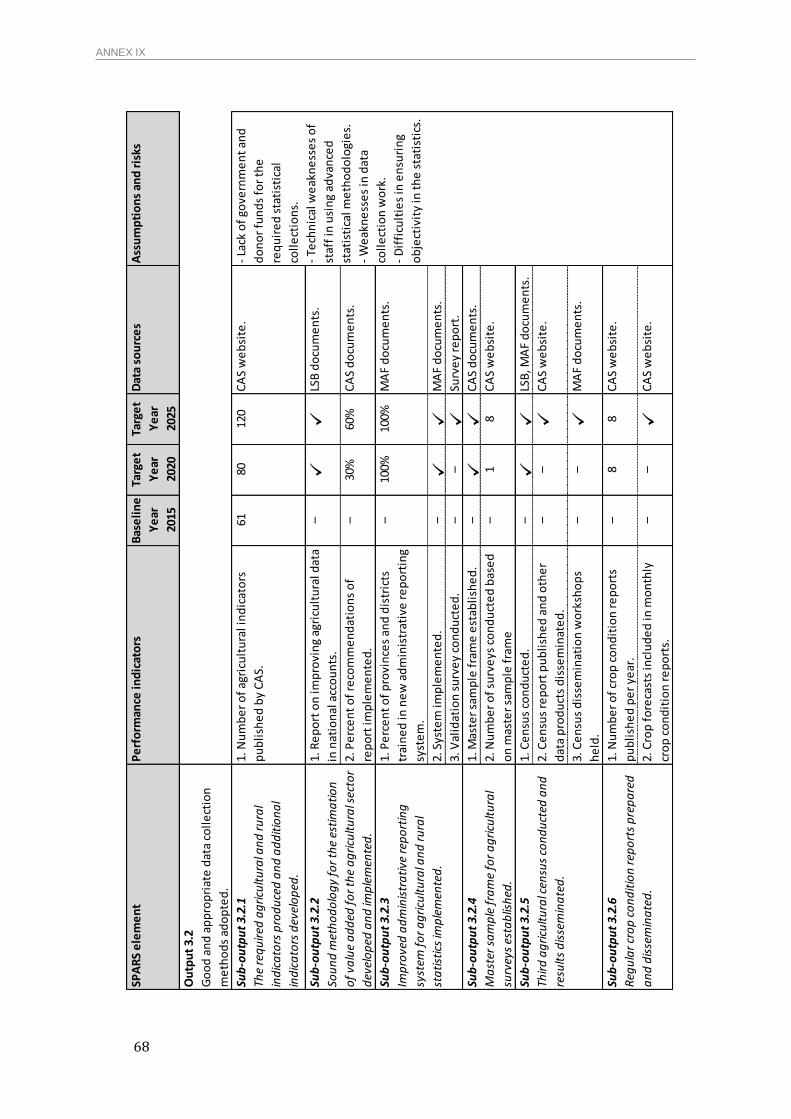
ANNEX IX
68
SPA
RS
ele
me
nt
Pe
rfo
rman
ce in
dic
ato
rsB
ase
lin
e
Ye
ar
2015
Targ
et
Ye
ar
2020
Targ
et
Ye
ar
2025
Dat
a so
urc
es
Ass
um
pti
on
s an
d r
isks
Ou
tpu
t 3.
2
Go
od
an
d a
pp
rop
riat
e d
ata
coll
ect
ion
me
tho
ds
ado
pte
d.
Sub
-ou
tpu
t 3.
2.1
The
req
uir
ed a
gri
cult
ura
l an
d r
ura
l
ind
ica
tors
pro
du
ced
an
d a
dd
itio
na
l
ind
ica
tors
dev
elo
ped
.
1. N
um
be
r o
f ag
ricu
ltu
ral i
nd
icat
ors
pu
bli
she
d b
y C
AS.
6180
120
CA
S w
eb
site
.
1. R
ep
ort
on
imp
rovi
ng
agri
cult
ura
l dat
a
in n
atio
nal
acc
ou
nts
.
–
LS
B d
ocu
me
nts
.
2. P
erc
en
t o
f re
com
me
nd
atio
ns
of
rep
ort
imp
lem
en
ted
.
–30
%60
%C
AS
do
cum
en
ts.
1. P
erc
en
t o
f p
rovi
nce
s an
d d
istr
icts
trai
ne
d in
ne
w a
dm
inis
trat
ive
re
po
rtin
g
syst
em
.
–10
0%10
0%M
AF
do
cum
en
ts.
2. S
yste
m im
ple
me
nte
d.
–
M
AF
do
cum
en
ts.
3. V
alid
atio
n s
urv
ey
con
du
cte
d.
––
Su
rve
y re
po
rt.
1. M
aste
r sa
mp
le f
ram
e e
stab
lish
ed
.–
CA
S d
ocu
me
nts
.
2. N
um
be
r o
f su
rve
ys c
on
du
cte
d b
ase
d
on
mas
ter
sam
ple
fra
me
–1
8C
AS
we
bsi
te.
1. C
en
sus
con
du
cte
d.
–
LS
B, M
AF
do
cum
en
ts.
2. C
en
sus
rep
ort
pu
bli
she
d a
nd
oth
er
dat
a p
rod
uct
s d
isse
min
ate
d.
––
C
AS
we
bsi
te.
3. C
en
sus
dis
sem
inat
ion
wo
rksh
op
s
he
ld.
––
M
AF
do
cum
en
ts.
1. N
um
be
r o
f cr
op
co
nd
itio
n r
ep
ort
s
pu
bli
she
d p
er
year
.
–8
8C
AS
we
bsi
te.
2. C
rop
fo
reca
sts
incl
ud
ed
in m
on
thly
cro
p c
on
dit
ion
re
po
rts.
––
C
AS
we
bsi
te.
Sub
-ou
tpu
t 3.
2.3
Imp
rove
d a
dm
inis
tra
tive
rep
ort
ing
syst
em f
or
ag
ricu
ltu
ral a
nd
ru
ral
sta
tist
ics
imp
lem
ente
d.
Sub
-ou
tpu
t 3.
2.6
Reg
ula
r cr
op
co
nd
itio
n r
epo
rts
pre
pa
red
an
d d
isse
min
ate
d.
Sub
-ou
tpu
t 3.
2.5
Thir
d a
gri
cult
ura
l cen
sus
con
du
cted
an
d
resu
lts
dis
sem
ina
ted
.
Sub
-ou
tpu
t 3.
2.4
Ma
ster
sa
mp
le f
ram
e fo
r a
gri
cult
ura
l
surv
eys
esta
blis
hed
.
- La
ck o
f go
vern
me
nt
and
do
no
r fu
nd
s fo
r th
e
req
uir
ed
sta
tist
ical
coll
ect
ion
s.
- Te
chn
ical
we
akn
ess
es
of
staf
f in
usi
ng
adva
nce
d
stat
isti
cal m
eth
od
olo
gie
s.
- W
eak
ne
sse
s in
dat
a
coll
ect
ion
wo
rk.
- D
iffi
cult
ies
in e
nsu
rin
g
ob
ject
ivit
y in
th
e s
tati
stic
s.
Sub
-ou
tpu
t 3.
2.2
Sou
nd
met
ho
do
log
y fo
r th
e es
tim
ati
on
of
valu
e a
dd
ed f
or
the
ag
ricu
ltu
ral s
ecto
r
dev
elo
ped
an
d im
ple
men
ted
.
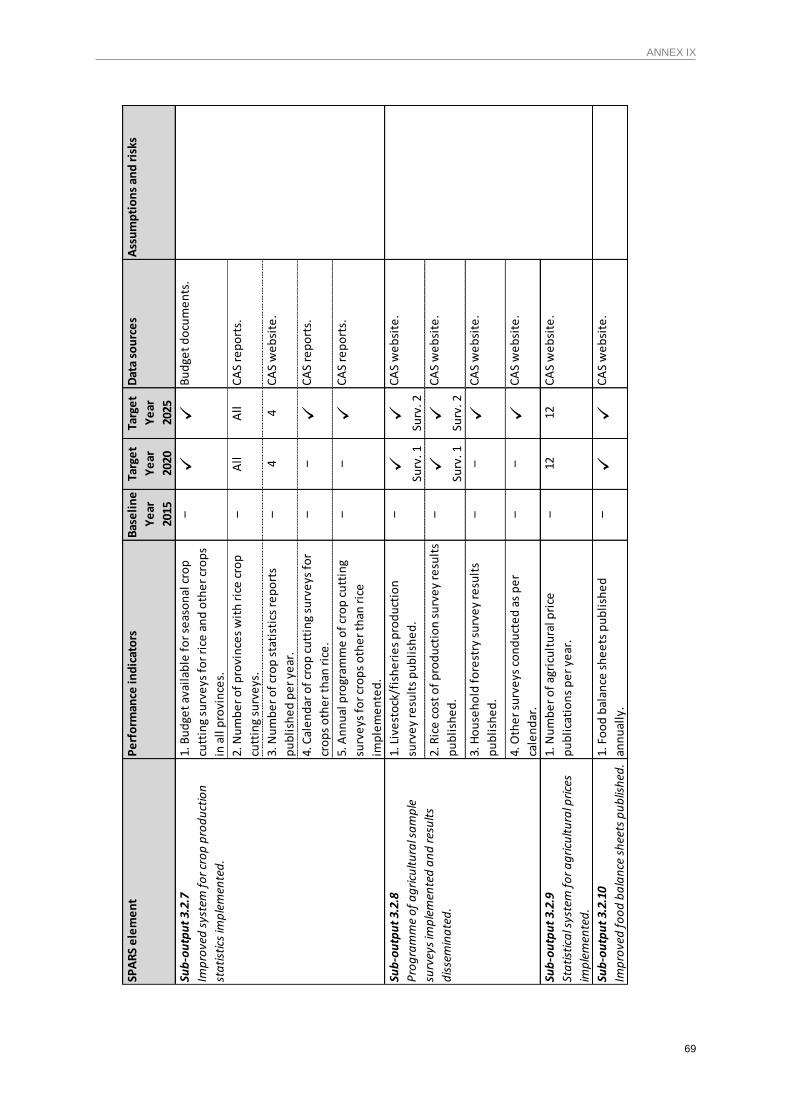
ANNEX IX
69
SP
AR
S e
lem
en
tP
erf
orm
ance
ind
icat
ors
Bas
eli
ne
Ye
ar
2015
Targ
et
Ye
ar
2020
Targ
et
Ye
ar
2025
Dat
a so
urc
es
Ass
um
pti
on
s an
d r
isks
1. B
ud
get
avai
lab
le f
or
seas
on
al c
rop
cutt
ing
surv
eys
fo
r ri
ce a
nd
oth
er
cro
ps
in a
ll p
rovi
nce
s.
–
B
ud
get
do
cum
en
ts.
2. N
um
be
r o
f p
rovi
nce
s w
ith
ric
e c
rop
cutt
ing
surv
eys
.
–A
llA
llC
AS
rep
ort
s.
3. N
um
be
r o
f cr
op
sta
tist
ics
rep
ort
s
pu
bli
she
d p
er
year
.
–4
4C
AS
we
bsi
te.
4. C
ale
nd
ar o
f cr
op
cu
ttin
g su
rve
ys f
or
cro
ps
oth
er
than
ric
e.
––
C
AS
rep
ort
s.
5. A
nn
ual
pro
gram
me
of
cro
p c
utt
ing
surv
eys
fo
r cr
op
s o
the
r th
an r
ice
imp
lem
en
ted
.
––
C
AS
rep
ort
s.
1. L
ive
sto
ck/f
ish
eri
es
pro
du
ctio
n
surv
ey
resu
lts
pu
bli
she
d.
–
Surv
. 1
Surv
. 2
CA
S w
eb
site
.
2. R
ice
co
st o
f p
rod
uct
ion
su
rve
y re
sult
s
pu
bli
she
d.
–
Surv
. 1
Surv
. 2
CA
S w
eb
site
.
3. H
ou
seh
old
fo
rest
ry s
urv
ey
resu
lts
pu
bli
she
d.
––
C
AS
we
bsi
te.
4. O
the
r su
rve
ys c
on
du
cte
d a
s p
er
cale
nd
ar.
––
C
AS
we
bsi
te.
Sub
-ou
tpu
t 3.
2.9
Sta
tist
ica
l sys
tem
fo
r a
gri
cult
ura
l pri
ces
imp
lem
ente
d.
1. N
um
be
r o
f ag
ricu
ltu
ral p
rice
pu
bli
cati
on
s p
er
year
.
–12
12C
AS
we
bsi
te.
Sub
-ou
tpu
t 3.
2.10
Imp
rove
d f
oo
d b
ala
nce
sh
eets
pu
blis
hed
.
1. F
oo
d b
alan
ce s
he
ets
pu
bli
she
d
ann
ual
ly.
–
C
AS
we
bsi
te.
Sub
-ou
tpu
t 3.
2.8
Pro
gra
mm
e o
f a
gri
cult
ura
l sa
mp
le
surv
eys
imp
lem
ente
d a
nd
res
ult
s
dis
sem
ina
ted
.
Sub
-ou
tpu
t 3.
2.7
Imp
rove
d s
yste
m f
or
cro
p p
rod
uct
ion
sta
tist
ics
imp
lem
ente
d.
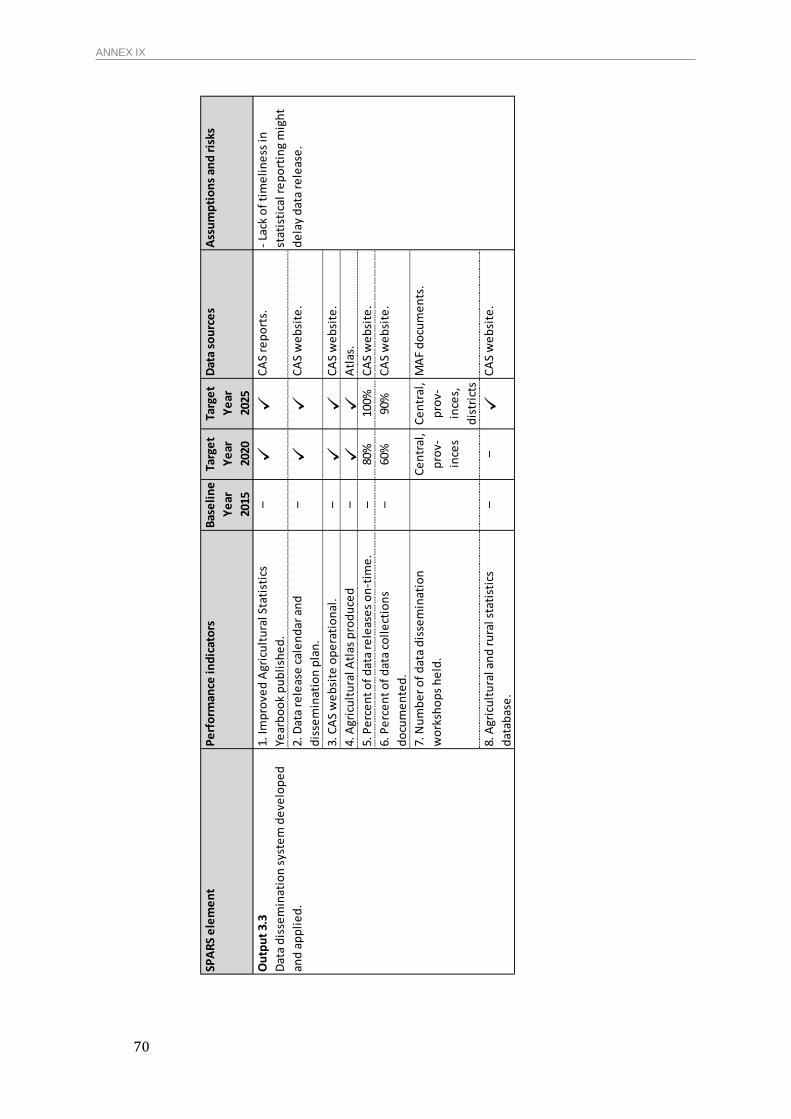
ANNEX IX
70
SPA
RS
ele
me
nt
Pe
rfo
rman
ce in
dic
ato
rsB
ase
lin
e
Ye
ar
2015
Targ
et
Ye
ar
2020
Targ
et
Ye
ar
2025
Dat
a so
urc
es
Ass
um
pti
on
s an
d r
isks
1. Im
pro
ved
Agr
icu
ltu
ral S
tati
stic
s
Year
bo
ok
pu
bli
she
d.
–
C
AS
rep
ort
s.
2. D
ata
rele
ase
cal
en
dar
an
d
dis
sem
inat
ion
pla
n.
–
C
AS
we
bsi
te.
3. C
AS
we
bsi
te o
pe
rati
on
al.
–
C
AS
we
bsi
te.
4. A
gric
ult
ura
l Atl
as p
rod
uce
d–
Atl
as.
5. P
erc
en
t o
f d
ata
rele
ase
s o
n-t
ime
.–
80%
100%
CA
S w
eb
site
.
6. P
erc
en
t o
f d
ata
coll
ect
ion
s
do
cum
en
ted
.
–60
%90
%C
AS
we
bsi
te.
7. N
um
be
r o
f d
ata
dis
sem
inat
ion
wo
rksh
op
s h
eld
.
Ce
ntr
al,
pro
v-
ince
s
Ce
ntr
al,
pro
v-
ince
s,
dis
tric
ts
MA
F d
ocu
me
nts
.
8. A
gric
ult
ura
l an
d r
ura
l sta
tist
ics
dat
abas
e.
––
C
AS
we
bsi
te.
Ou
tpu
t 3.
3
Dat
a d
isse
min
atio
n s
yste
m d
eve
lop
ed
and
ap
pli
ed
.
- La
ck o
f ti
me
lin
ess
in
stat
isti
cal r
ep
ort
ing
mig
ht
de
lay
dat
a re
leas
e.
ANNEX X
71
ANNEX X
SPARS FINANCING PLAN
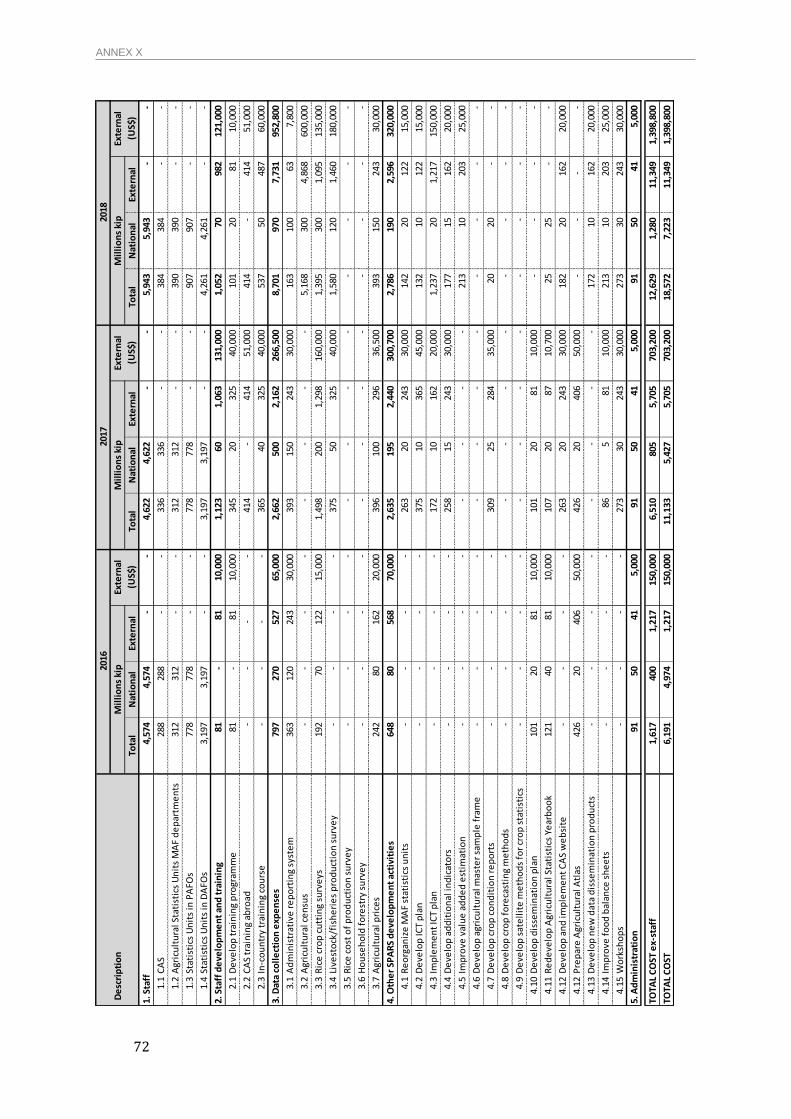
ANNEX X
72
Tota
lN
atio
nal
Exte
rnal
Tota
lN
atio
nal
Exte
rnal
Tota
lN
atio
nal
Exte
rnal
1. S
taff
4,57
4
4,
574
-
-
4,62
2
4,
622
-
-
5,94
3
5,
943
-
-
1.1
CA
S28
8
28
8
-
-
33
6
33
6
-
-
38
4
38
4
-
-
1.2
Agr
icu
ltu
ral S
tati
stic
s U
nit
s M
AF
de
par
tme
nts
312
312
-
-
312
312
-
-
390
390
-
-
1.3
Stat
isti
cs U
nit
s in
PA
FOs
778
778
-
-
778
778
-
-
907
907
-
-
1.4
Stat
isti
cs U
nit
s in
DA
FOs
3,19
7
3,
197
-
-
3,19
7
3,
197
-
-
4,26
1
4,
261
-
-
2. S
taff
de
velo
pm
en
t an
d t
rain
ing
81
-
81
10,0
00
1,
123
60
1,
063
131,
000
1,
052
70
98
2
12
1,00
0
2.1
De
velo
p t
rain
ing
pro
gram
me
81
-
81
10,0
00
34
5
20
325
40,0
00
10
1
20
81
10
,000
2.2
CA
S tr
ain
ing
abro
ad-
-
-
-
414
-
414
51,0
00
41
4
-
41
4
51
,000
2.3
In-c
ou
ntr
y tr
ain
ing
cou
rse
-
-
-
-
36
5
40
325
40,0
00
53
7
50
487
60,0
00
3. D
ata
coll
ect
ion
exp
en
ses
797
270
527
65,0
00
2,
662
500
2,16
2
26
6,50
0
8,70
1
97
0
7,
731
952,
800
3.1
Ad
min
istr
ativ
e r
ep
ort
ing
syst
em
363
120
243
30,0
00
39
3
15
0
24
3
30
,000
163
100
63
7,
800
3.2
Agr
icu
ltu
ral c
en
sus
-
-
-
-
-
-
-
-
5,16
8
30
0
4,
868
600,
000
3.3
Ric
e c
rop
cu
ttin
g su
rve
ys19
2
70
122
15,0
00
1,
498
200
1,29
8
16
0,00
0
1,39
5
30
0
1,
095
135,
000
3.4
Live
sto
ck/f
ish
eri
es
pro
du
ctio
n s
urv
ey
-
-
-
-
375
50
32
5
40
,000
1,58
0
12
0
1,
460
180,
000
3.5
Ric
e c
ost
of
pro
du
ctio
n s
urv
ey
-
-
-
-
-
-
-
-
-
-
-
-
3.6
Ho
use
ho
ld f
ore
stry
su
rve
y-
-
-
-
-
-
-
-
-
-
-
-
3.7
Agr
icu
ltu
ral p
rice
s24
2
80
162
20,0
00
39
6
10
0
29
6
36
,500
393
150
243
30,0
00
4. O
the
r SP
AR
S d
eve
lop
me
nt
acti
viti
es
648
80
56
8
70
,000
2,63
5
19
5
2,
440
300,
700
2,
786
190
2,59
6
32
0,00
0
4.1
Re
org
aniz
e M
AF
stat
isti
cs u
nit
s-
-
-
-
26
3
20
243
30,0
00
14
2
20
122
15,0
00
4.2
De
velo
p IC
T p
lan
-
-
-
-
375
10
36
5
45
,000
132
10
12
2
15
,000
4.3
Imp
lem
en
t IC
T p
lan
-
-
-
-
172
10
16
2
20
,000
1,23
7
20
1,21
7
15
0,00
0
4.4
De
velo
p a
dd
itio
nal
ind
icat
ors
-
-
-
-
258
15
24
3
30
,000
177
15
16
2
20
,000
4.5
Imp
rove
val
ue
ad
de
d e
stim
atio
n-
-
-
-
-
-
-
-
21
3
10
203
25,0
00
4.6
De
velo
p a
gric
ult
ura
l mas
ter
sam
ple
fra
me
-
-
-
-
-
-
-
-
-
-
-
-
4.7
De
velo
p c
rop
co
nd
itio
n r
ep
ort
s-
-
-
-
30
9
25
284
35,0
00
20
20
-
-
4.8
De
velo
p c
rop
fo
reca
stin
g m
eth
od
s-
-
-
-
-
-
-
-
-
-
-
-
4.9
De
velo
p s
ate
llit
e m
eth
od
s fo
r cr
op
sta
tist
ics
-
-
-
-
-
-
-
-
-
-
-
-
4.10
De
velo
p d
isse
min
atio
n p
lan
101
20
81
10,0
00
10
1
20
81
10
,000
-
-
-
-
4.11
Re
de
velo
p A
gric
ult
ura
l Sta
tist
ics
Year
bo
ok
121
40
81
10,0
00
10
7
20
87
10
,700
25
25
-
-
4.12
De
velo
p a
nd
imp
lem
en
t C
AS
we
bsi
te-
-
-
-
26
3
20
243
30,0
00
18
2
20
162
20,0
00
4.12
Pre
par
e A
gric
ult
ura
l Atl
as42
6
20
406
50,0
00
42
6
20
406
50,0
00
-
-
-
-
4.13
De
velo
p n
ew
dat
a d
isse
min
atio
n p
rod
uct
s-
-
-
-
-
-
-
-
17
2
10
162
20,0
00
4.14
Imp
rove
fo
od
bal
ance
sh
ee
ts-
-
-
-
86
5
81
10
,000
213
10
20
3
25
,000
4.15
Wo
rksh
op
s-
-
-
-
27
3
30
243
30,0
00
27
3
30
243
30,0
00
5. A
dm
inis
trat
ion
91
50
41
5,
000
91
50
41
5,
000
91
50
41
5,
000
TOTA
L C
OST
ex-
staf
f 1,
617
400
1,21
7
15
0,00
0
6,51
0
80
5
5,
705
703,
200
12
,629
1,28
0
11
,349
1,39
8,80
0
TOTA
L C
OST
6,
191
4,97
4
1,
217
150,
000
11
,133
5,42
7
5,
705
703,
200
18
,572
7,22
3
11
,349
1,39
8,80
0
Mil
lio
ns
kip
Exte
rnal
(US$
)
Mil
lio
ns
kip
Exte
rnal
(US$
)
Mil
lio
ns
kip
Exte
rnal
(US$
)
De
scri
pti
on
2016
2017
2018
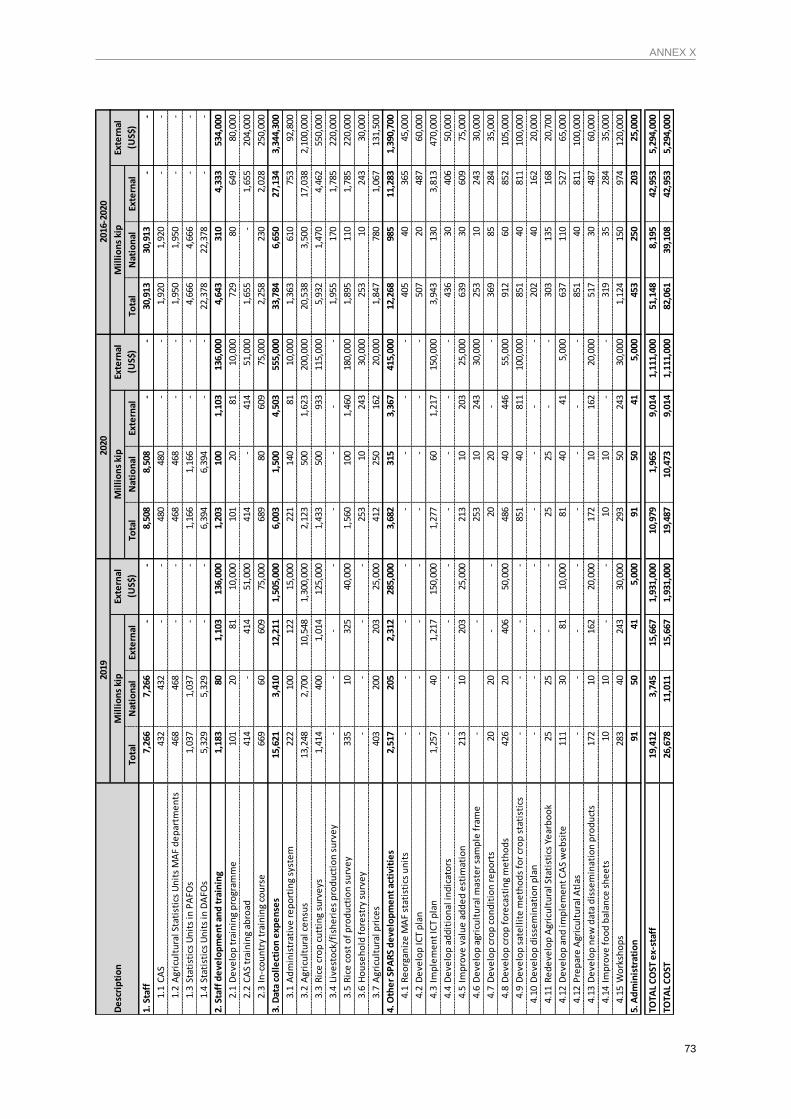
ANNEX X
73
Tota
lN
atio
nal
Exte
rnal
Tota
lN
atio
nal
Exte
rnal
Tota
lN
atio
nal
Exte
rnal
1. S
taff
7,26
6
7,
266
-
-
8,50
8
8,
508
-
-
30,9
13
30
,913
-
-
1.1
CA
S43
2
43
2
-
-
48
0
48
0
-
-
1,
920
1,92
0
-
-
1.2
Agr
icu
ltu
ral S
tati
stic
s U
nit
s M
AF
de
par
tme
nts
468
468
-
-
468
468
-
-
1,95
0
1,
950
-
-
1.3
Stat
isti
cs U
nit
s in
PA
FOs
1,03
7
1,
037
-
-
1,16
6
1,
166
-
-
4,66
6
4,
666
-
-
1.4
Stat
isti
cs U
nit
s in
DA
FOs
5,32
9
5,
329
-
-
6,39
4
6,
394
-
-
22,3
78
22
,378
-
-
2. S
taff
de
velo
pm
en
t an
d t
rain
ing
1,18
3
80
1,10
3
13
6,00
0
1,20
3
10
0
1,
103
136,
000
4,
643
310
4,33
3
53
4,00
0
2.1
De
velo
p t
rain
ing
pro
gram
me
101
20
81
10,0
00
10
1
20
81
10
,000
729
80
64
9
80
,000
2.2
CA
S tr
ain
ing
abro
ad41
4
-
41
4
51
,000
414
-
414
51,0
00
1,
655
-
1,65
5
20
4,00
0
2.3
In-c
ou
ntr
y tr
ain
ing
cou
rse
669
60
60
9
75
,000
689
80
60
9
75
,000
2,25
8
23
0
2,
028
250,
000
3. D
ata
coll
ect
ion
exp
en
ses
15,6
21
3,
410
12,2
11
1,
505,
000
6,00
3
1,
500
4,50
3
55
5,00
0
33,7
84
6,
650
27,1
34
3,
344,
300
3.1
Ad
min
istr
ativ
e r
ep
ort
ing
syst
em
222
100
122
15,0
00
22
1
14
0
81
10,0
00
1,
363
610
753
92,8
00
3.2
Agr
icu
ltu
ral c
en
sus
13,2
48
2,
700
10,5
48
1,
300,
000
2,12
3
50
0
1,
623
200,
000
20
,538
3,50
0
17
,038
2,10
0,00
0
3.3
Ric
e c
rop
cu
ttin
g su
rve
ys1,
414
400
1,01
4
12
5,00
0
1,43
3
50
0
93
3
11
5,00
0
5,93
2
1,
470
4,46
2
55
0,00
0
3.4
Live
sto
ck/f
ish
eri
es
pro
du
ctio
n s
urv
ey
-
-
-
-
-
-
-
-
1,95
5
17
0
1,
785
220,
000
3.5
Ric
e c
ost
of
pro
du
ctio
n s
urv
ey
335
10
32
5
40
,000
1,56
0
10
0
1,
460
180,
000
1,
895
110
1,78
5
22
0,00
0
3.6
Ho
use
ho
ld f
ore
stry
su
rve
y-
-
-
-
25
3
10
243
30,0
00
25
3
10
243
30,0
00
3.7
Agr
icu
ltu
ral p
rice
s40
3
20
0
20
3
25
,000
412
250
162
20,0
00
1,
847
780
1,06
7
13
1,50
0
4. O
the
r SP
AR
S d
eve
lop
me
nt
acti
viti
es
2,51
7
20
5
2,
312
285,
000
3,
682
315
3,36
7
41
5,00
0
12,2
68
98
5
11
,283
1,39
0,70
0
4.1
Re
org
aniz
e M
AF
stat
isti
cs u
nit
s-
-
-
-
-
-
-
-
40
5
40
365
45,0
00
4.2
De
velo
p IC
T p
lan
-
-
-
-
-
-
-
-
507
20
48
7
60
,000
4.3
Imp
lem
en
t IC
T p
lan
1,25
7
40
1,21
7
15
0,00
0
1,27
7
60
1,21
7
15
0,00
0
3,94
3
13
0
3,
813
470,
000
4.4
De
velo
p a
dd
itio
nal
ind
icat
ors
-
-
-
-
-
-
-
-
436
30
40
6
50
,000
4.5
Imp
rove
val
ue
ad
de
d e
stim
atio
n21
3
10
203
25,0
00
21
3
10
203
25,0
00
63
9
30
609
75,0
00
4.6
De
velo
p a
gric
ult
ura
l mas
ter
sam
ple
fra
me
-
-
253
10
24
3
30
,000
253
10
24
3
30
,000
4.7
De
velo
p c
rop
co
nd
itio
n r
ep
ort
s20
20
-
-
20
20
-
-
36
9
85
284
35,0
00
4.8
De
velo
p c
rop
fo
reca
stin
g m
eth
od
s42
6
20
406
50,0
00
48
6
40
446
55,0
00
91
2
60
852
105,
000
4.9
De
velo
p s
ate
llit
e m
eth
od
s fo
r cr
op
sta
tist
ics
-
-
-
-
851
40
81
1
10
0,00
0
851
40
81
1
10
0,00
0
4.10
De
velo
p d
isse
min
atio
n p
lan
-
-
-
-
-
-
-
-
202
40
16
2
20
,000
4.11
Re
de
velo
p A
gric
ult
ura
l Sta
tist
ics
Year
bo
ok
25
25
-
-
25
25
-
-
303
135
168
20,7
00
4.12
De
velo
p a
nd
imp
lem
en
t C
AS
we
bsi
te11
1
30
81
10
,000
81
40
41
5,
000
637
110
527
65,0
00
4.12
Pre
par
e A
gric
ult
ura
l Atl
as-
-
-
-
-
-
-
-
85
1
40
811
100,
000
4.13
De
velo
p n
ew
dat
a d
isse
min
atio
n p
rod
uct
s17
2
10
162
20,0
00
17
2
10
162
20,0
00
51
7
30
487
60,0
00
4.14
Imp
rove
fo
od
bal
ance
sh
ee
ts10
10
-
-
10
10
-
-
31
9
35
284
35,0
00
4.15
Wo
rksh
op
s28
3
40
243
30,0
00
29
3
50
243
30,0
00
1,
124
150
974
120,
000
5. A
dm
inis
trat
ion
91
50
41
5,
000
91
50
41
5,
000
453
250
203
25,0
00
TOTA
L C
OST
ex-
staf
f 19
,412
3,74
5
15
,667
1,93
1,00
0
10
,979
1,96
5
9,
014
1,11
1,00
0
51
,148
8,19
5
42
,953
5,29
4,00
0
TOTA
L C
OST
26
,678
11,0
11
15
,667
1,93
1,00
0
19
,487
10,4
73
9,
014
1,11
1,00
0
82
,061
39,1
08
42
,953
5,29
4,00
0
2016
-202
0
Mil
lio
ns
kip
Exte
rnal
(US$
)
Exte
rnal
(US$
)
Mil
lio
ns
kip
Exte
rnal
(US$
)
De
scri
pti
on
2019
2020
Mil
lio
ns
kip

ANNEX X
74
ANNEX X
75
SPARS documentation and printing of this report is
supported by the United Nations Food and Agricultural
Organization for the Asia Pacific Region (FAO-RAP).
Department of Planning and Cooperation Ministry of Agriculture and Forests
Vientiane