Embed Size (px)
Citation preview
American Journal of Engineering Research (AJER) 2013
w w w . a j e r . o r g
Page 204
American Journal of Engineering Research (AJER)
e-ISSN : 2320-0847 p-ISSN : 2320-0936
Volume-02, Issue-11, pp-204-215
www.ajer.org
Research Paper Open Access
Structural and Stratigraphic Mapping of Delta Field, Agbada
Formation, Offshore Niger Delta, Nigeria
E.K. Nyantakyi*1,2
, W.S. Hu2, J.K. Borkloe
1,2, Gong Qin
2, M. Cheng Han
2
1Department of Civil Engineering, Kumasi Polytechnic, Kumasi, 00233, Ghana. 2School of Earth Sciences, Yangtze University, Wuhan, Hubei 430100, China
*Corresponding author:[email protected]
Abstract: - The Niger Delta is ranked among the world’s major hydrocarbon provinces in the world. Oil and
gas in the Niger Delta are mainly trapped in sandstones and unconsolidated sands in the Agbada formation. The
traps, structure and stratigraphy are not easy to map precisely because they are very slight, not obvious and very
complicated. The degree of reliability and precision of the mapping can be greatly enhanced by integrating seismic data with well logs commonly used independently in hydrocarbon exploration and exploitation studies.
Seismic data were integrated with well logs to define the subsurface geometry, stratigraphy and hydrocarbon
trapping potential of Delta field, off shore Niger Delta. Lithologic units were identified on the logs and
correlated across the wells. The stratigraphic cross-sections produced show a general lateral continuity of the
lithologic units across the field. Five (5) sequence boundaries namely SB1, SB2, SB3, SB4 and SB5 were
mapped and structure contour maps drawn for each of the sequence boundaries. Fault closures of high quality
hydrocarbon prospects were identified and delineated. Stratigraphic plays such as pinch-outs, unconformities,
sand lenses and channels are also suspected. The integration of seismic data with well logs greatly improved the
extent of accuracy and exactness of structural and stratigraphic mapping in predicting lateral and vertical
variations, hydrocarbon prospects and its development in Delta Field.
Key words: - Delta Field, Niger Delta, Integration, Stratigraphic mapping, Structural interpretation, well logs.
I. INTRODUCTION The Niger Delta is ranked among the world’s major hydrocarbon provinces in the world. It is the most
important in the West African continental margin. Oil and gas in the Niger Delta are primarily produced from
sandstones and unconsolidated sands mainly in the Agbada formation. The 12 km thick Niger Delta clastic
wedge spans a 75, 000 km2 area in southern Nigeria and the Gulf of Guinea offshore Nigeria. This clastic wedge
contains the 12th largest known accumulation of recoverable hydrocarbons, with reserves exceeding 34 billion
barrels of oil and 93 trillion cubic feet of gas (Tuttle et al., 1999). These deposits have been divided into three
large-scale lithostratigraphic units: (1) the basal Paleocene to Recent pro-delta facies of the Akata Formation, (2)
Eocene to Recent, paralic facies of the Agbada Formation, and (3) Oligocene-Recent, fluvial facies of the Benin
Formation (Evamy et al., 1978; Short and Stauble, 1967; Whiteman, 1982). These formations become
progressively younger farther into the basin, recording the long-term progradation of depositional environments of the Niger Delta onto the Atlantic Ocean passive margin. Stratigraphy of Niger Delta is complicated by the
syndepositional collapse of the clastic wedge as shale of the Akata Formation mobilized under the load of
prograding deltaic Agbada and fluvial Benin Formation deposits. A series of large scale, basinward-dipping
listric normal faults formed as underlying shales diapered upward. Blocks down dropped across these faults
filled with growth strata, changed local depositional slopes, and complicated sediment transport paths into the
basin.
The goal of oil and gas exploration is to identify and delineate structural traps suitable for profitably
exploitable accumulations and delineate the extent of discoveries in field appraisals and development. These
traps are very slight, not obvious and very complicated and are therefore not easy to map precisely. Major
improvements in seismic and well logs have made it possible to map such structural and stratigraphic
arrangements with high degree of accuracy and exactness. Seismic profiles provide almost a continuous lateral
American Journal of Engineering Research (AJER) 2013
w w w . a j e r . o r g
Page 205
view of the subsurface by defining its geometry and providing an estimate of the acoustic impedance which is
related to the formation densities and velocities.
However, vertical details are limited due to lengthy duration of the individual seismic wavelets and the
occurrence of overlapping wavelets from closely spaced reflectors. Well logs are limited in their definition of
lateral variation of subsurface parameters. Thus, the extent of accuracy in mapping complicated structural plays
would be improved greatly by combining seismic data with well logs (Adejobi and Olayinka, 1997; Barde et al.
(2000 and 2002). In addition, the risk associated with finding oil and gas in very slight, not obvious and
complicated structural/stratigraphic places will be reduced tremendously since such integration will help to
discriminate between poor and rich reservoirs and also greatly improve the extent of accuracy and exactness of the structural maps in hydrocarbon prospects and its development.
In the present work, 3-D seismic reflection data were integrated with well logs so as to define the
subsurface geometry, stratigraphy and hydrocarbon potential of Delta field, offshore Niger Delta. The aims of
the study include characterization of the subsurface geometry and stratigraphy, determination of hydrocarbon
trapping potential of the field and identification and delineation of possible hydrocarbon prospects in the field.
1.1 Geological Setting of the Field
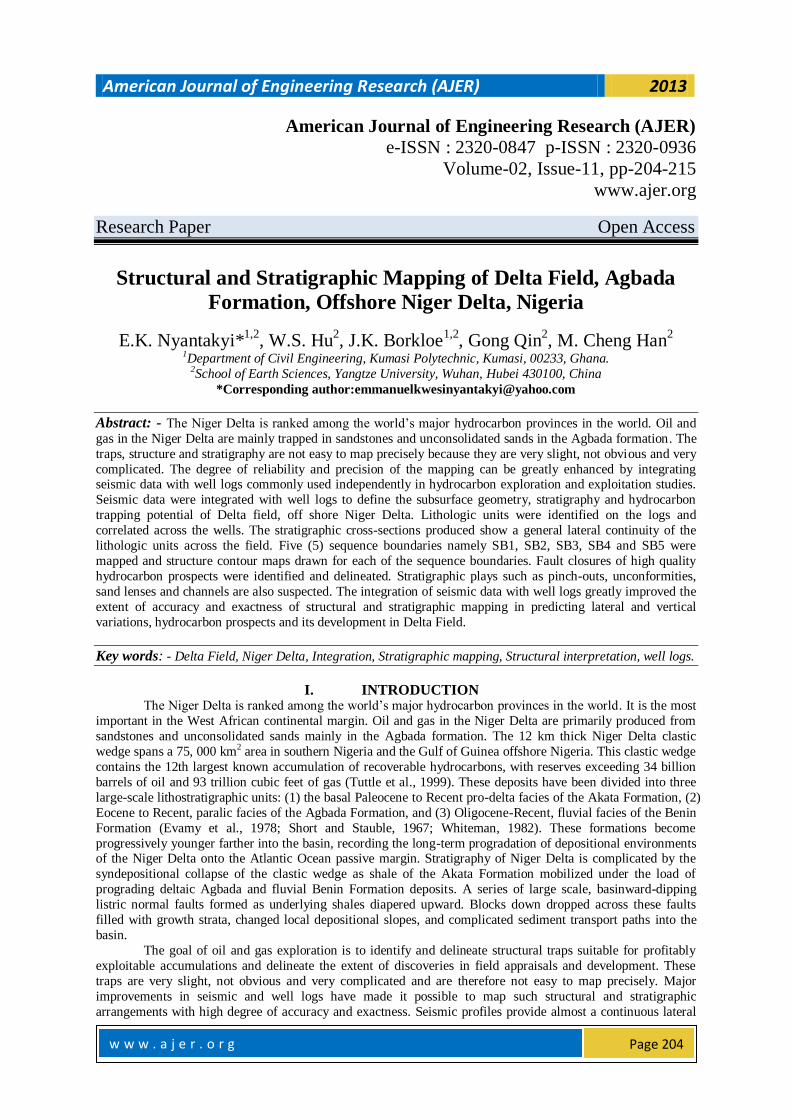
Delta field is located in 12 feet of water on Oil Mining Leases (OML) 49/95 in the Southwestern part
of the Niger Delta (Figure 1). The field was discovered in 1965 after completion of Delta 1 well, and targeting a
structural prospect; the field was opened for production in 1968. The field is divided into 2 major fault blocks
(Figure 1C). The western block 1 is down dropped relative to the eastern block 2 along a major normal fault. A third fault block in the northeastern part of the field, defined by a minor horst, does not contain commercial oil
reserves. Wells in Delta field were generally drilled to lower parts of the Agbada Formation, and targeted
structural prospect in the middle of the formation. Only a few wells were logged through the Benin Formation,
which contains fresh-water saturated sands. Of the 37 wells drilled in the field, 14 are vertical and 23 are
deviated (5 of these deviated wells become horizontal at depth). Twelve of the wells are located in fault block 2
(Figure 1C). One well in fault block 2 is a water injector well used to provide pressure support (DE-34I).
Additional horizontal wells were recently drilled to address a water-coning problem in producing wells and to
optimize production based on results of a reservoir simulation study. Fifty-three distinct reservoirs have been
discovered within the field to date. The Niger Delta, situated at the apex of the Gulf of Guinea on the west coast
of Africa, covers an area of about 75 000 km2. The geology of the tertiary Niger Delta province has been
described by several workers Short and Stauble (1967); Weber (1971); Weber and Daukoru (1975); Weber et al.,
(1978); Evamy et al., (1978); Doust and Omatsola (1990); Haack et al., (2000).
Figure 1: Location map of study area. (A) Position of Nigeria in Africa and Niger Delta Basin. (B) Cross
section from NNE to SSW across Niger Delta Modified from Stacher (1995). See location of cross section in
American Journal of Engineering Research (AJER) 2013
w w w . a j e r . o r g
Page 206
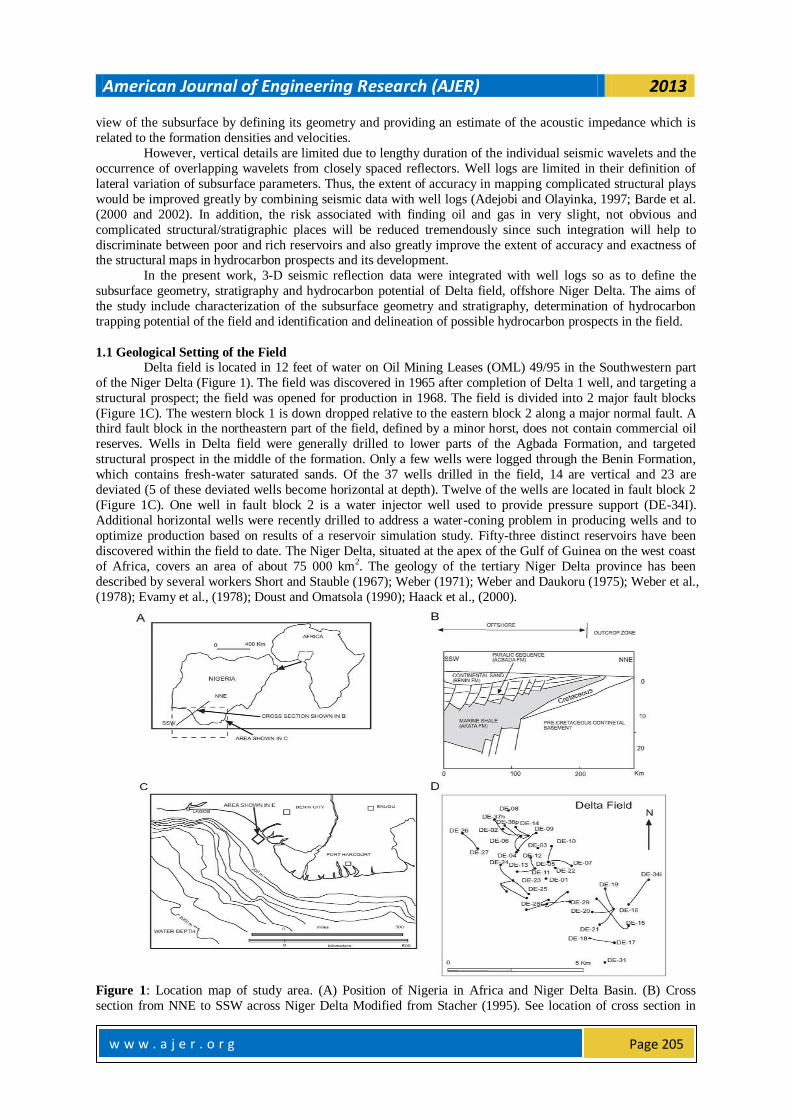
(A). (C) Delta field well locations. (D) Delta field location map. (E) Seismic survey area. Dash line enclosed
area with seismic data provided by Chevron Nigeria Ltd. Area studied is enclosed in the bold line. (F) Area
shown in horizontal seismic slices.
Figure 1: Continued.
Basement tectonics related to crucial divergence and translation during the late Jurassic and Cretaceous
continental rifting probably determined the original site of the main rivers that controlled the early development
of the Delta. The Cenozoic development of the delta is also believed to have taken place under approximate
isostatic equilibrium. The main depocenter is thought to have been at the triple junction between the continental
and oceanic crust where the delta reached a main zone of crustal instability.
The Niger Delta basin is located on the continental margin of the Gulf of Guinea in equatorial West
Africa and lies between latitudes 4o and 7oN and longitudes 3o and 9oE (Whiteman, 1982). It ranks among the
world’s most prolific petroleum producing Tertiary deltas that together account for about 5% of the world’s oil
and gas reserves. It is one of the economically prominent sedimentary basins in West Africa and the largest in
Africa (Reijers, 1996). Detailed studies on tectonics, stratigraphy, depositional environment, petrophysics,
sedimentology and hydrocarbon potential are well documented in the literature (Short and Stauble (1967);
Weber and Daukoru (1975); Evamy et al., (1978); Knox and Omatsola (1989); Doust and Omatsola (1990), Nton and Adebambo (2009); Nton and Adesina (2009)) among others.
The Niger Delta is a large arcuate delta of the destructive, wave-dominated type and is composed of an
overall regressive clastic sequence which reaches a maximum thickness of about 12 km in the basin centre.
The Delta’s sediments show an upward transition from marine pro-delta shales (Akata Formation) through a
paralic interval (Agbada Formation) to a continental sequence (Benin Formation). These three sedimentary
environments, typical of most deltaic environments, extend across the whole delta and ranges in age from early
tertiary to recent. A separate member, the Afam clay member, of the Benin formation is recognized in the
eastern part of the delta and is considered as an ancient valley fill formed in Miocene sediments. The formations
are strongly diachronous (Murat, 1970) and cut across the time stratigraphic units which are characteristically S-
shaped in cross-section. Most economically exploitable hydrocarbon in the delta is believed to be trapped within
the Agbada formation. Structurally, the Niger Delta shelf developed as a prograding extensional complex overlying a ductile
substrate which probably composed largely of over pressure marine shales. The onshore growth fault systems
have been described by (Doust and Omatsola, 1990) as a series of major growth fault bounded depobelts or
mega-structures thought to be transient basinal areas succeeding one another in space and time as the delta
progrades southward. The extensional system is dominated by “tepee” structure in which landward-dipping
growth faults intersects seaward dipping in complex interlocking fault networks (Figure 2).
American Journal of Engineering Research (AJER) 2013
w w w . a j e r . o r g
Page 207
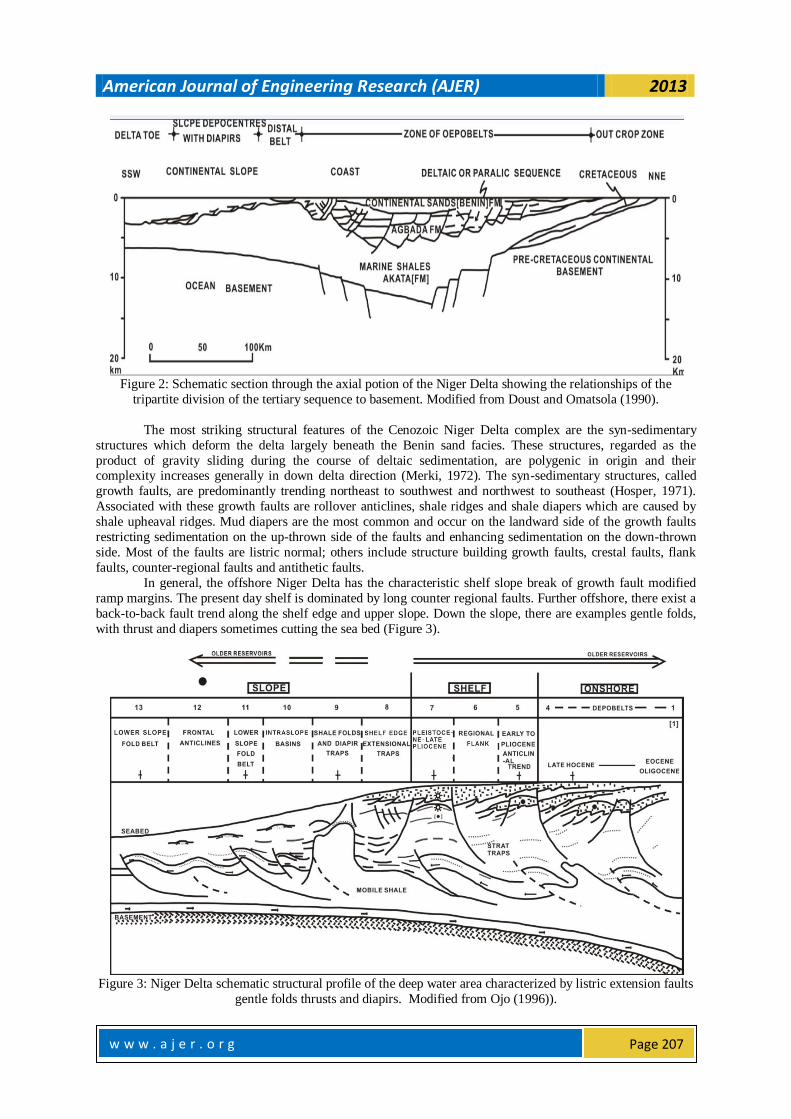
Figure 2: Schematic section through the axial potion of the Niger Delta showing the relationships of the
tripartite division of the tertiary sequence to basement. Modified from Doust and Omatsola (1990).
The most striking structural features of the Cenozoic Niger Delta complex are the syn-sedimentary
structures which deform the delta largely beneath the Benin sand facies. These structures, regarded as the
product of gravity sliding during the course of deltaic sedimentation, are polygenic in origin and their complexity increases generally in down delta direction (Merki, 1972). The syn-sedimentary structures, called
growth faults, are predominantly trending northeast to southwest and northwest to southeast (Hosper, 1971).
Associated with these growth faults are rollover anticlines, shale ridges and shale diapers which are caused by
shale upheaval ridges. Mud diapers are the most common and occur on the landward side of the growth faults
restricting sedimentation on the up-thrown side of the faults and enhancing sedimentation on the down-thrown
side. Most of the faults are listric normal; others include structure building growth faults, crestal faults, flank
faults, counter-regional faults and antithetic faults.
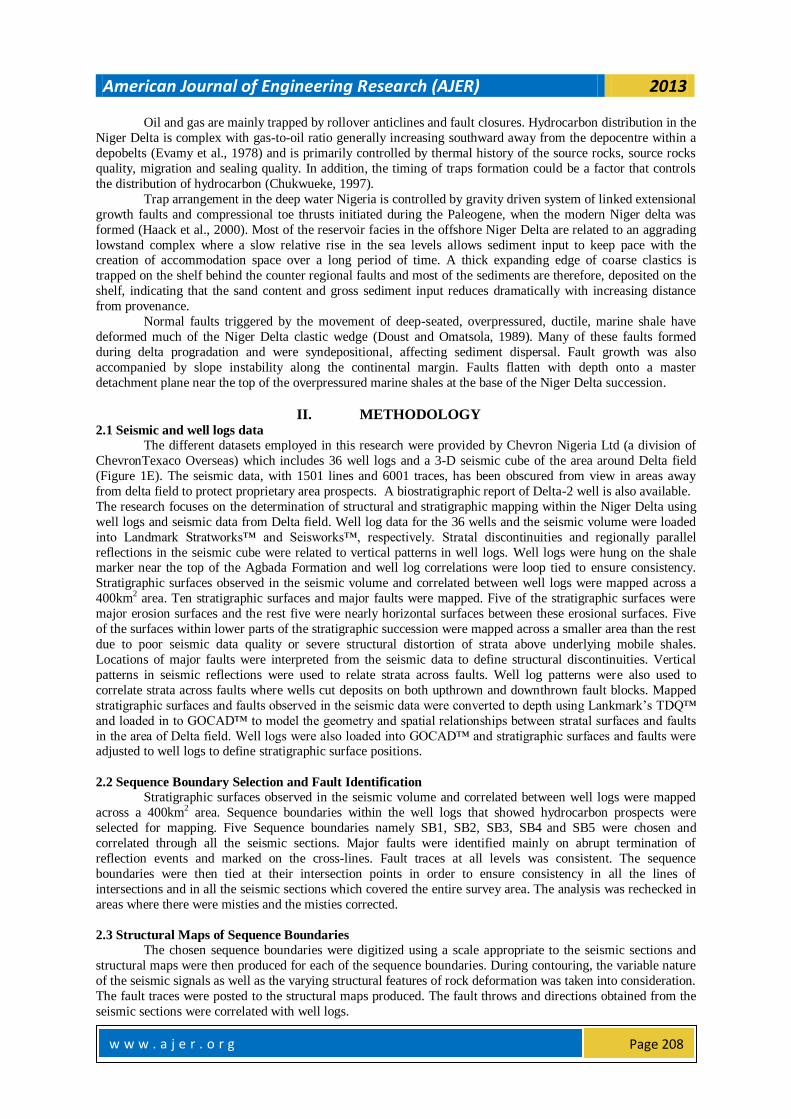
In general, the offshore Niger Delta has the characteristic shelf slope break of growth fault modified
ramp margins. The present day shelf is dominated by long counter regional faults. Further offshore, there exist a
back-to-back fault trend along the shelf edge and upper slope. Down the slope, there are examples gentle folds,
with thrust and diapers sometimes cutting the sea bed (Figure 3).
Figure 3: Niger Delta schematic structural profile of the deep water area characterized by listric extension faults
gentle folds thrusts and diapirs. Modified from Ojo (1996)).
American Journal of Engineering Research (AJER) 2013
w w w . a j e r . o r g
Page 208
Oil and gas are mainly trapped by rollover anticlines and fault closures. Hydrocarbon distribution in the
Niger Delta is complex with gas-to-oil ratio generally increasing southward away from the depocentre within a
depobelts (Evamy et al., 1978) and is primarily controlled by thermal history of the source rocks, source rocks
quality, migration and sealing quality. In addition, the timing of traps formation could be a factor that controls
the distribution of hydrocarbon (Chukwueke, 1997).
Trap arrangement in the deep water Nigeria is controlled by gravity driven system of linked extensional
growth faults and compressional toe thrusts initiated during the Paleogene, when the modern Niger delta was
formed (Haack et al., 2000). Most of the reservoir facies in the offshore Niger Delta are related to an aggrading
lowstand complex where a slow relative rise in the sea levels allows sediment input to keep pace with the creation of accommodation space over a long period of time. A thick expanding edge of coarse clastics is
trapped on the shelf behind the counter regional faults and most of the sediments are therefore, deposited on the
shelf, indicating that the sand content and gross sediment input reduces dramatically with increasing distance
from provenance.
Normal faults triggered by the movement of deep-seated, overpressured, ductile, marine shale have
deformed much of the Niger Delta clastic wedge (Doust and Omatsola, 1989). Many of these faults formed
during delta progradation and were syndepositional, affecting sediment dispersal. Fault growth was also
accompanied by slope instability along the continental margin. Faults flatten with depth onto a master
detachment plane near the top of the overpressured marine shales at the base of the Niger Delta succession.
II. METHODOLOGY 2.1 Seismic and well logs data
The different datasets employed in this research were provided by Chevron Nigeria Ltd (a division of
ChevronTexaco Overseas) which includes 36 well logs and a 3-D seismic cube of the area around Delta field
(Figure 1E). The seismic data, with 1501 lines and 6001 traces, has been obscured from view in areas away
from delta field to protect proprietary area prospects. A biostratigraphic report of Delta-2 well is also available.
The research focuses on the determination of structural and stratigraphic mapping within the Niger Delta using
well logs and seismic data from Delta field. Well log data for the 36 wells and the seismic volume were loaded
into Landmark Stratworks™ and Seisworks™, respectively. Stratal discontinuities and regionally parallel
reflections in the seismic cube were related to vertical patterns in well logs. Well logs were hung on the shale marker near the top of the Agbada Formation and well log correlations were loop tied to ensure consistency.
Stratigraphic surfaces observed in the seismic volume and correlated between well logs were mapped across a
400km2 area. Ten stratigraphic surfaces and major faults were mapped. Five of the stratigraphic surfaces were
major erosion surfaces and the rest five were nearly horizontal surfaces between these erosional surfaces. Five
of the surfaces within lower parts of the stratigraphic succession were mapped across a smaller area than the rest
due to poor seismic data quality or severe structural distortion of strata above underlying mobile shales.
Locations of major faults were interpreted from the seismic data to define structural discontinuities. Vertical
patterns in seismic reflections were used to relate strata across faults. Well log patterns were also used to
correlate strata across faults where wells cut deposits on both upthrown and downthrown fault blocks. Mapped
stratigraphic surfaces and faults observed in the seismic data were converted to depth using Lankmark’s TDQ™
and loaded in to GOCAD™ to model the geometry and spatial relationships between stratal surfaces and faults
in the area of Delta field. Well logs were also loaded into GOCAD™ and stratigraphic surfaces and faults were adjusted to well logs to define stratigraphic surface positions.
2.2 Sequence Boundary Selection and Fault Identification
Stratigraphic surfaces observed in the seismic volume and correlated between well logs were mapped
across a 400km2 area. Sequence boundaries within the well logs that showed hydrocarbon prospects were
selected for mapping. Five Sequence boundaries namely SB1, SB2, SB3, SB4 and SB5 were chosen and
correlated through all the seismic sections. Major faults were identified mainly on abrupt termination of
reflection events and marked on the cross-lines. Fault traces at all levels was consistent. The sequence
boundaries were then tied at their intersection points in order to ensure consistency in all the lines of
intersections and in all the seismic sections which covered the entire survey area. The analysis was rechecked in
areas where there were misties and the misties corrected.
2.3 Structural Maps of Sequence Boundaries
The chosen sequence boundaries were digitized using a scale appropriate to the seismic sections and
structural maps were then produced for each of the sequence boundaries. During contouring, the variable nature
of the seismic signals as well as the varying structural features of rock deformation was taken into consideration.
The fault traces were posted to the structural maps produced. The fault throws and directions obtained from the
seismic sections were correlated with well logs.
American Journal of Engineering Research (AJER) 2013
w w w . a j e r . o r g
Page 209
III. RESULTS AND DISCUSSION 3.1 Seismic interpretations and stratigraphic cross-sections
The seismic record is characterized by a series of nearly parallel reflections offset by listric normal
faults dipping to the southwest. Most wells in Delta field pass into a hanging wall anticline within a relatively
large coherent fault block. Offshore of the field, normal faults are more closely spaced and antithetic faults
occur, hindering correlation of stratigraphic surfaces. Seismic reflections also become more chaotic deeper
within the seismic record (below 3.0 seconds), where diapiric movement of underlying mobile shale has complicated reflector geometry. Truncation of reflectors against an irregular high relief overlying reflector
indicates an allostratigraphic discontinuity or an erosional “sequence boundary”. Five sequence boundaries are
observed within the Agbada Formation in Delta field. Successive erosion surfaces are generally more closely
spaced higher within the stratigraphic section. Parallel to paleoflow, the relief along these surfaces is more
subdued, but can show up to 200 meters of local relief. Incisions along sequence boundaries 1 and 2 have up to
300 feet of relief. Locally there is a 3 km wide, 300 foot deep channel along sequence boundary 1, and a 1 km
wide, 100 foot deep channel along sequence boundary 2. The relief along sequence boundary 3 is more subdued,
and is expressed in Delta field only by low-angle truncation of reflectors down dip. Relief along sequence
boundaries 4 and 5 is substantially greater, with steep margined channels 5 km wide and 600 feet deep along
boundary 4, and 5 km wide, 900 feet deep along boundary 5.
In most locations reflector patterns within sequences can be divided into two parts: 1) a lower part with chaotic patterns and or a set of inclined reflectors, and an upper part where reflectors are generally parallel and
more closely spaced. In some locations the deposits directly above sequence boundaries comprise a 50 to nearly
500 feet thick set of inclined reflectors dipping at a fraction of a degree basinward. These sets of inclined beds
are thickest directly above the most deeply incised areas along sequence boundaries. In other locations strata
directly above these erosion surfaces have chaotic or mounded reflection patterns. In the area of greatest incision
along sequence boundary 5, inclined reflectors downlap onto underlying chaotic reflectors.
Seismic reflectors significantly above each sequence bounding erosion surface are parallel, generally
continuous across the field, and are generally more closely spaced, unlike thicker intervals with chaotic or
inclined reflectors directly overlying sequence boundaries. These parallel reflectors are interpreted to image
nearly horizontal strata across the 5-10 km span of Delta field, even though they may dip at regional-scales as
very low angle basinward dipping strata. A practically continuous reflector traced within each sequence was correlated through the seismic volume to provide datum’s for mapping changes in stratigraphic thickness across
the study area and across specific faults. In some cases, these intra-sequence reflectors appear to correspond to
the finest grained parts of sequences, but this is not true in all cases. Intra-sequence reflectors within sequences
1 and 2 could not be traced across the major fault south of Delta field, because of deformation and abundant
faults produced by diapiring shales under the down thrown blocks at these depths. Intra-sequence reflectors
mapped within sequences 3 and 4 are locally cut out where overlying sequence boundaries incise deepest into
underlying deposits.
Stratigraphic differences in the Agbada Formation of Delta field show the regression of depositional
environments within the Niger Delta Basin. This broadly changes from finer-grained deposits deeper in wells
directly above underlying Akata Formation shales (higher gamma-ray log values) to progressively coarser-
grained deposits shallower in wells below the overlying Benin Formation (lower gamma-ray log values). The
top of the Agbada Formation is defined as the base of fresh water sands at about 3000 feet below sea level. The base of the formation, not penetrated by the wells, lies greater than 8000 feet below sea level. The Agbada
Formation is thus somewhat over 5000 feet thick under Delta field. Gamma-ray logs show tens to a few hundred
feet vertical differences superimposed on this formation scale trend, which record alternation between sandier
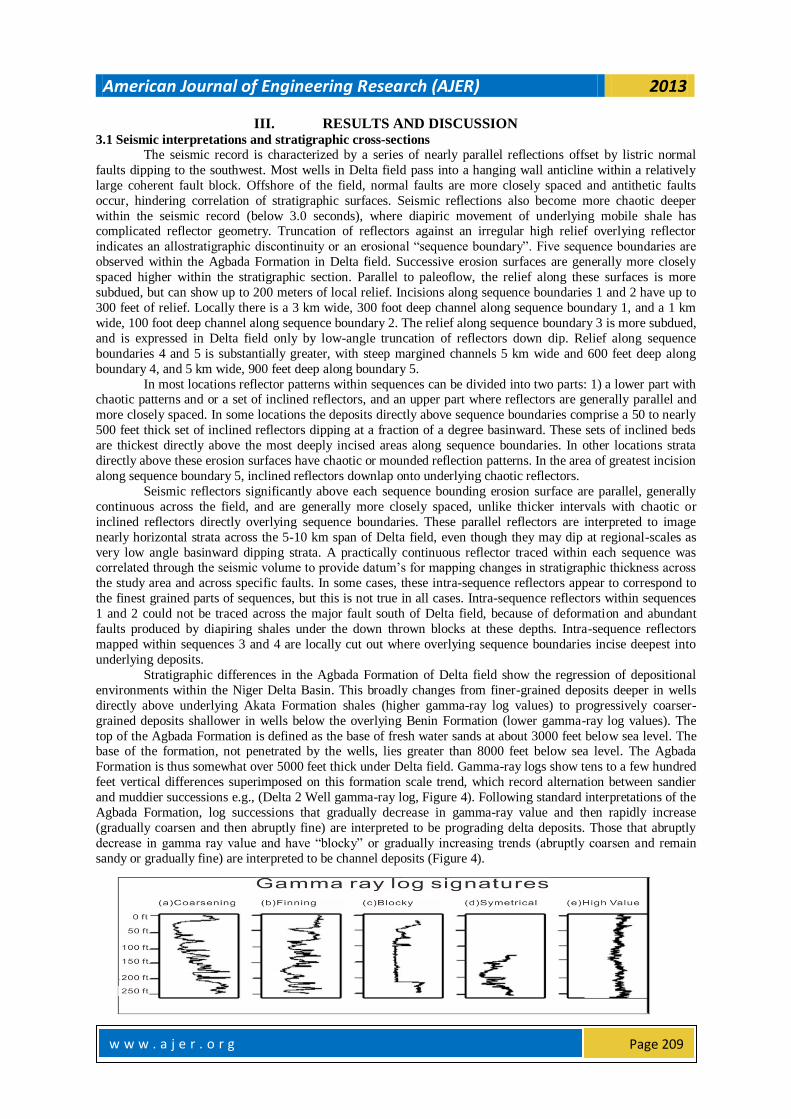
and muddier successions e.g., (Delta 2 Well gamma-ray log, Figure 4). Following standard interpretations of the
Agbada Formation, log successions that gradually decrease in gamma-ray value and then rapidly increase
(gradually coarsen and then abruptly fine) are interpreted to be prograding delta deposits. Those that abruptly
decrease in gamma ray value and have “blocky” or gradually increasing trends (abruptly coarsen and remain
sandy or gradually fine) are interpreted to be channel deposits (Figure 4).
American Journal of Engineering Research (AJER) 2013
w w w . a j e r . o r g
Page 210
Figure 4: Types of well log patterns observed in Delta field. (a) Upward-coarsening, progradation log pattern. (b)
Upward-fining, retrogradational log pattern. (c) Sharp-based, blocky log pattern. (d) Symmetrical log pattern. (e)
High gamma- ray value log pattern.
Serrated high value gamma ray intervals are dominated by mudstone with varying amounts of thin
sandstone beds. It should be acknowledged, however, that different log trends related to prograding shorelines
are not always fundamentally distinct from those of prograding deeper water mass flow fans, and that no cores
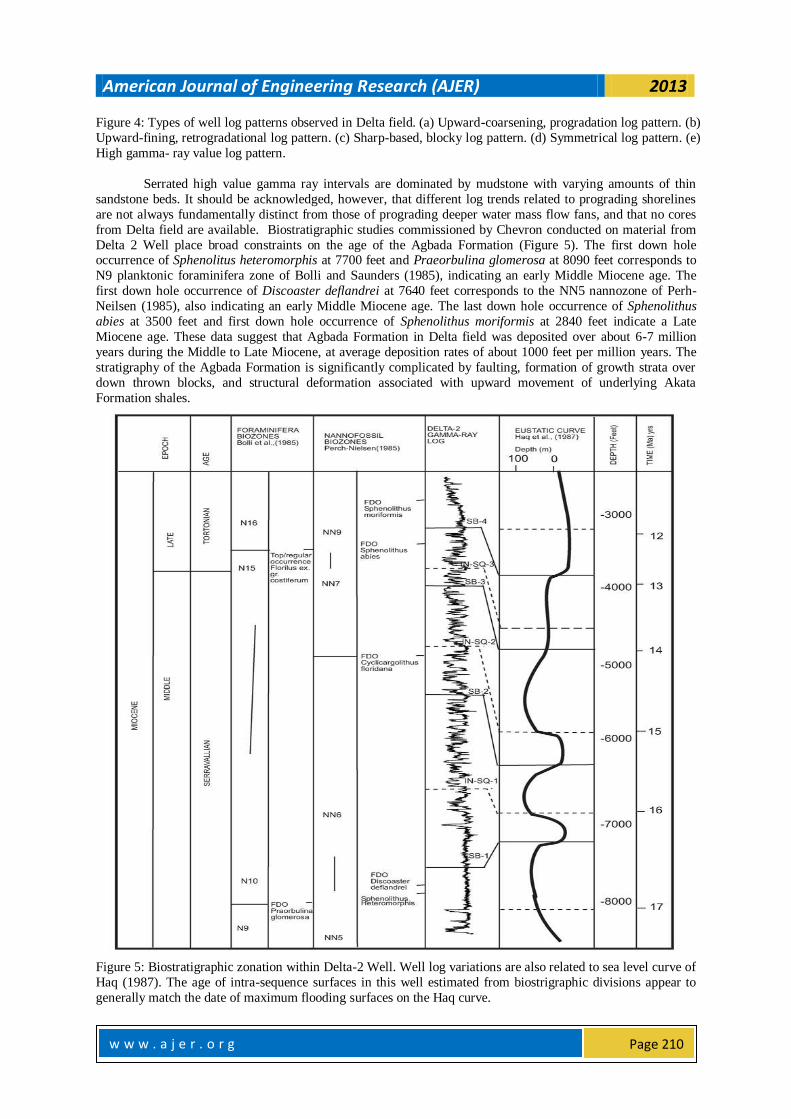
from Delta field are available. Biostratigraphic studies commissioned by Chevron conducted on material from
Delta 2 Well place broad constraints on the age of the Agbada Formation (Figure 5). The first down hole occurrence of Sphenolitus heteromorphis at 7700 feet and Praeorbulina glomerosa at 8090 feet corresponds to
N9 planktonic foraminifera zone of Bolli and Saunders (1985), indicating an early Middle Miocene age. The
first down hole occurrence of Discoaster deflandrei at 7640 feet corresponds to the NN5 nannozone of Perh-
Neilsen (1985), also indicating an early Middle Miocene age. The last down hole occurrence of Sphenolithus
abies at 3500 feet and first down hole occurrence of Sphenolithus moriformis at 2840 feet indicate a Late
Miocene age. These data suggest that Agbada Formation in Delta field was deposited over about 6-7 million
years during the Middle to Late Miocene, at average deposition rates of about 1000 feet per million years. The
stratigraphy of the Agbada Formation is significantly complicated by faulting, formation of growth strata over
down thrown blocks, and structural deformation associated with upward movement of underlying Akata
Formation shales.
Figure 5: Biostratigraphic zonation within Delta-2 Well. Well log variations are also related to sea level curve of
Haq (1987). The age of intra-sequence surfaces in this well estimated from biostrigraphic divisions appear to
generally match the date of maximum flooding surfaces on the Haq curve.
American Journal of Engineering Research (AJER) 2013
w w w . a j e r . o r g
Page 211
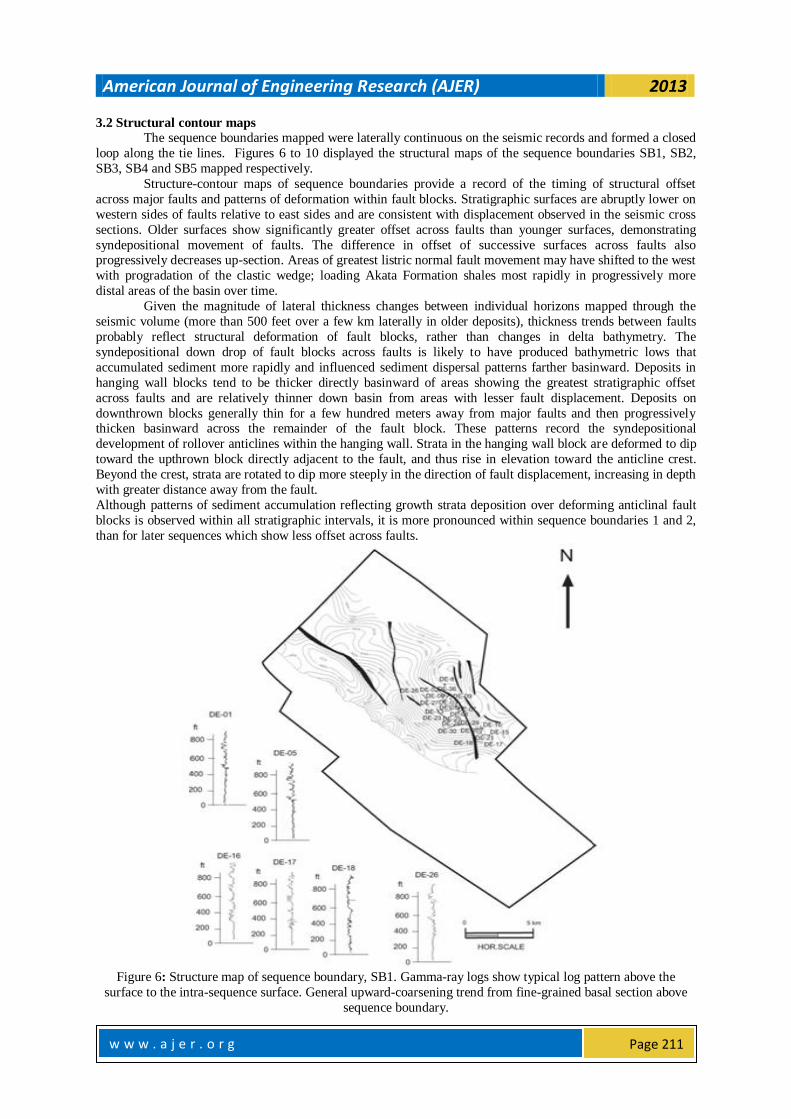
3.2 Structural contour maps
The sequence boundaries mapped were laterally continuous on the seismic records and formed a closed
loop along the tie lines. Figures 6 to 10 displayed the structural maps of the sequence boundaries SB1, SB2,
SB3, SB4 and SB5 mapped respectively.
Structure-contour maps of sequence boundaries provide a record of the timing of structural offset
across major faults and patterns of deformation within fault blocks. Stratigraphic surfaces are abruptly lower on
western sides of faults relative to east sides and are consistent with displacement observed in the seismic cross
sections. Older surfaces show significantly greater offset across faults than younger surfaces, demonstrating
syndepositional movement of faults. The difference in offset of successive surfaces across faults also progressively decreases up-section. Areas of greatest listric normal fault movement may have shifted to the west
with progradation of the clastic wedge; loading Akata Formation shales most rapidly in progressively more
distal areas of the basin over time.
Given the magnitude of lateral thickness changes between individual horizons mapped through the
seismic volume (more than 500 feet over a few km laterally in older deposits), thickness trends between faults
probably reflect structural deformation of fault blocks, rather than changes in delta bathymetry. The
syndepositional down drop of fault blocks across faults is likely to have produced bathymetric lows that
accumulated sediment more rapidly and influenced sediment dispersal patterns farther basinward. Deposits in
hanging wall blocks tend to be thicker directly basinward of areas showing the greatest stratigraphic offset
across faults and are relatively thinner down basin from areas with lesser fault displacement. Deposits on
downthrown blocks generally thin for a few hundred meters away from major faults and then progressively thicken basinward across the remainder of the fault block. These patterns record the syndepositional
development of rollover anticlines within the hanging wall. Strata in the hanging wall block are deformed to dip
toward the upthrown block directly adjacent to the fault, and thus rise in elevation toward the anticline crest.
Beyond the crest, strata are rotated to dip more steeply in the direction of fault displacement, increasing in depth
with greater distance away from the fault.
Although patterns of sediment accumulation reflecting growth strata deposition over deforming anticlinal fault
blocks is observed within all stratigraphic intervals, it is more pronounced within sequence boundaries 1 and 2,
than for later sequences which show less offset across faults.
Figure 6: Structure map of sequence boundary, SB1. Gamma-ray logs show typical log pattern above the
surface to the intra-sequence surface. General upward-coarsening trend from fine-grained basal section above
sequence boundary.
American Journal of Engineering Research (AJER) 2013
w w w . a j e r . o r g
Page 212
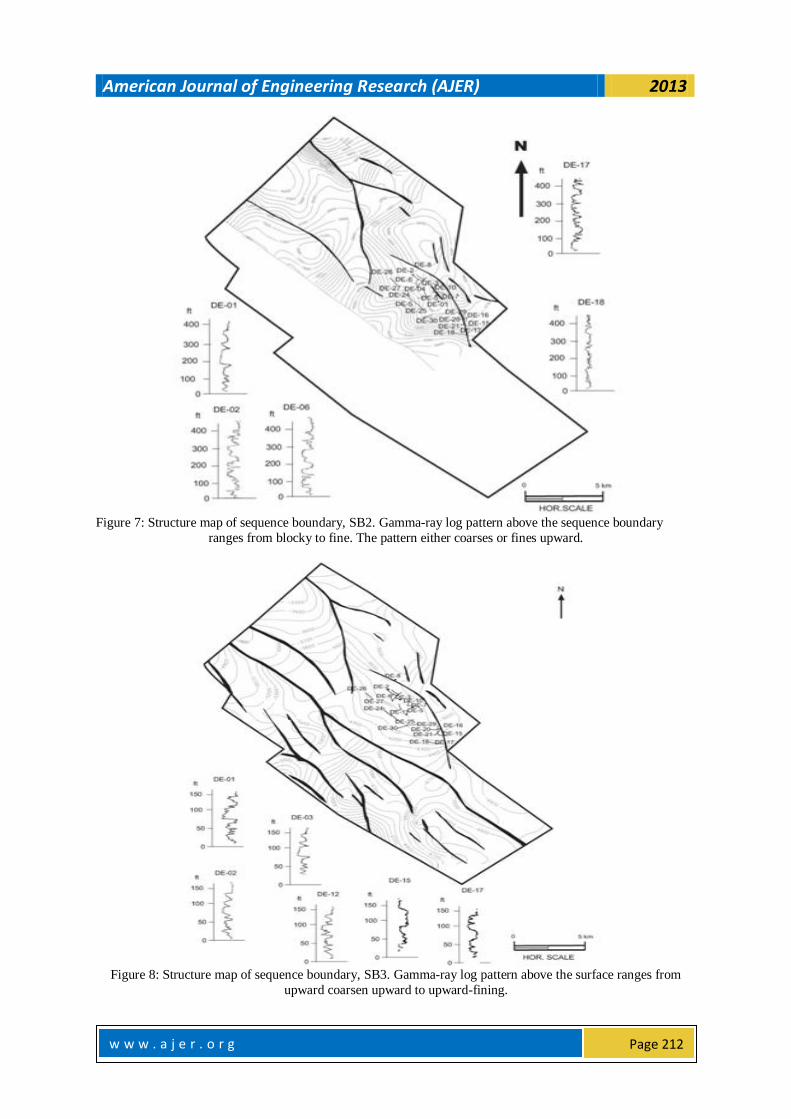
Figure 7: Structure map of sequence boundary, SB2. Gamma-ray log pattern above the sequence boundary
ranges from blocky to fine. The pattern either coarses or fines upward.
Figure 8: Structure map of sequence boundary, SB3. Gamma-ray log pattern above the surface ranges from
upward coarsen upward to upward-fining.
American Journal of Engineering Research (AJER) 2013
w w w . a j e r . o r g
Page 213
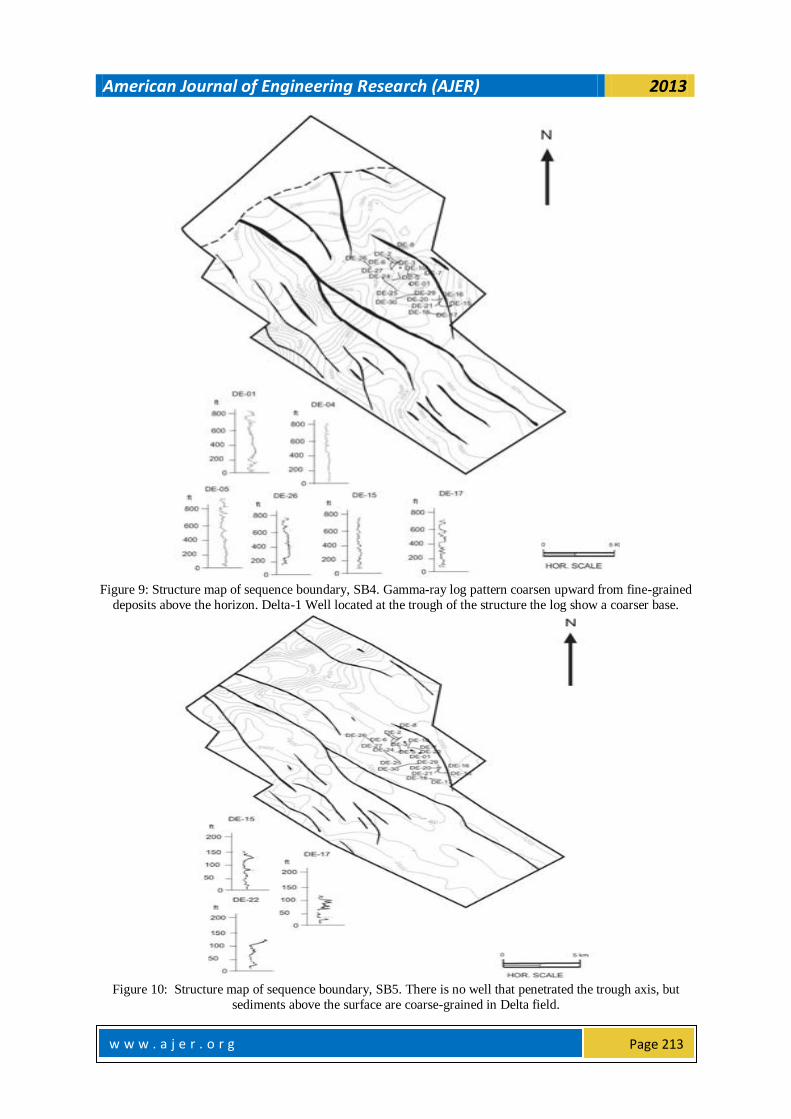
Figure 9: Structure map of sequence boundary, SB4. Gamma-ray log pattern coarsen upward from fine-grained
deposits above the horizon. Delta-1 Well located at the trough of the structure the log show a coarser base.
Figure 10: Structure map of sequence boundary, SB5. There is no well that penetrated the trough axis, but
sediments above the surface are coarse-grained in Delta field.
American Journal of Engineering Research (AJER) 2013
w w w . a j e r . o r g
Page 214
IV. CONCLUSIONS Five sequence boundaries (major erosion surfaces) divide the Agbada Formation, each formed during
an episode of structural collapse of the basin prograding clastic wedge along basinward dipping listric normal
faults. Sequence boundaries were carved by submarine mass flows across basin gradients steepened over a
succession of down-dropped fault blocks. The five (5) sequence boundaries mapped were all within the Agbada
formation since most of the hydrocarbon was believed to be trapped in the Niger Delta. Anticlinal closures and
fault assisted closures regarded as good hydrocarbon prospect areas were delineated in the structural maps. The integration of seismic data and well logs proved to be a useful and important technique in structural mapping
and was successful in defining the subsurface geometry, and determining the structure and hydrocarbon trapping
potential of Delta field. The technique proved to be very useful in structural mapping. Hydrocarbon prospect
areas were delineated in the structural maps produced. The growth faults acted as conduits for hydrocarbon from
the underlying Akata formation. Thus, it is necessary to integrate all exploration and evaluation tools so as to
effectively explore the study area and optimize well locations. Amplitude variation with offset (AVO), seismic
attributes analysis and seismic inversion should be carried out in the study area to better discriminate the
lithology, characterize the reservoirs and define the hydrocarbon types.
V. ACKNOWLEDGEMENT The authors would like to acknowledge the management of Kumasi Polytechnic, Kumasi headed by the
Rector Prof. N.N.N. Nsowah-Nuamah, for providing financial assistance and also the management and staff of
Chevron Nigeria Ltd. (a division of ChevronTexaco Overseas), for providing 3-D seismic data and well logging
data for the research.
REFERENCES [1]. Adejobi AR, Olayinka AI (1997). Stratigraphy and hydrocarbon potential of the Opuama channel
complex area, western Niger delta. Nig. Ass. of petrol. Expl. (NAPE) Bull., 12: 1-10 [2]. Barde JP, Chambertain P, Gralla P, Harwijanto J, Marsky J, Schroeter T (2000). Explaining a complex
hydrocarbon system in the Permo- Triassic of the precaspian basin by integration of independent models.
Abstracts, 62nd European Association of Geoscientists and Engineers Conference and Technical
Exhibition, 2: (P.021), P. 4
[3]. Barde JP, Gralla P, Harwijanto J, Marsky J (2002). Exploration at the eastern edge of the prescapian
basin impact of data integration on Upper Permian and Trasic prospectivity. Am. Assoc. Petrol. Geol.
Bull., 86: 399-415.
[4]. Chukwueke C.C. (1997). Factors controlling hydrocarbon distribution in the central swamp deposit of the
Niger Delta. Nig. Assoc. Petrol. Explorat. Bull., 12: 41-45.
[5]. Doust, H. and E. Omatsola, (1989). Niger delta: AAPG Memoir 48 p. 201-238.
[6]. Doust H, Omatsola E (1990). Niger Delta in divergent/passive margin basins, in J. D. Edwards and P. A. Santogrossied, eds., Am. Assoc. Petrol. Geol. Memoir, 48: 201-238.
[7]. Evamy, B.O., Herembourne, J., Kameline, P., Knap, W.A., Molloy, F.A. and Rowlands, P.H. (1978).
Hydrocarbon habitat of Tertiary Niger Delta, American Association of Petroleum Geologists Bulletin, 62,
p.1-39
[8]. Haack RC, Sundararaman P, Diedjomahor JO, Xiao H, Gant NJ, May ED, Kelsch K (2000). Niger Delta
petroleum systems, Nigeria, in M. R. Mello and B. J. Katz, eds., Petroleum systems of South Atlantic
margins: Am. Assoc. Petrol. Geol. Memoir, 73: 213-231.
[9]. Haq, B.U., J. Hardenbol and P.R., Vail, 1987, Chronology of fluctuating sea-levels since the Triassic:
Science, v. 235, p. 1153-1165.
[10]. Hosper J (1971). The geology of the Niger Delta area, in the Geology of the East Atlantic continental
margin, Great Britain, Institute of Geological Science, Report, 70(16): 121-141
[11]. Knox, G. J. & Omatsola, M. E. (1989). Development of the Cenozoic Niger Delta in terms of the escalator regression model and impact on hydrocarbon distribution, in W. J. M. van der Linden et al., eds,
1987, Proceedings, KNGMG Symposium on Coastal Lowlands, Geology, and Geotechnology: Dordrecht,
Klumer Academic Publishers, p. 181-202.
[12]. Merki PJ (1972). Structural geology of the Cenozoic Niger Delta: 1st Conference on African Geology
Proceedings, Ibadan University Press, pp. 635-646.
[13]. Murat RC (1970). Stratigraphy and Paleogeography of the Cretaceous and Lower Tertiary in Southern
Nigerian. 1st Conference on African Geology Proceedings, Ibadan University Press, pp. 251-266.
[14]. Nton, M.E. and Adebambo, B.A., (2009). Petrophysical evaluation and depositional environments of
reservoir sands of X- field, offshore Niger delta ., Mineral Wealth Vol. 150 pp 1-12
American Journal of Engineering Research (AJER) 2013
w w w . a j e r . o r g
Page 215
[15]. Nton, M.E. and Adesina, A. D., (2009). Aspects of structures and depositional environment of sand
bodies within tomboy field, offshore western Niger Delta, Nigeria RMZ – Materials and Geoenvironment,
Vol. 56, No. 3, pp. 284–303
[16]. Ojo A.O. (1996). Pre-drill prospect evaluation in deep water Nigeria. Nig. Assoc. Petrol. Explo. Bull., 11:
11-22.
[17]. Reijers, T.J.F., (1996). Selected Chapters on Geology, SPDC of Nigeria, Copporate Reprographic
Services, Warri, 197p
[18]. Short, K.C. and Stauble, A. J. (1967). Outline of the geology of Niger Delta, American Association of
Petrroleum Geologists Bulletin, 51 p. 761-779 [19]. Tuttle, M. L. W., R. R. Charpentier and M. E. Brownfield, (1999). The Niger delta petroleum system:
Niger delta province, Nigeria, Cameroon, and Equatorial Guinea, Africa: USGS Open-file report 99-50-H.
[20]. Weber KJ (1971). Sedimentological aspect of oil fielding the Niger Delta. Geol. Minjbouw, 50: 559-576.
[21]. Weber, K.J. and Daukoro, E.M. (1975). Petroleum geological aspects of the Niger Delta. Tokyo, 9th
world Petroleum Congress Proceedings, 5 ( 2), p. 209-221
[22]. Weber KJ, Mandi J, Pilaar WF, Lehner E, Precious RG (1978). The role of faults in hydrocarbon
migration and trapping in Nigeria growth fault structures. 10th Annual Offshore Technology Conference
Proceedings, 4: 2643-2653.
[23]. Whiteman, A., (1982). Nigeria: Its Petroleum Geology, Resources and Potential: London, Graham and
Trotman, 394 p.