Embed Size (px)
Citation preview
2 3 n o v e m b e r 2 0 1 7 | v o L 5 5 1 | n A T U r e | 5 2 1
LeTTerdoi:10.1038/nature24464
Structural basis of nucleotide sugar transport across the Golgi membraneJoanne L. Parker1 & Simon newstead1
Glycosylation is a fundamental cellular process that, in eukaryotes, occurs in the lumen of both the Golgi apparatus and the endoplasmic reticulum1. Nucleotide sugar transporters (NSTs) are an essential component of the glycosylation pathway, providing the diverse range of substrates required for the glycosyltransferases2,3. NSTs are linked to several developmental and immune disorders in humans, and in pathogenic microbes they have an important role in virulence4–8. How NSTs recognize and transport activated monosaccharides, however, is currently unclear. Here we present the crystal structure of an NST, the GDP–mannose transporter Vrg4, in both the substrate-free and the bound states. A hitherto unobserved requirement of short-chain lipids in activating the transporter supports a model for regulation within the highly dynamic membranes of the Golgi apparatus. Our results provide a structural basis for understanding nucleotide sugar recognition, and provide insights into the transport and regulatory mechanism of this family of intracellular transporters.
Within eukaryotes, glycosylation is compartmentalized to maintain both high efficiency and tight regulation, and occurs within the lumen of both the endoplasmic reticulum and the Golgi apparatus9. However, the substrates for the glycosylation enzymes, nucleotide sugars, are syn-thesized in either the cytoplasm or the nucleus, and are unable to cross the organellular membranes. NSTs are therefore required to import all the nucleotide sugars required for glycosylation into the lumen of the Golgi and the endoplasmic reticulum (Fig. 1a). NSTs belong to the SLC35 family of solute carriers, and their function is highly conserved from simple eukaryotes, fungi and parasites to plants and mammals10. NSTs are among only a small number of transporters implicated in Mendelian diseases, such as leukocyte adhesion deficiency II, caused by point mutations within the transporter specific for GDP–fucose4,8, and congenital disorder of glycosylation IIf, caused by mutations in the CMP–sialic acid transporter5.
The transport of nucleotide sugars into the secretory pathway is also important for pathogenic fungi and trypanosomatid parasites, as these organisms contain a cell wall or a surface glycocalyx predominantly consisting of glycomannosylated conjugates that form a protective coat against the human immune system6,7. In these organisms, GDP– mannose transport is fundamental for virulence, making NSTs attrac-tive targets for inhibitor design11,12. However, given the lack of any structural information, the molecular basis of nucleotide sugar recog-nition and transport remains poorly understood13.
To obtain structural information about NSTs, we determined the crystal structure of Vrg4 to 3.2 Å resolution (Extended Data Table 1 and Extended Data Fig. 1a, b). Vrg4 adopts a compact structure, approximately 30 Å in length, consisting of 10 transmembrane (TM) α - helices connected by short loops (Fig. 1b and Extended Data Fig. 2). The topology is similar to that of other members of the drug and metabolite transporter superfamily, to which the NSTs belong14,15. The N and C termini are located on the same side of the transporter, which would correspond to the cytoplasmic side of the Golgi membrane16. The Golgi retrieval sequence K326QKKQQ, which binds to COPI
vesicles and enables the localization of Vrg4 to the Golgi membranes17, forms a structured region at the very C terminus. Notably, TM10 is markedly vertical with respect to the plane of the membrane, resulting in this sequence protruding above the transporter and probably aiding accessibility to the COP1 adaptor proteins17.
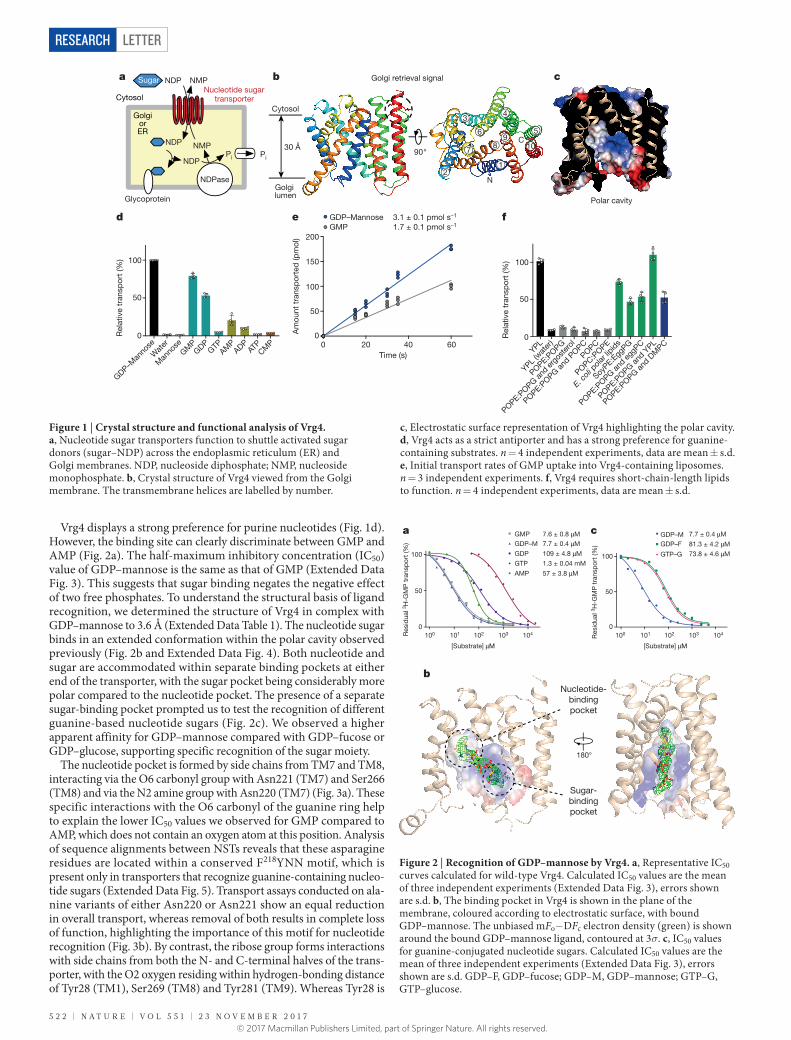
Transmembrane helices 6 and 7 (TM6–TM7) are packed against TM8–TM9 to seal a large cavity from the cytoplasm, whereas TM1–TM2 and TM3–TM4 are opened out, providing a snapshot of the transporter in the state that is closed to the cytoplasm and open to the lumen of the Golgi (Fig. 1c). The central cavity is positively charged, suggestive of a potential site for sugar and phosphate binding. To analyse the substrate specificity, Vrg4 was reconstituted into proteoliposomes. The reconstituted protein acts as a strict antiporter18 requiring either GDP–mannose or GMP to function, with poor trans-port observed with AMP, and no appreciable transport with CMP, which contains the pyrimidine base cytosine (Fig. 1d). Our assays show that the central binding site can discriminate between mono-, di- and triphosphates (Extended Data Fig. 1c, d). Notably, we found that the transport rate was faster when GDP–mannose, as opposed to GMP, was used on the inside of the liposome (Fig. 1e), suggesting a potential asymmetry within the transport mechanism.
The Golgi is known to have a different lipid composition in com-parison to the plasma membrane, giving rise to a thinner bilayer19. On reconstitution into different lipid vesicles we observed a marked effect on transport function (Fig. 1f), highlighted by a severe reduction in transport with vesicles composed of pure POPE:POPG (3:1) lipids compared to yeast polar lipids (YPL). POPE:POPG mixtures have been extensively used to characterize a wide range of different membrane proteins20,21, raising the question of why Vrg4 was not functional in these lipids. Phosphatidylglycerol comprises only a small percentage of the phospholipid in eukaryotes22. First we addressed whether the lack of activity seen in POPE:POPG was due to the lack of phosphati-dylcholine, the major structural lipid in eukaryotes. However, activity was still not observed in vesicles made of pure POPC, POPC:POPE, or POPC-spiked POPE:POPG vesicles. These results rule out the require-ment of a specific lipid head group. Similarly, we observed no transport upon the addition of ergosterol. Activity was observed only when the proteoliposomes contained lipids from natural sources. Therefore, we reasoned that the lack of function of Vrg4 in POPE:POPG lipids was a result of hydrophobic mismatch23. The 1-palmitoyl-2-oleoyl lipids con-sist of one 16- and one 18-carbon fatty acid. We found that the addition of myristoyl fatty acid (14 carbons) in the form of 1,2- dimyristoyl-sn- glycero-3-phosphocholine (DMPC) into the POPE:POPG vesicles could support the function of Vrg4 (Fig. 1f). The Golgi occupies a central position within the secretory pathway, where it functions as a hub for vesicle trafficking. Many resident proteins are swept along the secretory pathway and require retrieval back to the Golgi complex24,25. The extreme case of hydrophobic mismatch we observe for Vrg4 may reflect a mechanism within the NSTs to tightly regulate their function, ensuring maximal activity occurs only in the correct cellular context.
1Department of Biochemistry, University of Oxford, South Parks Road, Oxford OX1 3QU, UK.
© 2017 Macmillan Publishers Limited, part of Springer Nature. All rights reserved.
LetterreSeArCH
5 2 2 | n A T U r e | v o L 5 5 1 | 2 3 n o v e m b e r 2 0 1 7
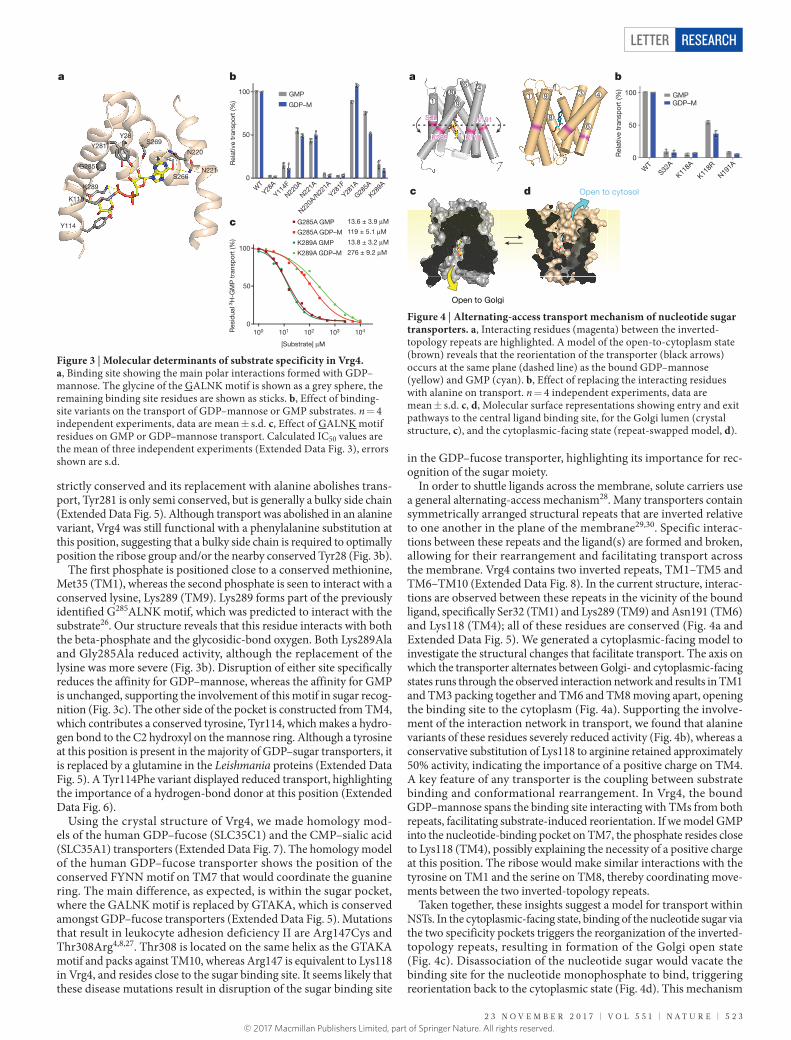
Vrg4 displays a strong preference for purine nucleotides (Fig. 1d). However, the binding site can clearly discriminate between GMP and AMP (Fig. 2a). The half-maximum inhibitory concentration (IC50) value of GDP–mannose is the same as that of GMP (Extended Data Fig. 3). This suggests that sugar binding negates the negative effect of two free phosphates. To understand the structural basis of ligand recognition, we determined the structure of Vrg4 in complex with GDP–mannose to 3.6 Å (Extended Data Table 1). The nucleotide sugar binds in an extended conformation within the polar cavity observed previously (Fig. 2b and Extended Data Fig. 4). Both nucleotide and sugar are accommodated within separate binding pockets at either end of the transporter, with the sugar pocket being considerably more polar compared to the nucleotide pocket. The presence of a separate sugar-binding pocket prompted us to test the recognition of different guanine-based nucleotide sugars (Fig. 2c). We observed a higher apparent affinity for GDP–mannose compared with GDP–fucose or GDP–glucose, supporting specific recognition of the sugar moiety.
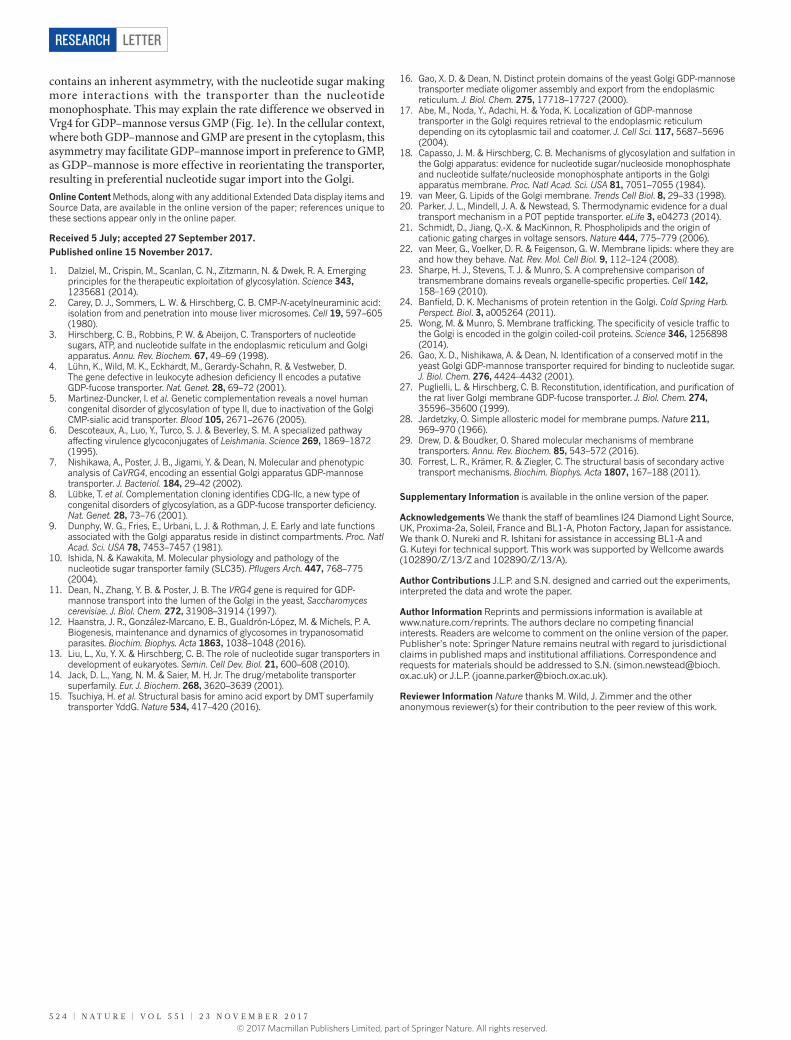
The nucleotide pocket is formed by side chains from TM7 and TM8, interacting via the O6 carbonyl group with Asn221 (TM7) and Ser266 (TM8) and via the N2 amine group with Asn220 (TM7) (Fig. 3a). These specific interactions with the O6 carbonyl of the guanine ring help to explain the lower IC50 values we observed for GMP compared to AMP, which does not contain an oxygen atom at this position. Analysis of sequence alignments between NSTs reveals that these asparagine residues are located within a conserved F218YNN motif, which is present only in transporters that recognize guanine-containing nucleo-tide sugars (Extended Data Fig. 5). Transport assays conducted on ala-nine variants of either Asn220 or Asn221 show an equal reduction in overall transport, whereas removal of both results in complete loss of function, highlighting the importance of this motif for nucleotide recognition (Fig. 3b). By contrast, the ribose group forms interactions with side chains from both the N- and C-terminal halves of the trans-porter, with the O2 oxygen residing within hydrogen-bonding distance of Tyr28 (TM1), Ser269 (TM8) and Tyr281 (TM9). Whereas Tyr28 is
d
NMPNucleotide sugar
transporterCytosol
GolgiorER
PiNDP
NMPPi
NDPase
NDP
NDPSugar
Glycoprotein
e f
cba
Polar cavity
90°
N
C30 Å
Golgi lumen
Golgi retrieval signal
78
3
10
6
12
9
4
5
Cytosol
GDP–Man
nose
Rel
ativ
e tr
ansp
ort
(%)
Wat
er
Man
nose
GMPGDP
GTPAM
PADP
ATPCM
P
GDP–MannoseGMP
Time (s)
Am
ount
tra
nsp
orte
d (p
mol
)
YPL
Rel
ativ
e tr
ansp
ort
(%)
YPL (w
ater
)
POPE:POPG
POPE:POPG an
d ergo
stero
l
POPE:POPG an
d POPC
POPC
POPC:POPE
E. coli
pola
r lipids
SoyPE:E
ggPG
POPE:POPG an
d eggP
C
POPE:POPG an
d YPL
POPE:POPG an
d DM
PC0
50
100
0
50
150
200
100
0
50
100
0 20 40 60
3.1 ± 0.1 pmol s–1
1.7 ± 0.1 pmol s–1
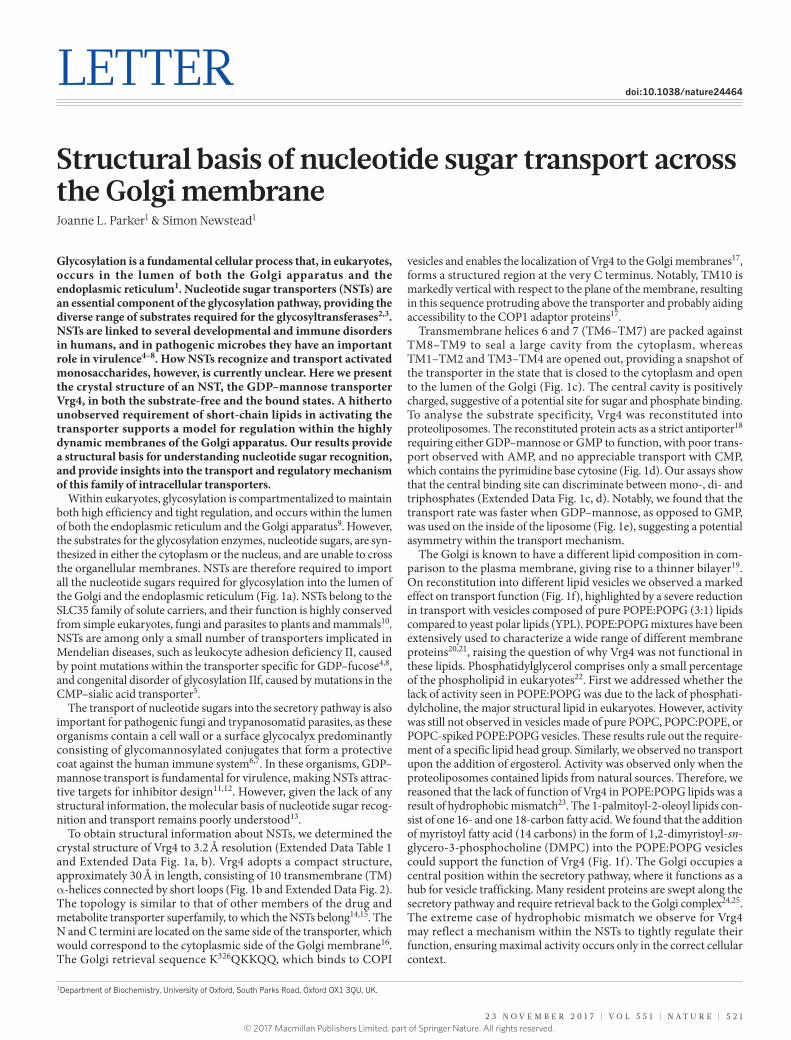
Figure 1 | Crystal structure and functional analysis of Vrg4. a, Nucleotide sugar transporters function to shuttle activated sugar donors (sugar–NDP) across the endoplasmic reticulum (ER) and Golgi membranes. NDP, nucleoside diphosphate; NMP, nucleoside monophosphate. b, Crystal structure of Vrg4 viewed from the Golgi membrane. The transmembrane helices are labelled by number.
c, Electrostatic surface representation of Vrg4 highlighting the polar cavity. d, Vrg4 acts as a strict antiporter and has a strong preference for guanine-containing substrates. n = 4 independent experiments, data are mean ± s.d. e, Initial transport rates of GMP uptake into Vrg4-containing liposomes. n = 3 independent experiments. f, Vrg4 requires short-chain-length lipids to function. n = 4 independent experiments, data are mean ± s.d.
180°
Nucleotide-bindingpocket
Sugar-bindingpocket
7.7 ± 0.4 μM
81.3 ± 4.2 μM
73.8 ± 4.6 μM
GDP–FGDP–M
GTP–G
100 101 102 103 1040
50
100
100 101 102 103 1040
50
100
7.6 ± 0.8 μM
57 ± 3.8 μM
7.7 ± 0.4 μM
109 ± 4.8 μM
1.3 ± 0.04 mM
GDP
GDP–MGMP
GTP
AMP
[Substrate] μM[Substrate] μM
Res
idua
l 3 H-G
MP
tra
nsp
ort
(%)
a
b
c
Res
idua
l 3 H-G
MP
tra
nsp
ort
(%)
0
50
100
0
50
100
100 101 102 103 104 100 101 102 103 104
Figure 2 | Recognition of GDP–mannose by Vrg4. a, Representative IC50 curves calculated for wild-type Vrg4. Calculated IC50 values are the mean of three independent experiments (Extended Data Fig. 3), errors shown are s.d. b, The binding pocket in Vrg4 is shown in the plane of the membrane, coloured according to electrostatic surface, with bound GDP–mannose. The unbiased mFo−DFc electron density (green) is shown around the bound GDP–mannose ligand, contoured at 3σ. c, IC50 values for guanine-conjugated nucleotide sugars. Calculated IC50 values are the mean of three independent experiments (Extended Data Fig. 3), errors shown are s.d. GDP–F, GDP–fucose; GDP–M, GDP–mannose; GTP–G, GTP–glucose.
© 2017 Macmillan Publishers Limited, part of Springer Nature. All rights reserved.
Letter reSeArCH
2 3 n o v e m b e r 2 0 1 7 | v o L 5 5 1 | n A T U r e | 5 2 3
strictly conserved and its replacement with alanine abolishes trans-port, Tyr281 is only semi conserved, but is generally a bulky side chain (Extended Data Fig. 5). Although transport was abolished in an alanine variant, Vrg4 was still functional with a phenylalanine substitution at this position, suggesting that a bulky side chain is required to optimally position the ribose group and/or the nearby conserved Tyr28 (Fig. 3b).
The first phosphate is positioned close to a conserved methionine, Met35 (TM1), whereas the second phosphate is seen to interact with a conserved lysine, Lys289 (TM9). Lys289 forms part of the previously identified G285ALNK motif, which was predicted to interact with the substrate26. Our structure reveals that this residue interacts with both the beta-phosphate and the glycosidic-bond oxygen. Both Lys289Ala and Gly285Ala reduced activity, although the replacement of the lysine was more severe (Fig. 3b). Disruption of either site specifically reduces the affinity for GDP–mannose, whereas the affinity for GMP is unchanged, supporting the involvement of this motif in sugar recog-nition (Fig. 3c). The other side of the pocket is constructed from TM4, which contributes a conserved tyrosine, Tyr114, which makes a hydro-gen bond to the C2 hydroxyl on the mannose ring. Although a tyrosine at this position is present in the majority of GDP–sugar transporters, it is replaced by a glutamine in the Leishmania proteins (Extended Data Fig. 5). A Tyr114Phe variant displayed reduced transport, highlighting the importance of a hydrogen-bond donor at this position (Extended Data Fig. 6).
Using the crystal structure of Vrg4, we made homology mod-els of the human GDP–fucose (SLC35C1) and the CMP–sialic acid (SLC35A1) transporters (Extended Data Fig. 7). The homology model of the human GDP–fucose transporter shows the position of the conserved FYNN motif on TM7 that would coordinate the guanine ring. The main difference, as expected, is within the sugar pocket, where the GALNK motif is replaced by GTAKA, which is conserved amongst GDP–fucose transporters (Extended Data Fig. 5). Mutations that result in leukocyte adhesion deficiency II are Arg147Cys and Thr308Arg4,8,27. Thr308 is located on the same helix as the GTAKA motif and packs against TM10, whereas Arg147 is equivalent to Lys118 in Vrg4, and resides close to the sugar binding site. It seems likely that these disease mutations result in disruption of the sugar binding site
in the GDP–fucose transporter, highlighting its importance for rec-ognition of the sugar moiety.
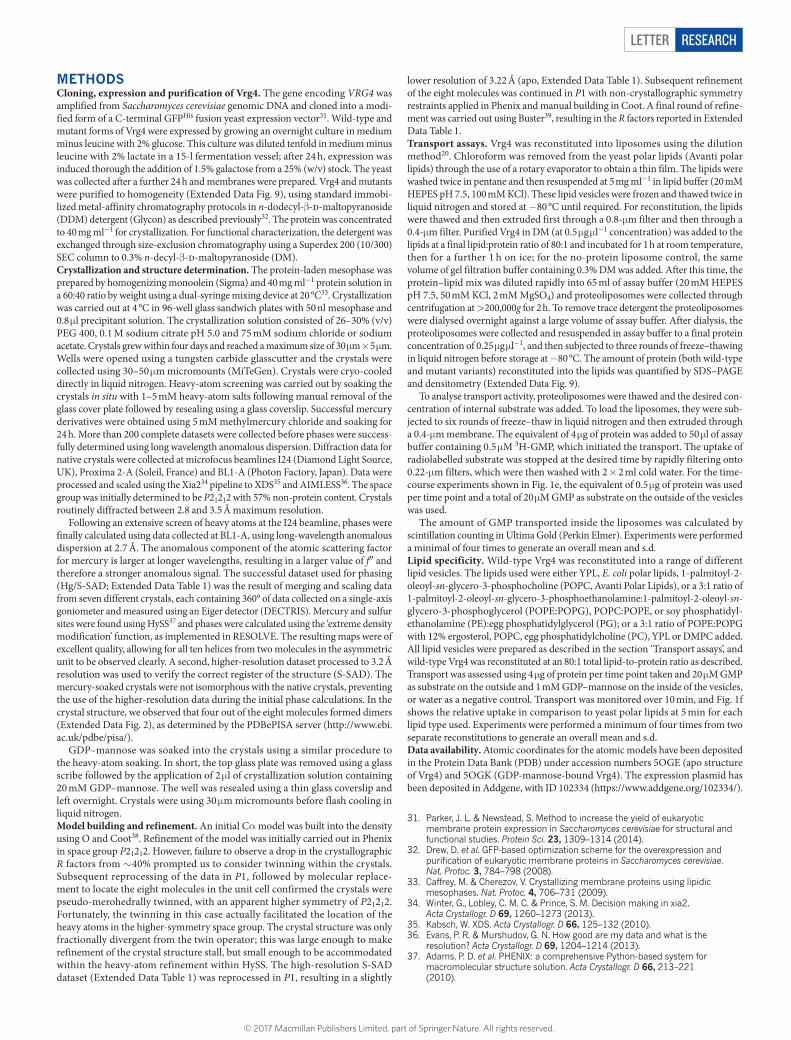
In order to shuttle ligands across the membrane, solute carriers use a general alternating-access mechanism28. Many transporters contain symmetrically arranged structural repeats that are inverted relative to one another in the plane of the membrane29,30. Specific interac-tions between these repeats and the ligand(s) are formed and broken, allowing for their rearrangement and facilitating transport across the membrane. Vrg4 contains two inverted repeats, TM1–TM5 and TM6–TM10 (Extended Data Fig. 8). In the current structure, interac-tions are observed between these repeats in the vicinity of the bound ligand, specifically Ser32 (TM1) and Lys289 (TM9) and Asn191 (TM6) and Lys118 (TM4); all of these residues are conserved (Fig. 4a and Extended Data Fig. 5). We generated a cytoplasmic-facing model to investigate the structural changes that facilitate transport. The axis on which the transporter alternates between Golgi- and cytoplasmic-facing states runs through the observed interaction network and results in TM1 and TM3 packing together and TM6 and TM8 moving apart, opening the binding site to the cytoplasm (Fig. 4a). Supporting the involve-ment of the interaction network in transport, we found that alanine variants of these residues severely reduced activity (Fig. 4b), whereas a conserva tive substitution of Lys118 to arginine retained approximately 50% activity, indicating the importance of a positive charge on TM4. A key feature of any transporter is the coupling between substrate binding and conformational rearrangement. In Vrg4, the bound GDP– mannose spans the binding site interacting with TMs from both repeats, facilitating substrate-induced reorientation. If we model GMP into the nucleotide-binding pocket on TM7, the phosphate resides close to Lys118 (TM4), possibly explaining the necessity of a positive charge at this position. The ribose would make similar interactions with the tyrosine on TM1 and the serine on TM8, thereby coordinating move-ments between the two inverted-topology repeats.
Taken together, these insights suggest a model for transport within NSTs. In the cytoplasmic-facing state, binding of the nucleotide sugar via the two specificity pockets triggers the reorganization of the inverted- topology repeats, resulting in formation of the Golgi open state (Fig. 4c). Disassociation of the nucleotide sugar would vacate the binding site for the nucleotide monophosphate to bind, triggering reorientation back to the cytoplasmic state (Fig. 4d). This mechanism
100 101 102 103 1040
50
100
104
b
c
a
[Substrate] μM
Res
idua
l 3 H-G
MP
tra
nsp
ort
(%)
K289A GMP
G285A GDP–M
G285A GMP
K289A GDP–M
0
50
100
GDP–M
GMP
Rel
ativ
e tr
ansp
ort
(%)
WT
Y28A
Y114F
N220A
N221A
N220A
/N22
1A
Y281A
Y281F
G285A
K289A
N220
N221
Y28
Y281
Y114
K118
K289
S269
G285
S266 00
50
100
0
50
100
100 101 102 103
13.6 ± 3.9 μM
119 ± 5.1 μM
13.8 ± 3.2 μM
276 ± 9.2 μM
Figure 3 | Molecular determinants of substrate specificity in Vrg4. a, Binding site showing the main polar interactions formed with GDP–mannose. The glycine of the GALNK motif is shown as a grey sphere, the remaining binding site residues are shown as sticks. b, Effect of binding-site variants on the transport of GDP–mannose or GMP substrates. n = 4 independent experiments, data are mean ± s.d. c, Effect of GALNK motif residues on GMP or GDP–mannose transport. Calculated IC50 values are the mean of three independent experiments (Extended Data Fig. 3), errors shown are s.d.
b
c
a
GDP–MGMP
Rel
ativ
e tr
ansp
ort
(%)
WT
d
S32A
K118A
K118R
N191A
Open to cytosol
Open to Golgi
a
S32
K289 K118
N191
46
918 1 9 43
8
0
50
100
6
Figure 4 | Alternating-access transport mechanism of nucleotide sugar transporters. a, Interacting residues (magenta) between the inverted-topology repeats are highlighted. A model of the open-to-cytoplasm state (brown) reveals that the reorientation of the transporter (black arrows) occurs at the same plane (dashed line) as the bound GDP–mannose (yellow) and GMP (cyan). b, Effect of replacing the interacting residues with alanine on transport. n = 4 independent experiments, data are mean ± s.d. c, d, Molecular surface representations showing entry and exit pathways to the central ligand binding site, for the Golgi lumen (crystal structure, c), and the cytoplasmic-facing state (repeat-swapped model, d).
© 2017 Macmillan Publishers Limited, part of Springer Nature. All rights reserved.
LetterreSeArCH
5 2 4 | n A T U r e | v o L 5 5 1 | 2 3 n o v e m b e r 2 0 1 7
contains an inherent asymmetry, with the nucleotide sugar making more interactions with the transporter than the nucleotide monophosphate. This may explain the rate difference we observed in Vrg4 for GDP–mannose versus GMP (Fig. 1e). In the cellular context, where both GDP–mannose and GMP are present in the cytoplasm, this asymmetry may facilitate GDP–mannose import in preference to GMP, as GDP–mannose is more effective in reorientating the transporter, resulting in preferential nucleotide sugar import into the Golgi.Online Content Methods, along with any additional Extended Data display items and Source Data, are available in the online version of the paper; references unique to these sections appear only in the online paper.
received 5 July; accepted 27 September 2017.
Published online 15 November 2017.
1. Dalziel, M., Crispin, M., Scanlan, C. N., Zitzmann, N. & Dwek, R. A. Emerging principles for the therapeutic exploitation of glycosylation. Science 343, 1235681 (2014).
2. Carey, D. J., Sommers, L. W. & Hirschberg, C. B. CMP-N-acetylneuraminic acid: isolation from and penetration into mouse liver microsomes. Cell 19, 597–605 (1980).
3. Hirschberg, C. B., Robbins, P. W. & Abeijon, C. Transporters of nucleotide sugars, ATP, and nucleotide sulfate in the endoplasmic reticulum and Golgi apparatus. Annu. Rev. Biochem. 67, 49–69 (1998).
4. Lühn, K., Wild, M. K., Eckhardt, M., Gerardy-Schahn, R. & Vestweber, D. The gene defective in leukocyte adhesion deficiency II encodes a putative GDP-fucose transporter. Nat. Genet. 28, 69–72 (2001).
5. Martinez-Duncker, I. et al. Genetic complementation reveals a novel human congenital disorder of glycosylation of type II, due to inactivation of the Golgi CMP-sialic acid transporter. Blood 105, 2671–2676 (2005).
6. Descoteaux, A., Luo, Y., Turco, S. J. & Beverley, S. M. A specialized pathway affecting virulence glycoconjugates of Leishmania. Science 269, 1869–1872 (1995).
7. Nishikawa, A., Poster, J. B., Jigami, Y. & Dean, N. Molecular and phenotypic analysis of CaVRG4, encoding an essential Golgi apparatus GDP-mannose transporter. J. Bacteriol. 184, 29–42 (2002).
8. Lübke, T. et al. Complementation cloning identifies CDG-IIc, a new type of congenital disorders of glycosylation, as a GDP-fucose transporter deficiency. Nat. Genet. 28, 73–76 (2001).
9. Dunphy, W. G., Fries, E., Urbani, L. J. & Rothman, J. E. Early and late functions associated with the Golgi apparatus reside in distinct compartments. Proc. Natl Acad. Sci. USA 78, 7453–7457 (1981).
10. Ishida, N. & Kawakita, M. Molecular physiology and pathology of the nucleotide sugar transporter family (SLC35). Pflugers Arch. 447, 768–775 (2004).
11. Dean, N., Zhang, Y. B. & Poster, J. B. The VRG4 gene is required for GDP-mannose transport into the lumen of the Golgi in the yeast, Saccharomyces cerevisiae. J. Biol. Chem. 272, 31908–31914 (1997).
12. Haanstra, J. R., González-Marcano, E. B., Gualdrón-López, M. & Michels, P. A. Biogenesis, maintenance and dynamics of glycosomes in trypanosomatid parasites. Biochim. Biophys. Acta 1863, 1038–1048 (2016).
13. Liu, L., Xu, Y. X. & Hirschberg, C. B. The role of nucleotide sugar transporters in development of eukaryotes. Semin. Cell Dev. Biol. 21, 600–608 (2010).
14. Jack, D. L., Yang, N. M. & Saier, M. H. Jr. The drug/metabolite transporter superfamily. Eur. J. Biochem. 268, 3620–3639 (2001).
15. Tsuchiya, H. et al. Structural basis for amino acid export by DMT superfamily transporter YddG. Nature 534, 417–420 (2016).
Supplementary Information is available in the online version of the paper.
Acknowledgements We thank the staff of beamlines I24 Diamond Light Source, UK, Proxima-2a, Soleil, France and BL1-A, Photon Factory, Japan for assistance. We thank O. Nureki and R. Ishitani for assistance in accessing BL1-A and G. Kuteyi for technical support. This work was supported by Wellcome awards (102890/Z/13/Z and 102890/Z/13/A).
Author Contributions J.L.P. and S.N. designed and carried out the experiments, interpreted the data and wrote the paper.
Author Information Reprints and permissions information is available at www.nature.com/reprints. The authors declare no competing financial interests. Readers are welcome to comment on the online version of the paper. Publisher’s note: Springer Nature remains neutral with regard to jurisdictional claims in published maps and institutional affiliations. Correspondence and requests for materials should be addressed to S.N. ([email protected]) or J.L.P. ([email protected]).
reviewer Information Nature thanks M. Wild, J. Zimmer and the other anonymous reviewer(s) for their contribution to the peer review of this work.
16. Gao, X. D. & Dean, N. Distinct protein domains of the yeast Golgi GDP-mannose transporter mediate oligomer assembly and export from the endoplasmic reticulum. J. Biol. Chem. 275, 17718–17727 (2000).
17. Abe, M., Noda, Y., Adachi, H. & Yoda, K. Localization of GDP-mannose transporter in the Golgi requires retrieval to the endoplasmic reticulum depending on its cytoplasmic tail and coatomer. J. Cell Sci. 117, 5687–5696 (2004).
18. Capasso, J. M. & Hirschberg, C. B. Mechanisms of glycosylation and sulfation in the Golgi apparatus: evidence for nucleotide sugar/nucleoside monophosphate and nucleotide sulfate/nucleoside monophosphate antiports in the Golgi apparatus membrane. Proc. Natl Acad. Sci. USA 81, 7051–7055 (1984).
19. van Meer, G. Lipids of the Golgi membrane. Trends Cell Biol. 8, 29–33 (1998). 20. Parker, J. L., Mindell, J. A. & Newstead, S. Thermodynamic evidence for a dual
transport mechanism in a POT peptide transporter. eLife 3, e04273 (2014).21. Schmidt, D., Jiang, Q.-X. & MacKinnon, R. Phospholipids and the origin of
cationic gating charges in voltage sensors. Nature 444, 775–779 (2006).22. van Meer, G., Voelker, D. R. & Feigenson, G. W. Membrane lipids: where they are
and how they behave. Nat. Rev. Mol. Cell Biol. 9, 112–124 (2008).23. Sharpe, H. J., Stevens, T. J. & Munro, S. A comprehensive comparison of
transmembrane domains reveals organelle-specific properties. Cell 142, 158–169 (2010).
24. Banfield, D. K. Mechanisms of protein retention in the Golgi. Cold Spring Harb. Perspect. Biol. 3, a005264 (2011).
25. Wong, M. & Munro, S. Membrane trafficking. The specificity of vesicle traffic to the Golgi is encoded in the golgin coiled-coil proteins. Science 346, 1256898 (2014).
26. Gao, X. D., Nishikawa, A. & Dean, N. Identification of a conserved motif in the yeast Golgi GDP-mannose transporter required for binding to nucleotide sugar. J. Biol. Chem. 276, 4424–4432 (2001).
27. Puglielli, L. & Hirschberg, C. B. Reconstitution, identification, and purification of the rat liver Golgi membrane GDP-fucose transporter. J. Biol. Chem. 274, 35596–35600 (1999).
28. Jardetzky, O. Simple allosteric model for membrane pumps. Nature 211, 969–970 (1966).
29. Drew, D. & Boudker, O. Shared molecular mechanisms of membrane transporters. Annu. Rev. Biochem. 85, 543–572 (2016).
30. Forrest, L. R., Krämer, R. & Ziegler, C. The structural basis of secondary active transport mechanisms. Biochim. Biophys. Acta 1807, 167–188 (2011).
© 2017 Macmillan Publishers Limited, part of Springer Nature. All rights reserved.
Letter reSeArCH
31. Parker, J. L. & Newstead, S. Method to increase the yield of eukaryotic membrane protein expression in Saccharomyces cerevisiae for structural and functional studies. Protein Sci. 23, 1309–1314 (2014).
32. Drew, D. et al. GFP-based optimization scheme for the overexpression and purification of eukaryotic membrane proteins in Saccharomyces cerevisiae. Nat. Protoc. 3, 784–798 (2008).
33. Caffrey, M. & Cherezov, V. Crystallizing membrane proteins using lipidic mesophases. Nat. Protoc. 4, 706–731 (2009).
34. Winter, G., Lobley, C. M. C. & Prince, S. M. Decision making in xia2. Acta Crystallogr. D 69, 1260–1273 (2013).
35. Kabsch, W. XDS. Acta Crystallogr. D 66, 125–132 (2010).36. Evans, P. R. & Murshudov, G. N. How good are my data and what is the
resolution? Acta Crystallogr. D 69, 1204–1214 (2013).37. Adams, P. D. et al. PHENIX: a comprehensive Python-based system for
macromolecular structure solution. Acta Crystallogr. D 66, 213–221 (2010).
MethOdSCloning, expression and purification of Vrg4. The gene encoding VRG4 was amplified from Saccharomyces cerevisiae genomic DNA and cloned into a modi-fied form of a C-terminal GFPHis fusion yeast expression vector31. Wild-type and mutant forms of Vrg4 were expressed by growing an overnight culture in medium minus leucine with 2% glucose. This culture was diluted tenfold in medium minus leucine with 2% lactate in a 15-l fermentation vessel; after 24 h, expression was induced thorough the addition of 1.5% galactose from a 25% (w/v) stock. The yeast was collected after a further 24 h and membranes were prepared. Vrg4 and mutants were purified to homogeneity (Extended Data Fig. 9), using standard immobi-lized metal-affinity chromatography protocols in n-dodecyl-β -d-maltopyranoside (DDM) detergent (Glycon) as described previously32. The protein was concentrated to 40 mg ml−1 for crystallization. For functional characterization, the detergent was exchanged through size-exclusion chromatography using a Superdex 200 (10/300) SEC column to 0.3% n-decyl-β -d-maltopyranoside (DM).Crystallization and structure determination. The protein-laden mesophase was prepared by homogenizing monoolein (Sigma) and 40 mg ml−1 protein solution in a 60:40 ratio by weight using a dual-syringe mixing device at 20 °C33. Crystallization was carried out at 4 °C in 96-well glass sandwich plates with 50 nl mesophase and 0.8 μ l precipitant solution. The crystallization solution consisted of 26–30% (v/v) PEG 400, 0.1 M sodium citrate pH 5.0 and 75 mM sodium chloride or sodium acetate. Crystals grew within four days and reached a maximum size of 30 μ m × 5 μ m. Wells were opened using a tungsten carbide glasscutter and the crystals were collected using 30–50 μ m micromounts (MiTeGen). Crystals were cryo-cooled directly in liquid nitrogen. Heavy-atom screening was carried out by soaking the crystals in situ with 1–5 mM heavy-atom salts following manual removal of the glass cover plate followed by resealing using a glass coverslip. Successful mercury derivatives were obtained using 5 mM methylmercury chloride and soaking for 24 h. More than 200 complete datasets were collected before phases were success-fully determined using long wavelength anomalous dispersion. Diffraction data for native crystals were collected at microfocus beamlines I24 (Diamond Light Source, UK), Proxima 2-A (Soleil, France) and BL1-A (Photon Factory, Japan). Data were processed and scaled using the Xia234 pipeline to XDS35 and AIMLESS36. The space group was initially determined to be P21212 with 57% non-protein content. Crystals routinely diffracted between 2.8 and 3.5 Å maximum resolution.
Following an extensive screen of heavy atoms at the I24 beamline, phases were finally calculated using data collected at BL1-A, using long-wavelength anomalous dispersion at 2.7 Å. The anomalous component of the atomic scattering factor for mercury is larger at longer wavelengths, resulting in a larger value of f″ and therefore a stronger anomalous signal. The successful dataset used for phasing (Hg/S-SAD; Extended Data Table 1) was the result of merging and scaling data from seven different crystals, each containing 360° of data collected on a single-axis goniometer and measured using an Eiger detector (DECTRIS). Mercury and sulfur sites were found using HySS37 and phases were calculated using the ‘extreme density modification’ function, as implemented in RESOLVE. The resulting maps were of excellent quality, allowing for all ten helices from two molecules in the asymmetric unit to be observed clearly. A second, higher-resolution dataset processed to 3.2 Å resolution was used to verify the correct register of the structure (S-SAD). The mercury-soaked crystals were not isomorphous with the native crystals, preventing the use of the higher-resolution data during the initial phase calculations. In the crystal structure, we observed that four out of the eight molecules formed dimers (Extended Data Fig. 2), as determined by the PDBePISA server (http://www.ebi.ac.uk/pdbe/pisa/).
GDP–mannose was soaked into the crystals using a similar procedure to the heavy-atom soaking. In short, the top glass plate was removed using a glass scribe followed by the application of 2 μ l of crystallization solution containing 20 mM GDP–mannose. The well was resealed using a thin glass coverslip and left overnight. Crystals were using 30 μ m micromounts before flash cooling in liquid nitrogen.Model building and refinement. An initial Cα model was built into the density using O and Coot38. Refinement of the model was initially carried out in Phenix in space group P21212. However, failure to observe a drop in the crystallographic R factors from ~ 40% prompted us to consider twinning within the crystals. Subsequent reprocessing of the data in P1, followed by molecular replace-ment to locate the eight molecules in the unit cell confirmed the crystals were pseudo-merohedrally twinned, with an apparent higher symmetry of P21212. Fortunately, the twinning in this case actually facilitated the location of the heavy atoms in the higher-symmetry space group. The crystal structure was only fractionally divergent from the twin operator; this was large enough to make refinement of the crystal structure stall, but small enough to be accommodated within the heavy-atom refinement within HySS. The high-resolution S-SAD dataset (Extended Data Table 1) was reprocessed in P1, resulting in a slightly
lower resolution of 3.22 Å (apo, Extended Data Table 1). Subsequent refinement of the eight molecules was continued in P1 with non-crystallographic symmetry restraints applied in Phenix and manual building in Coot. A final round of refine-ment was carried out using Buster39, resulting in the R factors reported in Extended Data Table 1.Transport assays. Vrg4 was reconstituted into liposomes using the dilution method20. Chloroform was removed from the yeast polar lipids (Avanti polar lipids) through the use of a rotary evaporator to obtain a thin film. The lipids were washed twice in pentane and then resuspended at 5 mg ml−1 in lipid buffer (20 mM HEPES pH 7.5, 100 mM KCl). These lipid vesicles were frozen and thawed twice in liquid nitrogen and stored at − 80 °C until required. For reconstitution, the lipids were thawed and then extruded first through a 0.8-μ m filter and then through a 0.4-μ m filter. Purified Vrg4 in DM (at 0.5 μ g μ l−1 concentration) was added to the lipids at a final lipid:protein ratio of 80:1 and incubated for 1 h at room temperature, then for a further 1 h on ice; for the no-protein liposome control, the same volume of gel filtration buffer containing 0.3% DM was added. After this time, the protein–lipid mix was diluted rapidly into 65 ml of assay buffer (20 mM HEPES pH 7.5, 50 mM KCl, 2 mM MgSO4) and proteoliposomes were collected through centrifugation at > 200,000g for 2 h. To remove trace detergent the proteoliposomes were dialysed overnight against a large volume of assay buffer. After dialysis, the proteoliposomes were collected and resuspended in assay buffer to a final protein concentration of 0.25 μ g μ l−1, and then subjected to three rounds of freeze–thawing in liquid nitrogen before storage at − 80 °C. The amount of protein (both wild-type and mutant variants) reconstituted into the lipids was quantified by SDS–PAGE and densitometry (Extended Data Fig. 9).
To analyse transport activity, proteoliposomes were thawed and the desired con-centration of internal substrate was added. To load the liposomes, they were sub-jected to six rounds of freeze–thaw in liquid nitrogen and then extruded through a 0.4-μ m membrane. The equivalent of 4 μ g of protein was added to 50 μ l of assay buffer containing 0.5 μ M 3H-GMP, which initiated the transport. The uptake of radiolabelled substrate was stopped at the desired time by rapidly filtering onto 0.22-μ m filters, which were then washed with 2 × 2 ml cold water. For the time-course experiments shown in Fig. 1e, the equivalent of 0.5 μ g of protein was used per time point and a total of 20 μ M GMP as substrate on the outside of the vesicles was used.
The amount of GMP transported inside the liposomes was calculated by scintillation counting in Ultima Gold (Perkin Elmer). Experiments were performed a minimal of four times to generate an overall mean and s.d.Lipid specificity. Wild-type Vrg4 was reconstituted into a range of different lipid vesicles. The lipids used were either YPL, E. coli polar lipids, 1- palmitoyl-2- oleoyl-sn-glycero-3-phosphocholine (POPC, Avanti Polar Lipids), or a 3:1 ratio of 1-palmitoyl-2-oleoyl-sn-glycero-3-phosphoethanolamine:1- palmitoyl-2-oleoyl-sn- glycero-3-phosphoglycerol (POPE:POPG), POPC:POPE, or soy phosphatidyl-ethanolamine (PE):egg phosphatidylglycerol (PG); or a 3:1 ratio of POPE:POPG with 12% ergosterol, POPC, egg phosphatidylcholine (PC), YPL or DMPC added. All lipid vesicles were prepared as described in the section ‘Transport assays’, and wild-type Vrg4 was reconstituted at an 80:1 total lipid-to-protein ratio as described. Transport was assessed using 4 μ g of protein per time point taken and 20 μ M GMP as substrate on the outside and 1 mM GDP–mannose on the inside of the vesicles, or water as a negative control. Transport was monitored over 10 min, and Fig. 1f shows the relative uptake in comparison to yeast polar lipids at 5 min for each lipid type used. Experiments were performed a minimum of four times from two separate reconstitutions to generate an overall mean and s.d.Data availability. Atomic coordinates for the atomic models have been deposited in the Protein Data Bank (PDB) under accession numbers 5OGE (apo structure of Vrg4) and 5OGK (GDP-mannose-bound Vrg4). The expression plasmid has been deposited in Addgene, with ID 102334 (https://www.addgene.org/102334/).
© 2017 Macmillan Publishers Limited, part of Springer Nature. All rights reserved.
LetterreSeArCH
38. Emsley, P., Lohkamp, B., Scott, W. G. & Cowtan, K. Features and development of Coot. Acta Crystallogr. D 66, 486–501 (2010).
39. Blanc, E. et al. Refinement of severely incomplete structures with maximum likelihood in BUSTER-TNT. Acta Crystallogr. D 60, 2210–2221 (2004).
40. Eckhardt, M., Gotza, B. & Gerardy-Schahn, R. Mutants of the CMP-sialic acid transporter causing the Lec2 phenotype. J. Biol. Chem. 273, 20189–20195 (1998).
41. Chan, K. F., Zhang, P. & Song, Z. Identification of essential amino acid residues in the hydrophilic loop regions of the CMP-sialic acid transporter and UDP-galactose transporter. Glycobiology 20, 689–701 (2010).
42. Stamm, M., Staritzbichler, R., Khafizov, K. & Forrest, L. R. AlignMe—a membrane protein sequence alignment web server. Nucleic Acids Res. 42, W246–W251 (2014).
© 2017 Macmillan Publishers Limited, part of Springer Nature. All rights reserved.
Letter reSeArCH
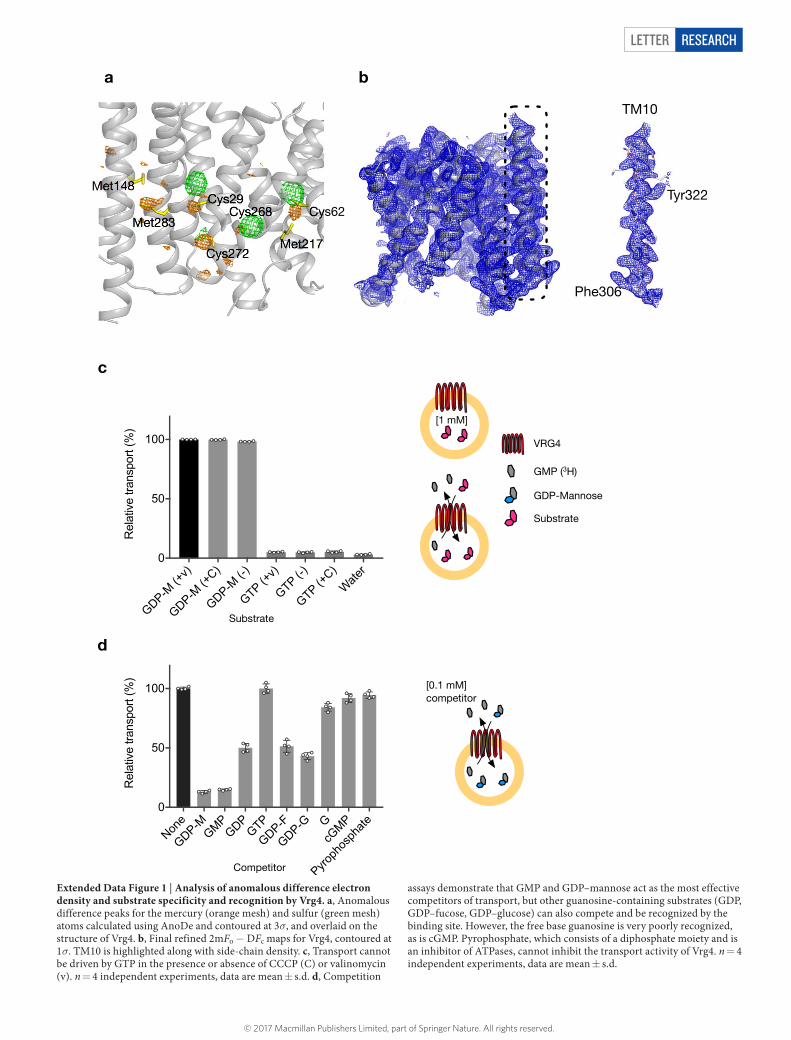
Extended Data Figure 1 | Analysis of anomalous difference electron density and substrate specificity and recognition by Vrg4. a, Anomalous difference peaks for the mercury (orange mesh) and sulfur (green mesh) atoms calculated using AnoDe and contoured at 3σ, and overlaid on the structure of Vrg4. b, Final refined 2mFo − DFc maps for Vrg4, contoured at 1σ. TM10 is highlighted along with side-chain density. c, Transport cannot be driven by GTP in the presence or absence of CCCP (C) or valinomycin (v). n = 4 independent experiments, data are mean ± s.d. d, Competition
assays demonstrate that GMP and GDP–mannose act as the most effective competitors of transport, but other guanosine-containing substrates (GDP, GDP–fucose, GDP–glucose) can also compete and be recognized by the binding site. However, the free base guanosine is very poorly recognized, as is cGMP. Pyrophosphate, which consists of a diphosphate moiety and is an inhibitor of ATPases, cannot inhibit the transport activity of Vrg4. n = 4 independent experiments, data are mean ± s.d.
© 2017 Macmillan Publishers Limited, part of Springer Nature. All rights reserved.
LetterreSeArCH
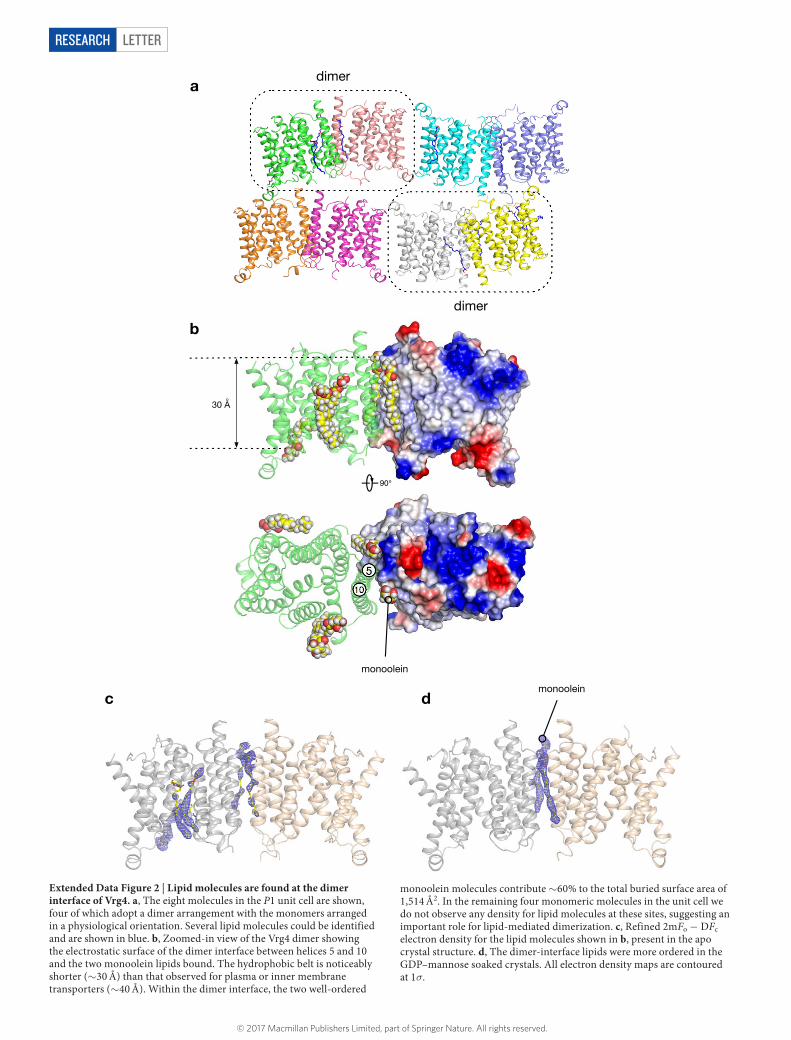
Extended Data Figure 2 | Lipid molecules are found at the dimer interface of Vrg4. a, The eight molecules in the P1 unit cell are shown, four of which adopt a dimer arrangement with the monomers arranged in a physiological orientation. Several lipid molecules could be identified and are shown in blue. b, Zoomed-in view of the Vrg4 dimer showing the electrostatic surface of the dimer interface between helices 5 and 10 and the two monoolein lipids bound. The hydrophobic belt is noticeably shorter (~ 30 Å) than that observed for plasma or inner membrane transporters (~ 40 Å). Within the dimer interface, the two well-ordered
monoolein molecules contribute ~ 60% to the total buried surface area of 1,514 Å2. In the remaining four monomeric molecules in the unit cell we do not observe any density for lipid molecules at these sites, suggesting an important role for lipid-mediated dimerization. c, Refined 2mFo − DFc electron density for the lipid molecules shown in b, present in the apo crystal structure. d, The dimer-interface lipids were more ordered in the GDP–mannose soaked crystals. All electron density maps are contoured at 1σ.
© 2017 Macmillan Publishers Limited, part of Springer Nature. All rights reserved.
Letter reSeArCH
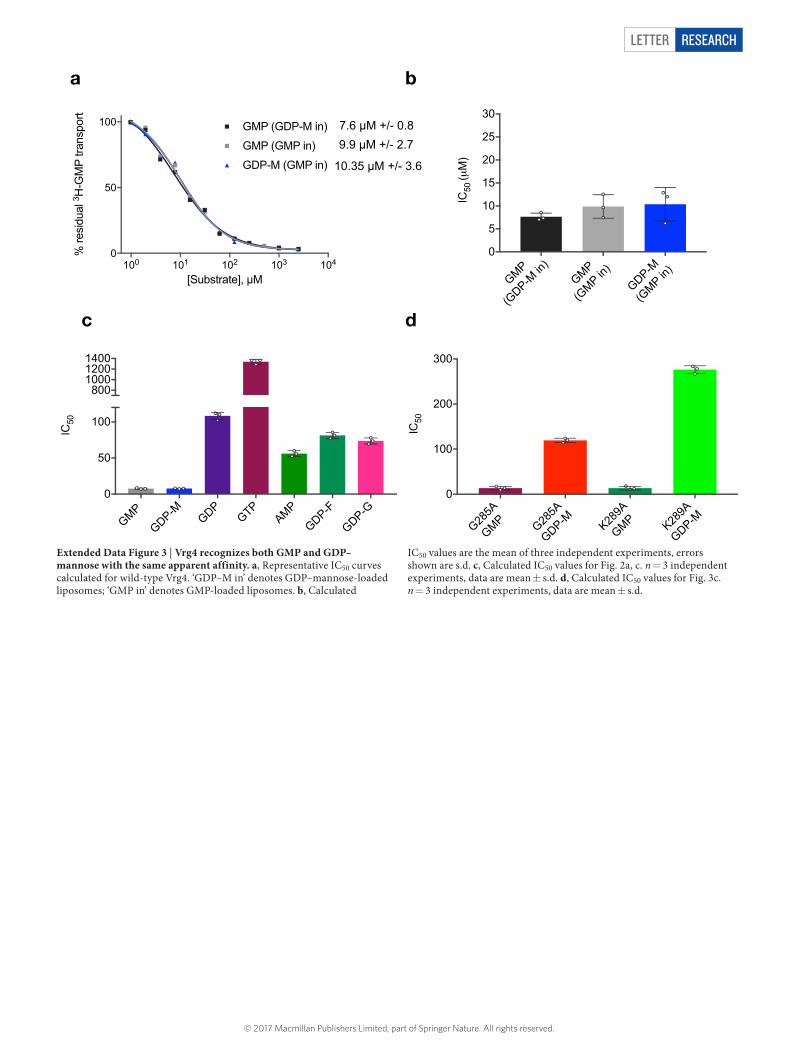
Extended Data Figure 3 | Vrg4 recognizes both GMP and GDP–mannose with the same apparent affinity. a, Representative IC50 curves calculated for wild-type Vrg4. ‘GDP–M in’ denotes GDP–mannose-loaded liposomes; ‘GMP in’ denotes GMP-loaded liposomes. b, Calculated
IC50 values are the mean of three independent experiments, errors shown are s.d. c, Calculated IC50 values for Fig. 2a, c. n = 3 independent experiments, data are mean ± s.d. d, Calculated IC50 values for Fig. 3c. n = 3 independent experiments, data are mean ± s.d.
© 2017 Macmillan Publishers Limited, part of Springer Nature. All rights reserved.
LetterreSeArCH
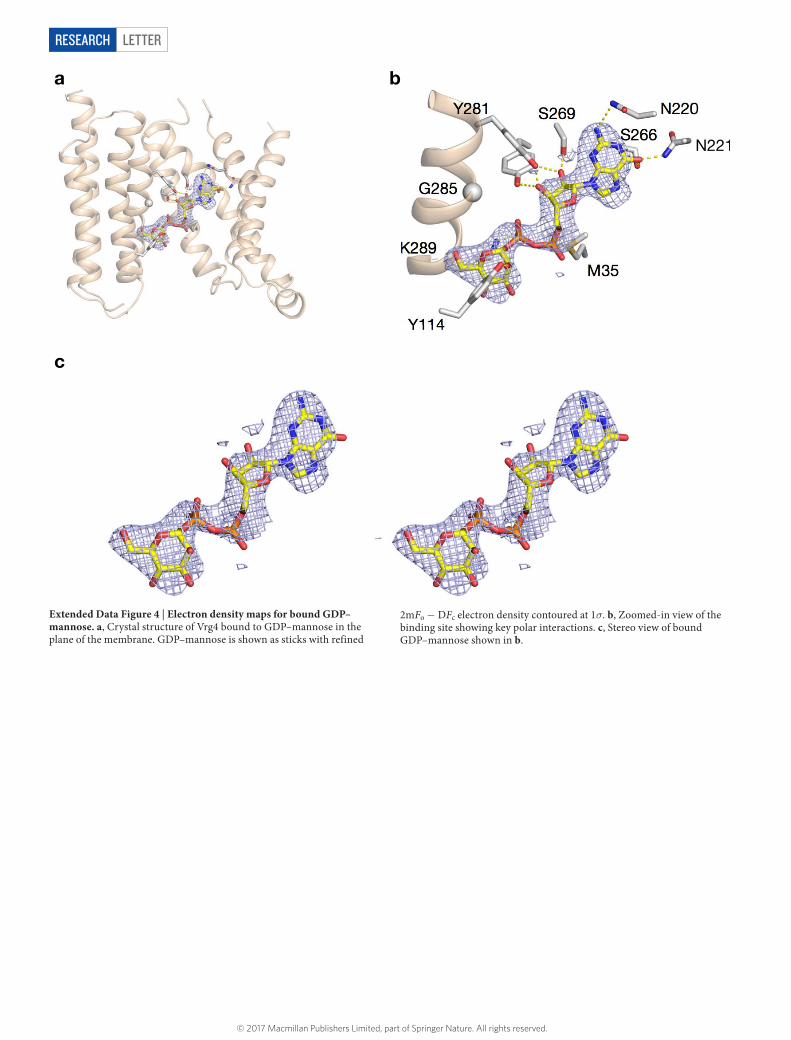
Extended Data Figure 4 | Electron density maps for bound GDP–mannose. a, Crystal structure of Vrg4 bound to GDP–mannose in the plane of the membrane. GDP–mannose is shown as sticks with refined
2mFo − DFc electron density contoured at 1σ. b, Zoomed-in view of the binding site showing key polar interactions. c, Stereo view of bound GDP–mannose shown in b.
© 2017 Macmillan Publishers Limited, part of Springer Nature. All rights reserved.
Letter reSeArCH
NC
5MT4MT3MT TM6
2MT1MT
8MT7MT TM9
TM10
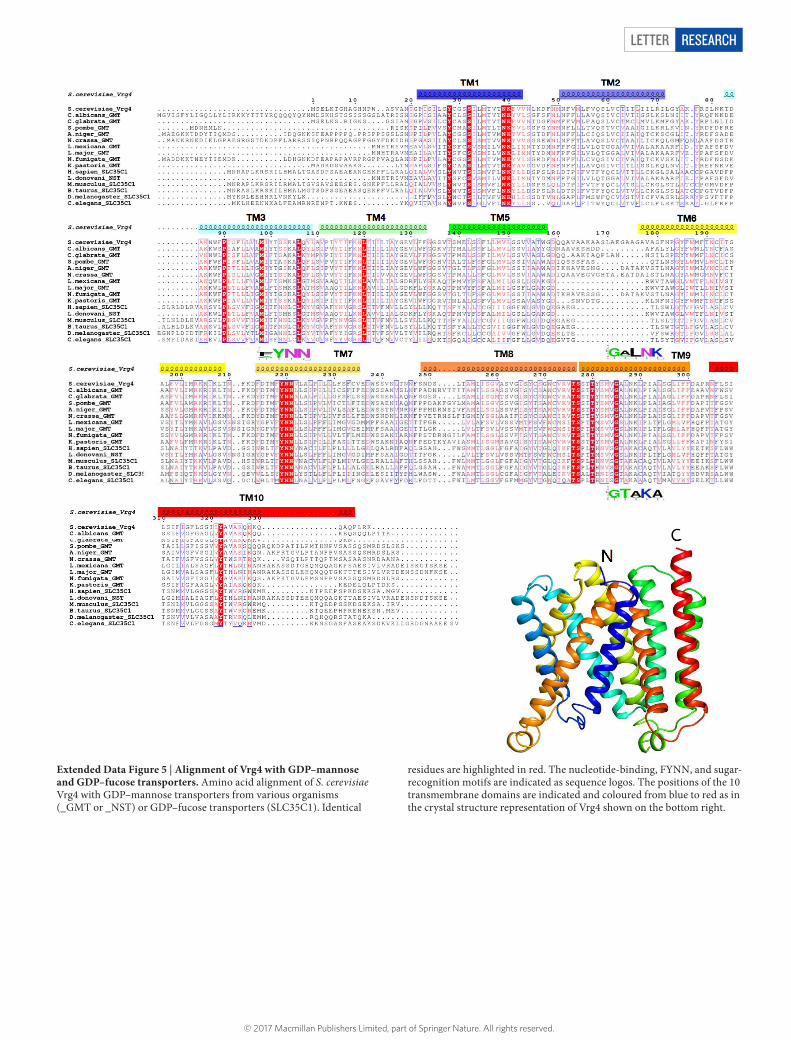
Extended Data Figure 5 | Alignment of Vrg4 with GDP–mannose and GDP–fucose transporters. Amino acid alignment of S. cerevisiae Vrg4 with GDP–mannose transporters from various organisms (_GMT or _NST) or GDP–fucose transporters (SLC35C1). Identical
residues are highlighted in red. The nucleotide-binding, FYNN, and sugar-recognition motifs are indicated as sequence logos. The positions of the 10 transmembrane domains are indicated and coloured from blue to red as in the crystal structure representation of Vrg4 shown on the bottom right.
© 2017 Macmillan Publishers Limited, part of Springer Nature. All rights reserved.
LetterreSeArCH
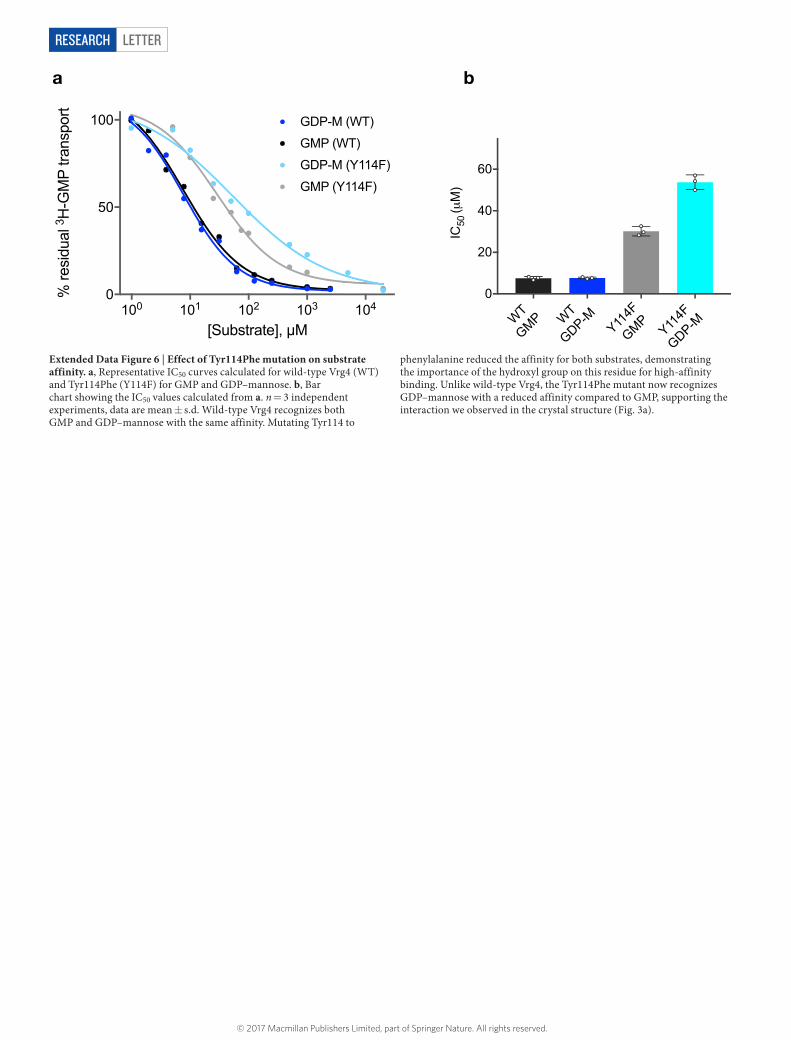
Extended Data Figure 6 | Effect of Tyr114Phe mutation on substrate affinity. a, Representative IC50 curves calculated for wild-type Vrg4 (WT) and Tyr114Phe (Y114F) for GMP and GDP–mannose. b, Bar chart showing the IC50 values calculated from a. n = 3 independent experiments, data are mean ± s.d. Wild-type Vrg4 recognizes both GMP and GDP–mannose with the same affinity. Mutating Tyr114 to
phenylalanine reduced the affinity for both substrates, demonstrating the importance of the hydroxyl group on this residue for high-affinity binding. Unlike wild-type Vrg4, the Tyr114Phe mutant now recognizes GDP–mannose with a reduced affinity compared to GMP, supporting the interaction we observed in the crystal structure (Fig. 3a).
© 2017 Macmillan Publishers Limited, part of Springer Nature. All rights reserved.
Letter reSeArCH
Extended Data Figure 7 | See next page for caption.
© 2017 Macmillan Publishers Limited, part of Springer Nature. All rights reserved.
LetterreSeArCH
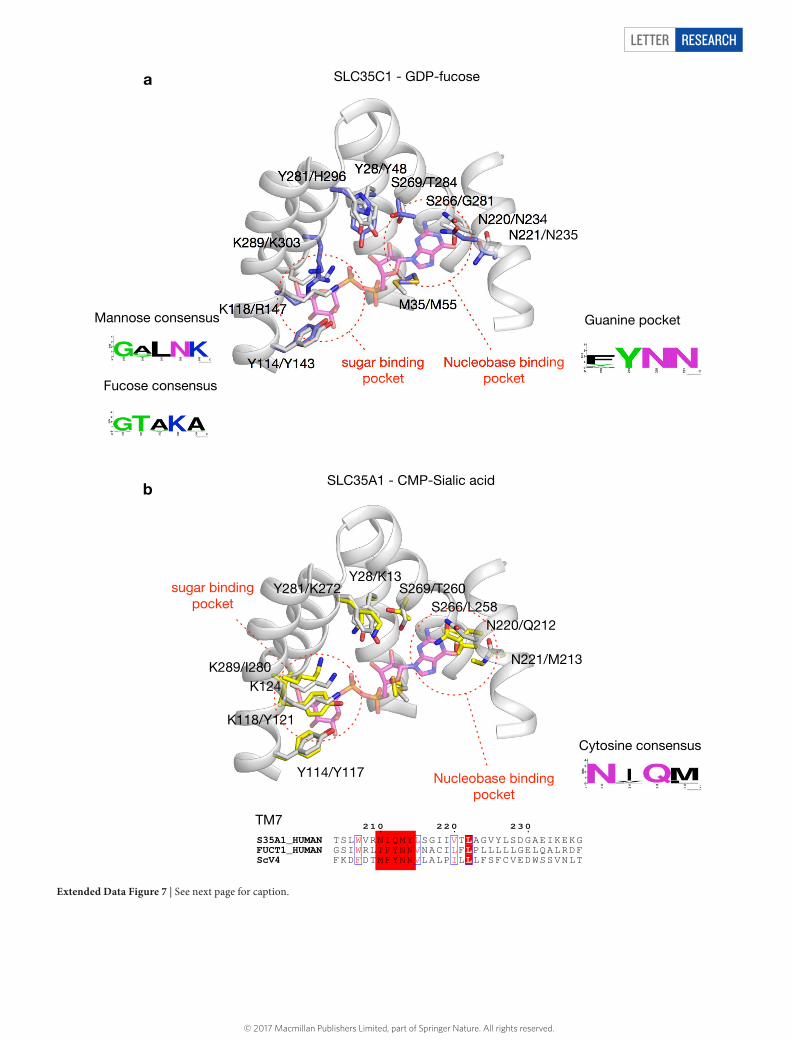
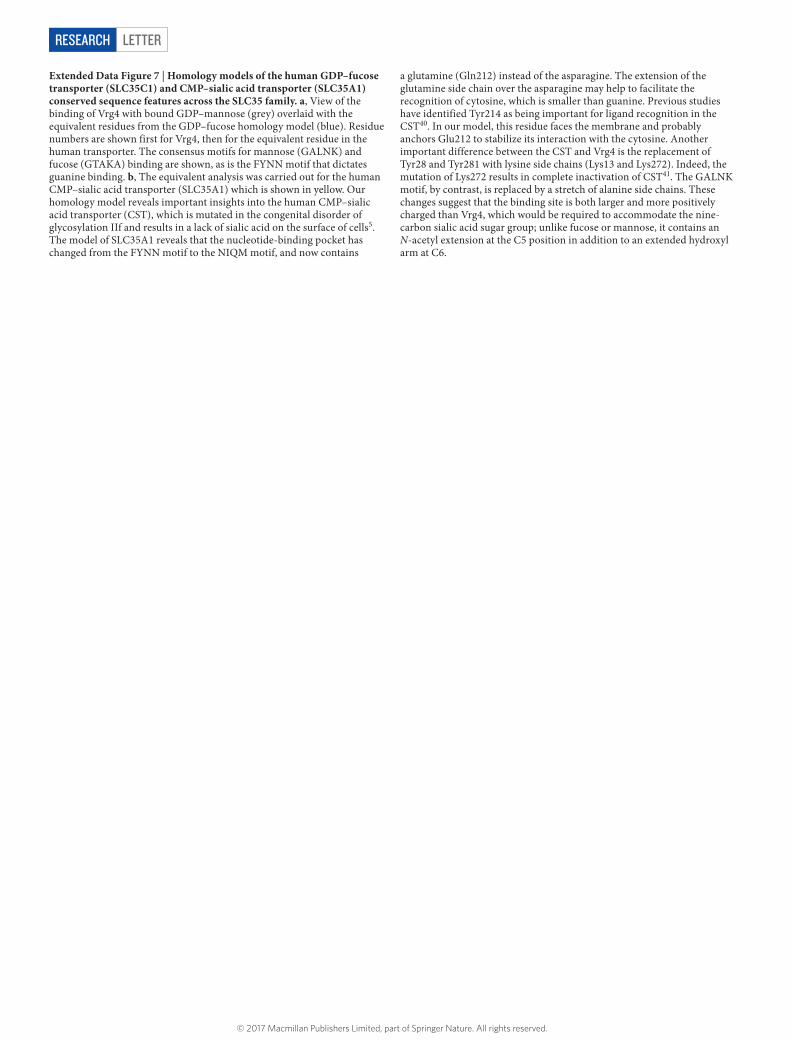
Extended Data Figure 7 | Homology models of the human GDP–fucose transporter (SLC35C1) and CMP–sialic acid transporter (SLC35A1) conserved sequence features across the SLC35 family. a, View of the binding of Vrg4 with bound GDP–mannose (grey) overlaid with the equivalent residues from the GDP–fucose homology model (blue). Residue numbers are shown first for Vrg4, then for the equivalent residue in the human transporter. The consensus motifs for mannose (GALNK) and fucose (GTAKA) binding are shown, as is the FYNN motif that dictates guanine binding. b, The equivalent analysis was carried out for the human CMP–sialic acid transporter (SLC35A1) which is shown in yellow. Our homology model reveals important insights into the human CMP–sialic acid transporter (CST), which is mutated in the congenital disorder of glycosylation IIf and results in a lack of sialic acid on the surface of cells5. The model of SLC35A1 reveals that the nucleotide-binding pocket has changed from the FYNN motif to the NIQM motif, and now contains
a glutamine (Gln212) instead of the asparagine. The extension of the glutamine side chain over the asparagine may help to facilitate the recognition of cytosine, which is smaller than guanine. Previous studies have identified Tyr214 as being important for ligand recognition in the CST40. In our model, this residue faces the membrane and probably anchors Glu212 to stabilize its interaction with the cytosine. Another important difference between the CST and Vrg4 is the replacement of Tyr28 and Tyr281 with lysine side chains (Lys13 and Lys272). Indeed, the mutation of Lys272 results in complete inactivation of CST41. The GALNK motif, by contrast, is replaced by a stretch of alanine side chains. These changes suggest that the binding site is both larger and more positively charged than Vrg4, which would be required to accommodate the nine-carbon sialic acid sugar group; unlike fucose or mannose, it contains an N-acetyl extension at the C5 position in addition to an extended hydroxyl arm at C6.
© 2017 Macmillan Publishers Limited, part of Springer Nature. All rights reserved.
Letter reSeArCH
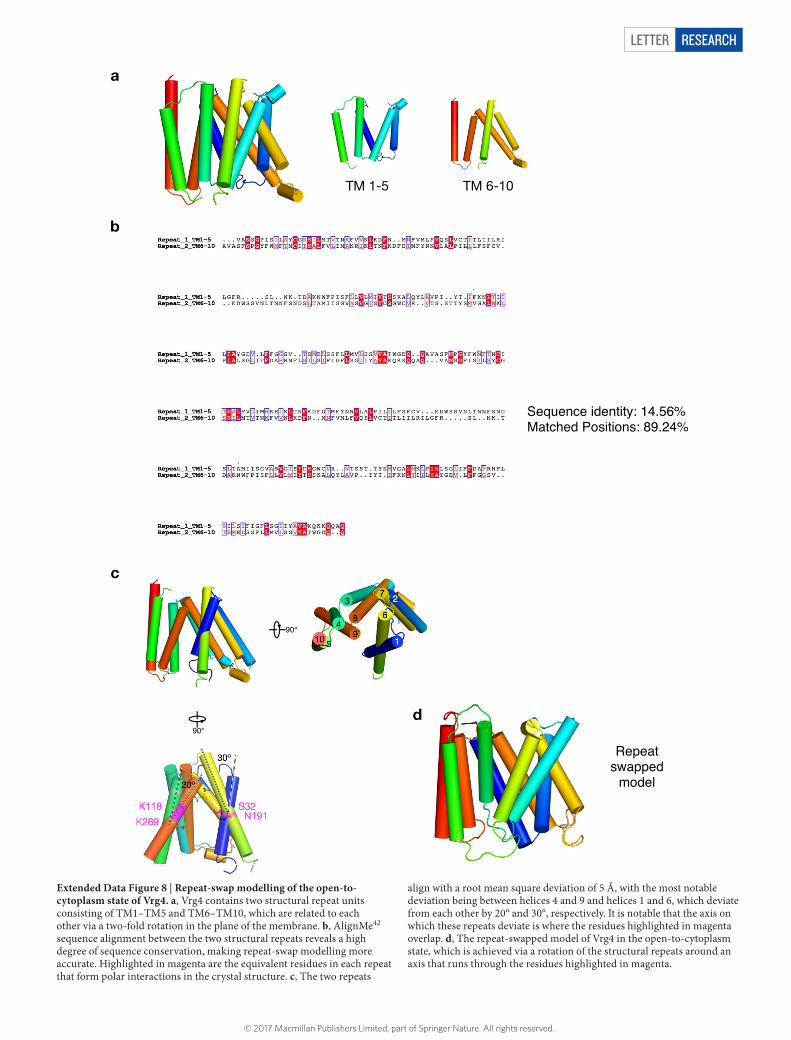
Extended Data Figure 8 | Repeat-swap modelling of the open-to-cytoplasm state of Vrg4. a, Vrg4 contains two structural repeat units consisting of TM1–TM5 and TM6–TM10, which are related to each other via a two-fold rotation in the plane of the membrane. b, AlignMe42 sequence alignment between the two structural repeats reveals a high degree of sequence conservation, making repeat-swap modelling more accurate. Highlighted in magenta are the equivalent residues in each repeat that form polar interactions in the crystal structure. c, The two repeats
align with a root mean square deviation of 5 Å, with the most notable deviation being between helices 4 and 9 and helices 1 and 6, which deviate from each other by 20° and 30°, respectively. It is notable that the axis on which these repeats deviate is where the residues highlighted in magenta overlap. d, The repeat-swapped model of Vrg4 in the open-to-cytoplasm state, which is achieved via a rotation of the structural repeats around an axis that runs through the residues highlighted in magenta.
© 2017 Macmillan Publishers Limited, part of Springer Nature. All rights reserved.
LetterreSeArCH
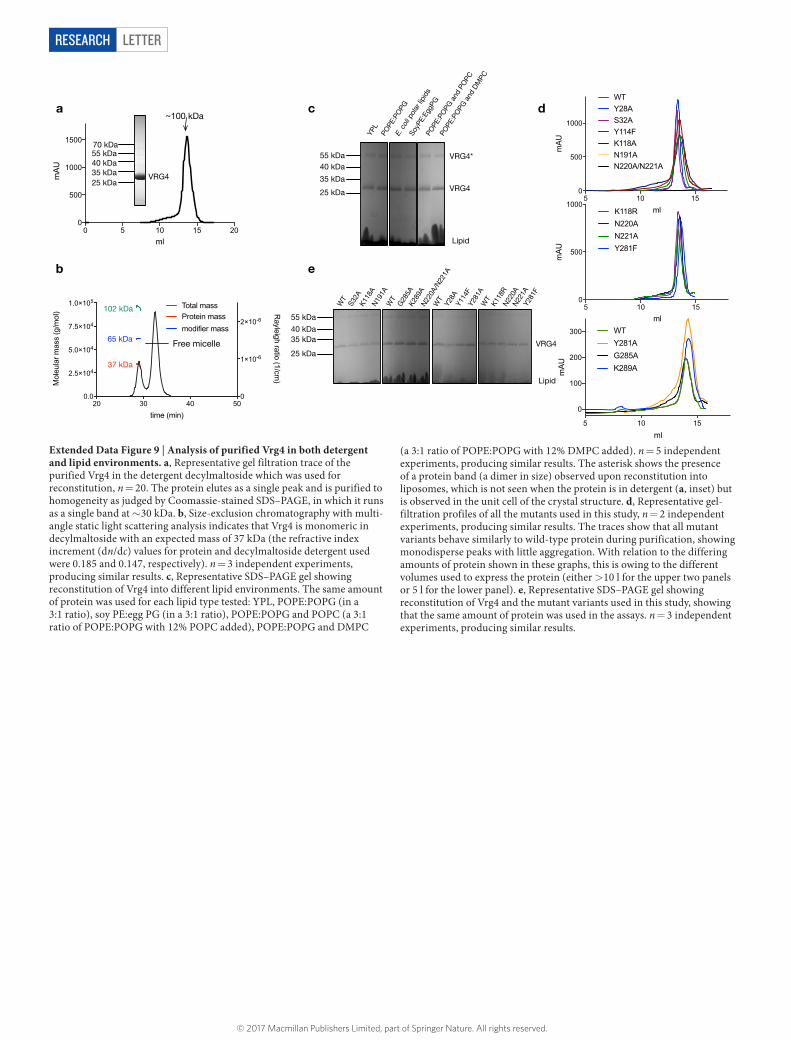
Extended Data Figure 9 | Analysis of purified Vrg4 in both detergent and lipid environments. a, Representative gel filtration trace of the purified Vrg4 in the detergent decylmaltoside which was used for reconstitution, n = 20. The protein elutes as a single peak and is purified to homogeneity as judged by Coomassie-stained SDS–PAGE, in which it runs as a single band at ~ 30 kDa. b, Size-exclusion chromatography with multi-angle static light scattering analysis indicates that Vrg4 is monomeric in decylmaltoside with an expected mass of 37 kDa (the refractive index increment (dn/dc) values for protein and decylmaltoside detergent used were 0.185 and 0.147, respectively). n = 3 independent experiments, producing similar results. c, Representative SDS–PAGE gel showing reconstitution of Vrg4 into different lipid environments. The same amount of protein was used for each lipid type tested: YPL, POPE:POPG (in a 3:1 ratio), soy PE:egg PG (in a 3:1 ratio), POPE:POPG and POPC (a 3:1 ratio of POPE:POPG with 12% POPC added), POPE:POPG and DMPC
(a 3:1 ratio of POPE:POPG with 12% DMPC added). n = 5 independent experiments, producing similar results. The asterisk shows the presence of a protein band (a dimer in size) observed upon reconstitution into liposomes, which is not seen when the protein is in detergent (a, inset) but is observed in the unit cell of the crystal structure. d, Representative gel-filtration profiles of all the mutants used in this study, n = 2 independent experiments, producing similar results. The traces show that all mutant variants behave similarly to wild-type protein during purification, showing monodisperse peaks with little aggregation. With relation to the differing amounts of protein shown in these graphs, this is owing to the different volumes used to express the protein (either > 10 l for the upper two panels or 5 l for the lower panel). e, Representative SDS–PAGE gel showing reconstitution of Vrg4 and the mutant variants used in this study, showing that the same amount of protein was used in the assays. n = 3 independent experiments, producing similar results.
© 2017 Macmillan Publishers Limited, part of Springer Nature. All rights reserved.
Letter reSeArCH
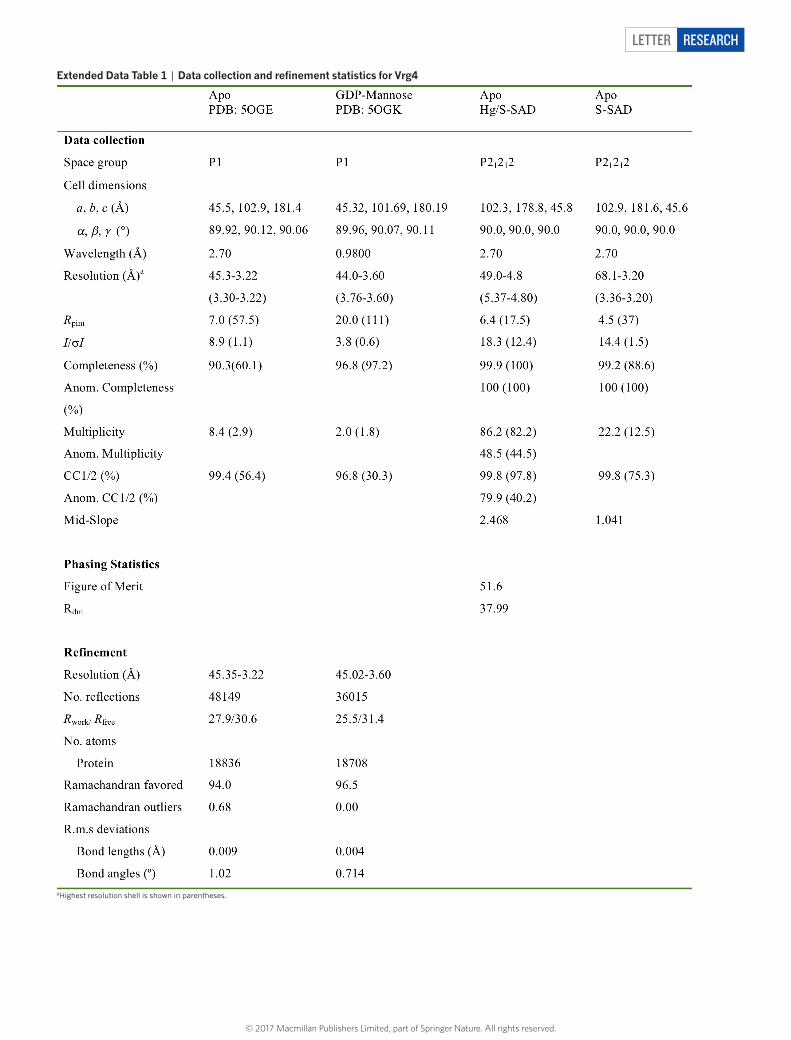
extended data table 1 | data collection and refinement statistics for Vrg4
aHighest resolution shell is shown in parentheses.
© 2017 Macmillan Publishers Limited, part of Springer Nature. All rights reserved.
1
nature research | life sciences reporting summ
aryJune 2017
Corresponding author(s): Simon Newstead
Initial submission Revised version Final submission
Life Sciences Reporting SummaryNature Research wishes to improve the reproducibility of the work that we publish. This form is intended for publication with all accepted life science papers and provides structure for consistency and transparency in reporting. Every life science submission will use this form; some list items might not apply to an individual manuscript, but all fields must be completed for clarity.
For further information on the points included in this form, see Reporting Life Sciences Research. For further information on Nature Research policies, including our data availability policy, see Authors & Referees and the Editorial Policy Checklist.
Experimental design1. Sample size
Describe how sample size was determined. Sample sizes were either triplicate or quadruplicate to ascertain accurate values for the data shown. Statistical methods were not used to determine sample size, but were used to calculate standard deviations.
2. Data exclusions
Describe any data exclusions. No data were excluded.
3. Replication
Describe whether the experimental findings were reliably reproduced.
All biochemical assays were repeated a minimum of three times and were reproducible.
4. Randomization
Describe how samples/organisms/participants were allocated into experimental groups.
Samples were not randomized for the experiments as this was not applicable for the biochemical assays described in our study.
5. Blinding
Describe whether the investigators were blinded to group allocation during data collection and/or analysis.
No blinding was applied to the data generated in our study, as this is not applicable to the types of biochemical or structural data generated.
Note: all studies involving animals and/or human research participants must disclose whether blinding and randomization were used.
6. Statistical parameters For all figures and tables that use statistical methods, confirm that the following items are present in relevant figure legends (or in the Methods section if additional space is needed).
n/a Confirmed
The exact sample size (n) for each experimental group/condition, given as a discrete number and unit of measurement (animals, litters, cultures, etc.)
A description of how samples were collected, noting whether measurements were taken from distinct samples or whether the same sample was measured repeatedly
A statement indicating how many times each experiment was replicated
The statistical test(s) used and whether they are one- or two-sided (note: only common tests should be described solely by name; more complex techniques should be described in the Methods section)
A description of any assumptions or corrections, such as an adjustment for multiple comparisons
The test results (e.g. P values) given as exact values whenever possible and with confidence intervals noted
A clear description of statistics including central tendency (e.g. median, mean) and variation (e.g. standard deviation, interquartile range)
Clearly defined error bars
See the web collection on statistics for biologists for further resources and guidance.
2
nature research | life sciences reporting summ
aryJune 2017
SoftwarePolicy information about availability of computer code
7. Software
Describe the software used to analyze the data in this study.
Prism 7 - for data plotting and analysis ChemDraw Professional 10 - for chemical structure drawing CCP4 v7 - Crystallographic software suite Phenix 1.11.1-2575 - Crystallographic software suite PDBePisa - online tool for oligomeric state prediction PyMol - Molecular graphics software XDS - Diffraction data processing package O - Crystallographic model building Coot - Crystallographic model building Buster - Crystallographic model refinement program
For manuscripts utilizing custom algorithms or software that are central to the paper but not yet described in the published literature, software must be made available to editors and reviewers upon request. We strongly encourage code deposition in a community repository (e.g. GitHub). Nature Methods guidance for providing algorithms and software for publication provides further information on this topic.
Materials and reagentsPolicy information about availability of materials
8. Materials availability
Indicate whether there are restrictions on availability of unique materials or if these materials are only available for distribution by a for-profit company.
No restrictions apply to the materials used in this study. WT plasmid has been deposited in Addgene, plasmid ID 102334.
9. Antibodies
Describe the antibodies used and how they were validated for use in the system under study (i.e. assay and species).
No antibodies were used.
10. Eukaryotic cell linesa. State the source of each eukaryotic cell line used. No Eukaryotic cell lines were used.
b. Describe the method of cell line authentication used. N/A
c. Report whether the cell lines were tested for mycoplasma contamination.
N/A
d. If any of the cell lines used are listed in the database of commonly misidentified cell lines maintained by ICLAC, provide a scientific rationale for their use.
N/A
Animals and human research participantsPolicy information about studies involving animals; when reporting animal research, follow the ARRIVE guidelines
11. Description of research animalsProvide details on animals and/or animal-derived materials used in the study.
No animals were used in this study.
Policy information about studies involving human research participants
12. Description of human research participantsDescribe the covariate-relevant population characteristics of the human research participants.
The study did not involve human research participants.