Embed Size (px)
Citation preview
June 2013 ❙ StRuCtuRAl DYNAmICS of BElgIum’S foREIgN tRADE ❙ 27
Structural dynamics of Belgium’s foreign trade
E. dhynec. duprez
Introduction
the liberalisation of trade and financial transactions, the reduction in transport costs, and the progress made in information and communication technologies have led to a fundamental change in the international environment. Economies have become much more closely intercon-nected, with the result that international trade in goods and services has intensified. In that context, the types of goods and services traded have diversified and the list of trading partners has been extended.
this article describes the structural dynamics of Belgian foreign trade from 1995 to 2011 (1). the aim is twofold : to assess the structural changes of the past fifteen years and to conduct an initial analysis of the recent crisis period. the study begins with a macroeconomic approach based on examination of the aggregates traditionally used to assess the external competitiveness of an economy ; after that, it examines microeconomic data which permit a more refined analysis of the dynamics at firm level.
1. macroeconomic analysis
Since the balance on current account gives a consolidated picture of the economy, it is a relevant indicator for de-tecting any imbalances : a current account deficit means that a country is spending more than it produces. that may be due to domestic imbalances, such as an excessive budget deficit, excessive credit expansion, an overvalued
property market, inappropriate wage increases, etc. Imbalances of this kind become unsustainable in the long run, so they need to be corrected as quickly as possible by a policy aimed at maintaining the balance between production potential and demand from the population. Since currency devaluation is no longer available as a
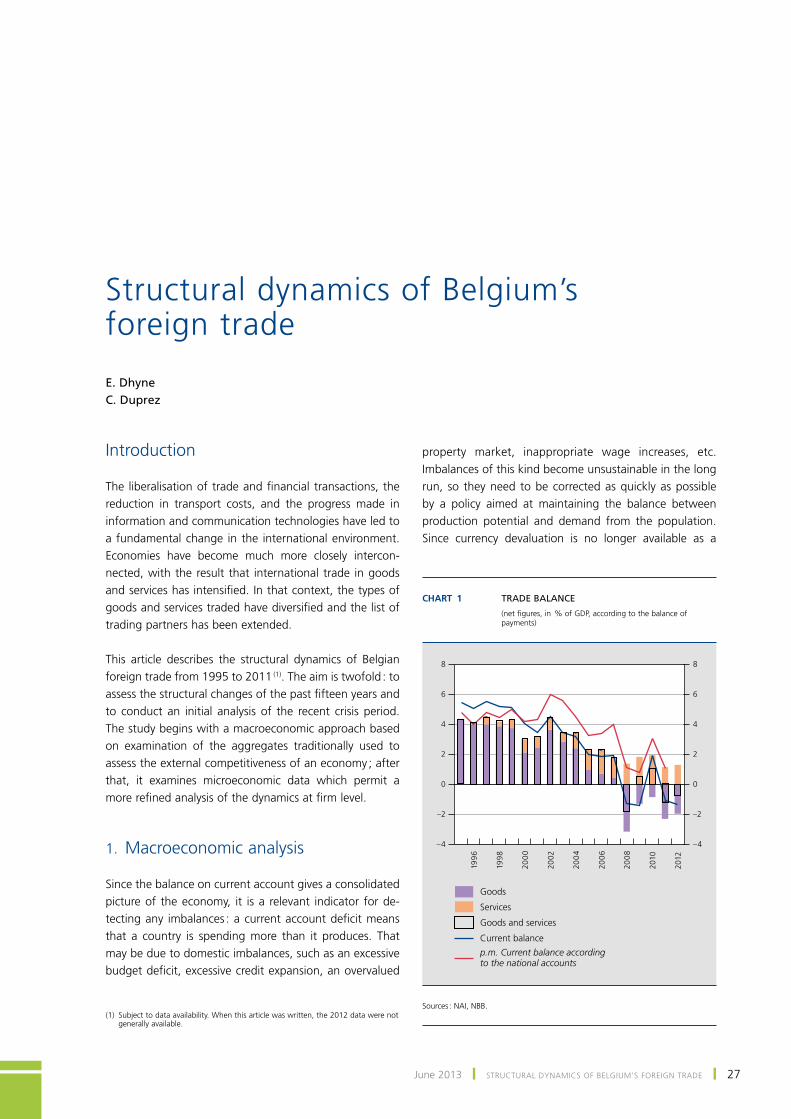
Chart 1 tradE BalancE
(net figures, in % of gDp, according to the balance of payments)
199
6
199
8
200
0
2002
200
4
200
6
200
8
2010
2012
–4
–2
0
2
4
6
8
–4
–2
0
2
4
6
8
Goods
Services
Goods and services
Current balance
p.m. Current balance according to the national accounts
Sources : NAI, NBB.(1) Subject to data availability. When this article was written, the 2012 data were not
generally available.
28 ❙ StRuCtuRAl DYNAmICS of BElgIum’S foREIgN tRADE ❙ NBB Economic Review
lever in a monetary union, the adjustments have to come from changes in the structural operation of the economy. measures of that kind generally have an effect only in the medium or long term, so they need to be implemented promptly.
During the 2000s, Belgium’s balance of current transac-tions with the rest of the world declined slowly but stead-ily, according to the balance of payments figures, primarily as a result of a fall in the balance of trade in goods and services. that balance declined from an average surplus of 4.3 % of gDp in the period 1995-1999 to an average deficit of 0.1 % of gDp in 2009-2012.
However, trade in goods displayed a rather different trend from trade in services. Since the value of trade in goods represents almost 80 % of Belgium’s foreign trade, goods flows are the decisive factor in the fluctuations apparent in the current balance. Conversely, the balance of trade in services has been rising steadily since 1995, though that has not been enough to offset the decline in the balance of trade in goods, so that the trade balance has declined overall.
1.1 Deterioration in the goods balance
In Belgium, the decline in the goods balance is largely attributable to the rise in net imports of energy products, as movements in the balances of other types of goods roughly cancelled one another out. on the one hand, the surplus in chemicals, including pharmaceutical products, expanded between 1995 and 2012. on the other hand, there was a steep decline in the balance in machinery and transport equipment, including road vehicles, and – albeit to a lesser extent – in non-edible commodities. In the former case, the decline reflects Belgium’s reduced specialisation in the car industry, while in the latter case the fall is due to increased use of imported metalliferous inputs. finally, in the ‘mineral fuels’ category, the balance of foreign trade (category SItC-3), comprising oil, natural gas and electricity, deteriorated by € 15.6 billion between 1995 and 2012, causing a similar contraction in the over-all goods result.
If Belgium’s balance of trade in goods is compared with the better figures for germany and the Netherlands, two significant differences emerge. first, the deficit in energy is smaller in the Netherlands than in Belgium. Second, both countries rely on exports of other types of goods to offset that negative balance in energy, particularly the export of means of transport. the Netherlands also benefits from the positive contribution to the trade balance derived from foodstuffs and – as in Belgium’s case – chemicals.
In Belgium, net imports of hydrocarbons mainly concern natural gas, crude oil and petroleum products. these fuels cover the energy needs of the various sectors : household final consumption (heating, transport), support for the production of the industrial sectors (energy source), and inputs in certain industrial processes (manufacture of non-energy products in the petrochemicals sector). Natural gas is also used as a fuel for generating electricity. processing losses occur when crude oil is refined into petroleum products.
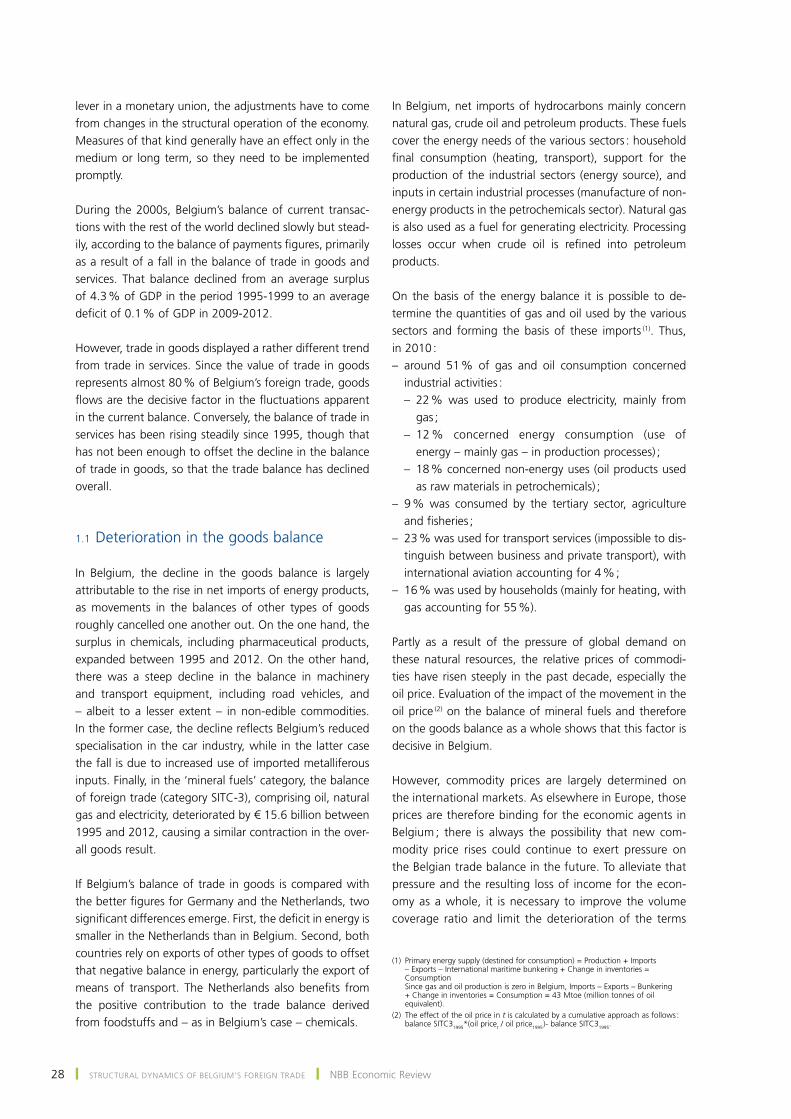
on the basis of the energy balance it is possible to de-termine the quantities of gas and oil used by the various sectors and forming the basis of these imports (1). thus, in 2010 :– around 51 % of gas and oil consumption concerned
industrial activities : – 22 % was used to produce electricity, mainly from
gas ; – 12 % concerned energy consumption (use of
energy – mainly gas – in production processes) ; – 18 % concerned non-energy uses (oil products used
as raw materials in petrochemicals) ;– 9 % was consumed by the tertiary sector, agriculture
and fisheries ;– 23 % was used for transport services (impossible to dis-
tinguish between business and private transport), with international aviation accounting for 4 % ;
– 16 % was used by households (mainly for heating, with gas accounting for 55 %).
partly as a result of the pressure of global demand on these natural resources, the relative prices of commodi-ties have risen steeply in the past decade, especially the oil price. Evaluation of the impact of the movement in the oil price (2) on the balance of mineral fuels and therefore on the goods balance as a whole shows that this factor is decisive in Belgium.
However, commodity prices are largely determined on the international markets. As elsewhere in Europe, those prices are therefore binding for the economic agents in Belgium ; there is always the possibility that new com-modity price rises could continue to exert pressure on the Belgian trade balance in the future. to alleviate that pressure and the resulting loss of income for the econ-omy as a whole, it is necessary to improve the volume coverage ratio and limit the deterioration of the terms
(1) primary energy supply (destined for consumption) = production + Imports – Exports – International maritime bunkering + Change in inventories = Consumption Since gas and oil production is zero in Belgium, Imports – Exports – Bunkering + Change in inventories = Consumption = 43 mtoe (million tonnes of oil equivalent).
(2) the effect of the oil price in t is calculated by a cumulative approach as follows : balance SItC31995*(oil pricet / oil price1995 )- balance SItC31995.
June 2013 ❙ StRuCtuRAl DYNAmICS of BElgIum’S foREIgN tRADE ❙ 29
of trade. to that end, export prices need to keep in step with import prices but without detriment to the volume of exports.
this ability to adjust export prices upwards depends in particular on the type of products exported : in general, producers of highly standardised products have far less room for manoeuvre. In the case of such products, there is potential surplus supply, since it is easy to duplicate production methods. moreover, since commodities are also used as inputs in the production of goods and ser-vices destined for export, rising commodity prices weaken Belgian producers, who also face fairly high costs in the domestic production factors. these problems are less pronounced in the case of producers of goods with a greater knowledge content, because such goods have the advantage of generally differing from those produced by competing suppliers.
there are various indicators which can be used indirectly to obtain an idea of the knowledge content of export goods. for example, on the basis of R&D expenditure and innovation rates for both processes and products or marketing, Belgium scores relatively poorly compared to germany, the Netherlands and france, though it out-performs the average for the Eu. these low innovation rates are also reflected in a smaller number of patents per million inhabitants, compared to the three neighbour-ing countries. Another decisive factor concerns entrepre-neurship. It seems that the percentage of young or future entrepreneurs in the Belgian population is lower than in neighbouring countries and below the Eu average.
Chart 2 nEt imports of minEral fuEls
199
6
199
8
200
0
2002
200
4
200
6
200
8
2010
2012
–25
–20
–15
–10
–5
0
5
100
80
60
40
20
0
–20
22%
12%
18%9%
19%
4%
16%
Processing input, distribution losses and energy sector’s own consumption
Final energy consumption by industry
Non-energy final consumption (feedstocks)
Energy consumption by the tertiary sector, agriculture and fisheries
Domestic transport (private and business)
p.m. Change in the goods balance
Change in the balance of the mineral fuels category
Effect of the oil price (2)
Change in the price of Brent crude per barrel (in €, right-hand scale, inverted)
EFFECT OF THE OIL PRICE(cumulative change compared to 1995 (1), in € billion, unless otherwise stated)
International aviation
Household energy consumption (heating)
BREAKDOWN OF CONSUMPTION OF GAS, CRUDE OIL AND PETROLEUM PRODUCTS(based on quantities from the energy balance sheet, in % of the total)
Sources : IEA, NAI, NBB.(1) Data according to the national concept.(2) the effect of the oil price in t is calculated as follows : balance SItC-31995* (oil pricet / oil price1995 ) – balance SItC-31995.
30 ❙ StRuCtuRAl DYNAmICS of BElgIum’S foREIgN tRADE ❙ NBB Economic Review
1.2 overall results for goods exports
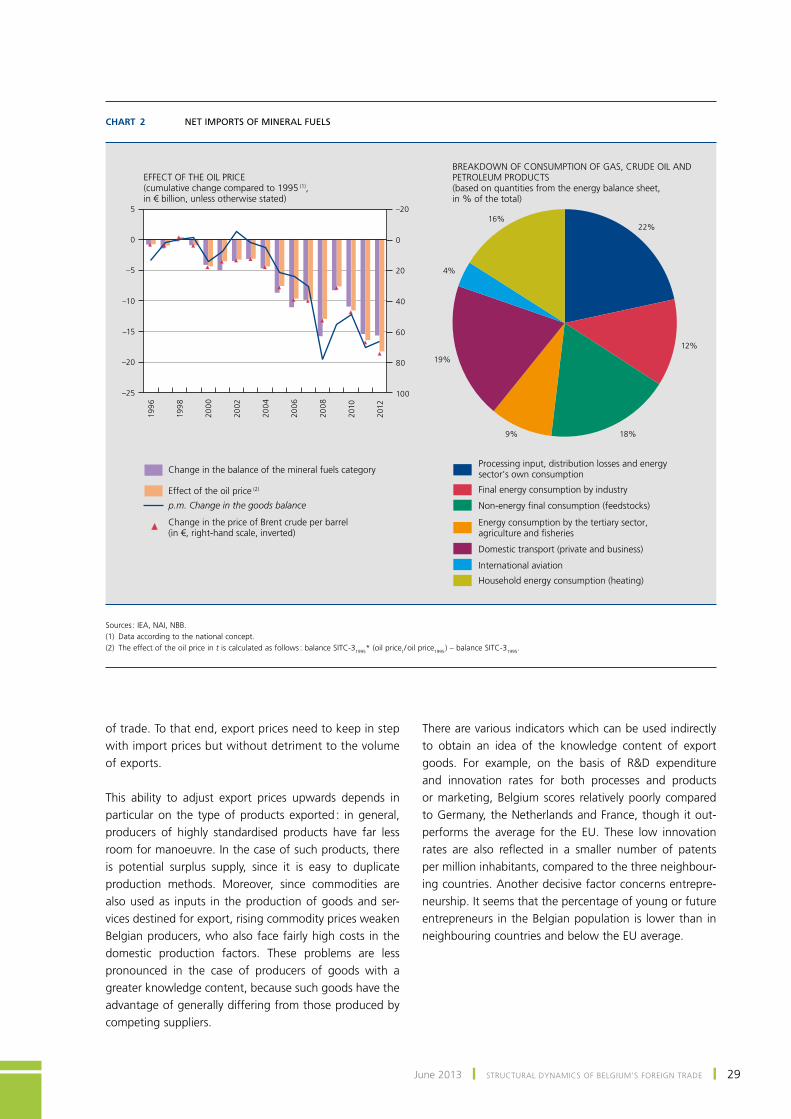
In all, the trade balance has contracted owing to a lack of dynamism in the value of Belgian goods exports. that is also evident from the difference between the growth of the trading partners’ imports and the expansion of Belgium’s exports of goods, indicating a steady loss of export market shares. Although Belgium’s specific geographical markets did not keep pace with the average 7.8 % per annum growth of world trade as a whole (since Belgian exporters, on average, still focus insufficiently on the fast-growing emerging markets), between 1995 and 2011 they nonetheless expanded by an average of 7.1 % a year (1). that growth was similar to that of the specific geographical markets for a number of European coun-tries. However, with an average year-on-year increase of 4.8 %, Belgian exports were less vigorous, so that the loss of market share averaged 2.2 % per annum. Examination of the Belgian export figures on each of the 20 princi-pal markets individually (2) reveals that Belgium is losing
market share overall, except in Hong Kong, but that is the least important market.
Similarly, while the average year-on-year growth of de-mand for Belgian exports, at 7.5 %, failed to keep pace with total world demand, it remained robust compared to that for a selection of European countries (3). Since Belgium’s geographical markets expanded by 7.1 %, Belgium’s slight disadvantage has more to do with the geographical destination of its exports rather than the type of products exported. Since demand for the latter was rel-atively dynamic, the gap in relation to exports was wider, so that Belgium lost market shares averaging 2.6 % a year.
Chart 3 gains / lossEs of markEt sharEs of thE principal ExportErs
(goods (1), in value, annual average %, 1995-2011, unless otherwise stated)
F
F
FF
F
FF
F
F
F FF
FF
F–6
–4
–2
0
2
4
6
8
10
12
14
–6
–4
–2
0
2
4
6
8
10
12
14
Chi
na
Russ
ia
Mex
ico
Kor
ea
Taiw
an
Net
herl
ands
Ger
man
y
Can
ada
Ital
y
Belg
ium
Uni
ted
Stat
es
Fran
ce
Uni
ted
Kin
gdom
Japa
n
Twel
ve n
ewEU
Mem
ber
Stat
es
Change in the share of total exports to Belgium’s main markets (2)
Change in share of world exports
Change in share of GDP in global GDP
p.m. Share in 2011 in total exports to Belgium’s main markets
12.7 2.8 4.3 2.6 3.0 2.2 2.9 8.8 3.2 3.0 2.3 6.5 3.5 2.8 4.2
F
x.x
Sources : uNCtAD, Imf, NAI.(1) Data according to the national concept for Belgium.(2) the 30 main markets in order of importance in Belgium’s exports between 1995 and 2011.
(1) the percentage change in the geographical markets is calculated as follows : the movement in imports in euros of ± 240 trading partners is weighted on the basis of the geographical structure of Belgian exports of goods. the markets in t are calculated according to the geographical structure in t–1.
(2) In order of importance : DE, fR, Nl, uK, It, uS, ES, lu, IN, CH, SE, Il, pl, CN, At, tR, Jp, Ru, DK and HK.
(3) the percentage change in markets by product is calculated as follows : the movement in global imports in euros of ± 260 products in the SItC nomenclature is weighted on the basis of the production structure of Belgian goods exports. the markets in t are calculated according to the product structure in t–1.
June 2013 ❙ StRuCtuRAl DYNAmICS of BElgIum’S foREIgN tRADE ❙ 31
An international comparison shows that the Netherlands and germany have suffered smaller losses of market share on the principal markets for Belgian exporters (1), whereas france (2), the united Kingdom and Japan have experi-enced heavier losses. generally speaking, most economies which have long been active in international trade, includ-ing Belgium, have lost ground. Conversely, the emerging economies, and particularly China, Russia and the new Eu member States, have conquered market shares. However, these developments are in line with a more general ten-dency towards increasing integration of those economies in global production.
1.3 Developments concerning service exports
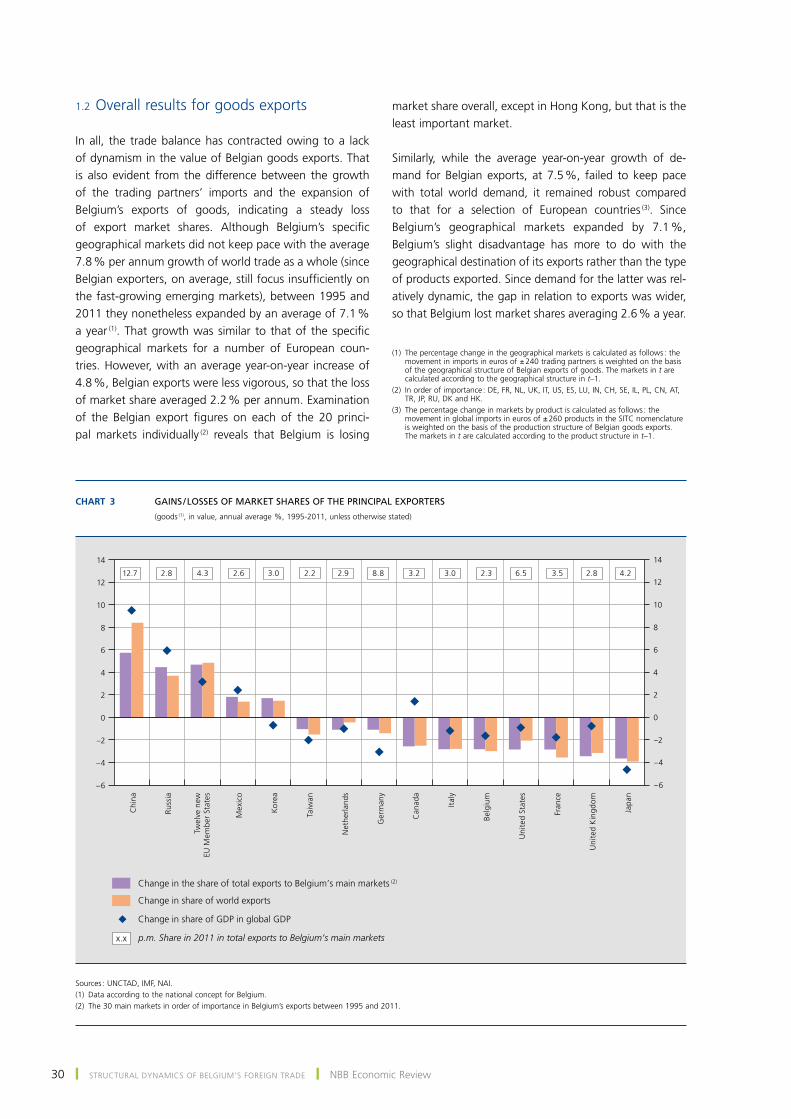
Although this movement was not enough to offset the sharp fall in net exports of goods, the balance of trade in services has risen steadily since 1995 : Belgium’s good performance in that respect was attributable to dynamic exports rather than weak imports. A comparison with the other euro area countries shows that Belgium has one of the highest proportions of services flows in its gDp. While
the share of Belgian goods exports in world trade de-clined sharply in terms of value, dropping by over a third between 1995 and 2012, the corresponding share for services remained constant at around 2.3 %. During the same period, germany’s share of global service exports remained steady at around 6.5 %, whereas it declined from 6.9 % to 5 % in france and from 3.7 % to 2.5 % in the Netherlands.
Belgium’s central position in the European economic structure is one of the main factors underlying this good performance in regard to the export trade in services (Duprez, 2011). for one thing, Belgium can rely on its net exports of services to the international and European in-stitutions based there (3), and on the activities which those exports generate, particularly at the level of multinational
(1) the aforesaid 20 countries are taken into consideration here, plus pt, CZ, IE, El, fI, BR, Hu, AE, CA and No.
(2) It should be noted that, whereas goods transit makes up a large part of the export flows of the Netherlands and germany (particularly via the ports of Rotterdam and Hamburg), that share seems to be small in the case of france.
(3) It should be noted that, where the type of service provided permits, part of the services to institutions is not included in the government services category but is attributed to specific service categories so that the specialisation in that sphere is calculated a minima for each country.
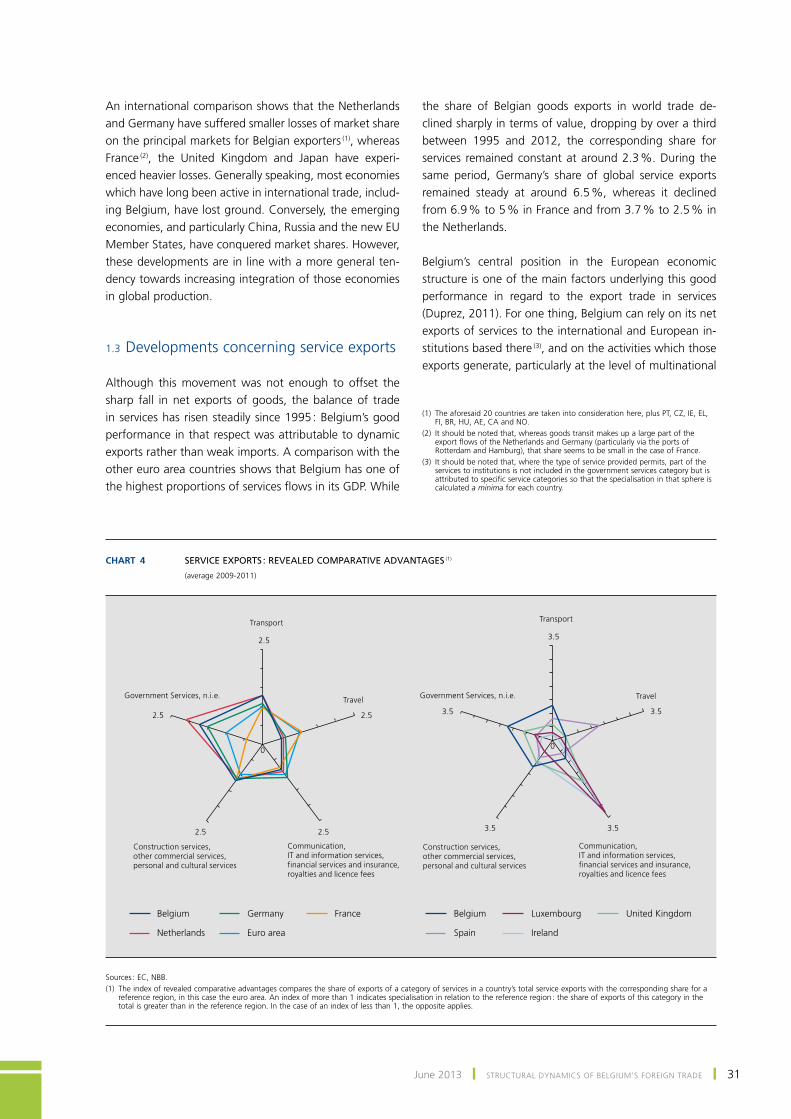
Chart 4 sErVicE Exports : rEVEalEd comparatiVE adVantagEs (1)
(average 2009-2011)
0 0
2.5
2.5
2.52.5
2.5
Transport
Travel
Communication, IT and information services, financial services and insurance, royalties and licence fees
Construction services, other commercial services, personal and cultural services
Government Services, n.i.e.
3.5
3.5
3.53.5
3.5
Transport
Travel
Communication, IT and information services, financial services and insurance, royalties and licence fees
Government Services, n.i.e.
Belgium Germany France
Netherlands Euro area
Belgium Luxembourg United Kingdom
Spain Ireland
Construction services, other commercial services, personal and cultural services
Sources : EC, NBB.(1) the index of revealed comparative advantages compares the share of exports of a category of services in a country’s total service exports with the corresponding share for a
reference region, in this case the euro area. An index of more than 1 indicates specialisation in relation to the reference region : the share of exports of this category in the total is greater than in the reference region. In the case of an index of less than 1, the opposite applies.
32 ❙ StRuCtuRAl DYNAmICS of BElgIum’S foREIgN tRADE ❙ NBB Economic Review
companies. Also, this location at the heart of Europe has encouraged an intermediation role, reflected in the de-velopment of services geared to the internationalisation of trade. this has fostered the expansion of transport and logistic services, particularly as a result of the port of Antwerp’s significance in flows of goods.
However, Belgium’s good overall performance in services is not reflected in all categories. In particular, exports of services relating to information and communication tech-nologies have not been particularly buoyant. moreover, the share of services with a strong focus on innovation, such as R&D or the exploitation of patents, remains small. Yet this group of services forms a growth catalyst that could benefit the entire economy.
2. microeconomic analysis of foreign trade
Apart from examination of aggregate trade flows, a more detailed analysis of the population of Belgian firms active on the international markets provides supplementary in-formation about the dynamics of goods exports, particu-larly during the recent crisis.
Such an analysis is based on an extremely detailed infor-mation source covering all transactions by resident firms with the rest of the world per country of destination (for exports) or origin (for imports) and by type of goods. the product classification used is the HS6 classification, which divides exports into more than 5 000 categories (1). As in
the case of the macroeconomic series presented in the previous section, the analysis only considers transactions used for the compilation of the foreign trade statistics according to the national concept, i.e. excluding transit flows and part of the quasi-transit flows. these data are obtained either from customs declarations, in the case of extra-Community trade, or from Intrastat declarations for intra-Community trade. firms were only taken into account if their exports to the Eu exceeded € 1 million at 2006 prices or if their extra-Community exports repre-sented at least € 100 000 at 2006 prices (2).
following a clean-up of the transaction data and applica-tion of the criteria defined above, the data taken into account cover between 82 and 92 % of Belgium’s exports and imports of goods according to the national concept.
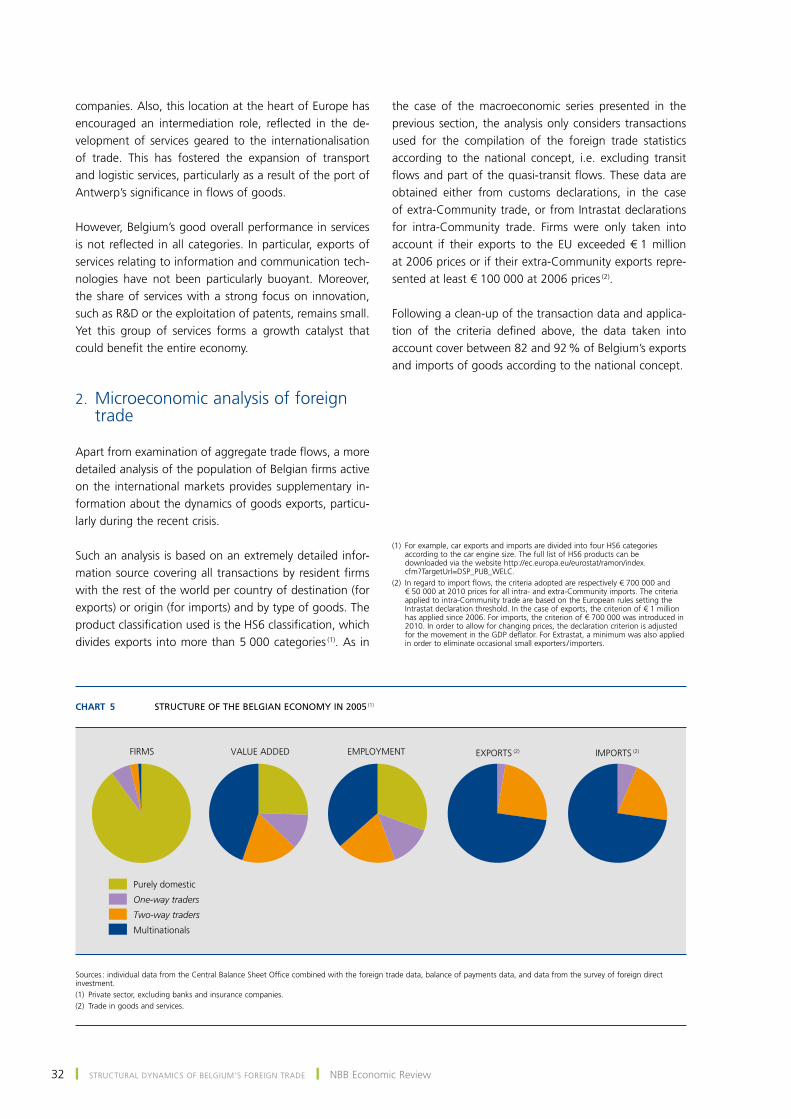
Chart 5 structurE of thE BElgian Economy in 2005 (1)
FIRMS
Purely domestic
One-way traders
Two-way traders
Multinationals
VALUE ADDED EMPLOYMENT EXPORTS (2) IMPORTS (2)
Sources : individual data from the Central Balance Sheet office combined with the foreign trade data, balance of payments data, and data from the survey of foreign direct investment.(1) private sector, excluding banks and insurance companies.(2) trade in goods and services.
(1) for example, car exports and imports are divided into four HS6 categories according to the car engine size. the full list of HS6 products can be downloaded via the website http://ec.europa.eu/eurostat/ramon/index.cfm?targeturl=DSp_puB_WElC.
(2) In regard to import flows, the criteria adopted are respectively € 700 000 and € 50 000 at 2010 prices for all intra- and extra-Community imports. the criteria applied to intra-Community trade are based on the European rules setting the Intrastat declaration threshold. In the case of exports, the criterion of € 1 million has applied since 2006. for imports, the criterion of € 700 000 was introduced in 2010. In order to allow for changing prices, the declaration criterion is adjusted for the movement in the gDp deflator. for Extrastat, a minimum was also applied in order to eliminate occasional small exporters / importers.
June 2013 ❙ StRuCtuRAl DYNAmICS of BElgIum’S foREIgN tRADE ❙ 33
2.1 Belgian firms in a globalised context
2.1.1 the situation in 2005
By way of introduction to the analysis of the pattern of goods exports, it is first necessary to define the degree to which Belgian firms are integrated into the world economy. for that purpose, in addition to the data on exports and imports of goods, the individual data on ser-vice exports and imports are used, plus the individual data from the survey on inward and outward direct investment. those data indicate all international service transactions for every Belgian firm, and all incoming and outgoing foreign direct investment involving a Belgian firm (as the subsidiary of a foreign group or as the parent company of a multinational). All that information was then combined with the data from the Central Balance Sheet office to de-termine the degree to which Belgian firms are integrated into the world economy.
In 2005, the latest year for which exhaustive data on international trade in services are available, of the 309 550 firms (excluding banks and insurance companies) which filed their annual accounts at the Central Balance Sheet office, 90 % were active only on the Belgian market and did not form part of an international group, 6 % were one-way traders, i.e. either importers or exporters, and 3 % were two-way traders, i.e. engaged in both export and import ; finally, 1 % of them formed part of an inter-national group, either as a subsidiary of a foreign firm or as the parent company of a Belgian multinational.
the number of multinationals active in Belgium is there-fore relatively small (2 979 in 2005). However, they account for almost 45 % of value added and 36 % of jobs in the private sector, excluding banks and insurance companies. multinationals are particularly important for Belgian foreign trade since they account on their own for almost 73 % of exports and imports of goods and services.
these figures illustrate the importance of firms’ external competitiveness for the Belgian economy. though barely 10 % of them are active on the international markets, they generate 75 % of value added and 70 % of jobs in the private sector.
As shown by numerous studies, both international (e.g. Bernard and Jensen, 1995, 1999, 2004, Aw and Hwang, 1995, Bernard, Eaton, Jensen and Kortum, 2003, Bernard, Jensen and Schott, 2005, for the united States, Eaton, Kortum and Kramarz, 2004, for france, and mayer and ottaviano, 2007, for an analysis at European level) and Belgian (muûls and pisu, 2007, Dhyne et al., 2010),
multinationals and, more generally, exporters and import-ers are large companies with higher productivity and better long-term growth prospects than purely domestic firms.
on the basis of the accounting data obtained from the Central Balance Sheet office, almost a third of the multinationals active in 2005 had invested in intangible fixed assets in 2004 or 2005, e.g. in R&D or patents and licences, goodwill or trademarks and similar rights, whereas barely 7 % of purely domestic firms made such investments during the same period.
2.1.2 Belgian exporters – Developments over the period 1995-2011
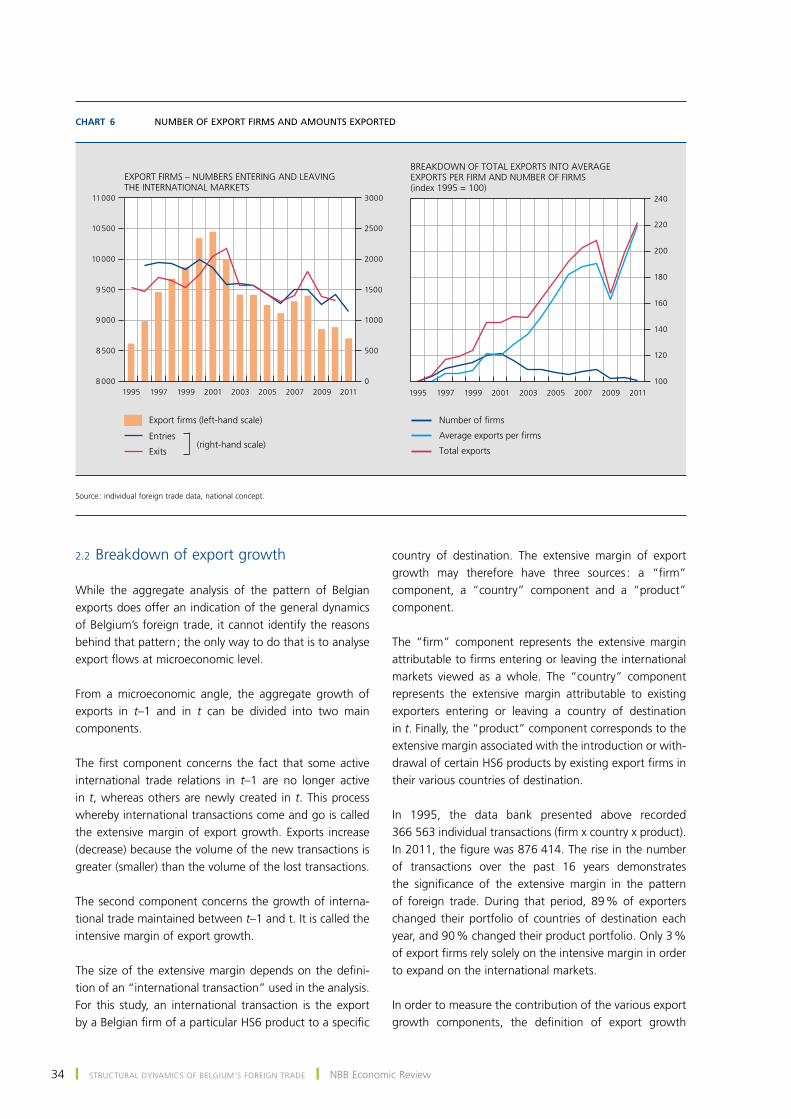
to supplement the static view presented above, an analy-sis of the change in the number of firms exporting goods during the period 1995-2011 reveals a steady decline in the number of exporters from 2002 onwards. While the number of exporters increased from 8 618 to 10 449 in 1995-2001, only 8 703 companies were still exporting goods in 2011. However, this fall in the number of export firms did not lead to a reduction in total Belgian exports, mainly because there was a considerable increase in the average amount of exports per exporter.
However, these net changes mask wide year-on-year variations in firms entering and leaving the interna-tional markets. In fact, from 1995 to 2011, an average of 1 635 firms entered the international markets each year, while 1 604 made their exit. New exporters evidently struggle to maintain their export business for longer than one year. After one year only 60 % of new exporters on the international markets are still exporting, and after five years that is down to 23 %.
Exporters naturally sell various products on different mar-kets. In 1995, the average export firm exported 14.2 HS6 products. During the period considered, the number of export products increased, reaching 22.1 in 2011. In that year, 12 % of exporters dealt in only one HS6 product, and the average exporter served 14 different destina-tions (or four more than in 1995). only 10 % of exporters traded with just one country, and 4 % exported a single product to a single destination.
However, Belgian exports are exceptionally highly con-centrated, with a small number of very large exporters. that high concentration has actually increased in the past 16 years. In 2011, the last percentile of the distribution of exporters (87 firms) accounted for 50 % of Belgian export goods (i.e. € 105 billion), while 80 % of exporters repre-sented only 10 % of the total.
34 ❙ StRuCtuRAl DYNAmICS of BElgIum’S foREIgN tRADE ❙ NBB Economic Review
2.2 Breakdown of export growth
While the aggregate analysis of the pattern of Belgian exports does offer an indication of the general dynamics of Belgium’s foreign trade, it cannot identify the reasons behind that pattern ; the only way to do that is to analyse export flows at microeconomic level.
from a microeconomic angle, the aggregate growth of exports in t–1 and in t can be divided into two main components.
the first component concerns the fact that some active international trade relations in t–1 are no longer active in t, whereas others are newly created in t. this process whereby international transactions come and go is called the extensive margin of export growth. Exports increase (decrease) because the volume of the new transactions is greater (smaller) than the volume of the lost transactions.
the second component concerns the growth of interna-tional trade maintained between t–1 and t. It is called the intensive margin of export growth.
the size of the extensive margin depends on the defini-tion of an “international transaction” used in the analysis. for this study, an international transaction is the export by a Belgian firm of a particular HS6 product to a specific
country of destination. the extensive margin of export growth may therefore have three sources : a “firm” component, a “country” component and a “product” component.
the “firm” component represents the extensive margin attributable to firms entering or leaving the international markets viewed as a whole. the “country” component represents the extensive margin attributable to existing exporters entering or leaving a country of destination in t. finally, the “product” component corresponds to the extensive margin associated with the introduction or with-drawal of certain HS6 products by existing export firms in their various countries of destination.
In 1995, the data bank presented above recorded 366 563 individual transactions (firm x country x product). In 2011, the figure was 876 414. the rise in the number of transactions over the past 16 years demonstrates the significance of the extensive margin in the pattern of foreign trade. During that period, 89 % of exporters changed their portfolio of countries of destination each year, and 90 % changed their product portfolio. only 3 % of export firms rely solely on the intensive margin in order to expand on the international markets.
In order to measure the contribution of the various export growth components, the definition of export growth
Chart 6 numBEr of Export firms and amounts ExportEd
1995 1997 1999 2001 2003 2005 2007 2009 20118 000
8 500
9 000
9 500
10 000
10 500
11 000
0
500
1000
1500
2000
2500
3000
1995 1997 1999 2001 2003 2005 2007 2009 2011100
120
140
160
180
200
220
240
EXPORT FIRMS – NUMBERS ENTERING AND LEAVING THE INTERNATIONAL MARKETS
BREAKDOWN OF TOTAL EXPORTS INTO AVERAGE EXPORTS PER FIRM AND NUMBER OF FIRMS (index 1995 = 100)
Entries
Export firms (left-hand scale)
Exits(right-hand scale)
Number of firms
Average exports per firms
Total exports
Source : individual foreign trade data, national concept.
June 2013 ❙ StRuCtuRAl DYNAmICS of BElgIum’S foREIgN tRADE ❙ 35
between two periods is the one proposed by Davis and Haltiwanger (1992). It can be used to calculate a growth figure relating to the transactions created / destroyed. the figure is calculated by this formula :
where represents the amount of transaction i recorded for year t and is the growth of that transaction be-tween t and t–1. (1)
the aggregate growth is obtained by
where represents the total export amount for year t and is the export growth between t and t–1.
2
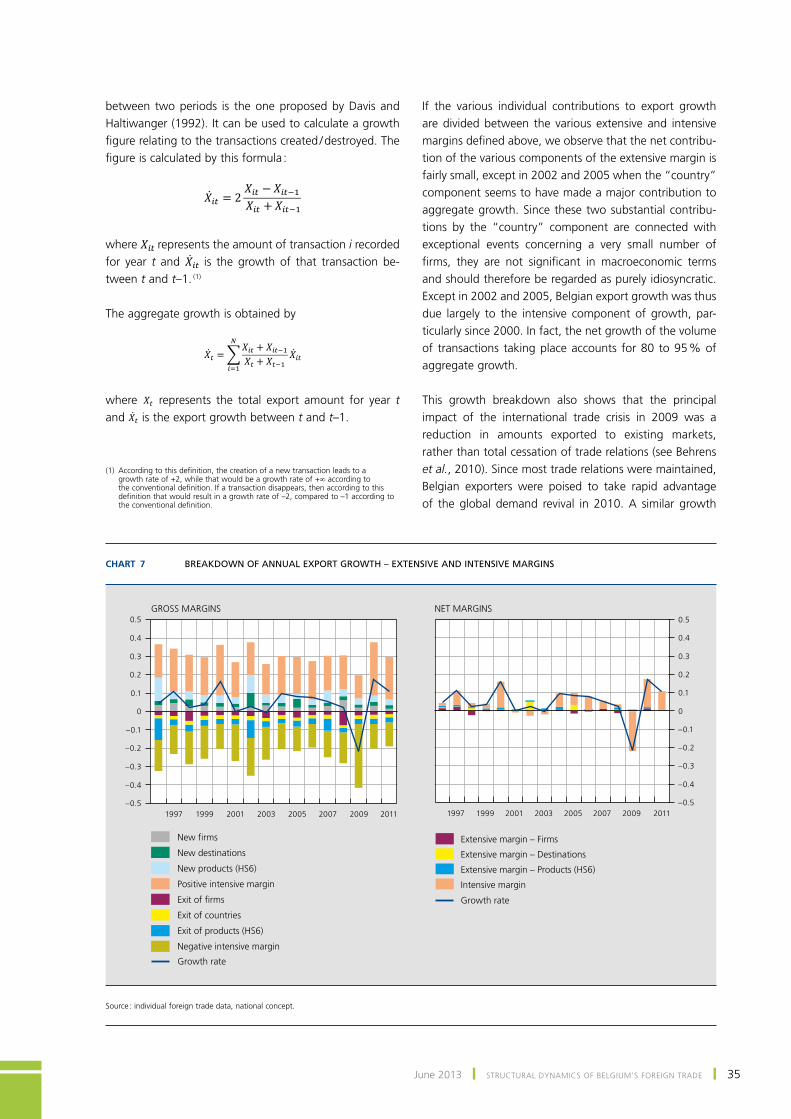
If the various individual contributions to export growth are divided between the various extensive and intensive margins defined above, we observe that the net contribu-tion of the various components of the extensive margin is fairly small, except in 2002 and 2005 when the “country” component seems to have made a major contribution to aggregate growth. Since these two substantial contribu-tions by the “country” component are connected with exceptional events concerning a very small number of firms, they are not significant in macroeconomic terms and should therefore be regarded as purely idiosyncratic. Except in 2002 and 2005, Belgian export growth was thus due largely to the intensive component of growth, par-ticularly since 2000. In fact, the net growth of the volume of transactions taking place accounts for 80 to 95 % of aggregate growth.
this growth breakdown also shows that the principal impact of the international trade crisis in 2009 was a reduction in amounts exported to existing markets, rather than total cessation of trade relations (see Behrens et al., 2010). Since most trade relations were maintained, Belgian exporters were poised to take rapid advantage of the global demand revival in 2010. A similar growth
(1) According to this definition, the creation of a new transaction leads to a growth rate of +2, while that would be a growth rate of +∞ according to the conventional definition. If a transaction disappears, then according to this definition that would result in a growth rate of –2, compared to –1 according to the conventional definition.
Chart 7 BrEakdown of annual Export growth – ExtEnsiVE and intEnsiVE margins
1997 1999 2001 2003 2005 2007 2009 2011 1997 1999 2001 2003 2005 2007 2009 2011–0.5
–0.4
–0.3
–0.2
–0.1
0
0.1
0.2
0.3
0.4
0.5
–0.5
–0.4
–0.3
–0.2
–0.1
0
0.1
0.2
0.3
0.4
0.5GROSS MARGINS NET MARGINS
Growth rate
New firms
New destinations
New products (HS6)
Positive intensive margin
Exit of firms
Exit of countries
Exit of products (HS6)
Negative intensive margin
Growth rate
Extensive margin – Firms
Intensive margin
Extensive margin – Destinations
Extensive margin – Products (HS6)
Source : individual foreign trade data, national concept.
36 ❙ StRuCtuRAl DYNAmICS of BElgIum’S foREIgN tRADE ❙ NBB Economic Review
profile is observed for imports by Belgian firms. that growth also originated mainly in the intensive margin.
A more detailed breakdown of the intensive margin into “intensive margin due to transactions created in the past three years” and “intensive margin due to other transac-tions” shows that it is mainly the recently created trade relations that contribute to intensive growth. In particular, it is notable that the pattern of the intensive margin in 2009 has a totally different structure from that in 2010. the reduction in trade flows in 2009 was attributable mainly to the “old” transactions (created before 2006), while – as stated above – half of the increase in 2010 resulted from the expansion of the trade relations created between 2007 and 2009.
the relatively small contribution of the extensive margin to export growth masks major changes in the structure of Belgian exports. As stated earlier, almost all export firms change their country and product portfolio every year. these major changes are reflected in the gross contribu-tions of the extensive and intensive margins to growth. for instance, the extremely small net contribution of the extensive “product” margin in fact conceals large posi-tive and negative contributions (due respectively to the introduction of new products on existing markets and the exit of products from existing markets). that indi-cates that Belgian exporters are adapting to international
competition by regularly adjusting their product portfolio on the various markets where they operate. the gross contributions of the extensive “firm” margin likewise reflect the large changes in the composition of the popu-lation of export firms.
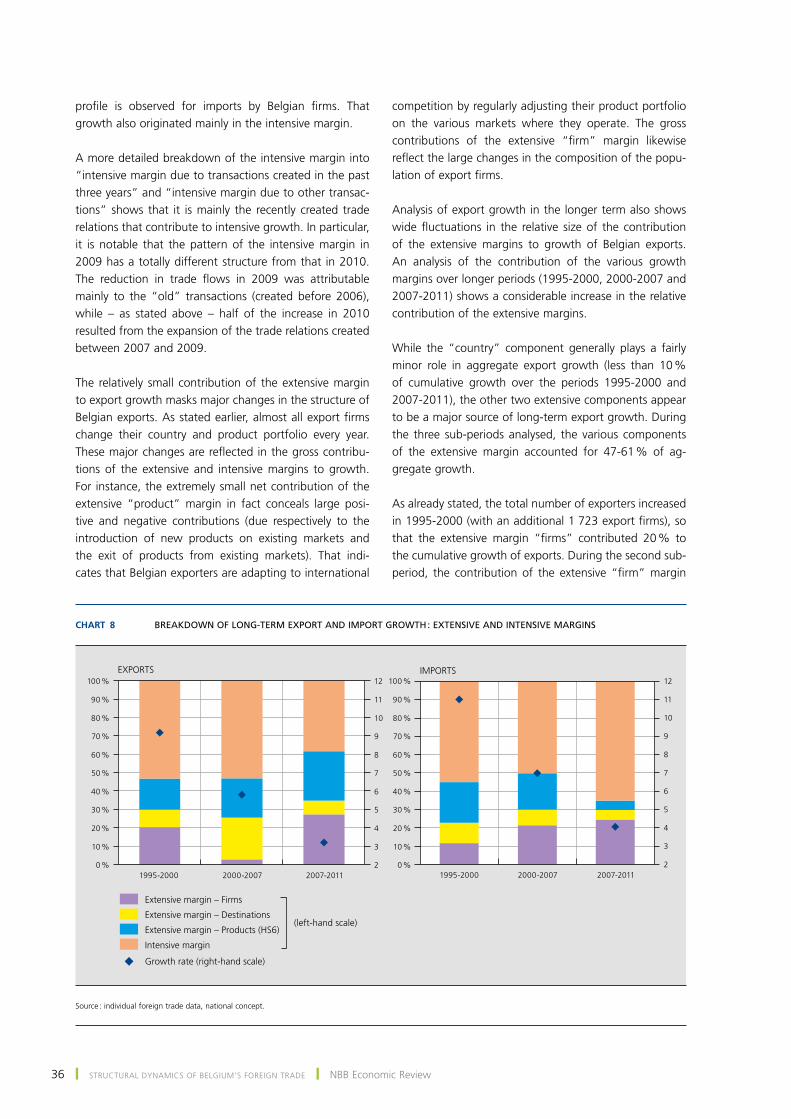
Analysis of export growth in the longer term also shows wide fluctuations in the relative size of the contribution of the extensive margins to growth of Belgian exports. An analysis of the contribution of the various growth margins over longer periods (1995-2000, 2000-2007 and 2007-2011) shows a considerable increase in the relative contribution of the extensive margins.
While the “country” component generally plays a fairly minor role in aggregate export growth (less than 10 % of cumulative growth over the periods 1995-2000 and 2007-2011), the other two extensive components appear to be a major source of long-term export growth. During the three sub-periods analysed, the various components of the extensive margin accounted for 47-61 % of ag-gregate growth.
As already stated, the total number of exporters increased in 1995-2000 (with an additional 1 723 export firms), so that the extensive margin “firms” contributed 20 % to the cumulative growth of exports. During the second sub-period, the contribution of the extensive “firm” margin
Chart 8 BrEakdown of long-tErm Export and import growth : ExtEnsiVE and intEnsiVE margins
F
F
F
F
1995-2000 2000-2007 2007-20110 %
10 %
20 %
30 %
40 %
50 %
60 %
70 %
80 %
90 %
100 %
2
3
4
5
6
7
8
9
10
11
12
F
F
F
1995-2000 2000-2007 2007-20112
3
4
5
6
7
8
9
10
11
12
0 %
10 %
20 %
30 %
40 %
50 %
60 %
70 %
80 %
90 %
100 %EXPORTS IMPORTS
Growth rate (right-hand scale)
Extensive margin – Firms
Extensive margin – Destinations
Extensive margin – Products (HS6)
Intensive margin
(left-hand scale)
Source : individual foreign trade data, national concept.
June 2013 ❙ StRuCtuRAl DYNAmICS of BElgIum’S foREIgN tRADE ❙ 37
remained slightly positive, against the backdrop of a declining number of exporters (in this period, a net loss of 1 031 export firms was recorded). During the recent period, the extensive “firm” margin again made a sub-stantial contribution (27 % of cumulative growth), albeit in a context of relatively weak total growth in the export volume compared to the other two sub-periods, which puts the importance of this contribution in a slightly dif-ferent perspective.
one major difference in relation to the breakdown of year-on-year growth is the key role of the extensive “product” margin. In the first two periods, this component account-ed for roughly 20 % of the cumulative growth. During the recent crisis period, it made a particularly substantial contribution, in excess of 27 %.
Admittedly, this larger contribution by the extensive mar-gin during the crisis (60 % of the growth if all the extensive margins are considered) came against the background of weak cumulative growth, with the intensive margins featuring highly adverse movements which reduced the cumulative growth contribution of the intensive margin. However, this breakdown of import growth shows that the contribution of the extensive margins during the first two sub-periods was comparable with that of exports, but that the situation in the crisis period was very different, while the context of the growth was very similar to that of exports. Between 2007 and 2011 imports, unlike exports, expanded mainly as a result of the intensive margin.
the breakdown of long-term export growth during 2007-2011 therefore suggests that Belgian exporters
made radical changes to their product portfolio on the markets where they were active during the crisis. It should be noted that this larger contribution from the “prod-uct” margin is not purely down to a smaller number of firms. Between 2007 and 2011, existing firms on existing markets conducted roughly 300 000 new transactions (a product exported by one firm to one country of destina-tion), and at the same time just over 200 000 transactions ceased. this major change in the product portfolio mainly concerned chemicals, electrical equipment and machin-ery. the overall picture appears to suggest that Belgian firms are repositioning themselves as exporters of high or medium-high technology products to emerging markets (Eastern Europe, China and India).
Conclusions
the analysis of both macro- and microeconomic data on Belgian foreign trade shows that the structure of Belgian exports has undergone major changes. those structural changes have been significant factors of external growth for Belgian firms, which need to focus on high technol-ogy niche segments in order to maintain or increase their foreign market share.
the process of Belgian economic transformation is re-flected in the key role that the extensive margin has played since 1995 in long-term export growth. that pro-cess actually seems to have persisted in recent times. As stated above, in the past five years Belgian export growth has been linked mainly to diversification of the product portfolio of Belgian exporters.
38 ❙ StRuCtuRAl DYNAmICS of BElgIum’S foREIgN tRADE ❙ NBB Economic Review
Bibliography
Aw B. and A. R. Hwang (1995), “productivity and the export market : A firm-level analysis”, Journal of Development Economics, 47(2), 313-332.
Behrens K., g. Corcos and g. mion (2010), Trade crisis ? What trade crisis ?, NBB Working paper 195.
Bernard A. and J. B. Jensen (1995), “Exporters, jobs and wages in u.S. manufacturing : 1976-1987”, Brookings Papers on Economic Activity, 67-112.
Bernard A. and J. B. Jensen (1999), “Exceptional export performance : Cause, effect or both ?”, Journal of International Economics, 47(1), 1-25.
Bernard A., J. Eaton, J. B. Jensen and S. Kortum (2003), “plants and productivity in international trade“, American Economic Review, 93(4), 1268-1290.
Bernard A. and J. B. Jensen (2004), “Exporting and productivity in the uSA”, Oxford Review of Economic Policy, 20(3), 343-357.
Bernard A., J. B. Jensen and p. Schott (2005), Importers, exporters and multinationals : A portrait of firms in the U.S. that trade goods, NBER Working paper 11404.
Davis S. and J. Haltiwanger (1992), “gross job creation, gross job destruction, and employment reallocation”, Quarterly Journal of Economics, 107(3), 819-63.
Dhyne E., C. fuss and C. mathieu (2010), Labour demand adjustment : Does foreign ownership matter ?, NBB Working paper 207.
Duprez C. (2011), “International trade in services : a growing contribution to Belgium’s current balance”, NBB Economic Review, 59-75, December.
Eaton J., S. Kortum and f. Kramarz (2004), “Dissecting trade : firms, industries, and export destinations”, American Economic Review, 94(2), 150-154.
mayer t. and g. ottaviano (2007), The happy few : New facts about the internationalisation of European firms, Bruegel/CEpR EfIm2007 Report, Bruegel Blueprint Series.
muûls m. and m. pisu (2007), Imports and exports at the level of the firm : Evidence from Belgium, NBB Working paper 114.