Embed Size (px)
Citation preview
Iwuoma Juliet Onyinyechukwu et al., IJSIT, 2016, 5(2), 193-202
IJSIT (www.ijsit.com), Volume 5, Issue 2, March-April 2016
193
STRUCTURAL INTERPRETATION AND HYDROCARBON POTENTIAL OF
OBUA FIELD, NIGER DELTA, SOUTHERN NIGERIA
1Iwuoma Juliet Onyinyechukwu and 2Minapuye I. Odigi
1Department of Geology, University of Port Harcourt, Nigeria
2Centre for Petroleum Geosciences, Institute of Petroleum Studies, University of Port Harcourt, Nigeria
ABSTRACT
Structural Interpretation and Hydrocarbon Potential of OBUA field was carried out to examine the
principal structures responsible for hydrocarbon entrapment and also indicate favourable areas in which
exploration can be concentrated in the field.The research methodology involved delineation of lithologies and
identification of reservoirs,fault and horizon mapping, well- to- seismic tie of the hydrocarbon reservoirs,
time to depth conversion,determination of petrophysical parameters and prospect evaluation.Sand and shale
are the two key lithological units present in the studied area. Two hydrocarbon bearing reservoirs (A and D)
were outlined. Well-to-seismic tie revealed that the hydrocarbon bearing reservoirs encountered tied
properly with the trough in the seismic. Two horizons and twelve faults were mapped. These faults include
eleven synthetic and one antithetic fault.Three growth faults were also interpreted. Depth structural maps
revealed that the principal structures responsible for hydrocarbon entrapment in OBUA field are fault
assisted closures and rollover anticlines. The result of the petrophysical evaluation showed that the average
porosity value for reservoir A is 0.225 while that of reservoir D is 0.219. The average permeability (k) values
range from 1462.695 to 1448.062md. Water saturation (Sw) average values are 0.381 and 0.424 for both
reservoirs. Net-to-Gross average values range from 0.625 to 0.597. Two prospects were identified at the
central part of the field. The results of this study suggest more developmental prospects in the central part of
the field.
Keywords: Lithologies, Reservoirs, ProspectEvaluation, Rollover Anticlines, Faults.
Iwuoma Juliet Onyinyechukwu et al., IJSIT, 2016, 5(2), 193-202
IJSIT (www.ijsit.com), Volume 5, Issue 2, March-April 2016
194
INTRODUCTION
The knowledge of the structural architecture of a reservoir aids in delineating prospective locations
suitable for economically exploitable accumulations in a field. Structural traps are formed as aneffect of
changes in the structure of the subsurface owing to processes like folding and faulting.Theyare the most
important type of trap because the majority of the world's petroleum reserves are discovered in structural
traps[1]. Structural traps are classified into three:the anticline trap, the fault trap and the salt dome trap.This
work therefore aimed at producing a regional structural interpretation as well as evaluating the hydrocarbon
potential of OBUA Field.
Several workers have carried out research on the structure and hydrocarbon potential of the Niger
Delta basin. They include; [3],[4], [6], [8] among others.
Geologic Setting and Stratigraphy:
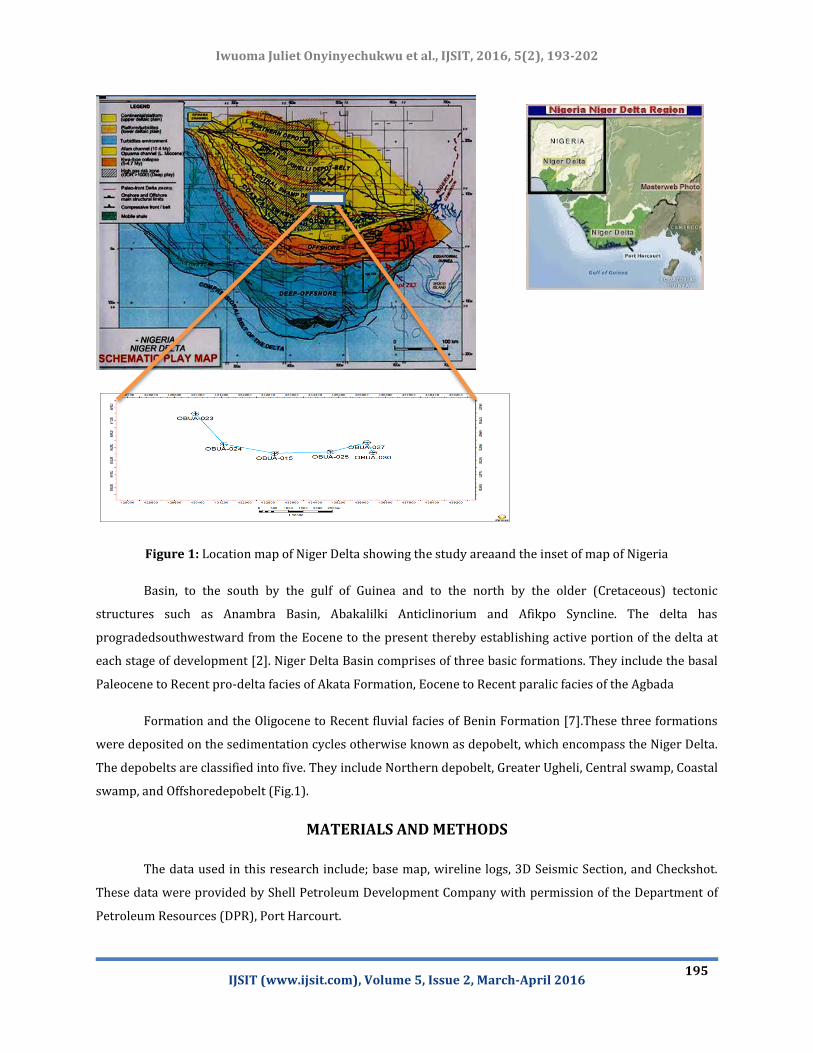
The OBUA field is locatedwithin southwest of Central swamp Depobelt of Niger Delta Basin
(fig.1).Niger Delta is situated in the southern part of Nigeria between the longitude 40–90E and latitude 40-60N
(Fig.2). The basin is surrounded to the east by the Calabar Flank [5], to the west by the Benin
Iwuoma Juliet Onyinyechukwu et al., IJSIT, 2016, 5(2), 193-202
IJSIT (www.ijsit.com), Volume 5, Issue 2, March-April 2016
195
Figure 1: Location map of Niger Delta showing the study areaand the inset of map of Nigeria
Basin, to the south by the gulf of Guinea and to the north by the older (Cretaceous) tectonic
structures such as Anambra Basin, Abakalilki Anticlinorium and Afikpo Syncline. The delta has
progradedsouthwestward from the Eocene to the present thereby establishing active portion of the delta at
each stage of development [2]. Niger Delta Basin comprises of three basic formations. They include the basal
Paleocene to Recent pro-delta facies of Akata Formation, Eocene to Recent paralic facies of the Agbada
Formation and the Oligocene to Recent fluvial facies of Benin Formation [7].These three formations
were deposited on the sedimentation cycles otherwise known as depobelt, which encompass the Niger Delta.
The depobelts are classified into five. They include Northern depobelt, Greater Ugheli, Central swamp, Coastal
swamp, and Offshoredepobelt (Fig.1).
MATERIALS AND METHODS
The data used in this research include; base map, wireline logs, 3D Seismic Section, and Checkshot.
These data were provided by Shell Petroleum Development Company with permission of the Department of
Petroleum Resources (DPR), Port Harcourt.
Iwuoma Juliet Onyinyechukwu et al., IJSIT, 2016, 5(2), 193-202
IJSIT (www.ijsit.com), Volume 5, Issue 2, March-April 2016
196
All data used in this research were checked for quality to avoid interpretation difficulties before
being loaded into geosciences workstation.
The methods adopted in this research include delineation of lithologies and identification of
reservoirs from log signatures of gamma ray and resistivity logs.Faults were recognised on the basis of
discontinuities in reflections. The checkshot data was used for the well- to- seismic tie of the hydrocarbon
reservoirs. Horizons were mapped and used to generate the time structure maps which were later converted
to depth structure maps using checkshot. These time and depth contour maps of productive reservoir
formations were constructed using time read directly from the tops of particular horizons and average
velocities derived from internal velocities. Petrophysical evaluation was carried out from the relevant
wireline logs. Finally, the prospective zones in OBUA field were delineated using depth structure map and
petrophysical results obtained.
RESULTS AND DISCUSSION
Lithologic Analysis/Reservoir Identification:
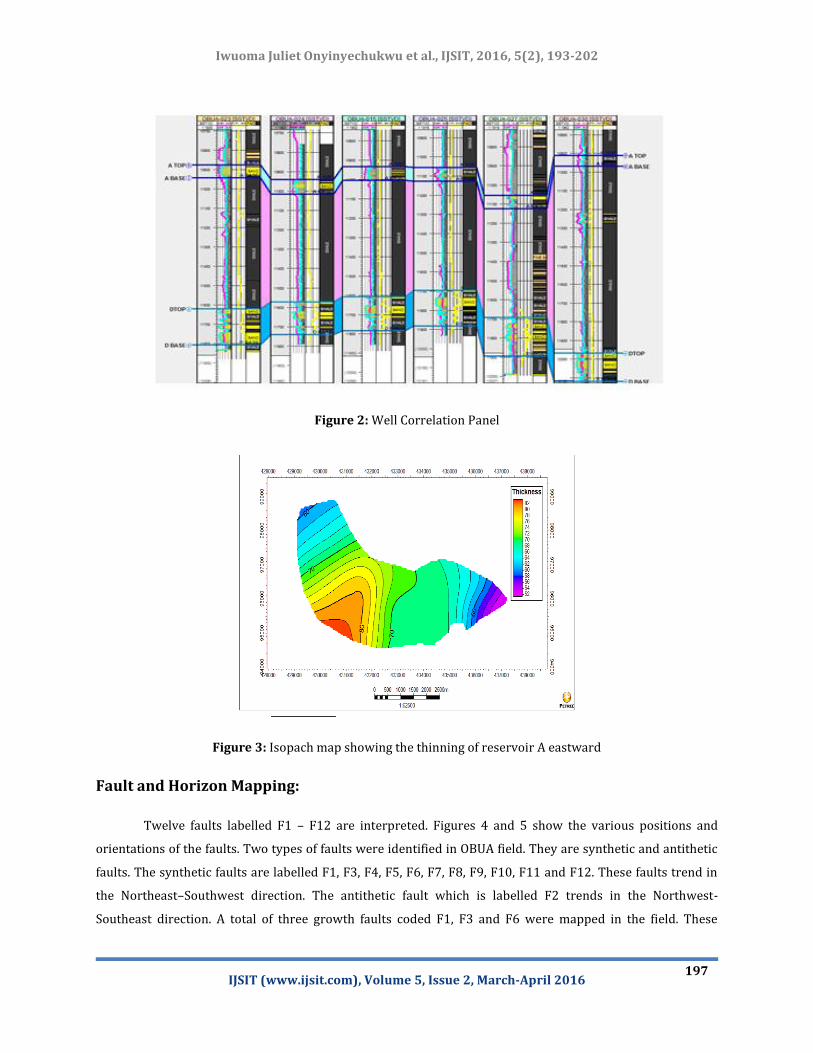
The two mainlithologies present in OBUA field as revealed by well logs are sand and shale. The
interval coloured yellow denotes sand while the interval coloured black signifies shale (fig.2).
Stratigraphic correlation of six wells in OBUA field led to a division of the sand bodies into two
sections. They are sand A and D correspondingly.
Two reservoirs were recognized in the field. The top and base of the reservoirs are shown in well
correlation panel. The deeper reservoir is found to be thicker and cleaner than the reservoir encountered at
shallow level. Reservoir A thins towards the eastern part of the field (fig.3)
Iwuoma Juliet Onyinyechukwu et al., IJSIT, 2016, 5(2), 193-202
IJSIT (www.ijsit.com), Volume 5, Issue 2, March-April 2016
197
Figure 2: Well Correlation Panel
Figure 3: Isopach map showing the thinning of reservoir A eastward
Fault and Horizon Mapping:
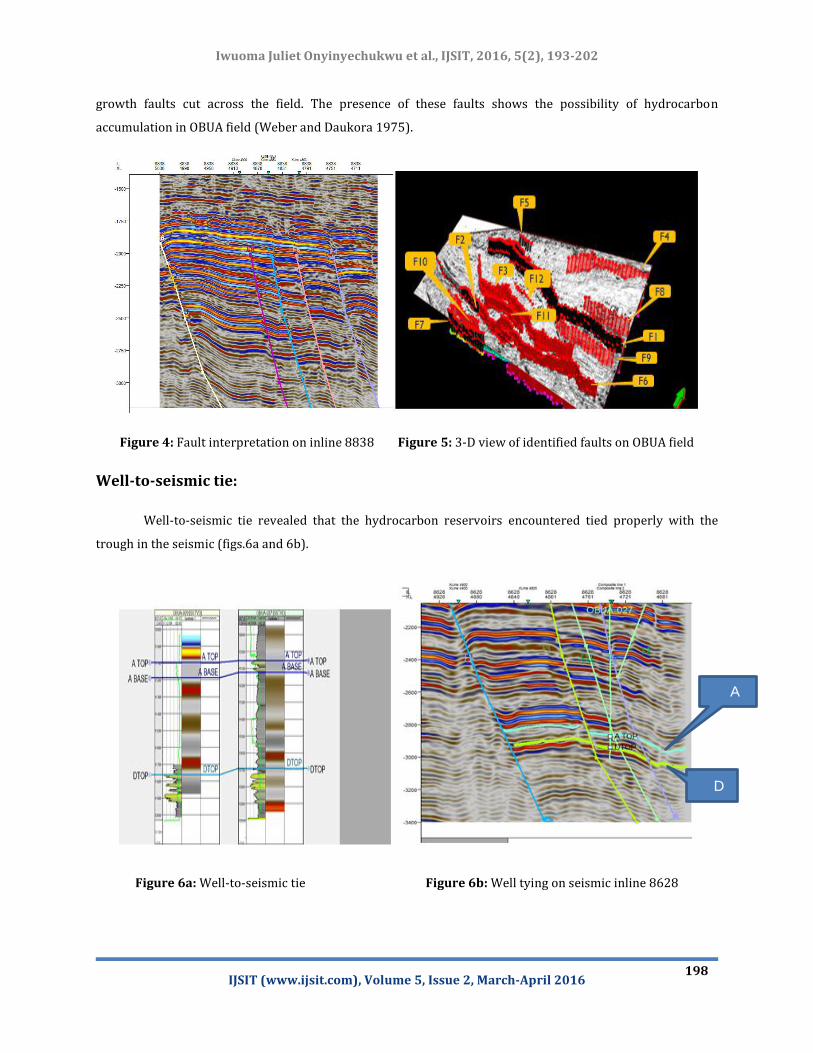
Twelve faults labelled F1 – F12 are interpreted. Figures 4 and 5 show the various positions and
orientations of the faults. Two types of faults were identified in OBUA field. They are synthetic and antithetic
faults. The synthetic faults are labelled F1, F3, F4, F5, F6, F7, F8, F9, F10, F11 and F12. These faults trend in
the Northeast–Southwest direction. The antithetic fault which is labelled F2 trends in the Northwest-
Southeast direction. A total of three growth faults coded F1, F3 and F6 were mapped in the field. These
Iwuoma Juliet Onyinyechukwu et al., IJSIT, 2016, 5(2), 193-202
IJSIT (www.ijsit.com), Volume 5, Issue 2, March-April 2016
198
growth faults cut across the field. The presence of these faults shows the possibility of hydrocarbon
accumulation in OBUA field (Weber and Daukora 1975).
Figure 4: Fault interpretation on inline 8838 Figure 5: 3-D view of identified faults on OBUA field
Well-to-seismic tie:
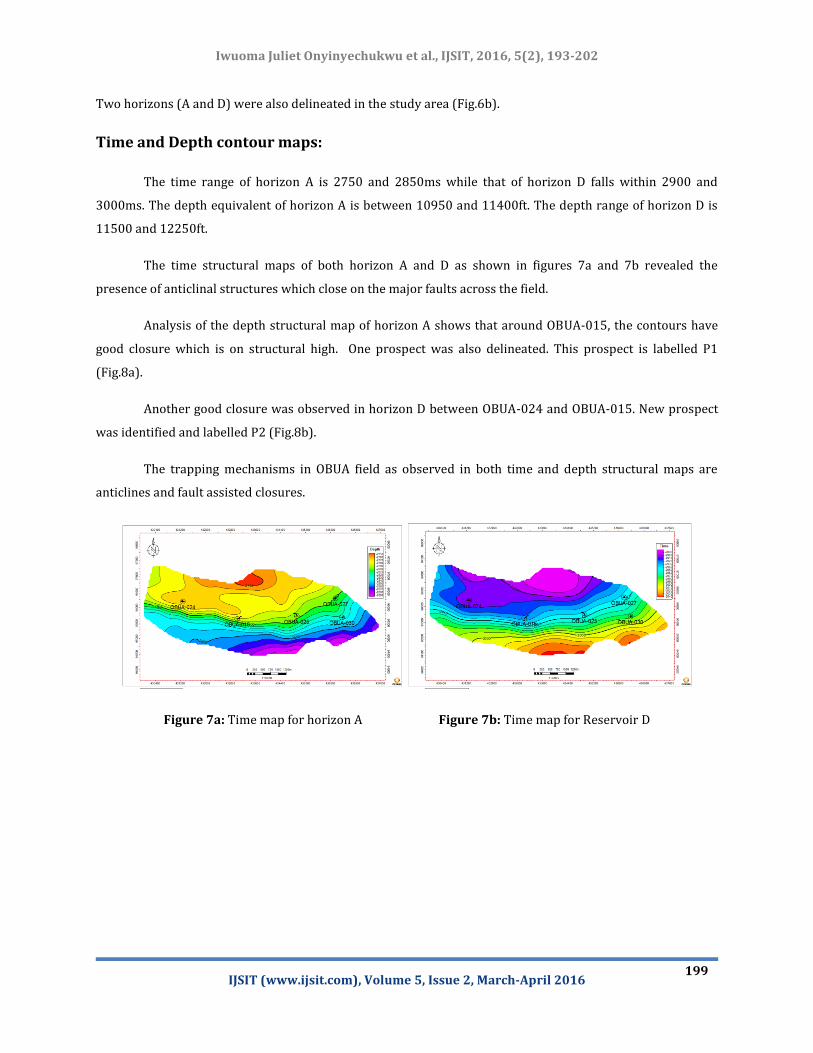
Well-to-seismic tie revealed that the hydrocarbon reservoirs encountered tied properly with the
trough in the seismic (figs.6a and 6b).
Figure 6a: Well-to-seismic tie Figure 6b: Well tying on seismic inline 8628
D
A
Iwuoma Juliet Onyinyechukwu et al., IJSIT, 2016, 5(2), 193-202
IJSIT (www.ijsit.com), Volume 5, Issue 2, March-April 2016
199
Two horizons (A and D) were also delineated in the study area (Fig.6b).
Time and Depth contour maps:
The time range of horizon A is 2750 and 2850ms while that of horizon D falls within 2900 and
3000ms. The depth equivalent of horizon A is between 10950 and 11400ft. The depth range of horizon D is
11500 and 12250ft.
The time structural maps of both horizon A and D as shown in figures 7a and 7b revealed the
presence of anticlinal structures which close on the major faults across the field.
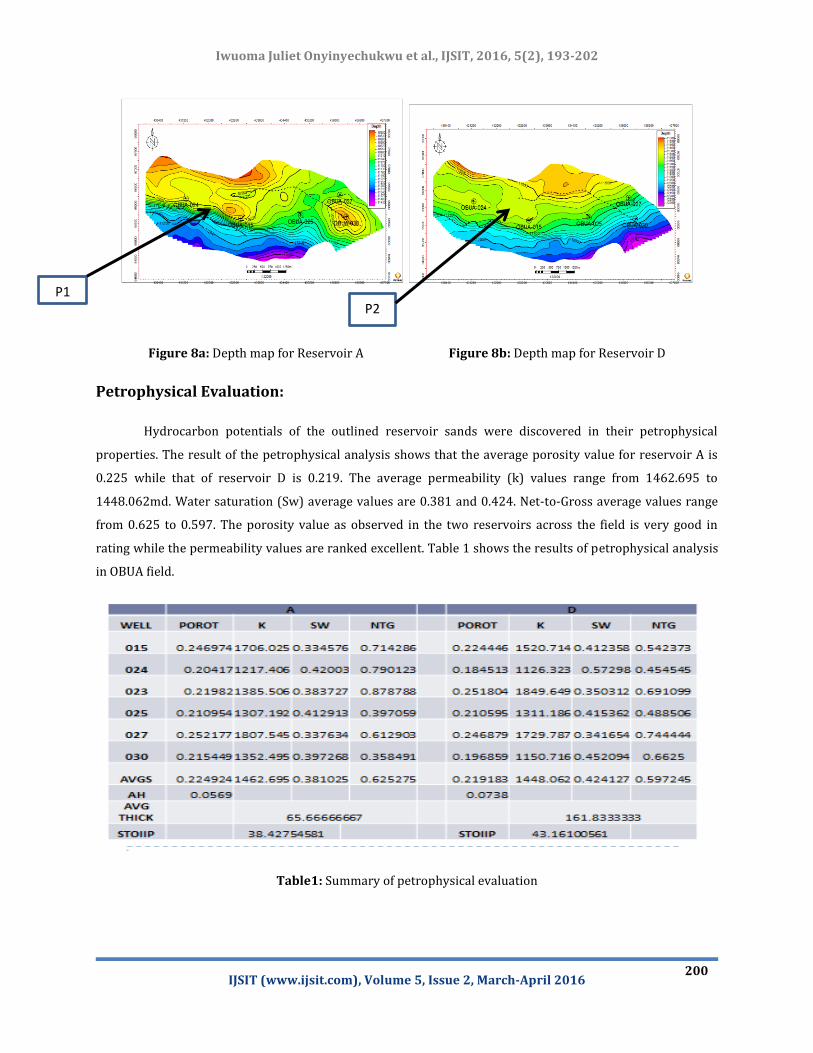
Analysis of the depth structural map of horizon A shows that around OBUA-015, the contours have
good closure which is on structural high. One prospect was also delineated. This prospect is labelled P1
(Fig.8a).
Another good closure was observed in horizon D between OBUA-024 and OBUA-015. New prospect
was identified and labelled P2 (Fig.8b).
The trapping mechanisms in OBUA field as observed in both time and depth structural maps are
anticlines and fault assisted closures.
Figure 7a: Time map for horizon A Figure 7b: Time map for Reservoir D
Iwuoma Juliet Onyinyechukwu et al., IJSIT, 2016, 5(2), 193-202
IJSIT (www.ijsit.com), Volume 5, Issue 2, March-April 2016
200
Figure 8a: Depth map for Reservoir A Figure 8b: Depth map for Reservoir D
Petrophysical Evaluation:
Hydrocarbon potentials of the outlined reservoir sands were discovered in their petrophysical
properties. The result of the petrophysical analysis shows that the average porosity value for reservoir A is
0.225 while that of reservoir D is 0.219. The average permeability (k) values range from 1462.695 to
1448.062md. Water saturation (Sw) average values are 0.381 and 0.424. Net-to-Gross average values range
from 0.625 to 0.597. The porosity value as observed in the two reservoirs across the field is very good in
rating while the permeability values are ranked excellent. Table 1 shows the results of petrophysical analysis
in OBUA field.
Table1: Summary of petrophysical evaluation
P2 P1
Iwuoma Juliet Onyinyechukwu et al., IJSIT, 2016, 5(2), 193-202
IJSIT (www.ijsit.com), Volume 5, Issue 2, March-April 2016
201
SUMMARY AND CONCLUSIONS
In this study, sand and shale are observed to be the two key lithological unitsexisting in the studied
area. Two hydrocarbon bearing reservoirs (A and D) have been described from well log analysis. Well-to-
seismic tie revealed that the hydrocarbon bearing reservoirs encountered in the wells tied properly with the
trough in the seismic. Two horizons were recognized and twelve faults were mapped across the field.
Both time and depth structural maps revealed that the principal structures accountable for
hydrocarbon entrapment in OBUA field are fault assisted closures and rollover anticlines. Two prospects
were identified in both reservoirs at the central part of the field.From the result of the petrophysicalanalysis,
it can be construedthat both the porosities and permeabilities of the reservoirs delineated are adequate to be
adjudicated a producible reservoir.The results of this study suggest more developmental prospects in the
central part of the field.
ACKNOWLEDGEMENTS
Sincere appreciation goes to Shell Petroleum Development Company Port Harcourt for provision of
data used in this study. We also acknowledge Prof. Ernest .E. Uwazie and Mrs OluchiEma- Etokudofor their
contributions in this research.
REFERENCES
1. Allen, P.A., and Allen, J.R.,. 2005. Basin Analysis: Principles and Applications. Second Edition. Publ.
Blackwell Publishing.
2. Doust, H., and Omatsola, E., 1990. Niger Delta, in, Edwards, J.D., and Santogrossi.P.A., eds.,
Divergent/passive Margin Basins, American Association of Petroleum Geologists Memoir 48: Tulsa,
American Association of Petroleum Geologists, pp.239-248.
3. Emujakporue, G.O., and Ngwueke, M.I., 2013. Structural Interpretation of seismic data from an XY Field,
Onshore Niger Delta, Nigeria. J. Appl. Sci. Environ. Manage, Vol. 17, No. 1, pp. 153-158
4. Momta, P.S., and Odigi, M.I. 2015. Geobody Architecture and Petroleum Potential of the Yowi Field,
Offshore Eastern Niger Delta, Nigeria.American Journal of Geosciences. DOI:10.3844/ajgsp2015.
5. Nwachukwu, J.I., and Chukwura, P.I., 1986. Organic matter of Agbada Formation, Niger Delta, Nigeria;
American Association of Petroleum Geologists Bulletin, Vol. 70, pp. 48-55.
6. Opara, A.I., 2010. Prospectivity Evaluation of “USSO” Field, Onshore Niger Delta Basin. The Petroleum and
Coal, Vol. 52, No.4, pp. 307-315.
7. Short, K.C., and Stauble, A.J.,1965. Outline of geology of Niger Delta: American Association of Petroleum
Geologists Bulletin, Vol. 51, pp. 761 – 779.
8. Weber,K.J., andDaukoru, E.M., 1975. Petroleum Geology of the Niger Delta, Ninth World Petroleum

Iwuoma Juliet Onyinyechukwu et al., IJSIT, 2016, 5(2), 193-202
IJSIT (www.ijsit.com), Volume 5, Issue 2, March-April 2016
202
Congress, Vol.2,London, Applied Science Publishers, Ltd, pp.210-221.