Embed Size (px)
Citation preview
Structural Response and Design Criteria for Imposed Deformations Superimposed to Vertical Loads Camara, J. Instituto Superior Técnico, Department of Civil Engineering and Architecture, Av. Rovisco Pais – 1049-001 Lisbon, Portugal Luís, R. JSJ, Design and Consulting Engineers, Av. Sidónio Pais, 18 – 3º Dt. – 1050-215 Lisboa, Portugal INTRODUCTION Structural behaviour and design criteria for imposed deformations have been a theme of research in the last twenty years. This research effort has been the basis for recent codes indications that give an important guidance of how to design and detail in order to insure good service behaviour. The elastic stress resultant is significantly reduced in comparison to its elastic values. Firstly this aspect is highlighted as well as the differences between flexion and axial effects due to imposed deformations. Axial imposed deformations effects are the more unfavourable as far as serviceability is concerned and are further analysed in this study. The differences between the structural response due to concrete shrinkage or to a global axial imposed deformation, as an uniform temperature variation, are pointed out. In practise, however, restriction to the free structural deformations due to shrinkage and temperature variations induces an axial effect on the slabs, which is superimposed to flexion due to permanent or other vertical loads. In this paper, it is shown how the structural non-linear response to an axial imposed deformation is modified by the fact that the structural members are already submitted to flexion due to vertical loads. It is highlighted that, in these cases, slab cracking due to flexion is responsible for smaller values of the axial effects (a certain percentage of the axial cracking load). Based on non-linear structural analysis and considering some variations on certain material parameters and steel percentages, design recommendations are presented for cases where superposition of effects exists. Finally, an example of an underground car parking slab design, taking into consideration those aspects, is presented, that shows that designing structures, with less or no joints, is possible with a better understanding of the consequences of such an option. Keywords: structural behaviour, imposed deformations, superimposed effects, non-linear analysis, design
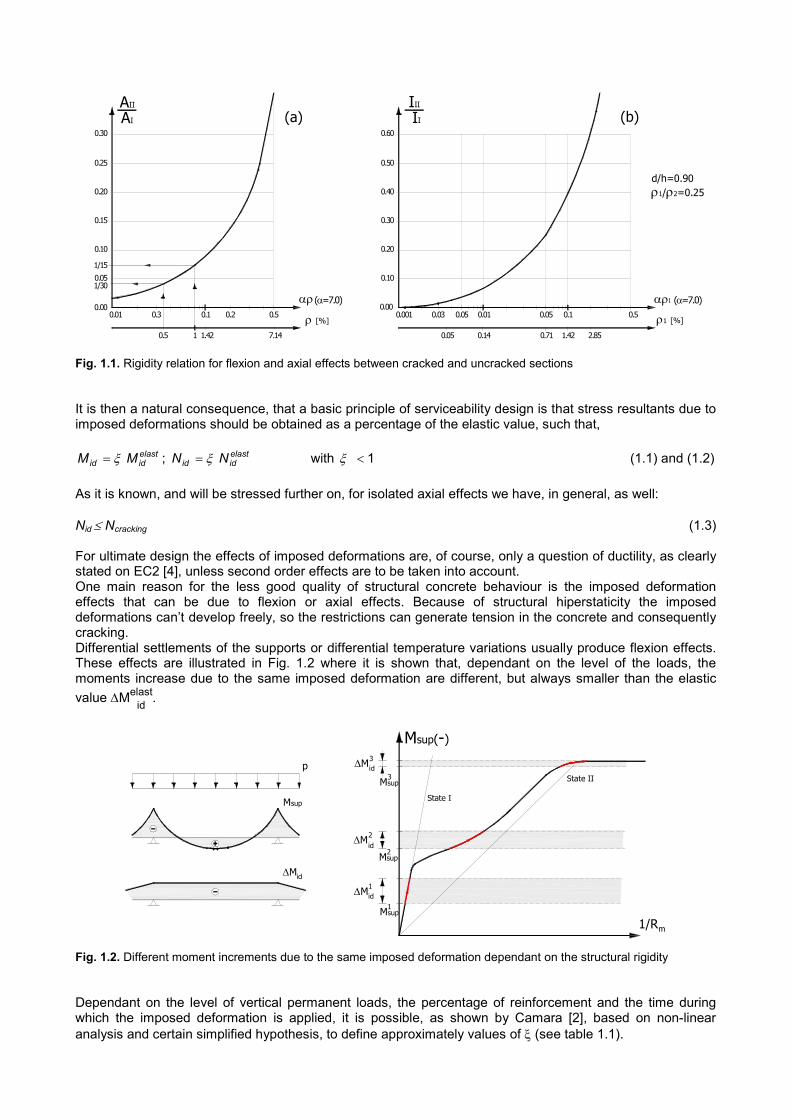
criteria 1. GENERAL DESIGN CONSIDERATIONS As far as structural behaviour is concerned, the response to imposed deformations, in terms of stress resultants, depends directly on its rigidity, which decreases considerable when the element cracks. In this sense, when considering the effects of imposed deformations the non-linear behaviour has to be taken into account. As shown in fig. 1.1 the loss of rigidity is important for flexion and is still more significant for axial effects. So it makes no sense to ignore these aspects for serviceability design analysis, unless the criteria is to avoid cracking. In these cases, only the creep effects for long term imposed deformations can be considered as a loss of rigidity in comparison to an elastic analysis. An aspect that is worth calling attention to, is the fact that for a cracked section creep has relatively small or even no influence on decreasing rigidity, respectively, for flexion and axial behaviours.
0.00
0.05
0.10
0.15
0.20
0.25
0.01 0.3 0.1 0.5
AII
αρ
(a)AI
0.30
ρ [%]0.2
0.5 1 1.42
1/15
1/30
7.14
0.00
0.10
0.20
0.30
0.40
0.50
0.001 0.03 0.01 0.1
III
αρ1
(b)II
0.60
ρ1 [%]0.050.05
(α=7.0)
0.71 2.85
0.5
d/h=0.90ρ1/ρ2=0.25
(α=7.0)
1.420.140.05
Fig. 1.1. Rigidity relation for flexion and axial effects between cracked and uncracked sections It is then a natural consequence, that a basic principle of serviceability design is that stress resultants due to imposed deformations should be obtained as a percentage of the elastic value, such that,
elastidid MM ξ= ; elast
idid NN ξ= with 1<ξ (1.1) and (1.2) As it is known, and will be stressed further on, for isolated axial effects we have, in general, as well: Nid ≤ Ncracking (1.3) For ultimate design the effects of imposed deformations are, of course, only a question of ductility, as clearly stated on EC2 [4], unless second order effects are to be taken into account. One main reason for the less good quality of structural concrete behaviour is the imposed deformation effects that can be due to flexion or axial effects. Because of structural hiperstaticity the imposed deformations can’t develop freely, so the restrictions can generate tension in the concrete and consequently cracking. Differential settlements of the supports or differential temperature variations usually produce flexion effects. These effects are illustrated in Fig. 1.2 where it is shown that, dependant on the level of the loads, the moments increase due to the same imposed deformation are different, but always smaller than the elastic value ∆Melast
id .
1/R
Msup(-)
State I
m
State II
∆M
∆M
∆M
1
2
3
Msup1
Msup2
Msup3
Msup
p
id∆M
id
id
id
Fig. 1.2. Different moment increments due to the same imposed deformation dependant on the structural rigidity Dependant on the level of vertical permanent loads, the percentage of reinforcement and the time during which the imposed deformation is applied, it is possible, as shown by Camara [2], based on non-linear analysis and certain simplified hypothesis, to define approximately values of ξ (see table 1.1).
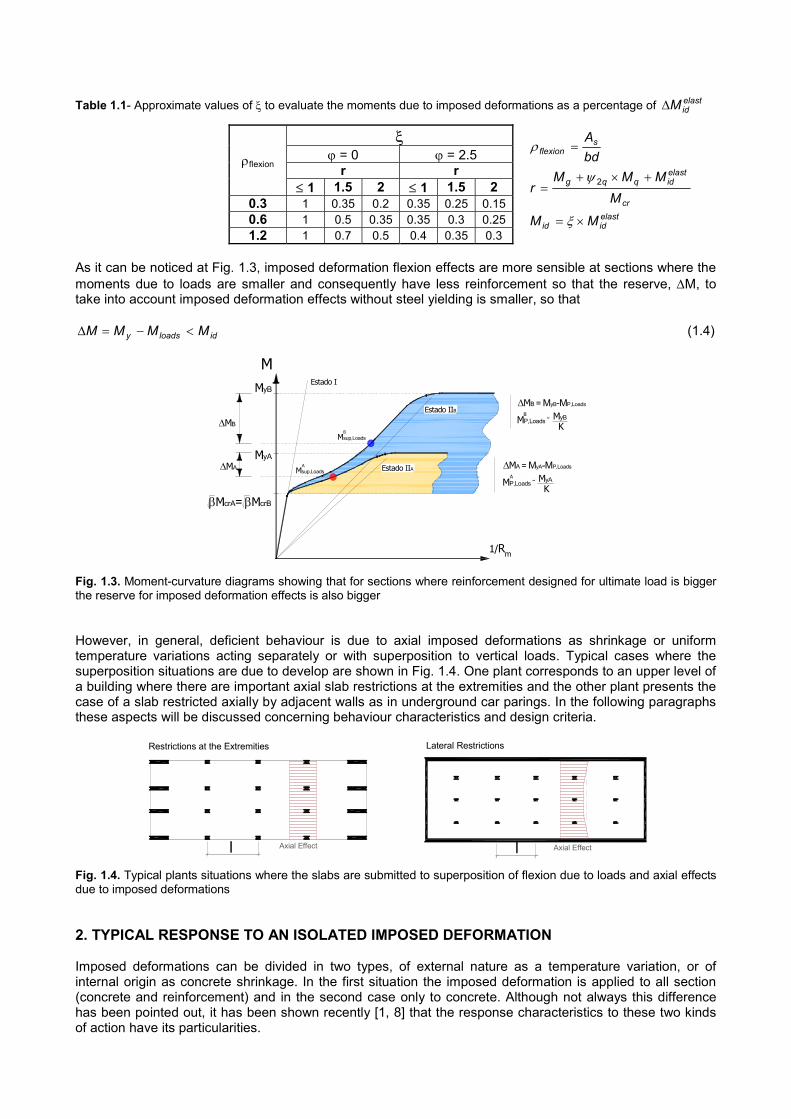
Table 1.1- Approximate values of ξ to evaluate the moments due to imposed deformations as a percentage of elastidM∆
ξ ϕ = 0 ϕ = 2.5
r r ρflexion
≤ 1 1.5 2 ≤ 1 1.5 2 0.3 1 0.35 0.2 0.35 0.25 0.15 0.6 1 0.5 0.35 0.35 0.3 0.25 1.2 1 0.7 0.5 0.4 0.35 0.3
bdAs
flexion =ρ
cr
elastidqqg
MMMM
r+×+
= 2ψ
elastidid MM ×= ξ
As it can be noticed at Fig. 1.3, imposed deformation flexion effects are more sensible at sections where the moments due to loads are smaller and consequently have less reinforcement so that the reserve, ∆M, to take into account imposed deformation effects without steel yielding is smaller, so that
idloadsy MMMM <−=∆ (1.4)
βMcrA= βMcrB
1/R
MMyB
Estado I
Estado IIA
MyA
m
∆MA
∆MB
Estado IIB
MP,Loads ˜ MyA
K
∆MA = MyA-MP,Loads
MP,Loads ˜ MyBK
∆MB = MyB-MP,Loads
A
B
Msup,LoadsA
Msup,LoadsB
Fig. 1.3. Moment-curvature diagrams showing that for sections where reinforcement designed for ultimate load is bigger the reserve for imposed deformation effects is also bigger However, in general, deficient behaviour is due to axial imposed deformations as shrinkage or uniform temperature variations acting separately or with superposition to vertical loads. Typical cases where the superposition situations are due to develop are shown in Fig. 1.4. One plant corresponds to an upper level of a building where there are important axial slab restrictions at the extremities and the other plant presents the case of a slab restricted axially by adjacent walls as in underground car parings. In the following paragraphs these aspects will be discussed concerning behaviour characteristics and design criteria.
Lateral RestrictionsRestrictions at the Extremities
Axial Effect Axial Effectl l
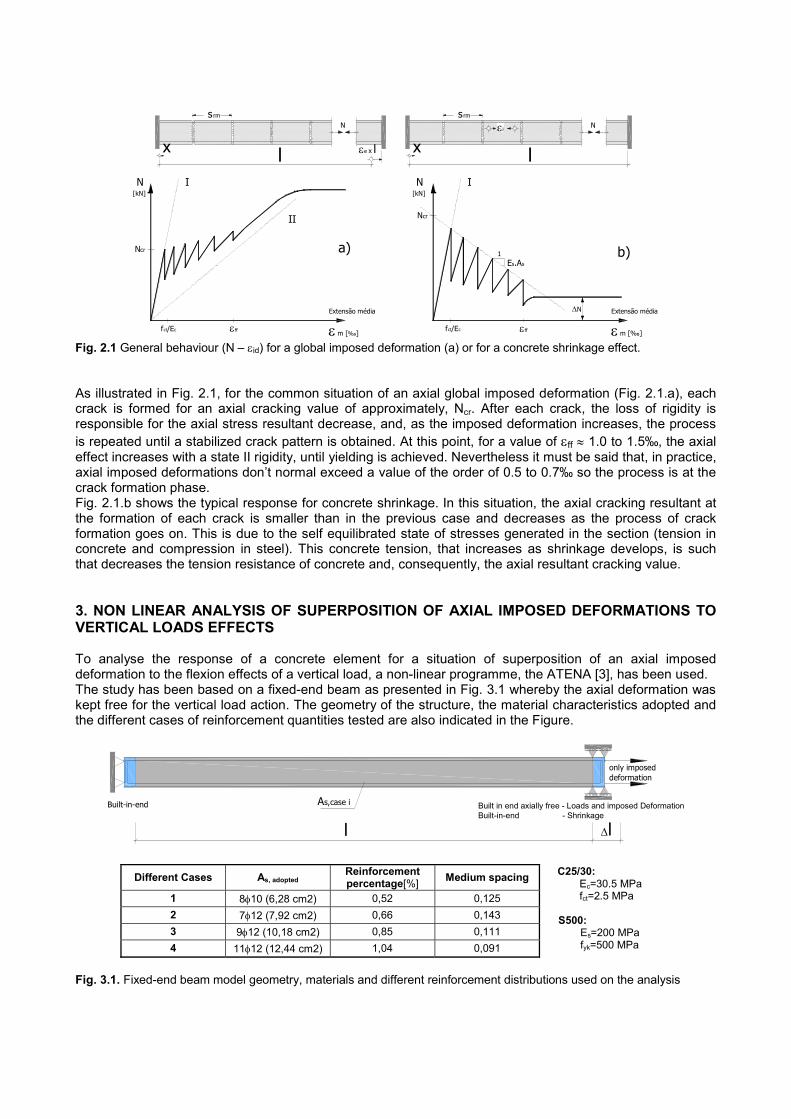
Fig. 1.4. Typical plants situations where the slabs are submitted to superposition of flexion due to loads and axial effects due to imposed deformations 2. TYPICAL RESPONSE TO AN ISOLATED IMPOSED DEFORMATION Imposed deformations can be divided in two types, of external nature as a temperature variation, or of internal origin as concrete shrinkage. In the first situation the imposed deformation is applied to all section (concrete and reinforcement) and in the second case only to concrete. Although not always this difference has been pointed out, it has been shown recently [1, 8] that the response characteristics to these two kinds of action have its particularities.
lεi N
x
s rm
l
N
x εe x l
s rm
Extensão média
ε m [‰]
N[kN]
I
Es.As
Ncr
εfffct/Ec
1
∆NExtensão média
ε m [‰]
I
II
Ncr
εfffct/Ec
N[kN]
a) b)
Fig. 2.1 General behaviour (N – εid) for a global imposed deformation (a) or for a concrete shrinkage effect. As illustrated in Fig. 2.1, for the common situation of an axial global imposed deformation (Fig. 2.1.a), each crack is formed for an axial cracking value of approximately, Ncr. After each crack, the loss of rigidity is responsible for the axial stress resultant decrease, and, as the imposed deformation increases, the process is repeated until a stabilized crack pattern is obtained. At this point, for a value of εff ≈ 1.0 to 1.5‰, the axial effect increases with a state II rigidity, until yielding is achieved. Nevertheless it must be said that, in practice, axial imposed deformations don’t normal exceed a value of the order of 0.5 to 0.7‰ so the process is at the crack formation phase. Fig. 2.1.b shows the typical response for concrete shrinkage. In this situation, the axial cracking resultant at the formation of each crack is smaller than in the previous case and decreases as the process of crack formation goes on. This is due to the self equilibrated state of stresses generated in the section (tension in concrete and compression in steel). This concrete tension, that increases as shrinkage develops, is such that decreases the tension resistance of concrete and, consequently, the axial resultant cracking value. 3. NON LINEAR ANALYSIS OF SUPERPOSITION OF AXIAL IMPOSED DEFORMATIONS TO VERTICAL LOADS EFFECTS To analyse the response of a concrete element for a situation of superposition of an axial imposed deformation to the flexion effects of a vertical load, a non-linear programme, the ATENA [3], has been used. The study has been based on a fixed-end beam as presented in Fig. 3.1 whereby the axial deformation was kept free for the vertical load action. The geometry of the structure, the material characteristics adopted and the different cases of reinforcement quantities tested are also indicated in the Figure.
As,case i Built in end axially free - Loads and imposed DeformationBuilt-in-end - Shrinkage
Built-in-end
l ∆l
only imposed deformation
Different Cases As, adopted Reinforcement percentage[%] Medium spacing
1 8φ10 (6,28 cm2) 0,52 0,125 2 7φ12 (7,92 cm2) 0,66 0,143 3 9φ12 (10,18 cm2) 0,85 0,111 4 11φ12 (12,44 cm2) 1,04 0,091
C25/30: Ec=30.5 MPa fct=2.5 MPa
S500:
Es=200 MPa fyk=500 MPa
Fig. 3.1. Fixed-end beam model geometry, materials and different reinforcement distributions used on the analysis
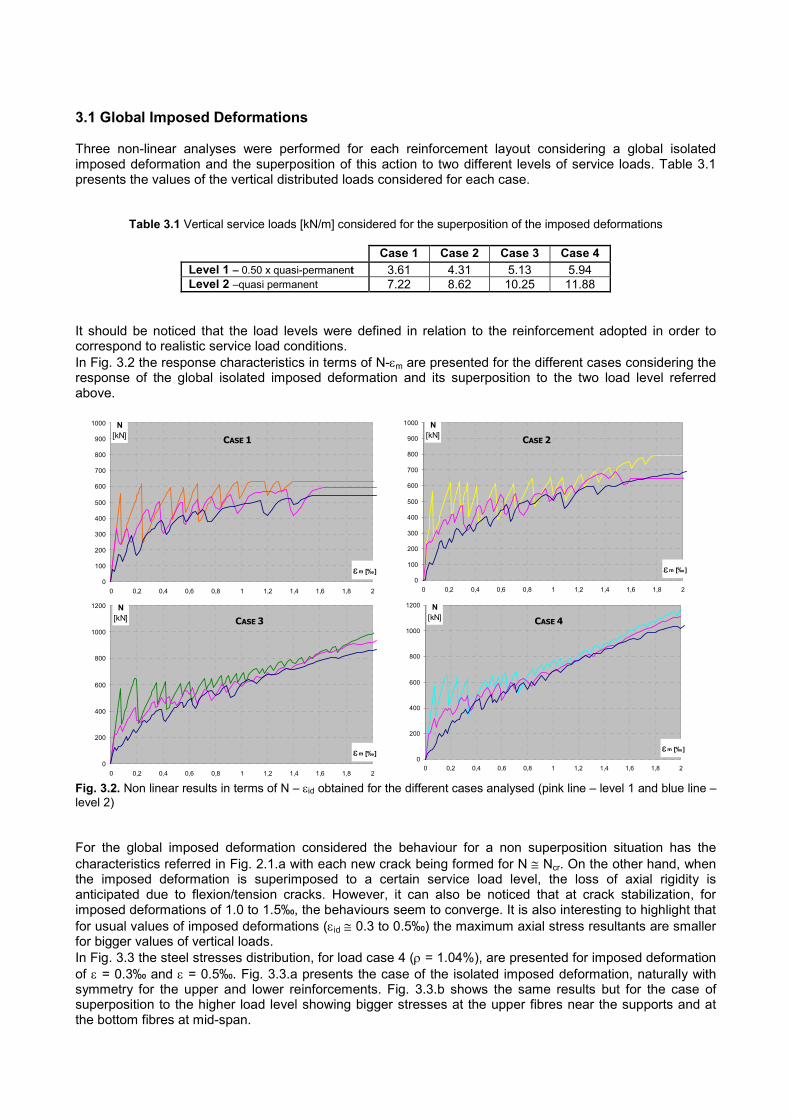
3.1 Global Imposed Deformations Three non-linear analyses were performed for each reinforcement layout considering a global isolated imposed deformation and the superposition of this action to two different levels of service loads. Table 3.1 presents the values of the vertical distributed loads considered for each case.
Table 3.1 Vertical service loads [kN/m] considered for the superposition of the imposed deformations
Case 1 Case 2 Case 3 Case 4 Level 1 – 0.50 x quasi-permanent 3.61 4.31 5.13 5.94 Level 2 –quasi permanent 7.22 8.62 10.25 11.88
It should be noticed that the load levels were defined in relation to the reinforcement adopted in order to correspond to realistic service load conditions. In Fig. 3.2 the response characteristics in terms of N-εm are presented for the different cases considering the response of the global isolated imposed deformation and its superposition to the two load level referred above.
0
100
200
300
400
500
600
700
800
900
1000
0 0,2 0,4 0,6 0,8 1 1,2 1,4 1,6 1,8 2
εm [‰]
N [kN]
0
100
200
300
400
500
600
700
800
900
1000
0 0,2 0,4 0,6 0,8 1 1,2 1,4 1,6 1,8 2
εm [‰ ]
N [kN]
0
200
400
600
800
1000
1200
0 0,2 0,4 0,6 0,8 1 1,2 1,4 1,6 1,8 2
εm [‰]
N [kN]
0
200
400
600
800
1000
1200
0 0,2 0,4 0,6 0,8 1 1,2 1,4 1,6 1,8 2
εm [‰]
N [kN]
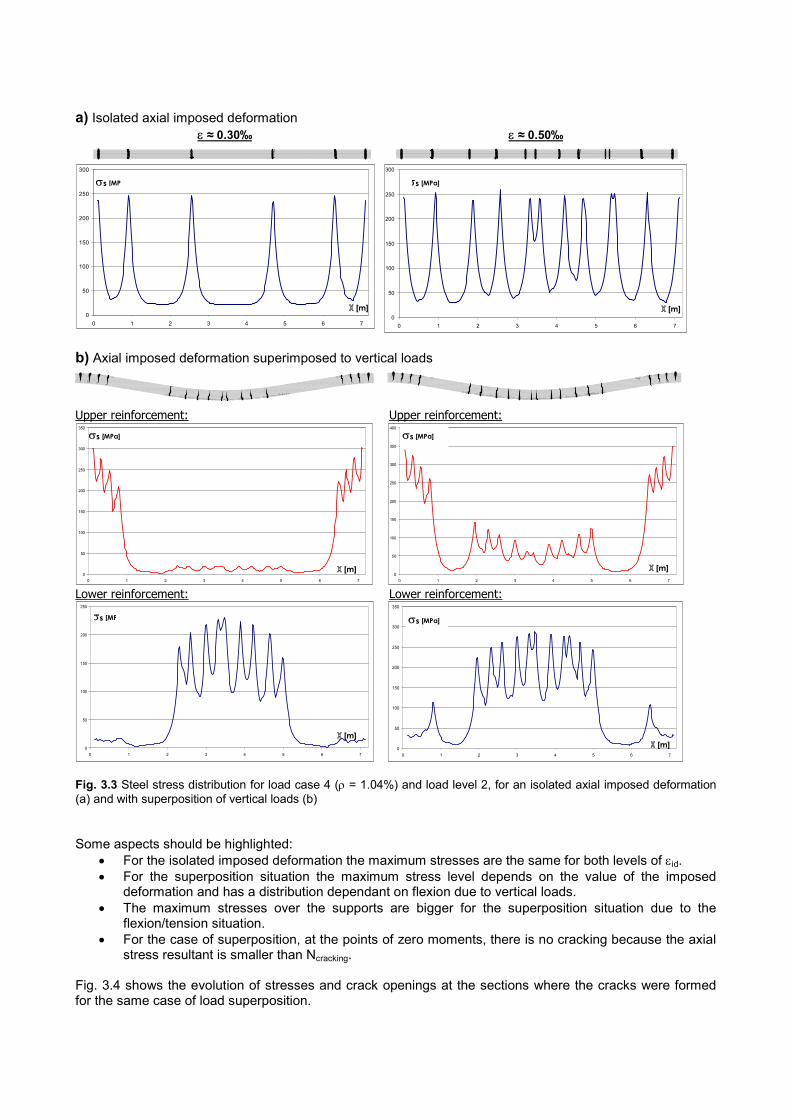
Fig. 3.2. Non linear results in terms of N – εid obtained for the different cases analysed (pink line – level 1 and blue line – level 2) For the global imposed deformation considered the behaviour for a non superposition situation has the characteristics referred in Fig. 2.1.a with each new crack being formed for N ≅ Ncr. On the other hand, when the imposed deformation is superimposed to a certain service load level, the loss of axial rigidity is anticipated due to flexion/tension cracks. However, it can also be noticed that at crack stabilization, for imposed deformations of 1.0 to 1.5‰, the behaviours seem to converge. It is also interesting to highlight that for usual values of imposed deformations (εid ≅ 0.3 to 0.5‰) the maximum axial stress resultants are smaller for bigger values of vertical loads. In Fig. 3.3 the steel stresses distribution, for load case 4 (ρ = 1.04%), are presented for imposed deformation of ε = 0.3‰ and ε = 0.5‰. Fig. 3.3.a presents the case of the isolated imposed deformation, naturally with symmetry for the upper and lower reinforcements. Fig. 3.3.b shows the same results but for the case of superposition to the higher load level showing bigger stresses at the upper fibres near the supports and at the bottom fibres at mid-span.
CASE 1 CASE 2
CASE 3 CASE 4
a) Isolated axial imposed deformation
ε ≈ 0.30‰ ε ≈ 0.50‰
0
50
100
150
200
250
300
0 1 2 3 4 5 6 70
50
100
150
200
250
300
0 1 2 3 4 5 6 7
b) Axial imposed deformation superimposed to vertical loads
Upper reinforcement:
0
50
100
150
200
250
300
350
0 1 2 3 4 5 6 7
Upper reinforcement:
0
50
100
150
200
250
300
350
400
0 1 2 3 4 5 6 7
Lower reinforcement:
0
50
100
150
200
250
0 1 2 3 4 5 6 7
Lower reinforcement:
0
50
100
150
200
250
300
350
0 1 2 3 4 5 6 7
Fig. 3.3 Steel stress distribution for load case 4 (ρ = 1.04%) and load level 2, for an isolated axial imposed deformation (a) and with superposition of vertical loads (b) Some aspects should be highlighted:
• For the isolated imposed deformation the maximum stresses are the same for both levels of εid. • For the superposition situation the maximum stress level depends on the value of the imposed
deformation and has a distribution dependant on flexion due to vertical loads. • The maximum stresses over the supports are bigger for the superposition situation due to the
flexion/tension situation. • For the case of superposition, at the points of zero moments, there is no cracking because the axial
stress resultant is smaller than Ncracking. Fig. 3.4 shows the evolution of stresses and crack openings at the sections where the cracks were formed for the same case of load superposition.
σs [MPa]
X [m]
σs [MP
X [m]
σs [MP
σs [MPa]
X [m]
σs [MPa]
X [m]
σs [MP σs [MPa]
X [m] X [m]
Upper face/reinforcement: Upper face/reinforcement:
0
100
200
300
400
500
0,00 0,10 0,20 0,30 0,40 0,50 0,60 0,70 0,80 0,90
εm [‰]
σs [MN/m2]
0,120
0,336
0,552
0,791
1,031
0
0,0001
0,0002
0,0003
0,0004
0,0005
0,0006w [m]
0
50
100
150
200
250
300
350
400
0,00 0,10 0,20 0,30 0,40 0,50 0,60 0,70 0,80 0,90εm [‰]
σs [MN/m2]
1,0312,3253,0213,3323,6683,9084,219
0,00000
0,00005
0,00010
0,00015
0,00020
0,00025
0,00030
0,00035
0,00040
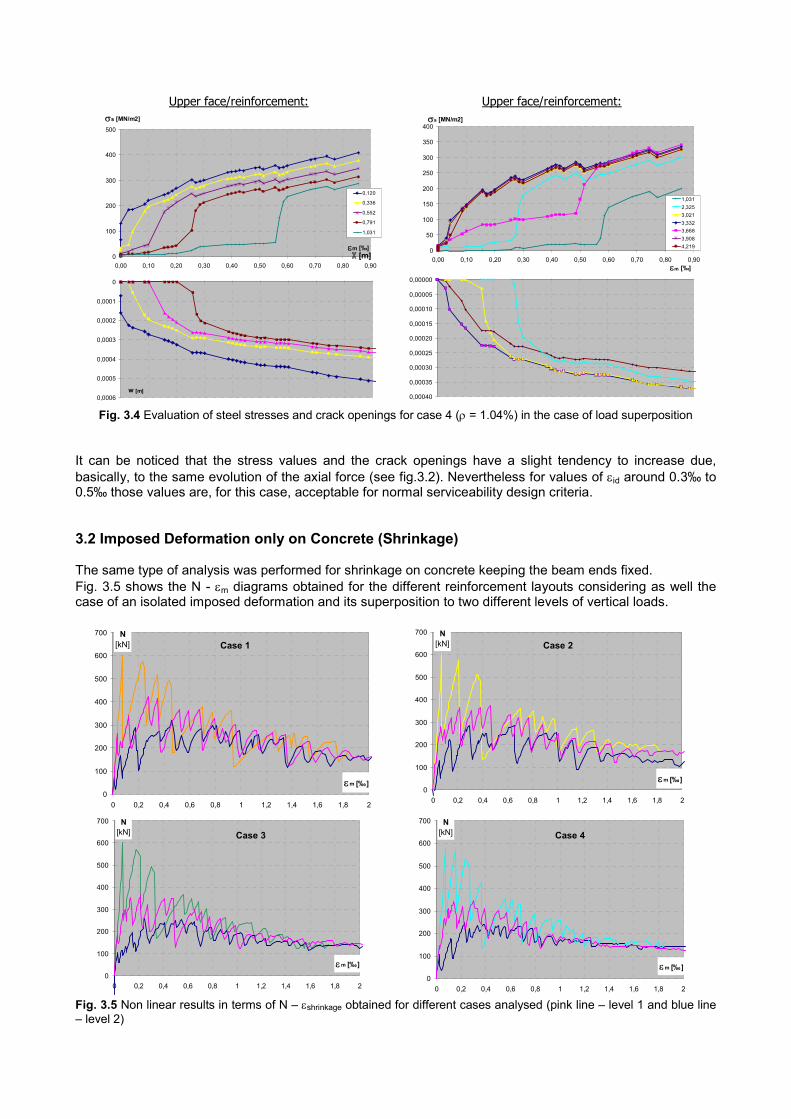
Fig. 3.4 Evaluation of steel stresses and crack openings for case 4 (ρ = 1.04%) in the case of load superposition It can be noticed that the stress values and the crack openings have a slight tendency to increase due, basically, to the same evolution of the axial force (see fig.3.2). Nevertheless for values of εid around 0.3‰ to 0.5‰ those values are, for this case, acceptable for normal serviceability design criteria. 3.2 Imposed Deformation only on Concrete (Shrinkage) The same type of analysis was performed for shrinkage on concrete keeping the beam ends fixed. Fig. 3.5 shows the N - εm diagrams obtained for the different reinforcement layouts considering as well the case of an isolated imposed deformation and its superposition to two different levels of vertical loads.
0
100
200
300
400
500
600
700
0 0,2 0,4 0,6 0,8 1 1,2 1,4 1,6 1,8 2
εm [‰]
N [kN]
0
100
200
300
400
500
600
700
0 0,2 0,4 0,6 0,8 1 1,2 1,4 1,6 1,8 2
εm [‰]
N [kN]
0
100
200
300
400
500
600
700
0 0,2 0,4 0,6 0,8 1 1,2 1,4 1,6 1,8 2
εm [‰]
N [kN]
0
100
200
300
400
500
600
700
0 0,2 0,4 0,6 0,8 1 1,2 1,4 1,6 1,8 2
εm [‰]
N [kN]
Fig. 3.5 Non linear results in terms of N – εshrinkage obtained for different cases analysed (pink line – level 1 and blue line – level 2)
Case 1 Case 2
Case 3 Case 4
X [m]
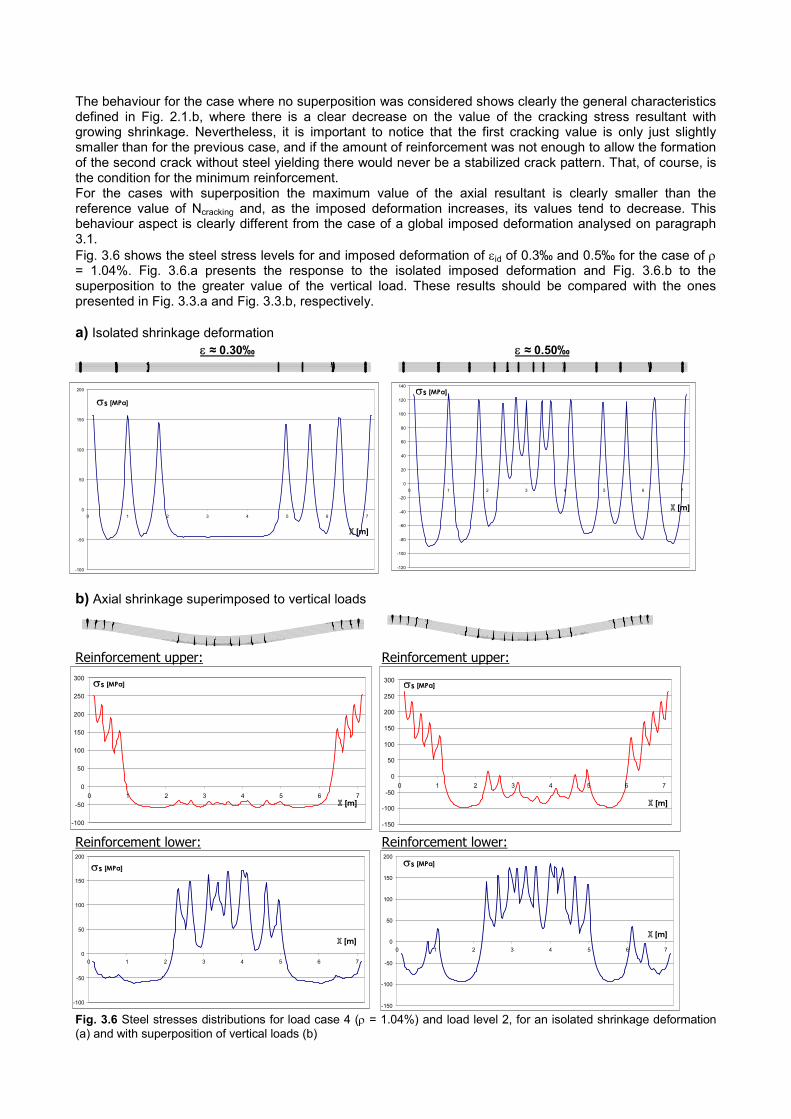
The behaviour for the case where no superposition was considered shows clearly the general characteristics defined in Fig. 2.1.b, where there is a clear decrease on the value of the cracking stress resultant with growing shrinkage. Nevertheless, it is important to notice that the first cracking value is only just slightly smaller than for the previous case, and if the amount of reinforcement was not enough to allow the formation of the second crack without steel yielding there would never be a stabilized crack pattern. That, of course, is the condition for the minimum reinforcement. For the cases with superposition the maximum value of the axial resultant is clearly smaller than the reference value of Ncracking and, as the imposed deformation increases, its values tend to decrease. This behaviour aspect is clearly different from the case of a global imposed deformation analysed on paragraph 3.1. Fig. 3.6 shows the steel stress levels for and imposed deformation of εid of 0.3‰ and 0.5‰ for the case of ρ = 1.04%. Fig. 3.6.a presents the response to the isolated imposed deformation and Fig. 3.6.b to the superposition to the greater value of the vertical load. These results should be compared with the ones presented in Fig. 3.3.a and Fig. 3.3.b, respectively. a) Isolated shrinkage deformation
ε ≈ 0.30‰ ε ≈ 0.50‰
-100
-50
0
50
100
150
200
0 1 2 3 4 5 6 7
-120
-100
-80
-60
-40
-20
0
20
40
60
80
100
120
140
0 1 2 3 4 5 6 7
b) Axial shrinkage superimposed to vertical loads
Reinforcement upper:
-100
-50
0
50
100
150
200
250
300
0 1 2 3 4 5 6 7
Reinforcement upper:
-150
-100
-50
0
50
100
150
200
250
300
0 1 2 3 4 5 6 7
Reinforcement lower:
-100
-50
0
50
100
150
200
0 1 2 3 4 5 6 7
Reinforcement lower:
-150
-100
-50
0
50
100
150
200
0 1 2 3 4 5 6 7
Fig. 3.6 Steel stresses distributions for load case 4 (ρ = 1.04%) and load level 2, for an isolated shrinkage deformation (a) and with superposition of vertical loads (b)
σs [MPa]
X [m]
σs [MPa]
X [m]
σs [MPa]
X [m]
σs [MPa]
X [m]
σs [MPa]
X [m]
σs [MPa]
X [m]
The following aspects should be mentioned to: • The tension stresses in steel for the case of an isolated imposed deformation has peek values
clearly smaller than for the global imposed deformation. • Between cracks steel is naturally in compression due to the self-equilibrated stresses generated in
the section due to concrete shrinkage. • For the case of superposition of effects smaller peek steel stresses are obtained, if compared with
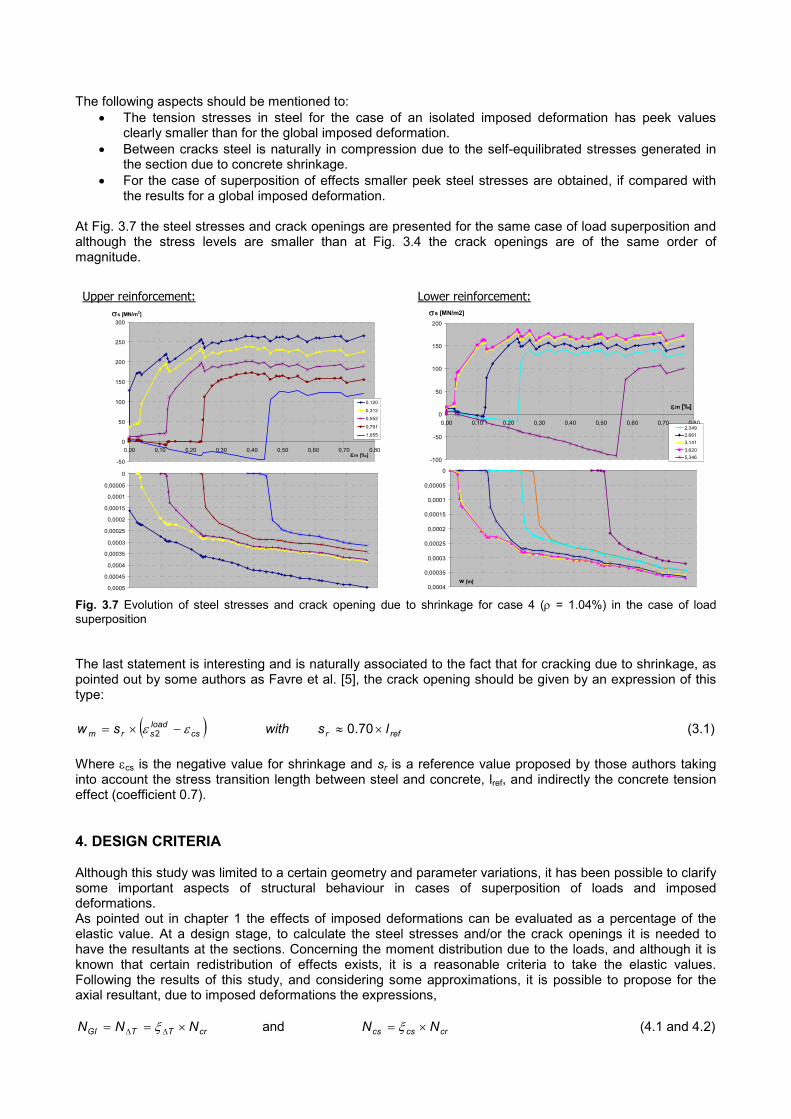
the results for a global imposed deformation. At Fig. 3.7 the steel stresses and crack openings are presented for the same case of load superposition and although the stress levels are smaller than at Fig. 3.4 the crack openings are of the same order of magnitude.
Upper reinforcement: Lower reinforcement:
0
0,00005
0,0001
0,00015
0,0002
0,00025
0,0003
0,00035
0,0004
0,00045
0,0005
-50
0
50
100
150
200
250
300
0,00 0,10 0,20 0,30 0,40 0,50 0,60 0,70 0,80εm [‰]
σs [MN/m2]
0,120
0,312
0,552
0,791
1,055
-100
-50
0
50
100
150
200
0,00 0,10 0,20 0,30 0,40 0,50 0,60 0,70 0,80
εm [‰]
σs [MN/m2]
2,3492,6613,1413,6205,346
0
0,00005
0,0001
0,00015
0,0002
0,00025
0,0003
0,00035
0,0004w [m]
Fig. 3.7 Evolution of steel stresses and crack opening due to shrinkage for case 4 (ρ = 1.04%) in the case of load superposition The last statement is interesting and is naturally associated to the fact that for cracking due to shrinkage, as pointed out by some authors as Favre et al. [5], the crack opening should be given by an expression of this type:
( )csloadsrm sw εε −×= 2 refr lswith ×≈ 70.0 (3.1)
Where εcs is the negative value for shrinkage and sr is a reference value proposed by those authors taking into account the stress transition length between steel and concrete, lref, and indirectly the concrete tension effect (coefficient 0.7). 4. DESIGN CRITERIA Although this study was limited to a certain geometry and parameter variations, it has been possible to clarify some important aspects of structural behaviour in cases of superposition of loads and imposed deformations. As pointed out in chapter 1 the effects of imposed deformations can be evaluated as a percentage of the elastic value. At a design stage, to calculate the steel stresses and/or the crack openings it is needed to have the resultants at the sections. Concerning the moment distribution due to the loads, and although it is known that certain redistribution of effects exists, it is a reasonable criteria to take the elastic values. Following the results of this study, and considering some approximations, it is possible to propose for the axial resultant, due to imposed deformations the expressions,
crTTGI NNN ×== ∆∆ ξ and crcscs NN ×= ξ (4.1 and 4.2)
Where the coefficients ξ∆T and ξcs can be obtained by table 4.1
Table 4.1 Reduction coefficients ξ∆T and ξcs for evaluation of imposed deformation effects
a. global imposed deformation
b. shrinkage imposed deformation ρ
[%] 0.2‰ 0.3‰ 0.5‰ 0.2‰ 0.3‰ 0.5‰ 0.50 0.4 0.55 0.65 0.4 0.45 0.5 0.80 0.50 0.6 0.7 0.4 0.4 0.45 1.00 0.55 0.6 0.8 0.35 0.35 0.4
As it can be seen, ξ variation with reinforcement percentages is not very significant. It is then reasonable, as a simplified design reference to take the bold values on the table independently of the steel reinforcement percentage. As presented in EC2 [4] two serviceability design criteria are important for the analysis of imposed deformation:
• The non yielding of steel, that leads to the minimum amount of reinforcement (σs ≤ fsyk). • A direct or indirect control of crack opening, usually more demanding (σs≤ σadm
s < fsyk or wmax wadmmax).
For the superposition situations analysed in this paper we suggest, for the criteria of non yielding, that the value of N should be evaluated by expressions 4.1 and 4.2, taking an intermediate value for ξ , if the two types of imposed deformation are to be considered, given by: ξ = k ξ∆T + (1 – k) ξcs (4.3) where k [0, 1] is a coefficient that takes into account the relative importance of the temperature variation or global deformation and shrinkage. For the direct control of the crack opening two alternatives could be followed. o A more formal one, where,
( )cs
Tloadsrm
cssw εε ε −×= +∆+2 (4.4)
and crNN ×= ξ with ξ given by 4.3.
o A more simplified alternative considering shrinkage as an equivalent temperature variation. In this
situation a bigger stress level would be obtained, but leading to a reasonable estimation of the crack opening,
( )equivTloadsrm sw ∆+×= 2ε (4.5)
crT NN ×= ∆ξ and αξcs
equiv TT +∆=∆ ; α = 1 x 10⁻⁵
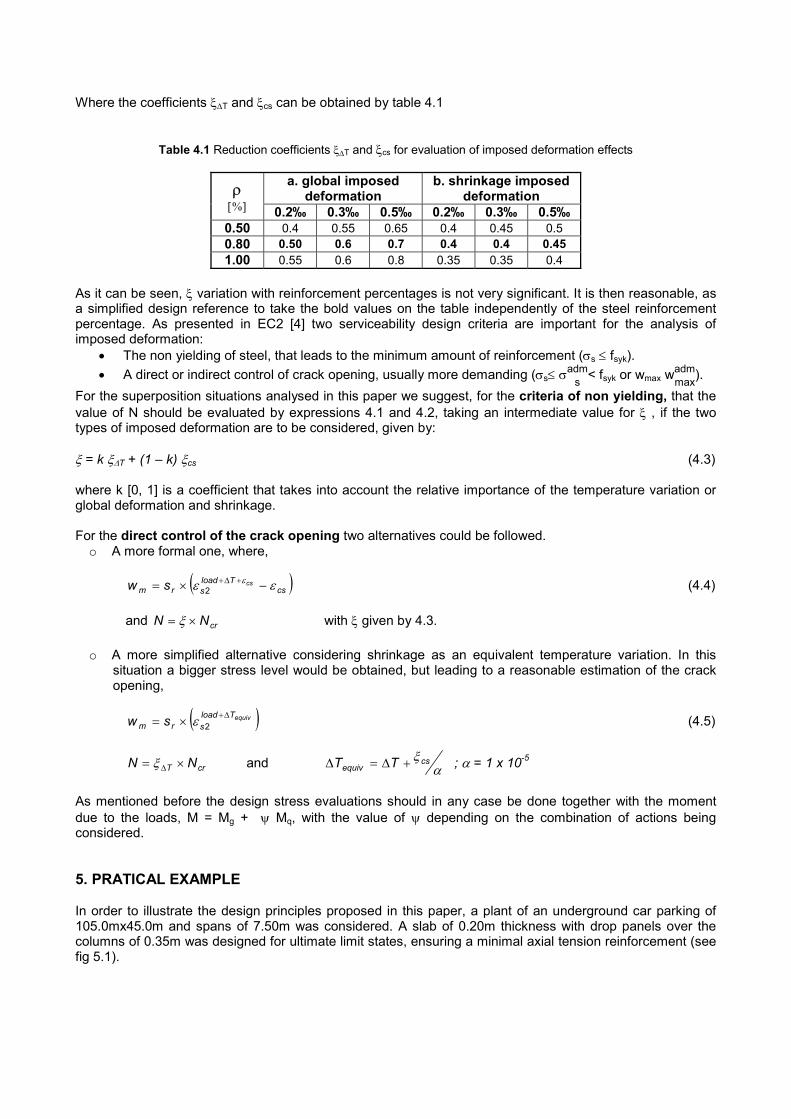
As mentioned before the design stress evaluations should in any case be done together with the moment due to the loads, M = Mg + ψ Mq, with the value of ψ depending on the combination of actions being considered. 5. PRATICAL EXAMPLE In order to illustrate the design principles proposed in this paper, a plant of an underground car parking of 105.0mx45.0m and spans of 7.50m was considered. A slab of 0.20m thickness with drop panels over the columns of 0.35m was designed for ultimate limit states, ensuring a minimal axial tension reinforcement (see fig 5.1).
C25 /30 ; S500
Support Detailing External and Internal span detailing
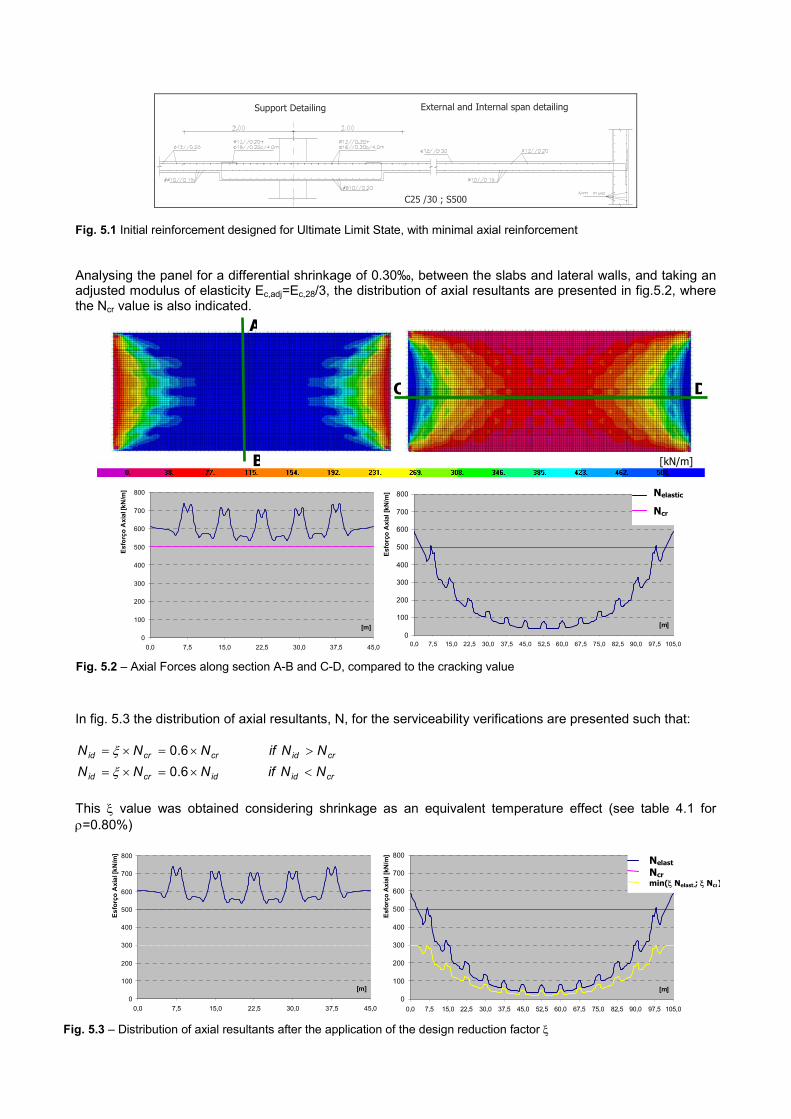
Fig. 5.1 Initial reinforcement designed for Ultimate Limit State, with minimal axial reinforcement Analysing the panel for a differential shrinkage of 0.30‰, between the slabs and lateral walls, and taking an adjusted modulus of elasticity Ec,adj=Ec,28/3, the distribution of axial resultants are presented in fig.5.2, where the Ncr value is also indicated.
0
100
200
300
400
500
600
700
800
0,0 7,5 15,0 22,5 30,0 37,5 45,0
[m]
Esfo
rço
Axi
al [k
N/m
]
0
100
200
300
400
500
600
700
800
0,0 7,5 15,0 22,5 30,0 37,5 45,0 52,5 60,0 67,5 75,0 82,5 90,0 97,5 105,0
[m]
Esfo
rço
Axi
al [k
N/m
]
Fig. 5.2 – Axial Forces along section A-B and C-D, compared to the cracking value
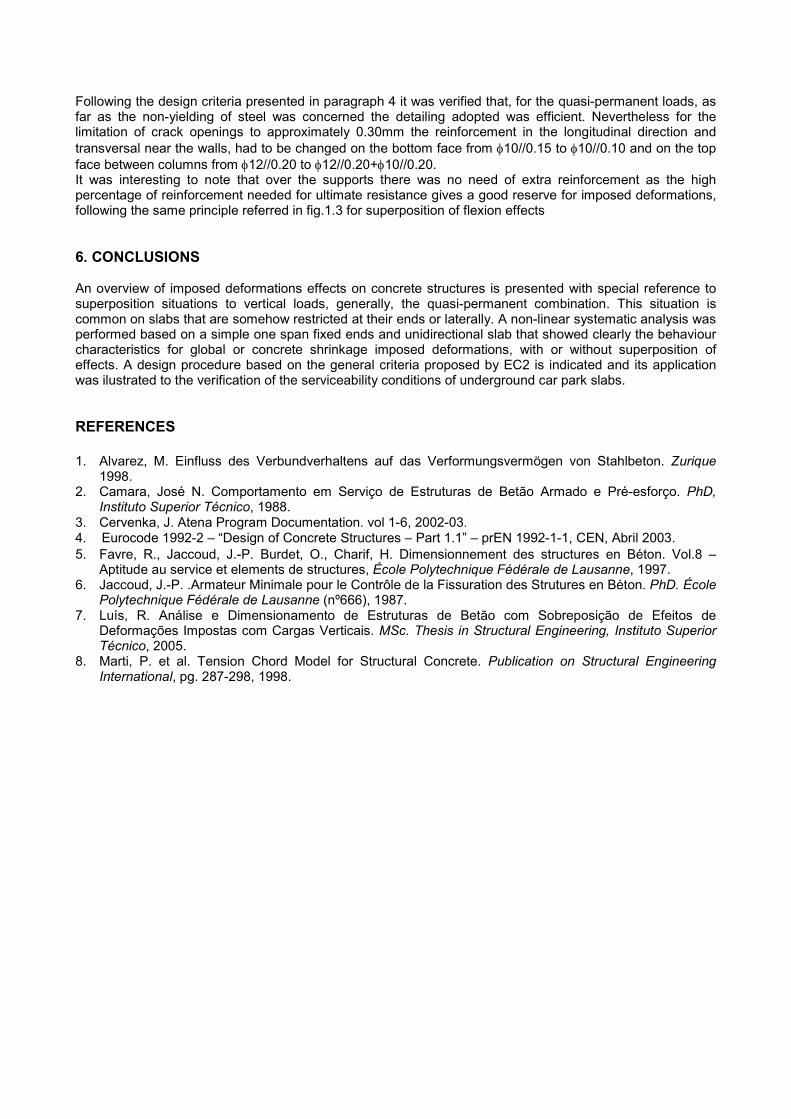
In fig. 5.3 the distribution of axial resultants, N, for the serviceability verifications are presented such that:
cridcrcrid NNifNNN >×=×= 6.0ξ
crididcrid NNifNNN <×=×= 6.0ξ This ξ value was obtained considering shrinkage as an equivalent temperature effect (see table 4.1 for ρ=0.80%)
0
100
200
300
400
500
600
700
800
0,0 7,5 15,0 22,5 30,0 37,5 45,0
[m]
Esfo
rço
Axi
al [k
N/m
]
0
100
200
300
400
500
600
700
800
0,0 7,5 15,0 22,5 30,0 37,5 45,0 52,5 60,0 67,5 75,0 82,5 90,0 97,5 105,0
[m]
Esfo
rço
Axi
al [k
N/m
]
Fig. 5.3 – Distribution of axial resultants after the application of the design reduction factor ξ
A
B
C D
Nelastic
Ncr
[kN/m]
Nelast
Ncr min(ξ Nelast.; ξ Ncr)
Following the design criteria presented in paragraph 4 it was verified that, for the quasi-permanent loads, as far as the non-yielding of steel was concerned the detailing adopted was efficient. Nevertheless for the limitation of crack openings to approximately 0.30mm the reinforcement in the longitudinal direction and transversal near the walls, had to be changed on the bottom face from φ10//0.15 to φ10//0.10 and on the top face between columns from φ12//0.20 to φ12//0.20+φ10//0.20. It was interesting to note that over the supports there was no need of extra reinforcement as the high percentage of reinforcement needed for ultimate resistance gives a good reserve for imposed deformations, following the same principle referred in fig.1.3 for superposition of flexion effects 6. CONCLUSIONS An overview of imposed deformations effects on concrete structures is presented with special reference to superposition situations to vertical loads, generally, the quasi-permanent combination. This situation is common on slabs that are somehow restricted at their ends or laterally. A non-linear systematic analysis was performed based on a simple one span fixed ends and unidirectional slab that showed clearly the behaviour characteristics for global or concrete shrinkage imposed deformations, with or without superposition of effects. A design procedure based on the general criteria proposed by EC2 is indicated and its application was ilustrated to the verification of the serviceability conditions of underground car park slabs. REFERENCES 1. Alvarez, M. Einfluss des Verbundverhaltens auf das Verformungsvermögen von Stahlbeton. Zurique
1998. 2. Camara, José N. Comportamento em Serviço de Estruturas de Betão Armado e Pré-esforço. PhD,
Instituto Superior Técnico, 1988. 3. Cervenka, J. Atena Program Documentation. vol 1-6, 2002-03. 4. Eurocode 1992-2 – “Design of Concrete Structures – Part 1.1” – prEN 1992-1-1, CEN, Abril 2003. 5. Favre, R., Jaccoud, J.-P. Burdet, O., Charif, H. Dimensionnement des structures en Béton. Vol.8 –
Aptitude au service et elements de structures, École Polytechnique Fédérale de Lausanne, 1997. 6. Jaccoud, J.-P. .Armateur Minimale pour le Contrôle de la Fissuration des Strutures en Béton. PhD. École
Polytechnique Fédérale de Lausanne (nº666), 1987. 7. Luís, R. Análise e Dimensionamento de Estruturas de Betão com Sobreposição de Efeitos de
Deformações Impostas com Cargas Verticais. MSc. Thesis in Structural Engineering, Instituto Superior Técnico, 2005.
8. Marti, P. et al. Tension Chord Model for Structural Concrete. Publication on Structural Engineering International, pg. 287-298, 1998.