Embed Size (px)
Citation preview
July 2016
Study of third-party debt collection operations
1
Table of contents Table of contents ......................................................................................................... 1
1. Introduction ........................................................................................................... 3
2. How the study was conducted ............................................................................ 5
2.1 Written survey ........................................................................................... 5
2.2 Phone calls with collection firms .............................................................. 7
2.3 Phone calls with vendors .......................................................................... 8
3. Respondent characteristics ................................................................................ 9
3.1 Types of debt collected by respondents .................................................... 9
3.2 Comparing large and small collection firms ............................................ 11
3.3 Collector and client characteristics ......................................................... 12
3.4 Employees ............................................................................................... 16
3.5 Litigation ................................................................................................. 17
3.6 Furnishing information to credit bureaus .............................................. 19
3.7 Audits for legal compliance .................................................................... 20
4. Information flows ................................................................................................ 22
4.1 Obtaining information from creditors .................................................... 22
4.2 Maintaining and using account information .......................................... 23
4.3 Collection management systems ............................................................ 24
2
5. Engagement with consumers ............................................................................ 28
5.1 Written communications ........................................................................ 28
5.2 Calling consumers .................................................................................. 28
5.3 Debt collection disputes ......................................................................... 30
6. Use of vendors, technology and other cost points ......................................... 32
6.1 Utilization of technology and vendors .................................................... 32
6.2 Litigation costs ........................................................................................ 34
Appendix A: ............................................................................................................... 36
Sample selection process ................................................................................. 36
3
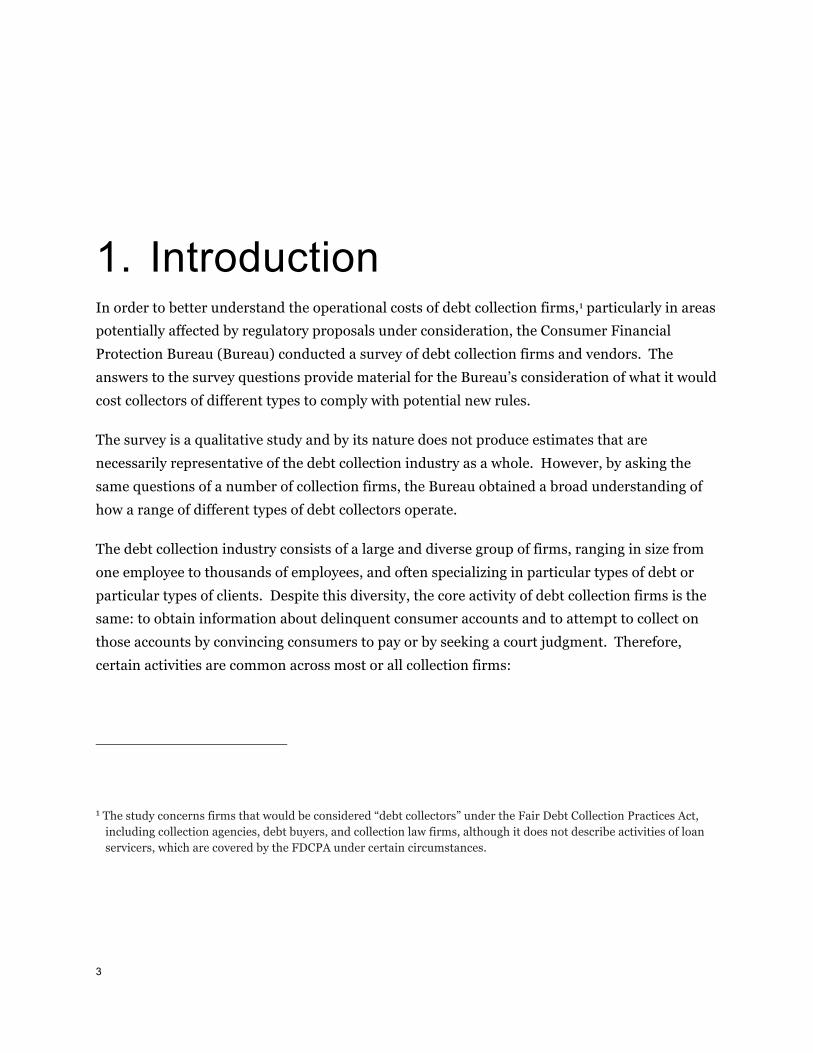
1. Introduction In order to better understand the operational costs of debt collection firms,1 particularly in areas potentially affected by regulatory proposals under consideration, the Consumer Financial Protection Bureau (Bureau) conducted a survey of debt collection firms and vendors. The answers to the survey questions provide material for the Bureau’s consideration of what it would cost collectors of different types to comply with potential new rules.
The survey is a qualitative study and by its nature does not produce estimates that are necessarily representative of the debt collection industry as a whole. However, by asking the same questions of a number of collection firms, the Bureau obtained a broad understanding of how a range of different types of debt collectors operate.
The debt collection industry consists of a large and diverse group of firms, ranging in size from one employee to thousands of employees, and often specializing in particular types of debt or particular types of clients. Despite this diversity, the core activity of debt collection firms is the same: to obtain information about delinquent consumer accounts and to attempt to collect on those accounts by convincing consumers to pay or by seeking a court judgment. Therefore, certain activities are common across most or all collection firms:
1 The study concerns firms that would be considered “debt collectors” under the Fair Debt Collection Practices Act, including collection agencies, debt buyers, and collection law firms, although it does not describe activities of loan servicers, which are covered by the FDCPA under certain circumstances.
4
§ Obtaining data about delinquent accounts and making it available to collection staff, generally using a software platform referred to in this report as a “collection management system”;
§ Calling consumers to ask them to pay;
§ Sending letters to consumers, including validation notices containing mandatory disclosures;
§ Posting payments, reconciling balances, and communicating payment information to collectors and clients;
§ Processing and investigating consumer disputes;
§ Furnishing information to credit bureaus; and
§ Pursuing litigation against consumers.
The written questions and phone interviews in the Bureau’s survey focused on understanding these and other aspects of debt collection firm operations.
5
2. How the study was conducted
The study consisted of a written survey that was sent to debt collection firms, telephone interviews with a subset of the respondents to the survey, and telephone interviews with vendors to the debt collection industry.2
All responses were voluntary. Respondents that chose to participate are likely to be those debt collection firms that were most comfortable with speaking to the CFPB. Respondents are likely to be those most confident that their procedures are compliant with the Fair Debt Collection Practices Act (FDCPA) and other laws. For this and other reasons, the responses may not be representative of the industry as a whole.
2.1 Written survey The written survey was conducted from July to September 2015 and inquired about current practices. The survey included questions about employees, types of debt collected, clients, vendors, software, policies and procedures for consumer interaction, disputes, furnishing data
2 The survey was conducted under OMB control number 3170-0032.

6
to credit bureaus, litigation, and compliance. The written survey also asked whether respondents would be willing to participate in follow up telephone interviews.
To identify potential respondents for the written survey, the Bureau began with data from InfoGroup’s ReferenceUSAGov database, which attempts to identify all debt collection firms in the United States and certain basic information about those firms, including estimated number of employees and contact phone number. The Bureau randomly selected a sample of firms from this data set, stratifying the sample according to firm size.3 From this sample, the Bureau ultimately received 56 responses. The Bureau also asked trade associations to identify additional firms in categories that were not widely represented among the initial survey respondents. From these efforts, the Bureau received an additional four written responses. In the results below, two respondents are excluded: one that collects exclusively commercial debt and one that appears to be a collections subsidiary of a large bank, collecting only the accounts of the bank itself. 4
Table 1 illustrates how the survey sample compares to the overall population of debt collectors. The first two columns of Table 1 present Census data on the number of U.S. debt collection firms and revenue generated by those firms, along with the number of firms included in the sample. Most debt collection firms are small, with over 75 percent of firms employing fewer than 20 people each. However, most revenue is generated by larger firms, with about two thirds of industry revenue generated by collection firms with at least 100 employees.
3 Appendix A describes the sample selection process in more detail.
4 These types of firms would generally not be covered b y the FDCPA.
7
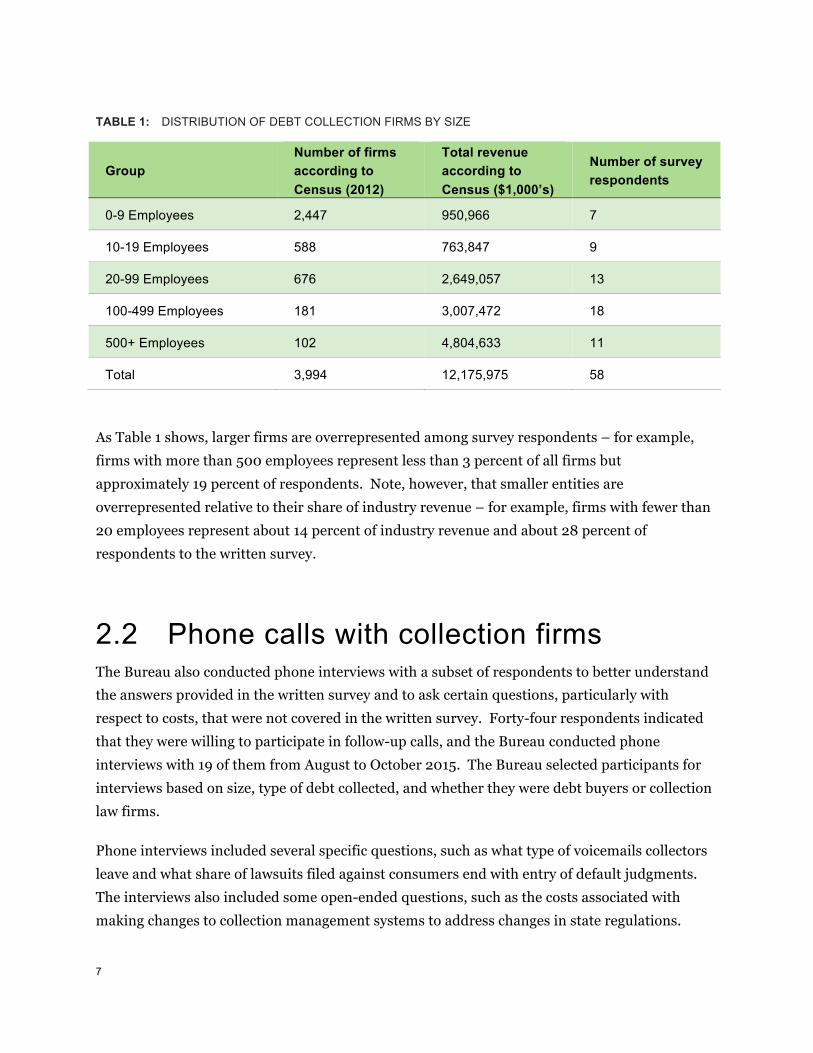
TABLE 1: DISTRIBUTION OF DEBT COLLECTION FIRMS BY SIZE
Group Number of firms according to Census (2012)
Total revenue according to Census ($1,000’s)
Number of survey respondents
0-9 Employees 2,447 950,966 7
10-19 Employees 588 763,847 9
20-99 Employees 676 2,649,057 13
100-499 Employees 181 3,007,472 18
500+ Employees 102 4,804,633 11
Total 3,994 12,175,975 58
As Table 1 shows, larger firms are overrepresented among survey respondents – for example, firms with more than 500 employees represent less than 3 percent of all firms but approximately 19 percent of respondents. Note, however, that smaller entities are overrepresented relative to their share of industry revenue – for example, firms with fewer than 20 employees represent about 14 percent of industry revenue and about 28 percent of respondents to the written survey.
2.2 Phone calls with collection firms The Bureau also conducted phone interviews with a subset of respondents to better understand the answers provided in the written survey and to ask certain questions, particularly with respect to costs, that were not covered in the written survey. Forty-four respondents indicated that they were willing to participate in follow-up calls, and the Bureau conducted phone interviews with 19 of them from August to October 2015. The Bureau selected participants for interviews based on size, type of debt collected, and whether they were debt buyers or collection law firms.
Phone interviews included several specific questions, such as what type of voicemails collectors leave and what share of lawsuits filed against consumers end with entry of default judgments. The interviews also included some open-ended questions, such as the costs associated with making changes to collection management systems to address changes in state regulations.
8
2.3 Phone calls with vendors The Bureau also conducted phone interviews with companies that supply products and services to debt collectors from July to October 2015. The Bureau selected, based on responses to the written survey and general industry knowledge, 15 vendors that the Bureau believed would provide insights relevant to a range of debt collectors. A particular focus of the vendor calls was collection management systems, including calls to suppliers of such systems and vendors that provide programming and consulting services to users of the systems. The Bureau also spoke with vendors providing print mail services, predictive dialers, voice analytics, payment processing, and data services.
Each vendor interview covered the following:
§ Products and services offered, including major features of the vendor’s product or service and differences across clients in how they use the vendor’s products or services;
§ Clients and competition, including segment of the debt collection market targeted by the vendor, the size of the clients served by the vendor, the vendor’s main competitors, and the market share of the vendor and main competitors;
§ The vendor’s pricing model and approximate prices for their product or service and competitors’ products or services; and
§ How the vendor’s product is affected by the regulatory environment.
9
3. Respondent characteristics This section describes the firms that responded to the survey and the main ways in which they differ from one another, including what the Bureau learned about collection firms’ relationships with their clients, certain account-related variables, and employment. Many characteristics of a debt collection firm are correlated with the characteristics of the clients that the collector works for, including the size of the clients and the category of debt collected.
Most of the survey respondents collect debt on behalf of clients, rather than buying debt. Of those respondents that do buy debt, many reported that they only have a small portfolio of debt that they own and collect upon and that the majority of the accounts they collect upon were for clients. As a result, this study does not provide distinct information or insights on debt buyers and their operations as compared to debt collectors.
Respondents included five law firms. Responses from law firms are generally included with other respondents below unless otherwise noted.
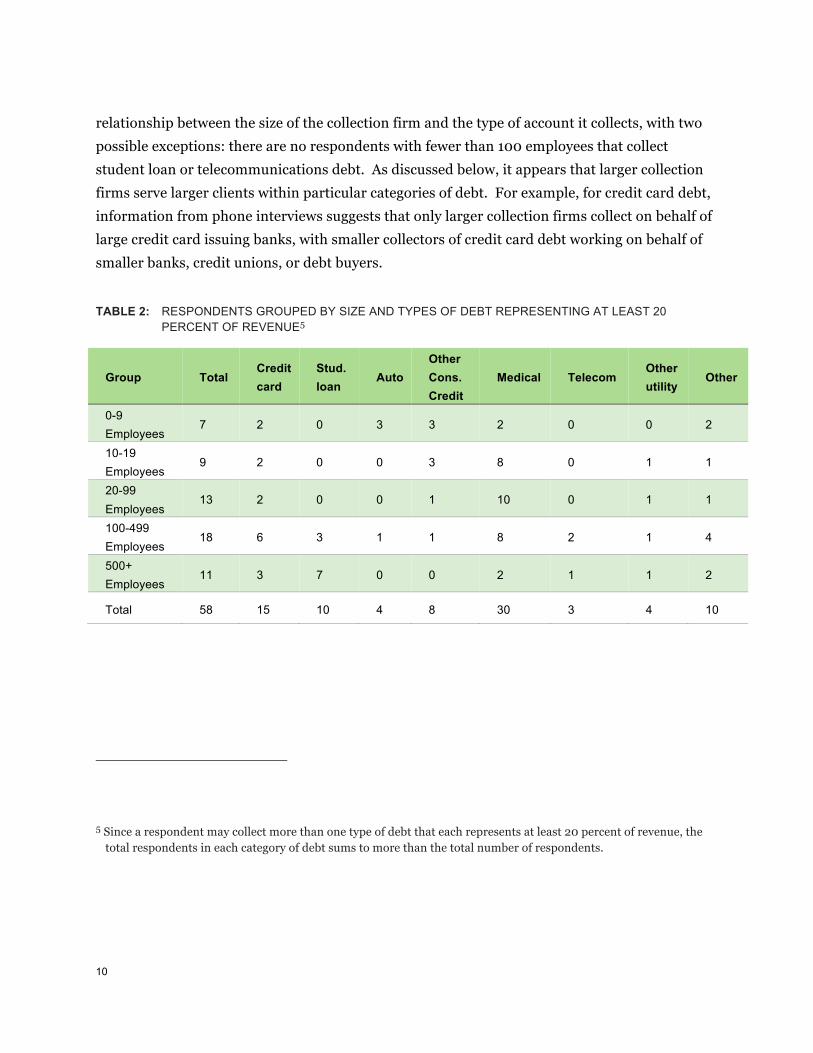
3.1 Types of debt collected by respondents There are many types of accounts that collection firms attempt to collect. Some collection firms specialize in a particular type of debt, although most collect on other types of debt as well. Survey respondents identified the approximate share of revenue that they receive from each of eight categories of debt. Table 2 below presents the distribution of respondents by number of employees and by types of debt that represent 20 percent or more of the respondent’s revenue.
More than half of the respondents collect medical debt, with medical debt collectors representing an especially large share of collection firms with 10 to 99 employees among survey respondents. Although not reported in this table, 17 of 58 respondents derived at least 50 percent of their revenue from medical collections. The sample does not suggest any clear
10
relationship between the size of the collection firm and the type of account it collects, with two possible exceptions: there are no respondents with fewer than 100 employees that collect student loan or telecommunications debt. As discussed below, it appears that larger collection firms serve larger clients within particular categories of debt. For example, for credit card debt, information from phone interviews suggests that only larger collection firms collect on behalf of large credit card issuing banks, with smaller collectors of credit card debt working on behalf of smaller banks, credit unions, or debt buyers.
TABLE 2: RESPONDENTS GROUPED BY SIZE AND TYPES OF DEBT REPRESENTING AT LEAST 20 PERCENT OF REVENUE5
Group Total Credit card
Stud. loan
Auto Other Cons. Credit
Medical Telecom Other utility
Other
0-9 Employees
7 2 0 3 3 2 0 0 2
10-19 Employees
9 2 0 0 3 8 0 1 1
20-99 Employees
13 2 0 0 1 10 0 1 1
100-499 Employees
18 6 3 1 1 8 2 1 4
500+ Employees
11 3 7 0 0 2 1 1 2
Total 58 15 10 4 8 30 3 4 10
5 Since a respondent may collect more than one type of debt that each represents at least 20 percent of revenue, the total respondents in each category of debt sums to more than the total number of respondents.
11
3.2 Comparing large and small collection firms
Some collection practices and policies appear to differ systematically by the size of the collection firm. Many of these differences may be driven by the types of clients served by collection firms of different sizes, which is discussed in more detail in the next subsection.
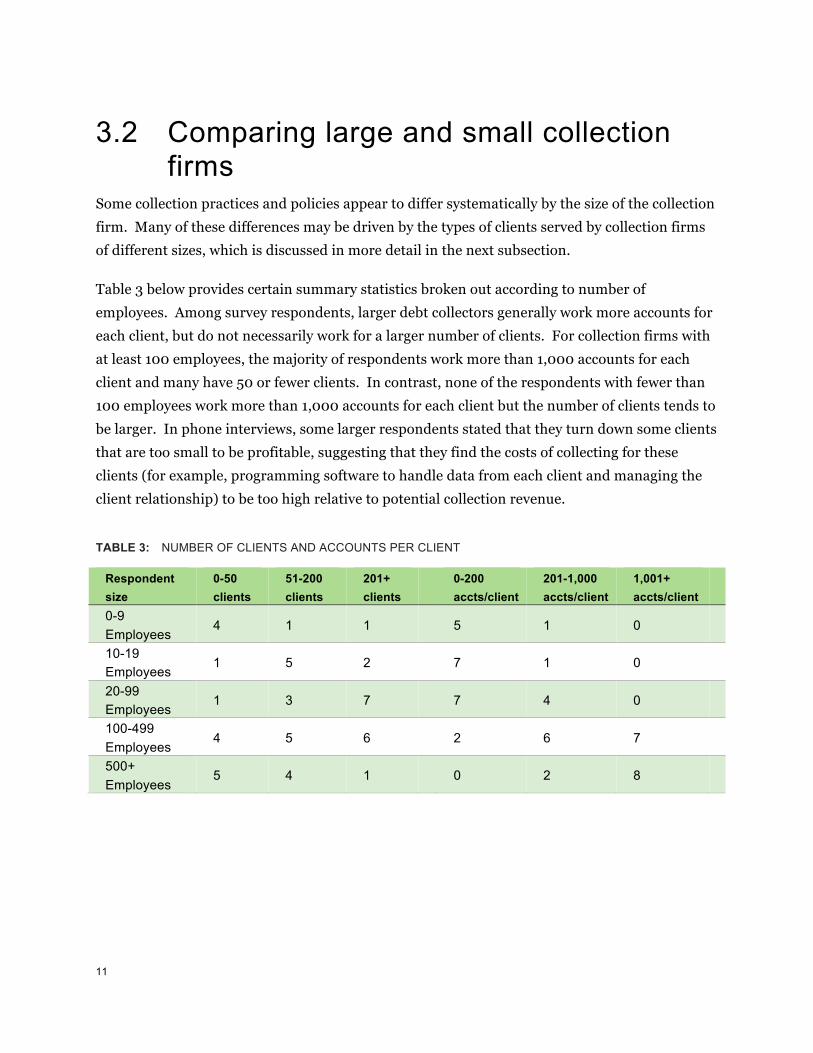
Table 3 below provides certain summary statistics broken out according to number of employees. Among survey respondents, larger debt collectors generally work more accounts for each client, but do not necessarily work for a larger number of clients. For collection firms with at least 100 employees, the majority of respondents work more than 1,000 accounts for each client and many have 50 or fewer clients. In contrast, none of the respondents with fewer than 100 employees work more than 1,000 accounts for each client but the number of clients tends to be larger. In phone interviews, some larger respondents stated that they turn down some clients that are too small to be profitable, suggesting that they find the costs of collecting for these clients (for example, programming software to handle data from each client and managing the client relationship) to be too high relative to potential collection revenue.
TABLE 3: NUMBER OF CLIENTS AND ACCOUNTS PER CLIENT
Respondent size
0-50 clients
51-200 clients
201+ clients
0-200 accts/client
201-1,000 accts/client
1,001+ accts/client
0-9 Employees
4 1 1 5 1 0
10-19 Employees
1 5 2 7 1 0
20-99 Employees
1 3 7 7 4 0
100-499 Employees
4 5 6 2 6 7
500+ Employees
5 4 1 0 2 8
12
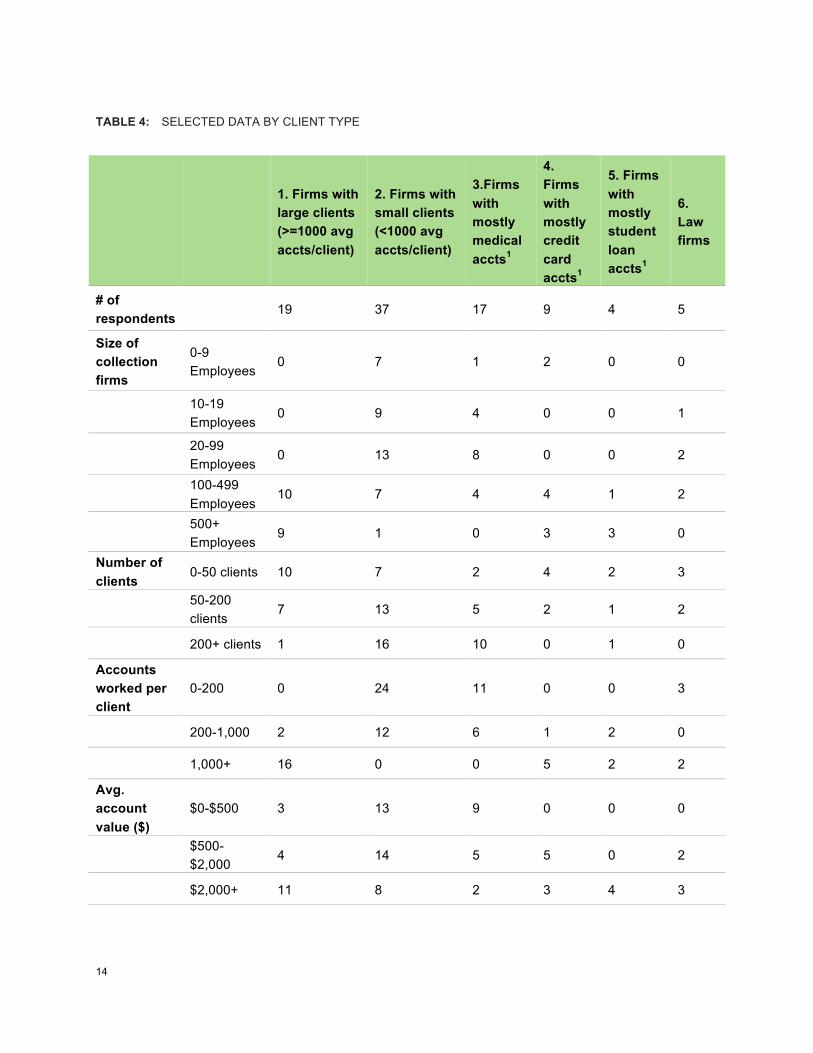
3.3 Collector and client characteristics Different creditors use debt collection firms in different ways to recover their delinquent accounts. Table 4 below provides summary statistics broken out by certain collector characteristics. Columns 1 and 2 present data for debt collectors that work for “large” and “small” clients, respectively, as represented by whether the collector’s clients place more or fewer than 1,000 accounts with the collector, on average. Columns 3-5 present data for respondents that receive at least 50 percent of their revenue from collecting particular types of debt, and column 6 presents data for law firm respondents.6
The first two columns of Table 4 illustrate some notable differences between collectors that work for larger clients and those that work for smaller clients.7 Firms with larger clients generally are larger themselves, collect accounts with higher average dollar values, and serve a smaller number of clients. Several findings suggest that larger clients more actively manage their collection agencies than smaller clients do.
§ Client audits. Seventeen of nineteen respondents with large average clients reported that they face “frequent” audits by their clients, with the other two saying that they face client audits “sometimes.” In contrast, only seven of 37 respondents with small average clients face frequent audits, and 14 of 37 face no audits at all.
6 Debt buyers were not broken out into a separate category because most of the debt buyers interviewed only had a small portfolio of debt that they owned and collected upon; the majority of the accounts they collected upon were for a client.
7 Two respondents did not provide the information necessary to determine the number of accounts worked per client. As a result, these two respondents were excluded from the first two columns.

13
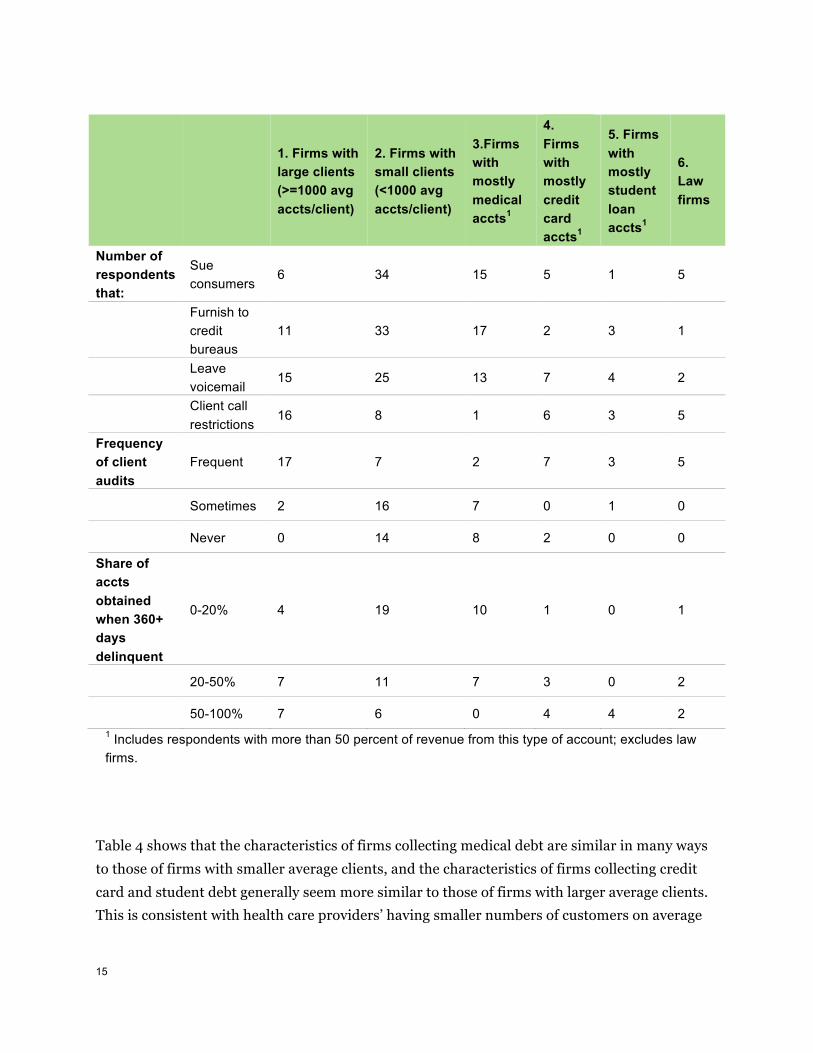
§ Use of multiple collection firms and rotation of accounts. Collection firms working for large average clients generally stated that clients assign accounts to a particular firm for a limited period, often six to twelve months. After that period has elapsed, clients recall the accounts and may place them with another firm or sell them to a debt buyer. In contrast, respondents working for smaller average clients often said that they are the only collection firm working with most of their clients. Their clients assign accounts to them indefinitely or until the statute of limitations for filing a lawsuit expires. One way this difference is reflected in Table 5 is in the share of accounts that the collection firm receives that are at least 360 days delinquent. Firms working for larger clients have a higher share of accounts that are more than 360 days delinquent when received, which may reflect in part that they are more likely to receive accounts that another debt collector (or the client itself) has previously attempted to collect.
§ Lawsuits. Only six of the 19 respondents (including one law firm) with large average clients have a practice of suing consumers, whereas 34 of the 37 respondents (including three law firms) with small clients sue consumers. Collection agencies that do not sue consumers may have clients that choose never to sue or that use other firms when they litigate accounts.
§ Call caps. Sixteen of 19 respondents with large average clients said that at least some of their clients impose limits on how frequently they call consumers, whereas only eight of the 37 respondents with small average clients said they ever face client call restrictions.
14
TABLE 4: SELECTED DATA BY CLIENT TYPE
1. Firms with large clients (>=1000 avg accts/client)
2. Firms with small clients (<1000 avg accts/client)
3.Firms with mostly medical accts1
4. Firms with mostly credit card accts1
5. Firms with mostly student loan accts1
6. Law firms
# of respondents
19 37 17 9 4 5
Size of collection firms
0-9 Employees
0 7 1 2 0 0
10-19 Employees
0 9 4 0 0 1
20-99 Employees
0 13 8 0 0 2
100-499 Employees
10 7 4 4 1 2
500+ Employees
9 1 0 3 3 0
Number of clients
0-50 clients 10 7 2 4 2 3
50-200 clients
7 13 5 2 1 2
200+ clients 1 16 10 0 1 0
Accounts worked per client
0-200 0 24 11 0 0 3
200-1,000 2 12 6 1 2 0
1,000+ 16 0 0 5 2 2
Avg. account value ($)
$0-$500 3 13 9 0 0 0
$500-$2,000
4 14 5 5 0 2
$2,000+ 11 8 2 3 4 3
15
1. Firms with large clients (>=1000 avg accts/client)
2. Firms with small clients (<1000 avg accts/client)
3.Firms with mostly medical accts1
4. Firms with mostly credit card accts1
5. Firms with mostly student loan accts1
6. Law firms
Number of respondents that:
Sue consumers
6 34 15 5 1 5
Furnish to credit bureaus
11 33 17 2 3 1
Leave voicemail
15 25 13 7 4 2
Client call restrictions
16 8 1 6 3 5
Frequency of client audits
Frequent 17 7 2 7 3 5
Sometimes 2 16 7 0 1 0
Never 0 14 8 2 0 0
Share of accts obtained when 360+ days delinquent
0-20% 4 19 10 1 0 1
20-50% 7 11 7 3 0 2
50-100% 7 6 0 4 4 2 1 Includes respondents with more than 50 percent of revenue from this type of account; excludes law firms.
Table 4 shows that the characteristics of firms collecting medical debt are similar in many ways to those of firms with smaller average clients, and the characteristics of firms collecting credit card and student debt generally seem more similar to those of firms with larger average clients. This is consistent with health care providers’ having smaller numbers of customers on average
16
than many creditors, and lower average balances for medical bills than for delinquent credit card accounts.
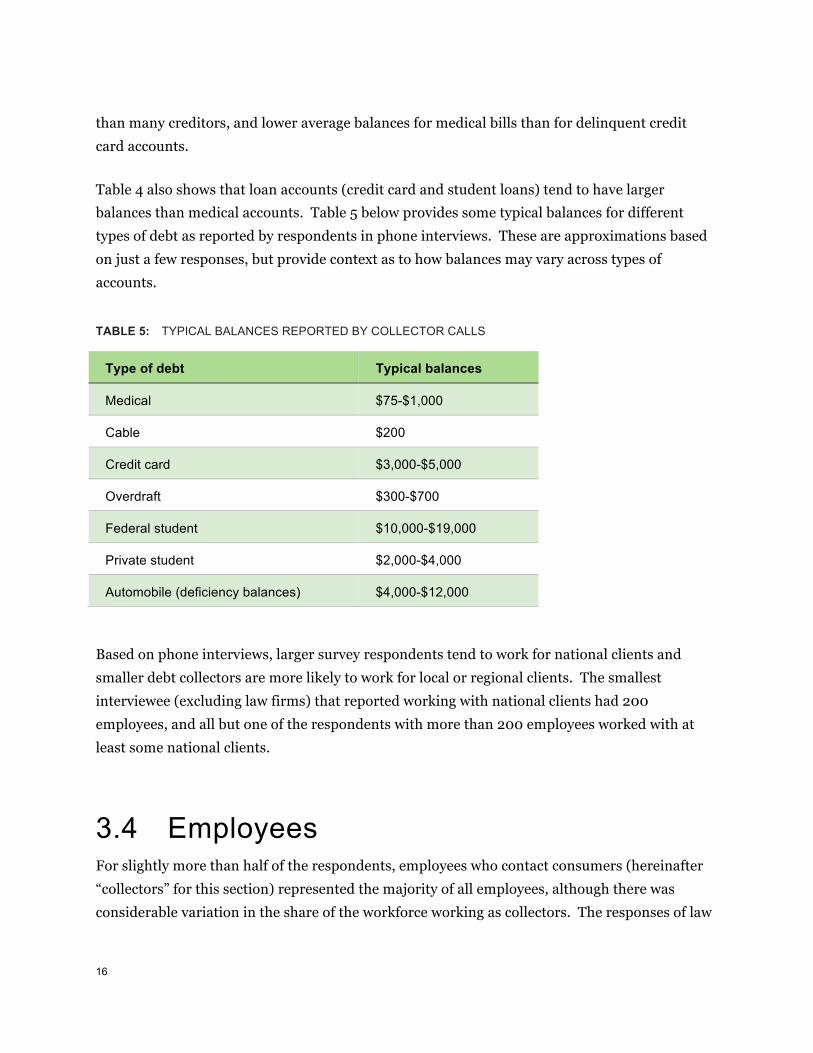
Table 4 also shows that loan accounts (credit card and student loans) tend to have larger balances than medical accounts. Table 5 below provides some typical balances for different types of debt as reported by respondents in phone interviews. These are approximations based on just a few responses, but provide context as to how balances may vary across types of accounts.
TABLE 5: TYPICAL BALANCES REPORTED BY COLLECTOR CALLS
Type of debt Typical balances
Medical $75-$1,000
Cable $200
Credit card $3,000-$5,000
Overdraft $300-$700
Federal student $10,000-$19,000
Private student $2,000-$4,000
Automobile (deficiency balances) $4,000-$12,000
Based on phone interviews, larger survey respondents tend to work for national clients and smaller debt collectors are more likely to work for local or regional clients. The smallest interviewee (excluding law firms) that reported working with national clients had 200 employees, and all but one of the respondents with more than 200 employees worked with at least some national clients.
3.4 Employees For slightly more than half of the respondents, employees who contact consumers (hereinafter “collectors” for this section) represented the majority of all employees, although there was considerable variation in the share of the workforce working as collectors. The responses of law
17
firms and other debt collectors that engage in litigation suggested that they generally had a lower share of employees that they considered collectors.
In phone interviews, respondents reported that beginning collectors generally earn from $10 to $11 per hour plus incentive pay and that experienced collectors generally earn from $13 to $20 per hour plus incentive pay. According to one respondent, the commission fee that collectors could earn was typically 25 percent of contingency fees earned in excess of a certain threshold. Respondents generally reported attempting to collect on an average of between 1,000 and 3,000 accounts for each collector employed.
Most respondents reported a training period of two to four weeks for new collectors. Reported turnover was relatively low among smaller respondents, whereas larger respondents (with more than 250 employees) reported annual turnover rates of 75 percent to 100 percent.
Larger respondents generally reported that they have in-house IT staff, whereas smaller respondents either rely on outside vendors for programming support or have software systems that can be managed without a great deal of programming expertise. Of the respondents that participated in phone interviews, the smallest with full-time IT staff had 83 employees. Larger collection firms also generally reported that they had a dedicated compliance staff, with employees often having somewhat specialized roles. Activities of compliance staff typically included listening to call recordings, training staff, responding to consumer complaints, monitoring changes in state laws, and implementing the firm’s policies and procedures. Smaller respondents generally reported having only one or two employees responsible for compliance as part of their duties, with compliance tasks often undertaken by the firm’s management.
3.5 Litigation Forty-two of the 58 respondents reported that they file complaints in court to collect on debts as part of their business practice. Of these, 39 respondents reported engaging in pre-litigation outreach if the client allows it. The outreach typically takes the form of one letter and/or phone call attempt to give the consumer notice of the intent to sue and a chance to resolve the debt before litigation begins.
Based on phone interviews, collection firms consider a number of factors when deciding whether to pursue litigation on a particular account. Most interviewees said they would litigate
18
only if account balances exceed a certain threshold, typically around $500 to $1000. The cost of filing a claim plays a large role in litigation decisions and varies significantly across jurisdications based on differences in factors such as filing fees and what types of collections claims can be brought in small claims court. Besides balance amount and court costs, respondents also reported considering information about a consumer’s employment, whether the consumer has substantial assets, whether the consumer is bankrupt or deceased, whether the respondent has good address information for the consumer to effect service of process, and the number of prior collection attempts.
Law firm respondents said they obtain all the documentation they believe they need for litigation prior to initiating a lawsuit. Law firms generally said that they receive the documentation at placement, and do not need to go back to their clients for more information. Debt collectors that hire law firms for litigation generally reported that they review the account documentation prior to referring an account to a law firm for suit, with a focus on determining whether the account meets their litigation criteria.
Respondents reported obtaining default judgments in 60 to 90 percent of their filed suits (this does not include jurisdictions where the defendant’s appearance in court is necessary before the court will enter a default judgment), with the percentage appearing to vary according to jurisdiction.
19
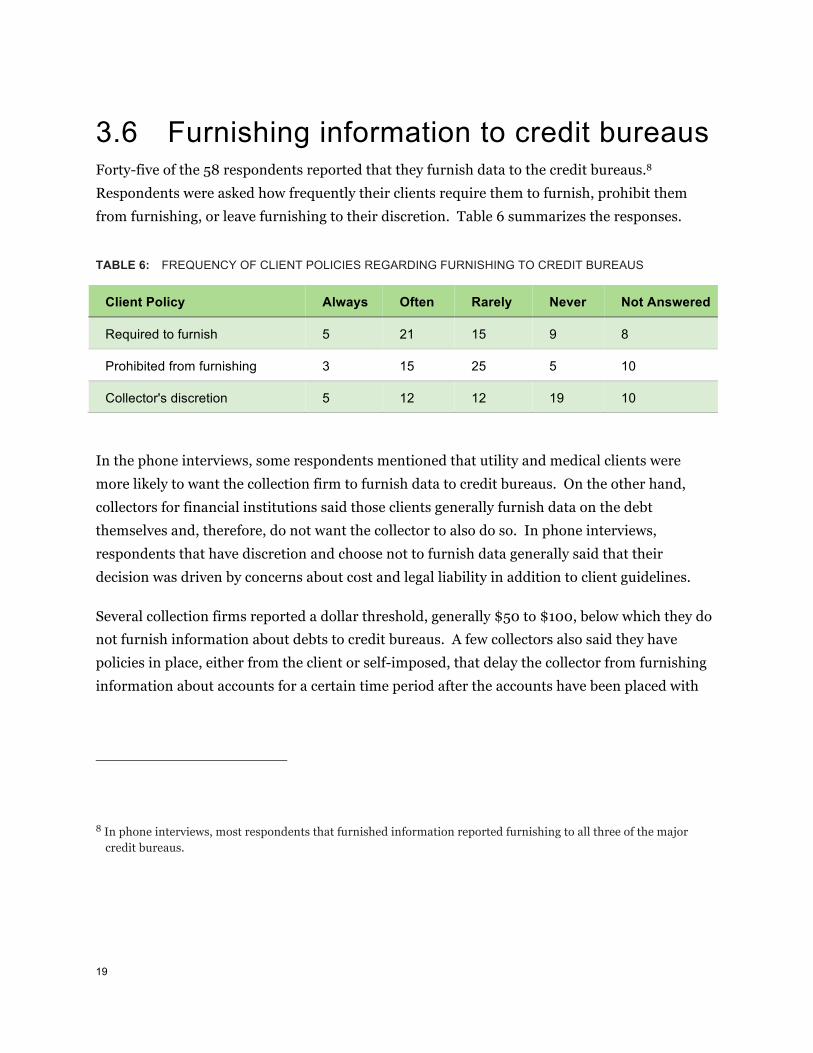
3.6 Furnishing information to credit bureaus Forty-five of the 58 respondents reported that they furnish data to the credit bureaus.8 Respondents were asked how frequently their clients require them to furnish, prohibit them from furnishing, or leave furnishing to their discretion. Table 6 summarizes the responses.
TABLE 6: FREQUENCY OF CLIENT POLICIES REGARDING FURNISHING TO CREDIT BUREAUS
Client Policy Always Often Rarely Never Not Answered
Required to furnish 5 21 15 9 8
Prohibited from furnishing 3 15 25 5 10
Collector's discretion 5 12 12 19 10
In the phone interviews, some respondents mentioned that utility and medical clients were more likely to want the collection firm to furnish data to credit bureaus. On the other hand, collectors for financial institutions said those clients generally furnish data on the debt themselves and, therefore, do not want the collector to also do so. In phone interviews, respondents that have discretion and choose not to furnish data generally said that their decision was driven by concerns about cost and legal liability in addition to client guidelines.
Several collection firms reported a dollar threshold, generally $50 to $100, below which they do not furnish information about debts to credit bureaus. A few collectors also said they have policies in place, either from the client or self-imposed, that delay the collector from furnishing information about accounts for a certain time period after the accounts have been placed with
8 In phone interviews, most respondents that furnished information reported furnishing to all three of the major credit bureaus.
20
the collector. This time period generally ranged from 45 to 90 days, though one respondent reported that for medical debt the period can be up to 245 days.
Under the Fair Credit Reporting Act (FCRA), collection firms that furnish information to credit bureaus must investigate consumer disputes about such information (FCRA disputes) and report the results of the investigation to the credit bureaus. Investigation of disputes is discussed below in section 5.3. In phone interviews, respondents generally said that the time required to report the results of an FCRA investigation to the credit bureaus (using the e-Oscar system) was approximately five minutes per FCRA dispute. In addition, interviewees reported monetary costs of $0.20-$0.30 to submit a report on e-OSCAR. Respondents said that consumers often repeatedly submit the same FCRA dispute, and two respondents reported that they need at least one full time employee dedicated solely to resolving those FCRA disputes.
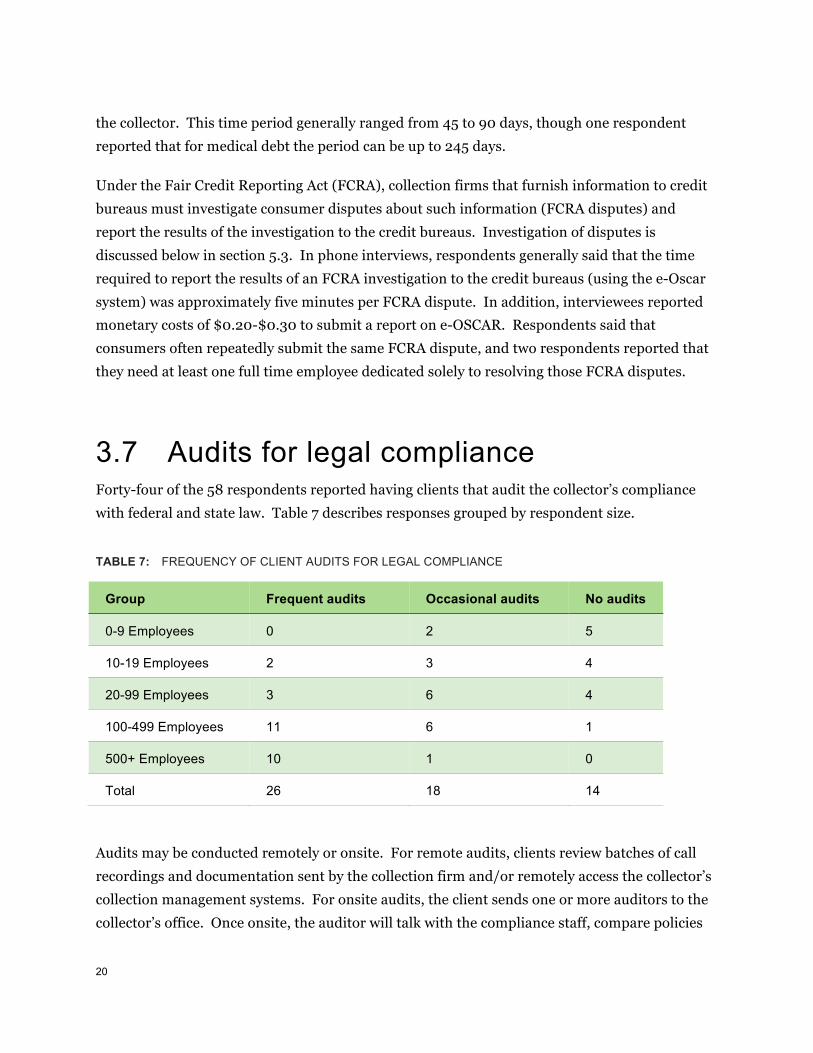
3.7 Audits for legal compliance Forty-four of the 58 respondents reported having clients that audit the collector’s compliance with federal and state law. Table 7 describes responses grouped by respondent size.
TABLE 7: FREQUENCY OF CLIENT AUDITS FOR LEGAL COMPLIANCE
Group Frequent audits Occasional audits No audits
0-9 Employees 0 2 5
10-19 Employees 2 3 4
20-99 Employees 3 6 4
100-499 Employees 11 6 1
500+ Employees 10 1 0
Total 26 18 14
Audits may be conducted remotely or onsite. For remote audits, clients review batches of call recordings and documentation sent by the collection firm and/or remotely access the collector’s collection management systems. For onsite audits, the client sends one or more auditors to the collector’s office. Once onsite, the auditor will talk with the compliance staff, compare policies

21
and procedures to practice, monitor collectors’ calls, look at FCRA and FDCPA disputes and consumer complaints, and otherwise examine evidence of compliance with the FDCPA and other laws. Onsite audits generally take from one to four days to complete.
The number of audits faced by the respondents varied depending on their clients. Some collectors reported that at any given time at least one client was conducting an audit. Generally, larger clients demanded more audits and at more frequent intervals. On the high end, one respondent reported that some clients conduct remote audits three to four times per year and onsite audits three times per year.
Respondents said their main cost of audits is employee time, including time to prepare and review documents prior to the audit and making employees available during the audit. In addition, some clients may require the collector pay for the auditor’s traveling expenses.
22
4. Information flows
4.1 Obtaining information from creditors Before they can begin collecting, debt collectors must obtain information from creditors about each account and make that information available to their collection staff. Most collectors that participated in interviews reported that they obtain account information from their clients via a secured file transfer protocol (SFTP) or similar secured site, sometimes maintained by the client and sometimes maintained by the collection firm or a third-party vendor. Creditors may also provide electronic versions of underlying account documentation, such as account statements or agreements, either transferring them directly to collectors or providing collectors with remote access to documents retained on the creditor’s system. Some collectors said they receive accounts by mail or email but reported that this approach is used by only a minority of typically smaller clients.
When the data is received, collection firms reported using external data sources to identify accounts belonging to bankrupt or deceased consumers, and often also to identify address changes, consumers covered by the Servicemembers Civil Relief Act, and litigious consumers. Collection firms also search for new phone numbers at this time. All of the respondents in the phone interviews said that this process usually takes a few hours or is an overnight process. Collection firms reported that they pay approximately $0.20 per “hit” to check for bankruptcy and $0.40 per “hit” to check for deceased consumers. Apart from the process of checking incoming data against external databases, very few respondents did any additional checks for accuracy or adequacy of the data. Two law firms and a few other collection firms indicated that they manually review the data to look for potential inaccuracies or indications that the data might be unreliable.
23
4.2 Maintaining and using account information
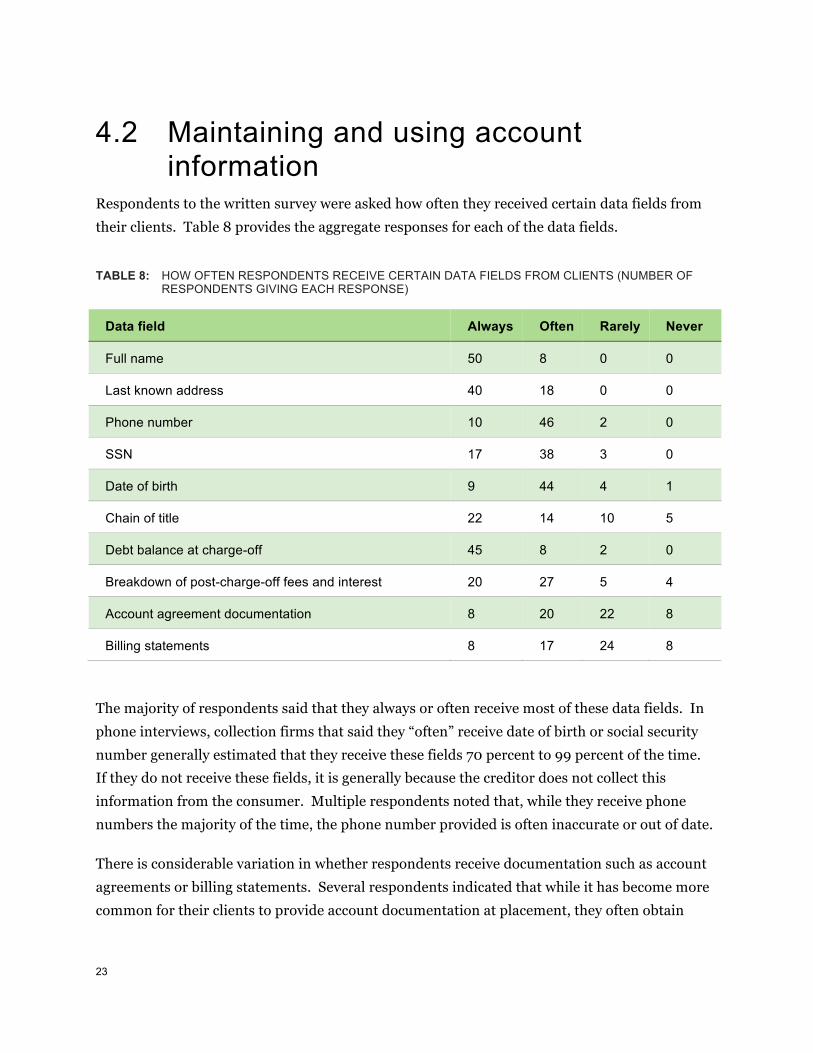
Respondents to the written survey were asked how often they received certain data fields from their clients. Table 8 provides the aggregate responses for each of the data fields.
TABLE 8: HOW OFTEN RESPONDENTS RECEIVE CERTAIN DATA FIELDS FROM CLIENTS (NUMBER OF RESPONDENTS GIVING EACH RESPONSE)
Data field Always Often Rarely Never
Full name 50 8 0 0
Last known address 40 18 0 0
Phone number 10 46 2 0
SSN 17 38 3 0
Date of birth 9 44 4 1
Chain of title 22 14 10 5
Debt balance at charge-off 45 8 2 0
Breakdown of post-charge-off fees and interest 20 27 5 4
Account agreement documentation 8 20 22 8
Billing statements 8 17 24 8
The majority of respondents said that they always or often receive most of these data fields. In phone interviews, collection firms that said they “often” receive date of birth or social security number generally estimated that they receive these fields 70 percent to 99 percent of the time. If they do not receive these fields, it is generally because the creditor does not collect this information from the consumer. Multiple respondents noted that, while they receive phone numbers the majority of the time, the phone number provided is often inaccurate or out of date.
There is considerable variation in whether respondents receive documentation such as account agreements or billing statements. Several respondents indicated that while it has become more common for their clients to provide account documentation at placement, they often obtain
24
documents from their clients only when needed. More than one respondent indicated that they prefer not to obtain documentation unless and until a consumer submits an FDCPA dispute or there is another reason to review the documentation, but that their client’s policies generally determine whether documents are sent at the time of placement.
4.3 Collection management systems A “collection management system” is a software platform that maintains account-level information about debts in collection, makes the information available to individual collectors, and tracks account activity such as calls made, the outcome of discussions with consumers, and payments made. Based on survey responses and discussions with vendors, most collection firms use a collection management system offered by one of several software vendors that target the debt collection market, although some collection firms use their own proprietary systems.
Vendors of different collection management systems generally described similar features and functionality of their basic product. However, vendors and collection firms reported that, when implemented at a particular collection firm, collection management software is often customized to the needs of that firm. For example, collection firms may customize their collection management systems to address particular client requirements for how accounts are handled or how reports are provided, or to integrate their systems with other software and hardware products, such as predictive dialers or services provided by data vendors.
Vendors and collection firms described three general approaches to acquiring and maintaining a collection management system:
§ Purchasing a software license from a software vendor. Under this model, the collection firm purchases a software license from the vendor, and the collection firm maintains account data on its own servers. The software vendor regularly provides software updates and sometimes provides a certain number of hours of support. Under the licensing model, vendors reported that the up-front charge for a license ranges from $1,500 to $2,000 per seat. In addition, collection firms generally pay a licensing or maintenance fee either monthly or quarterly.
§ A subscription model in which the software and account data are hosted by the software vendor. Vendors said that the subscription model (or “software as a
25
service”) has become more prevalent in recent years. Under this model, the collection firm pays a monthly fee for access to a platform hosted by the vendor, with account data residing on the vendor’s servers. Vendors reported prices ranging from $125 to $200 per seat per month for the basic subscription. When additional data and other services are included, the costs ranged from $400 to $1200 per seat per month. One vendor that specializes in providing a collection management system for smaller collection firms indicated that in recent years all of its new customers subscribed to this model of its product.
§ A proprietary system. One vendor estimated approximately 10 to 15 percent of collection firms use a collection management system that they developed in house. This is roughly consistent with what the Bureau found in the survey, in which eight of 58 respondents indicated that they use a proprietary system. Some smaller respondents described using general-purpose spreadsheet software to track accounts, whereas a larger respondent using proprietary software reported having invested significant resources to develop a customized software platform.
4.3.1 Costs of modifying collection management systems Changes to collection management systems may be required in response to changes in the law or client requirements. Vendors reported that they need to make frequent updates to their software to address changes in state regulatory requirements, and larger collection firms also indicated that they frequently must make changes to their collection management systems to address client or regulatory concerns. Some smaller respondents, typically working in only one or two states, said that they seldom need to make changes to their collection management systems.
Collections firms needing to make changes to their collection management systems can obtain programming services at an hourly rate from vendors of the collection management systems or from software consulting vendors. Most collection firm respondents indicated that they use some combination of outside vendors and in-house resources to make such changes. Of the 50 respondents that reported using a vendor-provided system, only five said that all adjustments were made by outside vendors, and only seven said that all adjustments were made using in-house resources.
26
Respondents generally told the Bureau that if changes to collection management systems are required to comply with changes in state law, it is common for the vendor to make relevant changes without additional charge as part of regular software updates, either as a software patch or as part of periodic updates. However, some larger respondents indicated that they could not rely entirely on vendor updates to comply with new laws and that in-house resources were generally needed to satisfy themselves that the updated software is sufficient to comply with state law.
In phone interviews, the Bureau asked about the cost of making adjustments to collection management systems. Responses varied in how precise they were, but some general findings were as follows:
§ Smaller collection firms (including some with 100 to 200 employees) reported costs of less than $3,000 per project to make changes, depending on the nature of the change. Respondents indicated that adding a data field could be done relatively easily with in-house resources or at a cost of less than $1,000. Other typical changes, such as customization to accommodate a new client, were estimated to cost between $1,200 and $2,800 or were described as being generally handled by in-house IT staff. Smaller firms indicated that any changes required for state requirements would generally be incorporated into vendor software updates. Some smaller collection firms work in only one or a few states and therefore may be less likely to be affected by frequent state law changes.
§ Larger collection firms reported more significant costs associated with state law changes. Larger firms typically had in-house IT staff that worked to accommodate client changes. One collection firm estimated that programming to address state law changes generally required about 40 hours of work at a cost of $150 per hour (i.e., $6,000 in programming costs), and that in some cases approximately one hour of training on new requirements would be required for each collector. A software vendor that often does programming work for larger collection firms estimated that a “typical” project for which it was engaged costs between $13,000 and $26,000.
§ Law firms estimated larger costs associated with changes for client requirements. Two collections law firms that participated in phone interviews reported that changes to accommodate client requirements generally cost between $3,000 and $7,000, with the

27
larger firm (having more than 100 employees) reporting that some projects might cost as much as $15,000.
Some respondents noted that state law changes impose significant costs beyond just IT changes to the collection management system. Before IT work begins, management must interpret the rule, sometimes in consultation with counsel, and decide what needs to be done. Clients also may want to know what the collector is doing to comply with the law, which can increase the costs of client audits and related reporting to those clients.
28
5. Engagement with consumers
5.1 Written communications Survey respondents did not vary too much in their approach to written communications. Fifty-three of 58 respondents said that they send a validation notice9 shortly after receiving a new placement, typically within 24 to 48 hours. Only two respondents said that they send a validation notice after making contact with the consumer, and three respondents follow a policy that is not clear from the response. While it was rare among respondents to send validation notices only after speaking with consumers, one letter vendor said that this practice was increasing as a way to reduce costs.
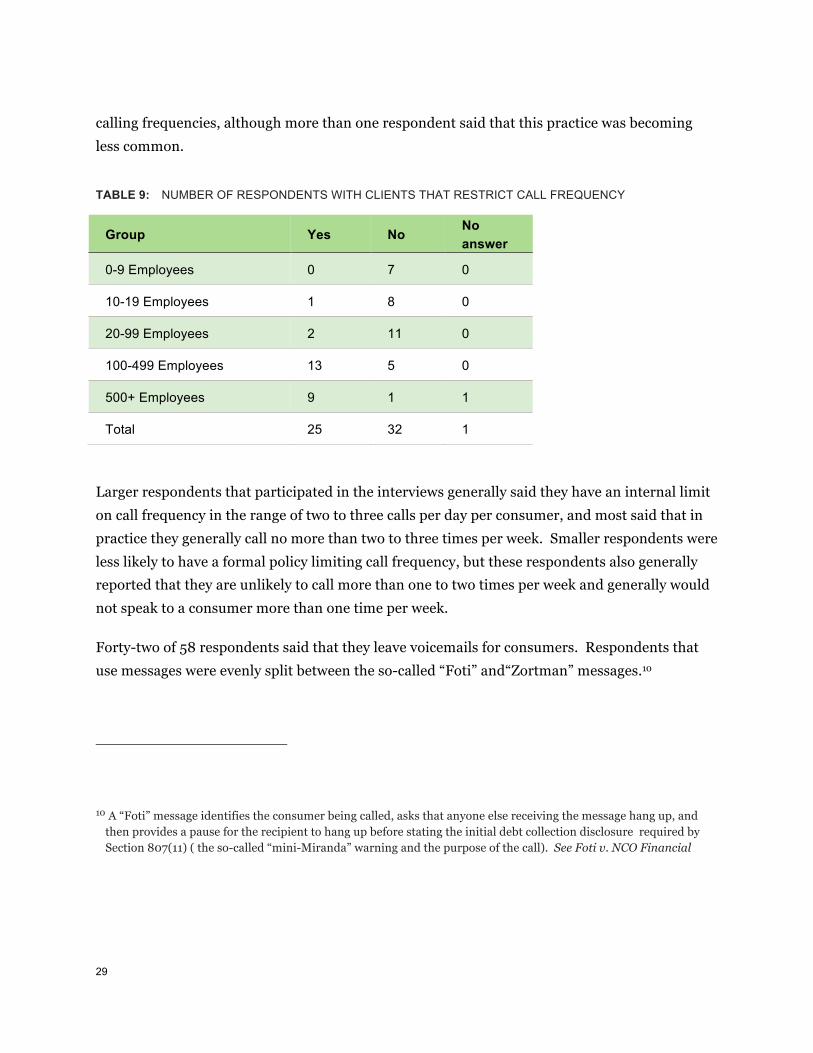
5.2 Calling consumers Respondents were asked if their clients set limits on how often they call consumers. Table 9 provides the responses grouped by respondent size. Based on phone interviews, when limits are present, they generally range from one to six call attempts per day. In addition to maximum calling frequencies, some respondents indicated that some of their clients impose minimum
9 That is, a written notice required by 15 U.S.C. 1692g containing disclosures and other information.
29
calling frequencies, although more than one respondent said that this practice was becoming less common.
TABLE 9: NUMBER OF RESPONDENTS WITH CLIENTS THAT RESTRICT CALL FREQUENCY
Group Yes No No answer
0-9 Employees 0 7 0
10-19 Employees 1 8 0
20-99 Employees 2 11 0
100-499 Employees 13 5 0
500+ Employees 9 1 1
Total 25 32 1
Larger respondents that participated in the interviews generally said they have an internal limit on call frequency in the range of two to three calls per day per consumer, and most said that in practice they generally call no more than two to three times per week. Smaller respondents were less likely to have a formal policy limiting call frequency, but these respondents also generally reported that they are unlikely to call more than one to two times per week and generally would not speak to a consumer more than one time per week.
Forty-two of 58 respondents said that they leave voicemails for consumers. Respondents that use messages were evenly split between the so-called “Foti” and“Zortman” messages.10
10 A “Foti” message identifies the consumer being called, asks that anyone else receiving the message hang up, and then provides a pause for the recipient to hang up before stating the initial debt collection disclosure required by Section 807(11) ( the so-called “mini-Miranda” warning and the purpose of the call). See Foti v. NCO Financial
30
Respondents using the Foti message were generally more cautious about when to leave a message, typically using the Foti message only if the collector could confirm that the phone number belonged to the person the collector was seeking to contact – for example, if the voicemail greeting specifically identified the person. At least one respondent said that when there was any doubt, or if the number was a home number (where a third party might be likely to hear), the Zortman message was typically used.
5.3 Debt collection disputes When consumers dispute information about a debt with a collection firm, the firm may have obligations to investigate the dispute under both the FDCPA and, if the dispute concerns information the collection firm furnished to credit bureaus, under the FCRA. Reporting the outcome of disputes to credit bureaus as required by the FCRA is discussed in section 3.6 above.
When the Bureau asked interviewees what fraction of the consumers they contacted dispute their debts (whether in writing or by phone), answers varied greatly. Many respondents said that they do not track disputes. Two respondents said that 50 percent or more of the consumers they contact may initially express some disagreement with the debt, including statements such as “my insurance should have paid for that,” but that a much smaller share (10 to 20 percent) persists in the dispute after a discussion with the collector. Other respondents estimated dispute rates that ranged from less than 1 percent to 15 percent, and the two respondents that provided more specific estimates derived from their collection management system estimated dispute rates between 3 and 4 percent.
The written survey asked respondents to estimate the fraction of disputes that fell into four categories. There was a lot of variation in response, which may reflect in part differences in what respondents considered to be a dispute. Overall, the least prevalent dispute seems to be
Systems, 424 F. Supp. 2d 643 (S.D.N.Y. 2006). A “Zortman” message generally only identifies the caller’s name and a call back number. See Zortman v. J.C. Christensen & Associates, Inc., 870 F. Supp. 2d 694, 703 (D. Minn. 2012).

31
that the person contacted is the wrong consumer, and the other three categories seem to be equally prevalent: generic disputes that do not specify the nature of the dispute; disputes about the amount owed; and other specific disputes, such as a claim that an insurer should have paid the amount sought.
Most respondents in phone interviews described a fairly standardized process of responding to a dispute, including ceasing activity on the account, obtaining account documentation from the creditor, and forwarding the information to the consumer. A few respondents said that, for some clients, some or all disputes were returned to the client for resolution. Some respondents, including law firms, indicated that they were more involved than the creditor in investigating at least some disputes.
Respondents generally said disputes took staff between five minutes and one hour to resolve, with 15 to 30 minutes being the most common answer (note that this does not include whatever time or resources the creditor must devote to obtaining documents and otherwise addressing a dispute). One law firm said that in general four staff members including one lawyer are involved in reviewing each dispute and estimated that it took 90 minutes to 120 minutes of total staff time to resolve each dispute. According to the respondents, wrong consumer and non-specific disputes (which generally consist of form letters) take the longest time to resolve, whereas disputes about the amount owed take less time to resolve.
32
6. Use of vendors, technology and other cost points
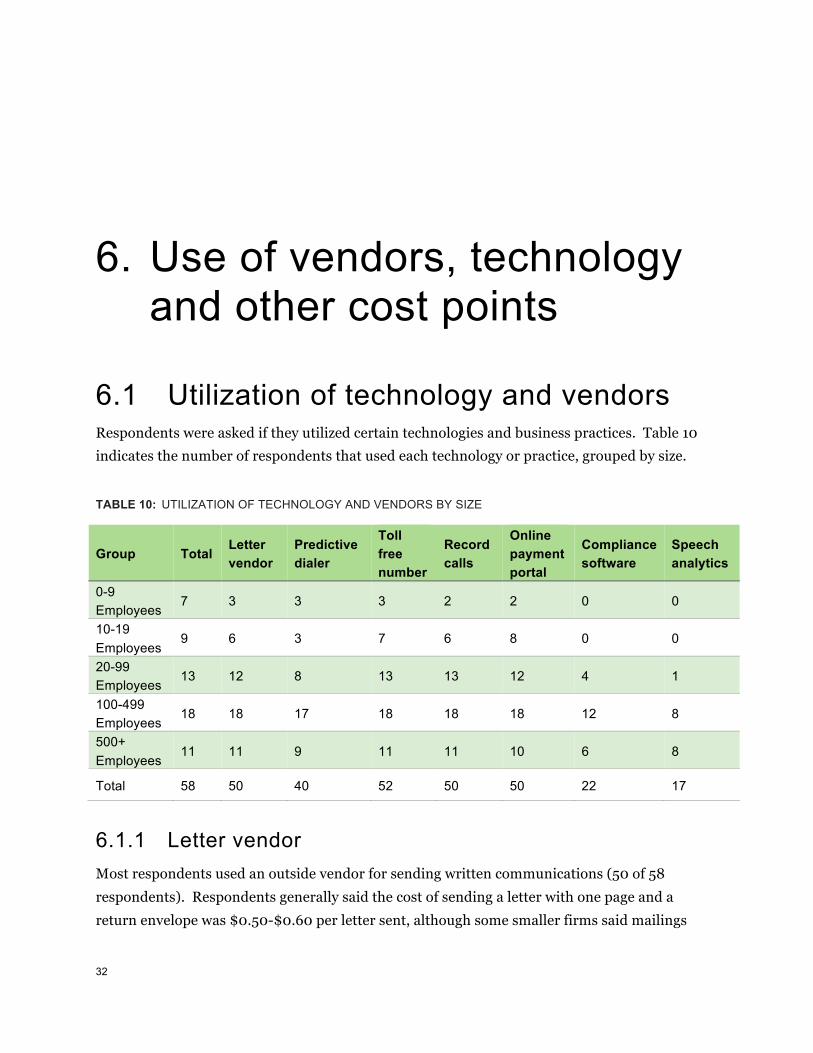
6.1 Utilization of technology and vendors Respondents were asked if they utilized certain technologies and business practices. Table 10 indicates the number of respondents that used each technology or practice, grouped by size.
TABLE 10: UTILIZATION OF TECHNOLOGY AND VENDORS BY SIZE
Group Total Letter vendor
Predictive dialer
Toll free number
Record calls
Online payment portal
Compliance software
Speech analytics
0-9 Employees
7 3 3 3 2 2 0 0
10-19 Employees
9 6 3 7 6 8 0 0
20-99 Employees
13 12 8 13 13 12 4 1
100-499 Employees
18 18 17 18 18 18 12 8
500+ Employees
11 11 9 11 11 10 6 8
Total 58 50 40 52 50 50 22 17
6.1.1 Letter vendor Most respondents used an outside vendor for sending written communications (50 of 58 respondents). Respondents generally said the cost of sending a letter with one page and a return envelope was $0.50-$0.60 per letter sent, although some smaller firms said mailings
33
could cost as much as $0.80-$1.00. According to the vendors surveyed, 80 percent of the charge reflects postage costs. Collection firms generally use one sheet of 8.5” x 11” paper for validation notices and do not include any inserts with the validation notice, although one letter vendor said that some collection firms are moving toward an 8.5” x 14” letter size to accommodate expanding state disclosure requirements. Collection firms and vendors said that vendors generally do not charge extra for changes to the template used to produce the letter, although one vendor said it was considering whether to change this policy given an increase in the frequency with which collection firms have been changing letter templates. Adding an 8.5” x 11” insert costs approximately $0.05-$0.10 per letter.
6.1.2 Toll free numbers Fifty-two of the respondents provided consumers with a toll-free phone number for return calls. The respondents that did not provide a toll-free phone number were all small, with the largest one having only 13 collectors. Such collectors may operate only in a small area, so that many consumers they contact might be able to reach them with a local call.
6.1.3 Recording calls Forty-eight of the respondents reported that they record all of the calls made to consumers, and two others said that they record at least some calls. All but three respondents that record calls retain the recordings for a year or more, and 33 of 48 keep them for two years or more.
6.1.4 Online payment portal Fifty of the 58 respondents reported that they provide consumers with an online payment portal. Respondents generally use a vendor that provides a consumer interface and processes online payments.
In order to provide consumers with Automated Clearing House (ACH) services, collection firms pay the vendor a monthly gateway maintenance fee that is usually around $50 per month. The collection firm also pays a fee per transaction. Depending on the number of transactions for a collection firm, it could pay as much as $0.50 per payment to as little as $0.20 per payment. If the transaction is declined due to nonsufficient funds (NSF), a collection firm with few transactions will be charged a fee of about $4 per NSF transaction and a firm with many transactions will be charged a fee that could be as low as $1.50 per NSF transaction.
34
In order to provide consumers with credit card services, collection firms pay a monthly gateway maintenance fee that is generally around $30 per month. Collection firms also pay a fee per transaction. Depending on the number of transactions, the firm could pay from as little as $0.10 per payment to as much as $0.30 per payment.
6.1.5 Speech analytics software Seventeen respondents reported using speech analytics software. Speech analytics software generally analyzes call recordings to evaluate the content of a call. Speech analytics software is capable of identifying key words, the timing of the words, and the volume of the conversation. The first two functionalities can be used to test script adherence (for example, to make sure collectors make mandated disclosures at the right time) and look for disputes (for example, by looking for key words such as “dispute”). The volume of the conversation could also be used to indicate if the conversation is escalating.
Respondents using speech analytics software were all larger collection firms, with the smallest respondent having 83 employees. According to speech analytics software vendors, their typical client employs 100 to 200 collectors.
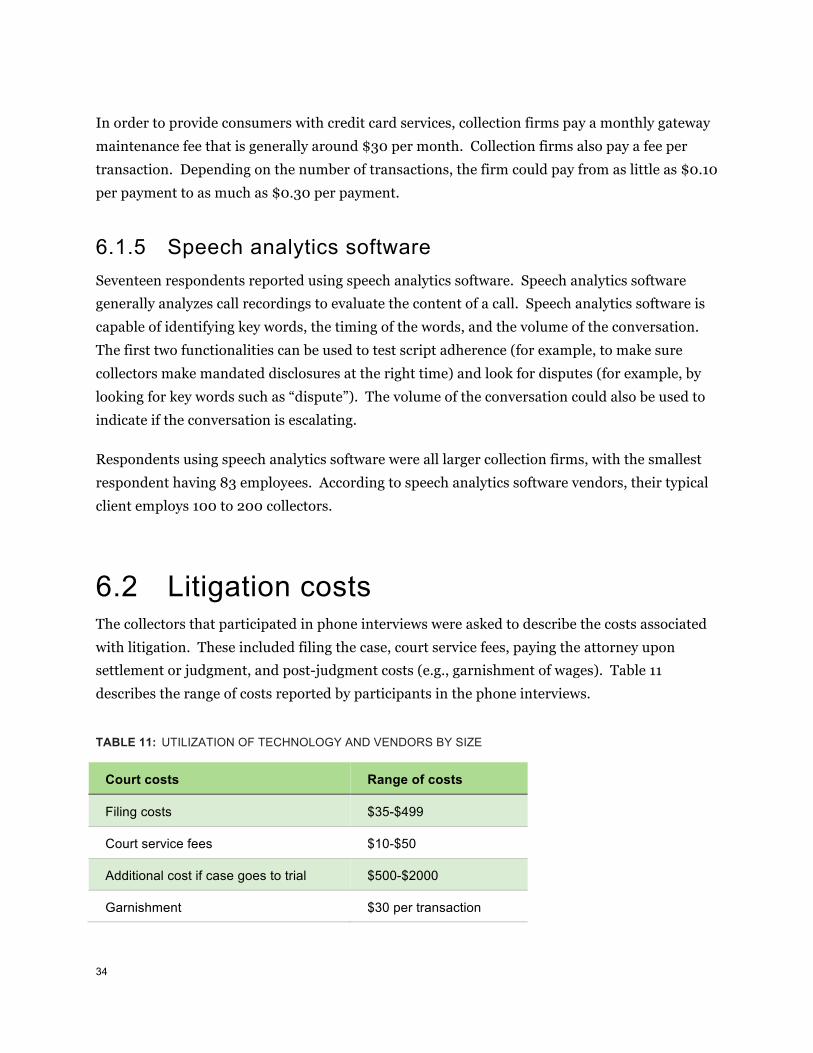
6.2 Litigation costs The collectors that participated in phone interviews were asked to describe the costs associated with litigation. These included filing the case, court service fees, paying the attorney upon settlement or judgment, and post-judgment costs (e.g., garnishment of wages). Table 11 describes the range of costs reported by participants in the phone interviews.
TABLE 11: UTILIZATION OF TECHNOLOGY AND VENDORS BY SIZE
Court costs Range of costs
Filing costs $35-$499
Court service fees $10-$50
Additional cost if case goes to trial $500-$2000
Garnishment $30 per transaction

35
Attorneys are usually paid a percentage of the amount collected but may also be paid on a per hour basis or a fixed amount. When a judgment is obtained and a debt collector is able to recover on that judgment, the debt collector generally is entitled to recover its court costs first from amounts collected from the consumer, with the remaining balance after this recovery used to determine and pay the collector’s contingent fee. Note, however, that in a significant share of cases collectors are ultimately unable to recover on judgments.
36
APPENDIX A:
Sample selection process To identify potential respondents for the written survey, the Bureau began with data on all firms identified as collection agencies in InfoGroup’s ReferenceUSAGov database. The Bureau randomly selected a sample of firms from this database, stratifying the sample according to firm size as reported in the database. The Bureau reviewed the selected firms to identify any that were clearly misclassified based on its general knowledge of the industry. Before sending the written survey, the Bureau called the firms in this sample and asked whether they would be willing to participate in the survey. The Bureau began with a random sample of 190 firms, but found that a particularly small number of firms with fewer than 20 employees was responsive and willing to complete the survey. To increase coverage of debt collectors in this category, the Bureau randomly selected additional firms with fewer than 20 employees, bringing the total number of debt collectors that the Bureau attempted to contact to 548.
The low response rate among smaller firms likely reflected several factors. One is that debt collection firm contact information provided by ReferenceUSAGov appears to be less reliable for firms identified as small. Another is that some entities identified as small debt collection firms were in fact establishments within larger firms, and therefore ended up categorized as larger firms after survey responses were received. Finally, smaller firms may have been generally less willing to devote resources to completing a voluntary survey.
The Bureau ultimately received 56 responses from this process. The Bureau subsequently asked trade associations to identify additional respondents in categories that were not widely
37
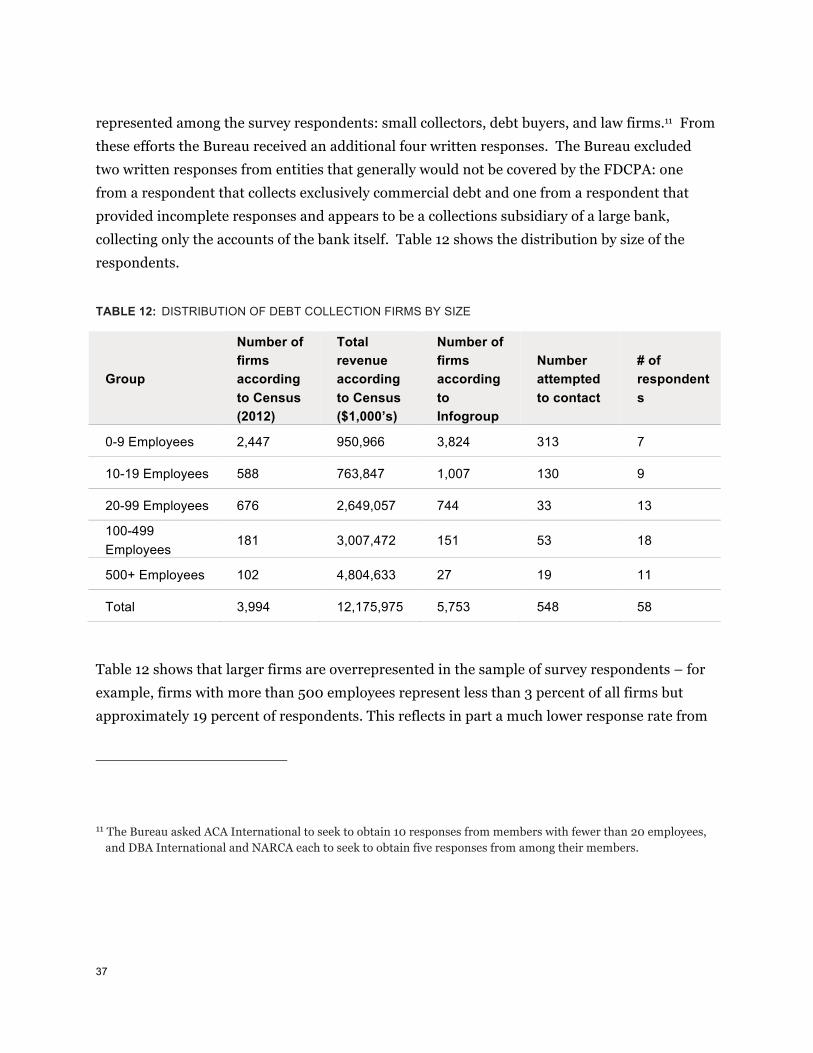
represented among the survey respondents: small collectors, debt buyers, and law firms.11 From these efforts the Bureau received an additional four written responses. The Bureau excluded two written responses from entities that generally would not be covered by the FDCPA: one from a respondent that collects exclusively commercial debt and one from a respondent that provided incomplete responses and appears to be a collections subsidiary of a large bank, collecting only the accounts of the bank itself. Table 12 shows the distribution by size of the respondents.
TABLE 12: DISTRIBUTION OF DEBT COLLECTION FIRMS BY SIZE
Group
Number of firms according to Census (2012)
Total revenue according to Census ($1,000’s)
Number of firms according to Infogroup
Number attempted to contact
# of respondents
0-9 Employees 2,447 950,966 3,824 313 7
10-19 Employees 588 763,847 1,007 130 9
20-99 Employees 676 2,649,057 744 33 13
100-499 Employees
181 3,007,472 151 53 18
500+ Employees 102 4,804,633 27 19 11
Total 3,994 12,175,975 5,753 548 58
Table 12 shows that larger firms are overrepresented in the sample of survey respondents – for example, firms with more than 500 employees represent less than 3 percent of all firms but approximately 19 percent of respondents. This reflects in part a much lower response rate from
11 The Bureau asked ACA International to seek to obtain 10 responses from members with fewer than 20 employees, and DBA International and NARCA each to seek to obtain five responses from among their members.

38
smaller entities. Note, however, that smaller entities are overrepresented relative to their share of industry revenue – for example, firms with fewer than 20 employees represent about 14 percent of industry revenue and about 28 percent of respondents to the written survey.