Embed Size (px)
Citation preview
Examensarbete i Hållbar Utveckling 151
Study on Plant Load Factor of Wind Power CDM Projects
Study on Plant Load Factor of Wind Power CDM Projects
Tianyu Meng
Tianyu Meng
Uppsala University, Department of Earth SciencesMaster Thesis E, in Sustainable Development, 30 creditsPrinted at Department of Earth Sciences,Geotryckeriet, Uppsala University, Uppsala, 2013.
Master’s ThesisE, 30 credits
Supervisor: Eva FrimanEvaluator: Lars Rudebeck
Examensarbete i Hållbar Utveckling 151
Study on Plant Load Factor of Wind Power CDM Projects
Tianyu Meng

i
Content 1 Introduction ...................................................................................................................... 1 2 Background ....................................................................................................................... 1 2.1 The Kyoto Protocol .……................................................................................................... 1 2.2 Clean Development Mechanism (CDM) ........................................................................... 2 2.2.1 Overview …….…………………….................................................................................... 2 2.2.2 CDM Benefits ………….………….................................................................................... 3 2.2.3 CDM Project Cycle…….…………..................................................................................... 3 2.2.4 CDM Project Additionality……..….................................................................................... 4 2.3 Wind Power CDM Projects …............................................................................................ 6 2.3.1 Overview ………………………….................................................................................... 6 2.3.2 Wind CDM projects’ contribution to sustainable development.......................................... 7 2.3.3 Issues about Wind CDM Project ........................................................................................ 7 2.4 Plant Load Factor …………… ........................................................................................... 7 2.4.1 Estimated PLF …………………….................................................................................... 7 2.4.2 Actual PLF ………………………….................................................................................. 7 2.4.3 Relative Variation of PLF …………................................................................................... 8 3 Methodology ...................................................................................................................... 8 3.1 Database establishment….................................................................................................... 8 3.1.1 Data selection …………...................................................................................................... 8 3.1.2 Data collection ………………………….......................................................................... 9 3.1.3 Data crosscheck…………………....................................................................................... 10 3.1.4 Data calculations …………………..................................................................................... 10 3.2 Comparison Analysis ……………….................................................................................. 10 3.2.1 Comparison objectives and their meanings ......................................................................... 10 3.2.2 Comparison basis ................................................................................................................. 11 4 Results…. …………………................................................................................................ 11 4.1 Project Distribution…........................................................................................................... 11 4.2 Comparison of all projects…………………………………………………………………. 12 4.3 Comparison based on scales ………………………………………………………………. 13 4.4 Comparison based on countries …………………………………………………………… 15 5 Discussions……………....................................................................................................... 16 5.1 Discussion on Under/Overestimation................................................................................... 16 5.2 Discussion on Relative Variation of PLF ............................................................................ 18 6 Conclusions………………….............................................................................................. 18 7 Acknowledgement……....................................................................................................... 18 8 References…….................................................................................................................... 19 Annex 1…………………………………………………………………………………………… 21
ii
Study on Plant Load Factor of Wind Power CDM Projects TIANYU MENG Meng, T., 2013: Study on Plant Load Factor of Wind Power CDM Projects. Master thesis in Sustainable Development at Uppsala University, No. 151, 26 pp, 30 ECTS/hp Abstract: Clean Development Mechanism (CDM), is a market-based mechanism under the Kyoto Protocol. It allows developed countries to implement emission reduction projects in developing countries, to assist their sustainable development; meanwhile, developed countries gain credits which could be used to meet part of their emission reduction targets under this protocol. There is a wide range of various types of CDM projects, among which, wind power projects account for the largest share. Additionality is a key component for CDM projects’ eligibility and to ensure CDM’s environmental integrity. It means that the emission reduction after the implementation of the project is additional to any that would have occurred in the absence of the certified CDM project. For wind CDM projects, the controversy on additionality raised debate and attention internationally, especially the concern if project developers deliberately underestimated Plant Load Factor (PLF) so as to meet the CDM additionality criterion. At the United Nations Framework Convention on Climate Change (UNFCCC) CDM Executive Board 63rd meeting, the UNFCCC Secretariat and the Registration and Issuance Team (RIT) proposed different decisions regarding a request for issuance of a Wind CDM project due to different views on the estimated PLF. The Board discussed the issue and requested a study on the PLF variations, which is the origin, and also a partial content of this thesis. In this thesis, relevant parameters are firstly defined – parameters such as Estimated PLF, Actual PLF, etc, and to better illustrate the magnitude of the PLF variation, the concept of Relative Variation of PLF is adopted, which is measured as the absolute difference of Estimated PLF and Actual PLF compared with Estimated PLF. Then a database in spreadsheet with all defined parameters of sampled projects is set up on the basis of collected information and calculation. Afterwards an investigation of PLFs and comparison analyses of Estimated PLFs and Actual PFLs is conducted. Considering there are two groups of Wind CDM projects, i.e. small-scale and large-scale; and considering the distributions of projects’ hosting countries, the comparison analyses are then conducted firstly for all projects, and then separated for small-scale and large-scale projects, and lastly separated for projects based on different hosting countries. The final results show that a minority of projects have underestimated PLFs, and a very small proportion of projects, either in all projects, or on different scales or in different hosting countries have underestimated PLFs to a level that is out of acceptable range. Therefore, the study concludes that there should be no concern on the PLF issue in Wind CDM projects. Keywords: Sustainable Development, Wind Power, Clean Development Mechanism, Additionality, Plant Load Factor Tianyu Meng, Department of Earth Sciences, Uppsala University, Villavägen 16, SE- 752 36 Uppsala, Sweden
iii
Study on Plant Load Factor of Wind Power CDM Projects TIANYU MENG Meng, T., 2013: Study on Plant Load Factor of Wind Power CDM Projects. Master thesis in Sustainable Development at Uppsala University, No. 151, 26 pp, 30 ECTS/hp Summary: Clean Development Mechanism (CDM), is a market-based mechanism under the Kyoto Protocol. It allows developed countries to implement emission reduction projects in developing countries, to assist their sustainable development; meanwhile, developed countries gain credits which could be used to meet part of their emission reduction targets under this protocol. There is a wide range of various types of CDM projects, among which, wind power projects account for the largest share. Nevertheless, the controversy of some wind CDM projects raised attention internationally and debate, such as about low tariff set by host country in order to attract CDM investment, and about underestimated Plant Load Factor (PLF) so as to meet the CDM additionality criterion. At the United Nations Framework Convention on Climate Change (UNFCCC) CDM Executive Board 63rd meeting, the UNFCCC Secretariat and the Registration and Issuance Team (RIT) proposed different decisions regarding a request for issuance of a Wind CDM project due to different views on the estimated PLF. The Board discussed the issue and requested a study on the PLF variations. This thesis is partially prepared for the Board’s meeting. In this thesis, relevant parameters are firstly been defined - parameters such as Estimated PLF, Actual PLF, Relative Variation of PLF, etc. Then a database including defined parameters of sampled projects is set up on the basis of collected information and calculation. Afterwards an investigation of PLFs and comparison analyses of Estimated PLFs and Actual PFLs are conducted. Considering there are two groups of Wind CDM projects, i.e. small-scale and large-scale; and considering the distributions of projects’ hosting countries. The comparison analyses are conducted firstly for all projects, and then separated for small-scale and large-scale projects, and lastly separated for projects based on hosting countries. The final results show that the minority of projects have underestimated PLFs, and a very small proportion of projects, either in all projects, or at different scales or in different hosting countries have underestimated PLFs to a level that is out of acceptable range. Therefore, the study concludes that there should be no concern on the PLF issue in Wind CDM projects.
Keywords: Sustainable Development, Wind Power, Clean Development Mechanism, Additionality, Plant Load Factor
Tianyu Meng, Department of Earth Sciences, Uppsala University, Villavägen 16, SE- 752 36 Uppsala, Sweden
iv
Abbreviations: AAU Assigned Amount Unit CDM Clean Development Mechanism CER Certified Emission Reduction COP Conference of Parties DNA Designated National Authority DOE Designated Operational Entity EE Energy Efficiency ERU Emission Reduction Unit ET Emission Trading GEWC Global Wind Energy Council GHG Greenhouse Gas GW Gigawatt IETA International Emission Trading Association JI Joint Implementation MW Megawatt MWh Megawatt hour PDD Project Design Document PLF Plant Load Factor RIT Registration and Issuance Team SPD Strategy and Policy Development tCO2e Ton of Carbon Dioxide Equivalent UNFCCC United Nations Framework Convention on Climate Change Definitions: Party Member country to United Nation Framework Convention on Climate Change
- 1 -
1. Introduction According to the United Nations Framework Convention on Climate Change (hereafter refer as UNFCCC), the Clean Development Mechanism (CDM) is one out of the three flexible market-based mechanisms defined in the Kyoto Protocol, intended to meet two objectives: i) to assist developing countries in achieving sustainable development; and ii) to assist developed countries in fulfilling their emission reduction commitment (Article 12, Kyoto Protocol). The process works in the following way. Developed countries (listed as Annex I parties) who have emission caps, assist developing countries (listed as non-Annex I parties) who don’t have emission caps to implement emission-reduction projects, through: the provision of capital, transfer of technologies, creation of employment, etc, in order for developing countries to achieve sustainable development. The specific indicators of sustainable development were developed by the host developing countries themselves according to their national goals/policies/priorities, and clearly reflected in the Project Design Document of every CDM project. At the mean time, saleable and tradable credits (here called Certified Emission Reduction, i.e., CERs) will be issued and can be used by developed countries to offset a part of their greenhouse gas (GHG) emission reduction targets under the Kyoto Protocol. There is a wide range of sectoral scopes of emission-reduction projects, such as Energy industries, Manufacturing industries, Chemical industries, Construction, Transport, Mining, Waste management, Solvent use, Afforestation and Reforestation, etc. According to statistics, Wind power CDM projects account for the largest share – 29% - of all kinds of CDM projects in pipeline until the end of 2012 (CDMpipeline, 2012). However, some of them are controversial for a couple of reasons, such as low tariff set by host country in order to attract CDM investment, and underestimated Plant Load Factor (PLF) so as to meet the CDM additionality criterion, which affects the environmental integrity, which in turn is one of the basic attributes of CDM projects. At the UNFCCC CDM Executive Board 63rd meeting, the UNFCCC Secretariat and the Registration and Issuance Team (RIT) proposed different decisions regarding a request for issuance of a Wind CDM project due to the different views on the estimated PLF. The Board discussed the issue and in particular discussed the magnitude and permanence of the PLF variations and the initial PLF estimation in Project Design Document (PDD).
Following its deliberation, the Board requested the Secretariat to prepare an assessment on the technical approaches for the appropriate determination of PLFs for wind power projects. It also requested a review of the determination of PLF by registered wind CDM project activities, as compared to actual monitored PLFs achieved by these registered project activities, for consideration by the Board at a future meeting. With part of the requests as original motivation for the thesis, as well as among others, the objectives of this thesis are: 1) to investigate the PLFs of wind CDM projects; 2) to conduct a comparative analysis between estimated PLFs and actual PLFs in registered wind projects; and 3) to inquire if the variation between estimated PLFs and actual PLFs affect the environmental integrity.
2. Background 2.1. The Kyoto Protocol The Kyoto Protocol is an international environment treaty under United Nations Framework Convention on Climate Change (UNFCCC), the ultimate objective of which is to ‘stabilize the greenhouse gas concentration (GHG) in the atmosphere at a level that would prevent dangerous anthropogenic interference with the climate system (UNFCCC Essential Background, 2013)’. This Protocol was adopted in 1997 in Kyoto, Japan, and entered into force in 2005 after the elaboration of concrete operations and a ratification process for member countries which are called Parties to the Protocol (hereafter, member country to the convention is referred to as Party). This treaty recognizes that developed countries are mainly responsible for the current greenhouse gases concentration in the atmosphere owing to their industrial activities during the last more than 150 years, and the fact that GHG emission per person in developing countries is lower than that in developed countries at present. Thus, the Protocol builds a principle that is ‘common but differentiated responsibilities’, based on which, it sets legally binding obligations of greenhouse gas reductions/limitations for developed countries, while encourage developing countries to reduce GHG emissions. Initially, there are two commitment periods, from 2008 to 2012 and from 2013 to 2020. For the first commitment period, it targeted 37 industrialized countries and the European Union, and the overall emission reduction
- 2 -
on average amounted to 5% relative to the 1990s level (Kyoto Protocol, 1998). Countries which have emission limitation/reduction commitments under Kyoto Protocol principally take national measures to meet their targets. Meanwhile, to make it more flexible and cost-effective, the Protocol introduced three market-based mechanisms, consequently creating the concept of ‘carbon market’. The mechanisms encompass:
- Emission Trading (ET); - Clean Development Mechanism (CDM) - Joint Mechanism (JI).
Emission Trading allows countries with emission targets to trade their commitments under this Protocol. Specifically, under this Protocol, the targets of emission reduction/limitation are expressed as allowed emissions, or the common used ‘assigned amount’, which could be divided to ‘assigned amount units’ (AAUs). According to Article 17 of the Protocol, the country which hasn’t used up its AAUs is allowed to sell the excess units to the countries which over use their own. Clean Development Mechanism allows countries with emission reduction/limitation targets to do emission reduction/removal projects in developing countries in order to earn salable and tradable Certified Emission Reduction (CER) credits, which can be used to meet part of their own targets under this Protocol. Joint Implementation, according to Article 6 of the Protocol, enables countries which have emission reduction/limitation commitments to implement emission reduction/removal projects, referred to as joint implementation projects, in countries also with such commitments so as to earn Emission Reduction Units (ERUs) to meet part of their own targets under this Protocol. The working process, taking Clean Development Mechanism as an example, in theory, is like this: an investor or governmental body from a developed country invests in or provides finance to a project developer in order to implement a CDM project in a developing country; afterwards, the investor gets carbon credits (CERs) corresponding to the amount of emission reduction from the project, and can use them to meet its target under the Kyoto Protocol instead of reducing its own emission. However, in practice, the process is much more complex. Normally it involves financial intermediaries who invest in CDM projects or purchase CERs, and afterwards sell those CERs to companies/governments in developed countries. Sometimes, the CERs could be traded several times. Besides, project developers may self finance their CDM projects and then seek buyers for the
generated CERs. Nevertheless, the fundamental remains the same, which is developed countries invest in emission reduction projects in developing countries, and get the corresponding carbon credits to off-set their own emission reduction target under the Kyoto Protocol. According to the Protocol, the established three market-based mechanisms specifically contribute in the following ways:
i) To help countries with emission reduction/limitation targets seek cost-effective ways to fulfill their commitments;
ii) To encourage developing countries contribute to emission reduction efforts;
iii) To spur private sector to get involved in the emission reduction projects from different angles;
iv) To stimulate sustainable development through investment in environmental friendly projects, technology transfer, implementation of sustainability projects, among others.
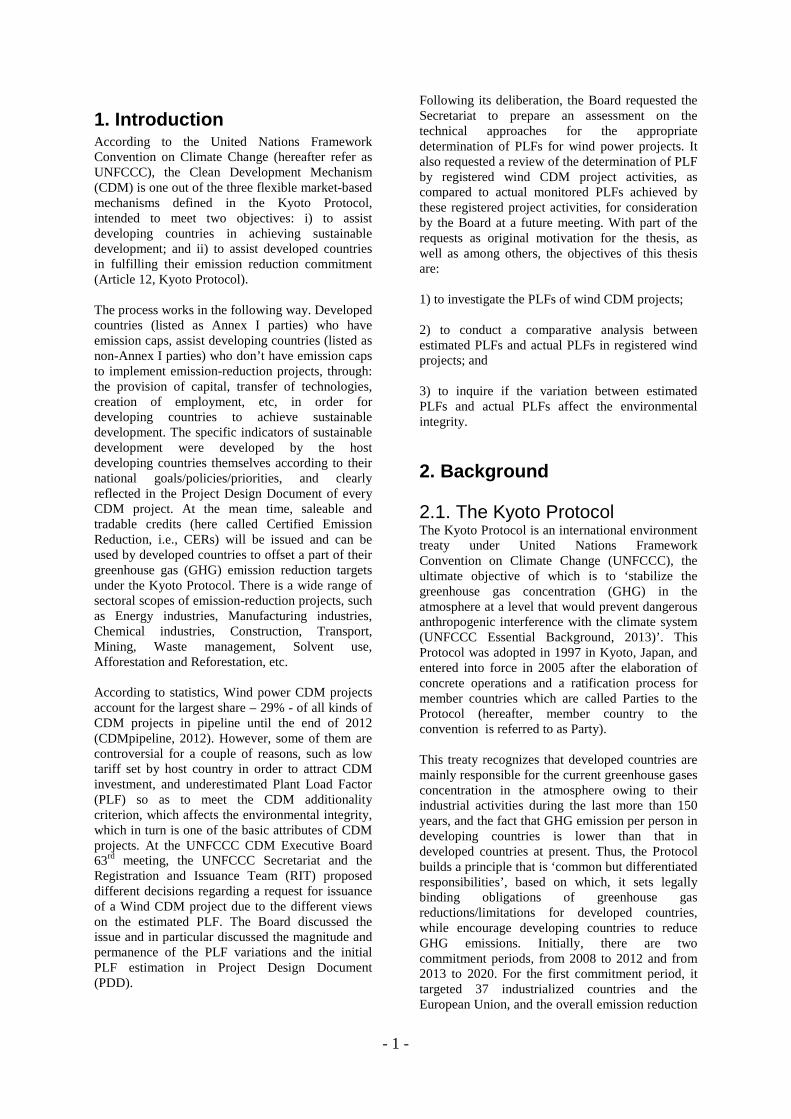
2.2. Clean Development Mechanism (CDM) As a market-based and project-based mechanism, and the only mechanism which involves both developing and developed countries under the Kyoto Protocol, the Clean Development Mechanism was designed to stimulate sustainable development in developing countries; while giving developed countries flexibility to fulfill their commitments of emission reduction/limitation (Article 12, Kyoto Protocol). 2.2.1. Overview CDM projects are as diverse as waste heat recovery in Pakistan, kiln efficiency in Bangladesh, wind power in Mexico, methane capture in Chili, landfill gas recovery in Saudi Arabia, reforestation in Uganda, soil conversation in Moldova, etc. According to CDM pipeline, since the first CDM project registered in 2004, up to the end of 2012, the quantities of different type CDM projects are listed in below Tab. 1. The numbers include 6660 ones which are registered with or without issued CERs, 159 in process of registration, and 2178 at validation stage (refer to 2.2.3 of CDM Cycle).
Type Number Percent Wind 2611 29% Hydro 2317 26% Biomass 883 10% Methane avoidance 758 8% EE own generation 459 5%
- 3 -
Landfill gas 431 5% Solar 395 4.4% EE industry 158 1.8% Fossil fuel switch 149 1.7% EE supply side 126 1.4% EE Households 113 1.26% Coal bed/mine methane
112 1.24%
N2O 108 1.2% Afforestation & Reforestation
72 0.8%
Fugitive 65 0.7% EE Service 42 0.47% Cement 40 0.44% Transport 38 0.42% Geothermal 35 0.39% Energy distribution 28 0.31% HFCs 23 0.26% PFCs and SF6 18 0.20% Mixed renewable 10 0.11% CO2 usage 3 0.03% Tidal 1 0.01% Agriculture 2 0.02% Total 8997 100%
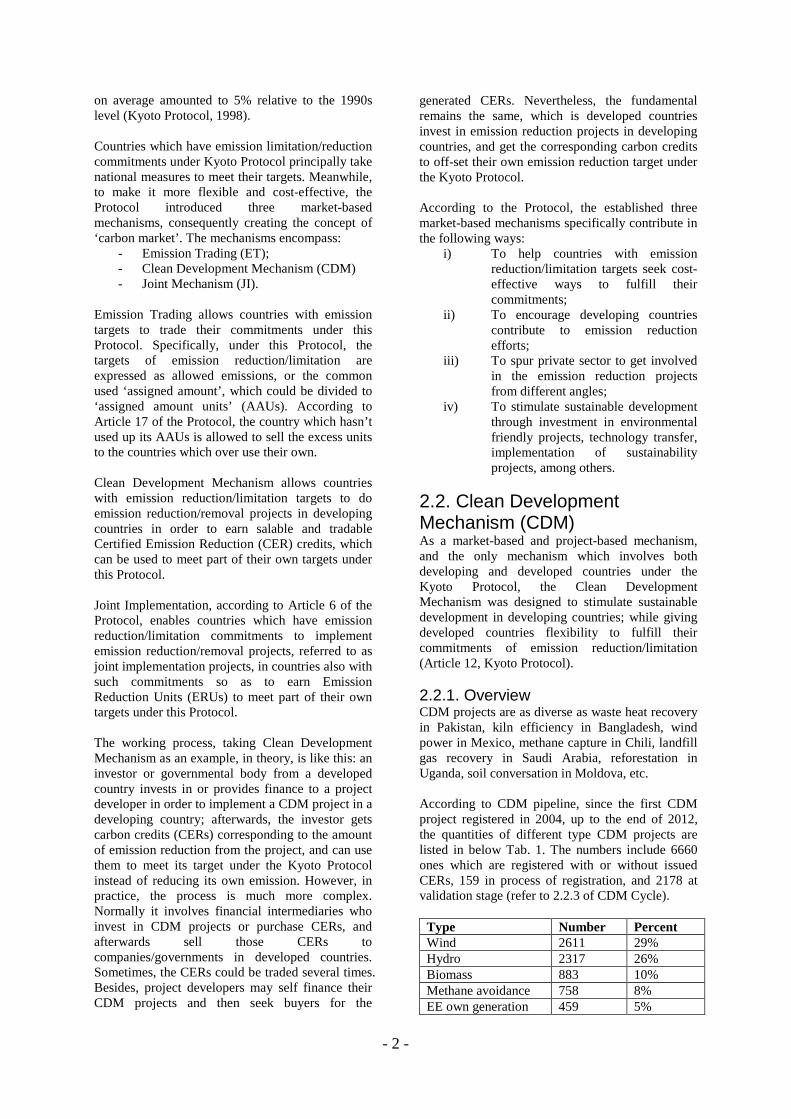
Tab.1. The numbers and percentages of different CDM project types up to the end of 2012. Source: UNEP Risoe CDM/JI pipeline The data presented in table 1 reveals that wind CDM projects amount to the largest share, following are Hydro projects, Biomass projects, Methane avoidance projects, and so on. CDM projects take place worldwide. According to statistics from CDM Pipeline, up to the end of 2012, the distribution of CDM projects in different regions are listed in Table 2 as blow. Region Number of
projects Percentage out of all projects
Africa1 268 2.98% Asia & the Pacific2
7306 81.2%
Europe and Central Asia3
102 1.13%
Latin America4 1218 13.54% Middle-East5 103 1.14% total 8997 100% Tab.2. The numbers and percentages of different CDM project host regions up to the end of 2012. 1South Africa, Kenya, Egypt, Morocco, Nigeria, etc 2China, India, Viet Nam, Thailand, Indonesia, Malaysia, South Korea, Philippines, Pakistan, Sri Lanka, etc 3Uzbekistan, Serbia, Azerbaijan, Cyprus, Moldova, etc 4Brazil, Mexico, Chile, Colombia, Peru, Argentina, Ecuador, Honduras, Guatemala, Panama, etc 5Israel, Iran, Syria, Lebanon, Saudi Arabia, Kuwait, etc Source: UNEP Risoe CDM/JI pipeline
It’s observed from table 2 that the projects in Asia & the Pacific, and Latin America accounted for almost 95% of all projects. In Asia & the Pacific region, China and India hold the first and second position in terms of CDM projects number respectively. And in Latin America, Brazil and Mexico are the top two. In the table 2, there are 4016, 2171, 426, 215 CDM projects in China, India, Brazil, and Mexico respectively. The sum of the projects in these four countries accounted for around 79% out of all. However, the numbers of projects vary with time. The fraction of total projects in the four countries out of all projects started from 50% in 2004, reached the highest - 85% to date in mid 2006, and fell around 50% in the first quarter of 2013 due to more countries, especially in Africa, are active, along with changes in policies, financial instruments, incentives to investment and international carbon markets, among others (CDM Pipeline, 2013). 2.2.2. CDM Benefits The Report of ‘Benefits of the CDM 2012’ issued by UNFCCC, highlights that, from 2004 the first CDM project registered up to the end of 2012, 161 countries and more than 4500 organizations participated into CDM, more than 1 billion tons of CO2 equivalent (tCO2e) have been mitigated, renewable energy projects with capacity of 120 gigawatts (GW) have been installed, at least 3.6 billion US$ in emission reduction costs have been saved for developed countries, 9.5 – 13.5 billion US$ have been earned directly from sale of CERs, and 215.4 billion US$ has been mobilized to CDM projects in developing countries, as well as other non-quantified benefits, including transfer of technology and know-how, stimulation to sustainable development. Contribution to sustainable development is a fundamental objective and an eligibility criterion of CDM projects. CDM Executive Board left the responsibility of specifying sustainable development indicators to project host countries in line with their own national priorities/policies, while with consideration of the international framework, etc. The report generalized them from economic, environmental and social perspectives, from studies of more than 4000 registered CDM projects. In the economic dimension, CDM projects stimulate economy through job creation for local people, poverty reduction, enhancement of investment in this area, cost saving and tax creation for local community or domestically. Besides, they invest into infrastructure, promote technology transfer, stimulate the transition to less carbon-intensive or low-carbon development, etc. In the environmental dimension, CDM projects reduce pollutions besides
- 4 -
GHG emissions, increase renewable energy capacity, enhance the energy security by diversifying energy sources, and preserve natural resources by reasonably utilizing natural resources and wastes. In the social dimension, they improve the local health situation, provide training to local workers, empower women and children, as with access to energy they don’t need to spend that much time picking wood for fuel, and promote education as a result of the improved accessibility to education resources, and so on. As CDM projects have a large variety, and each takes place under different circumstances, any CDM project could contribute to sustainable development from some of the abovementioned aspects or some additional sides. Those are clearly stated in ‘Description of the project activity’ in Paragraph 2, Section A in Project Design Document for each CDM project. 2.2.3. CDM Project Cycle There are seven steps for a CDM project from the design stage to being issued with CERs (UNFCCC, CDM Project Cycle). Step 1: Project Design; the project participants design the project according to the Project Design Document (hereafter referred to as PDD) developed by CDM Executive Board, following its relevant approved emission baseline and monitoring methodology; Step 2: National Approval; after the PDD being completed, the project participants submit it to Designated National Authority (DNA) which is granted by a Party to authorize participation in CDM projects, in order to get an approval letter to testify that the proposed project contributes to the country’s sustainable development according to national development priorities, among others; Step 3: Validation; the Designated Operational Entity (DOE) which is an individual third party certifier, validates CDM projects against CDM requirements; Step 4: Registration; after validation, the Designated Operational Entity sends the PDD to CDM Executive Board for registration which is the formal acceptance as a CDM project at United Nations so as to further get issued CERs accordingly; Step 5: Monitoring; once the project has been registered as a CDM project, the project participants are responsible for monitoring actual emission in line with relevant approved methodologies; Step 6: Verification: the Designated Operational Entity verifies if the emission claimed by project
participants is credible, i.e., if the actual emission is as claimed, and accordingly certifies it. Step 7: CER Issuance: after verification, the Designated Operational Entity sends a request for CERs issuance to CDM Executive Board. CERs, i.e. Certified Emission Reductions, commonly known as ‘carbon credits’, each unit of which is equal to one metric tonne equivalent carbon dioxide (CO2), expressed as t CO2e. The CDM Executive Board supervises all the CDM projects under the authorization of the Conference of Parties (COP), and makes the final decision regarding the registration and issuance of CDM projects. According to the Term of Reference of the Support Structure of CDM Executive Board 2012, the UNFCCC Secretariat (hereafter referred to as Secretariat) provides institutional and technical support, including, administering the CDM processes’ implementation, assessing the compliance of proposed/registered CDM projects against the requirements, providing recommendations on the procedures of each CDM process, etc. In the above listed step 3 and step 7 of the CDM project Cycle, i.e., both the Registration and Issuance steps, the Secretariat does compliance check and vetting, and the Executive Board does vetting. If there is a Party or if three members of the Executive Board request review for registration/issuance, the project has to undergo review. The Executive Board is assisted by Registration and Issuance Team for both steps. According to the Term of Reference for the Registration, and Issuance Team (RIT) 2012, the team is constituted of a group of experts, playing a role in assisting the CDM Executive Board to assess the requests for registration and issuance of CERs of projects. The RIT and the Secretariat could hold different views towards a project in accordance with their own judgment, while the CDM Executive Board makes the final decision. At the CDM Executive Board 63rd meeting, the Secretariat and the RIT proposed different decisions regarding a request for issuance of a Wind CDM project owing to their different views on the estimated PLF. Thus, the Board discussed the issue and in particular discussed the magnitude and permanence of the PLF variations and the initial PLF estimation in Project Design Document (PDD), and afterwards requested the Secretariat to prepare relevant study, which was the origin of this thesis (refer the first Chapter of Introduction).
- 5 -
2.2.4. CDM Project additionality The CDM is defined in Article 12 under Kyoto Protocol, which specifies several criteria for CDM project’s eligibility. Three of them are specifically indicated, which are: i) the participation is volunteered by approved Parties; ii) the emission reduction is real and measurable; iii) the emission reduction is ‘additional to any that would occur in the absence of the certified CDM project (Paragraph 5, Article 12, Kyoto Protocol)’. In other words, additionality to a project implies that after its implementation, the greenhouse gas emissions are less than those generated by a plausible alternative project that would have occurred. Additionality is a key component for CDM projects. To put the concept easy-to-understand, as different terminologies having been used to describe it in climate policy literature (Gillenwater, M, 2012), financial additionality and environmental additionality were chosen as examples to illustrate in the context of CDM. Financial additionality is often used interchangeably with investment additionality. It basically refers to whether a project is financially attractive, or in other words, the investment for the project would take place, without the revenue from the CDM credits (Gillenwater, M, 2012). To conceptualize it, let’s take a solar project as an example. A solar company is planning to undertake a solar project in a developing country, and 25% return rate should at least be guaranteed according to the budget. If the expected return rate is less than 25%, the company would not undertake the project. However, if the project is to be registered as a CDM project, with the crediting, the return rate would be higher than 25%. Thus, the solar company would undertake it. This solar project is financially additional. Conversely, if the expected return rate is equal or more than 25%, the project is not financially additional as it ‘would have taken place’ without revenues from CDM crediting. Environmental additionality refers to whether a project reduces GHG emissions compared to a baseline. Environmental additionality is measurable and quantifiable. And the reduced emission will further be used to calculate the corresponding CERs. To conceptualize it, let’s continue with the solar project example. To undertake the project, the solar company needs to calculate the GHG emission and the baseline emission which is the emission that ‘would have taken place with the absence of this CDM project’. The baseline emission is calculated based on the baseline scenario, which is identified by the solar company (project participant) according to relevant approved methodologies and with consideration of sectoral/national policies and other circumstances,
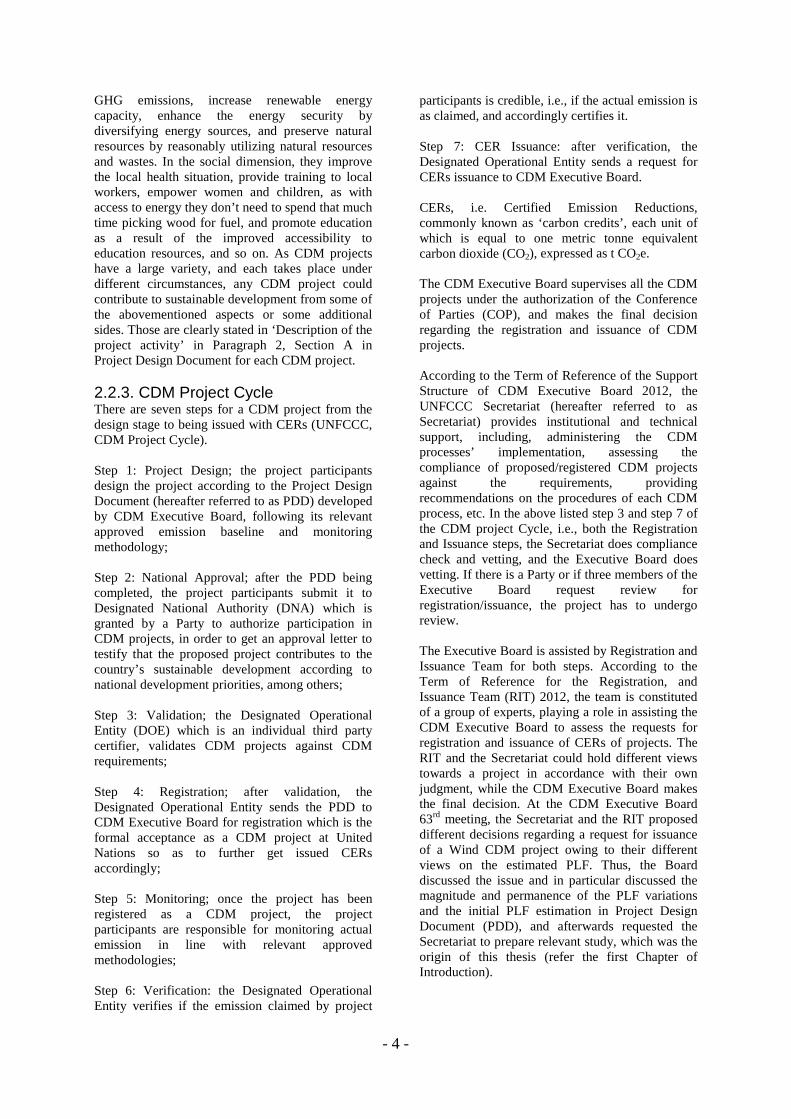
as well as afterwards verified by DOEs. If the emission from the project is less than the baseline emission, the project is emission additional, in other words, environmental additional. And the difference between the actual emission and baseline emission is the reduced emission. This quantified reduction is further for the CERs calculation. The CDM Executive Board issued ‘Tool for the demonstration and assessment of additionality’, which is used for Project Participants to demonstrate additionality, and also for the DOEs and the Board itself to assess the additionality of any CDM project. Y N N N n Y Y Optional Y N Y N N Y Fig.1. the flowchart of steps to demonstrate and assess additionality Source: UNFCCC CDM Tools page
Step 0: Is the project is First-of- its-kind project activities?
Step 1: to identify alternatives to the project according to laws and regulations
Step 3: Barrier Analysis: i) Is there at least one barrier preventing the implementation of the project without the CDM? And ii) is at least one alternative, other than the proposed CDM project, not prevented by any of the identified barriers?
Step 2: Investment Analysis: Does the sensitive analysis conclude the project is unlikely to be (the most) financially attractive?
Step 4: Common practice analysis i) No similar activities can be observed? ii) if similar activities are observed, are there essential distinctions between the proposed CDM project activity that can reasonably be explained?
Project is additional
Project is non-additional
- 6 -
The tool is a step-wise approach and the steps are shown in Figure 1. Using this tool, the project participants must explain ‘why and how the project is additional, and not the baseline scenario (CDM, PDD)’, by applying several analyses. Essentially, they need to demonstrate i) in investment analysis step, the proposed project is less financially attractive compared to the most plausible alternative project or the benchmark; and/or ii) in the barrier analysis step, the proposed project has to overcome prohibitive barriers; and iii) in the common practice analysis step, the project is not a ‘common practice’. They need to at first build a baseline scenario and to testify the project itself is not the scenario (World Bank, 2010). Overtime, the investment analysis is increased used over barrier analysis due to its quantitative nature within this tool (WB, 2010; Schneider, 2011). The CDM Executive Board also issued ‘Combined tool to identify the baseline scenario and demonstrate additionality’ and simplified tools for small/micro scale projects. Even with tools for additionality demonstration, the process is still controversial and has been a subject of debate in international climate conferences among different stakeholders since the establishment of CDM (Schneider, 2011). The main debate is about whether a project is additional or non-additional based on the information it provided. In the World Bank’s publication, it is stated that the inability to demonstrate additionality by using the CDM process is the most common reason that caused the rejection of the proposed project at CDM Executive Board (World Bank, 2010). The concept of additionality is essential for CDM to preserve environmental integrity which is fundamental in climate regime (Muller B., 2009, World Bank, 2010, Schneider, 2011). The environmental integrity of an off-set mechanism such as CDM, refers to that the carbon credits generated from a project accurately correspond to the actual emission reductions achieved by that project. As CDM is a zero-sum mechanism, it doesn’t lead to additional emission reduction beyond the cap which is the emission permitted under Kyoto Protocol. The carbon credits earned from emission reduction projects in developing countries are used to offset the same amount of emissions in developed countries. In other words, through this mechanism, the emissions are virtually shifted geographically, instead of reduced. If a project is non-additional, i.e. business-as-usual, and sells credits to a developed country under CDM, it will cause the developed country emit more than its permission without reducing the same amount of emission in the developing country where the
project takes place, further, cause the increase of emission over the cap under Kyoto Protocol regime. Therefore, additionality plays a key role to ensure the environmental integrity of CDM (Carbon Market Watch, 2008; Muller B., 2009; Streck C., 2010). 2.3. Wind CDM Project The numbers of different project types in table 1 shows that up to the end of 2012, wind power CDM projects accounted for the largest share out of all CDM projects. A total of 2611 wind projects were in ‘CDM Pipeline’ which included 2140 projects in status of registered with or without issued CERs, 35 in process of registration, and 436 at validation stage. Out of the registered 2140 projects, 602 were issued with CERs which amounted to 114213kCERs. Further, there are 41 host countries spread in Africa, Asia and the Pacific, Europe and Central Asia, Mid-east as well as Latin America (CDM Pipeline, 2012). 2.3.1. Wind CDM projects’ Contributions to Sustainable Development The contributions to sustainable development in host countries are clearly stated in ‘Description of the project activity’ in Paragraph 2, Section A in Project Design Document. For wind CDM projects, to summarize, the contributions to sustainable development in host developing countries are in ways such as,
(1) from environmental perspective, reducing the greenhouse gas (GHG) emissions primarily CO2 and other air pollutants, which would otherwise be generated by fuel-powered plant;
(2) from economical perspective, creating job opportunities during the installation and maintenance process of wind power plants;
(3) from social perspective, meeting the deficit of the electricity and improving the livelihood in the project area, etc.
Further, regarding any specific case, the contributions to sustainable development could be more than abovementioned depending on the given circumstances. Take the project ‘San Cristobal Wind Power Project in Ecuador’ (Reference number: 1255) as an example, economically, it encouraged a wider use of renewable energy technologies and provided incentives for private sector to invest in these technologies, meanwhile, it demonstrated innovative organizational and administrative model as the project was constructed under a public-private cooperation framework; environmentally, it catalyzed the improvement and
- 7 -
transition from diesel power plant and contributed a roadmap for diesel-wind hybrid project in nearby areas. Take the project ‘Amayo 40MW Wind Power Project - Nicaragua’ (Reference number: 2315) as another example, it resulted in technology transfer as it’s the first project that employed this technology and the wind power equipment provider agreed to train the local workers to guarantee the performance of the facilities. 2.3.2. Issues of Wind CDM Projects Wind CDM projects were regarded as a safe investment. And CDM was observed contributing significantly to promoting wind energy, as well as other renewable energy in developing countries, in the meantime, saving emission reduction costs for developed countries (Pechak O., Mavrotas G., Diakoulaki D., 2010). In 2009, the CDM Executive Board shocked the carbon market by questioning whether some wind CDM projects hosted in China met the CDM additionality requirement. Immediately following, the Executive Board rejected the registration of 10 wind projects from China at its 51st Meeting (EB 51st Meeting Report, 2009) on suspicions that the Chinese government was manipulating the feed-in tariff of electricity generated by wind power plants in order to make the wind projects economically less viable and, therefore, to meet the CDM additionality criterion, in order to attract the international investment under CDM credits. This Executive Board’s decision aroused strong reactions. The International Emission Trading Association (IETA) and the Global Wind Energy Council (GEWC) heavily criticized the Board for ignoring the evidences provided by stakeholders, crossing its mandate boundary of supervision CDM projects, and failing to substantiate its suspicion (IETA press, 2009). Besides, the Chinese delegation outright criticized the decision of rejection of the 10 wind projects’ registration as ‘irrational, non-transparent, unfair and interfering with the national energy policies’ at the Copenhagen Climate Change Conference which took place soon after that Board Meeting (China Org, 2009). The issue of plant load factor in Wind CDM projects has been controversial for a long time. Some professionals/organizations observed that, in a number of wind CDM projects, the Plant Load Factors in actual operation were higher than those estimated by project developers at the design stage. Further, they suspected that those project developers deliberately underestimated the Plant Load Factors so as to underestimate the amount of electricity, which in turn resulted in making the projects economically less viable in order to attract international investment under the CDM framework.
2.4. Plant Load Factor Plant load factor, is also called capacity factor, load factor. In electricity industry, it is the ratio of the actual output of a power plant over a period of time, to its potential output if it had operated at full nameplate/rated capacity the entire time (Wind Energy Center, 2008). For instance, there is a power plant with nameplate capacity 1MW, in 1 year, if it had operated with full capacity of 1MW for 24 hours a day for 365 days during the year, the output electricity would be 8760MWh (calculated from: 1MW*365(days)*24(hrs/day)); suppose that in fact the actual output electricity is 6000MWh, then, the plant load factor of this power plant during this year is 68% (calculated from: 6000/8760). Every power plant has its load factor. In wind power projects, the plant load factor is codetermined and affected by technological characteristics of installed wind turbines, and wind resources like wind speed/ direction/ frequency / density, etc, in the project taken location. As a result, plant load factor varies from project to project. According to the wind capacity report (Wind Energy Center, 2008), the typical plant load factor of a wind project is ranged from 20% to 40%. 2.4.1. Estimated PLF A project developer conducts necessary assessment and analyses when planning to carry out a wind project, in order to predict if the outcomes of the project would meet their objectives, financially, socially, etc. Wind CDM project participants need to estimate PLF, thus to estimate the amount of output electricity, combined with other factors, in order for the investment analysis to testify if this proposed project meets the CDM additionality criterion. In this study, Estimated PLF is the PLF of a project estimated at the design stage which is stated in the Project Design Document (PDD). 2.4.2. Actual PLF According to the CDM Project Cycle, CERs would be issued after a CDM project has taken place, project participants have monitored the actual emission reduction of the project, DOEs have validated the emission reduction, and finally the CDM Executive Board has agreed to it. Thus, Actual PLF is the PLF during the operation of a project which has been monitored and validated. As there could be one or more monitoring periods, i.e. one or more operation periods, for wind CDM projects, the actual PLF is the final average actual PLF of all the actual PLFs in each monitoring period.
- 8 -
2.4.3. Relative Variation of PLF The relative variation of PLF is the ratio of the difference between Estimated PLF and Actual PLF compared with the Estimated PLF. The calculation method is: (Estimated PLF - Actual PLF)/Estimated PLF.
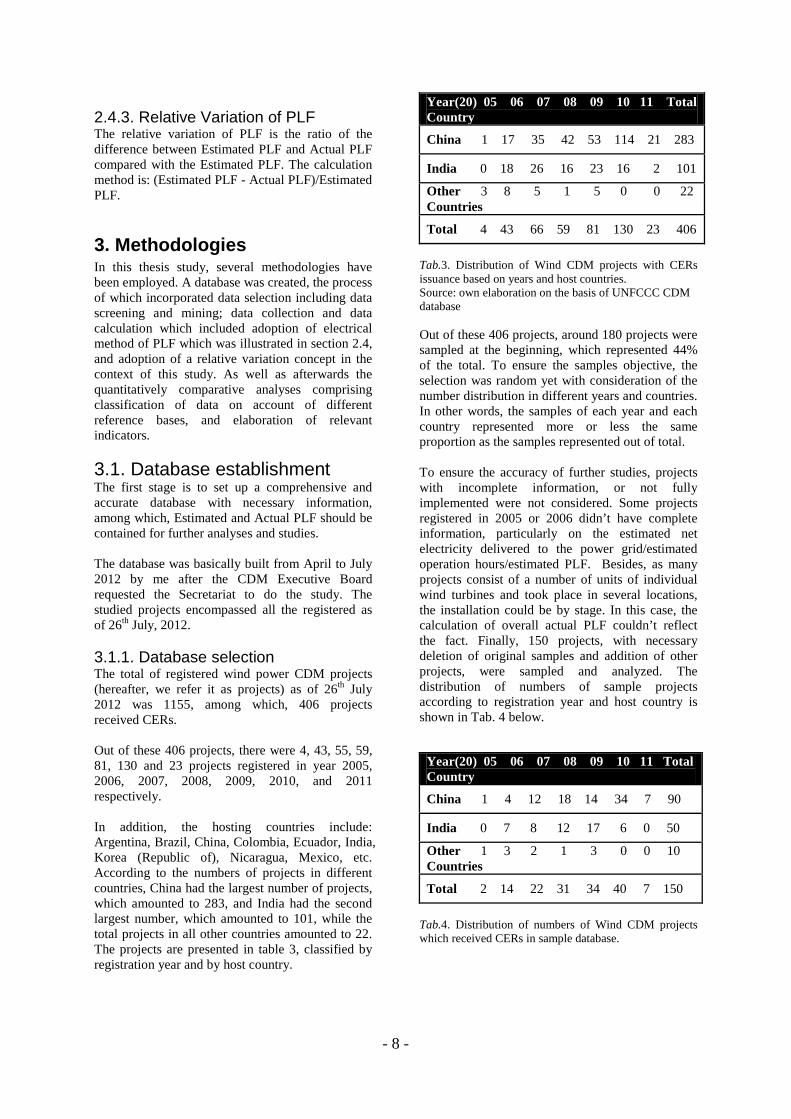
3. Methodologies In this thesis study, several methodologies have been employed. A database was created, the process of which incorporated data selection including data screening and mining; data collection and data calculation which included adoption of electrical method of PLF which was illustrated in section 2.4, and adoption of a relative variation concept in the context of this study. As well as afterwards the quantitatively comparative analyses comprising classification of data on account of different reference bases, and elaboration of relevant indicators. 3.1. Database establishment The first stage is to set up a comprehensive and accurate database with necessary information, among which, Estimated and Actual PLF should be contained for further analyses and studies. The database was basically built from April to July 2012 by me after the CDM Executive Board requested the Secretariat to do the study. The studied projects encompassed all the registered as of 26th July, 2012. 3.1.1. Database selection The total of registered wind power CDM projects (hereafter, we refer it as projects) as of 26th July 2012 was 1155, among which, 406 projects received CERs. Out of these 406 projects, there were 4, 43, 55, 59, 81, 130 and 23 projects registered in year 2005, 2006, 2007, 2008, 2009, 2010, and 2011 respectively. In addition, the hosting countries include: Argentina, Brazil, China, Colombia, Ecuador, India, Korea (Republic of), Nicaragua, Mexico, etc. According to the numbers of projects in different countries, China had the largest number of projects, which amounted to 283, and India had the second largest number, which amounted to 101, while the total projects in all other countries amounted to 22. The projects are presented in table 3, classified by registration year and by host country.
Year(20) 05 06 07 08 09 10 11 Total Country
China 1 17 35 42 53 114 21 283
India 0 18 26 16 23 16 2 101
Other 3 8 5 1 5 0 0 22 Countries
Total 4 43 66 59 81 130 23 406 Tab.3. Distribution of Wind CDM projects with CERs issuance based on years and host countries. Source: own elaboration on the basis of UNFCCC CDM database Out of these 406 projects, around 180 projects were sampled at the beginning, which represented 44% of the total. To ensure the samples objective, the selection was random yet with consideration of the number distribution in different years and countries. In other words, the samples of each year and each country represented more or less the same proportion as the samples represented out of total. To ensure the accuracy of further studies, projects with incomplete information, or not fully implemented were not considered. Some projects registered in 2005 or 2006 didn’t have complete information, particularly on the estimated net electricity delivered to the power grid/estimated operation hours/estimated PLF. Besides, as many projects consist of a number of units of individual wind turbines and took place in several locations, the installation could be by stage. In this case, the calculation of overall actual PLF couldn’t reflect the fact. Finally, 150 projects, with necessary deletion of original samples and addition of other projects, were sampled and analyzed. The distribution of numbers of sample projects according to registration year and host country is shown in Tab. 4 below.
Year(20) 05 06 07 08 09 10 11 Total Country
China 1 4 12 18 14 34 7 90
India 0 7 8 12 17 6 0 50
Other 1 3 2 1 3 0 0 10 Countries
Total 2 14 22 31 34 40 7 150 Tab.4. Distribution of numbers of Wind CDM projects which received CERs in sample database.
- 9 -
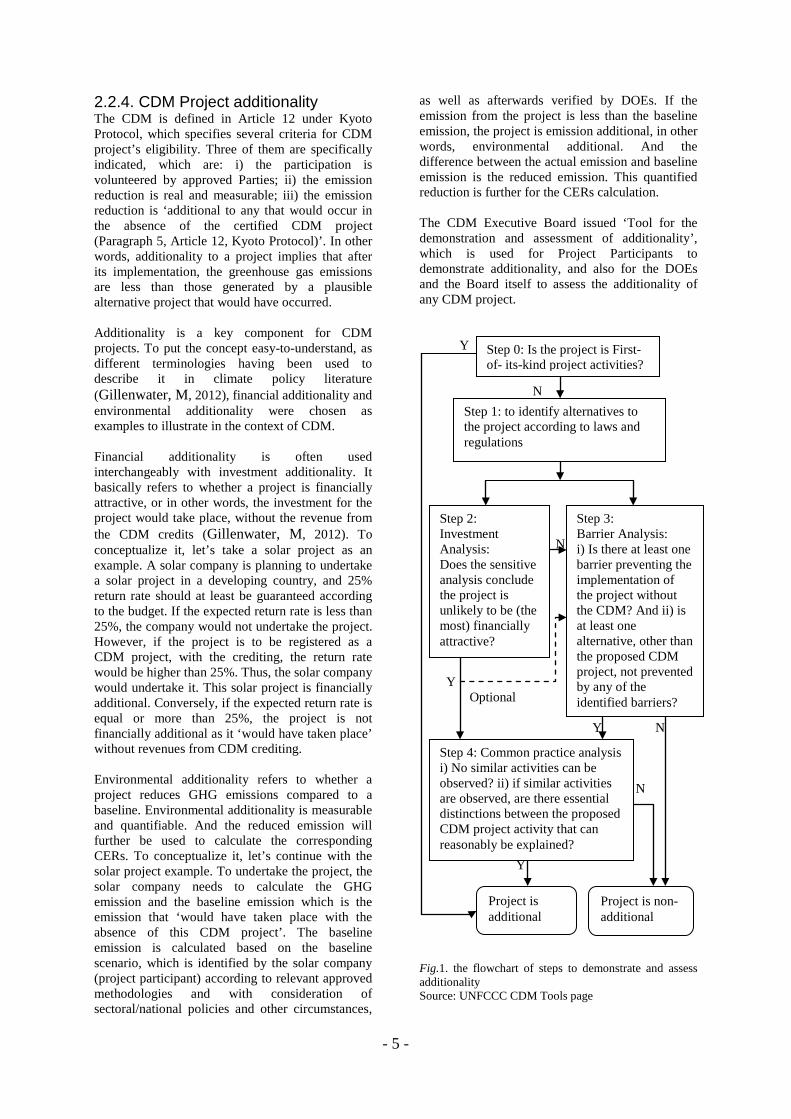
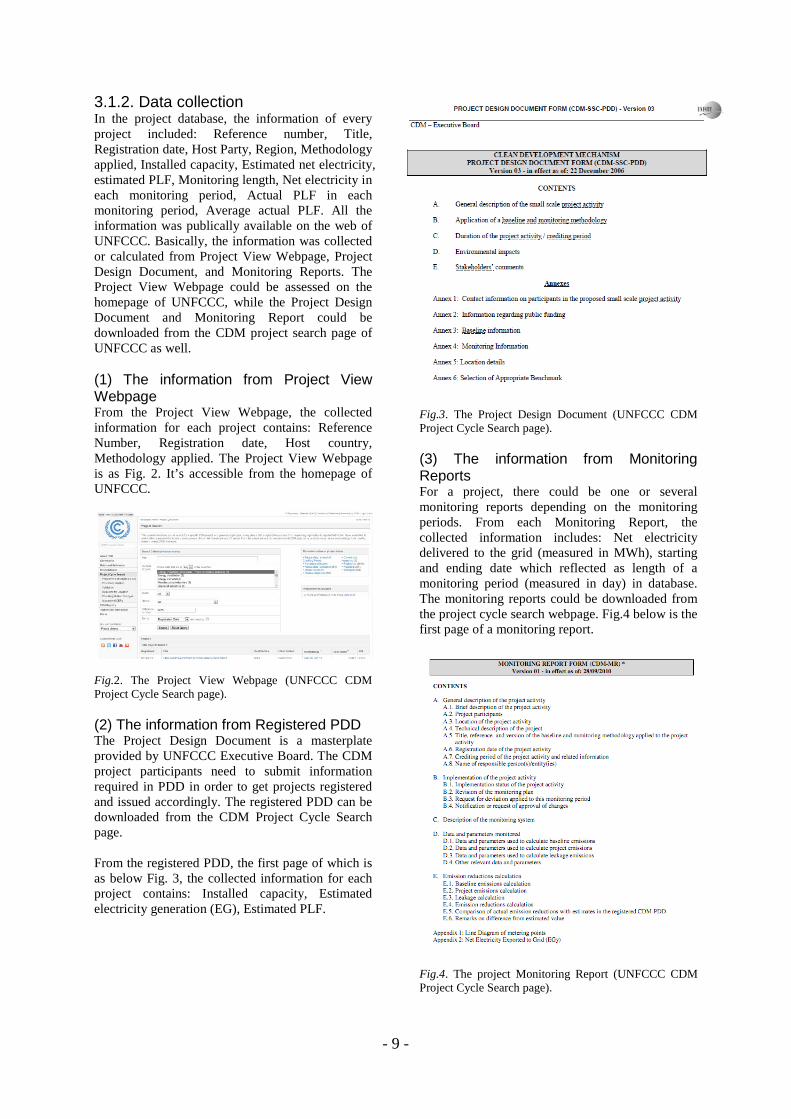
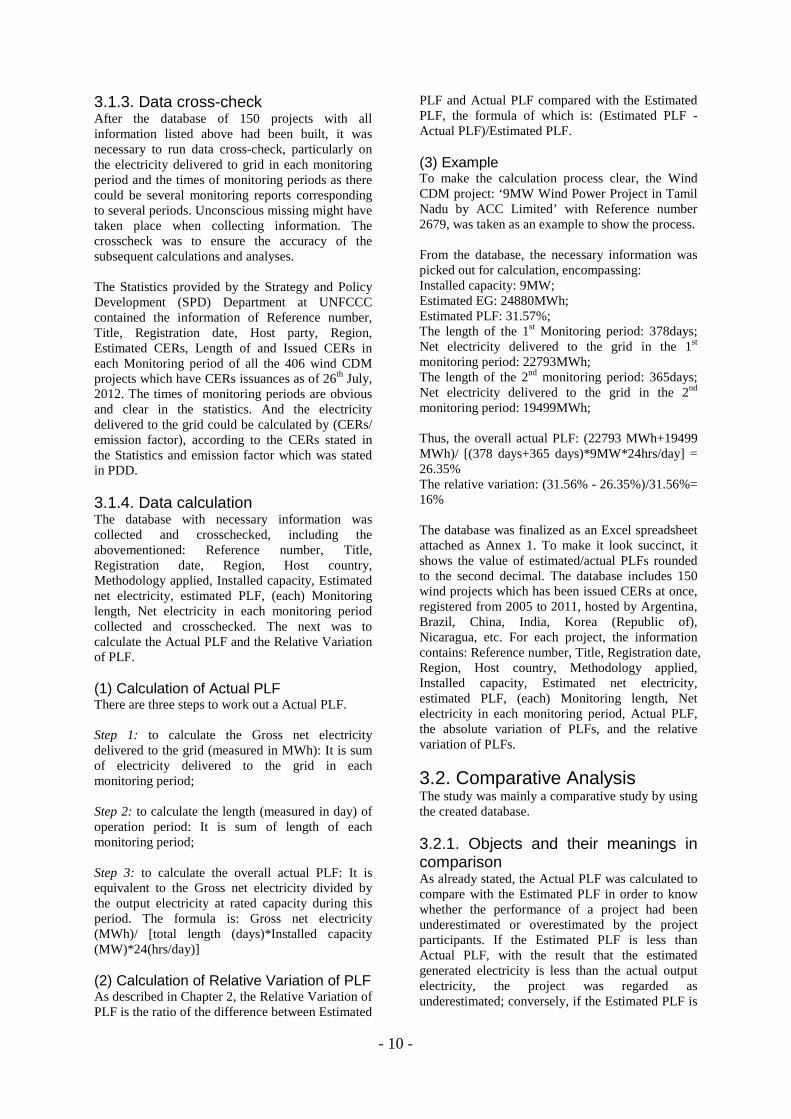
3.1.2. Data collection In the project database, the information of every project included: Reference number, Title, Registration date, Host Party, Region, Methodology applied, Installed capacity, Estimated net electricity, estimated PLF, Monitoring length, Net electricity in each monitoring period, Actual PLF in each monitoring period, Average actual PLF. All the information was publically available on the web of UNFCCC. Basically, the information was collected or calculated from Project View Webpage, Project Design Document, and Monitoring Reports. The Project View Webpage could be assessed on the homepage of UNFCCC, while the Project Design Document and Monitoring Report could be downloaded from the CDM project search page of UNFCCC as well. (1) The information from Project View Webpage From the Project View Webpage, the collected information for each project contains: Reference Number, Registration date, Host country, Methodology applied. The Project View Webpage is as Fig. 2. It’s accessible from the homepage of UNFCCC.
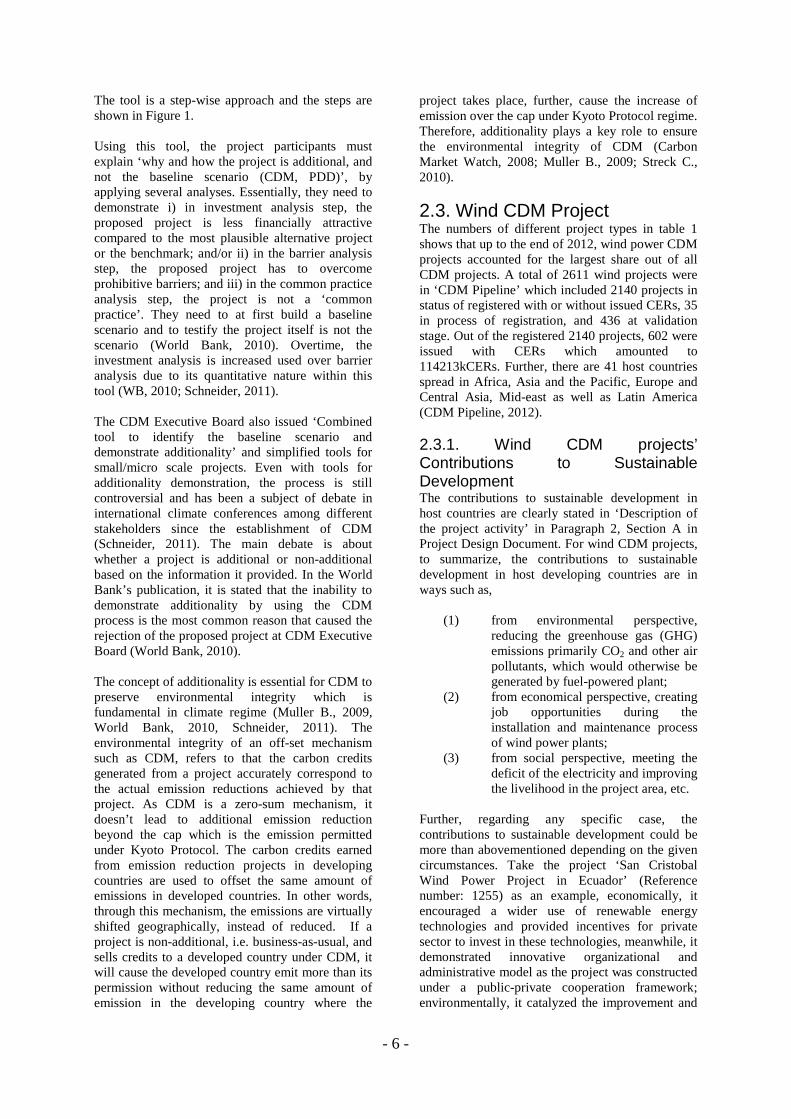
Fig.2. The Project View Webpage (UNFCCC CDM Project Cycle Search page). (2) The information from Registered PDD The Project Design Document is a masterplate provided by UNFCCC Executive Board. The CDM project participants need to submit information required in PDD in order to get projects registered and issued accordingly. The registered PDD can be downloaded from the CDM Project Cycle Search page. From the registered PDD, the first page of which is as below Fig. 3, the collected information for each project contains: Installed capacity, Estimated electricity generation (EG), Estimated PLF.
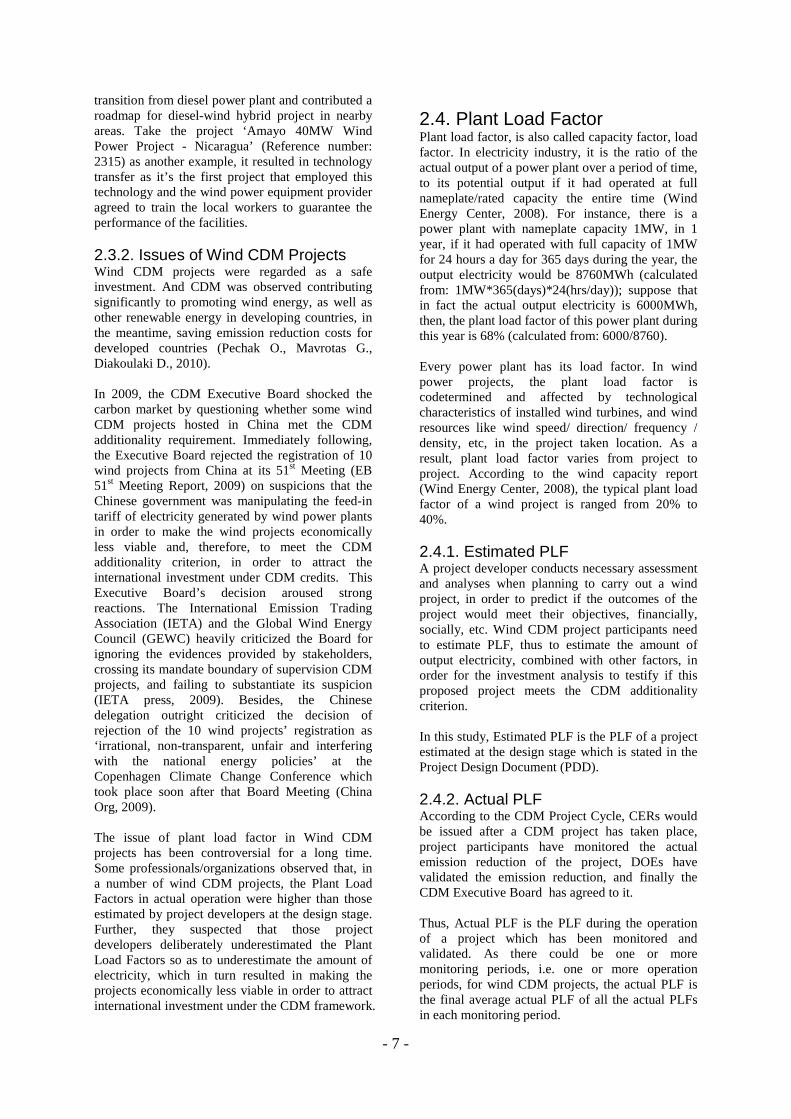
Fig.3. The Project Design Document (UNFCCC CDM Project Cycle Search page). (3) The information from Monitoring Reports For a project, there could be one or several monitoring reports depending on the monitoring periods. From each Monitoring Report, the collected information includes: Net electricity delivered to the grid (measured in MWh), starting and ending date which reflected as length of a monitoring period (measured in day) in database. The monitoring reports could be downloaded from the project cycle search webpage. Fig.4 below is the first page of a monitoring report.
Fig.4. The project Monitoring Report (UNFCCC CDM Project Cycle Search page).
- 10 -
3.1.3. Data cross-check After the database of 150 projects with all information listed above had been built, it was necessary to run data cross-check, particularly on the electricity delivered to grid in each monitoring period and the times of monitoring periods as there could be several monitoring reports corresponding to several periods. Unconscious missing might have taken place when collecting information. The crosscheck was to ensure the accuracy of the subsequent calculations and analyses. The Statistics provided by the Strategy and Policy Development (SPD) Department at UNFCCC contained the information of Reference number, Title, Registration date, Host party, Region, Estimated CERs, Length of and Issued CERs in each Monitoring period of all the 406 wind CDM projects which have CERs issuances as of 26th July, 2012. The times of monitoring periods are obvious and clear in the statistics. And the electricity delivered to the grid could be calculated by (CERs/ emission factor), according to the CERs stated in the Statistics and emission factor which was stated in PDD. 3.1.4. Data calculation The database with necessary information was collected and crosschecked, including the abovementioned: Reference number, Title, Registration date, Region, Host country, Methodology applied, Installed capacity, Estimated net electricity, estimated PLF, (each) Monitoring length, Net electricity in each monitoring period collected and crosschecked. The next was to calculate the Actual PLF and the Relative Variation of PLF. (1) Calculation of Actual PLF There are three steps to work out a Actual PLF. Step 1: to calculate the Gross net electricity delivered to the grid (measured in MWh): It is sum of electricity delivered to the grid in each monitoring period; Step 2: to calculate the length (measured in day) of operation period: It is sum of length of each monitoring period; Step 3: to calculate the overall actual PLF: It is equivalent to the Gross net electricity divided by the output electricity at rated capacity during this period. The formula is: Gross net electricity (MWh)/ [total length (days)*Installed capacity (MW)*24(hrs/day)] (2) Calculation of Relative Variation of PLF As described in Chapter 2, the Relative Variation of PLF is the ratio of the difference between Estimated
PLF and Actual PLF compared with the Estimated PLF, the formula of which is: (Estimated PLF - Actual PLF)/Estimated PLF. (3) Example To make the calculation process clear, the Wind CDM project: ‘9MW Wind Power Project in Tamil Nadu by ACC Limited’ with Reference number 2679, was taken as an example to show the process. From the database, the necessary information was picked out for calculation, encompassing: Installed capacity: 9MW; Estimated EG: 24880MWh; Estimated PLF: 31.57%; The length of the 1st Monitoring period: 378days; Net electricity delivered to the grid in the 1st monitoring period: 22793MWh; The length of the 2nd monitoring period: 365days; Net electricity delivered to the grid in the 2nd monitoring period: 19499MWh; Thus, the overall actual PLF: (22793 MWh+19499 MWh)/ [(378 days+365 days)*9MW*24hrs/day] = 26.35% The relative variation: (31.56% - 26.35%)/31.56%= 16% The database was finalized as an Excel spreadsheet attached as Annex 1. To make it look succinct, it shows the value of estimated/actual PLFs rounded to the second decimal. The database includes 150 wind projects which has been issued CERs at once, registered from 2005 to 2011, hosted by Argentina, Brazil, China, India, Korea (Republic of), Nicaragua, etc. For each project, the information contains: Reference number, Title, Registration date, Region, Host country, Methodology applied, Installed capacity, Estimated net electricity, estimated PLF, (each) Monitoring length, Net electricity in each monitoring period, Actual PLF, the absolute variation of PLFs, and the relative variation of PLFs. 3.2. Comparative Analysis The study was mainly a comparative study by using the created database. 3.2.1. Objects and their meanings in comparison As already stated, the Actual PLF was calculated to compare with the Estimated PLF in order to know whether the performance of a project had been underestimated or overestimated by the project participants. If the Estimated PLF is less than Actual PLF, with the result that the estimated generated electricity is less than the actual output electricity, the project was regarded as underestimated; conversely, if the Estimated PLF is
- 11 -
greater than Actual PLF, resulting in the estimated electricity greater than the actual output electricity, the project was regarded as overestimated. The underestimation/overestimation of PLFs gave a general view of performance of the Wind power CDM projects which had been issued with CERs. After the overview of projects’ performance has been given, it is further necessary to know the magnitude of the over/under performance, the concepts of which were described as under/over estimation of the PLFs by project developers in the previous paragraph. In the database, the estimated PLF varies from project to project, ranging from 16%, which is a wind project with reference number 1225 in Ecuador, to 48%, the reference number of which is 2315 in Nicaragua. Thus, the absolute difference, i.e., the value of Estimated PLF subtract Actual PLF, can’t reasonably reflect the magnitude. For instance, suppose the difference between Estimated PLF and Actual PLF of two projects was equally 5%, one project has estimated PLF of 20% and the other one 40%, the same difference of 5% doesn’t mean the same effect to both projects. Hereby, the concept of relative difference has been adopted to more effectively and correctly reflect the magnitude of under/over estimation. Moreover, as stated in section 2.2.4, the project participants shall demonstrate the additionality of the proposed project in Project Design Document. The flowchart of tool to demonstrate additionality is depicted in figure 1. Step 2 - investment analysis - testifies if the proposed project is less financially attractive compared to the most plausible alternative project or the benchmark. This step includes a sub-step – sensitivity analysis, which analyzes relevant factors to check out if the conclusion regarding the financial attractiveness is robust to reasonable variations. A plus-minus 10% variation of relevant parameters (such as PLF) is applied. Hence, if the relative variation falls into a certain range which is between -10% and 10%, in other words, the magnitude of over/under estimation of performance is between -10% and 10%, it is supposed to be acceptable. Otherwise, if it falls outside this range, the estimation is supposed as defective, particularly, if it is less than -10%, that is to say, the magnitude of underestimation is more than 10%, it needs to be questioned if the project has properly met additionality criterion. 3.2.2. Basis of comparison As interpreted in the previous section, the comparison was at first conducted in all projects to generate an overview of the performance, as well as magnitude of over/under estimation of PLFs. Considering different attributes of wind CDM projects, the following basis was employed.
Firstly, CDM projects are categorized into large scale and small scale groups, for which, the methodological tools to demonstrate additionality or calculate particular emission are different (CDM Methodology Booklet, 2012). In terms of wind CDM projects, the small scale has installed capacity less than 15MW, while large scale greater than 15MW. Capacity of 15MW could be categorized into either group depending on which methodology tool it has applied. Therefore, comparison analyses were separately conducted in small-scale and large-scale groups. Secondly, as those projects were located worldwide, with regard to the similar geographic characteristics in the same country or region, while considering projects’ distribution in different countries (please refer to 3.1.1), comparison analyses were respectively conducted in China, India, and other countries as a group.
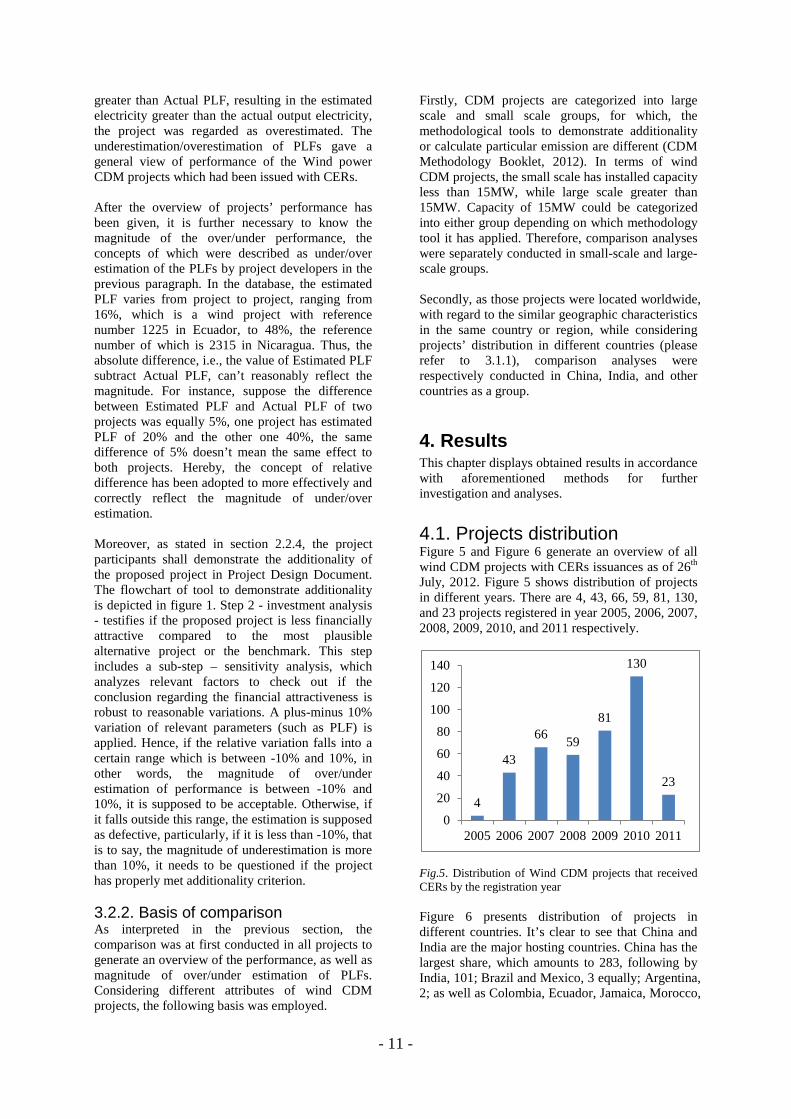
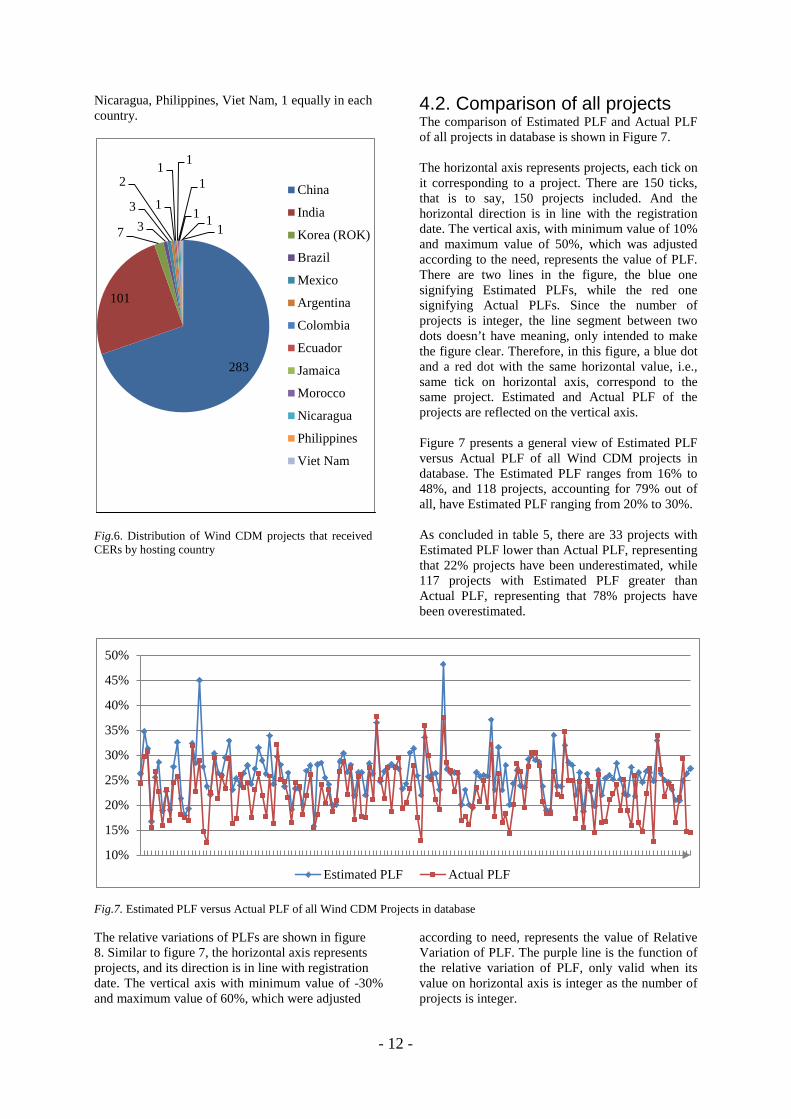
4. Results This chapter displays obtained results in accordance with aforementioned methods for further investigation and analyses. 4.1. Projects distribution Figure 5 and Figure 6 generate an overview of all wind CDM projects with CERs issuances as of 26th July, 2012. Figure 5 shows distribution of projects in different years. There are 4, 43, 66, 59, 81, 130, and 23 projects registered in year 2005, 2006, 2007, 2008, 2009, 2010, and 2011 respectively.
Fig.5. Distribution of Wind CDM projects that received CERs by the registration year Figure 6 presents distribution of projects in different countries. It’s clear to see that China and India are the major hosting countries. China has the largest share, which amounts to 283, following by India, 101; Brazil and Mexico, 3 equally; Argentina, 2; as well as Colombia, Ecuador, Jamaica, Morocco,
4
43
66 59
81
130
23
0
20
40
60
80
100
120
140
2005 2006 2007 2008 2009 2010 2011
- 12 -
Nicaragua, Philippines, Viet Nam, 1 equally in each country.
Fig.6. Distribution of Wind CDM projects that received CERs by hosting country
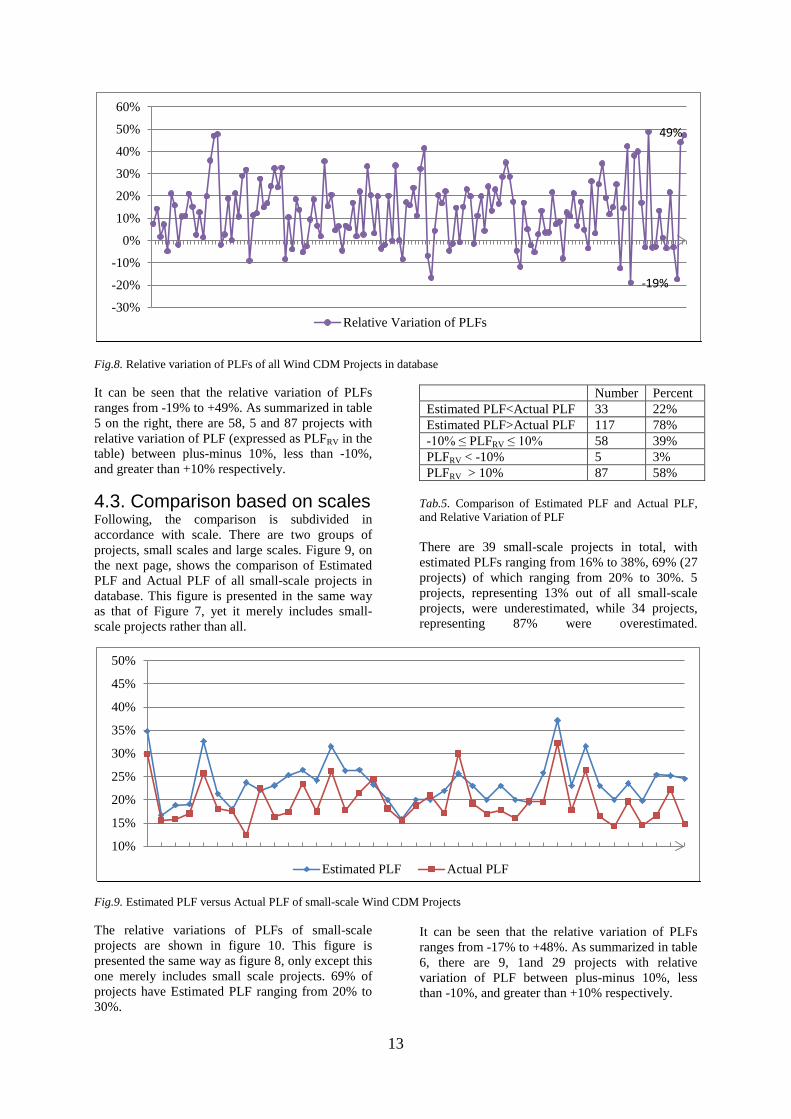
4.2. Comparison of all projects The comparison of Estimated PLF and Actual PLF of all projects in database is shown in Figure 7. The horizontal axis represents projects, each tick on it corresponding to a project. There are 150 ticks, that is to say, 150 projects included. And the horizontal direction is in line with the registration date. The vertical axis, with minimum value of 10% and maximum value of 50%, which was adjusted according to the need, represents the value of PLF. There are two lines in the figure, the blue one signifying Estimated PLFs, while the red one signifying Actual PLFs. Since the number of projects is integer, the line segment between two dots doesn’t have meaning, only intended to make the figure clear. Therefore, in this figure, a blue dot and a red dot with the same horizontal value, i.e., same tick on horizontal axis, correspond to the same project. Estimated and Actual PLF of the projects are reflected on the vertical axis. Figure 7 presents a general view of Estimated PLF versus Actual PLF of all Wind CDM projects in database. The Estimated PLF ranges from 16% to 48%, and 118 projects, accounting for 79% out of all, have Estimated PLF ranging from 20% to 30%. As concluded in table 5, there are 33 projects with Estimated PLF lower than Actual PLF, representing that 22% projects have been underestimated, while 117 projects with Estimated PLF greater than Actual PLF, representing that 78% projects have been overestimated.
Fig.7. Estimated PLF versus Actual PLF of all Wind CDM Projects in database The relative variations of PLFs are shown in figure 8. Similar to figure 7, the horizontal axis represents projects, and its direction is in line with registration date. The vertical axis with minimum value of -30% and maximum value of 60%, which were adjusted
according to need, represents the value of Relative Variation of PLF. The purple line is the function of the relative variation of PLF, only valid when its value on horizontal axis is integer as the number of projects is integer.
283
101
7 3 3
2
1
1 1
1
1 1 1
China
India
Korea (ROK)
Brazil
Mexico
Argentina
Colombia
Ecuador
Jamaica
Morocco
Nicaragua
Philippines
Viet Nam
10%
15%
20%
25%
30%
35%
40%
45%
50%
Estimated PLF Actual PLF
13
Fig.8. Relative variation of PLFs of all Wind CDM Projects in database It can be seen that the relative variation of PLFs ranges from -19% to +49%. As summarized in table 5 on the right, there are 58, 5 and 87 projects with relative variation of PLF (expressed as PLFRV in the table) between plus-minus 10%, less than -10%, and greater than +10% respectively.
4.3. Comparison based on scales Following, the comparison is subdivided in accordance with scale. There are two groups of projects, small scales and large scales. Figure 9, on the next page, shows the comparison of Estimated PLF and Actual PLF of all small-scale projects in database. This figure is presented in the same way as that of Figure 7, yet it merely includes small-scale projects rather than all.
Number Percent Estimated PLF<Actual PLF 33 22% Estimated PLF>Actual PLF 117 78% -10% ≤ PLFRV ≤ 10% 58 39% PLFRV < -10% 5 3% PLFRV > 10% 87 58%
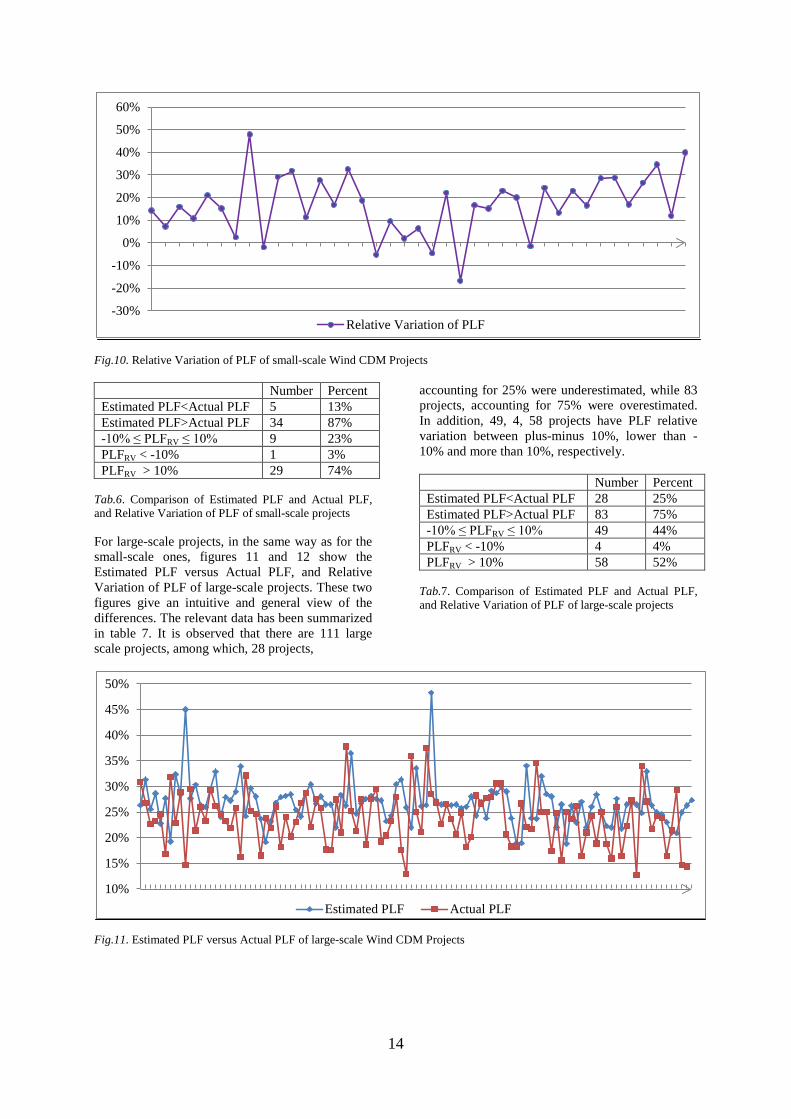
Tab.5. Comparison of Estimated PLF and Actual PLF, and Relative Variation of PLF There are 39 small-scale projects in total, with estimated PLFs ranging from 16% to 38%, 69% (27 projects) of which ranging from 20% to 30%. 5 projects, representing 13% out of all small-scale projects, were underestimated, while 34 projects, representing 87% were overestimated.
Fig.9. Estimated PLF versus Actual PLF of small-scale Wind CDM Projects The relative variations of PLFs of small-scale projects are shown in figure 10. This figure is presented the same way as figure 8, only except this one merely includes small scale projects. 69% of projects have Estimated PLF ranging from 20% to 30%.
It can be seen that the relative variation of PLFs ranges from -17% to +48%. As summarized in table 6, there are 9, 1and 29 projects with relative variation of PLF between plus-minus 10%, less than -10%, and greater than +10% respectively.
-19%
49%
-30%
-20%
-10%
0%
10%
20%
30%
40%
50%
60%
Relative Variation of PLFs
10%
15%
20%
25%
30%
35%
40%
45%
50%
Estimated PLF Actual PLF
14
Fig.10. Relative Variation of PLF of small-scale Wind CDM Projects
Number Percent Estimated PLF<Actual PLF 5 13% Estimated PLF>Actual PLF 34 87% -10% ≤ PLFRV ≤ 10% 9 23% PLFRV < -10% 1 3% PLFRV > 10% 29 74%
Tab.6. Comparison of Estimated PLF and Actual PLF, and Relative Variation of PLF of small-scale projects For large-scale projects, in the same way as for the small-scale ones, figures 11 and 12 show the Estimated PLF versus Actual PLF, and Relative Variation of PLF of large-scale projects. These two figures give an intuitive and general view of the differences. The relevant data has been summarized in table 7. It is observed that there are 111 large scale projects, among which, 28 projects,
accounting for 25% were underestimated, while 83 projects, accounting for 75% were overestimated. In addition, 49, 4, 58 projects have PLF relative variation between plus-minus 10%, lower than -10% and more than 10%, respectively.
Number Percent Estimated PLF<Actual PLF 28 25% Estimated PLF>Actual PLF 83 75% -10% ≤ PLFRV ≤ 10% 49 44% PLFRV < -10% 4 4% PLFRV > 10% 58 52%
Tab.7. Comparison of Estimated PLF and Actual PLF, and Relative Variation of PLF of large-scale projects
Fig.11. Estimated PLF versus Actual PLF of large-scale Wind CDM Projects
-30%
-20%
-10%
0%
10%
20%
30%
40%
50%
60%
Relative Variation of PLF
10%
15%
20%
25%
30%
35%
40%
45%
50%
Estimated PLF Actual PLF
15
Fig.12. Relative Variation of PLF of large-scale Wind CDM Projects
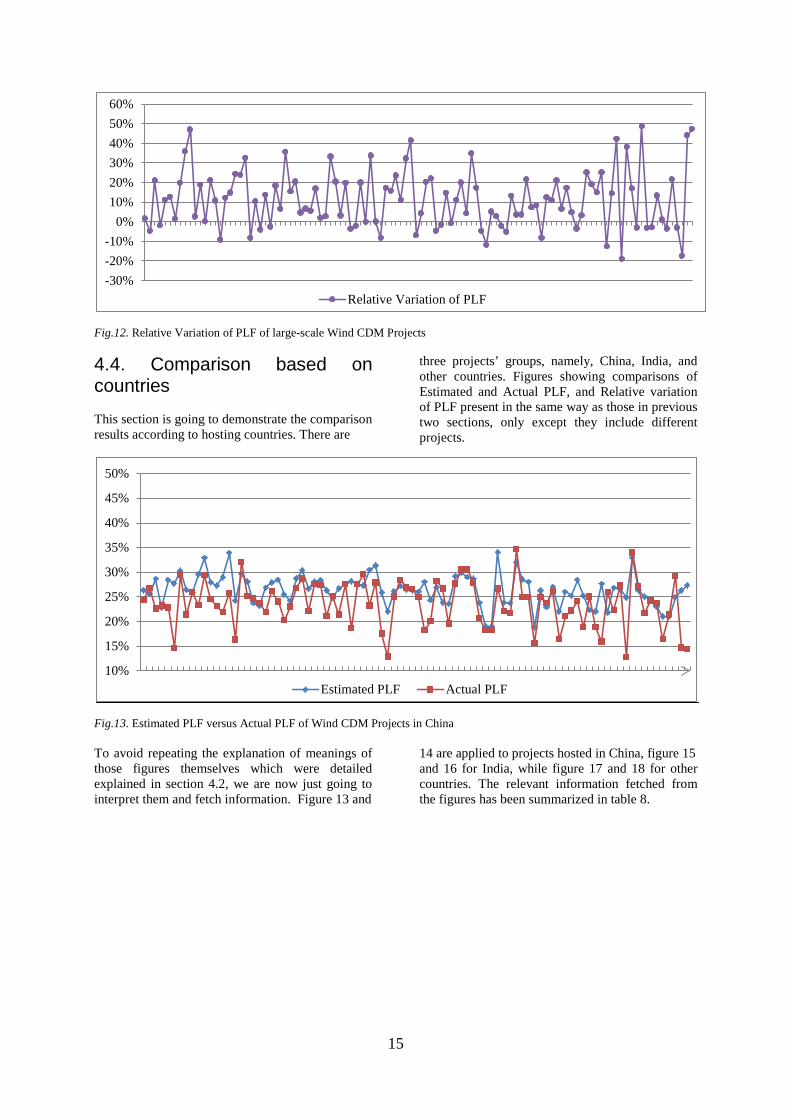
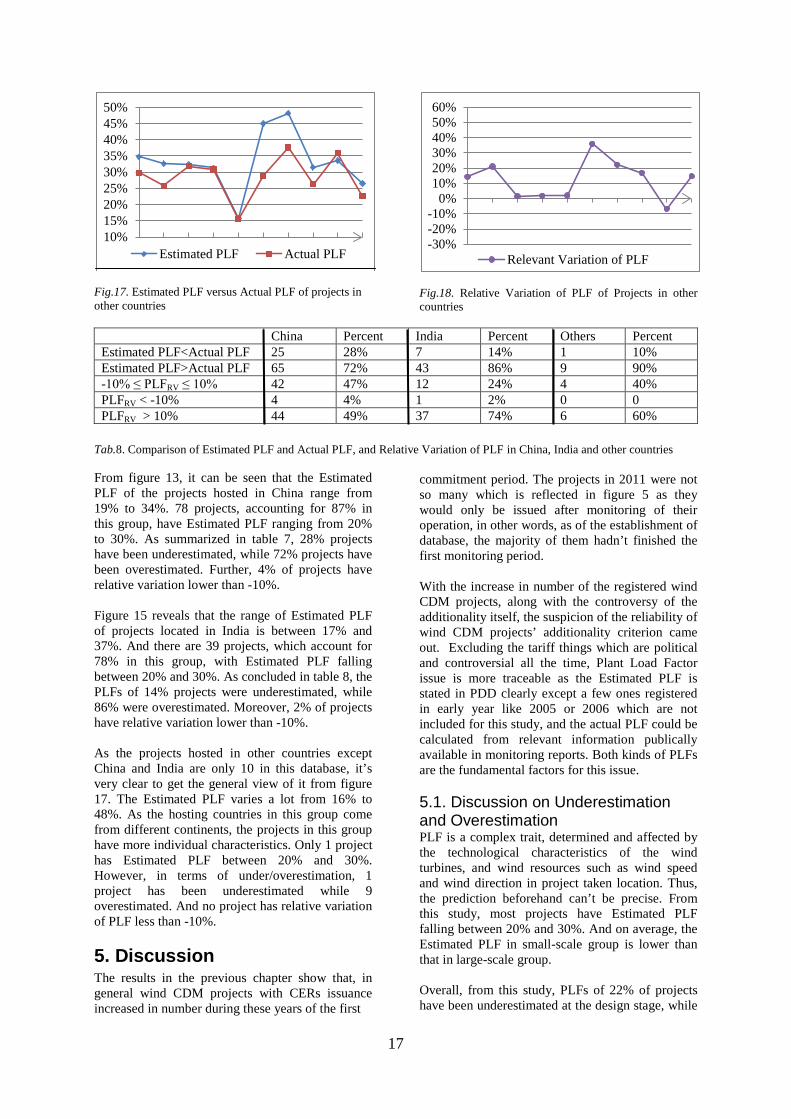
4.4. Comparison based on countries This section is going to demonstrate the comparison results according to hosting countries. There are
three projects’ groups, namely, China, India, and other countries. Figures showing comparisons of Estimated and Actual PLF, and Relative variation of PLF present in the same way as those in previous two sections, only except they include different projects.
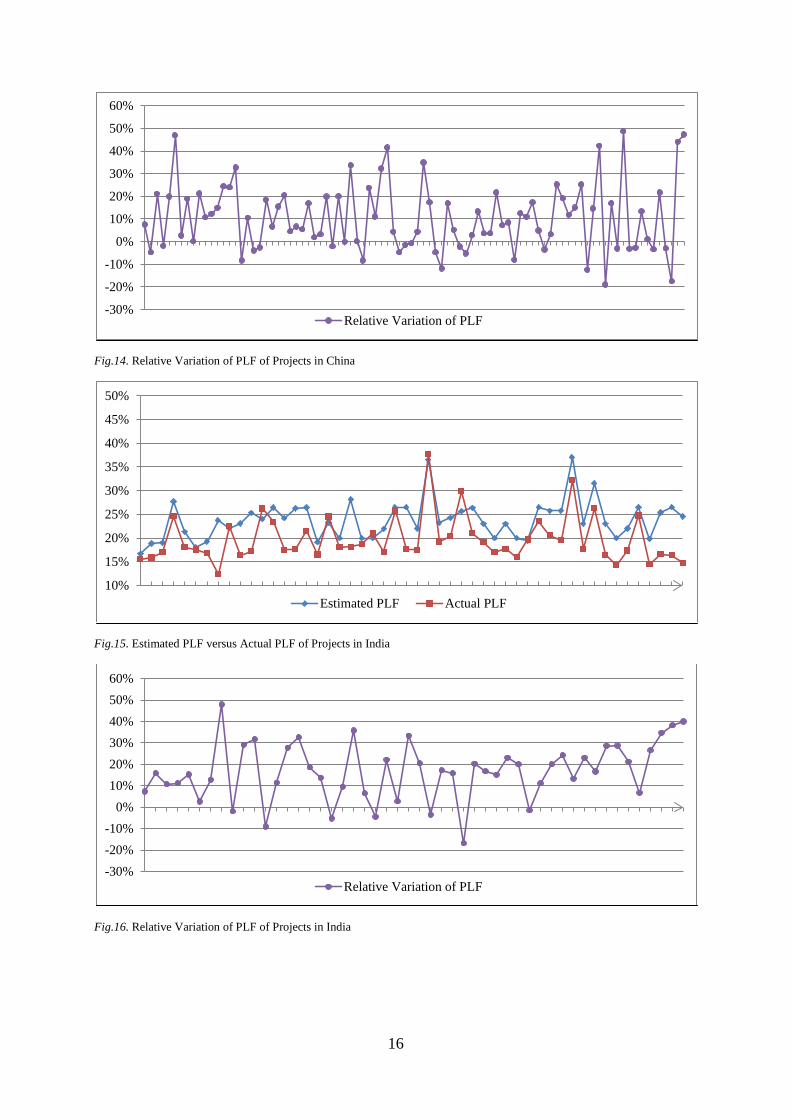
Fig.13. Estimated PLF versus Actual PLF of Wind CDM Projects in China To avoid repeating the explanation of meanings of those figures themselves which were detailed explained in section 4.2, we are now just going to interpret them and fetch information. Figure 13 and
14 are applied to projects hosted in China, figure 15 and 16 for India, while figure 17 and 18 for other countries. The relevant information fetched from the figures has been summarized in table 8.
-30%-20%-10%
0%10%20%30%40%50%60%
Relative Variation of PLF
10%
15%
20%
25%
30%
35%
40%
45%
50%
Estimated PLF Actual PLF
16
Fig.14. Relative Variation of PLF of Projects in China
Fig.15. Estimated PLF versus Actual PLF of Projects in India
Fig.16. Relative Variation of PLF of Projects in India
-30%
-20%
-10%
0%
10%
20%
30%
40%
50%
60%
Relative Variation of PLF
10%
15%
20%
25%
30%
35%
40%
45%
50%
Estimated PLF Actual PLF
-30%-20%-10%
0%10%20%30%40%50%60%
Relative Variation of PLF
17
Fig.17. Estimated PLF versus Actual PLF of projects in other countries
Fig.18. Relative Variation of PLF of Projects in other countries
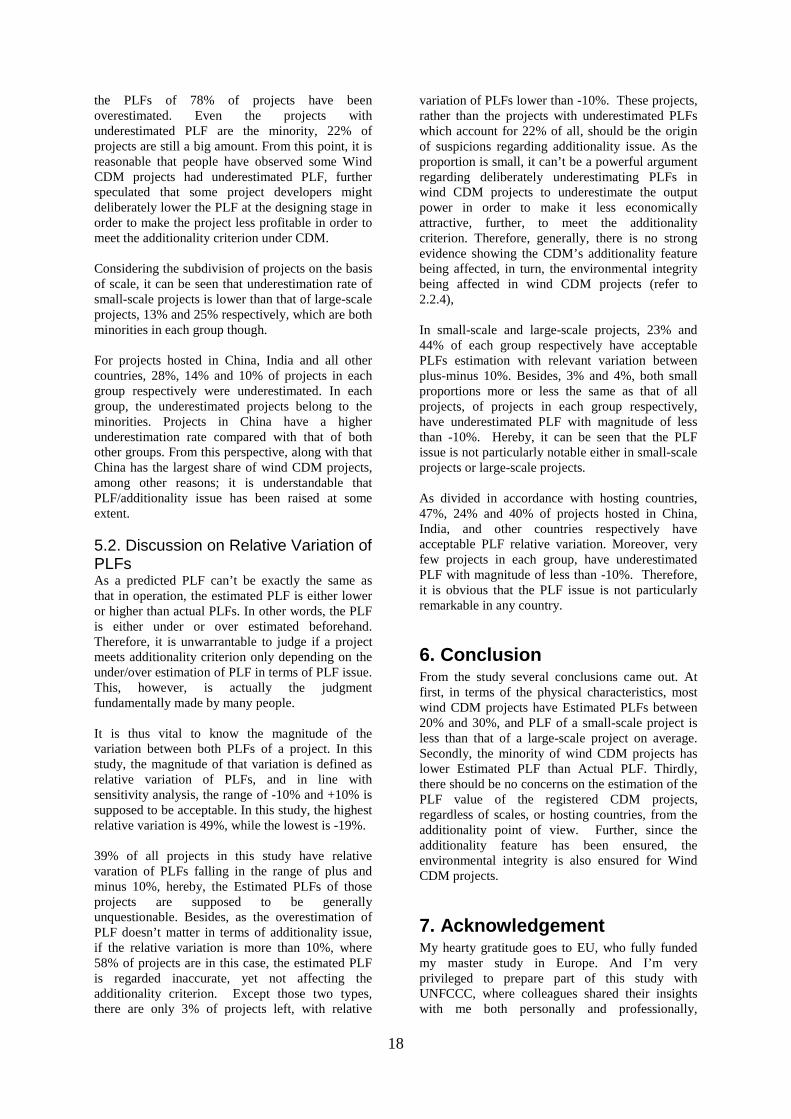
China Percent India Percent Others Percent Estimated PLF<Actual PLF 25 28% 7 14% 1 10% Estimated PLF>Actual PLF 65 72% 43 86% 9 90% -10% ≤ PLFRV ≤ 10% 42 47% 12 24% 4 40% PLFRV < -10% 4 4% 1 2% 0 0 PLFRV > 10% 44 49% 37 74% 6 60%
Tab.8. Comparison of Estimated PLF and Actual PLF, and Relative Variation of PLF in China, India and other countries From figure 13, it can be seen that the Estimated PLF of the projects hosted in China range from 19% to 34%. 78 projects, accounting for 87% in this group, have Estimated PLF ranging from 20% to 30%. As summarized in table 7, 28% projects have been underestimated, while 72% projects have been overestimated. Further, 4% of projects have relative variation lower than -10%. Figure 15 reveals that the range of Estimated PLF of projects located in India is between 17% and 37%. And there are 39 projects, which account for 78% in this group, with Estimated PLF falling between 20% and 30%. As concluded in table 8, the PLFs of 14% projects were underestimated, while 86% were overestimated. Moreover, 2% of projects have relative variation lower than -10%. As the projects hosted in other countries except China and India are only 10 in this database, it’s very clear to get the general view of it from figure 17. The Estimated PLF varies a lot from 16% to 48%. As the hosting countries in this group come from different continents, the projects in this group have more individual characteristics. Only 1 project has Estimated PLF between 20% and 30%. However, in terms of under/overestimation, 1 project has been underestimated while 9 overestimated. And no project has relative variation of PLF less than -10%.
5. Discussion The results in the previous chapter show that, in general wind CDM projects with CERs issuance increased in number during these years of the first
commitment period. The projects in 2011 were not so many which is reflected in figure 5 as they would only be issued after monitoring of their operation, in other words, as of the establishment of database, the majority of them hadn’t finished the first monitoring period. With the increase in number of the registered wind CDM projects, along with the controversy of the additionality itself, the suspicion of the reliability of wind CDM projects’ additionality criterion came out. Excluding the tariff things which are political and controversial all the time, Plant Load Factor issue is more traceable as the Estimated PLF is stated in PDD clearly except a few ones registered in early year like 2005 or 2006 which are not included for this study, and the actual PLF could be calculated from relevant information publically available in monitoring reports. Both kinds of PLFs are the fundamental factors for this issue. 5.1. Discussion on Underestimation and Overestimation PLF is a complex trait, determined and affected by the technological characteristics of the wind turbines, and wind resources such as wind speed and wind direction in project taken location. Thus, the prediction beforehand can’t be precise. From this study, most projects have Estimated PLF falling between 20% and 30%. And on average, the Estimated PLF in small-scale group is lower than that in large-scale group. Overall, from this study, PLFs of 22% of projects have been underestimated at the design stage, while
10%15%20%25%30%35%40%45%50%
Estimated PLF Actual PLF-30%-20%-10%
0%10%20%30%40%50%60%
Relevant Variation of PLF
18
the PLFs of 78% of projects have been overestimated. Even the projects with underestimated PLF are the minority, 22% of projects are still a big amount. From this point, it is reasonable that people have observed some Wind CDM projects had underestimated PLF, further speculated that some project developers might deliberately lower the PLF at the designing stage in order to make the project less profitable in order to meet the additionality criterion under CDM. Considering the subdivision of projects on the basis of scale, it can be seen that underestimation rate of small-scale projects is lower than that of large-scale projects, 13% and 25% respectively, which are both minorities in each group though. For projects hosted in China, India and all other countries, 28%, 14% and 10% of projects in each group respectively were underestimated. In each group, the underestimated projects belong to the minorities. Projects in China have a higher underestimation rate compared with that of both other groups. From this perspective, along with that China has the largest share of wind CDM projects, among other reasons; it is understandable that PLF/additionality issue has been raised at some extent. 5.2. Discussion on Relative Variation of PLFs As a predicted PLF can’t be exactly the same as that in operation, the estimated PLF is either lower or higher than actual PLFs. In other words, the PLF is either under or over estimated beforehand. Therefore, it is unwarrantable to judge if a project meets additionality criterion only depending on the under/over estimation of PLF in terms of PLF issue. This, however, is actually the judgment fundamentally made by many people. It is thus vital to know the magnitude of the variation between both PLFs of a project. In this study, the magnitude of that variation is defined as relative variation of PLFs, and in line with sensitivity analysis, the range of -10% and +10% is supposed to be acceptable. In this study, the highest relative variation is 49%, while the lowest is -19%. 39% of all projects in this study have relative varation of PLFs falling in the range of plus and minus 10%, hereby, the Estimated PLFs of those projects are supposed to be generally unquestionable. Besides, as the overestimation of PLF doesn’t matter in terms of additionality issue, if the relative variation is more than 10%, where 58% of projects are in this case, the estimated PLF is regarded inaccurate, yet not affecting the additionality criterion. Except those two types, there are only 3% of projects left, with relative
variation of PLFs lower than -10%. These projects, rather than the projects with underestimated PLFs which account for 22% of all, should be the origin of suspicions regarding additionality issue. As the proportion is small, it can’t be a powerful argument regarding deliberately underestimating PLFs in wind CDM projects to underestimate the output power in order to make it less economically attractive, further, to meet the additionality criterion. Therefore, generally, there is no strong evidence showing the CDM’s additionality feature being affected, in turn, the environmental integrity being affected in wind CDM projects (refer to 2.2.4), In small-scale and large-scale projects, 23% and 44% of each group respectively have acceptable PLFs estimation with relevant variation between plus-minus 10%. Besides, 3% and 4%, both small proportions more or less the same as that of all projects, of projects in each group respectively, have underestimated PLF with magnitude of less than -10%. Hereby, it can be seen that the PLF issue is not particularly notable either in small-scale projects or large-scale projects. As divided in accordance with hosting countries, 47%, 24% and 40% of projects hosted in China, India, and other countries respectively have acceptable PLF relative variation. Moreover, very few projects in each group, have underestimated PLF with magnitude of less than -10%. Therefore, it is obvious that the PLF issue is not particularly remarkable in any country.
6. Conclusion From the study several conclusions came out. At first, in terms of the physical characteristics, most wind CDM projects have Estimated PLFs between 20% and 30%, and PLF of a small-scale project is less than that of a large-scale project on average. Secondly, the minority of wind CDM projects has lower Estimated PLF than Actual PLF. Thirdly, there should be no concerns on the estimation of the PLF value of the registered CDM projects, regardless of scales, or hosting countries, from the additionality point of view. Further, since the additionality feature has been ensured, the environmental integrity is also ensured for Wind CDM projects.
7. Acknowledgement My hearty gratitude goes to EU, who fully funded my master study in Europe. And I’m very privileged to prepare part of this study with UNFCCC, where colleagues shared their insights with me both personally and professionally,
19
particularly, Maxim, Roy and Pedro who provided innovative suggestions when plenty of uncertainties came out in the process of database establishment and data elaboration. I also feel very thankful to my thesis supervisor, Eva, who was always supportive, and my thesis evaluator, Lars, who provided critical suggestions so that the thesis could be more integrated. Last but not least, my utmost love and thanks go to families and friends, who are always there, backing me up to go through all the ups and downs.
8. References Carbon Market Watch, Additionality and Baselines, 2008, Assessed at <http://carbonmarketwatch.org/category/additionality-and-baselines/> China Org, UN COP15 Copenhagen Climate Change Conference, Review on Chinese wind power projects, 2009, Assessed at < http://www.china.org.cn/environment/Copenhagen/2009-12/10/content_19040396.htm > Gillenwater, M, What is Additionality: A long standing problem, January 2012, Greenhouse Gas Management Institute, Princeton University, Assessed at: < http://ghginstitute.org/wp-content/uploads/content/GHGMI/AdditionalityPaper_Part-1(ver3)FINAL.pdf > IETA (International Emission Trading Association), Press release, Blow Right off Course? CDM Executive Board Turns Against Renewable Energy Development, 2009, Assessed at < http://www.ieta.org/index.php?option=com_content&view=article&id=117:blown-right-off-course?-cdm-executive-board-turns-against-renewable-energy-development&catid=21:archived-press-releases&Itemid=107 > Muller B., Additionality in Clean Development Mechanism - Why and What, March 2009, Oxford Institute for Energy Studies EV 4, assessed at: < http://www.oxfordclimatepolicy.org/publications/documents/EV44.pdf > Pechak O., Mavrotas G., Diakoulaki D., Investigating the Role of the Clean Development Mechanism within the Global Green Energy Market: The Case of Wind Energy, 2010, IEEE. Schneider L., Assessing the additionality of CDM projects: practical experiences and lessons learned, 2011, Climate Policy. Shreck C., The Concept of Additionality under the UNFCCC and the Kyoto Protocol - Implications for
Environmental Integrity and Equity, 2010, University College London. UNEP Riso Center, CDM Pipeline, The distribution of the project among the project types, 2012, Assessed at < http://www.cdmpipeline.org/cdm-projects-type.htm > UNFCCC, CDM, CDM Benefits, 2012, Assessed at <http://cdm.unfccc.int/about/dev_ben/index.html> UNFCCC, CDM, CDM Executive Board 63rd Meeting, 2012, Assessed at < https://cdm.unfccc.int/Meetings/MeetingInfo/DB/RCFV7EBNTD03U54/view> UNFCCC, CDM, CDM Project Cycle Search webpage, assessed at: <http://cdm.unfccc.int/Projects/projsearch.html> UNFCCC, CDM, Executive Board of Clean Development Mechanism 51st Meeting Report, 2009, Assessed at <http://cdm.unfccc.int/EB/051/eb51rep.pdf> UNFCCC, CDM, Project Design Document of Project 1255: San Cristobal Wind Power Project in Ecuador, assessed at: < http://cdm.unfccc.int/Projects/DB/SGS-UKL1185291192.39/view > UNFCCC, CDM, Project Design Document of Project 2315: Amayo 40MW Wind Power Project – Nicaragua, Assessed at <http://cdm.unfccc.int/filestorage/j/z/QK078TFCAN9DZHX6RSPYJ5L2B4VI1O.pdf/eb72_meeting%20report.pdf?t=eE98bWp5NWFwfDDoZgcNlnA6E8J77TOtnCRF> UNFCCC, CDM, Term of Reference of the Support Structure of the CDM Executive Board (Version 03.1), 2012, Assessed at : <https://cdm.unfccc.int/Reference/Procedures/panels_proc02.pdf> UNFCCC, CDM, Term of Reference for Registration and Issuance Team (08 Version), 2012, Assessed at: <http://cdm.unfccc.int/Reference/Procedures/reg_proc02.pdf> UNFCCC, Kyoto Protocol to United Nations Convention to Climate Change, 1998, Assessed at <http://unfccc.int/resource/docs/convkp/kpeng.pdf > UNFCCC, CDM, What is CDM? Assessed at: <http://cdm.unfccc.int/about/index.html>

20
Wind Energy Center, Wind Power: Capacity Factor, Intermittency, and what happens when the wind doesn’t blow? 2009, University of Massachusetts Amherst World Bank, 10 Years of Experience in Carbon Finance: Insights from working with the Kyoto Mechanisms, 2010, Assessed at :< http://siteresources.worldbank.org/INTCARBONFI
NANCE/Resources/10_Years_of_Experience_in_CF_August_2010.pdf>
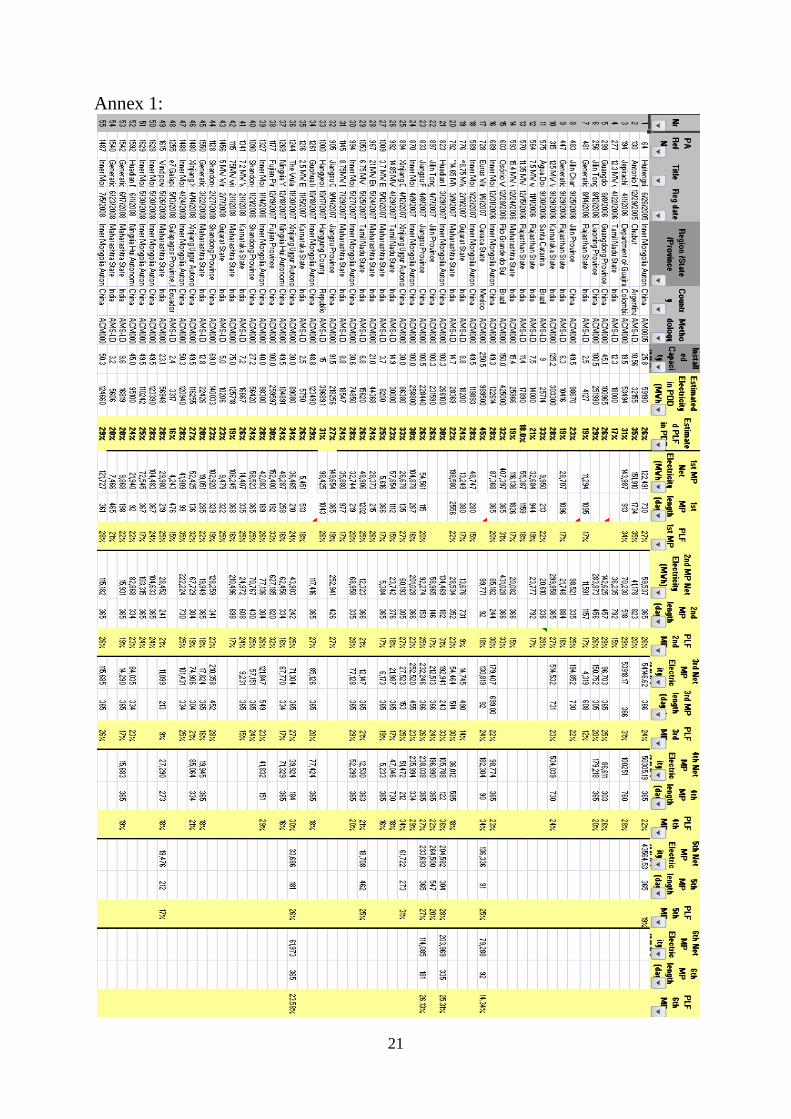
21
Annex 1:
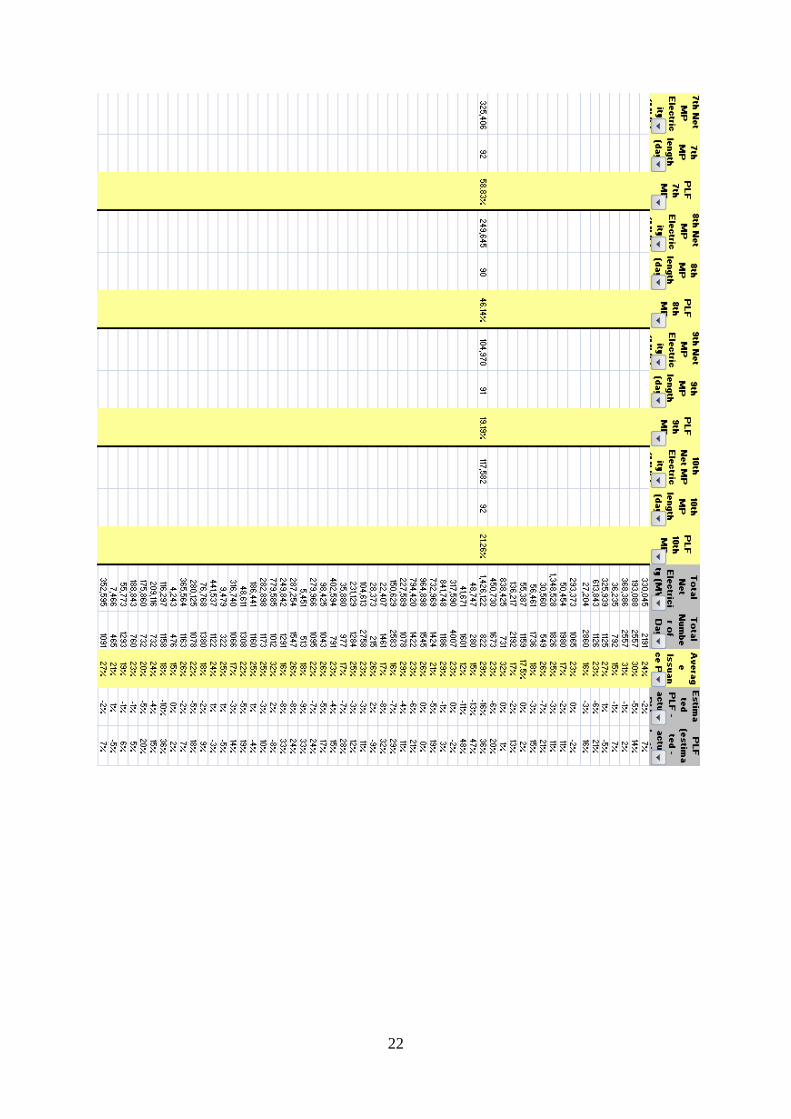
22
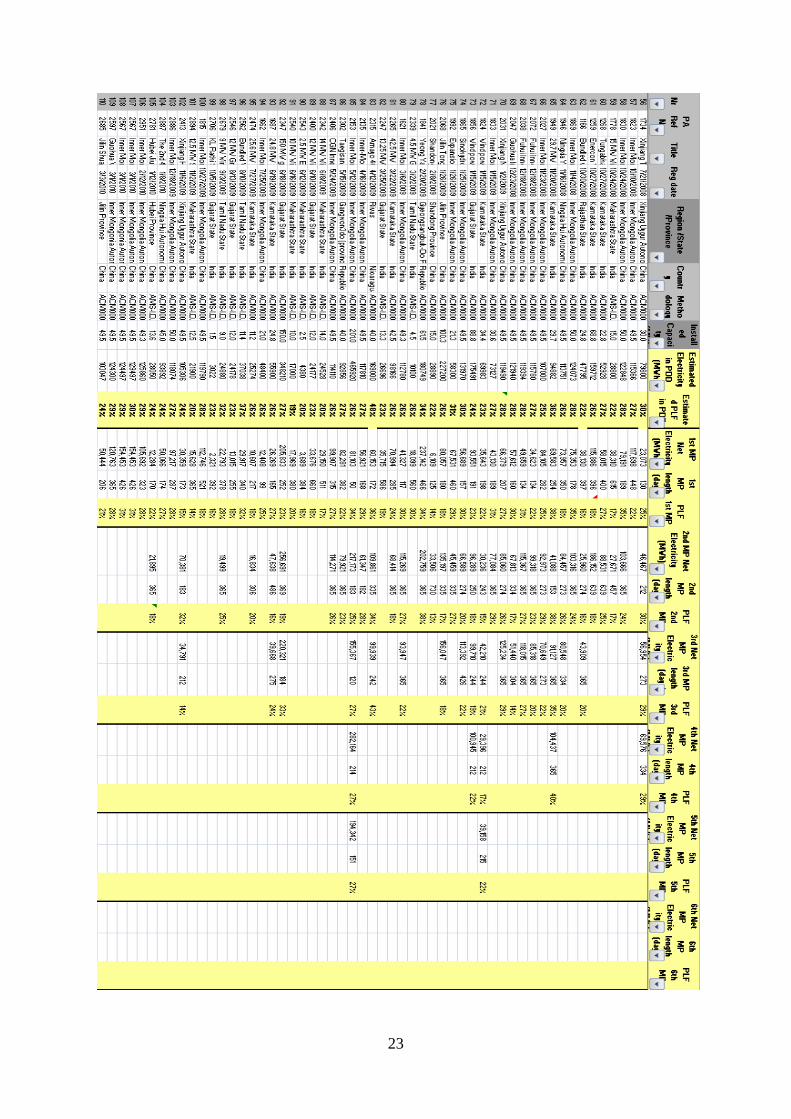
23
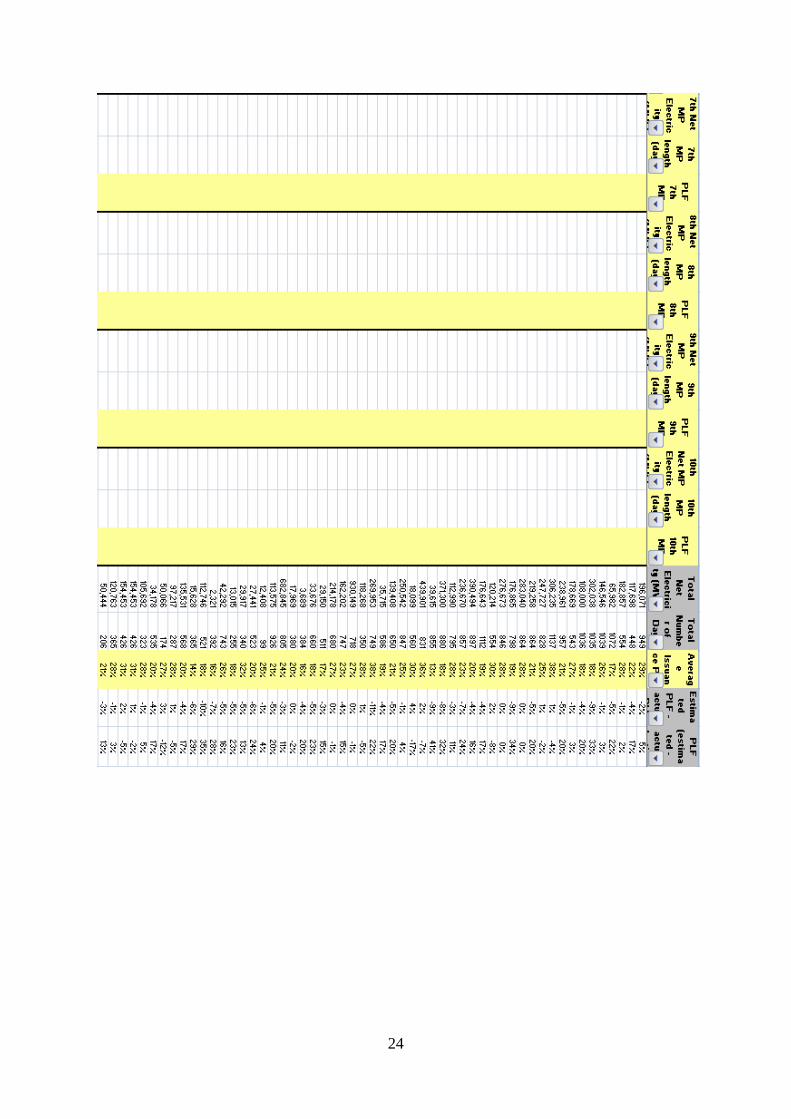
24
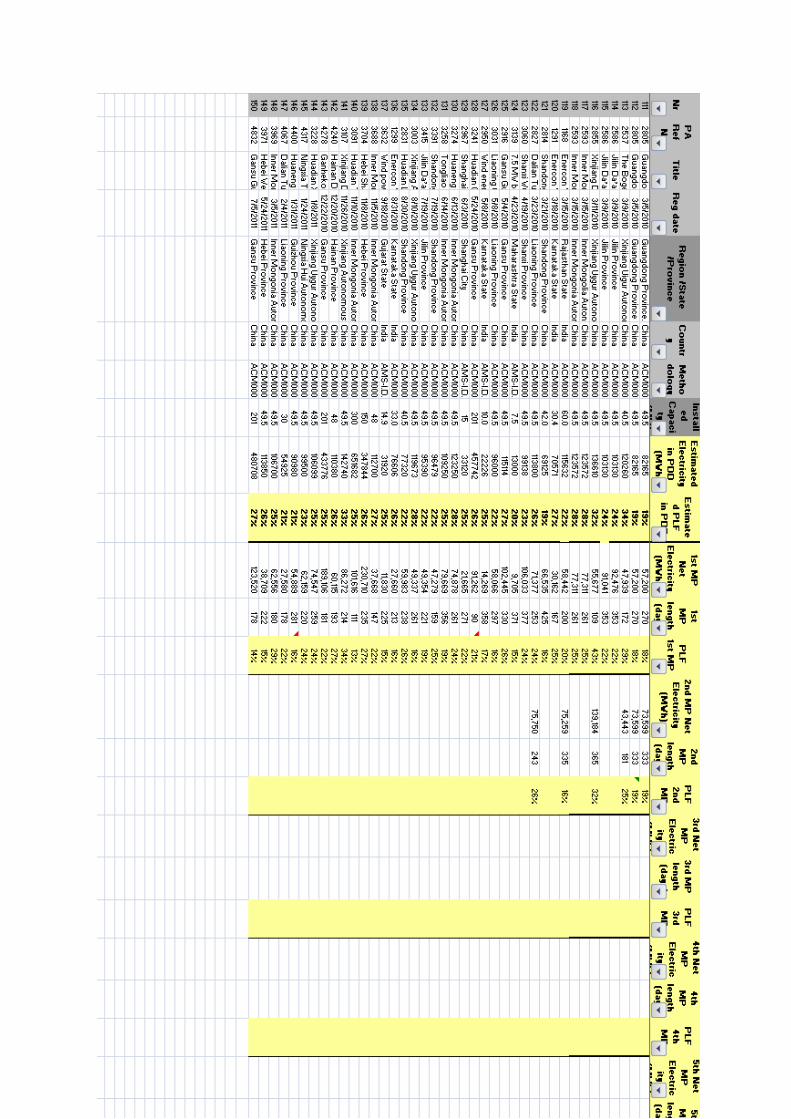
25
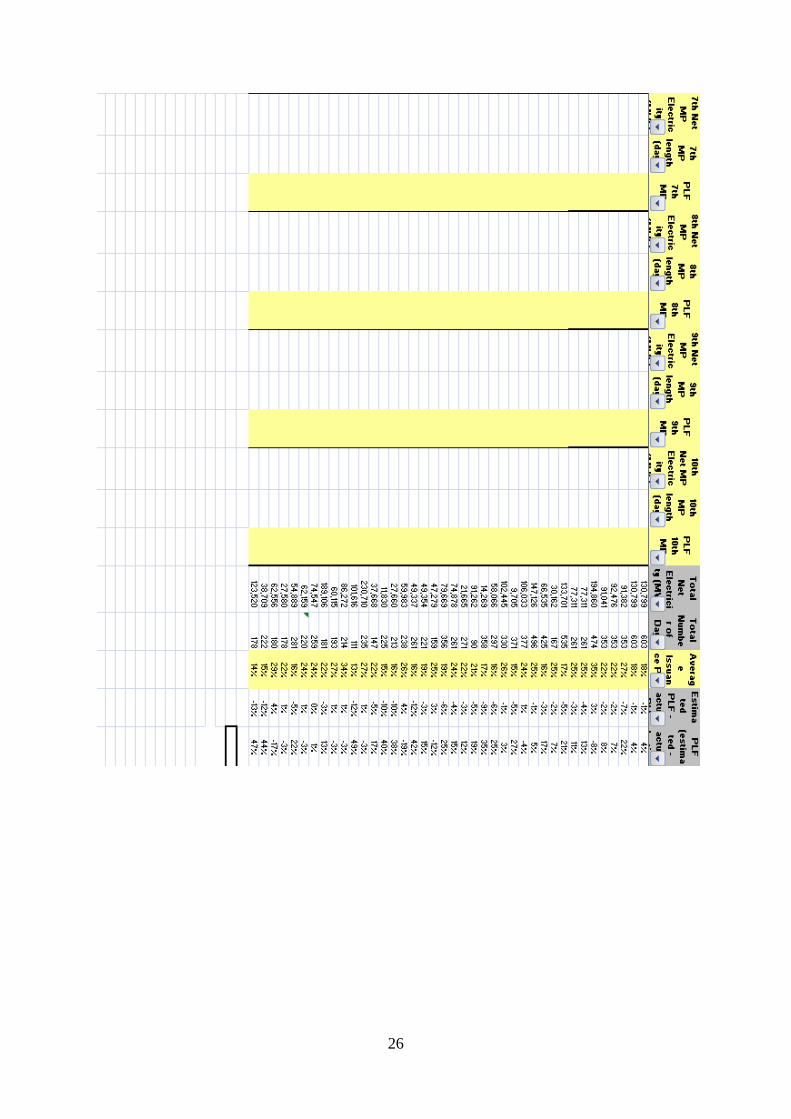
26