Embed Size (px)
Citation preview

W E S T E R N E L E C T R I C I T Y C O O R D I N A T I N G C OU N C I L
Study Results
February 10, 2015
2
W E S T E R N E L E C T R I C I T Y C O O R D I N A T I N G C OU N C I L
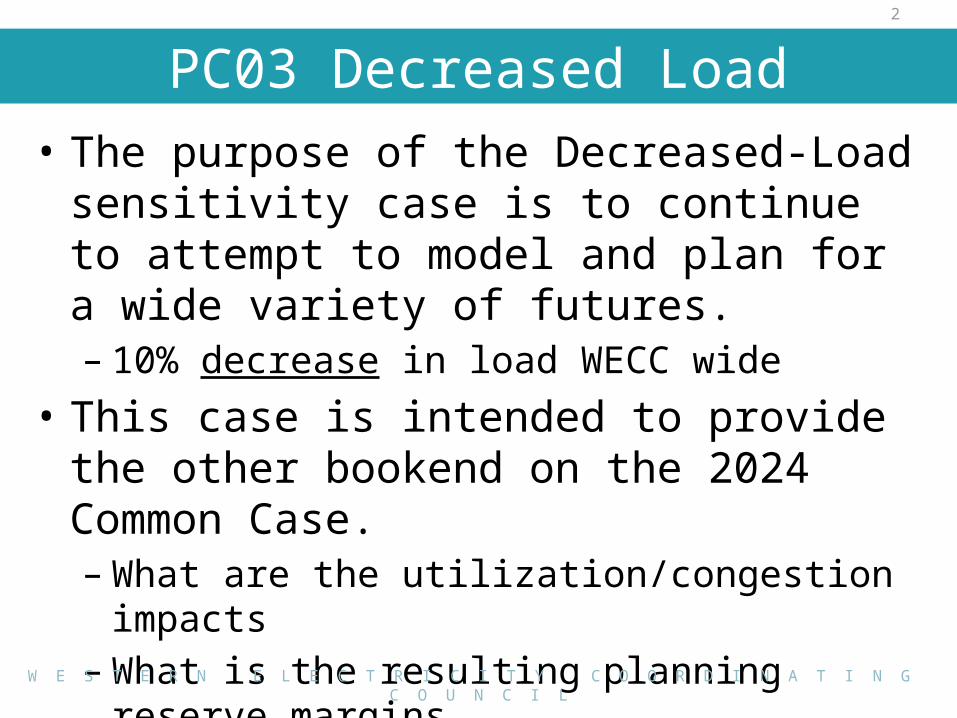
PC03 Decreased Load• The purpose of the Decreased-Load sensitivity
case is to continue to attempt to model and plan for a wide variety of futures. – 10% decrease in load WECC wide
• This case is intended to provide the other bookend on the 2024 Common Case.– What are the utilization/congestion impacts– What is the resulting planning reserve margins
3
W E S T E R N E L E C T R I C I T Y C O O R D I N A T I N G C OU N C I L
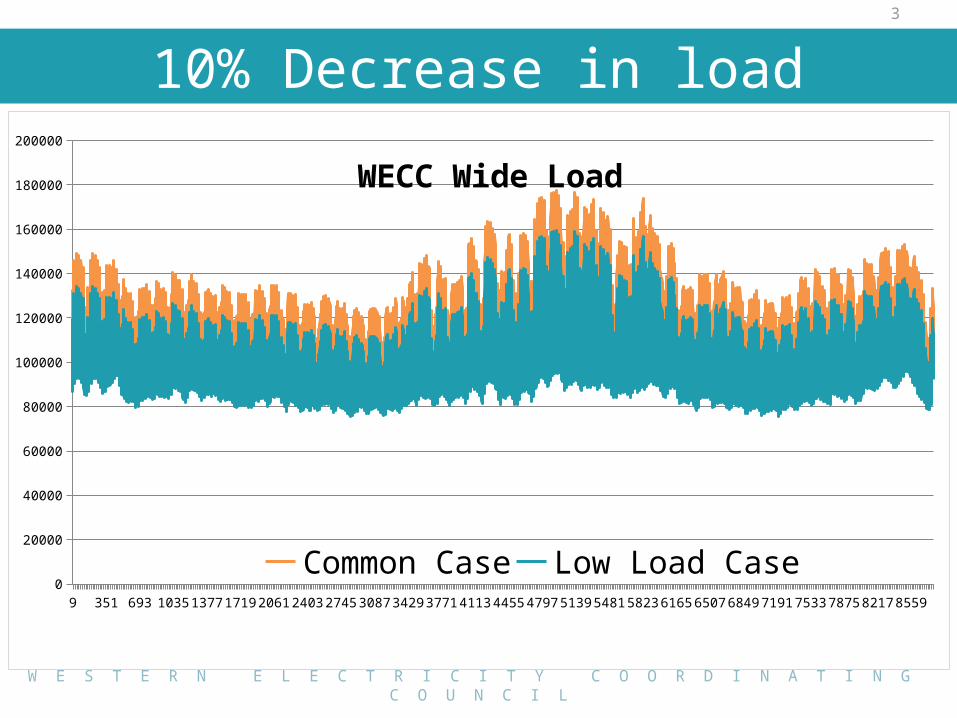
10% Decrease in load
9 297 585 873 1161144917372025231326012889317734653753404143294617490551935481576960576345663369217209749777858073836186490
20000
40000
60000
80000
100000
120000
140000
160000
180000
200000
WECC Wide Load
Common Case Low Load Case
4
W E S T E R N E L E C T R I C I T Y C O O R D I N A T I N G C OU N C I L
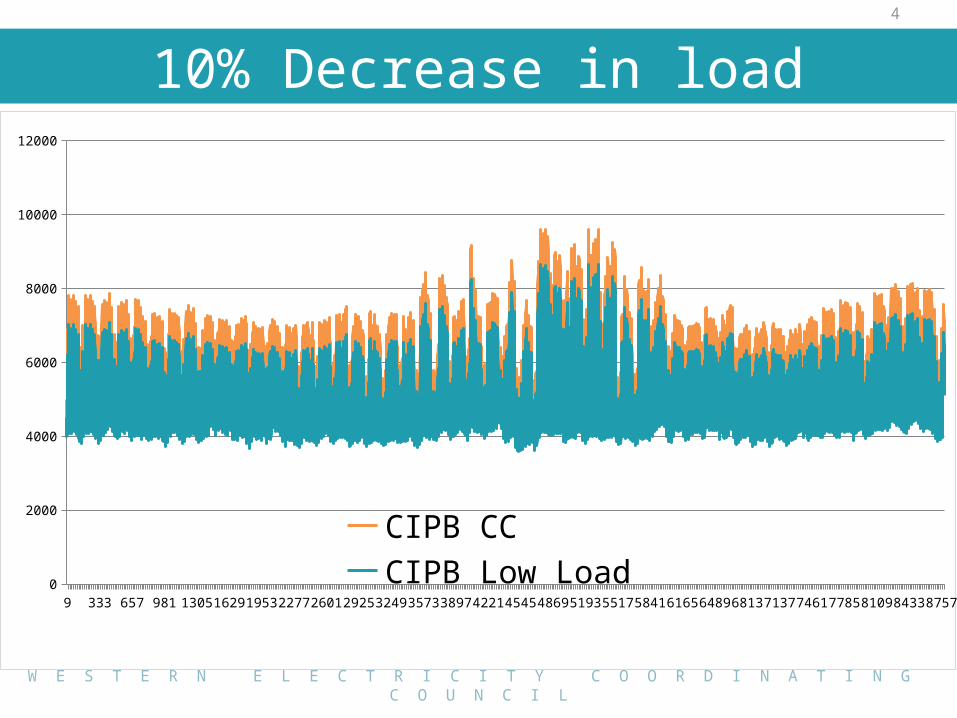
10% Decrease in load
9 297 585 873 1161144917372025231326012889317734653753404143294617490551935481576960576345663369217209749777858073836186490
2000
4000
6000
8000
10000
12000
CIPB CC CIPB Low Load
5
W E S T E R N E L E C T R I C I T Y C O O R D I N A T I N G C OU N C I L
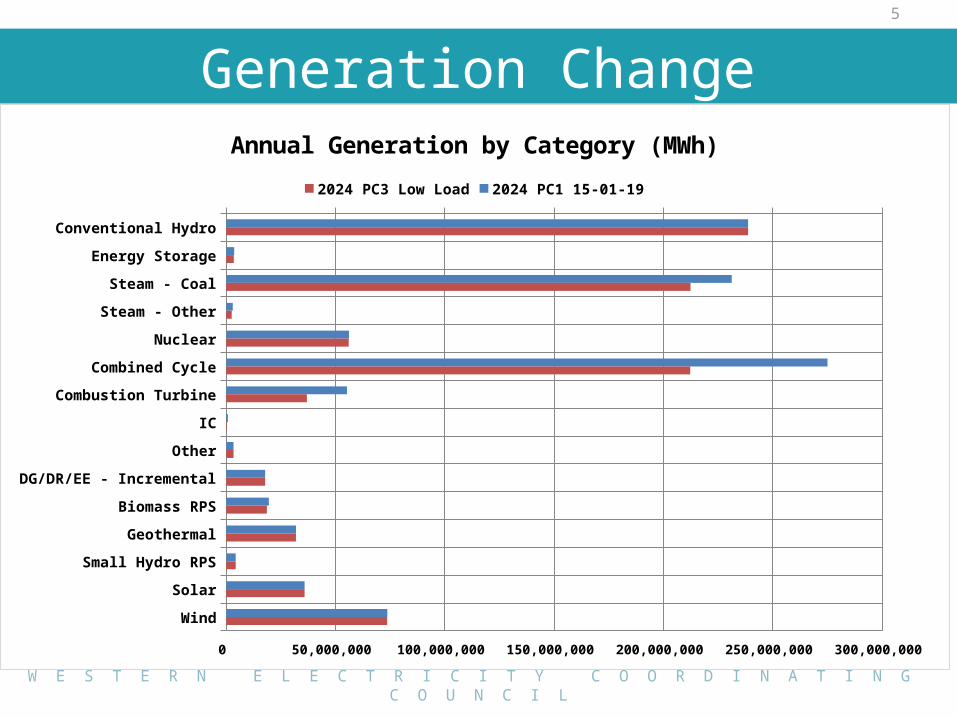
Generation Change
Conventional Hydro
Energy Storage
Steam - Coal
Steam - Other
Nuclear
Combined Cycle
Combustion Turbine
IC
Other
DG/DR/EE - Incremental
Biomass RPS
Geothermal
Small Hydro RPS
Solar
Wind
0 50,000,000 100,000,000 150,000,000 200,000,000 250,000,000 300,000,000
Annual Generation by Category (MWh)2024 PC3 Low Load 2024 PC1 15-01-19
6
W E S T E R N E L E C T R I C I T Y C O O R D I N A T I N G C OU N C I L
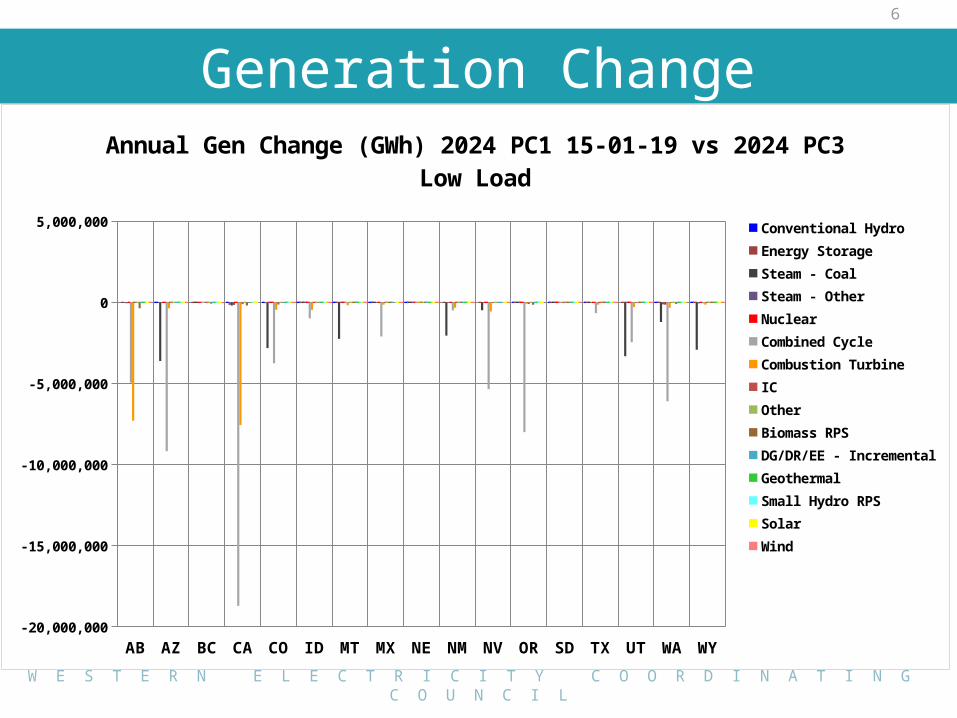
Generation Change
AB AZ BC CA CO ID MT MX NE NM NV OR SD TX UT WA WY-20,000,000
-15,000,000
-10,000,000
-5,000,000
0
5,000,000
Annual Gen Change (GWh) 2024 PC1 15-01-19 vs 2024 PC3 Low Load
Conventional HydroEnergy StorageSteam - CoalSteam - OtherNuclearCombined CycleCombustion TurbineICOtherBiomass RPSDG/DR/EE - IncrementalGeothermalSmall Hydro RPSSolarWind
7
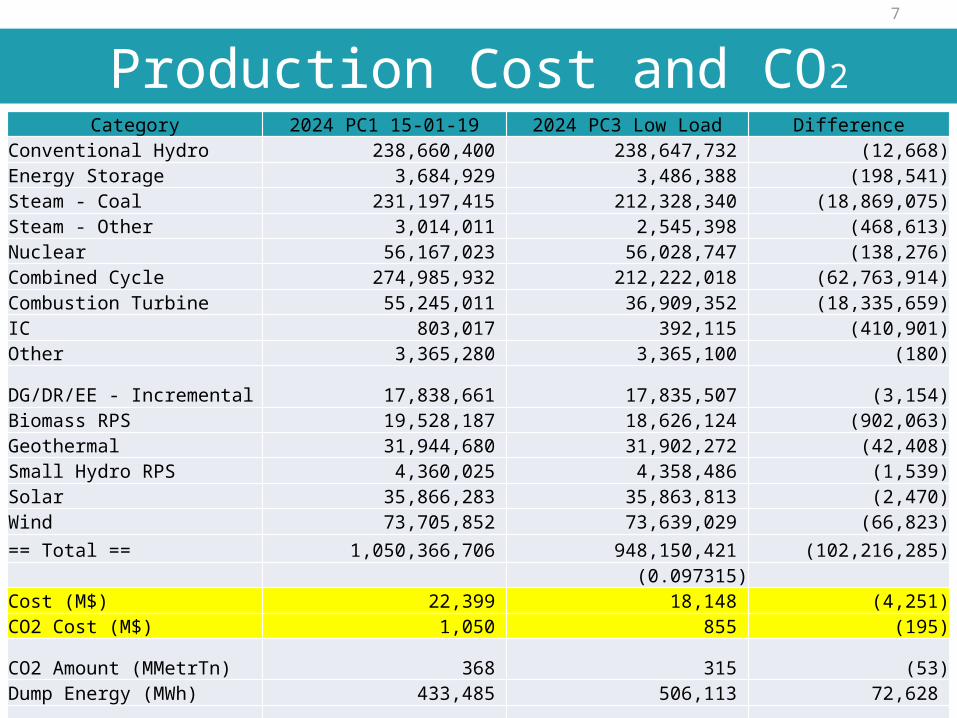
Production Cost and CO2Category 2024 PC1 15-01-19 2024 PC3 Low Load Difference
Conventional Hydro 238,660,400 238,647,732 (12,668)Energy Storage 3,684,929 3,486,388 (198,541)Steam - Coal 231,197,415 212,328,340 (18,869,075)Steam - Other 3,014,011 2,545,398 (468,613)Nuclear 56,167,023 56,028,747 (138,276)Combined Cycle 274,985,932 212,222,018 (62,763,914)Combustion Turbine 55,245,011 36,909,352 (18,335,659)IC 803,017 392,115 (410,901)Other 3,365,280 3,365,100 (180)
DG/DR/EE - Incremental 17,838,661 17,835,507 (3,154)Biomass RPS 19,528,187 18,626,124 (902,063)Geothermal 31,944,680 31,902,272 (42,408)Small Hydro RPS 4,360,025 4,358,486 (1,539)Solar 35,866,283 35,863,813 (2,470)Wind 73,705,852 73,639,029 (66,823)== Total == 1,050,366,706 948,150,421 (102,216,285)
(0.097315)Cost (M$) 22,399 18,148 (4,251)CO2 Cost (M$) 1,050 855 (195)
CO2 Amount (MMetrTn) 368 315 (53)Dump Energy (MWh) 433,485 506,113 72,628
Pumping (PL+PS) (MWh) 15,528,457 15,277,586 (250,871)
8
W E S T E R N E L E C T R I C I T Y C O O R D I N A T I N G C OU N C I L
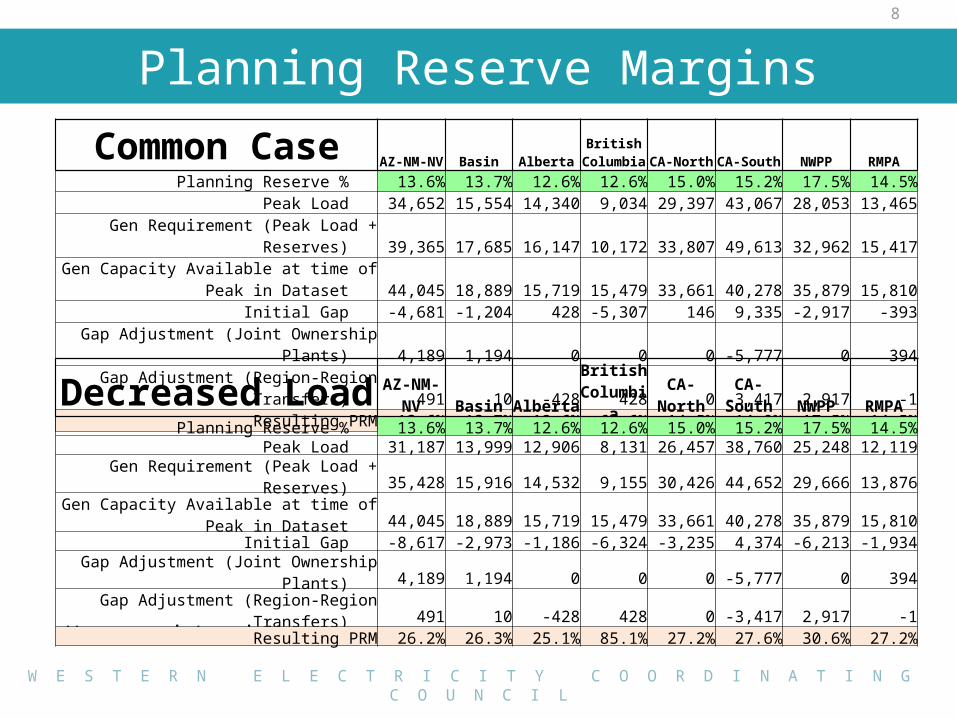
Planning Reserve MarginsCommon Case AZ-NM-NV Basin Alberta
British Columbia CA-North CA-South NWPP RMPA
Planning Reserve % 13.6% 13.7% 12.6% 12.6% 15.0% 15.2% 17.5% 14.5%Peak Load 34,652 15,554 14,340 9,034 29,397 43,067 28,053 13,465
Gen Requirement (Peak Load + Reserves) 39,365 17,685 16,147 10,172 33,807 49,613 32,962 15,417Gen Capacity Available at time of Peak in Dataset
44,045 18,889 15,719 15,479 33,661 40,278 35,879 15,810Initial Gap -4,681 -1,204 428 -5,307 146 9,335 -2,917 -393
Gap Adjustment (Joint Ownership Plants) 4,189 1,194 0 0 0 -5,777 0 394Gap Adjustment (Region-Region Transfers) 491 10 -428 428 0 -3,417 2,917 -1
Resulting PRM 13.6% 13.7% 12.6% 66.6% 14.5% 14.9% 17.5% 14.5%
Unserved Load-None
Decreased Load AZ-NM-NV Basin Alberta
British Columbia CA-North CA-South NWPP RMPA
Planning Reserve % 13.6% 13.7% 12.6% 12.6% 15.0% 15.2% 17.5% 14.5%Peak Load 31,187 13,999 12,906 8,131 26,457 38,760 25,248 12,119
Gen Requirement (Peak Load + Reserves) 35,428 15,916 14,532 9,155 30,426 44,652 29,666 13,876Gen Capacity Available at time of Peak in Dataset
44,045 18,889 15,719 15,479 33,661 40,278 35,879 15,810Initial Gap -8,617 -2,973 -1,186 -6,324 -3,235 4,374 -6,213 -1,934
Gap Adjustment (Joint Ownership Plants) 4,189 1,194 0 0 0 -5,777 0 394Gap Adjustment (Region-Region Transfers) 491 10 -428 428 0 -3,417 2,917 -1
Resulting PRM 26.2% 26.3% 25.1% 85.1% 27.2% 27.6% 30.6% 27.2%
9
W E S T E R N E L E C T R I C I T Y C O O R D I N A T I N G C OU N C I L
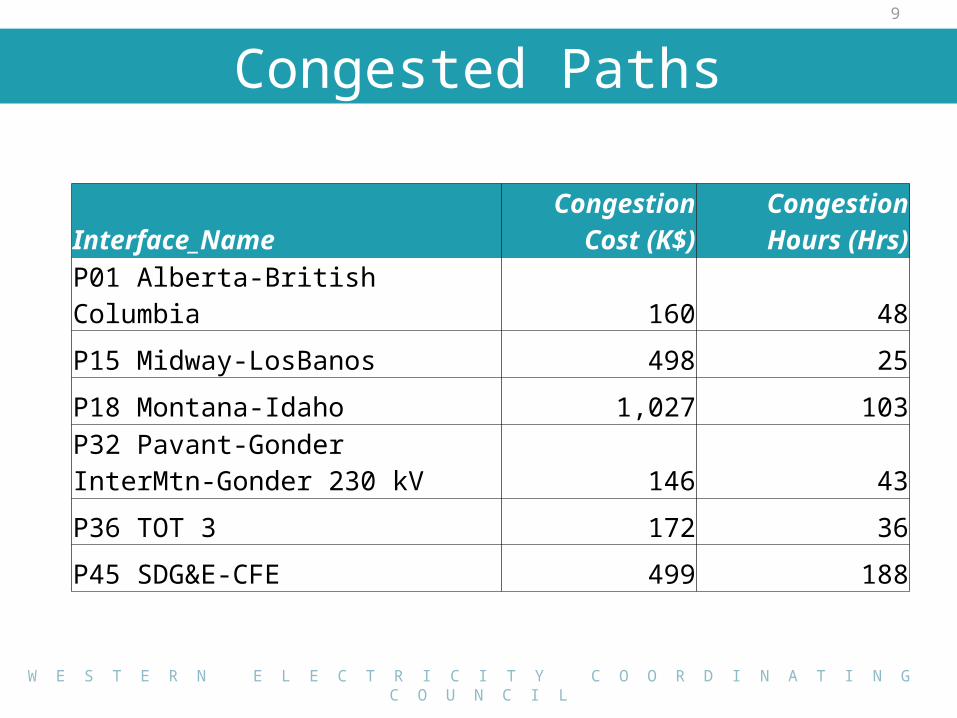
Congested Paths
Interface_NameCongestion
Cost (K$)Congestion Hours (Hrs)
P01 Alberta-British Columbia 160 48
P15 Midway-LosBanos 498 25
P18 Montana-Idaho 1,027 103P32 Pavant-Gonder InterMtn-Gonder 230 kV 146 43
P36 TOT 3 172 36
P45 SDG&E-CFE 499 188
10
W E S T E R N E L E C T R I C I T Y C O O R D I N A T I N G C OU N C I L
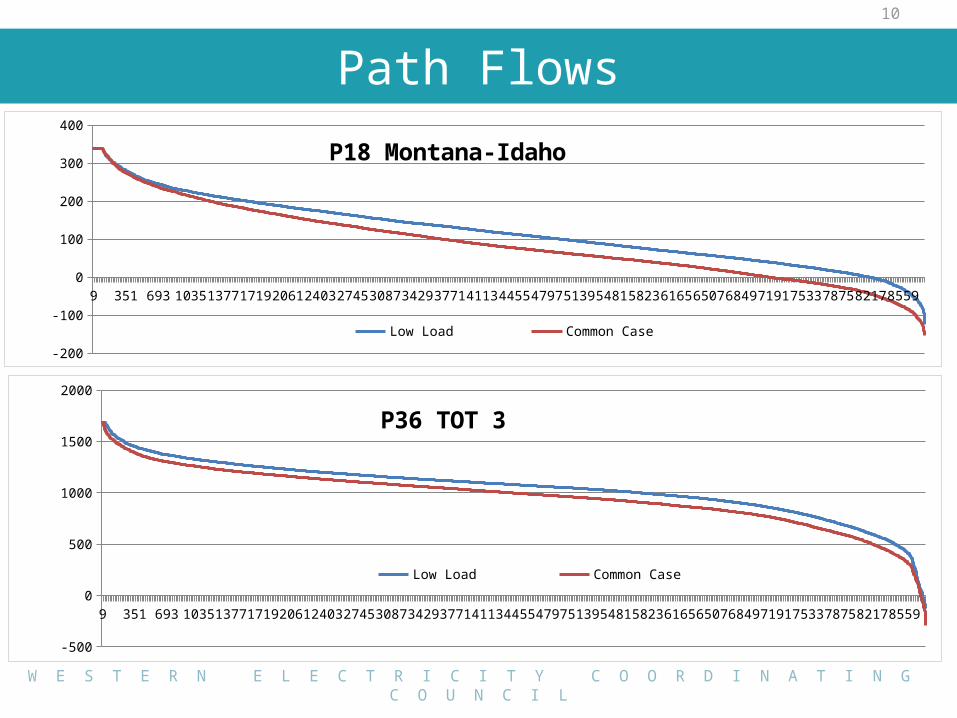
Path Flows
9 315 621 927 1233153918452151245727633069337536813987429345994905521155175823612964356741704773537659796582718577
-200
-100
0
100
200
300
400
P18 Montana-Idaho
Low Load Common Case
9 315 621 927 1233153918452151245727633069337536813987429345994905521155175823612964356741704773537659796582718577
-500
0
500
1000
1500
2000
P36 TOT 3
Low Load Common Case
11
W E S T E R N E L E C T R I C I T Y C O O R D I N A T I N G C OU N C I L
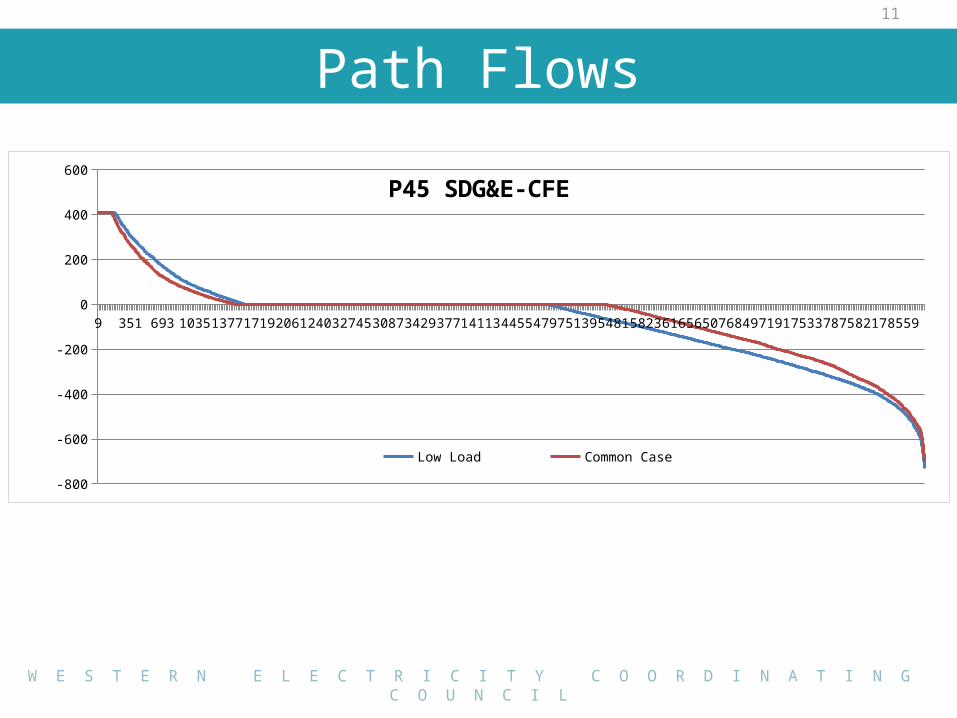
Path Flows
9 315 621 927 1233153918452151245727633069337536813987429345994905521155175823612964356741704773537659796582718577
-800
-600
-400
-200
0
200
400
600P45 SDG&E-CFE
Low Load Common Case
12
W E S T E R N E L E C T R I C I T Y C O O R D I N A T I N G C OU N C I L
ObservationsDecreasing load by 10% across the Western Interconnection has the following effects:
• Gas- and coal-fired generation primarily are ramped back under decreased loads
• Roughly -19% in CO2 cost and production cost across the Western Interconnection
• Congestion is decreased from that of the Common Case

13
W E S T E R N E L E C T R I C I T Y C O O R D I N A T I N G C OU N C I L
Questions