Embed Size (px)
Citation preview

STYLEINNOVATIONSAFETYSECOND QUARTERLY REPORT FOR THE SIX MONTHSENDED JUNE 30, 2014
DOREL INDUSTRIES INC.

Management’s Discussion and Analysis
of Financial Conditions and Results of Operations
For the second quarter and six months ended June 30, 2014 All figures in US dollars
DOREL INDUSTRIES INC. – MANAGEMENT’S DISCUSSION AND ANALYSIS for the second quarter and six months ended June 30, 2014 1
This Interim Management’s Discussion and Analysis of Financial Conditions and Results of Operations (“MD & A”) should be read in conjunction with the unaudited condensed consolidated interim financial statements as at and for the second quarter and six months ended June 30, 2014 and the audited consolidated financial statements and MD & A as at and for the year ended December 30, 2013. This MD & A is based on reported earnings prepared in accordance with International Financial Reporting Standards (“IFRS”), using the US dollar as the reporting currency.
The Company’s condensed consolidated interim financial statements have been prepared using the same accounting policies as described in Note 4 of the Company’s audited consolidated financial statements for the year ended December 30, 2013. The condensed consolidated interim financial statements do not include all of the information required for full annual financial statements. Certain information and footnote disclosures normally included in annual financial statements prepared in accordance with IFRS were omitted or condensed where such information is not considered material to the understanding of the Company’s condensed consolidated interim financial statements. Quarterly reports, the annual report and supplementary information filed with the Canadian securities regulatory authorities can be found on-line at www.sedar.com, as well as on the Company’s corporate Web site at www.dorel.com.
Note that there have been no significant changes with regards to the “Corporate Overview”, “Operating Segments”, “Contractual Obligations”, “Off-Balance Sheet Arrangements”, “Derivative Financial Instruments”, “Critical Accounting Estimates” or “Market Risks and Uncertainties” to those outlined in the Company’s 2013 annual MD & A as filed with Canadian securities regulatory authorities on March 6, 2014. As such, they are not repeated herein. The information in this MD & A is current as of August 6, 2014.
SIGNIFICANT EVENTS IN 2014
On January 16, 2014, the Company announced that it had purchased 100% of the shares of juvenile business Tiny Love, a global, baby products and developmental toy company headquartered in Tel Aviv, Israel, with offices located in the U.S. and China. Tiny Love is recognized as an innovator in the developmental toy category, which comprises products like activity gyms, mobiles, light gear and toys designed specifically for babies and toddlers. The purchase price was $55.8 million. The Company is presently in the process of finalizing the fair value of the assets acquired and the liabilities assumed. In addition, on January 16, 2014, in the Recreational/Leisure segment, the Company acquired certain assets of Sombrio Freewear Company Ltd., a designer and manufacturer of high performance apparel, outwear and streetwear, headquartered in Vancouver, Canada. The purchase price was $0.7 million. On April 3, 2014, Dorel Juvenile Brazil acquired the rights to sell Infanti branded product in the Brazilian market place for a purchase price of approximately $7.0 million. This acquisition expanded the Company’s ownership of the Infanti brand, to which the Company already owns the rights in Chile, Bolivia, Peru, Argentina, Colombia, and most Central American and Caribbean countries. The Company is presently in the process of determining the fair value of the assets acquired.

DOREL INDUSTRIES INC. – MANAGEMENT’S DISCUSSION AND ANALYSIS for the second quarter and six months ended June 30, 2014 2
On April 22, 2014, Caloi issued approximately $45.4 million of non-convertible unsecured debentures in Brazil. The proceeds from the issuance of the debentures were used to replace current existing debts such as bank indebtedness and revolving bank loans. The terms and the principal repayments of these debentures are disclosed in Note 6 of the June 30, 2014 condensed consolidated interim financial statements. On May 12, 2014 the Company announced that it had decided to implement a normal course issuer bid (“2014 NCIB”). Under the 2014 NCIB, the Company is entitled to repurchase for cancellation up to 500,000 Class B Subordinate Voting Shares over a twelve-month period commencing May 14, 2014 and ending May 13, 2015, representing approximately 1.8% of the Company’s issued and outstanding Class B Subordinate Voting Shares. The purchases by the Company will be realized through the facilities of the Toronto Stock Exchange (“TSX”) and will be made at the market price of the Class B Subordinate Voting Shares at the time of the purchase. As at May 5, 2014, there were 28,095,947 Dorel Class B Subordinate Voting Shares issued and outstanding. The Board of Directors considers that the underlying value of the Company may not be reflected in the market price of its Class B Subordinate Voting Shares at certain times during the term of the normal course issuer bid. The Board has therefore concluded that the repurchase of shares at certain market prices may constitute an appropriate use of financial resources and be beneficial to the company and its shareholders. During the six month period prior to the implementation of the 2014 NCIB, the average daily trading volume for the Class B Subordinate Voting Shares of the Company on the TSX was 29,927 shares. Consequently, under the policies of the TSX, the Company has the right to repurchase during any one trading day a maximum of 7,481 Class B Subordinate Voting Shares, representing 25% of the average daily trading volume. In addition, the Company may make, once per calendar week, a block purchase (as such term is defined in the TSX Company Manual) of Class B Subordinate Voting Shares not directly or indirectly owned by insiders of the Company, in accordance with the policies of the TSX. Any purchases made pursuant to the 2014 NCIB will be made in accordance with the requirements of the TSX. The Company will make no purchases of Class B Subordinate Voting Shares other than open market purchases during the period of the 2014 NCIB. To the knowledge of the Company, no director or officer of the Company intends to sell shares of the Company while the 2014 NCIB is in effect. In addition, the Company has entered into an automatic share purchase agreement with CIBC World Markets Inc. in connection with the 2014 NCIB. Under the agreement, CIBC may acquire, at its discretion, Class B Subordinate Voting Shares on the Company’s behalf during certain “black-out” periods, subject to certain parameters as to price and number of shares. The agreement with CIBC is cancellable at any time by the Company. On June 16, 2014, the Company announced that it had signed an agreement to acquire the juvenile business of Hong Kong based Lerado Group, a juvenile product manufacturer in China specializing in the design and manufacture of a wide range of infant and juvenile products. The Lerado Group is a subsidiary of Lerado Group (Holding) Company Limited, a publicly traded company listed on the Hong Kong Stock Exchange. The purchase price has been established at HK$930 million ($120 million), subject to adjustments, and will be due upon closing. The transaction is subject to regulatory review as well as approval by the shareholders of Lerado and it is anticipated to close before year-end. The acquisition is not expected to be accretive in the first year of operations as work will be required to integrate these new facilities into existing operations. During the second quarter ended June 30, 2014, the Company implemented a share appreciation rights plan and a performance share unit plan for senior executives and certain key employees that entitle them to a cash payment. Further information on these plans can be found in Note 9 of the June 30, 2014 condensed consolidated interim financial statements.
DOREL INDUSTRIES INC. – MANAGEMENT’S DISCUSSION AND ANALYSIS for the second quarter and six months ended June 30, 2014 3
RESULTS OF OPERATIONS
(All tabular figures are in thousands except per share amounts)
Overview
For the second quarter of 2014, revenue increased by $55.4 million, or 9.2%, to $655.8 million. This compares to $600.4 million posted a year ago. The organic revenue increase, removing the impact of foreign exchange rate variations and new business acquisitions was approximately 4%. Pre-tax earnings increased by 13.5% to $19.0 million from $16.8 million in 2013. Net income for the quarter was $15.2 million, an increase of 14.9% from the $13.2 million recorded in 2013. On a diluted earnings-per-share (“EPS”) basis, this equates to $0.47 for the second quarter of 2014 compared to $0.41 in 2013. For the six months ended June 30 2014, revenue increased by $108.9 million, or 9.1%, to $1,303.5 million. This compares to $1,194.6 million posted a year ago. The organic revenue increase, removing the impact of foreign exchange rate variations and new business acquisitions was approximately 8%. Pre-tax earnings increased by 17.8% to $48.9 million from $41.5 million in 2013. Net income for the six months was $40.0 million, an increase of 12.5% from the $35.5 million recorded in 2013. On a diluted EPS basis, this equates to $1.24 for the six months of 2014 compared to $1.11 in 2013. The impact of Caloi decreased Dorel’s earnings by US$10.3 million net of tax for six months ended June 30, 2014 which is mainly comprised of the Caloi $0.8 million loss from operations at the segment level, cash interest costs and $6.0 million of non-cash charges such as accretion interests and unrealized foreign exchange losses on put option liabilities. In the second quarter, gross profit increased by 40 basis points to 23.8% from 23.4% in the prior year. The gross profit increase was in the Recreational / Leisure and Juvenile segments, partially offset by a decrease in the Home Furnishings segment. Year-to-date, gross profit increased by 10 basis points to 23.9% from 23.8% in the previous year. The gross profit increase was in the Recreational / Leisure segment, partially offset by a decrease in the Home Furnishing segment and remained stable in Juvenile. For the second quarter, the Company’s selling expenses decreased by $0.4 million, or 0.7% compared to the prior year. Year-to-date, selling expenses have increased by $0.9 million, or 0.8%. General and administrative costs increased by $10.5 million or 22.8% in the second quarter versus the second quarter of 2013. Year-to-date general and administrative expenses have increased by $8.5 million or 8.7%. The increase was in all segments and was mainly due to the acquisition of Caloi and Tiny Love in both the quarter and year-to-date periods. Included in general and administrative costs is an amount of $1.0 million for the second quarter and $2.7 million for the year-to-date, related to unrealized foreign exchange losses on the put option liabilities. This compares to an unrealized foreign exchange gain in 2013 of $2.2 million for the second quarter and $2.0 million for the year-to-date. Excluding these unrealized foreign exchange amounts and the impact of the acquired companies, Caloi and Tiny Love, general and administrative expenses would have shown an increase of $2.9 million for the second quarter and a decrease of $4.6 million for the year-to-date when compared to the prior year, which would represent 8.2% of revenue compared with 8.0% in 2013 for the second quarters and 7.7% of revenue compared with 8.4% in 2013 for the year-to-date. Note that these unrealized foreign exchange gains and losses on put option liabilities are not allocated to the Company’s segments and are included with the corporate expenses within the segmented figures presented in Note 13 to the Company’s condensed consolidated interim financial statements. The Company’s year-to-date finance expenses increased by $9.4 million to $19.5 million from $10.1 million in 2013. The increase is due to higher borrowings as a result of the acquisitions. The interest rate on the Company’s long-term borrowings and revolving line of credit for the first six months of 2014 was 4.6% compared with 3.7% in 2013. Included in finance expenses was $3.8 million related to interest recorded on the Company’s put option liabilities related to certain of its business acquisitions. This compares to $1.2 million for the same period of 2013. As a multi-national company, Dorel is resident in numerous countries and therefore subject to different tax rates in those various jurisdictions and by the interpretation and application of tax laws, as well as the application of income tax treaties between various countries. As such, significant tax rate variations can occur from year to year and between quarters within a given year. The 2014 second quarter tax rate was 20.2% and year-to-date was 18.1%. This compares to 21.1% for the quarter and 14.3% year-to-date in 2013. The main causes of the variations year-over-year are changes in the jurisdictions in which the Company generated its income year-over-year and the increase in the fair value

DOREL INDUSTRIES INC. – MANAGEMENT’S DISCUSSION AND ANALYSIS for the second quarter and six months ended June 30, 2014 4
adjustments related to the put option liabilities which are non-deductible for tax purposes. The Company has stated that for the full year it expects its annual tax rate to be between 15% and 20%. However, variations in earnings across quarters mean that this rate may vary significantly from quarter to quarter. The principal changes in net income from 2013 to 2014 are summarized as follows:
Second Year-
Quarter to-DateJuvenile increase $ 352 $ 2,000
Recreational/Leisure (excluding restructuring costs) increase 11,284 18,505
Home Furnishings decrease (1,947) (1,825)
Restructuring costs (Increase) decrease 247 (204)
Total increase in operating profit 9,936 18,476
Increase in finance expenses (4,646) (9,443)
Increase in income tax expense (296) (2,934)
Increase in corporate expenses (3,018) (1,639)
Total increase in net income $ 1,976 $ 4,460
The causes of these variations versus last year are discussed in more detail below.
Selected Financial Information
The tables below show selected financial information for the eight most recently completed quarters.
$ $ $ $
Jun. 30, 2014 Mar. 31, 2014 Dec. 30, 2013 Sep. 30, 2013
Total revenue $655,831 $647,701 $633,534 $607,298
Net income $15,200 $24,800 $11,024 $11,105
Earnings per share:
Basic $0.47 $0.78 $0.35 $0.35
Diluted $0.47 $0.77 $0.34 $0.34
Amount of restructuring costs after tax included in the
quarter based on diluted earnings per share $ 0.03 $ 0.01 $ 0.25 $ -
$ $ $ $
Jun. 30, 2013 Mar. 31, 2013 Dec. 30, 2012 Sep. 30, 2012
Total revenue $600,449 $594,168 $622,604 $613,295
Net income $13,224 $22,316 $29,119 $19,986
Earnings per share:
Basic $0.41 $0.70 $0.92 $0.64
Diluted $0.41 $0.70 $0.91 $0.63
Amount of restructuring costs after tax included in the
quarter based on diluted earnings per share $ 0.04 $ - $ - $ -
Operating Results for the Quarters Ended
Operating Results for the Quarters Ended
Segmented Results
Segmented figures are presented in Note 13 to the Company’s condensed consolidated interim financial statements. Further industry segment detail is presented below:

DOREL INDUSTRIES INC. – MANAGEMENT’S DISCUSSION AND ANALYSIS for the second quarter and six months ended June 30, 2014 5
Juvenile
Results as a percentage of total revenue
2014 2013 2014 2013
Total revenue 100.0% 100.0% 100.0% 100.0%
Cost of sales 71.0% 71.8% 71.3% 71.3%
Gross profit 29.0% 28.2% 28.7% 28.7%
Selling expenses 11.5% 11.2% 11.1% 10.9%
General and administrative expenses 9.4% 8.4% 8.7% 9.0%
Research and development expenses 1.7% 2.1% 2.0% 2.0%
Operating profit 6.4% 6.5% 6.9% 6.8%
Second Quarters ended June 30 Six months ended June 30
Juvenile segment revenue in the second quarter of 2014 was $251.3 million, compared to $243.4 million in 2013, an increase of $7.9 million or 3.2%. On a year-to-date basis, Juvenile segment revenue was $520.6 million versus $498.6 million a year ago, an increase of 4.4%. Organic revenue, after removing the effect of acquisitions and the impact of varying exchange rates year-over-year, was flat in the quarter and increased by approximately 1% year-to-date. While the organic revenue growth for the segment overall is negligible, Latin American organic growth was the exception, with an increase of approximately 10% for the quarter and 16% year-to-date. However, upon conversion to US dollar, this growth was mostly offset by a less favorable rate of exchange. Gross profit increased by 80 basis points to 29.0% in the second quarter of 2014 compared to 28.2% in 2013. Year-to-date gross profit was stable at 28.7% in both 2014 and 2013. Operating profit for the quarter was $16.2 million, an increase of 2.2% from $15.8 million in 2013. The main driver of the improvement in operating profit was Dorel Juvenile Europe due to improved gross margins and operating costs that were well contained. Furthermore, the conversion of European operating profit was aided by a stronger rate of conversion to US dollar. Conversely, operating profits in Latin America, Canada and Australia were impacted negatively due to a weakness in foreign exchange rates versus the US dollar. Operating profit for the first six months of 2014 was $35.7 million, compared with $33.7 million in 2013, a growth of 5.9% with Dorel Juvenile USA and Dorel Juvenile Europe being substantial contributors to the improvement. These increases were partially offset by the challenge in the other markets as described above. For the segment as a whole, selling expenses increased by $1.4 million in the quarter, and have increased $2.9 million year-to-date. The majority of the increases in selling expenses can be attributed to the acquisition in the first quarter of Tiny Love. The conversion of selling expenses in Europe at a higher rate of exchange also contributed to the increase. General and administrative expenses increased by $3.2 million in the quarter and were stable on a year-to-date basis compared to the prior year. Significant variations for both the quarter and year-to-date are mainly attributed to the addition of Tiny Love, timing and conversion to US dollar of costs in Europe and professional fees related to acquisition activity, partly offset by lower product liability costs.

DOREL INDUSTRIES INC. – MANAGEMENT’S DISCUSSION AND ANALYSIS for the second quarter and six months ended June 30, 2014 6
Recreational / Leisure
Results as a percentage of total revenue
2014 2013 2014 2013
Total revenue 100.0% 100.0% 100.0% 100.0%
Cost of sales 76.5% 77.1% 75.7% 76.0%
Gross profit 23.5% 22.9% 24.3% 24.0%
Selling expenses 9.9% 12.7% 9.8% 12.2%
General and administrative expenses 7.3% 7.2% 7.6% 7.6%
Research and development expenses 0.6% 0.7% 0.6% 0.7%
Restructuring costs 0.4% 0.8% 0.3% 0.5%
Operating profit 5.3% 1.5% 6.0% 3.0%
Second Quarters ended June 30 Six months ended June 30
Second quarter 2014 Recreational / Leisure revenue increased by $48.0 million, or 20.2% to $286.2 million compared to last year’s $238.2 million. Revenue for the first six months of 2014 increased by $84.9 million, or 19.2% to $526.6 million compared to $441.7 million in the previous year. Organic revenue which excludes the impact of varying foreign exchange rates and acquisitions, increased by approximately 11% in the quarter and 15% year-to-date. Overseas markets in the independent bike dealer (IBD) channels, particularly Europe and Japan, as well as the sales to the North American mass merchant distribution channels contributed to the quarter and year-to-date organic growth. The increases in both the IBD and the mass merchant distribution channels were driven partly by improved weather conditions when compared to prior year. Recreational / Leisure adjusted operating profit, excluding restructuring costs, for the second quarter, increased by $11.3 million or 200.4% to $16.9 million, compared with $5.6 million in 2013. Year-to-date adjusted operating profit, excluding restructuring costs, increased by $18.5 million or 122.0% to $33.7 million versus the $15.2 million posted in the first half of 2013. For the quarter, excluding restructuring costs included in cost of goods, adjusted gross margin increased by 80 basis points to 23.7% from 22.9% recorded in the second quarter of 2013. Year-to-date, the increase in adjusted gross margin was 40 basis points to 24.4% from 24.0% in the same period of 2013. Less discounting of inventory, and the weakening of the US dollar against its Euro counterpart helped boost the gross margins in the IBD channel in both the quarter and year-to-date periods in 2014. Gross profit in the mass market channel was tempered by lower gross profit marginally below the prior year’s level in both the quarter and year-to-date due mainly to sales mix. For the quarter and year-to-date periods, selling expenses declined 6.7% and 4.6% respectively. Excluding the impact of the Caloi acquisition, selling expenses declined by 15.3% in the quarter and 13.7% year-to-date. The decline in selling expenses is due to significant cost cutting initiatives as part of the restructuring plan put in place in January 2014. General and administrative expenses increased 23.3% and 19.6% for the quarter and year-to-date respectively. Excluding the general and administrative expenses of Caloi, the increase for the quarter and year-to-date periods were 3.4% and 0.3% respectively. Restructuring costs of approximately $1.7 million for the quarter and $2.2 million year-to-date were recorded in 2014, compared with $2.0 million recorded for both the quarter and year-to-date periods of 2013.

DOREL INDUSTRIES INC. – MANAGEMENT’S DISCUSSION AND ANALYSIS for the second quarter and six months ended June 30, 2014 7
Home Furnishings
Results as a percentage of total revenue
2014 2013 2014 2013
Total revenue 100.0% 100.0% 100.0% 100.0%
Cost of sales 86.6% 85.6% 86.8% 86.1%
Gross profit 13.4% 14.4% 13.2% 13.9%
Selling expenses 3.5% 3.4% 3.2% 3.1%
General and administrative expenses 4.7% 4.1% 4.1% 4.1%
Research and development expenses 0.8% 0.8% 0.7% 0.7%
Operating profit 4.4% 6.1% 5.2% 6.0%
Second Quarters ended June 30 Six months ended June 30
Second quarter Home Furnishings revenue were flat compared with the previous year while the year-to-date revenue increased by $2.1 million or 0.8% from $254.3 million in 2013 to $256.4 million in 2014. Sales to the segment’s drop ship vendor program and on-line sales increased both for the quarter and the year-to-date when compared to the previous year. These increases were offset for the quarter and partly offset for the year-to-date by declines in sales to brick-and-mortar stores. Operating profit in the quarter was $5.3 million compared to $7.2 million in the prior year, a decrease of $1.9 million or 27.0%. On a year-to-date basis operating profit decreased to $13.3 million from $15.1 million in 2013, a decline of $1.8 million or 12.0%. For the second quarter of 2014 gross profit was 13.4%, a decrease of 100 basis points from the 14.4% recorded in the comparable period of the prior year. Year-to-date gross profit has declined by 70 basis points to 13.2% in 2014 from 13.9% in 2013. While input costs rose slightly versus last year, particularly in particle board, gross profit deteriorated due to the impact of the higher proportion of sales of lower margin items. Though operating expenses, consisting of selling, general and administrative, and research and development costs, increased slightly, they remain well-contained at 9% and 8% of revenue for the quarter and year-to-date respectively.
LIQUIDITY AND CAPITAL RESOURCES
Statement of Financial Position
Certain of the Company’s working capital ratios are as follows:
Jun. 30, 2014 Jun. 30, 2013 Dec. 30, 2013
Debt* to equity 0.38 0.27 0.32
# of days in receivables 68 66 68
# of days in inventory 111 99 108
# of days in payables 60 54 61
*Debt is defined as bank indebtedness plus long-term debt
As at:
There were no significant changes in the Company’s Statement of Financial Position in the quarter except as discussed below. The increase in the debt to equity ratio compared to year-end is a function of higher borrowing as at the end of the second quarter to finance acquisitions. Inventory as at June 30, 2014 was $593.1 million, an increase of $37.5 million or 6.7% from $555.6 million as at December 30, 2013. The increase is mainly in the Recreational / Leisure segment due in part to the acquisition of Caloi which represented 35% of the total increase. The increase in inventory value also explains the increase in the number of days in inventory compared with the same quarter in 2013 and is consistent compared to the year-end.

DOREL INDUSTRIES INC. – MANAGEMENT’S DISCUSSION AND ANALYSIS for the second quarter and six months ended June 30, 2014 8
As at December 30, 2013, the Company was in breach with one of its covenants. As a result of this breach, the Company reclassified the long-term portion of the related debts to the current portion of long-term debt since as at December 30, 2013, the Company had not obtained from the associated lenders the amendment to its debt agreements for this covenant. During the three months ended March 31, 2014, the Company amended certain financial covenants related to its debt agreements. As of June 30, 2014, Dorel was compliant with all of its borrowing covenant requirements and as a result the related debts are classified as long-term. The Company continuously reviews its cash management and financing strategy to optimize the use of funds and minimize its cost of borrowing.
Statement of Cash Flows
During the first six months of 2014, cash flow provided by operating activities was $16.6 million compared to $44.4 million in 2013. The main reasons for the year-over-year decrease of $27.8 million was due principally to the increase in accounts receivable and inventory, partially offset by the increase in accounts payable compared with the December 30, 2013 statement of financial position. The net change in balances related to non-cash working capital negatively impacted the cash flow provided by operating activities reducing the positive impact of the higher net income. Year-to-date net additions to property, plant and equipment and intangible assets were $27.6 million in 2014. This compares to $28.1 million in 2013. The Company disbursed $9.7 million in the quarter and $19.3 million year-to-date for dividends in 2014 compared with $9.6 million and $19.1 million in the second quarter and year-to-date respectively of 2013. In the first six months of 2014 the Company disbursed 54.6 million related to business acquisitions. Included in year-to-date financing activities is a positive cash flow amount of $6.9 million related to certain stock options being exercised under the Company’s employee stock option plan. Principally as a result of the above, bank indebtedness plus long-term debt less cash and cash equivalents include a combined net increase of $87.3 million for the first half of 2014.
Future Accounting Changes
A number of new standards, interpretations and amendments to existing standards were issued by the International Accounting Standards Board or the International Financial Reporting Interpretations Committee (“IFRIC”) that are mandatory but not yet effective for the three and six months ended June 30, 2014 and have not been applied in preparing these condensed consolidated interim financial statements. The following standards and interpretations have been issued by the IASB and the IFRIC with effective dates in the future that have been determined by management to impact the consolidated financial statements: IFRS 9 – Financial Instruments IFRS 15 – Revenue from Contracts with Customers IFRIC Interpretation 21 – Levies (IFRIC 21) Further information on these modifications can be found in Note 3 of the June 30, 2014 condensed consolidated interim financial statements.
OTHER INFORMATION
The designation, number and amount of each class and series of its shares outstanding as of July 31, 2014 are as follows:
An unlimited number of Class "A" Multiple Voting Shares without nominal or par value, convertible at any time at the option of the holder into Class "B" Subordinate Voting Shares on a one-for-one basis, and;
An unlimited number of Class "B" Subordinate Voting Shares without nominal or par value, convertible into Class "A" Multiple Voting Shares, under certain circumstances, if an offer is made to purchase the Class "A" shares.

DOREL INDUSTRIES INC. – MANAGEMENT’S DISCUSSION AND ANALYSIS for the second quarter and six months ended June 30, 2014 9
Details of the issued and outstanding shares are as follows:
Total
Number $(‘000) Number $(‘000) $(‘000)
4,195,135 $1,771 28,107,805 $197,587 $199,358
Class A Class B
Outstanding stock options, Deferred Share Units, Share Appreciation Rights and Performance Share Units are disclosed in Note 9 to the Company’s condensed consolidated interim financial statements. There were no significant changes to these values in the period between the quarter-end and the date of the preparation of this MD & A.
Disclosure Controls and Procedures and Internal Controls over Financial Reporting
During the quarter ended June 30, 2014 the Company has made no change that has materially affected or is likely to materially affect the Company’s internal control over financial reporting. In accordance with National Instrument 52-109 and with practices accepted by the Autorités des Marchés Financiers, the Company excluded Caloi from its assessment of internal control over financial reporting. Supplemental information about this acquisition is provided in the table below:
Six months ended
June 30, 2014
$
Total Revenue 43,035
Operating Profit(1) (4,257)
As at
June 30, 2014
$
Total current assets 72,459
Total non-current assets 138,077
Total current liabilities 38,508
Total non-current liabilities 101,769
(1) Includes all fair value adjustments related to the put option liabilities but excludes the accretion expense on those put option liabilities which are not presented in the
recreational/leisure segment. These costs are included in the corporate expenses within the segmented income statement in Note 13 to the condensed consolidated interim
financial statements.
Caution Regarding Forward Looking Information
Certain statements included in this MD&A may constitute “forward-looking statements” within the meaning of applicable Canadian securities legislation. Except as may be required by Canadian securities laws, the Company does not undertake any obligation to update or revise any forward-looking statements, whether as a result of new information, future events or otherwise. Forward-looking statements, by their very nature, are subject to numerous risks and uncertainties and are based on several assumptions which give rise to the possibility that actual results could differ materially from the Company’s expectations expressed in or implied by such forward-looking statements and that the objectives, plans, strategic priorities and business outlook may not be achieved. As a result, the Company cannot guarantee that any forward-looking statement will materialize. Forward-looking statements are provided in this MD&A for the purpose of giving information about Management’s current expectations and plans and allowing investors and others to get a better understanding of the Company’s operating environment. However, readers are cautioned that it may not be appropriate to use such forward-looking statements for any other purpose.

DOREL INDUSTRIES INC. – MANAGEMENT’S DISCUSSION AND ANALYSIS for the second quarter and six months ended June 30, 2014 10
Forward-looking statements made in this MD&A are based on a number of assumptions that the Company believed were reasonable on the day it made the forward-looking statements. Factors that could cause actual results to differ materially from the Company’s expectations expressed in or implied by the forward-looking statements include: general economic conditions; changes in product costs and supply channel; foreign currency fluctuations; customer and credit risk including the concentration of revenues with few customers; costs associated with product liability; changes in income tax legislation or the interpretation or application of those rules; the continued ability to develop products and support brand names; changes in the regulatory environment; continued access to capital resources and the related costs of borrowing; changes in assumptions in the valuation of goodwill and other intangible assets and subject to dividends being declared by the Board of Directors, there can be no certainty that Dorel Industries Inc.’s Dividend Policy will be maintained. These and other risk factors that could cause actual results to differ materially from expectations expressed in or implied by the forward-looking statements are discussed in the Company’s annual MD&A and Annual Information Form filed with the applicable Canadian securities regulatory authorities. The risk factors outlined in the previously mentioned documents are specifically incorporated herein by reference. The Company cautions readers that the risks described above are not the only ones that could impact it. Additional risks and uncertainties not currently known to the Company or that the Company currently deems to be immaterial may also have a material adverse effect on the business, financial condition or results of operations. Given these risks and uncertainties, investors should not place undue reliance on forward-looking statements as a prediction of actual results. Except as otherwise indicated, forward-looking statements do not reflect the potential impact of any non-recurring or other unusual items or of any dispositions, mergers, acquisitions, other business combinations or other transactions that may be announced or that may occur after the date hereof. The financial impact of these transactions and non-recurring and other unusual items can be complex and depends on the facts particular to each of them. The Company therefore cannot describe the expected impact in a meaningful way or in the same way the Company presents known risks affecting the business.

DOREL INDUSTRIES INC. – CONDENSED CONSOLIDATED INTERIM FINANCIAL STATEMENTS for the second quarter and six months ended June 30, 2014 11
CONDENSED CONSOLIDATED INTERIM STATEMENTS OF FINANCIAL POSITION
ALL FIGURES IN THOUSANDS OF US $
As at
June 30, 2014 As at
December 30, 2013
(unaudited) (unaudited)
ASSETS
CURRENT ASSETS
Cash and cash equivalents (Note 12) $ 40,858 $ 40,074
Trade and other receivables 474,776 456,465
Inventories 593,094 555,567
Other financial assets 780 231
Income taxes receivable 14,296 11,626
Prepaid expenses 32,694 26,200
1,156,498 1,090,163
Assets held for sale (Note 4) 1,308 –
1,157,806 1,090,163 NON-CURRENT ASSETS
Property, plant and equipment 179,613 181,299
Intangible assets 557,117 500,381
Goodwill (Note 13) 632,851 637,084
Other financial assets 1,036 620
Deferred tax assets 20,150 24,356
Other assets 5,562 6,060
1,396,329 1,349,800
$ 2,554,135 $ 2,439,963
LIABILITIES
CURRENT LIABILITIES
Bank indebtedness $ 38,740 $ 72,546
Trade and other payables 389,116 379,311
Other financial liabilities 3,540 3,231
Income taxes payable 4,147 7,075
Long-term debt (Note 6) 61,727 344,374
Provisions 37,318 44,570
534,588 851,107
NON-CURRENT LIABILITIES
Long-term debt (Note 6) 417,753 13,183
Net pension and post-retirement defined benefit liabilities 31,172 31,701
Deferred tax liabilities 94,723 87,171
Provisions 2,000 1,993
Put option liabilities (Note 7) 81,646 92,570
Other financial liabilities 2,203 2,727
Other long-term liabilities 14,162 12,751
643,659 242,096
EQUITY
Share capital (Note 8) 199,358 190,458
Contributed surplus 25,679 26,994
Accumulated other comprehensive income 68,730 67,824
Retained earnings 1,082,121 1,061,484
1,375,888 1,346,760
$ 2,554,135 $ 2,439,963
(See accompanying notes)

DOREL INDUSTRIES INC. – CONDENSED CONSOLIDATED INTERIM FINANCIAL STATEMENTS for the second quarter and six months ended June 30, 2014 12
CONDENSED CONSOLIDATED INTERIM INCOME STATEMENTS
ALL FIGURES IN THOUSANDS OF US $, EXCEPT PER SHARE AMOUNTS
Second Quarters Ended Six Months Ended
June 30, 2014 June 30, 2013 June 30, 2014 June 30, 2013
(unaudited) (unaudited) (unaudited) (unaudited)
Sales $ 653,415 $ 598,046 $ 1,296,573 $ 1,187,112
Licensing and commission income 2,416 2,403 6,959 7,505
TOTAL REVENUE 655,831 600,449 1,303,532 1,194,617
Cost of sales (Note 4) 499,894 459,993 992,647 910,286
GROSS PROFIT 155,937 140,456 310,885 284,331
Selling expenses 61,964 62,412 118,662 117,772
General and administrative expenses 56,544 46,044 106,675 98,178
Research and development expenses 6,945 7,696 15,696 14,899
Restructuring costs (Note 4) 1,212 1,950 1,483 1,950
OPERATING PROFIT 29,272 22,354 68,369 51,532
Finance expenses (Note 11) 10,231 5,585 19,510 10,067
INCOME BEFORE INCOME TAXES 19,041 16,769 48,859 41,465
Income taxes expense (Note 11) 3,841 3,545 8,859 5,925
NET INCOME $ 15,200 $ 13,224 $ 40,000 $ 35,540
EARNINGS PER SHARE
Basic $ 0.47 $ 0.41 $ 1.25 $ 1.12
Diluted $ 0.47 $ 0.41 $ 1.24 $ 1.11
SHARES OUTSTANDING (Note 10)
Basic – weighted average 32,297,064 31,865,525 32,117,648 31,765,123
Diluted – weighted average 32,488,794 32,223,810 32,384,207 32,152,285
(See accompanying notes)

DOREL INDUSTRIES INC. – CONDENSED CONSOLIDATED INTERIM FINANCIAL STATEMENTS for the second quarter and six months ended June 30, 2014 13
CONDENSED CONSOLIDATED INTERIM STATEMENTS OF COMPREHENSIVE INCOME
ALL FIGURES IN THOUSANDS OF US $
Second Quarters Ended Six Months Ended
June 30, 2014 June 30, 2013 June 30, 2014 June 30, 2013
(unaudited) (unaudited) (unaudited) (unaudited)
NET INCOME $ 15,200 $ 13,224 $ 40,000 $ 35,540
OTHER COMPREHENSIVE INCOME
(LOSS):
Items that are or may be reclassified subsequently to net income:
Cumulative translation account:
Net change in unrealized foreign currency gains (losses) on translation of net investments in foreign operations, net of tax of nil 441 (3,711 ) 109 (19,349 )
Net changes in cash flow hedges:
Net change in unrealized gains (losses) on derivatives designated as cash flow hedges (1,070) (294 ) (939) 3,824
Reclassification to income 190 251 480 503
Reclassification to the related non-financial asset 993 (628 ) 1,477 (758 )
Deferred income taxes 71 41 (227) (1,211 )
184 (630 ) 791 2,358
Items that will not be reclassified to net income:
Defined benefit plans:
Remeasurements of the net pension and post-retirement defined benefit liabilities 9 (4 ) 9 4
Deferred income taxes (3) 1 (3) (1 )
6 (3 ) 6 3
TOTAL OTHER COMPREHENSIVE INCOME (LOSS) 631 (4,344 ) 906 (16,988 )
TOTAL COMPREHENSIVE INCOME $ 15,831 $ 8,880 $ 40,906 $ 18,552
(See accompanying notes)

DOREL INDUSTRIES INC. – CONDENSED CONSOLIDATED INTERIM FINANCIAL STATEMENTS for the second quarter and six months ended June 30, 2014 14
CONDENSED CONSOLIDATED INTERIM STATEMENTS OF CHANGES IN EQUITY
ALL FIGURES IN THOUSANDS OF US $
Attributable to equity holders of the Company
Accumulated other comprehensive income
Share
Capital
Contributed Surplus
Cumulative Translation
Account
Cash Flow Hedges
Defined Benefit Plans
Retained Earnings
Total Equity
(unaudited) (unaudited) (unaudited) (unaudited) (unaudited) (unaudited) (unaudited)
Balance as at December 30, 2012 $ 180,856 $ 27,192 $ 66,391 $ (1,036 ) $ (7,736 ) $ 1,042,446 $ 1,308,113
Total comprehensive income:
Net income – – – – – 35,540 35,540
Other comprehensive income (loss) – – (19,349 ) 2,358 3 – (16,988 )
$ – $ – $ (19,349 ) $ 2,358 $ 3 $ 35,540 $ 18,552
Issued under stock option plan 6,464 – – – – – 6,464
Reclassification from contributed surplus due to exercise of stock options 1,377 (1,377 ) – – – – –
Reclassification from contributed surplus due to settlement of deferred share units (Note 9) 227 (347 ) – – – – (120 )
Share-based payments (Note 9) – 1,381 – – – – 1,381
Dividends on common shares – – – – – (19,052 ) (19,052 )
Dividends on deferred share units (Note 9) – 93 – – – (93 ) –
Balance as at June 30, 2013 $ 188,924 $ 26,942 $ 47,042 $ 1,322 $ (7,733 ) $ 1,058,841 $ 1,315,338
Balance as at December 30, 2013 $ 190,458 $ 26,994 $ 75,378 $ (2,154 ) $ (5,400 ) $ 1,061,484 $ 1,346,760
Total comprehensive income:
Net income – – – – – 40,000 40,000
Other comprehensive income – – 109 791 6 – 906
$ – $ – $ 109 $ 791 $ 6 $ 40,000 $ 40,906
Issued under stock option plan (Note 8) 6,916 – – – – – 6,916
Reclassification from contributed surplus due to exercise of stock options (Note 8) 1,829 (1,829 ) – – – – –
Reclassification from contributed surplus due to settlement of deferred share units (Notes 8 and 9) 155 (233 ) – – – – (78 )
Share-based payments (Note 9) – 650 – – – – 650
Dividends on common shares – – – – – (19,266 ) (19,266 )
Dividends on deferred share units (Note 9) – 97 – – – (97 ) –
Balance as at June 30, 2014 $ 199,358 $ 25,679 $ 75,487 $ (1,363 ) $ (5,394 ) $ 1,082,121 $ 1,375,888
(See accompanying notes)

DOREL INDUSTRIES INC. – CONDENSED CONSOLIDATED INTERIM FINANCIAL STATEMENTS for the second quarter and six months ended June 30, 2014 15
CONDENSED CONSOLIDATED INTERIM STATEMENTS OF CASH FLOWS
ALL FIGURES IN THOUSANDS OF US $
Second Quarters Ended Six Months Ended
June 30, 2014 June 30, 2013 June 30, 2014 June 30, 2013
(unaudited) (unaudited) (unaudited) (unaudited)
CASH PROVIDED BY (USED IN):
OPERATING ACTIVITIES
Net income $ 15,200 $ 13,224 $ 40,000 $ 35,540
Items not involving cash:
Depreciation and amortization 14,692 13,957 29,712 27,080
Amortization of deferred financing costs (Note 11) 206 98 383 190
Accretion expense on put option liabilities (Notes 7 and 11) 1,452 578 3,797 1,172
Unrealized losses (gains) due to foreign exchange exposure on put option liabilities (Note 7) 969 (2,169 ) 2,654 (1,975 )
Unrealized losses (gains) arising on financial assets and financial liabilities classified as held for trading 538
– 538 –
Other finance expenses (Note 11) 8,573 4,909 15,330 8,705
Restructuring costs (Note 4) 1,703 1,950 2,154 1,950
Income taxes expense 3,841 3,545 8,859 5,925
Share-based payments (Note 9) 192 327 506 1,076
Defined benefit pension and post-retirement costs 833 933 1,704 1,492
Loss (gain) on disposal of property, plant and equipment 43 (197 ) 20 (218 )
48,242 37,155 105,657 80,937
Net changes in balances related to operations (Note 12) (21,510 ) 35,784 (63,850 ) (29,096 )
Income taxes paid (5,935 ) (4,247 ) (18,544 ) (9,609 )
Income taxes received 1,226 1,663 6,445 9,891
Interest paid (9,700 ) (6,695 ) (13,390 ) (8,213 )
Interest received 85 – 274 496
CASH PROVIDED BY OPERATING ACTIVITIES 12,408 63,660 16,592 44,406
FINANCING ACTIVITIES
Bank indebtedness (28,937 ) (9,726 ) (37,194) 5,605
Increase of long-term debt 73,296 – 147,173 19,957
Repayments of long-term debt (24,968 ) (15,424 ) (26,395 ) (13,084 )
Repayments of contingent consideration (Note 7) – – – (1,995 )
Financing costs (900 ) (213 ) (1,291 ) (218 )
Issuance of share capital (Note 8) 301 571 6,901 5,620
Dividends on common shares (9,691 ) (9,562 ) (19,266 ) (19,052 )
CASH PROVIDED BY (USED IN) FINANCING ACTIVITIES 9,101 (34,354 ) 69,928 (3,167 )
INVESTING ACTIVITIES
Acquisition of businesses (Notes 5 and 12) (6,432 ) – (54,593 ) –
Additions to property, plant and equipment (8,054 ) (10,885 ) (18,084 ) (17,530 )
Disposals of property, plant and equipment 535 229 568 288
Additions to intangible assets (5,370 ) (5,535 ) (10,076 ) (10,877 )
CASH USED IN INVESTING ACTIVITIES (19,321 ) (16,191 ) (82,185 ) (28,119 )
Effect of foreign currency exchange rate changes on cash and cash equivalents (2,996 ) 1,781 (3,551 ) 986
NET (DECREASE) INCREASE IN CASH AND CASH EQUIVALENTS (808 ) 14,896 784 14,106
Cash and cash equivalents, beginning of period 41,666 37,521 40,074 38,311
CASH AND CASH EQUIVALENTS, END OF PERIOD $ 40,858 $ 52,417 $ 40,858 $ 52,417
(See accompanying notes)

DOREL INDUSTRIES INC. – CONDENSED CONSOLIDATED INTERIM FINANCIAL STATEMENTS for the second quarter and six months ended June 30, 2014 16
Notes to the Condensed Consolidated Interim Financial Statements
For the periods ended June 30, 2014 and 2013 All figures in thousands of US$, except per share amounts (unaudited)
1. Nature of operations
Dorel Industries Inc. (the “Company”) is a global consumer products company which designs, manufactures or sources, markets and distributes a diverse portfolio of powerful product brands, marketed through its Juvenile, Recreational/Leisure and Home Furnishings segments. The principal markets for the Company’s products are the United States, Canada, Europe and Latin America.
2. Statement of compliance and basis of preparation and measurement
The condensed consolidated interim financial statements have been prepared in accordance with IAS 34, Interim Financial Reporting as adopted by the International Accounting Standards Board (“IASB”), using the U.S. dollar as the reporting currency. The U.S. dollar is the functional currency of the Canadian parent company. All financial information presented in U.S. dollars has been rounded to the nearest thousand, unless otherwise indicated. These condensed consolidated interim financial statements are prepared in accordance with International Financial Reporting Standards (“IFRS”) and with the same accounting policies and methods of computation followed in the most recent audited consolidated annual financial statements as at and for the year ended December 30, 2013. The condensed consolidated interim financial statements do not include all of the information required for full consolidated annual financial statements. Certain information and footnote disclosures normally included in consolidated annual financial statements prepared in accordance with IFRS were omitted or condensed where such information is not considered material to the understanding of the Company’s condensed consolidated interim financial information.
These condensed consolidated interim financial statements should be read in conjunction with the Company’s 2013 audited consolidated annual financial statements.
The condensed consolidated interim financial statements have been prepared on a historical basis except for:
derivative financial instruments which are measured at fair value;
put option liabilities which are measured at fair value;
share-based compensation arrangements which are measured in accordance with IFRS 2 – Share-based payments;
identifiable assets acquired and liabilities assumed in connection with a business combination which are measured at fair value at acquisition date;
the net pension and post-retirement defined benefit liabilities which are measured as the net total of plan assets measured at fair value less the discounted present value of the defined benefit obligations; and
product liability which is measured at its discounted present value.
These condensed consolidated interim financial statements were authorized by the Company’s Board of Directors for issue on August 6th, 2014.
The results of operations for the interim period are not necessarily indicative of the results of operations for the full year.
3. Future accounting changes
A number of new standards, interpretations and amendments to existing standards were issued by the IASB or the International Financial Reporting Interpretations Committee (“IFRIC”) that are mandatory but not yet effective for the six months ended June 30, 2014 and have not been applied in preparing these condensed consolidated interim financial statements. The following standards and interpretations have been issued by the IASB and the IFRIC with effective dates in the future that have been determined by management to impact the consolidated financial statements:

DOREL INDUSTRIES INC. – CONDENSED CONSOLIDATED INTERIM FINANCIAL STATEMENTS for the second quarter and six months ended June 30, 2014 17
3. Future accounting changes (continued)
IFRS 9 – Financial Instruments
As part of the initial phase to replace IAS 39, Financial Instruments: Recognition and Measurement, this standard retains but simplifies the mixed measurement model and establishes two primary measurement categories for financial assets. This first phase only covers classification and measurement of financial assets and financial liabilities, with impairment of financial assets and hedge accounting being addressed in the other two phases. More specifically, the standard:
- Deals with classification and measurement of financial assets; - Establishes two primary measurement categories for financial assets: amortized cost and fair value; - Prescribes that classification depends on the entity’s business model and the contractual cash flow
characteristics of the financial asset; and - Eliminates the following existing categories of financial assets: held to maturity, available for sale, and loans
and receivables.
Most of the requirements in IAS 39 for classification and measurement of financial liabilities were carried forward in IFRS 9. However, certain changes were also made regarding the fair value option for financial liabilities and accounting for certain derivatives linked to unquoted equity instruments.
In November 2013, the IASB released IFRS 9, Financial Instruments (2013), which introduces a new hedge accounting model, together with corresponding disclosures about risk management activities. The new hedge accounting model represents a significant change in hedge accounting requirements. It increases the scope of hedged items eligible for hedge accounting and it enables entities to better reflect their risk management activities in their financial statements.
On July 24, 2014, the IASB issued the final version of IFRS 9, bringing together the classification and measurement, impairment and hedge accounting phases of the IASB’s project to replace IAS 39. The final version of IFRS 9 supersedes all previous versions of IFRS 9 and is effective for annual periods beginning on or after January 1, 2018, with earlier adoption permitted. The Company has not yet assessed the impact of the adoption of this standard on its consolidated financial statements.
IFRS 15 – Revenues from contracts with customers
In May 2014, the IASB released IFRS 15, Revenue from Contracts with Customers, which establishes principles for reporting the nature, amount, timing and uncertainty of revenue and cash flows arising from an entity’s contracts with customers. It provides a single model in order to depict the transfer of promised goods or services to customers. The core principle of IFRS 15 is that an entity recognizes revenue to depict the transfer of promised goods or services to customers in an amount that reflects the consideration to which an entity expects to be entitled in exchange for those goods and services. IFRS 15 also requires more comprehensive disclosures about the nature, amount, timing and uncertainty of revenue and cash flows arising from an entity’s contracts with customers.
IFRS 15 supersedes IAS 11, Construction Contracts, IAS 18, Revenue, and a number of revenue-related interpretations (IFRIC 13, Customer Loyalty Programmes, IFRIC 15, Agreements for the Construction of Real Estate, IFRIC 18, Transfers of Assets from Customers, and SIC-31, Revenue - Barter Transactions Involving Advertising Service). IFRS 15 is effective for annual periods beginning on or after January 1, 2018, with earlier adoption permitted. The Company has not yet assessed the impact of the adoption of this standard on its consolidated financial statements.
DOREL INDUSTRIES INC. – CONDENSED CONSOLIDATED INTERIM FINANCIAL STATEMENTS for the second quarter and six months ended June 30, 2014 18
3. Future accounting changes (continued)
IFRIC Interpretation 21 – Levies (IFRIC 21)
IFRIC 21 was issued by the IASB in May 2013. IFRIC 21 provides guidance on when to recognize a liability for a levy imposed by a government both for levies that are accounted for in accordance with IAS 37, Provisions, Contingent Liabilities and Contingent Assets and those where the timing and amount of the levy is certain. A levy is an outflow of resources embodying economic benefits that is imposed by governments on entities in accordance with legislation, other than income taxes within the scope of IAS 12, Income Taxes and fines or other penalties imposed for breaches of the legislation. The Interpretation identifies the obligating event for the recognition of a liability as the activity that triggers the payment of the levy in accordance with the relevant legislation. It provides the following guidance on recognition of a liability to pay levies: (i) the liability is recognized progressively if the obligating event occurs over a period of time, and (ii) if an obligation is triggered on reaching a minimum threshold, the liability is recognized when that minimum threshold is reached. The standard is effective for annual periods beginning January 1, 2014 and the Company will not early adopt this Standard. The Company is currently assessing the impact of this new standard on its consolidated financial statements.
4. Restructuring Activities
For the six months ended June 30, 2014, the Company recorded total expenses of $2,154 (year ended December 30, 2013 – $15,432) with respect to restructuring activities, of which $671 (year ended December 30, 2013 – $4,075) were recorded as cost of sales and $1,483 (year ended December 30, 2013 – $11,357) were recorded as restructuring costs. Recreational/Leisure segment
In the second and fourth quarters of 2013, restructuring activities affecting the Recreational/Leisure segment were initiated. In the second quarter of 2013, the Company initiated significant cost reductions across the Recreational/Leisure segment which included a headcount reduction of some 50 positions worldwide.
In the fourth quarter of 2013, the Company continued its strategy and it was announced that toward the end of 2014, the segment will close its assembly and testing facility in Bedford, Pennsylvania and leverage the strengths and capabilities of its global resources, third party partners, and existing facilities to simplify and optimize its business model. As part of its initiative to simplify and optimize its business model, the Recreational/Leisure segment announced a new partnership in Australia with Monza Imports (“Monza”) who became the official distributor of the brands in Australia. The operations in Australia transitioned to Monza on May 1, 2014. Operations currently performed at Bedford, including manufacturing, assembly, testing, quality control and customer and technical services are expected to be redeployed by early 2015.
In addition, the Recreational/Leisure segment will relocate its research and development facility in Bethel, Connecticut to the segment’s new headquarters in Wilton, Connecticut, and will convert its former retail lab in Bethel to accommodate GURU Academy activities. The value of the former Bethel headquarters was written down in the fourth quarter of 2013 to the fair value less costs to sell of the property. In April 2014, the Company made available for sale the building facility in Bethel, Connecticut. Accordingly, the land and building related to this facility are presented as current assets held for sale on the Company’s condensed consolidated interim statements of financial position. These restructuring initiatives are expected to be completed by the end of 2014 and result in cumulative restructuring charges of $18,500. To date, the Company has recorded a cumulative charge of $17,586 under the plan, including $10,448 of non-cash charges related to the write-down on long-lived assets, accelerated depreciation due to the revision of the estimated useful lives of long-lived assets and inventory markdowns, $6,919 of employee severance and termination benefits and $219 of other associated costs. The remaining costs associated with these restructuring activities are approximately $475 of employee severance and termination benefits and $439 of accelerated depreciation.

DOREL INDUSTRIES INC. – CONDENSED CONSOLIDATED INTERIM FINANCIAL STATEMENTS for the second quarter and six months ended June 30, 2014 19
4. Restructuring Activities (continued) The costs recognized for these restructuring activities consist of the following:
Second Quarters Ended
June 30, Six Months Ended
June 30,
2014 2013 2014 2013
Employee severance and termination benefits $ 435 $ 1,950 $ 348 $ 1,950
Accelerated depreciation 558 – 916 –
Other associated costs 219 – 219 –
Recorded as restructuring costs 1,212 1,950 1,483 1,950
Inventory markdowns (in cost of sales) (60 ) – (317 ) –
Accelerated depreciation (in cost of sales) 551 – 988 –
$ 1,703 $ 1,950 $ 2,154 $ 1,950
As at June 30, 2014, the related restructuring plan provision totaling $4,054 consists of employee severance and termination benefits and other associated costs. A summary of the Company’s restructuring plan provision is as follows:
Balance December 30, 2013
2014 Provision
Cash paid
Effect of foreign exchange
Balance June 30, 2014
Employee severance and termination benefits $ 4,982 $ 348 $ (1,503) $ 8 $ 3,835
Other associated costs – 219 – – 219
$ 4,982 $ 567 $ (1,503) $ 8 $ 4,054
5. Business acquisitions
Caloi On August 22, 2013, it was announced that the Company was acquiring a 70% interest in Caloi, a major Brazilian manufacturer of bicycles and bicycle equipment. Caloi’s portfolio encompasses a full range of bicycles, from high-performance to children’s models, including mountain bikes, urban, recreational and road bikes. Caloi’s products are distributed across Brazil through a variety of channels, from mass market to independent bicycle dealers. Caloi’s manufacturing facility in Manaus, Brazil will assemble bikes for the Company’s brands, such as Cannondale, Schwinn, Mongoose and GT to serve the Brazilian and export markets. As part of the acquisition, the Company entered into a put and call agreement with the non-controlling interest holder for the purchase of its 30% stake in Caloi. The determination of the fair value of the assets acquired, the liabilities assumed and the consideration transferred includes an estimate of the put option liability of $35,846 and is recorded as a financial liability within put option liabilities. The acquisition has been accounted for using the acquisition method with the results of the operations of Caloi being included in the accompanying condensed consolidated interim financial statements since the date of acquisition. The goodwill is not deductible for tax purposes. The total goodwill amount is included in the Company’s Recreational/Leisure segment as reported in Note 13.

DOREL INDUSTRIES INC. – CONDENSED CONSOLIDATED INTERIM FINANCIAL STATEMENTS for the second quarter and six months ended June 30, 2014 20
5. Business acquisitions (continued)
Caloi (continued) The following table summarizes the consideration transferred, the fair value of the identifiable assets acquired and liabilities assumed as at the date of acquisition:
Assets
Cash and cash equivalents $ 1,056
Trade and other receivables 30,079
Inventories 41,508
Prepaid expenses 489
Property, plant and equipment 18,855
Trademarks 61,669
Customer relationships 15,858
Software licenses 1,107
Deferred development costs 207
Goodwill 32,597
Other financial assets 262
Deferred tax assets 8,560
Other assets 1,208
213,455
Liabilities
Bank indebtedness 41,034
Trade and other payables 24,252
Income taxes payable 302
Current portion of long-term debt 5,828
Provisions 153
Long-term debt 14,420
Deferred tax liabilities 14,830
Other long-term liabilities 3,810
104,629
Net assets acquired $ 108,826
Consideration:
Cash $ 72,980
Put option liability 35,846
$ 108,826
The fair value, as well as, the gross amount of the trade accounts receivable amounts to $26,743 of which $207 was expected to be uncollectible as at the acquisition date and $241 was assumed for anticipated credits. The goodwill of $32,597 includes a control premium as well as the Company’s ability to extend their reach into a market that has future growth potential and further solidifies its position as a global leader in the recreational industry. Acquisition-related costs of $178 for the six months ended June 30, 2014 (year ended December 30, 2013 – $1,698) have been excluded from the consideration transferred and have been recognized as an expense, within general and administrative expenses in the condensed consolidated interim income statement and within the recreational/leisure segment’s operating profit.

DOREL INDUSTRIES INC. – CONDENSED CONSOLIDATED INTERIM FINANCIAL STATEMENTS for the second quarter and six months ended June 30, 2014 21
5. Business acquisitions (continued)
Tiny Love On January 16 2014, the Company announced that it had purchased 100% of the shares of juvenile business Tiny Love, a global, baby products and developmental toy company headquartered in Tel Aviv, Israel, with offices located in the U.S. and China. Tiny Love is recognized as an innovator in the developmental toy category, which comprises products like activity gyms, mobiles, light gear and toys designed specifically for babies and toddlers. The purchase price was $55,823. A balance of sale of $150 remains to be paid and is presented with the trade and other payables. The acquisition has been accounted for using the acquisition method with the results of operations of Tiny Love being included in the accompanying condensed consolidated interim financial statements since the date of acquisition. The goodwill is not deductible for tax purposes. The total goodwill amount is included in the Company’s Juvenile segment as reported in Note 13.
The following table summarizes the consideration transferred, the preliminary fair value of the identifiable assets acquired and liabilities assumed as at the date of acquisition:
Assets
Cash and cash equivalents $ 7,789
Trade and other receivables 3,213
Inventories 2,009
Other financial assets 6
Income taxes receivable 751
Prepaid expenses 146
Property, plant and equipment 441
Trademarks 22,600
Customer relationships 24,200
Goodwill 18,768
Deferred tax assets 2,002
81,925
Liabilities
Bank indebtedness 1
Trade and other payables 12,727
Income taxes payable 9
Deferred tax liabilities 13,365
26,102
Net assets acquired $ 55,823
Consideration:
Cash $ 55,673
Balance of sale 150
$ 55,823
The fair values of the trademarks and the customer relationships have been determined on a provisional basis pending completion of an independent valuation. The fair value, as well as, the gross amount of the trade accounts receivable amounts to $2,698 of which $5 was expected to be uncollectible as at the acquisition date and $254 was assumed for anticipated credits. The preliminary goodwill of $18,768 includes a control premium as well as the Company’s ability to extend their reach into markets that have future growth potential and further solidifies its position as a global leader in the juvenile industry. Had this business combination been effected as at the beginning of the year, management estimates that the Company’s consolidated revenues and net income for the six months ended June 30, 2014 would not be significantly different.

DOREL INDUSTRIES INC. – CONDENSED CONSOLIDATED INTERIM FINANCIAL STATEMENTS for the second quarter and six months ended June 30, 2014 22
5. Business acquisitions (continued)
Tiny Love (continued) Acquisition-related costs of $180 for the six months ended June 30, 2014 (year ended December 30, 2013 – $518) have been excluded from the consideration transferred and have been recognized as an expense within general and administrative expenses in the condensed consolidated interim income statement and within the juvenile segment’s operating profit. Sombrio On January 16, 2014, the Company acquired certain assets of Sombrio Freewear Company Ltd (“Sombrio”) for $744. Sombrio is the purveyor of leading design and manufactured high performance apparel, outerwear and street wear headquartered in Vancouver, Canada. The acquisition has been recorded under the purchase method of accounting with the results of the acquired business being included in the accompanying condensed consolidated interim financial statements since the date of acquisition. The fair value of the assets acquired and the consideration transferred includes an amount of $190 allocated to trademarks. Infanti Brazil On April 3, 2014, Dorel Juvenile Brazil acquired the rights to sell Infanti branded product in the Brazilian market place for a purchase price of $7,018 (BRL 16,000). This acquisition expanded the Company’s ownership of the Infanti brand, to which the Company already owns the rights in Chile, Bolivia, Peru, Argentina, Colombia, and most Central American and Caribbean countries. The acquisition has been recorded under the purchase method of accounting with the results of the acquired business being included in the accompanying condensed consolidated interim financial statements since the date of acquisition. The goodwill is deductible for tax purposes. The total goodwill amount is included in the Company’s Juvenile segment as reported in Note 13.
The following table summarizes the consideration transferred, the preliminary fair value of the identifiable assets acquired and liabilities assumed as at the date of acquisition:
Trademarks $ 3,597 Customer relationships 2,237 Goodwill 1,184
Assets acquired $ 7,018
Consideration:
Cash $ 5,965
Balance of sale 1,053
$ 7,018
The fair values of the trademarks and the customer relationships have been determined on a provisional basis. The preliminary goodwill of $1,184 includes a control premium as well as the Company’s ability to extend their reach into markets that have future growth potential, provides the Company with increased usage of the Infanti brand in this new territory and further solidifies its position as a global leader in the juvenile industry. Had this business combination been effected as at the beginning of the year, management estimates that the Company’s consolidated revenues and net income for the six months ended June 30, 2014 would not be significantly different. Acquisition-related costs of $65 for the six months ended June 30, 2014 have been excluded from the consideration transferred and have been recognized as an expense within general and administrative expenses in the condensed consolidated interim income statement and within the juvenile segment’s operating profit.

DOREL INDUSTRIES INC. – CONDENSED CONSOLIDATED INTERIM FINANCIAL STATEMENTS for the second quarter and six months ended June 30, 2014 23
6. Long-term debt
As at December 30, 2013, the Company was in breach with one of its covenants. As a result of this breach, the Company reclassified the long-term portion of the related debts to the current portion of long-term debt since as at December 30, 2013, the Company had not obtained from the associated lenders the amendment to its debt agreements for this covenant. During the three months ended March 31, 2014, the Company amended certain financial covenants related to its debt agreements. As of June 30, 2014, the Company was compliant with all its borrowing covenant requirements and as a result the related debts are classified as long-term. On April 3, 2014, associated with the Infanti Brazil acquisition, Dorel Juvenile Brazil borrowed $7,261 (BRL 16,000), with a three year term bearing interest at various rates per annum, based on a floating CDI (Inter-Bank Certificate of Deposit) rate plus a margin. The principal repayments of this debt are monthly after an initial one year grace period and it matures in 2017. On April 22, 2014, Caloi issued approximately $45,400 (BRL 100,000) of non-convertible unsecured debentures in Brazil, bearing interest at various rates per annum, based on a floating CDI (Inter-Bank Certificate of Deposit) rate plus a margin. The principal repayments of the debentures are as follow:
- 6 semi-annual instalments of $6,470 (BRL 14,250) payable in March and September of each year from March 2016 until September 2018
- 1 final semi-annual instalment of $6,580 (BRL 14,500) in March 2019
The proceeds from the issuance of the debentures were used to replace current existing debts such as bank indebtedness and revolving bank loans.
Effective May 27, 2014, the Company amended the terms of its $360,000 revolving bank loans in order to extend the maturity from July 1, 2016 to July 1, 2017.
7. Fair value of financial instruments
The Company has determined that the fair value of its current financial assets and liabilities approximates their
respective carrying amounts as at the statement of financial position dates because of the short-term nature of
those financial instruments. For long-term debt bearing interest at variable rates, the fair value is considered to
approximate the carrying amount. For long-term debt bearing interest at fixed rates, the fair value is estimated
based on discounting expected future cash flows at the discount rates which represent borrowing rates presently
available to the Company for loans with similar terms and maturity.
The fair value of the long-term debt bearing interest at fixed rates is as follows:
June 30,
2014 December 30,
2013
Carrying amount
Fair value
Carrying amount
Fair value
Financial liabilities
Other financial liabilities:
Long-term debt – bearing interest at fixed rates $ 174,236 $ 186,825 $ 187,048 $ 196,412
As at June 30, 2014 and December 30, 2013, the fair value of the other financial liabilities are comparable to their
carrying value since the majority of the amount is recorded based on discounted future cash outflows.
During the six months ended June 30, 2014, the Company decided to use interest rate swap agreements to lock
in a portion of its debt cost and reduce its exposure to the variability of interest rates by exchanging variable rate
payments for fixed rate payments and entered into new interest rate swap agreements to replace the agreements
that had matured on March 23, 2014. The Company has designated its interest rate swaps as cash flow hedges
for which it uses hedge accounting.

DOREL INDUSTRIES INC. – CONDENSED CONSOLIDATED INTERIM FINANCIAL STATEMENTS for the second quarter and six months ended June 30, 2014 24
7. Fair value of financial instruments (continued)
The maturity analysis associated with the interest rate swap agreements used to manage interest risk associated with long-term debt is as follows:
June 30, 2014
Fixed Rate (Percentage)
Notional amounts Maturity Fair value
Interest rate swap agreements 1.75 $ 50,000 March 26, 2019 $ (537)
Fair Value Hierarchy
The Company categorizes its financial assets and liabilities measured at fair value into one of three different
levels depending on the observability of the inputs used in the measurement.
Level 1: This level includes assets and liabilities measured at fair value based on unadjusted quoted prices
for identical assets and liabilities in active markets that are accessible at the measurement date.
Level 2: This level includes valuations determined using directly (i.e. as prices) or indirectly (i.e. derived
from prices) observable inputs other than quoted prices included within Level 1. Derivative
instruments in this category are valued using models or other standard valuation techniques
derived from observable market inputs.
Level 3: This level includes valuations based on inputs which are less observable, unavailable or where the
observable data does not support a significant portion of the instruments’ fair value.
The Company’s financial assets and liabilities measured at fair value are its foreign exchange contracts, interest
rate swaps and put option liabilities.
Where the fair value of financial assets and financial liabilities recorded in the consolidated statement of financial
position cannot be derived from active markets, they are determined using valuation techniques including
discounted cash flow models. The inputs to these models are taken from observable markets where possible, but
where this is not feasible, a degree of judgment is required in establishing the fair values. The judgments include
considerations of inputs such as liquidity risk, credit risk and volatility. Should any of the inputs to these models or
changes in assumptions about these factors occur, this could affect the reported fair value of financial
instruments.
The fair value of the foreign exchange contracts and the interest rate swaps were measured using Level 2 inputs
in the fair value hierarchy. The put option liabilities were measured using Level 3 inputs in the fair value hierarchy.
The fair value of the foreign exchange contracts is measured using a generally accepted valuation technique
which is the discounted value of the difference between the contract’s value at maturity based on the foreign
exchange rate set out in the contract and the contract’s value at maturity based on the foreign exchange rate that
the counterparty would use if it were to renegotiate the same contract at today’s date under the same conditions.
The Company’s or the counterparty’s credit risk is also taken into consideration in determining fair value.
The fair value of the interest rate swaps is measured using a generally accepted valuation technique which is the
discounted value of the difference between the value of the swap based on variable interest rates (estimated
using the yield curve for anticipated interest rates) and the value of the swap based on the swap’s fixed interest
rate. The counterparty’s credit risk is also taken into consideration in determining fair value.

DOREL INDUSTRIES INC. – CONDENSED CONSOLIDATED INTERIM FINANCIAL STATEMENTS for the second quarter and six months ended June 30, 2014 25
7. Fair value of financial instruments (continued)
The fair value of the put options liabilities is measured by applying the income approach using the probability-
weighted expected payment of the exit price and is based on discounted cash flows. The exit price is based on a
formulaic variable price which is mainly a function of the earnings levels in future periods. The Company assumes
a discount rate in order to calculate the present value of the expected payment of the exit price which represents
the cost of borrowing of the specific period for the cash flows. The significant unobservable input within the fair
value measurement of the put option liabilities is the estimated future earnings levels in future periods. If the
future earnings levels in future periods would increase (decrease), the estimated fair value of the put option
liabilities would increase (decrease).
The following table provides information about financial assets and liabilities measured at fair value in the
statement of financial position and categorized by level of hierarchy as at June 30, 2014:
June 30, 2014
Total Level 1 Level 2 Level 3
Financial assets
Held for trading financial assets
Foreign exchange contracts $ 115 $ – $ 115 $ –
Derivatives designated as cash flow hedges:
Foreign exchange contracts $ 665 $ – $ 665 $ –
Interest rate swaps $ 224 $ – $ 224 $ –
Financial liabilities
Held for trading financial liabilities
Foreign exchange contracts $ 598 $ – $ 598 $ –
Derivatives measured at fair value:
Put option liabilities $ 81,646 $ – $ – $ 81,646
Derivatives designated as cash flow hedges:
Foreign exchange contracts $ 2,181 $ – $ 2,181 $ –
Interest rate swaps $ 761 $ – $ 761 $ –
Changes in fair value of Level 3 financial instruments were as follows, for the six months ended June 30, 2014
and the fiscal year ended December 30, 2013:
Fair Value of Level 3 financial instruments
June 30,
2014 December 30,
2013
Balance, beginning of the period $ 92,570 $ 42,933
Addition through acquisition of businesses – 52,433
Change due to finalization of the fair value of the net assets acquired of Caloi (16,587) –
Accretion expense on put option liabilities included in finance expenses (Note 11) 3,797 2,815
Unrealized (gains) losses due to foreign exchange exposure on put option liabilities included in general and administrative expenses
2,654 (4,689)
Change of assumptions on put option liabilities included in general and administrative expenses
– (567)
Repayments of contingent consideration – (1,995)
Effect of foreign currency exchange rate changes recognized in other comprehensive income
(788) 1,640
Balance, end of the period $ 81,646 $ 92,570

DOREL INDUSTRIES INC. – CONDENSED CONSOLIDATED INTERIM FINANCIAL STATEMENTS for the second quarter and six months ended June 30, 2014 26
8. Share capital
Details of the issued and outstanding shares are as follows:
Six Months Ended
June 30, 2014 Year Ended
December 30, 2013
Number Amount Number Amount
Class “A” Multiple Voting Shares
Balance, beginning of period 4,195,135 $ 1,771 4,221,210 $ 1,787
Converted from Class “A” to Class “B” (1) – – (26,075 ) (16 )
Balance, end of period 4,195,135 $ 1,771 4,195,135 $ 1,771
Class “B” Subordinate Voting Shares
Balance, beginning of period 27,718,003 $ 188,687 27,410,127 $ 179,069
Converted from Class “A” to Class “B” (1) – – 26,075 16
Issued under stock option plan (2) 383,500 6,916 281,625 7,605
Reclassification from contributed surplus due to exercise of stock options – 1,829 –
1,838
Reclassification from contributed surplus due to settlement of deferred share units (Note 9) 6,302 155 10,176
227
Repurchase and cancellation of shares (3) – – (10,000 ) (68 )
Balance, end of period 28,107,805 $ 197,587 27,718,003 $ 188,687
TOTAL SHARE CAPITAL $ 199,358 $ 190,458
(1) During the year ended December 30, 2013, the Company converted 26,075 Class “A” Multiple Voting Shares into Class
“B” Subordinate Voting Shares at an average rate of $0.63 per share.
(2) During the six months ended June 30, 2014, the Company realized tax benefits amounting to $15 (year ended December
30, 2013 $865) as a result of stock option transactions. The benefit has been credited to share capital and is therefore not reflected in the current income tax provision.
(3) On May 12, 2014, the Company announced that it had decided to implement a new normal course issuer bid (the “2014 NCIB”). As approved by the TSX, under the 2014 NCIB, the Company is entitled to repurchase for cancellation up to 500,000 Class “B” Subordinate Voting Shares during the period of May 14, 2014 to May 13, 2015, or until such earlier time as the bid is completed or terminated at the option of the Company. Any shares the Company purchases under the 2014 NCIB will be purchased on the open market plus brokerage fees through the facilities of the TSX at the prevailing market price at the time of the transaction. Shares acquired under the 2014 NCIB will be cancelled. In accordance with the 2014 NCIB, the Company did not repurchase any Class “B” Subordinate Voting Shares during the six-months ended June 30, 2014. During the year ended December 30, 2013, in accordance with the its previous normal course issuer bid which ended on May 1, 2014, the Company repurchased a total of 10,000 Class “B” Subordinate Voting Shares for a cash consideration of $321. The excess of the shares’ repurchase value over their carrying amount of $253 was charged to retained earnings as share repurchase premiums.

DOREL INDUSTRIES INC. – CONDENSED CONSOLIDATED INTERIM FINANCIAL STATEMENTS for the second quarter and six months ended June 30, 2014 27
9. Share-based payments
Stock option plan
The Company may grant stock options on the Class "B" Subordinate Voting Shares at the discretion of the Board of Directors, to senior executives and certain key employees. The exercise price is the market price of the securities at the date the options are granted. Options granted vest according to a graded schedule of 25% per year commencing a day after the end of the first year, and expire no later than the year 2018. All options are to be settled by physical delivery of shares. The changes in outstanding stock options are as follows:
Six Months Ended June 30, 2014
Year Ended December 30, 2013
Options Weighted Average Exercise Price
Options Weighted Average Exercise Price
Options outstanding, beginning of period 589,750 $ 23.37 777,250 $ 23.13
Granted (1) – – 114,000 36.49
Exercised (2) (383,500 ) 18.05 (281,625 ) 24.27
Forfeited (14,250 ) 32.20 (19,875 ) 27.56
Options outstanding, end of period 192,000 $ 31.79 589,750 $ 23.37
Total exercisable, end of period 47,500 $ 30.05 401,000 $ 19.23
(1) The weighted average fair value of options granted during the year ended December 30, 2013 was
$7.79. (2) The weighted average share price at the date of exercise for the stock options exercised during the six
months ended June 30, 2014 was $34.54 (year ended December 30, 2013 $38.86).
A summary of options outstanding as of June 30, 2014 is as follows:
Total Outstanding Total Exercisable
Range of Exercise Prices Options
Weighted Average Exercise
Price
Weighted Average
Remaining Contractual
Life
(in years) Options
Weighted Average
Exercise Price
$24.21 - $30.95 65,000 $ 25.61 2.48 30,000 $ 26.41
$33.16 - $38.36 127,000 34.95 3.82 17,500 36.28
192,000 $ 31.79 3.36 47,500 $ 30.05
Total compensation cost recognized in income for employee stock options for the quarter and six months ended
June 30, 2014 amounts to $61 and $255, respectively (2013 $140 and $781, respectively), and was credited to contributed surplus.

DOREL INDUSTRIES INC. – CONDENSED CONSOLIDATED INTERIM FINANCIAL STATEMENTS for the second quarter and six months ended June 30, 2014 28
9. Share-based payments (continued)
Directors’ Deferred Share Unit Plan The Company has a Deferred Share Unit plan under which an external director of the Company may elect annually to have his or her director’s fees and fees for attending meetings of the Board of Directors or committees thereof paid in the form of deferred share units (“DSU’s”). A plan participant may also receive dividend equivalents paid in the form of DSU’s. The changes in outstanding DSU’s are as follows:
Second Quarter Ended
June 30, 2014 Second Quarter Ended
June 30, 2013
Number
of DSU’s
Contributed Surplus Amount
Number
of DSU’s
Contributed Surplus Amount
Balance, beginning of period 115,943 $ 3,455 108,939 $ 3,091
Issued for fees forfeited 3,726 131 5,220 187
Issued for dividend equivalents 929 36 765 31
Settlement of deferred share units (1) – – (7,994 ) (215 )
Balance, end of period 120,598 $ 3,622 106,930 $ 3,094
(1) During the second quarter ended June 30, 2013, 7,994 DSU’s were settled for which $215 was debited to
contributed surplus and $194 credited to share capital; the difference representing the withholding taxes the Company was required by law to withhold upon settlement.
Six Months Ended
June 30, 2014 Six Months Ended
June 30, 2013
Number
of DSU’s
Contributed Surplus Amount
Number
of DSU’s
Contributed Surplus Amount
Balance, beginning of period 116,160 $ 3,433 105,427 $ 2,953
Issued for fees forfeited 7,174 251 7,910 295
Issued for dividend equivalents 1,941 69 1,587 61
Settlement of deferred share units (1) (4,677 ) (131 ) (7,994 ) (215 )
Balance, end of period 120,598 $ 3,622 106,930 $ 3,094
(1) During the six months ended June 30, 2014, 4,677 DSU’s (2013 – 7,994) were settled for which $131
(2013 – $215) was debited to contributed surplus and $122 (2013 – $194) credited to share capital; the difference representing the withholding taxes the Company was required by law to withhold upon settlement.

DOREL INDUSTRIES INC. – CONDENSED CONSOLIDATED INTERIM FINANCIAL STATEMENTS for the second quarter and six months ended June 30, 2014 29
9. Share-based payments (continued)
Executive Deferred Share Unit Plan The Company has an Executive Deferred Share Unit plan under which executive officers of the Company may elect annually to have a portion of their annual salary and bonus paid in the form of deferred share units (“DSU’s”). A plan participant may also receive dividend equivalents paid in the form of DSU’s.
The changes in outstanding DSU’s are as follows:
Second Quarter Ended
June 30, 2014 Second Quarter Ended
June 30, 2013
Number
of DSU’s
Contributed Surplus Amount
Number
of DSU’s
Contributed Surplus Amount
Balance, beginning of period 58,711 $ 1,569 49,470 $ 1,199
Issued for salaries and bonus paid 4,265 144 7,370 305
Issued for dividend equivalents 385 14 427 17
Settlement of deferred share units (1) (4,114 ) (102 ) – –
Balance, end of period 59,247 $ 1,625 57,267 $ 1,521
(1) During the second quarter ended June 30, 2014, 4,114 DSU’s were settled for which $102 was debited to
contributed surplus and $33 credited to share capital; the difference representing the withholding taxes the Company was required by law to withhold upon settlement.
Six Months Ended
June 30, 2014 Six Months Ended
June 30, 2013
Number
of DSU’s
Contributed Surplus Amount
Number
of DSU’s
Contributed Surplus Amount
Balance, beginning of period 58,286 $ 1,555 55,320 $ 1,316
Issued for salaries and bonus paid 4,265 144 7,370 305
Issued for dividend equivalents 810 28 839 32
Settlement of deferred share units (1) (4,114 ) (102 ) (6,262 ) (132 )
Balance, end of period 59,247 $ 1,625 57,267 $ 1,521
(1) During the six months ended June 30, 2014, 4,114 DSU’s (2013 – 6,262) were settled for which $102
(2013 – $132) was debited to contributed surplus and $33 (2013 – $33) credited to share capital; the difference representing the withholding taxes the Company was required by law to withhold upon settlement.

DOREL INDUSTRIES INC. – CONDENSED CONSOLIDATED INTERIM FINANCIAL STATEMENTS for the second quarter and six months ended June 30, 2014 30
9. Share-based payments (continued)
Share Appreciation Rights (cash-settled) The Company implemented a share appreciation rights (SAR’s) plan for senior executives and certain key employees that entitle them to a cash payment based on the increase in the share price of the Company’s Class “B” Subordinate Voting Shares from the grant date to the vesting date. The vesting date share price is calculated using the weighted average trading price during the five trading days commencing two business days after the day the Company issues a press release announcing its financial results for its most recently-completed fiscal year. The SAR’s vest based on service conditions and are not subject to performance conditions. A liability is recognized for the services acquired and is recorded at the fair value of the SAR’s determined by applying the Black-Scholes pricing model in other long-term liabilities, except for the current portion recorded in trade and other payables, with a corresponding expense recognized in employee benefits expense within general and administrative expenses, over the period that the employees become unconditionally entitled to the payment. At the end of each reporting period until the liability is settled, the fair value of the liability is remeasured, with any changes in fair value recognized in the condensed consolidated interim income statement for the period. On June 25, 2014, the Company granted 359,516 SAR’s (2013 – 0). The SAR’s granted on June 25, 2014, vest according to a grading schedule of 10% the first year, 20% the second year, 30% the third year and 40% the fourth year. The weighted average share price at the date the SAR’s were granted on June 25, 2014 was $36.35. As at June 30, 2014, none of the outstanding SAR’s were vested. The employee benefits expense included in general and administrative expenses for SAR’s for the quarter and six months ended June 30, 2014 amounts to nil (2013 – $0). Performance Share Units (cash-settled) The Company implemented a performance share unit (PSU’s) plan for senior executives and certain key employees that entitle them to a cash payment. The PSU’s vest based on non-market performance conditions. The number of PSU’s that can vest can be up to 1.5 times the actual number of PSU’s awarded if exceptional financial performance is achieved. Upon settlement of the vested PSU’s, the cash payment will be equal to the number of PSU’s multiplied by the fair market value of the Company’s Class “B” Subordinate Voting Shares calculated using the weighted average trading price during the five trading days commencing two business days after the day the Company issues a press release announcing its financial results for its most recently-completed fiscal year. A plan participant may also receive dividend equivalents paid in the form of PSU’s. The number of PSU’s received for dividend equivalents is determined by dividing the amount of the dividend to be paid on payment date by the fair market value of the Company’s Class “B” Subordinate Voting Shares on that day. The fair market value of the Company’s Class “B” Subordinate Voting Shares is equal to their weighted average trading price during the five trading days preceding the date on which the dividends are payable. A liability is recognized for the services acquired and is recorded at fair value based on the share price of the Company’s Class “B” Subordinate Voting Shares in other long-term liabilities, except for the current portion recorded in trade and other payables, with a corresponding expense recognized in employee benefits expense within general and administrative expenses. The amount recognized as an expense is adjusted to reflect the number of units for which the related service and performance conditions are expected to be met, such that the amount ultimately recognized as an expense is based on the units of awards that do meet the related service and non-market performance conditions at the vesting date. At the end of each reporting period until the liability is settled, the fair value of the liability is remeasured, with any changes in fair value recognized in the condensed consolidated interim income statement for the period. On June 25, 2014, the Company granted 105,056 PSU’s (2013 – 0). The PSU’s granted on June 25, 2014, vest according to a grading schedule of 20% at the end of the first year, 30% at the end of the second year and 50% at the end of the third year and have performance vesting conditions. As at June 30, 2014, none of the outstanding PSU’s were vested The employee benefits expense included in general and administrative expenses for PSU’s for the quarter and six months ended June 30, 2014 amounts to $592 (2013 – $0) for which recognized amounts as at June 30, 2014 of $255 (2013 – $0) are included in trade and other payables and $337 (2013 – $0) in other long-term liabilities, based on a share price of $36.12.

DOREL INDUSTRIES INC. – CONDENSED CONSOLIDATED INTERIM FINANCIAL STATEMENTS for the second quarter and six months ended June 30, 2014 31
10. Shares outstanding
The following table provides a reconciliation between the number of basic and fully diluted shares outstanding:
Second Quarters Ended
June 30, Six Months Ended
June 30,
2014 2013 2014 2013
Weighted daily average number of Class “A” Multiple and Class “B” Subordinate Voting Shares 32,297,064 31,865,525 32,117,648 31,765,123
Dilutive effect of stock options 14,481 196,982 89,412 224,689
Dilutive effect of deferred share units 177,249 161,303 177,147 162,473
Weighted average number of diluted shares 32,488,794 32,223,810 32,384,207 32,152,285
Number of anti-dilutive stock options and deferred share units excluded from fully diluted earnings per share calculation 122,000 50,000 122,000 81,000
11. Finance expenses and other information
a) Finance expenses
Finance expenses consist of the following:
Second Quarters Ended
June 30, Six Months Ended
June 30,
2014 2013 2014 2013
Interest on long-term debt – including effect of cash flow hedge related to the interest rate swaps $ 6,126 $ 3,535 $ 10,994 $ 7,040
Accretion expense on put option liabilities 1,452 578 3,797 1,172
Amortization of deferred financing costs 206 98 383 190
Other interest 2,447 1,374 4,336 1,665
$ 10,231 $ 5,585 $ 19,510 $ 10,067
b) Cost of inventories and write-down of inventories included in the condensed consolidated interim income statements:
Second Quarters Ended
June 30, Six Months Ended
June 30,
2014 2013 2014 2013
Included in cost of sales:
Cost of inventories recognized as an expense $ 473,009 $ 457,884 $ 948,027 $ 892,086
Write down of inventories as a result of net realizable value being lower than cost $ 1,718 $ 1,899 $ 2,784 $ 3,438

DOREL INDUSTRIES INC. – CONDENSED CONSOLIDATED INTERIM FINANCIAL STATEMENTS for the second quarter and six months ended June 30, 2014 32
11. Finance expenses and other information (continued)
c) Income taxes: The second quarter and six months ended June 30, 2014 tax rates were 20.2% and 18.1%, respectively (2013
21.1% and $14.3%, respectively). The main causes of the variations year-over-year are changes in the jurisdictions in which the Company generated its income and the increase in the fair value adjustments related to the put option liabilities which are non-deductible for tax purposes.
12. Statement of cash flows
Acquiring a long-lived asset by incurring a liability does not result in a cash outflow for the Company until the liability is paid. As such, the condensed consolidated interim statements of cash flows exclude the following non-cash transactions:
June 30,
2014 2013
Acquisition of property, plant and equipment financed by trade and other payables $ 1,355 $ 1,240
Acquisition of intangible assets financed by trade and other payables $ 517 $ 89
Net changes in balances related to operations are as follows:
Second Quarters Ended
June 30, Six Months Ended
June 30,
2014 2013 2014 2013
Trade and other receivables $ 32,227 $ 41,435 $ (11,329 ) $ (3,979 )
Inventories (16,705 ) 9,717 (31,616 ) (13,312 )
Other financial assets 6 (12 ) (177 ) 24
Prepaid expenses 1,111 (310 ) (6,503 ) (9,552 )
Other assets 1,920 21 1,072 (1,293 )
Trade and other payables (31,678 ) (13,668 ) (6,667 ) 3,450
Net pension and post-retirement defined benefit liabilities (548 ) (499 ) (2,152 ) (1,733 )
Provisions, other financial liabilities and other long-term liabilities (7,843 ) (900 ) (6,478 ) (2,701 )
Total $ (21,510 ) $ 35,784 $ (63,850 ) $ 29,096 )

DOREL INDUSTRIES INC. – CONDENSED CONSOLIDATED INTERIM FINANCIAL STATEMENTS for the second quarter and six months ended June 30, 2014 33
12. Statement of cash flows (continued)
Details of business acquisitions:
Second Quarters Ended
June 30, Six Months Ended
June 30,
2014 2013 2014 2013
Acquisition of businesses (Note 5) $ (7,018 ) $ – $ (63,585 ) $ –
Cash acquired – – 7,789 –
(7,018 ) – (55,796 ) –
Balance of sale payable (paid) 586 – 1,203 –
Total $ (6,432 ) $ – $ (54,593 ) $ –
The components of cash and cash equivalents are:
June 30,
2014 December 30,
2013
Cash $ 38,146 $ 34,029
Short-term investments 2,712 6,045
Cash and cash equivalents $ 40,858 $ 40,074
13. Segmented information
Industry Segments
Second Quarters Ended June 30,
Total Juvenile Recreational / Leisure Home Furnishings
2014 2013 2014 2013 2014 2013 2014 2013
Total revenue $ 655,831 $ 600,449 $ 251,322 $ 243,412 $ 286,249 $ 238,174 $ 118,260 $ 118,863
Cost of sales (Note 4) 499,894 459,993 178,545 174,651 218,901 183,624 102,448 101,718
Gross profit 155,937 140,456 72,777 68,761 67,348 54,550 15,812 17,145
Selling expenses 61,142 61,804 28,761 27,384 28,300 30,319 4,081 4,101
General and administrative expenses 50,009 42,313 23,682 20,486 20,831 16,900 5,496 4,927
Research and development expenses 6,945 7,696 4,171 5,080 1,793 1,700 981 916
Restructuring
costs (Note 4) 1,212 1,950 – – 1,212 1,950 – –
Operating profit 36,629 26,693 16,163 15,811 15,212 3,681 5,254 7,201
Finance expenses 10,231 5,585
Corporate expenses 7,357 4,339
Income taxes 3,841 3,545
Net income $ 15,200 $ 13,224
Depreciation and amortization included in operating profit $ 14,646 $ 13,913 $ 10,097 $ 10,163 $ 3,522 $ 2,708 $ 1,027 $ 1,042

DOREL INDUSTRIES INC. – CONDENSED CONSOLIDATED INTERIM FINANCIAL STATEMENTS for the second quarter and six months ended June 30, 2014 34
13. Segmented information (continued)
Six Months Ended June 30,
Total Juvenile Recreational / Leisure Home Furnishings
2014 2013 2014 2013 2014 2013 2014 2013
Total revenue $ 1,303,532 $ 1,194,617 $ 520,554 $ 498,645 $ 526,597 $ 441,688 $ 256,381 $ 254,284
Cost of sales (Note 4) 992,647 910,286 371,363 355,378 398,807 335,849 222,477 219,059
Gross profit 310,885 284,331 149,191 143,267 127,790 105,839 33,904 35,225
Selling expenses 117,133 116,527 57,714 54,817 51,308 53,757 8,111 7,953
General and administrative expenses 95,983 88,841 45,214 44,845 40,191 33,615 10,578 10,381
Research and development expenses 15,696 14,899 10,520 9,862 3,285 3,295 1,891 1,742
Restructuring costs (Note 4) 1,483 1,950 – – 1,483 1,950 – –
Operating profit 80,590 62,114 35,743 33,743 31,523 13,222 13,324 15,149
Finance expenses 19,510 10,067
Corporate expenses 12,221 10,582
Income taxes 8,859 5,925
Net income $ 40,000 $ 35,540
Depreciation and amortization included in operating profit $ 29,625 $ 26,994 $ 20,597 $ 19,816 $ 6,868 $ 5,036 $ 2,160 $ 2,142
Geographic Segments – Origin of Revenues
Second Quarters Ended
June 30, Six Months Ended
June 30,
2014 2013 2014 2013
Canada $ 56,930 $ 63,025 $ 120,983 $ 135,416
United States 335,809 321,746 658,189 623,245
Europe 167,513 155,999 344,876 320,848
Latin America 56,275 33,477 109,367 63,350
Other countries 39,304 26,202 70,117 51,758
Total $ 655,831 $ 600,449 $ 1,303,532 $ 1,194,617
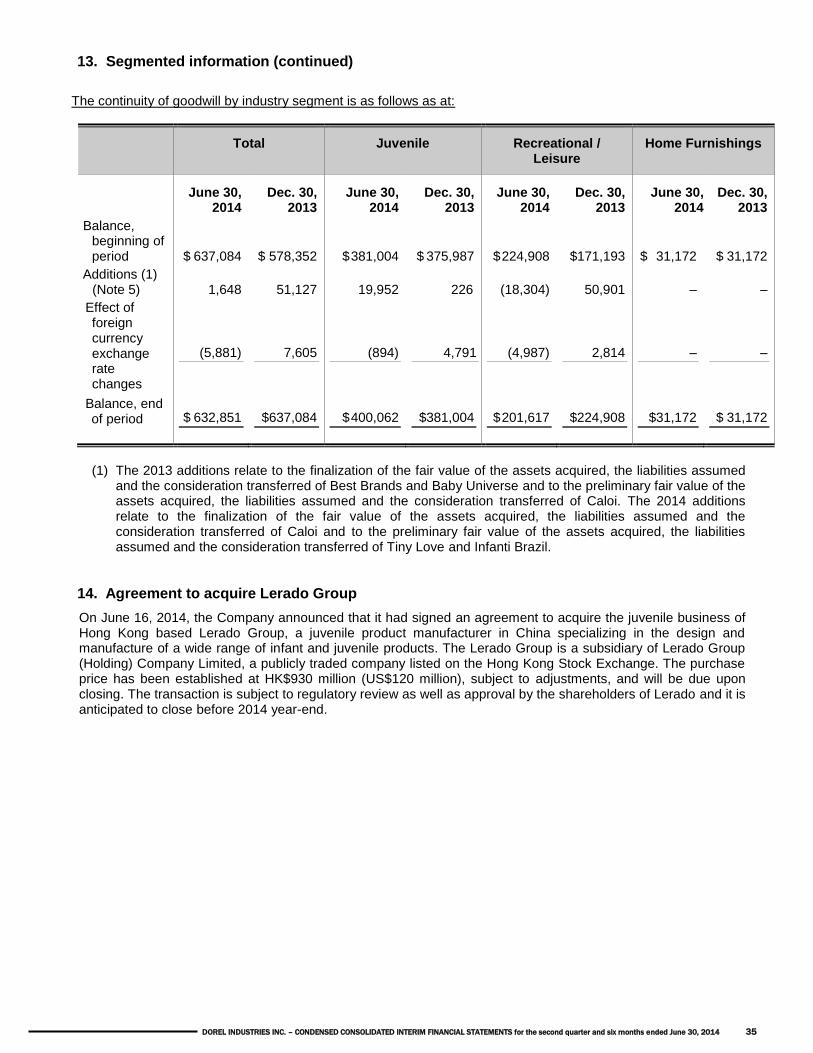
DOREL INDUSTRIES INC. – CONDENSED CONSOLIDATED INTERIM FINANCIAL STATEMENTS for the second quarter and six months ended June 30, 2014 35
13. Segmented information (continued)
The continuity of goodwill by industry segment is as follows as at:
Total Juvenile Recreational / Leisure
Home Furnishings
June 30,
2014 Dec. 30,
2013 June 30,
2014 Dec. 30,
2013 June 30,
2014 Dec. 30,
2013 June 30,
2014 Dec. 30,
2013
Balance, beginning of period
$ 637,084
$ 578,352
$ 381,004
$ 375,987
$ 224,908
$171,193
$ 31,172
$ 31,172
Additions (1) (Note 5) 1,648 51,127 19,952 226 (18,304) 50,901 – –
Effect of foreign currency exchange rate changes
(5,881)
7,605
(894)
4,791
(4,987)
2,814
–
–
Balance, end of period
$ 632,851
$637,084
$ 400,062
$381,004
$ 201,617
$224,908
$31,172
$ 31,172
(1) The 2013 additions relate to the finalization of the fair value of the assets acquired, the liabilities assumed
and the consideration transferred of Best Brands and Baby Universe and to the preliminary fair value of the assets acquired, the liabilities assumed and the consideration transferred of Caloi. The 2014 additions relate to the finalization of the fair value of the assets acquired, the liabilities assumed and the consideration transferred of Caloi and to the preliminary fair value of the assets acquired, the liabilities assumed and the consideration transferred of Tiny Love and Infanti Brazil.
14. Agreement to acquire Lerado Group
On June 16, 2014, the Company announced that it had signed an agreement to acquire the juvenile business of Hong Kong based Lerado Group, a juvenile product manufacturer in China specializing in the design and manufacture of a wide range of infant and juvenile products. The Lerado Group is a subsidiary of Lerado Group (Holding) Company Limited, a publicly traded company listed on the Hong Kong Stock Exchange. The purchase price has been established at HK$930 million (US$120 million), subject to adjustments, and will be due upon closing. The transaction is subject to regulatory review as well as approval by the shareholders of Lerado and it is anticipated to close before 2014 year-end.


![[10.3] Tangents](https://img.pdfslide.net/doc/110x75/56816216550346895dd241dd/103-tangents.jpg)