Embed Size (px)
Citation preview

Sumeet Subherwal, Richard G. Bach, Anita Y. Chen, Brian F. Gage, Sumeet Subherwal, Richard G. Bach, Anita Y. Chen, Brian F. Gage, Sunil V. Rao, Tracy Y. Wang, W. Brian Gibler, E. Magnus Ohman, Sunil V. Rao, Tracy Y. Wang, W. Brian Gibler, E. Magnus Ohman, Matthew T. Roe, Eric D. Peterson, Karen P. Alexander Matthew T. Roe, Eric D. Peterson, Karen P. Alexander
Sumeet Subherwal, Richard G. Bach, Anita Y. Chen, Brian F. Gage, Sumeet Subherwal, Richard G. Bach, Anita Y. Chen, Brian F. Gage, Sunil V. Rao, Tracy Y. Wang, W. Brian Gibler, E. Magnus Ohman, Sunil V. Rao, Tracy Y. Wang, W. Brian Gibler, E. Magnus Ohman, Matthew T. Roe, Eric D. Peterson, Karen P. Alexander Matthew T. Roe, Eric D. Peterson, Karen P. Alexander
The CRUSADE Bleeding Score to Assess Baseline Risk of Major Bleeding in Non–ST-
Segment Elevation Myocardial Infarction
The CRUSADE Bleeding Score to Assess Baseline Risk of Major Bleeding in Non–ST-
Segment Elevation Myocardial Infarction

Sumeet Subherwal, MD,Sumeet Subherwal, MD,11 Richard G. Bach, MD, Richard G. Bach, MD,11 Anita Y. Chen, MS,Anita Y. Chen, MS,11 Brian F. Gage, MD, MSc, Brian F. Gage, MD, MSc,11 Sunil V. Rao, MD, Sunil V. Rao, MD,11 Tracy Y. Wang, MS,Tracy Y. Wang, MS,11 W. Brian Gibler, MD, W. Brian Gibler, MD,22 E. Magnus Ohman, MD, E. Magnus Ohman, MD,22 Matthew T. Roe, MD, MHS,Matthew T. Roe, MD, MHS,22 Eric D. Peterson, MD, MPH, Eric D. Peterson, MD, MPH,33 Karen P. Alexander, MD,Karen P. Alexander, MD,44
1No relationships to disclose
2Research grants from Bristol-Myers Squibb/Sanofi Pharmaceuticals Partnership and Schering Corporation
3Research grants from Bristol-Myers Squibb, Bristol-Myers Squibb/Sanofi Pharmaceuticals Partnership; Bristol-Myers Squibb/Merck and Bristol-Myers Squibb/Merck
4Research grants from CV Therapeutics, Honoraria from Schering Plough and Pfizer
Author DisclosureAuthor Disclosure

Treatment with antithrombotics and catheter-based Treatment with antithrombotics and catheter-based interventions reduces ischemic events in patients with interventions reduces ischemic events in patients with nonnon––ST-segment elevation myocardial infarction ST-segment elevation myocardial infarction (NSTEMI) but at an increased risk of major bleeding(NSTEMI) but at an increased risk of major bleeding
Major bleeding is associated with worse clinical outcomesMajor bleeding is associated with worse clinical outcomes
Given the impact of both safety (bleeding) and efficacy Given the impact of both safety (bleeding) and efficacy (ischemia) on patient outcomes, global risk stratification (ischemia) on patient outcomes, global risk stratification may enhance patient managementmay enhance patient management
BackgroundBackground

Validated risk stratification tools predict baseline risk of Validated risk stratification tools predict baseline risk of ischemic eventsischemic events TIMI, PURSUIT, GRACE ACS Risk ScoreTIMI, PURSUIT, GRACE ACS Risk Score
Current estimation of baseline risk of bleeding in Current estimation of baseline risk of bleeding in NSTEMI is difficult because existing risk stratification NSTEMI is difficult because existing risk stratification tools: tools: include treatment variables (i.e. antithrombotics or include treatment variables (i.e. antithrombotics or
invasive procedures) invasive procedures) derived from highly selected patient populationsderived from highly selected patient populations
BackgroundBackground

To develop and validate a risk prediction tool for estimation of baseline risk of in-hospital major bleeding in patients with NSTEMI.
To develop and validate a risk prediction tool for estimation of baseline risk of in-hospital major bleeding in patients with NSTEMI.
PurposePurpose

CRUSADE Quality Improvement Initiative February 15, 2003 to December 31, 2006 n=89,134 NSTEMI patients at 485 US hospitals
•Excluded unstable angina, home warfarin, transfer out, deaths within 48 hours
In-hospital Major Bleeding Absolute HCT drop of ≥ 12% (Baseline HCT - Nadir HCT
≥ 12%) Intracranial hemorrhage Witnessed retroperitoneal bleed RBC transfusion when Baseline HCT ≥ 28% RBC transfusion when Baseline HCT < 28% with
witnessed bleed Major bleeding censored at time of CABG
MethodsMethods
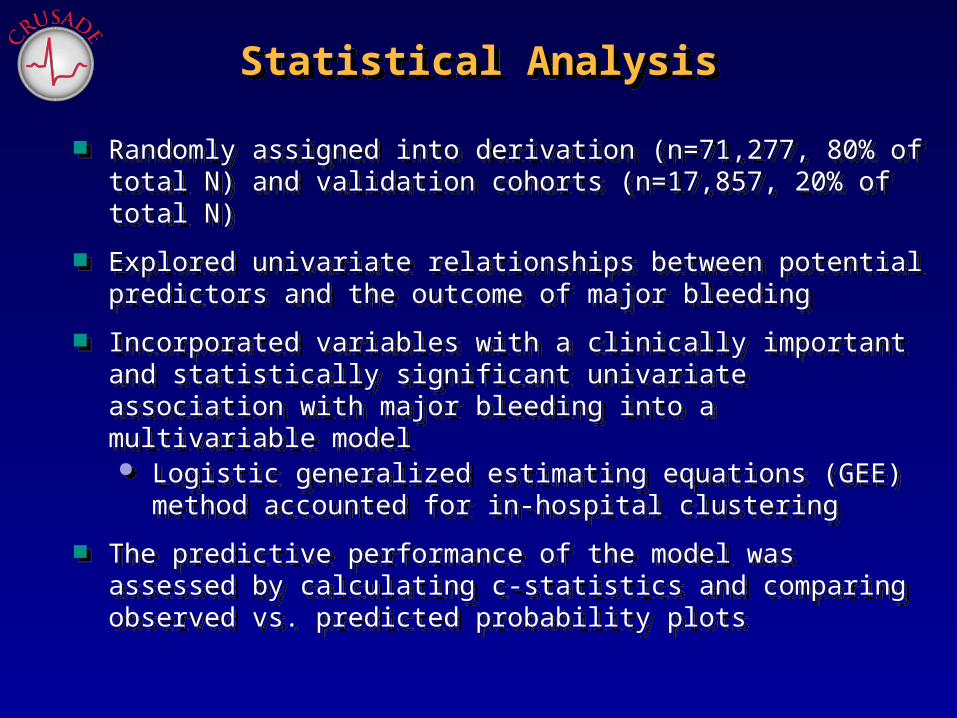
Randomly assigned into derivation (n=71,277, 80% of total N) and validation cohorts (n=17,857, 20% of total N)
Explored univariate relationships between potential predictors and the outcome of major bleeding
Incorporated variables with a clinically important and statistically significant univariate association with major bleeding into a multivariable model Logistic generalized estimating equations (GEE) method
accounted for in-hospital clustering
The predictive performance of the model was assessed by calculating c-statistics and comparing observed vs. predicted probability plots
Statistical AnalysisStatistical Analysis

VariableDerivation Cohort
(N = 71,277)Validation Cohort
(N = 17,857) Age (years)* 67.0 (56.0, 79.0) 67.0 (56.0, 79.0)
Male 60.2% 60.3%
Family history of CAD 33.9% 33.9%
History of hypertension 70.5% 70.6%
Diabetes mellitus 32.7% 32.5%
Prior vascular disease† 18.4% 18.1%
Current/recent smoker 28.4% 27.8%
Hyperlipidemia 52.0% 51.7%
Prior myocardial infarction 28.1% 27.9%
Prior CABG 18.2% 18.5%
Baseline HCT (%)* 40.7 (36.5, 44.2) 40.7 (36.6, 44.1)
CrCl (mL/min)*‡ 70.3 (43,8, 101.9) 70.8 (44.0, 102.0)
In-Hospital Events
Death > 48 hrs 2.7% 2.6%
Major bleeding 9.4% 9.6%
*Median (25th, 75th percentile)†Prior vascular disease defined as h/o stroke or peripheral arterial disease‡ Creatinine clearance as estimated by Cockcroft-Gault Formula
Baseline CharacteristicsBaseline Characteristics
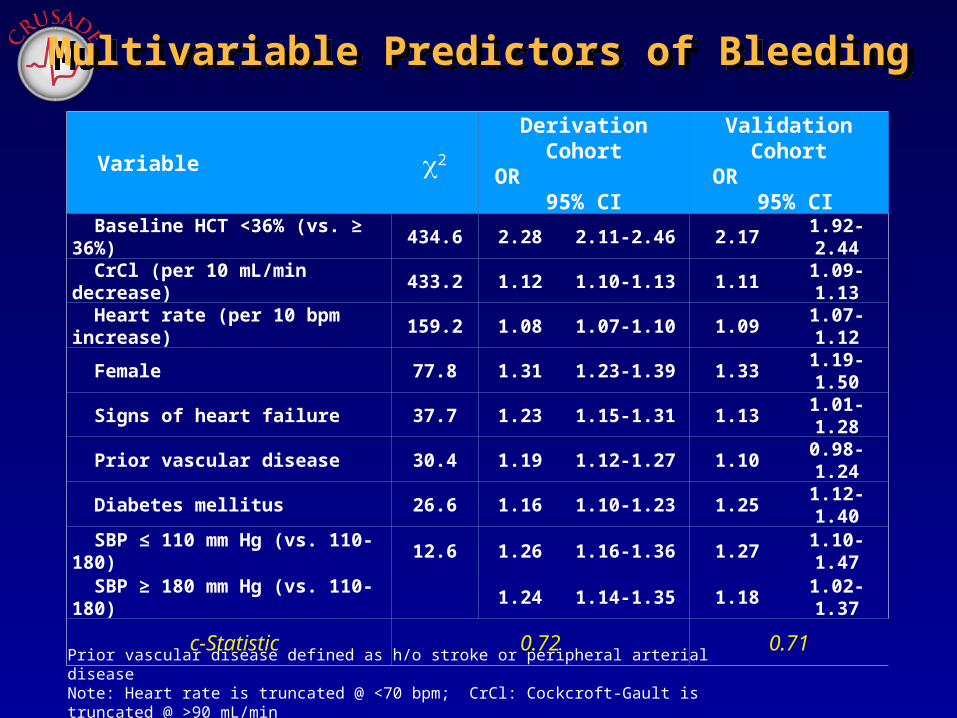
Prior vascular disease defined as h/o stroke or peripheral arterial diseaseNote: Heart rate is truncated @ <70 bpm; CrCl: Cockcroft-Gault is truncated @ >90 mL/min
Variable 2 Derivation CohortOR 95% CI
Validation Cohort OR 95% CI
Baseline HCT <36% (vs. ≥ 36%) 434.6 2.28 2.11-2.46 2.17 1.92-2.44
CrCl (per 10 mL/min decrease) 433.2 1.12 1.10-1.13 1.11 1.09-1.13
Heart rate (per 10 bpm increase) 159.2 1.08 1.07-1.10 1.09 1.07-1.12
Female 77.8 1.31 1.23-1.39 1.33 1.19-1.50
Signs of heart failure 37.7 1.23 1.15-1.31 1.13 1.01-1.28
Prior vascular disease 30.4 1.19 1.12-1.27 1.10 0.98-1.24
Diabetes mellitus 26.6 1.16 1.10-1.23 1.25 1.12-1.40
SBP ≤ 110 mm Hg (vs. 110-180) 12.6 1.26 1.16-1.36 1.27 1.10-1.47
SBP ≥ 180 mm Hg (vs. 110-180) 1.24 1.14-1.35 1.18 1.02-1.37
c-Statistic 0.72 0.71
Multivariable Predictors of BleedingMultivariable Predictors of Bleeding
CRUSADE Bleeding ScoreCRUSADE Bleeding ScoreCRUSADE Bleeding ScoreCRUSADE Bleeding Score
The CRUSADE Bleeding Score was developed by assigning a weighted integer to each independent predictor based on the predictor’s coefficient in the reduced regression model
The CRUSADE Bleeding Score equals the sum of the weighted integers for the independent predictors Range 1-100 points
The CRUSADE Bleeding Score was developed by assigning a weighted integer to each independent predictor based on the predictor’s coefficient in the reduced regression model
The CRUSADE Bleeding Score equals the sum of the weighted integers for the independent predictors Range 1-100 points

CRUSADE Bleeding Score NomogramScore NomogramCRUSADE Bleeding Score NomogramScore Nomogram
Note: Heart rate is truncated @ <70 bpm; CrCl: Cockcroft-Gault is truncated @ >90 mL/min; Prior Vascular disease is defined as prior PAD or stroke
PredictorPredictor RangeRange ScoreScoreBaseline Hematocrit (%) < 31
31-33.934-36.937-39.9
≥ 40
97320
Creatinine Clearance (mL/min) ≤ 15>15-30>30-60>60-90
>90-120>120
3935281770
Heart rate (bpm) ≤ 7071-8081-90
91-100101-110111-120≥ 121
01368
1011
Sex MaleFemale
08
Signs of CHF at presentation NoYes
07
Prior Vascular Disease NoYes
06
Diabetes Mellitus NoYes
06
Systolic blood pressure (mm Hg) ≤ 9091-100
101-120121-180181-200≥ 201
1085135

Risk of Major Bleeding Across the Risk of Major Bleeding Across the Spectrum of CRUSADE Bleeding ScoreSpectrum of CRUSADE Bleeding Score
p<0.001 for trend; Derivation: C=0.71 Validation: C=0.70

Risk QuintilesRisk Quintiles
Patients were categorized into quintiles of risk Patients were categorized into quintiles of risk groups based on their CRUSADE Bleeding groups based on their CRUSADE Bleeding ScoreScore
Patients were categorized into quintiles of risk Patients were categorized into quintiles of risk groups based on their CRUSADE Bleeding groups based on their CRUSADE Bleeding ScoreScore
Risk N Min Score Max Score Bleeding
Very low 19,486 1 20 3.1%
Low 12,545 21 30 5.5%
Moderate 11,530 31 40 8.6%
High 10,961 41 50 11.9%
Very High 15,210 51 91 19.5%

Subgroup AnalysisSubgroup Analysis
Performance of the Bleeding Score was tested across four Performance of the Bleeding Score was tested across four treatment subgroups in the derivation cohort defined by in-treatment subgroups in the derivation cohort defined by in-hospital antithrombotics and invasive care: hospital antithrombotics and invasive care:
1.1. ≥≥2 Antithrombotic medications (anti-platelet [aspirin or 2 Antithrombotic medications (anti-platelet [aspirin or clopidogrel], anti-coagulant, or GP IIb/IIIa inhibitors) clopidogrel], anti-coagulant, or GP IIb/IIIa inhibitors) (n=50,969)(n=50,969)
2.2. <2 Antithrombotic medications (anti-platelet, anti-coagulant, or <2 Antithrombotic medications (anti-platelet, anti-coagulant, or GP IIb/IIIa inhibitors) (n=5,931)GP IIb/IIIa inhibitors) (n=5,931)
3.3. Cardiac catheterization (n=52,048)Cardiac catheterization (n=52,048)
4.4. No cardiac catheterization (n=6,407)No cardiac catheterization (n=6,407)

1.93.1 2.6
5.5 5.3
8.46.7
12.0
19.9
13.5
p<0.001 testing for trend
Rate of Major Bleeding in <2 Antithrombotics Rate of Major Bleeding in <2 Antithrombotics vs. 2 or more Antithromboticsvs. 2 or more Antithrombotics
Note: Anti-thrombotic defined as (anti-platelet [aspirin or clopidgorel], anti-coagulant, or GP IIb/IIIa inhibitors)
Risk Of Bleeding
0
5
10
15
20
25
Maj
or
Ble
edin
g (
%)
Very Low Low Moderate High Very High
<2 Antithrombotics 2 or more Antithrombotics

2.6 3.14.6 5.5
7.2
13.3
23.1
15.1
6.6
8.7
Rate of Major Bleeding in Catheterization vs. Rate of Major Bleeding in Catheterization vs. No CatheterizationNo Catheterization
p<0.001 testing for trend
Risk Of Bleeding
0
5
10
15
20
25
Maj
or
Ble
edin
g )
%)
Very Low Low Moderate High Very High
No Catheterization Catheterization

LimitationsLimitations
Only baseline factors were considered in development of Only baseline factors were considered in development of the CRUSADE Bleeding Scorethe CRUSADE Bleeding Score
C-index would have been higher if we included post C-index would have been higher if we included post admission treatments and their contribution to riskadmission treatments and their contribution to risk
History of prior bleeding or bleeding diathesis was not History of prior bleeding or bleeding diathesis was not collectedcollected
Did not capture bleeding events:Did not capture bleeding events: Excluded patients that died within 48 hoursExcluded patients that died within 48 hours Censored bleeding at the time of CABGCensored bleeding at the time of CABG


ConclusionConclusion
The CRUSADE Bleeding Score combines 8 predictors The CRUSADE Bleeding Score combines 8 predictors of major bleeding into a simple validated prediction tool of major bleeding into a simple validated prediction tool that estimates baseline risk of in-hospital major bleeding that estimates baseline risk of in-hospital major bleeding in patients with NSTEMI in patients with NSTEMI
Preserved discrimination across treatment subgroupsPreserved discrimination across treatment subgroups
Complements ischemic risk prediction tools to Complements ischemic risk prediction tools to better better enable clinicians to consider all the potential adverse enable clinicians to consider all the potential adverse outcomes in patients with NSTEMI prior to initiation of outcomes in patients with NSTEMI prior to initiation of therapytherapy


![Contents · PDF filecomplexing agents, like inorganic anions (fluoride and phosphates) or ... and solubility product of amorphous and crystalline aluminium hydroxide [Ohman 1988]](https://img.pdfslide.net/doc/110x75/5a9995067f8b9a30358d9c00/contents-agents-like-inorganic-anions-fluoride-and-phosphates-or-and-solubility.jpg)