Embed Size (px)
Citation preview
Summary of Sea Education Association Long-term Sargasso Sea Surface Net DataAmy N.S. Siuda
Number 0 Sargasso Sea Alliance Science Report Series
When referenced this report should be referred to as:
Siuda, A.N.S. 2011. Summary of Sea Education Association Long-Term Sargasso Sea Surface Net Data. Sargasso Sea Alliance Science Report Series, No 10, 18 pp. ISBN 978-0-9897520 9-6.
The Sargasso Sea Alliance is led by the Bermuda Government and aims to promote international awareness of the importance of the Sargasso Sea and to mobilise support from a wide variety of national and international organisations, governments, donors and users for protection measures for the Sargasso Sea.
Further details:
Dr David Freestone, Executive Director, Sargasso Sea Alliance, Suite 300, 1630 Connecticut Avenue NW, Washington D.C., 20009, USA. Email: [email protected]
Kate K. Morrison, Deputy Director, at the same address Email: [email protected]
The Secretariat of the Sargasso Sea Alliance is hosted by the Washington D.C. Office of the International Union for the Conservation of Nature (IUCN).
Website is www.sargassoalliance.org
This case is being produced with generous support of donors to the Sargasso Sea Alliance: Ricardo Cisneros, Erik H. Gordon, JM Kaplan Fund, Richard Rockefeller, David E. Shaw, and the Waitt Foundation. Additional support provided by: WWF Sweden and the Pew Environment Group.
COVER PHOTO: SEA Neuston Tow, Amy Siuda.
ISBN 978-0-9897520 9-6
Summary of Sea Education Association Long-Term Sargasso Sea Surface Net DataAmy N.S. SiudaAssociate Professor / Chief Scientist Sea Education AssociationWoods Hole, MA
2Sargasso Sea All iance – Sea Education Association Surface Net Data
Foreword
B ETWEEN 2010 AND 2012 a large number of authors from seven different countries and
26 separate organisations developed a scientific case to establish the global importance
of the Sargasso Sea. A summary of this international study was published in 2012 as the
“Summary science and Supporting Evidence Case.” Nine reasons why the Sargasso Sea is
important are identified in the summary. Compiling the science and evidence for this case
was a significant undertaking and during that process a number of reports were specially
commissioned by the Sargasso Sea Alliance to summarise our knowledge of various aspects
of the Sargasso Sea.
This report is one of these commissioned reports. These are now being made available
in the Sargasso Sea Alliance Science Series to provide further details of the research and
evidence used in the compilation of the summary case. A full list of the reports in this series
can be found in the inside back cover of this report. All of them can be downloaded from
www.sargassoalliance.org.
Professor Howard Roe Science Advisory Committee Chair Sargasso Sea Alliance
Professor Dan Laffoley Science Coordinator Sargasso Sea Alliance
3Sargasso Sea All iance – Sea Education Association Surface Net Data
Summary of Sea Education Association Long-Term Sargasso Sea Surface Net Data
Dataset Summary
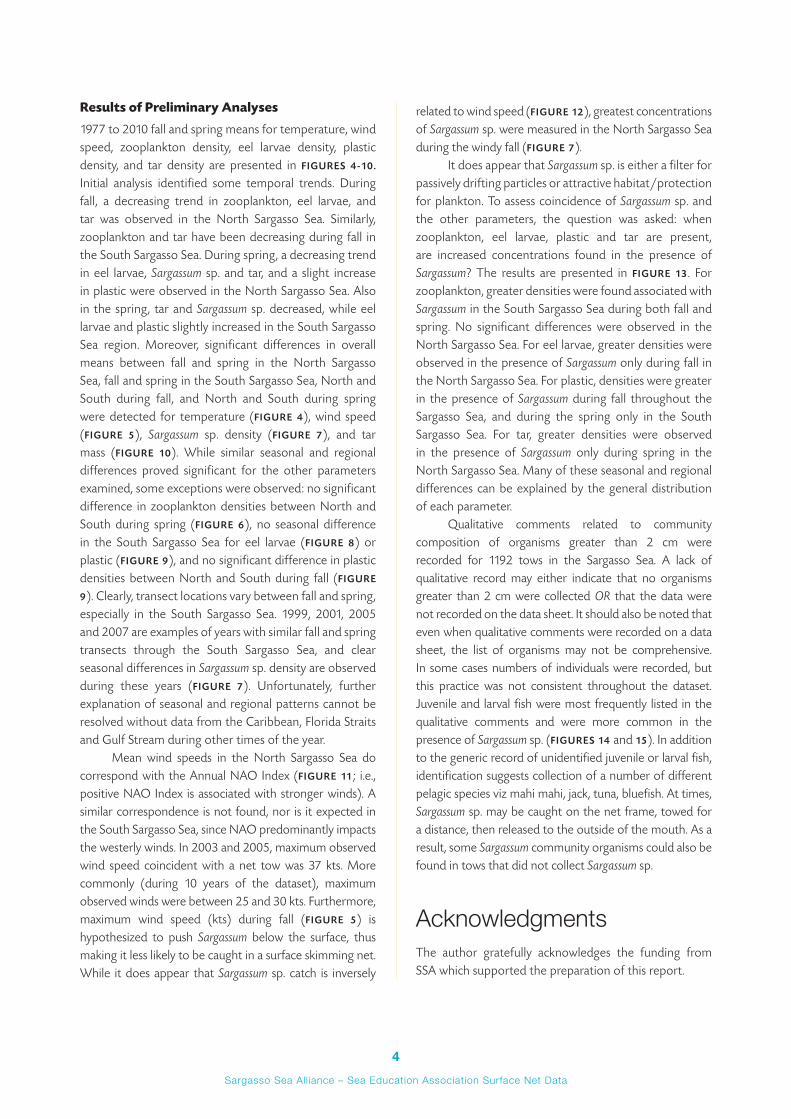
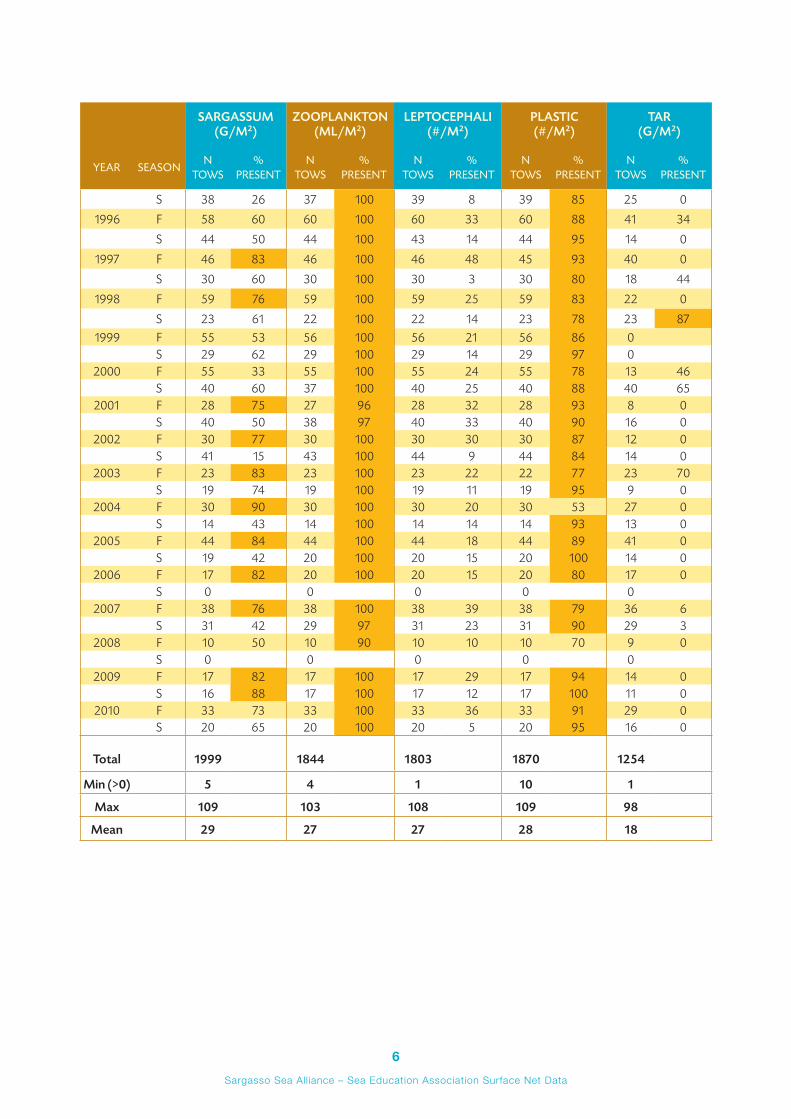
SEA Neuston Tow records from 1973 to 2010 were digitized. Many of the quantitative record keeping began in 1977. Sargassum sp. densities (g/m2) were recorded for 1999 individual tows, whereas tar densities (g/m2) were recorded least regularly, resulting in 1254 records from individual tows (TABLE 1). Plastic pieces and Sargassum sp. were encountered in all sampling years, and frequency of presence was high (TABLE 1). In contrast, eel larvae were less frequently observed (TABLE 1). Moreover, the frequency of tar balls decreased dramatically to nearly zero from the mid-1990s onward (TABLE 1).
Methods
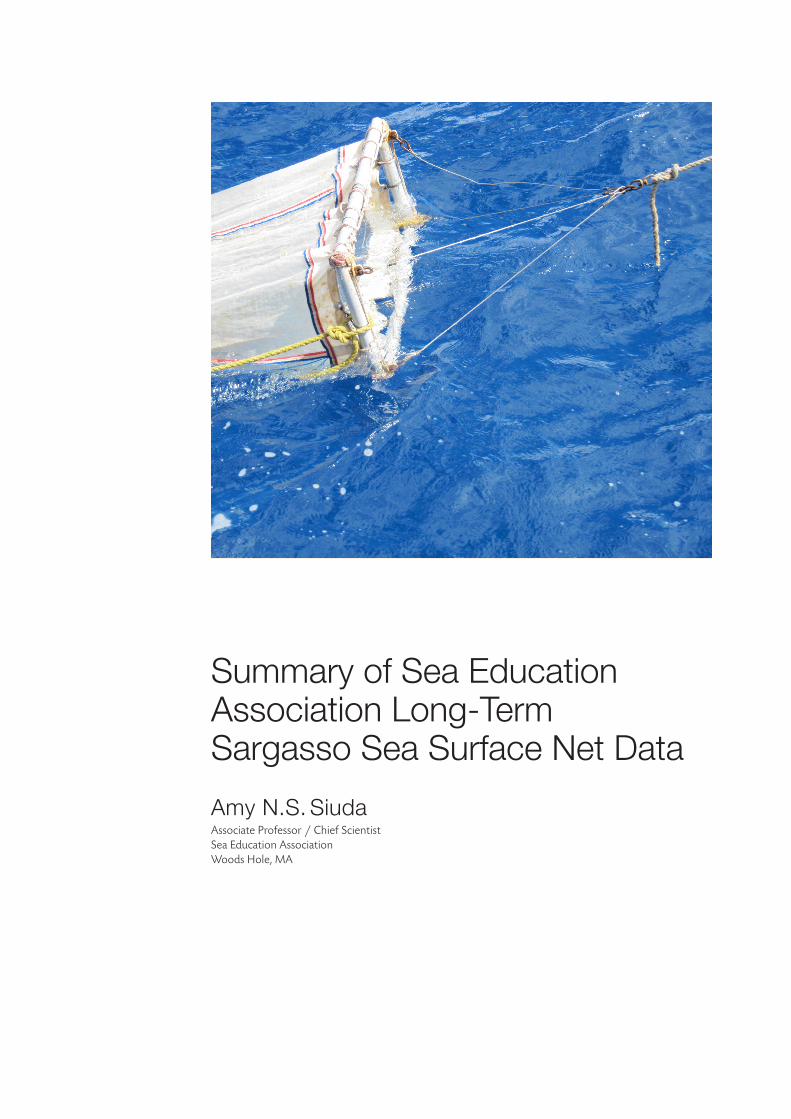
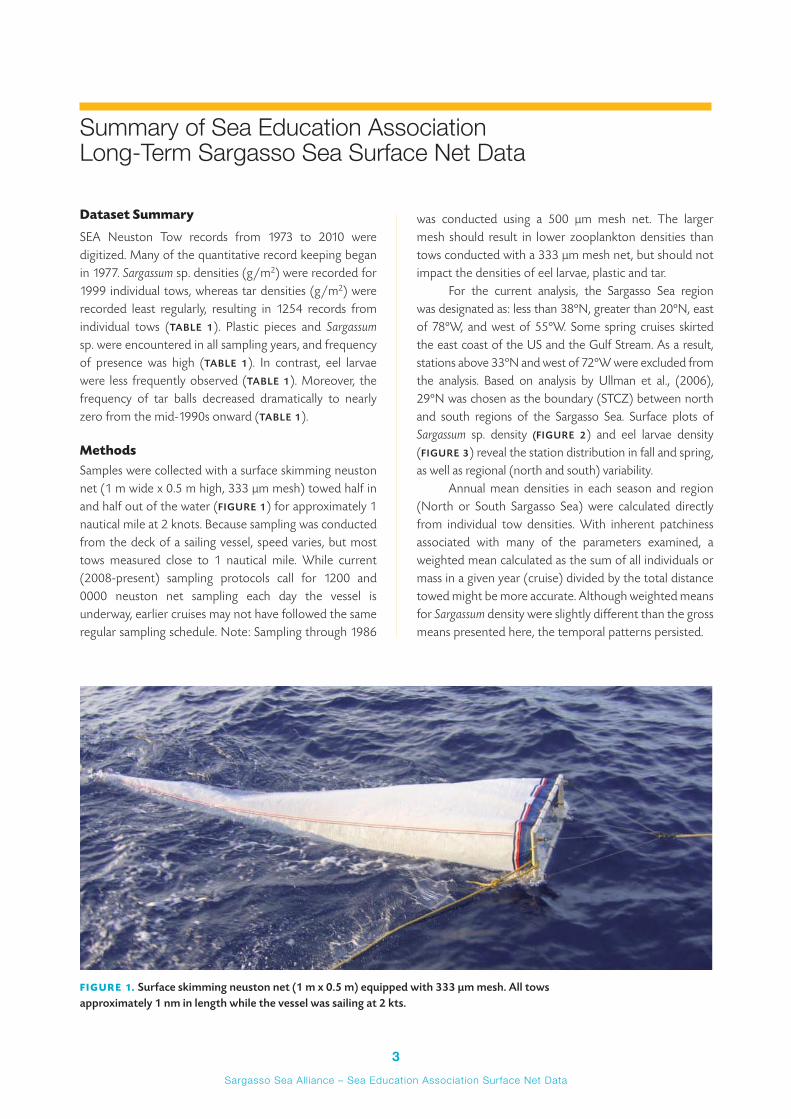
Samples were collected with a surface skimming neuston net (1 m wide x 0.5 m high, 333 µm mesh) towed half in and half out of the water (FIGURE 1) for approximately 1 nautical mile at 2 knots. Because sampling was conducted from the deck of a sailing vessel, speed varies, but most tows measured close to 1 nautical mile. While current (2008-present) sampling protocols call for 1200 and 0000 neuston net sampling each day the vessel is underway, earlier cruises may not have followed the same regular sampling schedule. Note: Sampling through 1986
was conducted using a 500 µm mesh net. The larger mesh should result in lower zooplankton densities than tows conducted with a 333 µm mesh net, but should not impact the densities of eel larvae, plastic and tar.
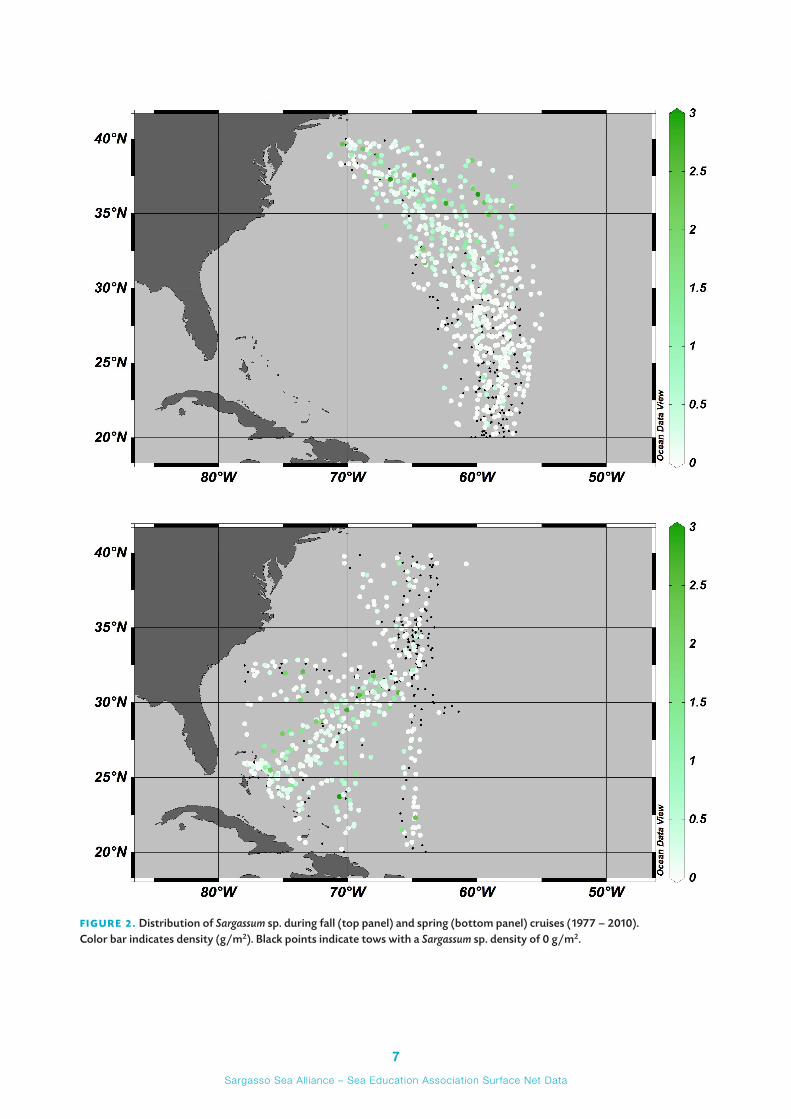
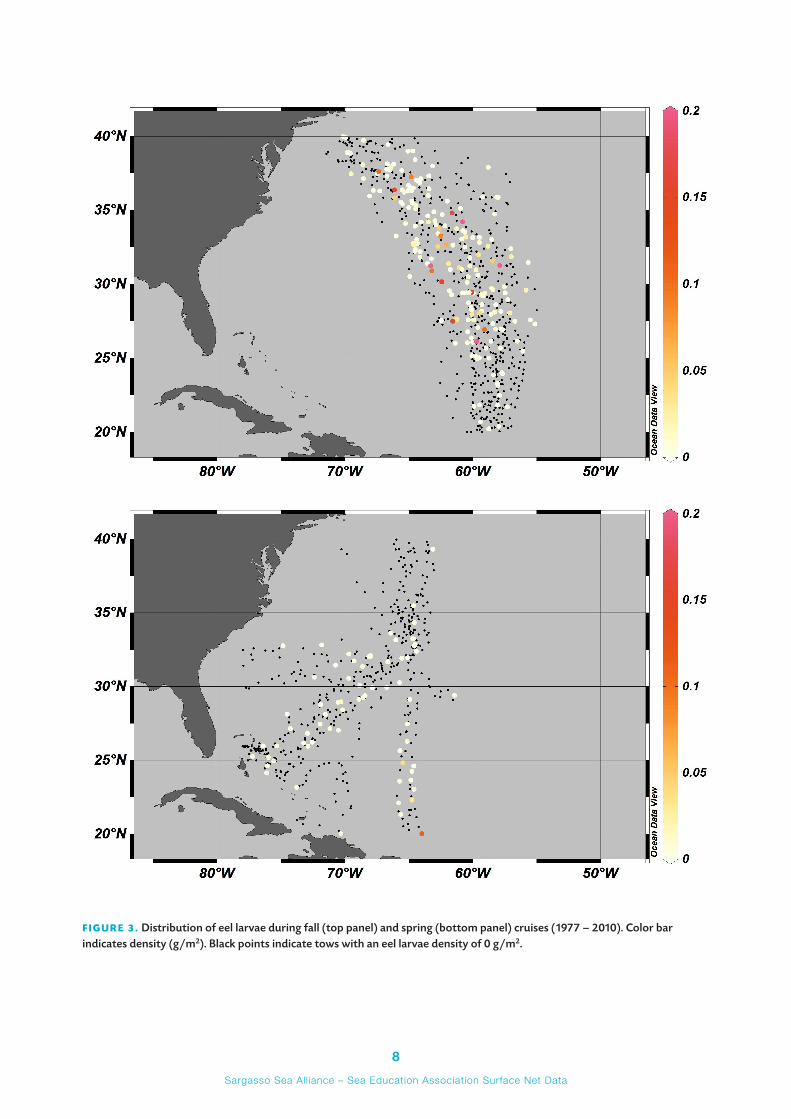
For the current analysis, the Sargasso Sea region was designated as: less than 38ºN, greater than 20ºN, east of 78ºW, and west of 55ºW. Some spring cruises skirted the east coast of the US and the Gulf Stream. As a result, stations above 33ºN and west of 72ºW were excluded from the analysis. Based on analysis by Ullman et al., (2006), 29ºN was chosen as the boundary (STCZ) between north and south regions of the Sargasso Sea. Surface plots of Sargassum sp. density (FIGURE 2) and eel larvae density (FIGURE 3) reveal the station distribution in fall and spring, as well as regional (north and south) variability.
Annual mean densities in each season and region (North or South Sargasso Sea) were calculated directly from individual tow densities. With inherent patchiness associated with many of the parameters examined, a weighted mean calculated as the sum of all individuals or mass in a given year (cruise) divided by the total distance towed might be more accurate. Although weighted means for Sargassum density were slightly different than the gross means presented here, the temporal patterns persisted.
FIGURE 1. Surface skimming neuston net (1 m x 0.5 m) equipped with 333 µm mesh. All tows approximately 1 nm in length while the vessel was sailing at 2 kts.
4Sargasso Sea All iance – Sea Education Association Surface Net Data
Results of Preliminary Analyses
1977 to 2010 fall and spring means for temperature, wind speed, zooplankton density, eel larvae density, plastic density, and tar density are presented in FIGURES 4-10.
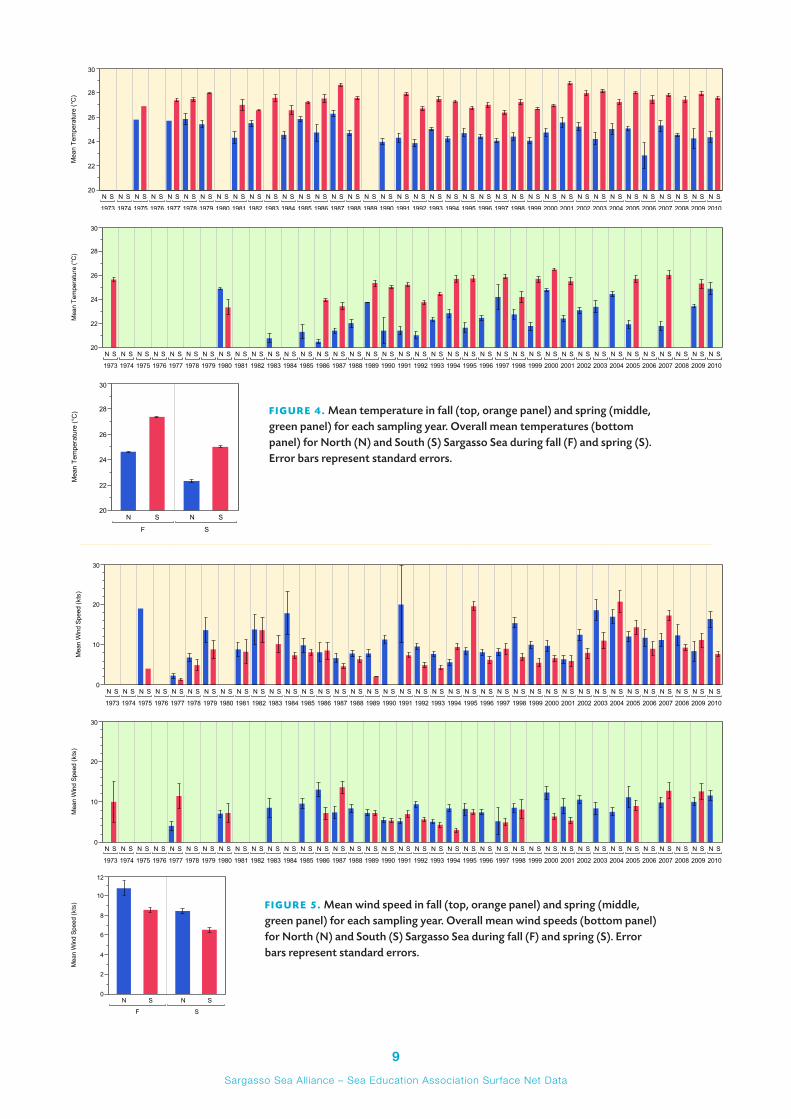
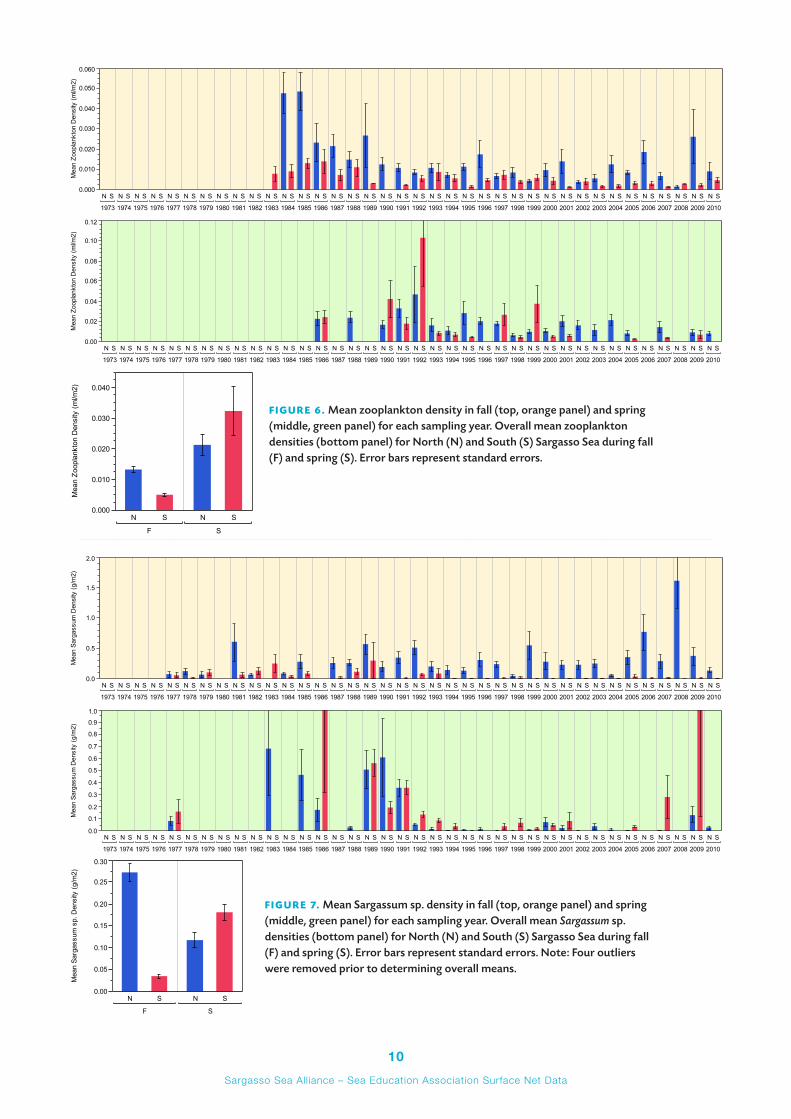
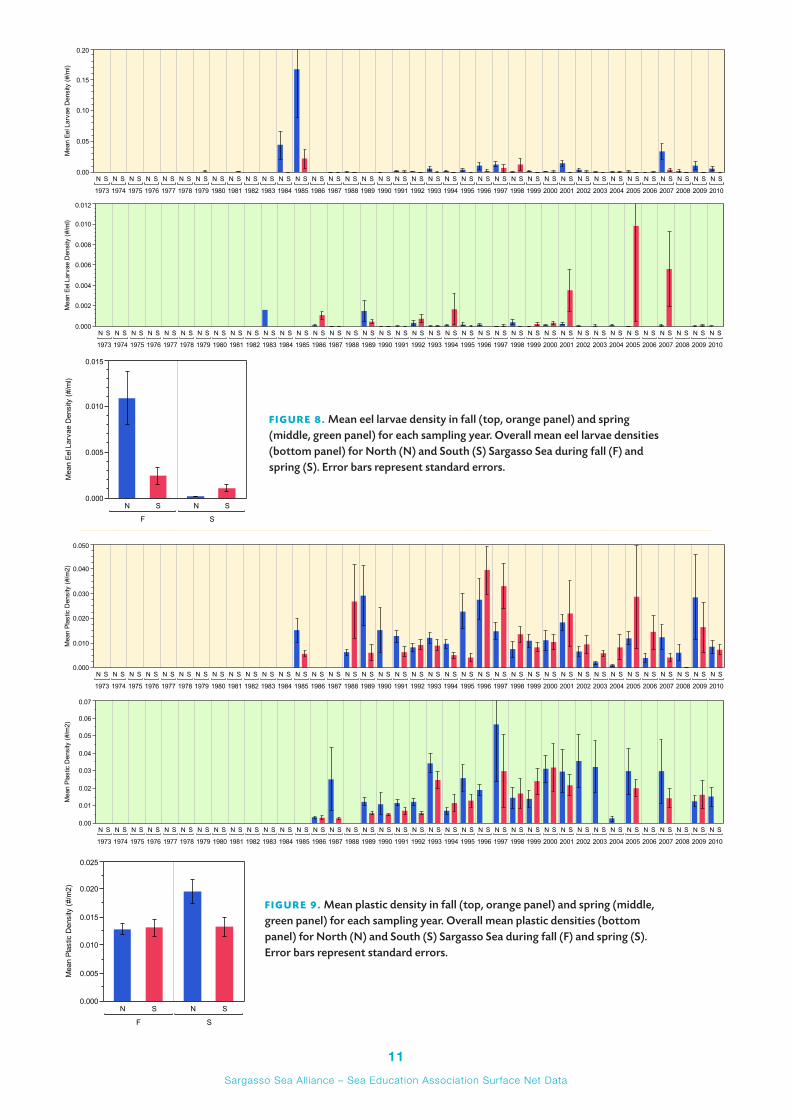
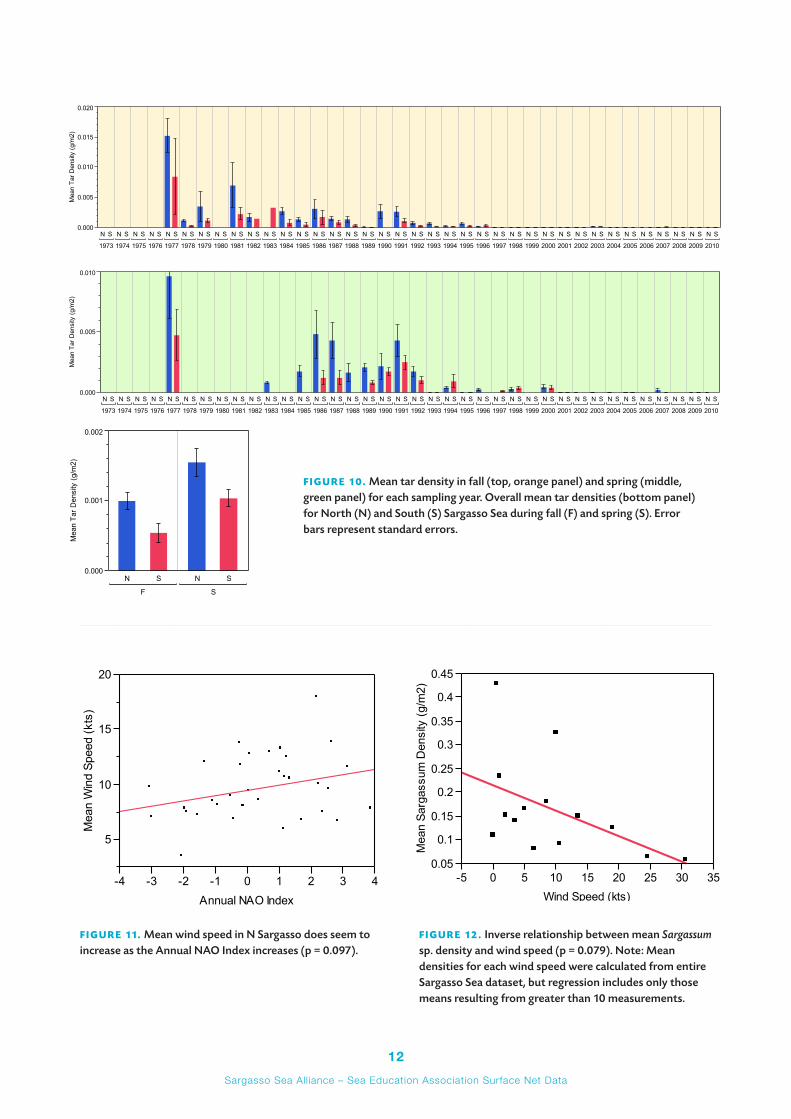
Initial analysis identified some temporal trends. During fall, a decreasing trend in zooplankton, eel larvae, and tar was observed in the North Sargasso Sea. Similarly, zooplankton and tar have been decreasing during fall in the South Sargasso Sea. During spring, a decreasing trend in eel larvae, Sargassum sp. and tar, and a slight increase in plastic were observed in the North Sargasso Sea. Also in the spring, tar and Sargassum sp. decreased, while eel larvae and plastic slightly increased in the South Sargasso Sea region. Moreover, significant differences in overall means between fall and spring in the North Sargasso Sea, fall and spring in the South Sargasso Sea, North and South during fall, and North and South during spring were detected for temperature (FIGURE 4), wind speed (FIGURE 5), Sargassum sp. density (FIGURE 7), and tar mass (FIGURE 10). While similar seasonal and regional differences proved significant for the other parameters examined, some exceptions were observed: no significant difference in zooplankton densities between North and South during spring (FIGURE 6), no seasonal difference in the South Sargasso Sea for eel larvae (FIGURE 8) or plastic (FIGURE 9), and no significant difference in plastic densities between North and South during fall (FIGURE
9). Clearly, transect locations vary between fall and spring, especially in the South Sargasso Sea. 1999, 2001, 2005 and 2007 are examples of years with similar fall and spring transects through the South Sargasso Sea, and clear seasonal differences in Sargassum sp. density are observed during these years (FIGURE 7). Unfortunately, further explanation of seasonal and regional patterns cannot be resolved without data from the Caribbean, Florida Straits and Gulf Stream during other times of the year.
Mean wind speeds in the North Sargasso Sea do correspond with the Annual NAO Index (FIGURE 11; i.e., positive NAO Index is associated with stronger winds). A similar correspondence is not found, nor is it expected in the South Sargasso Sea, since NAO predominantly impacts the westerly winds. In 2003 and 2005, maximum observed wind speed coincident with a net tow was 37 kts. More commonly (during 10 years of the dataset), maximum observed winds were between 25 and 30 kts. Furthermore, maximum wind speed (kts) during fall (FIGURE 5) is hypothesized to push Sargassum below the surface, thus making it less likely to be caught in a surface skimming net. While it does appear that Sargassum sp. catch is inversely
related to wind speed (FIGURE 12), greatest concentrations of Sargassum sp. were measured in the North Sargasso Sea during the windy fall (FIGURE 7).
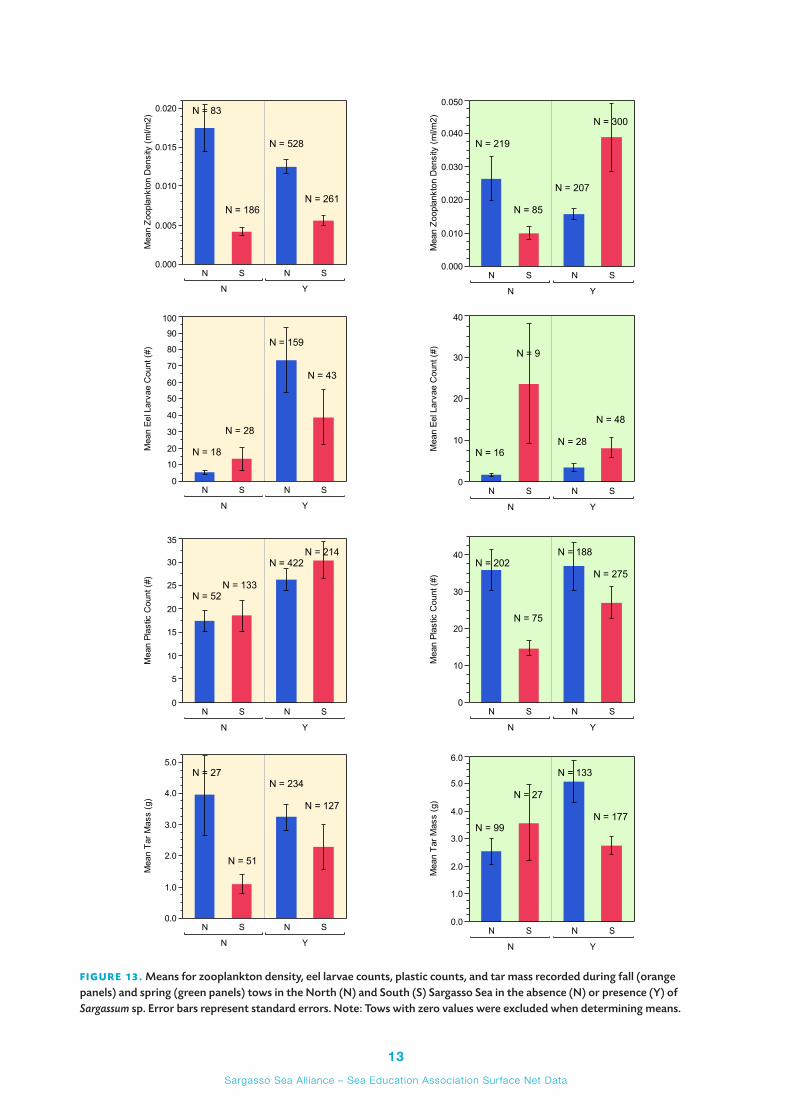
It does appear that Sargassum sp. is either a filter for passively drifting particles or attractive habitat/protection for plankton. To assess coincidence of Sargassum sp. and the other parameters, the question was asked: when zooplankton, eel larvae, plastic and tar are present, are increased concentrations found in the presence of Sargassum? The results are presented in FIGURE 13 . For zooplankton, greater densities were found associated with Sargassum in the South Sargasso Sea during both fall and spring. No significant differences were observed in the North Sargasso Sea. For eel larvae, greater densities were observed in the presence of Sargassum only during fall in the North Sargasso Sea. For plastic, densities were greater in the presence of Sargassum during fall throughout the Sargasso Sea, and during the spring only in the South Sargasso Sea. For tar, greater densities were observed in the presence of Sargassum only during spring in the North Sargasso Sea. Many of these seasonal and regional differences can be explained by the general distribution of each parameter.
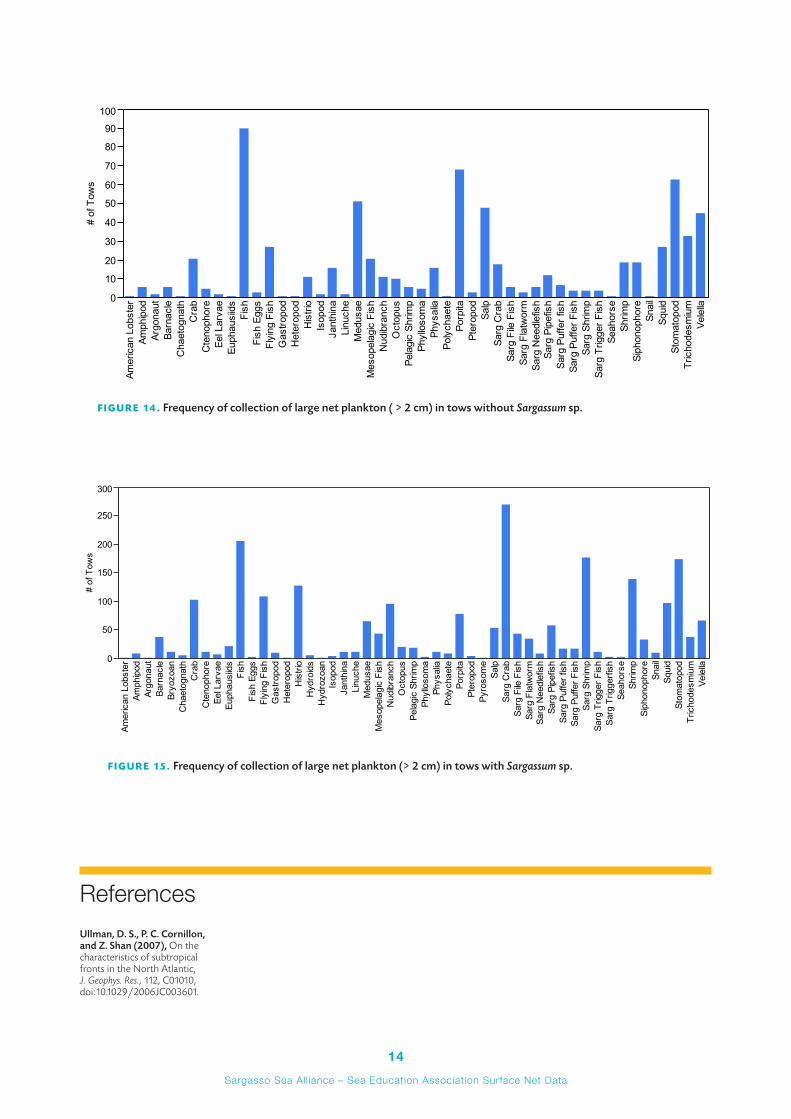
Qualitative comments related to community composition of organisms greater than 2 cm were recorded for 1192 tows in the Sargasso Sea. A lack of qualitative record may either indicate that no organisms greater than 2 cm were collected OR that the data were not recorded on the data sheet. It should also be noted that even when qualitative comments were recorded on a data sheet, the list of organisms may not be comprehensive. In some cases numbers of individuals were recorded, but this practice was not consistent throughout the dataset. Juvenile and larval fish were most frequently listed in the qualitative comments and were more common in the presence of Sargassum sp. (FIGURES 14 and 15). In addition to the generic record of unidentified juvenile or larval fish, identification suggests collection of a number of different pelagic species viz mahi mahi, jack, tuna, bluefish. At times, Sargassum sp. may be caught on the net frame, towed for a distance, then released to the outside of the mouth. As a result, some Sargassum community organisms could also be found in tows that did not collect Sargassum sp.
AcknowledgmentsThe author gratefully acknowledges the funding from SSA which supported the preparation of this report.
5Sargasso Sea All iance – Sea Education Association Surface Net Data
SARGASSUM (G/M2)
ZOOPLANKTON (ML/M2)
LEPTOCEPHALI (#/M2)
PLASTIC (#/M2)
TAR (G/M2)
YEAR SEASONN
TOWS%
PRESENTN
TOWS%
PRESENTN
TOWS%
PRESENTN
TOWS%
PRESENTN
TOWS%
PRESENT
1977 F 11 91 0 0 0 11 100
S 12 83 0 0 0 12 100
1978 F 13 77 0 0 0 13 92
S 0 0 0 0 0
1979 F 9 100 0 2 100 0 8 100
S 0 0 0 0 0
1980 F 0 0 0 0 0
S 0 0 0 0 0
1981 F 9 78 0 4 75 0 9 89
S 0 0 0 0 0
1982 F 7 100 0 0 0 3 100
S 0 0 0 0 0
1983 F 6 100 4 100 0 0 1 100
S 5 100 0 1 100 0 0
1984 F 32 91 30 100 32 22 0 27 89
S 0 0 0 0 0
1985 F 37 100 29 100 35 29 35 100 33 88
S 14 79 0 0 0 17 82
1986 F 0 11 100 0 8 100 7 100
S 38 89 38 100 39 28 39 77 0
1987 F 19 95 32 100 28 0 0 0
S 0 0 15 0 19 100 21 95
1988 F 90 90 63 100 86 15 49 94 27 89
S 3 100 29 100 0 0 0
1989 F 13 92 13 100 0 13 92 13 92
S 67 96 0 19 42 81 94 73 95
1990 F 18 89 18 100 4 0 18 94 12 100
S 104 81 103 83 57 2 102 75 98 79
1991 F 81 93 82 99 81 14 78 81 48 92
S 65 88 59 100 41 2 67 85 49 69
1992 F 74 99 65 100 74 18 74 88 41 85
S 109 71 102 100 108 11 109 93 4 0
1993 F 43 79 44 100 44 20 44 91 42 33
S 48 67 48 96 48 4 48 92 21 0
1994 F 43 49 45 100 46 30 47 87 10 0
S 21 52 21 95 21 19 21 76 21 0
1995 F 61 57 61 98 61 18 61 89 59 86
Table 1 continues
TABLE 1. Number of Neuston Net tows (N Tows) and encounter rate (% Present) for Sargassum sp., zooplankton, eel larvae, plastic pieces and tar mass along each SEA Sargasso Sea transect (e.g., fall or spring of each year). Differences in total tow counts result from differences in quality of original records. Cruises for which a parameter was collected in greater than 75% of the tow are highlighted in orange.
6Sargasso Sea All iance – Sea Education Association Surface Net Data
SARGASSUM (G/M2)
ZOOPLANKTON (ML/M2)
LEPTOCEPHALI (#/M2)
PLASTIC (#/M2)
TAR (G/M2)
YEAR SEASONN
TOWS%
PRESENTN
TOWS%
PRESENTN
TOWS%
PRESENTN
TOWS%
PRESENTN
TOWS%
PRESENT
S 38 26 37 100 39 8 39 85 25 0
1996 F 58 60 60 100 60 33 60 88 41 34
S 44 50 44 100 43 14 44 95 14 0
1997 F 46 83 46 100 46 48 45 93 40 0
S 30 60 30 100 30 3 30 80 18 44
1998 F 59 76 59 100 59 25 59 83 22 0
S 23 61 22 100 22 14 23 78 23 871999 F 55 53 56 100 56 21 56 86 0
S 29 62 29 100 29 14 29 97 02000 F 55 33 55 100 55 24 55 78 13 46
S 40 60 37 100 40 25 40 88 40 652001 F 28 75 27 96 28 32 28 93 8 0
S 40 50 38 97 40 33 40 90 16 02002 F 30 77 30 100 30 30 30 87 12 0
S 41 15 43 100 44 9 44 84 14 02003 F 23 83 23 100 23 22 22 77 23 70
S 19 74 19 100 19 11 19 95 9 02004 F 30 90 30 100 30 20 30 53 27 0
S 14 43 14 100 14 14 14 93 13 02005 F 44 84 44 100 44 18 44 89 41 0
S 19 42 20 100 20 15 20 100 14 02006 F 17 82 20 100 20 15 20 80 17 0
S 0 0 0 0 02007 F 38 76 38 100 38 39 38 79 36 6
S 31 42 29 97 31 23 31 90 29 32008 F 10 50 10 90 10 10 10 70 9 0
S 0 0 0 0 02009 F 17 82 17 100 17 29 17 94 14 0
S 16 88 17 100 17 12 17 100 11 02010 F 33 73 33 100 33 36 33 91 29 0
S 20 65 20 100 20 5 20 95 16 0
Total 1999 1844 1803 1870 1254
Min (>0) 5 4 1 10 1
Max 109 103 108 109 98
Mean 29 27 27 28 18
7Sargasso Sea All iance – Sea Education Association Surface Net Data
FIGURE 2. Distribution of Sargassum sp. during fall (top panel) and spring (bottom panel) cruises (1977 – 2010). Color bar indicates density (g/m2). Black points indicate tows with a Sargassum sp. density of 0 g/m2.
8Sargasso Sea All iance – Sea Education Association Surface Net Data
FIGURE 3. Distribution of eel larvae during fall (top panel) and spring (bottom panel) cruises (1977 – 2010). Color bar indicates density (g/m2). Black points indicate tows with an eel larvae density of 0 g/m2.
9Sargasso Sea All iance – Sea Education Association Surface Net Data
20
22
24
26
28
30M
ean
Tem
pera
ture
(°C
)
N S N S N S N S N S N S N S N S N S N S N S N S N S N S N S N S N S N S N S N S N S N S N S N S N S N S N S N S N S N S N S N S N S N S N S N S N S N S
1973 1974 1975 1976 1977 1978 1979 1980 1981 1982 1983 1984 1985 1986 1987 1988 1989 1990 1991 1992 1993 1994 1995 1996 1997 1998 1999 2000 2001 2002 2003 2004 2005 2006 2007 2008 2009 2010
N or S Sargasso? w ithin Year
20
22
24
26
28
30
Mea
n Te
mpe
ratu
re (°
C)
N S N S
F S
N or S Sargasso? w ithin Season
FIGURE 4. Mean temperature in fall (top, orange panel) and spring (middle, green panel) for each sampling year. Overall mean temperatures (bottom panel) for North (N) and South (S) Sargasso Sea during fall (F) and spring (S). Error bars represent standard errors.
FIGURE 5. Mean wind speed in fall (top, orange panel) and spring (middle, green panel) for each sampling year. Overall mean wind speeds (bottom panel) for North (N) and South (S) Sargasso Sea during fall (F) and spring (S). Error bars represent standard errors.
0
10
20
30
Mea
n W
ind
Spee
d (k
ts)
N S N S N S N S N S N S N S N S N S N S N S N S N S N S N S N S N S N S N S N S N S N S N S N S N S N S N S N S N S N S N S N S N S N S N S N S N S N S
1973 1974 1975 1976 1977 1978 1979 1980 1981 1982 1983 1984 1985 1986 1987 1988 1989 1990 1991 1992 1993 1994 1995 1996 1997 1998 1999 2000 2001 2002 2003 2004 2005 2006 2007 2008 2009 2010
N or S Sargasso? w ithin Year
0
2
4
6
8
10
12
Mea
n W
ind
Spee
d (k
ts)
N S N S
F S
N or S Sargasso? w ithin Season
10Sargasso Sea All iance – Sea Education Association Surface Net Data
0.000
0.010
0.020
0.030
0.040
0.050
0.060M
ean
Zoop
lank
ton
Den
sity
(ml/m
2)
N S N S N S N S N S N S N S N S N S N S N S N S N S N S N S N S N S N S N S N S N S N S N S N S N S N S N S N S N S N S N S N S N S N S N S N S N S N S
1973 1974 1975 1976 1977 1978 1979 1980 1981 1982 1983 1984 1985 1986 1987 1988 1989 1990 1991 1992 1993 1994 1995 1996 1997 1998 1999 2000 2001 2002 2003 2004 2005 2006 2007 2008 2009 2010
N or S Sargasso? w ithin Year
0.00
0.02
0.04
0.06
0.08
0.10
0.12
Mea
n Zo
opla
nkto
n D
ensi
ty (m
l/m2)
N S N S N S N S N S N S N S N S N S N S N S N S N S N S N S N S N S N S N S N S N S N S N S N S N S N S N S N S N S N S N S N S N S N S N S N S N S N S
1973 1974 1975 1976 1977 1978 1979 1980 1981 1982 1983 1984 1985 1986 1987 1988 1989 1990 1991 1992 1993 1994 1995 1996 1997 1998 1999 2000 2001 2002 2003 2004 2005 2006 2007 2008 2009 2010
N or S Sargasso? w ithin Year
0.000
0.010
0.020
0.030
0.040
Mea
n Zo
opla
nkto
n D
ensi
ty (m
l/m2)
N S N S
F S
N or S Sargasso? w ithin Season
0.0
0.5
1.0
1.5
2.0
Mea
n Sa
rgas
sum
Den
sity
(g/m
2)
N S N S N S N S N S N S N S N S N S N S N S N S N S N S N S N S N S N S N S N S N S N S N S N S N S N S N S N S N S N S N S N S N S N S N S N S N S N S
1973 1974 1975 1976 1977 1978 1979 1980 1981 1982 1983 1984 1985 1986 1987 1988 1989 1990 1991 1992 1993 1994 1995 1996 1997 1998 1999 2000 2001 2002 2003 2004 2005 2006 2007 2008 2009 2010
N or S Sargasso? w ithin Year
0.0
0.1
0.2
0.3
0.4
0.5
0.6
0.7
0.8
0.9
1.0
Mea
n Sa
rgas
sum
Den
sity
(g/m
2)
N S N S N S N S N S N S N S N S N S N S N S N S N S N S N S N S N S N S N S N S N S N S N S N S N S N S N S N S N S N S N S N S N S N S N S N S N S N S
1973 1974 1975 1976 1977 1978 1979 1980 1981 1982 1983 1984 1985 1986 1987 1988 1989 1990 1991 1992 1993 1994 1995 1996 1997 1998 1999 2000 2001 2002 2003 2004 2005 2006 2007 2008 2009 2010
N or S Sargasso? w ithin Year
0.00
0.05
0.10
0.15
0.20
0.25
0.30
Mea
n Sa
rgas
sum
sp.
Den
sity
(g/m
2)
N S N S
F S
N or S Sargasso? w ithin Season
FIGURE 6. Mean zooplankton density in fall (top, orange panel) and spring (middle, green panel) for each sampling year. Overall mean zooplankton densities (bottom panel) for North (N) and South (S) Sargasso Sea during fall (F) and spring (S). Error bars represent standard errors.
FIGURE 7. Mean Sargassum sp. density in fall (top, orange panel) and spring (middle, green panel) for each sampling year. Overall mean Sargassum sp. densities (bottom panel) for North (N) and South (S) Sargasso Sea during fall (F) and spring (S). Error bars represent standard errors. Note: Four outliers were removed prior to determining overall means.
11Sargasso Sea All iance – Sea Education Association Surface Net Data
0.00
0.05
0.10
0.15
0.20
Mea
n Ee
l Lar
vae
Den
sity
(#/m
l)
N S N S N S N S N S N S N S N S N S N S N S N S N S N S N S N S N S N S N S N S N S N S N S N S N S N S N S N S N S N S N S N S N S N S N S N S N S N S
1973 1974 1975 1976 1977 1978 1979 1980 1981 1982 1983 1984 1985 1986 1987 1988 1989 1990 1991 1992 1993 1994 1995 1996 1997 1998 1999 2000 2001 2002 2003 2004 2005 2006 2007 2008 2009 2010
N or S Sargasso? w ithin Year
0.000
0.002
0.004
0.006
0.008
0.010
0.012
Mea
n Ee
l Lar
vae
Den
sity
(#/m
l)
N S N S N S N S N S N S N S N S N S N S N S N S N S N S N S N S N S N S N S N S N S N S N S N S N S N S N S N S N S N S N S N S N S N S N S N S N S N S
1973 1974 1975 1976 1977 1978 1979 1980 1981 1982 1983 1984 1985 1986 1987 1988 1989 1990 1991 1992 1993 1994 1995 1996 1997 1998 1999 2000 2001 2002 2003 2004 2005 2006 2007 2008 2009 2010
N or S Sargasso? w ithin Year
0.000
0.005
0.010
0.015
Mea
n Ee
l Lar
vae
Den
sity
(#/m
l)
N S N S
F S
N or S Sargasso? w ithin Season
0.000
0.010
0.020
0.030
0.040
0.050
Mea
n Pl
astic
Den
sity
(#/m
2)
N S N S N S N S N S N S N S N S N S N S N S N S N S N S N S N S N S N S N S N S N S N S N S N S N S N S N S N S N S N S N S N S N S N S N S N S N S N S
1973 1974 1975 1976 1977 1978 1979 1980 1981 1982 1983 1984 1985 1986 1987 1988 1989 1990 1991 1992 1993 1994 1995 1996 1997 1998 1999 2000 2001 2002 2003 2004 2005 2006 2007 2008 2009 2010
N or S Sargasso? w ithin Year
0.00
0.01
0.02
0.03
0.04
0.05
0.06
0.07
Mea
n Pl
astic
Den
sity
(#/m
2)
N S N S N S N S N S N S N S N S N S N S N S N S N S N S N S N S N S N S N S N S N S N S N S N S N S N S N S N S N S N S N S N S N S N S N S N S N S N S
1973 1974 1975 1976 1977 1978 1979 1980 1981 1982 1983 1984 1985 1986 1987 1988 1989 1990 1991 1992 1993 1994 1995 1996 1997 1998 1999 2000 2001 2002 2003 2004 2005 2006 2007 2008 2009 2010
N or S Sargasso? w ithin Year
0.000
0.005
0.010
0.015
0.020
0.025
Mea
n Pl
astic
Den
sity
(#/m
2)
N S N S
F S
N or S Sargasso? w ithin Season
FIGURE 8. Mean eel larvae density in fall (top, orange panel) and spring (middle, green panel) for each sampling year. Overall mean eel larvae densities (bottom panel) for North (N) and South (S) Sargasso Sea during fall (F) and spring (S). Error bars represent standard errors.
FIGURE 9. Mean plastic density in fall (top, orange panel) and spring (middle, green panel) for each sampling year. Overall mean plastic densities (bottom panel) for North (N) and South (S) Sargasso Sea during fall (F) and spring (S). Error bars represent standard errors.
12Sargasso Sea All iance – Sea Education Association Surface Net Data
0.000
0.005
0.010
0.015
0.020
Mea
n Ta
r Den
sity
(g/m
2)
N S N S N S N S N S N S N S N S N S N S N S N S N S N S N S N S N S N S N S N S N S N S N S N S N S N S N S N S N S N S N S N S N S N S N S N S N S N S
1973 1974 1975 1976 1977 1978 1979 1980 1981 1982 1983 1984 1985 1986 1987 1988 1989 1990 1991 1992 1993 1994 1995 1996 1997 1998 1999 2000 2001 2002 2003 2004 2005 2006 2007 2008 2009 2010
N or S Sargasso? w ithin Year
0.000
0.005
0.010
Mea
n Ta
r Den
sity
(g/m
2)
N S N S N S N S N S N S N S N S N S N S N S N S N S N S N S N S N S N S N S N S N S N S N S N S N S N S N S N S N S N S N S N S N S N S N S N S N S N S
1973 1974 1975 1976 1977 1978 1979 1980 1981 1982 1983 1984 1985 1986 1987 1988 1989 1990 1991 1992 1993 1994 1995 1996 1997 1998 1999 2000 2001 2002 2003 2004 2005 2006 2007 2008 2009 2010
N or S Sargasso? w ithin Year
0.000
0.001
0.002
Mea
n Ta
r Den
sity
(g/m
2)
N S N S
F S
N or S Sargasso? w ithin Season
FIGURE 10. Mean tar density in fall (top, orange panel) and spring (middle, green panel) for each sampling year. Overall mean tar densities (bottom panel) for North (N) and South (S) Sargasso Sea during fall (F) and spring (S). Error bars represent standard errors.
FIGURE 11. Mean wind speed in N Sargasso does seem to increase as the Annual NAO Index increases (p = 0.097).
FIGURE 12. Inverse relationship between mean Sargassum sp. density and wind speed (p = 0.079). Note: Mean densities for each wind speed were calculated from entire Sargasso Sea dataset, but regression includes only those means resulting from greater than 10 measurements.
5
10
15
20
Mea
n W
ind
Spee
d (k
ts)
-4 -3 -2 -1 0 1 2 3 4Annual NAO Index
0.05
0.1
0.15
0.2
0.25
0.3
0.35
0.4
0.45
Mea
n Sa
rgas
sum
Den
sity
(g/m
2)
-5 0 5 10 15 20 25 30 35Wind Speed (kts)
13Sargasso Sea All iance – Sea Education Association Surface Net Data
0.000
0.005
0.010
0.015
0.020
Mea
n Zo
opla
nkto
n D
ensi
ty (m
l/m2)
N S N S
N Y
N or S Sargasso? w ithin Sargassum Presence?
0
10
20
30
40
50
60
70
80
90
100
Mea
n Ee
l Lar
vae
Cou
nt (#
)
N S N S
N Y
N or S Sargasso? w ithin Sargassum Presence?
0
5
10
15
20
25
30
35
Mea
n Pl
astic
Cou
nt (#
)
N S N S
N Y
N or S Sargasso? w ithin Sargassum Presence?
0.0
1.0
2.0
3.0
4.0
5.0
Mea
n Ta
r Mas
s (g
)
N S N S
N Y
N or S Sargasso? w ithin Sargassum Presence?
N = 83
N = 528
N = 186 N = 261
N = 18
N = 159
N = 28
N = 43
N = 52
N = 422
N = 133
N = 214
N = 27 N = 234
N = 51
N = 127
0.000
0.010
0.020
0.030
0.040
0.050
Mea
n Zo
opla
nkto
n D
ensi
ty (m
l/m2)
N S N S
N Y
N or S Sargasso? w ithin Sargassum Presence?
0
10
20
30
40
Mea
n Ee
l Lar
vae
Cou
nt (#
)
N S N S
N Y
N or S Sargasso? w ithin Sargassum Presence?
0
10
20
30
40
Mea
n Pl
astic
Cou
nt (#
)
N S N S
N Y
N or S Sargasso? w ithin Sargassum Presence?
0.0
1.0
2.0
3.0
4.0
5.0
6.0
Mea
n Ta
r Mas
s (g
)
N S N S
N Y
N or S Sargasso? w ithin Sargassum Presence?
N = 219
N = 207
N = 85
N = 300
N = 16 N = 28
N = 9
N = 48
N = 202 N = 188
N = 75
N = 275
N = 99
N = 133
N = 27
N = 177
Figure 10. Means for zooplankton density, eel larvae counts, plastic counts, and tar mass recorded during fall (orange panels) and spring (green panels) tows in the North (N) and South (S) Sargasso Sea in the absence (N) or presence (Y) of Sargassum sp. Error bars represent standard errors. Note: Tows with zero values were excluded when determining means.
FIGURE 13. Means for zooplankton density, eel larvae counts, plastic counts, and tar mass recorded during fall (orange panels) and spring (green panels) tows in the North (N) and South (S) Sargasso Sea in the absence (N) or presence (Y) of Sargassum sp. Error bars represent standard errors. Note: Tows with zero values were excluded when determining means.
14Sargasso Sea All iance – Sea Education Association Surface Net Data
0
10
20
30
40
50
60
70
80
90
100
# of
Tow
s
Amer
ican
Lob
ster
Amph
ipod
Argo
naut
Barn
acle
Cha
etog
nath
Cra
bC
teno
phor
eEe
l Lar
vae
Euph
ausi
ids
Fish
Fish
Egg
sFl
ying
Fis
hG
astro
pod
Het
erop
odH
istri
oIs
opod
Jant
hina
Linu
che
Med
usae
Mes
opel
agic
Fis
hN
udib
ranc
hO
ctop
usPe
lagi
c Sh
rimp
Phyl
loso
ma
Phys
alia
Poly
chae
tePo
rpita
Pter
opod
Salp
Sarg
Cra
bSa
rg F
ile F
ish
Sarg
Fla
twor
mSa
rg N
eedl
efis
hSa
rg P
ipef
ish
Sarg
Puf
fer f
ish
Sarg
Puf
fer F
ish
Sarg
Shr
imp
Sarg
Trig
ger F
ish
Seah
orse
Shrim
pSi
phon
opho
reSn
ail
Squi
dSt
omat
opod
Tric
hode
smiu
mVe
lella
Group
0
50
100
150
200
250
300
# of
Tow
s
Amer
ican
Lob
ster
Amph
ipod
Argo
naut
Barn
acle
Bryo
zoan
Cha
etog
nath
Cra
bC
teno
phor
eEe
l Lar
vae
Euph
ausi
ids
Fish
Fish
Egg
sFl
ying
Fis
hG
astro
pod
Het
erop
odH
istri
oH
ydro
ids
Hyd
rozo
anIs
opod
Jant
hina
Linu
che
Med
usae
Mes
opel
agic
Fis
hN
udib
ranc
hO
ctop
usPe
lagi
c Sh
rimp
Phyl
loso
ma
Phys
alia
Poly
chae
tePo
rpita
Pter
opod
Pyro
som
eSa
lpSa
rg C
rab
Sarg
File
Fis
hSa
rg F
latw
orm
Sarg
Nee
dlef
ish
Sarg
Pip
efis
hSa
rg P
uffe
r fis
hSa
rg P
uffe
r Fis
hSa
rg S
hrim
pSa
rg T
rigge
r Fis
hSa
rg T
rigge
rfish
Seah
orse
Shrim
pSi
phon
opho
reSn
ail
Squi
dSt
omat
opod
Tric
hode
smiu
mVe
lella
Group
FIGURE 14. Frequency of collection of large net plankton ( > 2 cm) in tows without Sargassum sp.
FIGURE 15. Frequency of collection of large net plankton (> 2 cm) in tows with Sargassum sp.
ReferencesUllman, D. S., P. C. Cornillon, and Z. Shan (2007), On the characteristics of subtropical fronts in the North Atlantic, J. Geophys. Res., 112, C01010, doi:10.1029/2006JC003601.
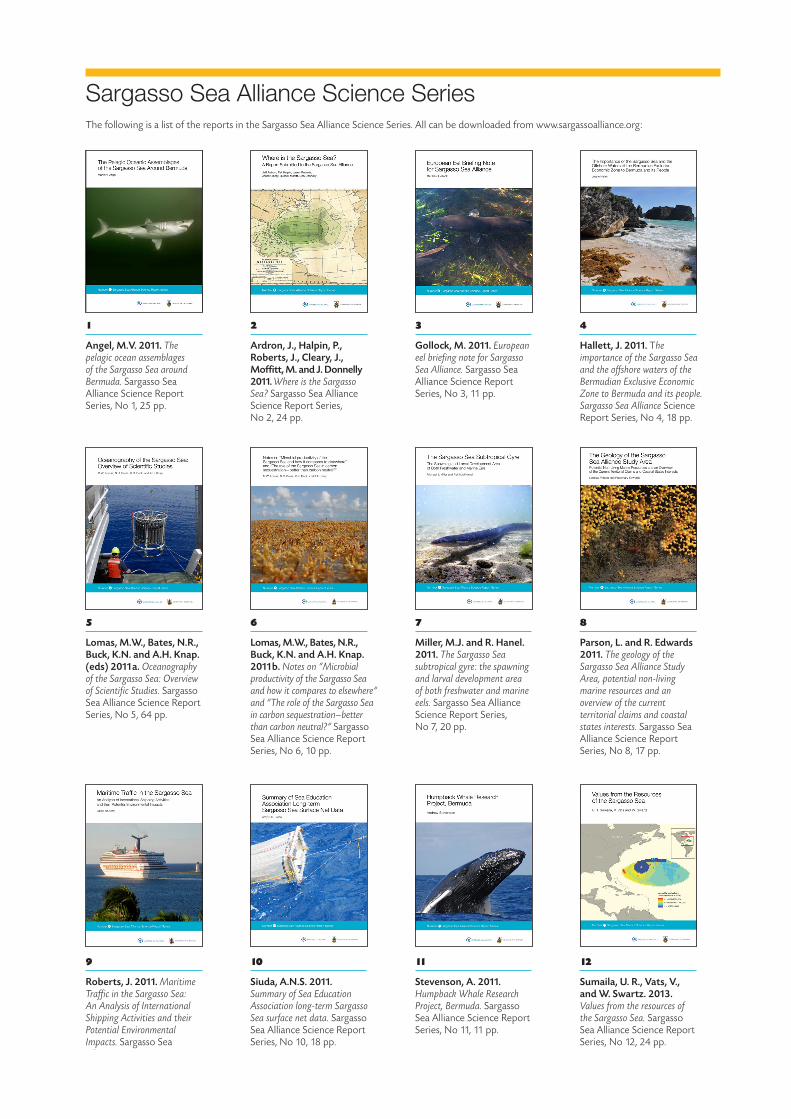
Sargasso Sea Alliance Science SeriesThe following is a list of the reports in the Sargasso Sea Alliance Science Series. All can be downloaded from www.sargassoalliance.org:
1
Angel, M.V. 2011. The pelagic ocean assemblages of the Sargasso Sea around Bermuda. Sargasso Sea Alliance Science Report Series, No 1, 25 pp.
2
Ardron, J., Halpin, P., Roberts, J., Cleary, J., Moffitt, M. and J. Donnelly 2011. Where is the Sargasso Sea? Sargasso Sea Alliance Science Report Series, No 2, 24 pp.
3
Gollock, M. 2011. European eel briefing note for Sargasso Sea Alliance. Sargasso Sea Alliance Science Report Series, No 3, 11 pp.
4
Hallett, J. 2011. The importance of the Sargasso Sea and the offshore waters of the Bermudian Exclusive Economic Zone to Bermuda and its people. Sargasso Sea Alliance Science Report Series, No 4, 18 pp.
5
Lomas, M.W., Bates, N.R., Buck, K.N. and A.H. Knap. (eds) 2011a. Oceanography of the Sargasso Sea: Overview of Scientific Studies. Sargasso Sea Alliance Science Report Series, No 5, 64 pp.
6
Lomas, M.W., Bates, N.R., Buck, K.N. and A.H. Knap. 2011b. Notes on “Microbial productivity of the Sargasso Sea and how it compares to elsewhere” and “The role of the Sargasso Sea in carbon sequestration—better than carbon neutral?” Sargasso Sea Alliance Science Report Series, No 6, 10 pp.
7
Miller, M.J. and R. Hanel. 2011. The Sargasso Sea subtropical gyre: the spawning and larval development area of both freshwater and marine eels. Sargasso Sea Alliance Science Report Series, No 7, 20 pp.
8
Parson, L. and R. Edwards 2011. The geology of the Sargasso Sea Alliance Study Area, potential non-living marine resources and an overview of the current territorial claims and coastal states interests. Sargasso Sea Alliance Science Report Series, No 8, 17 pp.
9
Roberts, J. 2011. Maritime Traffic in the Sargasso Sea: An Analysis of International Shipping Activities and their Potential Environmental Impacts. Sargasso Sea Alliance Science Report Series, No 9, 45 pp.
10
Siuda, A.N.S. 2011. Summary of Sea Education Association long-term Sargasso Sea surface net data. Sargasso Sea Alliance Science Report Series, No 10, 18 pp.
11
Stevenson, A. 2011. Humpback Whale Research Project, Bermuda. Sargasso Sea Alliance Science Report Series, No 11, 11 pp.
12
Sumaila, U. R., Vats, V., and W. Swartz. 2013. Values from the resources of the Sargasso Sea. Sargasso Sea Alliance Science Report Series, No 12, 24 pp.
Since the initial meetings the partnership around the Sargasso Sea Alliance has expanded.
Led by the Government of Bermuda, the Alliance now includes the following organisations.
PARTNER TYPE OF ORGANISATION
Department of Environmental Protection Government of Bermuda
Department of Conservation Services Government of Bermuda
Mission Blue / Sylvia Earle Alliance Non-Governmental Organisation
International Union for the Conservation of Nature (IUCN) and its World Commission on Protected Areas Multi-lateral Conservation Organisation
Marine Conservation Institute Non-Governmental Organisation
Woods Hole Oceanographic Institution Academic
Bermuda Institute for Ocean Sciences Academic
Bermuda Underwater Exploration Institute Non-Governmental Organisation
World Wildlife Fund International Non-Governmental Organisation
Atlantic Conservation Partnership Non-Governmental Organisation