Embed Size (px)
Citation preview
* Corresponding author.
Deep-Sea Research II 48 (2001) 1567}1582
Shallow remineralization in the Sargasso Seaestimated from seasonal variations in oxygen,
dissolved inorganic carbon and nitrate
S. Ono��*, A. Ennyu�, R.G. Najjar�, N.R. Bates�
�Department of Geosciences, The Pennsylvania State University, University Park, PA 16802, USA�Bermuda Biological Station for Research, Inc., 17 Biological Lane, Ferry Reach GE 01, Bermuda
Abstract
A diagnostic model of the mean annual cycles of oxygen, dissolved inorganic carbon (DIC) and nitratebelow the mixed layer at the Bermuda Atlantic Time-Series Study (BATS) site is presented and used toestimate organic matter remineralization in the seasonal thermocline. The model includes lateral and verticaladvection as well as vertical di!usion, which are found to be signi"cant components of the seasonal budgetsof oxygen, DIC and nitrate. The vertical and seasonal variation of the remineralization rates deduced fromthe oxygen and DIC distributions are very similar. Both locate the spring}summer community compensationdepth at &85 m and the remineralization rate maximum at &120 m; nitrate-based estimates of these depthsare about 40 m greater. Remineralization rates based on oxygen, DIC and nitrate all show the seasonalmaximum to occur in the late spring, presumably re#ecting the decomposition of organic matter formedduring the spring bloom. The remineralization rate integrated between 100 and 250 m and between mid-Apriland mid-December is estimated to be 2.08$0.38 mol O
�m��, 1.53$0.35 mol C m�� and
0.080$0.046 mol N m��. These imply remineralization ratios of O�
: C"1.4$0.40 and C : N"19$12.The former agrees well with the canonical Red"eld ratio and the latter is signi"cantly larger. The analysis isconsistent with the export and remineralization of nitrogen-poor organic matter from surfacewaters. � 2001 Elsevier Science Ltd. All rights reserved.
1. Introduction
The ocean's `biological pumpa, characterized by net production of organic matter in surfacewaters and net remineralization in deeper waters, maintains vertical gradients in a myriad of
0967-0645/01/$ - see front matter � 2001 Elsevier Science Ltd. All rights reserved.PII: S 0 9 6 7 - 0 6 4 5 ( 0 0 ) 0 0 1 5 4 - 5
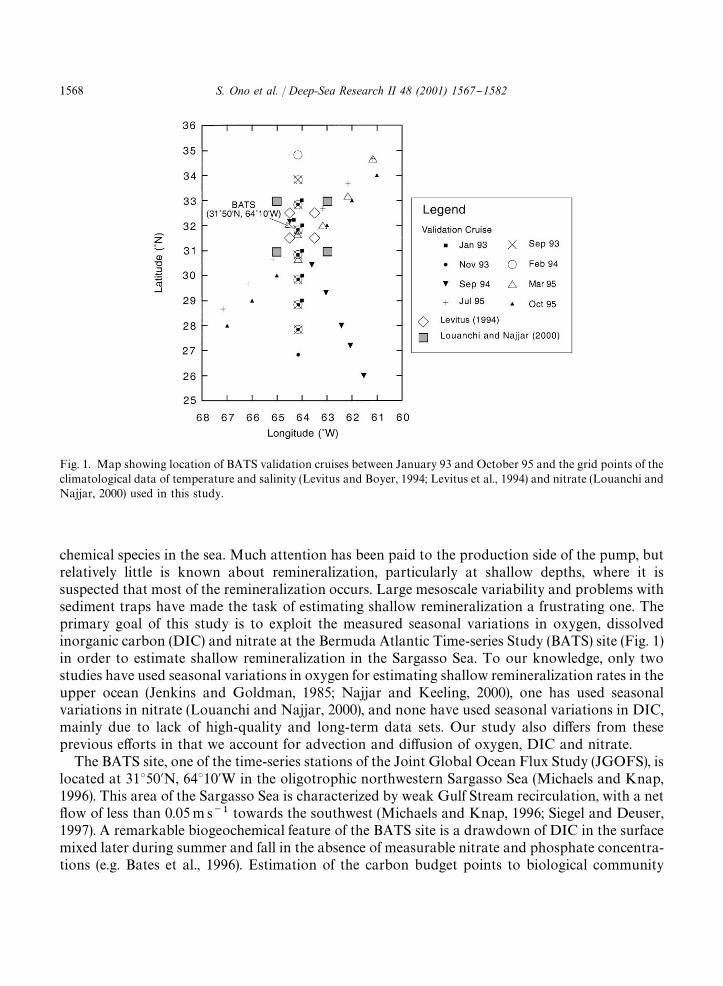
Fig. 1. Map showing location of BATS validation cruises between January 93 and October 95 and the grid points of theclimatological data of temperature and salinity (Levitus and Boyer, 1994; Levitus et al., 1994) and nitrate (Louanchi andNajjar, 2000) used in this study.
chemical species in the sea. Much attention has been paid to the production side of the pump, butrelatively little is known about remineralization, particularly at shallow depths, where it issuspected that most of the remineralization occurs. Large mesoscale variability and problems withsediment traps have made the task of estimating shallow remineralization a frustrating one. Theprimary goal of this study is to exploit the measured seasonal variations in oxygen, dissolvedinorganic carbon (DIC) and nitrate at the Bermuda Atlantic Time-series Study (BATS) site (Fig. 1)in order to estimate shallow remineralization in the Sargasso Sea. To our knowledge, only twostudies have used seasonal variations in oxygen for estimating shallow remineralization rates in theupper ocean (Jenkins and Goldman, 1985; Najjar and Keeling, 2000), one has used seasonalvariations in nitrate (Louanchi and Najjar, 2000), and none have used seasonal variations in DIC,mainly due to lack of high-quality and long-term data sets. Our study also di!ers from theseprevious e!orts in that we account for advection and di!usion of oxygen, DIC and nitrate.
The BATS site, one of the time-series stations of the Joint Global Ocean Flux Study (JGOFS), islocated at 31350�N, 64310�W in the oligotrophic northwestern Sargasso Sea (Michaels and Knap,1996). This area of the Sargasso Sea is characterized by weak Gulf Stream recirculation, with a net#ow of less than 0.05 m s�� towards the southwest (Michaels and Knap, 1996; Siegel and Deuser,1997). A remarkable biogeochemical feature of the BATS site is a drawdown of DIC in the surfacemixed later during summer and fall in the absence of measurable nitrate and phosphate concentra-tions (e.g. Bates et al., 1996). Estimation of the carbon budget points to biological community
1568 S. Ono et al. / Deep-Sea Research II 48 (2001) 1567}1582
production as the most important process (e.g. Michaels et al., 1994; Gruber et al., 1998).Horizontal advection of low DIC water also has been invoked to explain the DIC drawdown in thesurface water during May}October (Toggweiler, 1994). However, the lateral gradients of DIC arereported to be too small (Bates et al., 1996). Nitrogen "xation is considered to be a source ofnitrogen to support new production during summer and fall (e.g. Gruber and Sarmiento, 1997), asis mesoscale eddy pumping (Siegel et al., 1999; McGillicuddy et al., 1999), though the latter is alsopresumably a source of DIC and so does not help to resolve the strong non-Red"eld character ofthe drawdown. Some have also speculated that nitrogen is preferentially recycled in the euphoticzone, leaving the organic matter exported relatively carbon rich and nitrogen poor. If this were thecase, one should expect the subsequent remineralization also to have a high C : N ratio. Thus,a secondary goal of this study is to shed light on the nature of net community production at theBATS site by analyzing the rates of decomposition implied by the seasonal variations in oxygen,DIC and nitrate.
To avoid the di$culties of estimating the impact of mixed layer entrainment on these seasonalvariations, we focus our attention on the period from April through December, when the mixedlayer is shoaling or only slightly deepening. We do consider, however, vertical mixing in theseasonal thermocline, as well as vertical and lateral advection. The basic approach is to estimatelateral advection from climatological estimates of the geostrophic #ow, vertical advection from theEkman balance, and then to tune the vertical di!usivity to best match the temperature distribution.Remineralization is then determined diagnostically from the oxygen, DIC and nitrate budgets. Theapproach is conceptually similar to that adopted by Gruber et al. (1998) for the mixed layer budgetsof DIC and ��C at the BATS site.
The main data sets we draw on in this study are the temperature, DIC, oxygen and nitratemeasurements made at the BATS site, in addition to measurements of these variables (and salinity)from `validation cruisesa (Fig. 1). The latter, together with climatological estimates of temperature,salinity, nitrate and oxygen are used to estimate lateral advection of heat, oxygen, DIC and nitrate.
2. Mean annual cycles of oxygen, DIC and nitrate
BATS core data from 1992 to 1998 (http://www.bbsr.edu) were used to construct mean annualcycles of temperature, oxygen, DIC, and nitrate (actually, nitrate#nitrite). BATS core measure-ments were made monthly except during the spring bloom period (February}April) when biweeklymeasurements are made. Data were available at 11 standard depths in the top 250 m: 2.5, 10, 20, 40,60, 80, 100, 140, 160, 200 and 250 m. Mean annual cycles of each property at these depths wereconstructed by using a weighted moving average. The discrete data for each depth were averagedonto a temporal grid with 15-day intervals using a weighting factor with a normal distribution:
��(t)"exp��
t�!t� �
�
�, (1)
where t is time of year in days (0}365), n is the index of the discrete data point, and � is a time scalefor averaging. In order to obtain smooth mean annual cycles at each depth, we chose �"35 daysand an averaging window of 50 days. The seasonal amplitudes of DIC, O
�and nitrate obtained
S. Ono et al. / Deep-Sea Research II 48 (2001) 1567}1582 1569
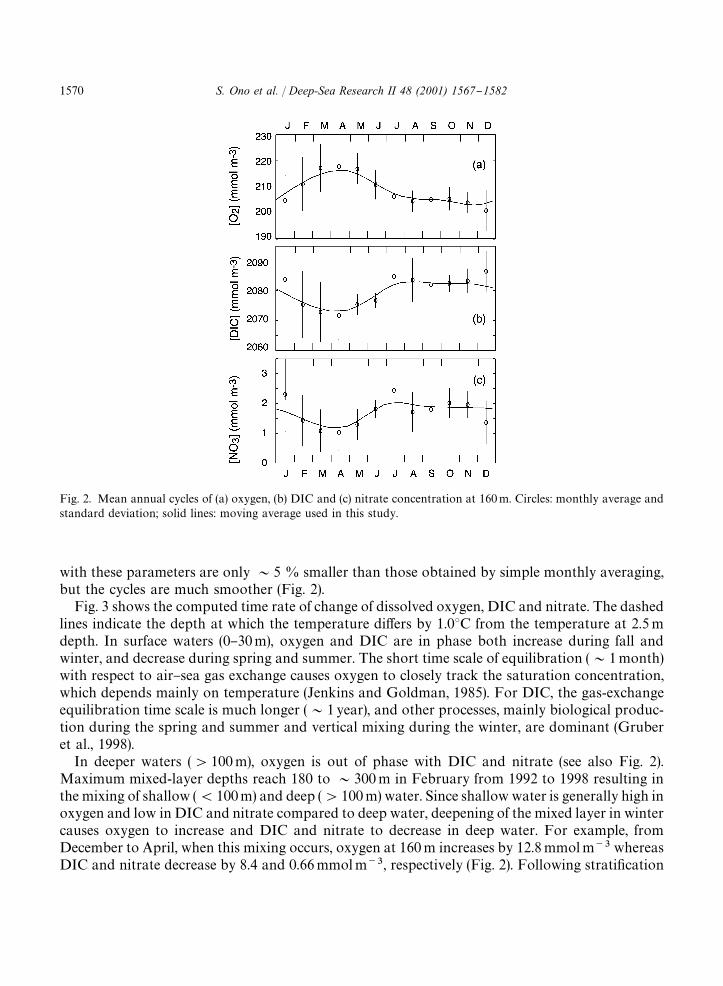
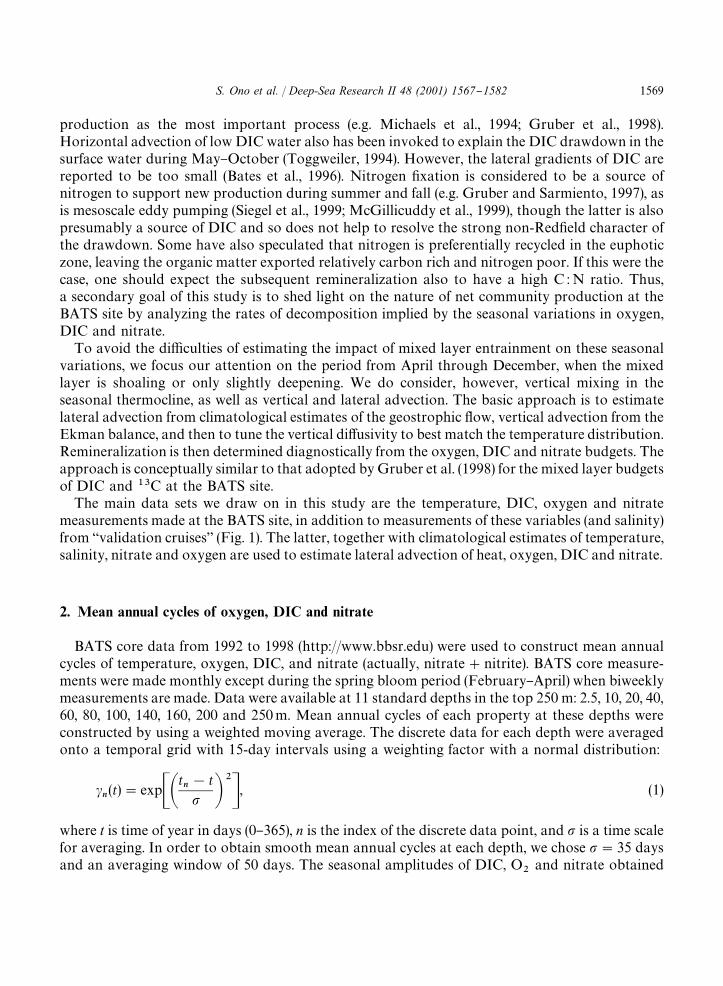
Fig. 2. Mean annual cycles of (a) oxygen, (b) DIC and (c) nitrate concentration at 160 m. Circles: monthly average andstandard deviation; solid lines: moving average used in this study.
with these parameters are only &5 % smaller than those obtained by simple monthly averaging,but the cycles are much smoother (Fig. 2).
Fig. 3 shows the computed time rate of change of dissolved oxygen, DIC and nitrate. The dashedlines indicate the depth at which the temperature di!ers by 1.03C from the temperature at 2.5 mdepth. In surface waters (0}30 m), oxygen and DIC are in phase both increase during fall andwinter, and decrease during spring and summer. The short time scale of equilibration (&1 month)with respect to air}sea gas exchange causes oxygen to closely track the saturation concentration,which depends mainly on temperature (Jenkins and Goldman, 1985). For DIC, the gas-exchangeequilibration time scale is much longer (&1 year), and other processes, mainly biological produc-tion during the spring and summer and vertical mixing during the winter, are dominant (Gruberet al., 1998).
In deeper waters ('100 m), oxygen is out of phase with DIC and nitrate (see also Fig. 2).Maximum mixed-layer depths reach 180 to &300 m in February from 1992 to 1998 resulting inthe mixing of shallow ((100 m) and deep ('100 m) water. Since shallow water is generally high inoxygen and low in DIC and nitrate compared to deep water, deepening of the mixed layer in wintercauses oxygen to increase and DIC and nitrate to decrease in deep water. For example, fromDecember to April, when this mixing occurs, oxygen at 160 m increases by 12.8 mmol m�� whereasDIC and nitrate decrease by 8.4 and 0.66 mmol m��, respectively (Fig. 2). Following strati"cation
1570 S. Ono et al. / Deep-Sea Research II 48 (2001) 1567}1582
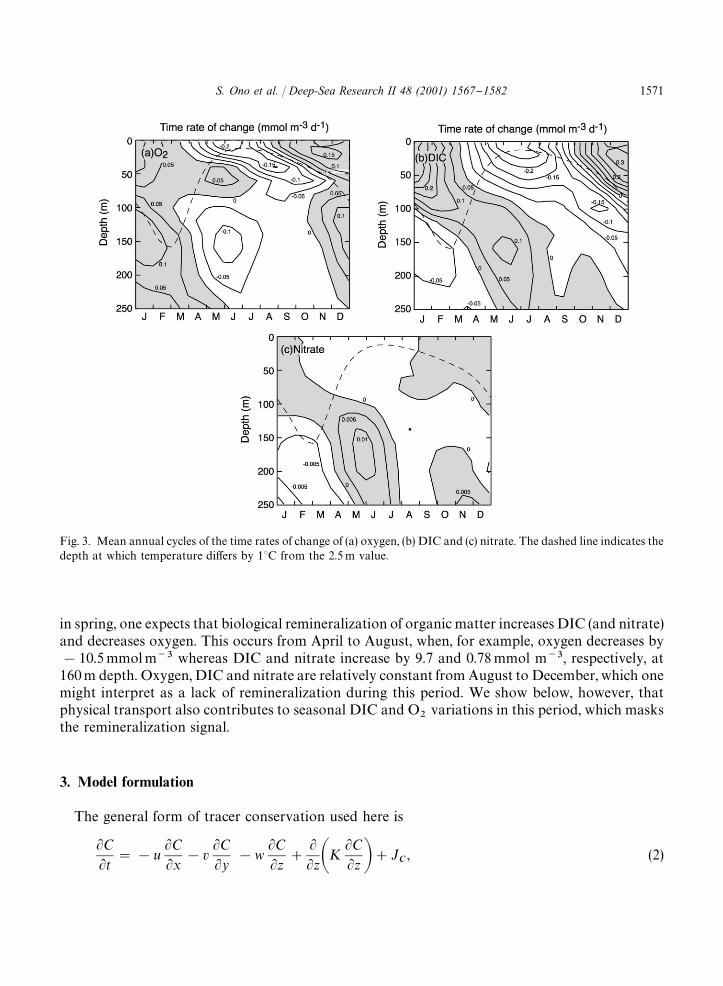
Fig. 3. Mean annual cycles of the time rates of change of (a) oxygen, (b) DIC and (c) nitrate. The dashed line indicates thedepth at which temperature di!ers by 13C from the 2.5 m value.
in spring, one expects that biological remineralization of organic matter increases DIC (and nitrate)and decreases oxygen. This occurs from April to August, when, for example, oxygen decreases by!10.5 mmol m�� whereas DIC and nitrate increase by 9.7 and 0.78 mmol m��, respectively, at160 m depth. Oxygen, DIC and nitrate are relatively constant from August to December, which onemight interpret as a lack of remineralization during this period. We show below, however, thatphysical transport also contributes to seasonal DIC and O
�variations in this period, which masks
the remineralization signal.
3. Model formulation
The general form of tracer conservation used here is
�C�t
"!u�C�x
!v�C�y
!w�C�z
#
��z�K
�C�z �#J
�, (2)
S. Ono et al. / Deep-Sea Research II 48 (2001) 1567}1582 1571
where C represents temperature, or the concentration of oxygen, DIC or nitrate; u, v and w are thevelocity components; K is the vertical di!usivity, and J
�is an internal source term. For temper-
ature, J�
represents the e!ect of solar radiation that penetrates below the mixed layer. For oxygen,DIC and nitrate, J
�represents the net e!ects of photosynthesis and respiration.
The surface solar radiation is speci"ed as a simple sinusoidal "t to data of Musgrave et al. (1988).The mean and amplitude are 180 and 80 W m��, respectively, and the maximum occurs on July13th. Following Paulson and Simpson (1977), solar radiation is parameterized as a function ofdepth by a double exponential with coe$cients for Jerlov water type I.
Horizontal velocities, u and v, were assumed to be geostrophic and were computed fromclimatological temperature and salinity data of Levitus and Boyer (1994) and Levitus et al. (1994),and the thermal wind equations. The approach is similar to that of Siegel and Deuser (1997). Toobtain the seasonality of lateral advection, we used the `seasonala (three-month averaged) data.The four grid points surrounding the BATS site were selected (Fig. 1). The density of water wascalculated using the formulation of Millero and Poisson (1981), and longitudinal and latitudinaldensity gradients were computed using averaged density for each x and y component. Velocitieswere computed for the upper 250 m assuming a level of no motion at 3000 m. The four seasonalvalues of velocities and T and S gradients were "t with a single harmonic to obtain values every 15days. The calculated geostrophic #ow is from northeast to southwest at the rate of 0.02}0.03 m s��in the upper 200 m, consistent with the calculation of Siegel and Deuser (1997).
The horizontal gradients of oxygen and DIC were estimated from BATS validation cruise data,which were collected from the Sargasso Sea between &263N and &353N at di!erent times of theyear. (Fig. 1). Data are sparse, and only eight transects are available from 1993 to 1995, mainly innorth}south and northeast}southwest directions. We assumed a simple linear relationship betweenthe horizontal gradient of oxygen (and DIC) and temperature and salinity. That is,
�[O�] (or �[DIC])"��¹#��S, (3)
where �[O�], �[DIC], �T and �S represent the di!erence between data for a given cast and the
cast closest to the BATS site. � and � are coe$cients determined by least-squares "t as a function ofdepth but independent of time. Both � [O
�] and � [DIC] correlate well with �S and �T in surface
waters (0}100 m, r"0.5}0.9, N+30), re#ecting the inverse temporal correlation of surface DICand oxygen with temperature noted above. Salinity also presumably helps the goodness of the "t,particularly for DIC, which can be signi"cantly a!ected by evaporation and precipitation (Najjar,1992). However, the goodness of "t decreases with increasing depth (for 100}250 m, r"0.3}0.9,N+30), suggesting that mesoscale eddy or biological processes may predominate. The uncertaintyin the lateral advection of oxygen and DIC may therefore be large. We estimate horizontalgradients of O
�and DIC using the coe$cients from Eq. (3). For example, the horizontal gradient of
oxygen for the east}west direction is estimated to be
�[O�]
�x"�
�¹
�x#�
�S�x
. (4)
The horizontal gradient of nitrate was computed from climatological data of Louanchi and Najjar(2000) interpolated to a regular 23 grid. The monthly data were linearly interpolated at 15 daysincrements with respect to time at the four closest grid points surrounding the BATS site (Fig. 1).
1572 S. Ono et al. / Deep-Sea Research II 48 (2001) 1567}1582
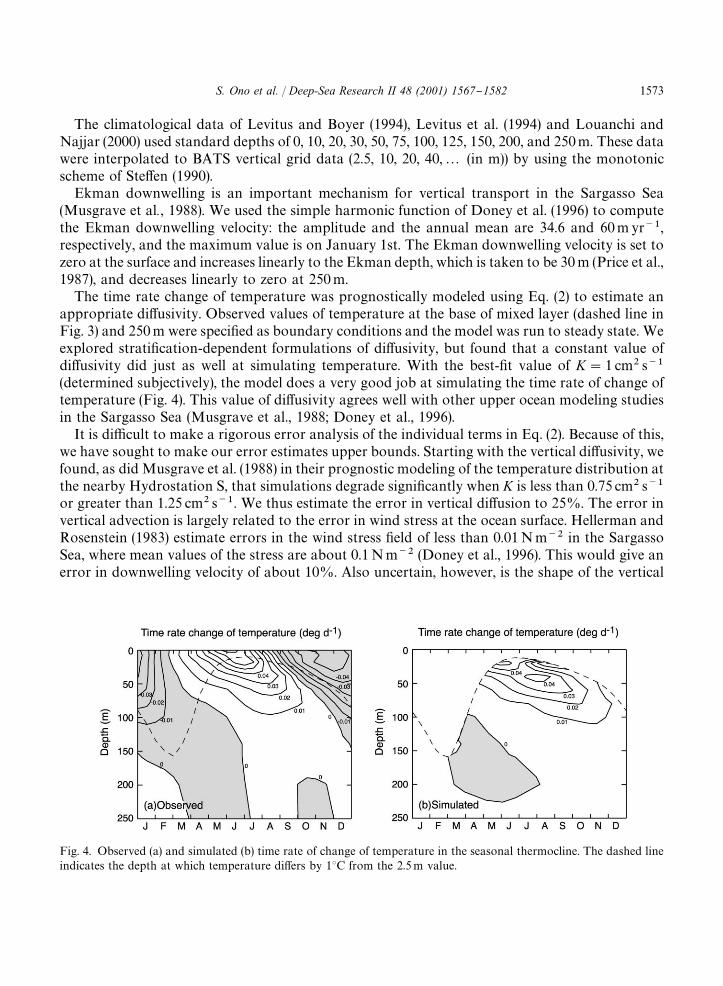
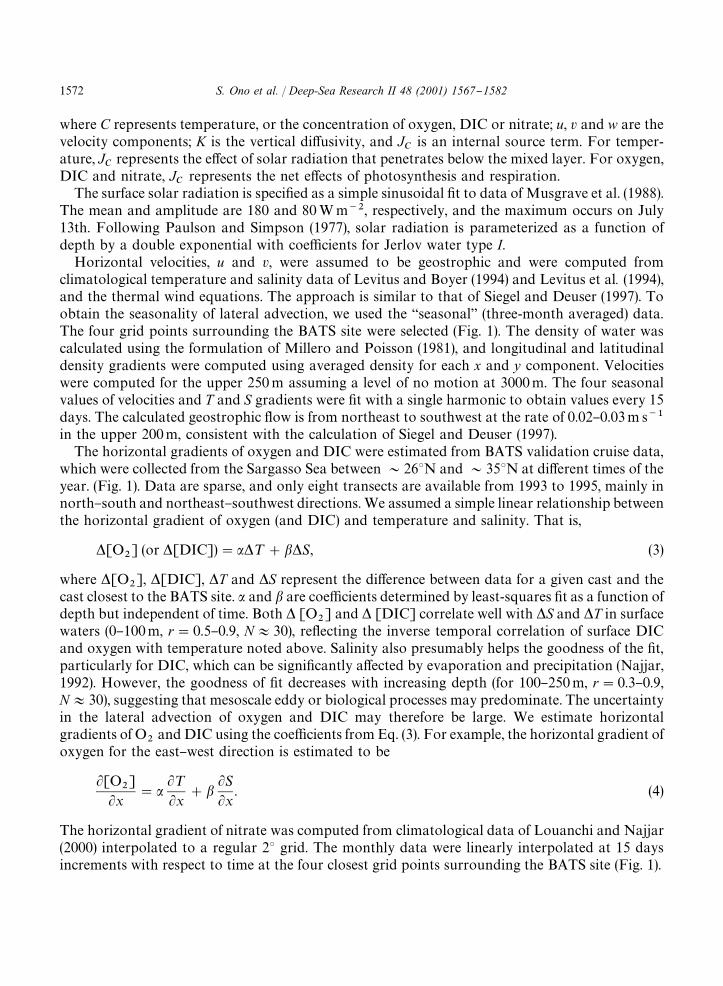
Fig. 4. Observed (a) and simulated (b) time rate of change of temperature in the seasonal thermocline. The dashed lineindicates the depth at which temperature di!ers by 13C from the 2.5 m value.
The climatological data of Levitus and Boyer (1994), Levitus et al. (1994) and Louanchi andNajjar (2000) used standard depths of 0, 10, 20, 30, 50, 75, 100, 125, 150, 200, and 250 m. These datawere interpolated to BATS vertical grid data (2.5, 10, 20, 40,2 (in m)) by using the monotonicscheme of Ste!en (1990).
Ekman downwelling is an important mechanism for vertical transport in the Sargasso Sea(Musgrave et al., 1988). We used the simple harmonic function of Doney et al. (1996) to computethe Ekman downwelling velocity: the amplitude and the annual mean are 34.6 and 60 m yr��,respectively, and the maximum value is on January 1st. The Ekman downwelling velocity is set tozero at the surface and increases linearly to the Ekman depth, which is taken to be 30 m (Price et al.,1987), and decreases linearly to zero at 250 m.
The time rate change of temperature was prognostically modeled using Eq. (2) to estimate anappropriate di!usivity. Observed values of temperature at the base of mixed layer (dashed line inFig. 3) and 250 m were speci"ed as boundary conditions and the model was run to steady state. Weexplored strati"cation-dependent formulations of di!usivity, but found that a constant value ofdi!usivity did just as well at simulating temperature. With the best-"t value of K"1 cm� s��(determined subjectively), the model does a very good job at simulating the time rate of change oftemperature (Fig. 4). This value of di!usivity agrees well with other upper ocean modeling studiesin the Sargasso Sea (Musgrave et al., 1988; Doney et al., 1996).
It is di$cult to make a rigorous error analysis of the individual terms in Eq. (2). Because of this,we have sought to make our error estimates upper bounds. Starting with the vertical di!usivity, wefound, as did Musgrave et al. (1988) in their prognostic modeling of the temperature distribution atthe nearby Hydrostation S, that simulations degrade signi"cantly when K is less than 0.75 cm� s��or greater than 1.25 cm� s��. We thus estimate the error in vertical di!usion to 25%. The error invertical advection is largely related to the error in wind stress at the ocean surface. Hellerman andRosenstein (1983) estimate errors in the wind stress "eld of less than 0.01 N m�� in the SargassoSea, where mean values of the stress are about 0.1 N m�� (Doney et al., 1996). This would give anerror in downwelling velocity of about 10%. Also uncertain, however, is the shape of the vertical
S. Ono et al. / Deep-Sea Research II 48 (2001) 1567}1582 1573
Fig. 5. The biological source minus sink term of inorganic carbon modeled from the (a) oxygen and (b) DIC budgets. (c)The biological source-minus-sink term of inorganic nitrogen calculated from the nitrate budget. An O
�:C ratio of
!138:103 was used to convert the O�-based estimate to carbon units.
velocity pro"le assumed. We therefore conservatively estimate the error in vertical advection to be25%. The error in lateral advection is potentially much larger. We assume that the lateraladvection error is 100%. Fortunately, as we show below, lateral advection is usually the smallestterm in oxygen and DIC budgets of the seasonal thermocline. Our error analysis is applied to thebudgets integrated between April 16 and December 12 (a period of 240 days) and 100 and 250 m.The error in the inventory change between April and December is computed from the error in theApril and December concentrations. These errors are computed as a weighted standard deviationdivided by the number of observations, where the weighting factor from Eq. (1) is used.
4. Results and discussion
4.1. Distribution of remineralization
The biological source terms for oxygen (J��
), DIC (J��
) and nitrate (J��
), determined diagnos-tically from Eq. (4) are shown in Fig. 5. J
��has been multiplied by the canonical O
�: C Red"eld
1574 S. Ono et al. / Deep-Sea Research II 48 (2001) 1567}1582
ratio (O�
: C"!138 : 103) to highlight the similarities in the respiration and photosynthetic ratescomputed using oxygen and DIC. We will show below that our best estimate of the O
�: C ratio
during remineralization is in fact very close to the canonical value. J��
, on the other hand, hasbeen left in nitrogen units. Both J
��and J
��reveal a respiration maximum at 120 m in the spring,
with corresponding values of 1.4 and 1.3 mmol C m�� d��, respectively. The respiration ratedecreases with depth below 120 m and throughout the summer and fall. Both J
��and J
��also
imply that the community compensation depth (de"ned here by the depth at which J"0) is&80 m in the spring and summer. A clear signal of sub-mixed layer new production, responsiblefor producing the shallow oxygen maximum (Shulenberger and Reid, 1981; Hayward, 1994), is seenabove this depth. The pattern of J
��is similar to J
��and J
��, though shifted to greater depths:
the spring maximum, which has a value of 0.010 mol N m�� d��, is located at &140 m, and thecommunity compensation depth is &120 m on average in the spring and summer.
A remarkable feature of our analysis is the spring maximum in remineralization, which must bean artifact of the spring bloom in surface waters. It is well known that primary production andparticle #uxes are a maximum in spring at the BATS site (Michaels and Knap, 1996). Thesubsurface drawdown in dissolved organic carbon (DOC), which contributes signi"cantly to thecarbon budget at these depths, is greatest during this time as well (Carlson et al., 1994). To ourknowledge, the signal of the spring bloom has not been seen before in analyses of oxygen, DIC andnitrate distributions. Previous studies of the oxygen anomaly (the departure from saturation) in theshallow aphotic zone (Jenkins and Goldman, 1985; Najjar and Keeling, 1997) show gradualdeclines from spring to fall, not the abrupt decrease we see here. It is presumably the higher qualityand quantity of the BATS data compared to earlier measurements that has allowed this signal toemerge.
Another important result is our estimate of the community compensation depth, which separatesthe zone of net photosynthesis from net respiration. As such, the compensation depth is a veryimportant biogeochemical boundary. The more-frequently measured 1% light level is oftenimplicitly used as this boundary, but clearly there is nothing special about 1%, or even why thecompensation depth should be directly related to the fraction of surface light reaching a certaindepth. Unfortunately, the compensation depth is rarely measured directly. The analysis of theannual cycle of the oxygen anomaly by Jenkins and Goldman (1985) at Hydrostation S suggestsa compensation depth of about 80 m, as does a similar analysis of the zonal mean O
�anomaly at
303N in the Atlantic Ocean (Najjar and Keeling, 1997). This latter study suggested that the absoluteirradiance (not the fraction of surface irradiance) is an important controlling factor of thecompensation depth. What is not clear is why the compensation depth based on the nitratedistribution is signi"cantly deeper. One possible explanation is that nitri"cation, unlike theoxidation of organic carbon, is light inhibited.
4.2. Relative importance of physical transport
To evaluate the relative importance of various terms in the modeled oxygen, DIC and nitratebudgets in the seasonal thermocline, we present in Fig. 6 the vertical distribution of these termsaveraged from April 16 to December 12 (a period of 240 days, about 2/3 of the year). It is clearfrom this "gure that physical transport is a signi"cant component of the oxygen, DIC andnitrate budgets. Had we estimated remineralization from the seasonal drawdown of oxygen or
S. Ono et al. / Deep-Sea Research II 48 (2001) 1567}1582 1575
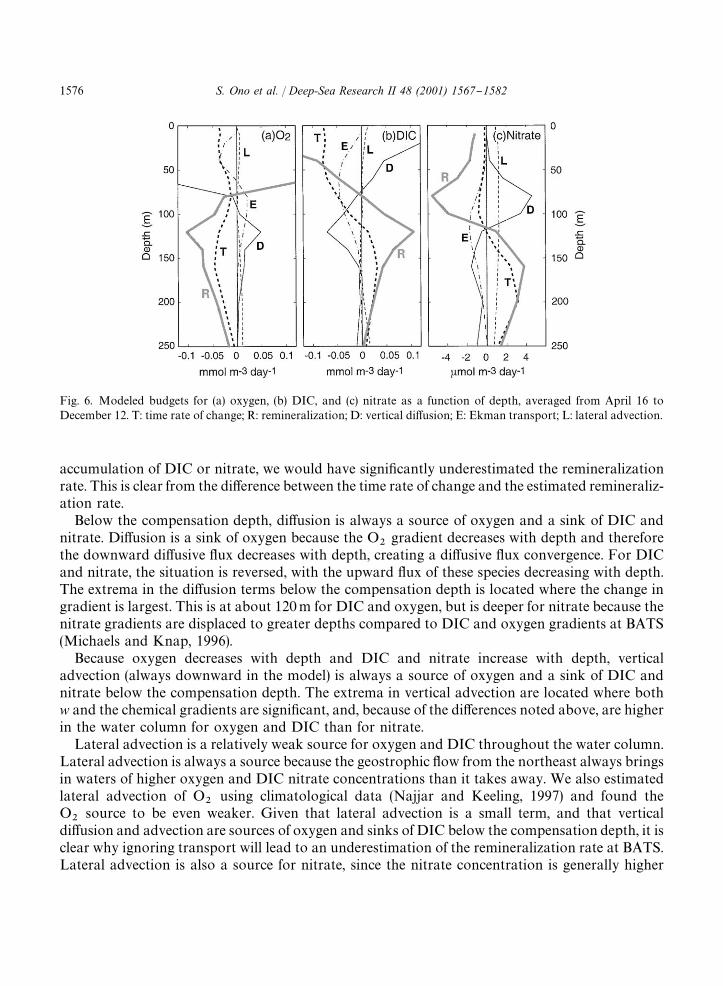
Fig. 6. Modeled budgets for (a) oxygen, (b) DIC, and (c) nitrate as a function of depth, averaged from April 16 toDecember 12. T: time rate of change; R: remineralization; D: vertical di!usion; E: Ekman transport; L: lateral advection.
accumulation of DIC or nitrate, we would have signi"cantly underestimated the remineralizationrate. This is clear from the di!erence between the time rate of change and the estimated remineraliz-ation rate.
Below the compensation depth, di!usion is always a source of oxygen and a sink of DIC andnitrate. Di!usion is a sink of oxygen because the O
�gradient decreases with depth and therefore
the downward di!usive #ux decreases with depth, creating a di!usive #ux convergence. For DICand nitrate, the situation is reversed, with the upward #ux of these species decreasing with depth.The extrema in the di!usion terms below the compensation depth is located where the change ingradient is largest. This is at about 120 m for DIC and oxygen, but is deeper for nitrate because thenitrate gradients are displaced to greater depths compared to DIC and oxygen gradients at BATS(Michaels and Knap, 1996).
Because oxygen decreases with depth and DIC and nitrate increase with depth, verticaladvection (always downward in the model) is always a source of oxygen and a sink of DIC andnitrate below the compensation depth. The extrema in vertical advection are located where bothw and the chemical gradients are signi"cant, and, because of the di!erences noted above, are higherin the water column for oxygen and DIC than for nitrate.
Lateral advection is a relatively weak source for oxygen and DIC throughout the water column.Lateral advection is always a source because the geostrophic #ow from the northeast always bringsin waters of higher oxygen and DIC nitrate concentrations than it takes away. We also estimatedlateral advection of O
�using climatological data (Najjar and Keeling, 1997) and found the
O�
source to be even weaker. Given that lateral advection is a small term, and that verticaldi!usion and advection are sources of oxygen and sinks of DIC below the compensation depth, it isclear why ignoring transport will lead to an underestimation of the remineralization rate at BATS.Lateral advection is also a source for nitrate, since the nitrate concentration is generally higher
1576 S. Ono et al. / Deep-Sea Research II 48 (2001) 1567}1582
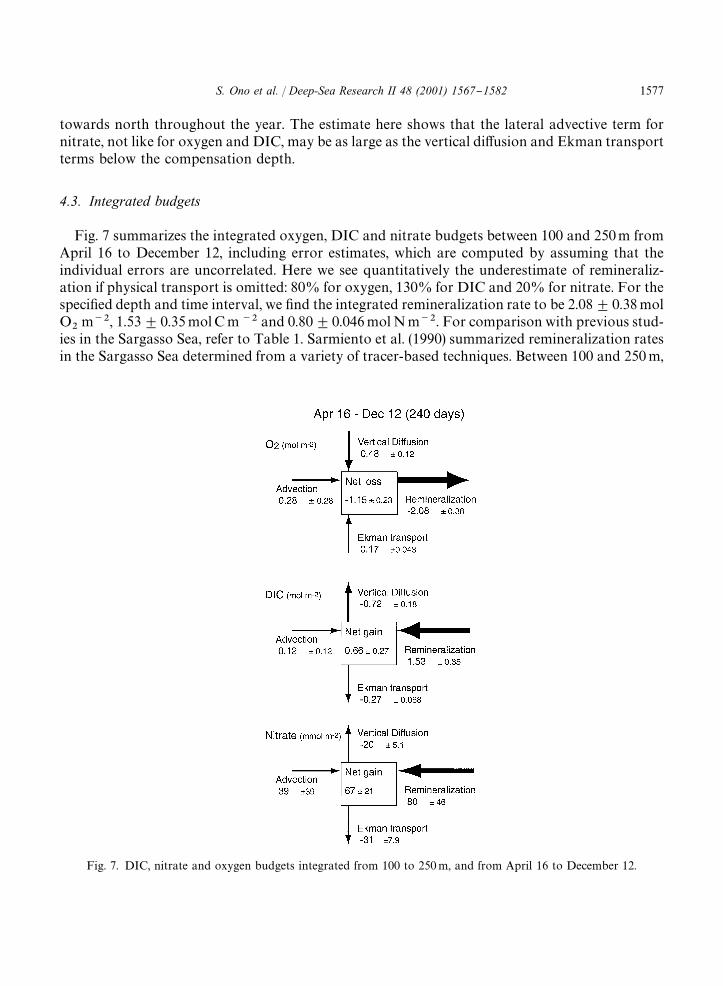
Fig. 7. DIC, nitrate and oxygen budgets integrated from 100 to 250 m, and from April 16 to December 12.
towards north throughout the year. The estimate here shows that the lateral advective term fornitrate, not like for oxygen and DIC, may be as large as the vertical di!usion and Ekman transportterms below the compensation depth.
4.3. Integrated budgets
Fig. 7 summarizes the integrated oxygen, DIC and nitrate budgets between 100 and 250 m fromApril 16 to December 12, including error estimates, which are computed by assuming that theindividual errors are uncorrelated. Here we see quantitatively the underestimate of remineraliz-ation if physical transport is omitted: 80% for oxygen, 130% for DIC and 20% for nitrate. For thespeci"ed depth and time interval, we "nd the integrated remineralization rate to be 2.08$0.38 molO
�m��, 1.53$0.35 mol C m �� and 0.80$0.046 mol N m��. For comparison with previous stud-
ies in the Sargasso Sea, refer to Table 1. Sarmiento et al. (1990) summarized remineralization ratesin the Sargasso Sea determined from a variety of tracer-based techniques. Between 100 and 250 m,
S. Ono et al. / Deep-Sea Research II 48 (2001) 1567}1582 1577
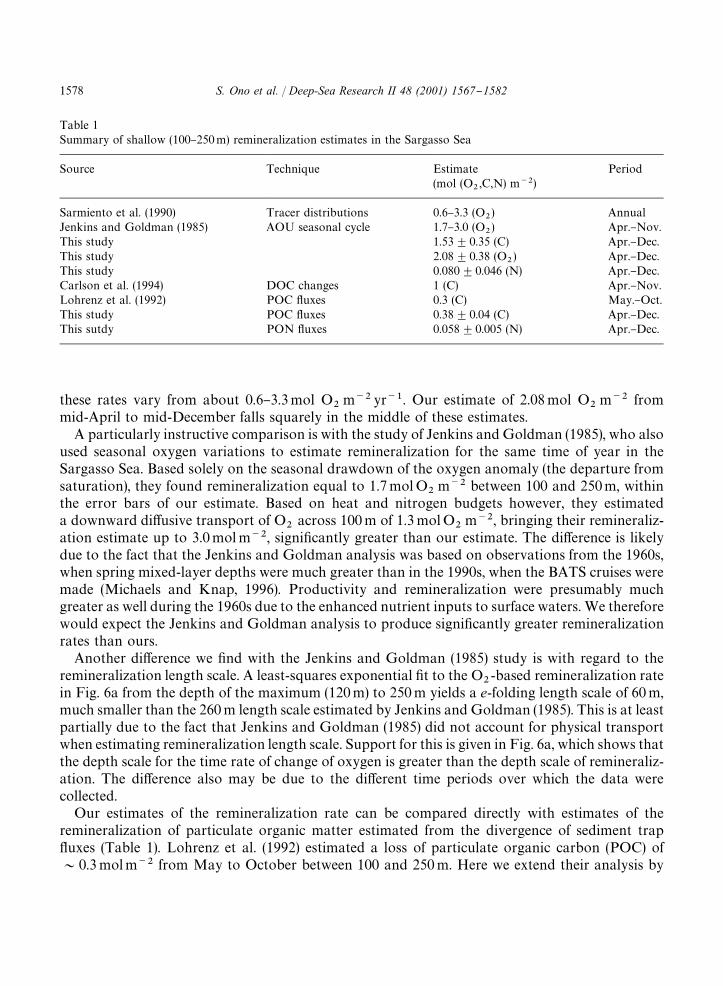
Table 1Summary of shallow (100}250 m) remineralization estimates in the Sargasso Sea
Source Technique Estimate Period(mol (O
�,C,N) m��)
Sarmiento et al. (1990) Tracer distributions 0.6}3.3 (O�) Annual
Jenkins and Goldman (1985) AOU seasonal cycle 1.7}3.0 (O�) Apr.}Nov.
This study 1.53$0.35 (C) Apr.}Dec.This study 2.08$0.38 (O
�) Apr.}Dec.
This study 0.080$0.046 (N) Apr.}Dec.Carlson et al. (1994) DOC changes 1 (C) Apr.}Nov.Lohrenz et al. (1992) POC #uxes 0.3 (C) May.}Oct.This study POC #uxes 0.38$0.04 (C) Apr.}Dec.This sutdy PON #uxes 0.058$0.005 (N) Apr.}Dec.
these rates vary from about 0.6}3.3 mol O�
m�� yr��. Our estimate of 2.08 mol O�
m�� frommid-April to mid-December falls squarely in the middle of these estimates.
A particularly instructive comparison is with the study of Jenkins and Goldman (1985), who alsoused seasonal oxygen variations to estimate remineralization for the same time of year in theSargasso Sea. Based solely on the seasonal drawdown of the oxygen anomaly (the departure fromsaturation), they found remineralization equal to 1.7 mol O
�m�� between 100 and 250 m, within
the error bars of our estimate. Based on heat and nitrogen budgets however, they estimateda downward di!usive transport of O
�across 100 m of 1.3 mol O
�m��, bringing their remineraliz-
ation estimate up to 3.0 mol m��, signi"cantly greater than our estimate. The di!erence is likelydue to the fact that the Jenkins and Goldman analysis was based on observations from the 1960s,when spring mixed-layer depths were much greater than in the 1990s, when the BATS cruises weremade (Michaels and Knap, 1996). Productivity and remineralization were presumably muchgreater as well during the 1960s due to the enhanced nutrient inputs to surface waters. We thereforewould expect the Jenkins and Goldman analysis to produce signi"cantly greater remineralizationrates than ours.
Another di!erence we "nd with the Jenkins and Goldman (1985) study is with regard to theremineralization length scale. A least-squares exponential "t to the O
�-based remineralization rate
in Fig. 6a from the depth of the maximum (120 m) to 250 m yields a e-folding length scale of 60 m,much smaller than the 260 m length scale estimated by Jenkins and Goldman (1985). This is at leastpartially due to the fact that Jenkins and Goldman (1985) did not account for physical transportwhen estimating remineralization length scale. Support for this is given in Fig. 6a, which shows thatthe depth scale for the time rate of change of oxygen is greater than the depth scale of remineraliz-ation. The di!erence also may be due to the di!erent time periods over which the data werecollected.
Our estimates of the remineralization rate can be compared directly with estimates of theremineralization of particulate organic matter estimated from the divergence of sediment trap#uxes (Table 1). Lohrenz et al. (1992) estimated a loss of particulate organic carbon (POC) of&0.3 mol m�� from May to October between 100 and 250 m. Here we extend their analysis by
1578 S. Ono et al. / Deep-Sea Research II 48 (2001) 1567}1582
including more observations (1989}1998) and the PON #ux. These data were also obtained fromthe BATS web site. Measurements were made at 150, 200 and 300 m. Estimates at 250 m were madeby linear interpolation and at 100 m by multiplying the #ux at 150 m by 1.5, following the Martinet al. (1987) #ux scaling. The decreases in POC and PON #uxes are estimated to be0.38$0.04 mol C m�� and 0.058$0.005 mol N m�� from April to December, where the errorestimates are computed from the standard deviation divided by the square root of the number ofobservations. These carbon and nitrogen #uxes are 24 and 51% of our remineralization estimates,respectively. These are probably lower bounds, however, since it is believed that sediment traps atBATS underestimate the particle #ux by as much as a factor of 2 (Michaels et al., 1994).
Dissolved organic matter also contributes signi"cantly to remineralization in the Sargasso Sea.Carlson et al. (1994) observed a drawdown of about 1 mol m�� of DOC from spring to fall.Observations of dissolved organic nitrogen (DON), are much less conclusive (Carlson, personalcommunication). These estimates of DOC and DON loss, however, do not account for physicaltransport. Because the concentration and vertical gradient of dissolved organic matter generallydecrease with depth, we would expect that vertical advection and di!usion are sources of DOC andDON in the seasonal thermocline, similar to oxygen. Thus, it seems likely that the estimates ofbiological DOC and DON losses are lower bounds. In consideration of the potential errors, weconclude that the remineralization rates for carbon and nitrogen estimated here are consistent withthe observed loss of particulate and dissolved organic carbon and nitrogen in the shallow aphoticzone at BATS.
It is also useful to compare the remineralization estimates made here to new productionestimates. Summaries of new production estimates in the Sargasso Sea have been made by manyauthors. The most recent summary (Gruber et al., 1998) shows a new production range of2}4 mol C m�� yr��. Thus, it appears that about 60$20% of annual new production is re-mineralized between 100 and 250 m between April and December.
4.4. Redxeld ratios
The Red"eld ratios during remineralization in the seasonal thermocline at BATS, taken from therates in Fig. 7, yield an O
�: C ratio of 1.4$0.40 and a C : N ratio of 19$12. Here, the errors
(assumed to be uncorrelated) are mainly derived from the errors in the net change and lateraladvection terms. The O
�: C ratio is in excellent agreement with the canonical value of the Red"eld
ratio. The most recent analysis by Anderson (1995) provides an estimate of 1.4 for O�
: C. Had weignored physical transport in estimating remineralization, we would have found an O
�: C ratio of
1.7. This highlights the importance of physical transport to our analysis.The C : N ratio we estimate here is signi"cantly higher than the standard Red"eld ratio (6.6),
though the low end of our estimate is close to this value and in somewhat better agreement withanalyses made on deep isopycnal surfaces (&8, Takahashi et al., 1985). The compensation depthwith respect to nitrate is deeper than those with respect to oxygen and DIC. Between 100 and 120 mdepth, the nitrate budget shows net photosynthesis whereas the O
�and DIC budgets show net
remineralization (Fig. 6). Therefore, integrating between 100 and 250 m contributes to the highC : N ratio for remineralization. Integrating between 120 and 250 m, where the O
�, DIC and nitrate
budgets all show net remineralization, yield O�
: C and C : N remineralization ratios of 1.5$0.5and 13$6.8, respectively, still leaving us with a C : N ratio higher than the standard value.
S. Ono et al. / Deep-Sea Research II 48 (2001) 1567}1582 1579
The high C : N ratio of remineralization gives additional support to the notion that thesummertime DIC drawdown in surface water is of biological origin, and, furthermore, thatnitrogen-poor organic matter is exported from surface waters. The sediment trap #uxes weanalyzed above yield a C : N ratio in the implied remineralization of 6.6, in good agreement with thestandard Red"eld ratio. Thus, if these #uxes are correct then the C : N ratio of the respired dissolvedorganic matter (DOM) is signi"cantly higher than 13$6.8. If the particulate #uxes are actually toolow, as suspected by Michaels et al. (1994), then the C : N ratio in the respired DOM is even higher.
What are the implications for the nitrogen budget at BATS? Somehow, nitrogen- poor organicmatter is being created and exported to depth, largely in dissolved form. Clearly, the results areconsistent with a preferential recycling of nitrogen in surface waters, but nitrogen "xation cannotbe ruled out either. Nitrogen-"xing bacteria, such as Trichodesmium, which are abundant in theSargasso Sea, use a carbohydrate ballast to control their buoyancy, and therefore have thepotential of creating organic matter with a C : N ratio substantially higher than the Red"eld ratio(Michaels et al., 1994).
5. Conclusions
For the "rst time seasonal variations in oxygen, DIC and nitrate have been exploited simulta-neously to estimate remineralization rates and Red"eld ratios in the shallow aphotic zone. Theseare important but elusive quantities for modeling marine biogeochemical cycles. We "nd that it isextremely important to quantify physical transport in order to make reliable estimates of shallowremineralization. The derived rates for carbon are consistent with direct observations of the loss ofPOC and DOC in the seasonal thermocline at BATS. The derived O
�: C remineralization ratio is
in good agreement with the standard Red"eld value, but the C : N ratio is much higher, suggestingan export of nitrogen-poor organic matter from surface waters. It seems likely that the lion's shareof this organic matter is in dissolved form. Any e!orts, therefore, at elucidating the strongnon-Red"eld character of the Sargasso Sea, should focus on the dynamics of dissolved organicmatter.
Acknowledgements
We wish to thank all the researchers at BBSR who made this study possible by creatinga high-quality data set and making it readily accessible. Thanks also to two anonymous reviewersfor their constructive criticism and to the editor for encouraging us to include the nitrate in ouranalysis. Finally, We wish to thank H. Ohmoto and M. A. Arthur for their encouragement duringthis study. A. Ennyu was supported by a graduate fellowship program of Yoshida ScholarshipFoundation, YKK Co. This research is supported by NASA Grant �NAD5-6451 to R. G. Najjar.
References
Anderson, L.A., 1995. On the hydrogen and oxygen content of marine phytoplankton. Deep-Sea Research I 42,1675}1680.
1580 S. Ono et al. / Deep-Sea Research II 48 (2001) 1567}1582
Bates, N.R., Michaels, A.F., Knap, A.H., 1996. Seasonal and interannual variability of ocean carbon dioxide species at theUS JGOFS Bermuda Atlantic Time-series Study (BATS) site. Deep-Sea Research II 43, 347}384.
Carlson, C.A., Ducklow, H.W., Michaels, A.F., 1994. Annual #ux of dissolved organic carbon from the euphotic zone inthe northwestern Sargasso Sea. Nature 371, 405}408.
Doney, S.C., Glover, D.M., Najjar, R.G., 1996. A new coupled, one-dimensional biological-physical model for the upperocean: applications to the JGOFS Bermuda Atlantic Time-series Study (BATS) site. Deep Sea Research II 43,591}621.
Gruber, N., Sarmiento, J.L., 1997. Global patterns of marine nitrogen "xation and denitri"cation. Global Biogeochemi-cal Cycles 11, 235}266.
Gruber, N., Keeling, C.D., Stocker, T.F., 1998. Carbon-13 constraints on the seasonal inorganic carbon budget at theBATS site in the northwestern Sargasso Sea. Deep-Sea Research I 45, 673}717.
Hayward, T.L., 1994. The shallow oxygen maximum layer and primary production. Deep-Sea Research I 41, 559}574.Hellerman, S., Rosenstein, M., 1983. Normal monthly wind stress over the world ocean with error estimates. Journal of
Physical Oceanography 13, 109}1104.Jenkins, W.J., Goldman, J.C., 1985. Seasonal oxygen cycling and primary production in the Sargasso Sea. Journal of
Marine Research 43, 465}491.Levitus, S., Boyer, T. 1994. World Ocean Atlas 1994 Vol. 4: Temperature. NOAA Atlas NESDIS 4, US Department of
Commerce, Washington, DC, 117pp.Levitus, S., Burgett, R., Boyer, T. 1994. World Ocean Atlas 1994 Volume 3: Salinity. NOAA Atlas NESDIS 3, US
Department of Commerce, Washington, DC, 99pp.Lohrenz, S.E., Michaels, A.F., Knap, A.H., Knauer, G.A., Asper, V.L., Tuel, M., 1992. Seasonal variability in primary
production and particle #ux in the northwestern Sargasso Sea: US JGOFS Bermuda Atlantic Time-series Study.Deep-Sea Research A 39, 1373}1391.
Louanchi, F., Najjar, R.G., 2000. A global monthly mean climatology of phosphate, nitrate and silicate in the upperocean: spring}summer production and shallow remineralization. Global Biogeochemical Cycles 14, 959}977.
Martin, J.H., Knauer, G.A., Karl, D.M., Broenkow, W.W., 1987. VERTEX: carbon cycling in the northeast Paci"c.Deep-Sea Research 34, 267}285.
McGillicuddy Jr., D.J., Johnson, R., Siegel, D.A., Michaels, A.F., Bates, N.R., Knap, A.H., 1999. Mesoscale variations ofbiogeochemical properties in the Sargasso Sea. Journal of Geophysical Research 104, 13 381}13 394.
Michaels, A.F., Knap, A.H., 1996. Overview of the US JGOFS Bermuda Atlantic Time-series Study and the Hydrosta-tion S program. Deep-Sea Research II 43, 157}198.
Michaels, A.F., Bates, N.R., Buesseler, K.O., Carlson, C.A., Knap, A.H., 1994. Carbon-cycle imbalances in the SargassoSea. Nature 372, 537}540.
Millero, F.J., Poisson, A., 1981. International one-atmosphere equation of state of seawater. Deep-Sea Research 28,625}629.
Musgrave, D.L., Chow, J., Jenkins, W.J., 1988. Application of a model of upper-ocean physics for studying seasonal cyclesof oxygen. Journal of Geophysical Research 93, 15 679}15 700.
Najjar, R.G., 1992. Marine biogeochemistry. In: Trenberth, K. (Ed.), Climate System Modeling. Cambridge UniversityPress, Cambridge, England, pp. 241}280.
Najjar, R.G., Keeling, R.F., 1997. Analysis of the mean annual cycle of the dissolved oxygen anomaly in the World Ocean.Journal of Marine Research 55, 117}151.
Najjar, R.G., Keeling, R.F., 2000. Mean annual cycle of the air}sea oxygen #ux: a global view. Global BiogeochemicalCycles 14, 573}584.
Paulson, C.A., Simpson, J.J., 1977. Irradiance measurements in the upper ocean. Journal of Physical Oceanography 7,952}956.
Price, J.F., Weller, R.A., Schudlich, R.R., 1987. Wind-driven ocean currents and Ekman transport. Science 238,1534}1538.
Sarmiento, J.L., Theile, G., Key, R.M., Moore, W.S., 1990. Oxygen and nitrate new production and remineralization inthe North Atlantic subtropical gyre. Journal of Geophysical Research 95, 18 303}18 315.
Shulenberger, E., Reid, J.L., 1981. The Paci"c shallow oxygen maximum, deep chlorophyll maximum, and primaryproductivity, reconsidered. Deep-Sea Research 28, 901}919.
S. Ono et al. / Deep-Sea Research II 48 (2001) 1567}1582 1581

Siegel, D.A., Deuser, W.G., 1997. Trajectories of sinking particles in the Sargasso Sea: modeling of statistical funnelsabove deep-ocean sediment traps. Deep-Sea Research I 44, 1519}1541.
Siegel, D.A., McGillicudy Jr., D.J., Fields, E.A., 1999. Mesoscale eddies, satellite altimetry, and new production in theSargasso Sea. Journal of Geophysical Research 104, 13 359}13 379.
Ste!en, M., 1990. A simple method for monotonic interpolation in one dimension. Astronomy and Astrophysics 239,443}450.
Takahashi, T., Broecker, W.S., Langer, S., 1985. Red"eld ratio based on chemical data from isopycnal surfaces. Journal ofGeophysical Research 90, 6907}6924.
Toggweiler, J.R., 1994. Vanishing in Bermuda. Nature 372, 505}506.
1582 S. Ono et al. / Deep-Sea Research II 48 (2001) 1567}1582