Embed Size (px)
Citation preview
i
Superprotonic Solid Acids
Thermochemistry, Structure, and Conductivity
Thesis by
Ayako Ikeda
In Partial Fulfillment of the Requirements
For the Degree of
Doctor of Philosophy
California Institute of Technology
Pasadena, California
2013
(Defended August 10, 2012)

ii
©2013
Ayako Ikeda
All rights reserved

iii
Acknowledgements
I got great help from many people to complete my research. I would like to state my
appreciation in this section.
First, I thank my advisor, Dr. Sossina Haile for a lot of things. She gave me an
opportunity to have very valuable experience in the U.S. She accepted me even though I had a
language issue. I got strong support from her. The advice which she gave me was very valuable,
not only for my research as a great scientist but also for my everyday life as a mother of young
kids. I was very happy to join her group.
I thank Dr. Tetsuya Uda, who instructed me when I started my research as a volunteer. I
could not get the idea that I can construct any measurement equipment by myself until he
suggested I make humidified TG. I learned how to survive in the lab at that time as my first step.
I thank a machinist, Mike Vondrus for his great help and friendship. I could not build my
measurement systems without his powerful help by his magical hands and deep knowledge. I
thank his wife, Masako Vondrus for her kindness and friendship. I was very happy to meet them
and spend time with them.
I thank Dr. Mary Louie, who was my labmate, for her kindness, help, advice and
discussion. It was fun to spend time with her during trips for conferences. I thank Dr. Calum
Chisholm and Dr. Dane Boysen for giving me advice, Dr. William Chow, Dr. Yoshihiro
Yamazaki, and TaeSik Oh for giving me great suggestions and discussions.
I thank Chih-Kai Yang for helping my XRD duty a lot. Also, he encouraged me when we
were taking ESL class together. I am so happy that both of us passed the SPEAK test just before
my graduation.
I thank Jack Geasland for his big effort to teach me writing and speaking English.
I deeply thank Carolyn Richmonds for great help in checking up my English in the thesis.
She kindly accepted the tough work with friendly smile. I could not have finished writing without
her.
I would like to thank all my labmates and friends for their help and friendship.
Finally, I thank my husband, Teruyuki, for supporting me always with great patience and
love. He helped me as my husband, our son’s father, and a scientist.
iv
Abstract
In this work, in order to investigate the thermochemistry and property of the
superprotonic solid acid compounds, the measurement methods were established for in-
situ observation, because superprotonic phases are neither stable at room temperature nor
freezable to room temperature. A humidity-controlled TG, DSC and AC impedance
measurement system, and high temperature stage for XRD were built for thermal analysis
and characterization of the solid acid compounds.
The thermodynamic and kinetics of the dehydration and hydration of CsH2PO4 is
investigated by TG, DSC, and XRD analysis. By making use of the enhanced kinetics
afforded by SiO2, the phase boundary between CsH2PO4, CsPO3, and dehydrated liquid
was precisely determined. The stability of CsH2PO4 and the liquid dehydrate, CsH2(1-
x)PO4-x(l), were confirmed by the complete reversal of dehydration to recover these
phases in the appropriate temperature and water partial pressure ranges. Rehydration and
conversion of CsPO3(s) to CsH2PO4(s) occurs over a period of several hours, depending
on temperature, water partial pressure, and morphology of the metaphosphate. High and
small particles favor rapid dehydration, whereas the temperature dependence of the
rehydration kinetics is nonmonotonic, reaching its fastest rate in the vicinity of the
superprotonic transition.
Doping Rb and K into CDP was examined and the stable region of Cs1-xRbxH2PO4
and Cs1-xKxH2PO4 are determined by in situ XRD and DSC measurement. Then the
effects of doping to the structure and conductivity are discussed. It was found that Rb has
whole-range solubility for both cubic and monoclinic CDP. Ts increases and Td decrease
v
with Rb content. K has 27% solubility for cubic CDP, Ts and Td decrease with K content.
The eutectic temperature is 208 ± 2°C. The lattice size of Rb- or K- doped CDP depends
on the averaged cation size. Conductivity linearly decreases by dopant concentration. The
impact of K doping is deeper than that of Rb for the equivalent averaged cation size.
In situ XRD measurement was carried out using single-crystal CsH2PO4 in order
to study the phase transformation mechanism of this compound. A plate-like single
crystal with (100) orientation was prepared, and the phase transition was observed by
heating and cooling with ramp rate 0.2 K/min. From the obtained XRD profile — the
after-first-phase transition (monocliniccubic) — the distribution of the domain
orientation was estimated. It was found that (100) is the preferential orientation after
phase transition, however, the amount of the domains with other orientation is not
ignorable. Therefore, it is considered that the phase transformation in CsH2PO4 is not
simple martensitic, but that some other event, such as recrystallization, happens during
the transition process.
vi
Table of contents
Chapter 1 Introduction .................................................................................................. 1
1.1 Overview ....................................................................................................................1
1.2 High-proton-conductive solid acid compounds and phase transition ........................3
1.3 Chemical stability ......................................................................................................6
1.4 Fuel cell application of solid acid compounds ...........................................................8
Bibliography ..................................................................................................................10
Chapter 2 Experimental methods ............................................................................... 12
2.1 Synthesis ............................................................................................................12
2.2 Thermogravimetry .............................................................................................13
2.3 Differential scanning calorimetry ......................................................................15
2.4 AC impedance spectroscopy ..............................................................................18
2.5 Energy-dispersive spectroscopy.........................................................................19
2.6 Lattice parameter refinement .............................................................................20
2.6.1 Nelson-Riley extrapolation method5 ........................................................... 21
2.6.2 Internal standard .......................................................................................... 23
2.6.3 Rietveld refinement ..................................................................................... 23
Bibliography ..................................................................................................................25
Chapter 3 Dehydration-hydration of CsH2PO4 1 ........................................................ 26
3.1. Introduction .............................................................................................................26
3.2. Experimental details ................................................................................................28
3.3. Results and discussion ............................................................................................30
3.3.1. Interaction of CsH2PO4 with SiO2 .................................................................. 30
3.3.2. General dehydration characteristics and data analysis methodology ............. 32
3.3.3. Thermodynamics of dehydration .................................................................... 38
3.3.4. Kinetics of rehydration ................................................................................... 49
4. Conclusions ................................................................................................................56
Bibliography ..................................................................................................................58
Chapter 4 Phase behavior of cation doped cubic CsH2PO4 ......................................... 60
4.1. Introduction .............................................................................................................60
4.2. Experimental details ................................................................................................61
vii
4.2.1. Sample preparation ......................................................................................... 61
4.2.2. In situ XRD measurements ............................................................................. 63
4.2.3. DSC measurements ......................................................................................... 66
4.2.4. AC impedance measurements ......................................................................... 67
4.3. Results and discussion ............................................................................................67
4.3.1 Overall phase characteristics ............................................................................ 67
4.3.2 Determination of Phase Behavior in the Cs1-xRbxH2PO4 system: 0 x 1 .... 70
4.3.3 Phase Behavior in the Cs1-xKxH2PO4 system: 0 x 0.3 ............................... 74
4.3.4 Structural and Transport Properties ................................................................. 78
4.4. Conclusion ..............................................................................................................83
Bibliography ..................................................................................................................85
Chapter 5 Phase transformation of CsH2PO4 ............................................................. 87
5.1 Introduction ........................................................................................................87
5.2 Mechanisms of Structural-phase transformation ...............................................88
5.2.1 Martensitic transformation3,4 ...................................................................... 88
5.2.2 Nucleation and growth-typed transformation ............................................. 92
5.2.3 Recrystallization ......................................................................................... 93
5.3 Experimental method .........................................................................................94
5.4 Result and discussion .........................................................................................95
5.5 Conclusion .........................................................................................................99
Bibliography ................................................................................................................101
Appendix A Phase behavior of anion doped cubic CsH2PO4 .................................... 102
A.1. CsH2PO4–CsHSO4 system ...................................................................................102
A.2. CsH2PO4–CsI system ...........................................................................................103
A.3 Conclusion ............................................................................................................106
Bibliography ................................................................................................................107
viii
List of figures
Figure 1.1. Conductivity change of CDP .........................................................................2
Figure 1.2. The conductivities of superprotonic phases of solid acid compounds. .........4
Figure 1.3. Dehydration process of CDP .........................................................................7
Figure 1.4. The fuel cell performance of the commercial stack (SAFCell) .....................8
Figure 2.1. Balance/furnace configurations of TG ........................................................14
Figure 2.2. Schematic view and actual setup of the system ...........................................14
Figure 2.3. The principle of DSC measurement ............................................................16
Figure 2.4. The schematic representation of the DSC setups ........................................17
Figure 2.5. The actual setup of DSC system ..................................................................17
Figure 2.6. The equivalent circuit (parallel of R and C) of solid electrolyte .................18
Figure 2.7. The impedance profiles of low conductivity and superprotonic phases ......19
Figure 2.8. The back scattered electron image of the annealed composites. .................20
Figure 2.9. The actual setup of the high temperature sealed stage for XRD. ................21
Figure 2.10. The relation of the sample displacement and the error in the angle ..........22
Figure 2.11. Extrapolation of lattice parameters using the Nelson-Riley method .........23
Figure 3.1. The schematic diagram of the in-house constructed DSC. ..........................30
Figure 3.2. XRD profiles of the dehydration product of composite.. ............................31
Figure 3.3. SEM images of the dehydration product of composite ...............................32
Figure 3.4. Typical dehydration behavior of CDPbelow the triple point. .....................34
Figure 3.5. Typical dehydration behavior of CDP above the triple point. .....................35
Figure 3.6. Weight change behavior of CDP (in composite form with SiO2). ..............39
Figure 3.7. Thermal behavior of CDP (in composite form with SiO2). .........................40
Figure 3.8. Isothermal weight change behavior of CsPO3, CDP ...................................41
Figure 3.9. The T–pH2O phase diagram of CDP . ...........................................................43
Figure 3.10. Comparison of de-, rehydration behavior of CDP and CsPO3 .................45
Figure 3.11. Isothermal hydration behavior of CsPO3 in various forms. ......................50
Figure 3.12. Isothermal hydration behavior of CsPO3 at several temperatures. ............52
Figure 3.13. Isothermal hydration behavior of CsPO3 under several pH2O . ..................55
Figure 4.1. The schematic view of the high temperature sealed stage ..........................63
Figure 4.2. XRD profile of CDP with Si at several temperatures ..................................65
Figure 4.3. The schematic view of the measurement cell of DSC .................................67
ix
Figure 4.4 Phase diagram of (a) CDP-RDP and (b) CDP-KDP systems .......................69
Figure 4.5(a). XRD profiles of Cs0.5Rb0.5H2PO4 with Si at several temperatures .........71
Figure 4.5(b). XRD profiles of RbH2PO4 with Si at several temperatures ....................72
Figure 4.5(c). XRD profiles of Cs1-xRbxH2PO4 with Si (x = 0~1) .................................72
Figure 4.6(a). DSC profiles of Cs1-xRbxH2PO4 (x = 0.19) .............................................74
Figure 4.6(b). DSC profiles of Cs1-xRbxH2PO4 (x = 0~1) ..............................................74
Figure 4.7(a). XRD profile of Cs1-xKxH2PO4.................................................................75
Figure 4.7(b, c). XRD profile of Cs1-xKxH2PO4 (x = 0.15, 0.3, 0.5) ..............................75
Figure 4.8. The lattice parameter change by K doping ..................................................77
Figure 4.9. DSC profiles of the 10%K composition ......................................................78
Figure 4.10. Lattice parameters of Rb- and K-doped CDP at several temperatures ....79
Figure 4.11. Ionic radius and lattice parameters of Rb- and K-doped CDP ..................80
Figure 4.12. AC impedance spectrum of 19% Rb- and 10% K-doped CDP .................81
Figure 4.13. Conductivity of doped CDP (cubic) at several temperatures ....................81
Figure 4.14. Pre-exponential factor and activation energy against the cation radius ....82
Figure 5.1. Schematic diagram of the transformation of a spherical particle ................89
Figure 5.2. Austenite/martensite interface with a simple transition layer ....................90
Figure 5.3. Plot of the factor in the formula for the hysteresis H vs. λ2 .........................91
Figure 5.4. The Gibbs free energy on the crystal size ..................................................92
Figure 5.5. Recrystallization of a metallic material and crystal grains growth .............93
Figure 5.6 Temperature history of in situ XRD measurement .......................................94
Figure 5.7. XRD profiles of single-crystal CDP with elevating temperature ................95
Figure 5.8. XRD profiles of single-crystal CDP with cooling .......................................96
Figure 5.9. The normalized peak areas for (200) and (400) with thermal cycle ............96
Figure 5.10. XRD profiles of monoclinic phase and cubic phase .................................97
Figure 5.11. The distribution of domain orientation after transformation .....................99
Figure A.1. The suggested phase diagram of CDP–CHS system ................................103
Figure A.2. The phase diagram of the CDP–CsI system ............................................104
Figure A.3. The lattice constant of iodine-doped CDP ................................................104
Figure A.4. The conductivity of 5 at.% I-doped CDP .................................................105
x
List of Tables
Table 2.1. The synthesis methods ..................................................................................13
Table 2.2. The parameters which are refined using Rietveld method ...........................24
Table 3.1. Lattice constants of CDP after thermal cycling with SiO2 ...........................32
Table 3.2. Summary of thermodynamic parameters for the dehydration of CDP .........48
Table 4.1. The dopant concentrations which were obtained by EDS measurements ....62
Table 4.2. The fitting parameters of Rietveld refinements for CDP ..............................65
Table 4.3. The thermal expansion coefficients of doped CDP ......................................79
Table 5.1. The quantity of the domains with specific orientation .................................98
Table A.1. The crystal structure, Ts and Tm of Cs(H2PO4)1-x(HSO4)x ..........................102
Table A.2. The thermal expansion coefficients of doped CDP ...................................105
xi
List of Acronyms
ACIS alternating current impedance spectroscopy
CDP cesium dihydrogen phosphate, CsH2PO4
CHP cesium hydrogen phosphite, CsHPO3H
CHS cesium hydrogen sulfate, CsHSO4
DSC Differential scanning calorimetry
DTA Differential thermal analysis
EDS energy dispersive spectroscopy
KDP potassium dihydrogen phosphate, KH2PO4
RDP rubidium dihydrogen phosphate, RbH2PO4
SEM scanning electron microscopy
TG Thermogravimetry
XRD X-ray diffraction
1
Chapter 1 Introduction
1.1 Overview
Solid acid compounds, which are composed of half normal salt and half acid, are
solid-state materials with protons in the structure. An example is CsHSO4, which is
formed by the reaction of a cesium salt and sulfuric acid,
½Cs2SO4 + ½H2SO4 = CsHSO4 (1)
Solid acids have similar properties to salts in that they are brittle ionic crystals which are
insulating at room temperature. Some of them are highly water soluble. One of the
biggest differences between salts and solid acids is that most solid acid compounds are
not truly stable at dry atmosphere. The reason that solid acid compounds can keep their
form for a very long time in the laboratory is that the saturated water vapor pressure is
too low at room temperature to cause rapid decomposition. It is known that some solid
acid compounds have high proton conductivity phases, with proton conductivity higher
than 1×10⁻³ Ω-1cm-1, at elevated temperature. Such phases are called superprotonic, and
the phase transformation from low to high conductivity phase; as called superprotonic
transition. These compounds are attractive materials for fuel cell electrolytes because
they are solid and are ideal for work in the moderate temperature range (100 < T <
300 °C). In this temperature range, it is expected that fuel cells can have both portability
and high efficiency. In order to explore new fuel cell electrolyte materials and to reveal
the origin of the high conductivity, several solid acid compounds have been investigated.
2
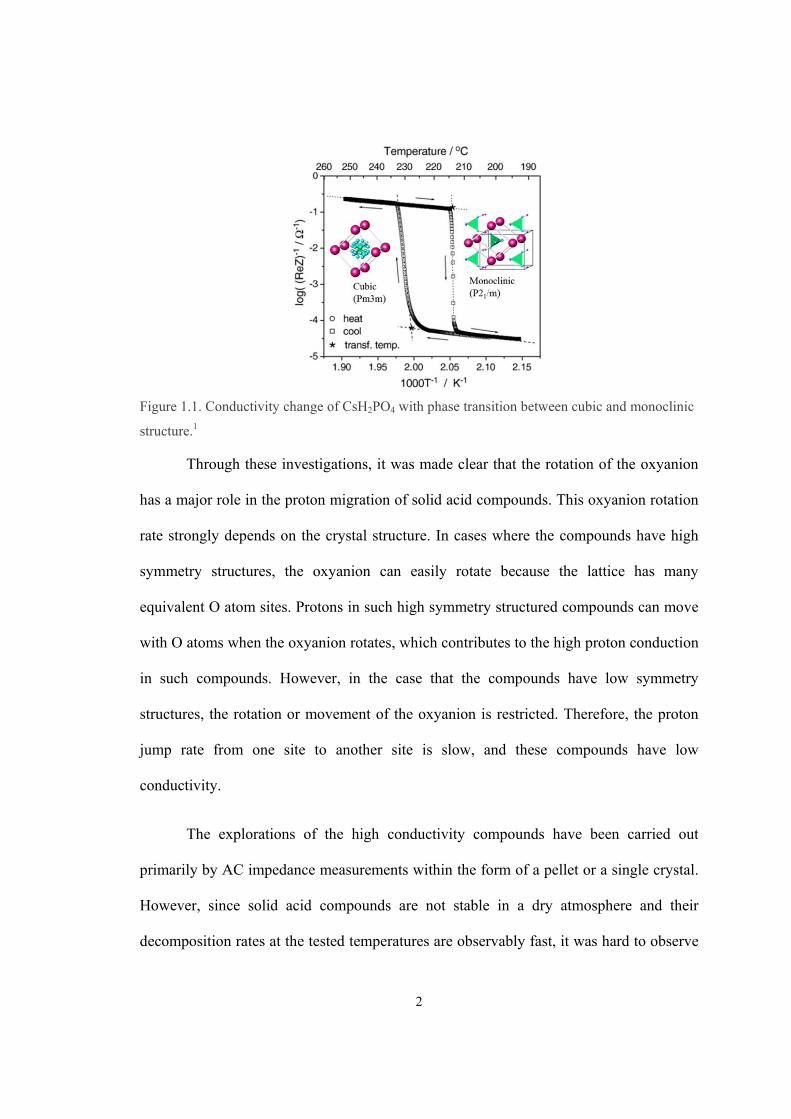
Figure 1.1. Conductivity change of CsH2PO4 with phase transition between cubic and monoclinic
structure.1
Through these investigations, it was made clear that the rotation of the oxyanion
has a major role in the proton migration of solid acid compounds. This oxyanion rotation
rate strongly depends on the crystal structure. In cases where the compounds have high
symmetry structures, the oxyanion can easily rotate because the lattice has many
equivalent O atom sites. Protons in such high symmetry structured compounds can move
with O atoms when the oxyanion rotates, which contributes to the high proton conduction
in such compounds. However, in the case that the compounds have low symmetry
structures, the rotation or movement of the oxyanion is restricted. Therefore, the proton
jump rate from one site to another site is slow, and these compounds have low
conductivity.
The explorations of the high conductivity compounds have been carried out
primarily by AC impedance measurements within the form of a pellet or a single crystal.
However, since solid acid compounds are not stable in a dry atmosphere and their
decomposition rates at the tested temperatures are observably fast, it was hard to observe
3
pure superprotonic phases by more conclusive methods, like XRD or DSC analysis on
their powder forms. Due to these difficulties, there is a lack of consistency in the
literature on solid acids and their superprotonic phases. In these reports, the absence of
knowledge of the thermochemistry of these compounds is apparent. In order to
understand a variety of solid acid material properties, it is necessary for the compounds to
be in equilibrium condition.
In this work, I present my efforts to obtain reliable data under equilibrium
conditions. I built several measurement systems with humidification and developed
methods to obtain reliable property data on solid acid compounds (mainly phosphates) in
order to ascertain what conditions are necessary for high conductivity compounds with
broader stable temperature region.
1.2 High-proton-conductive solid acid compounds and phase transition
The compounds which are reported as superprotonic, grouped by structure are:
Cubic (Pm3m); CsH2PO4, RbH2PO4, CsH2AsO42 and CsHPO3H
3
Tetragonal (I41/amd); CsHSO44 and CsH2PO4
5
Hexagonal (P3m); Cs5H3(SO4)4·nH2O, Cs5H3(SeO4)4·nH2O3, K5H3(SO4)4·nH2O
3,
Rb5H3(SO4)4
There are several mechanisms for proton migration. The first one is the combination of
the rotation of oxyanion and the proton jump as typified by CsHSO44 and CsH2PO4
5. It is
known that cubic phase CsH2PO4, RbH2PO4, CsH2AsO42, and CsHPO3H
3, and tetragonal
phase CsHSO4 and CsHSeO44 belong to this group.
4
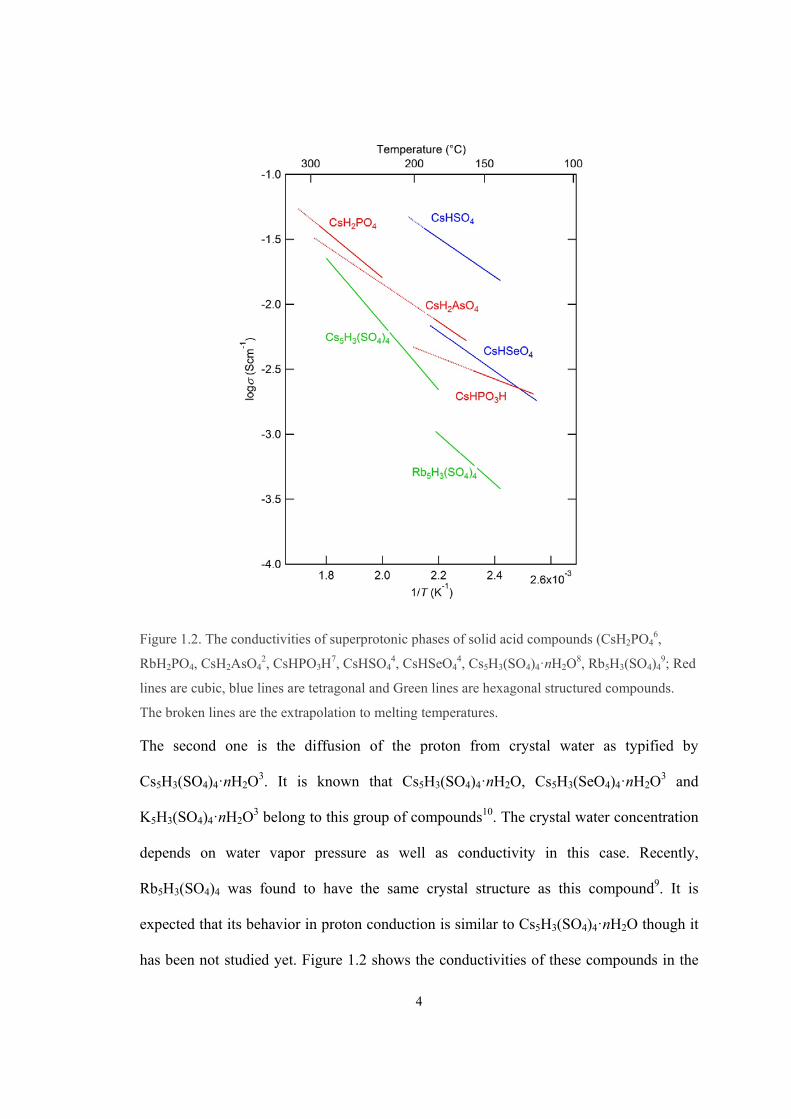
Figure 1.2. The conductivities of superprotonic phases of solid acid compounds (CsH2PO46,
RbH2PO4, CsH2AsO42, CsHPO3H
7, CsHSO44, CsHSeO4
4, Cs5H3(SO4)4·nH2O8, Rb5H3(SO4)4
9; Red
lines are cubic, blue lines are tetragonal and Green lines are hexagonal structured compounds.
The broken lines are the extrapolation to melting temperatures.
The second one is the diffusion of the proton from crystal water as typified by
Cs5H3(SO4)4·nH2O3. It is known that Cs5H3(SO4)4·nH2O, Cs5H3(SeO4)4·nH2O
3 and
K5H3(SO4)4·nH2O3 belong to this group of compounds10. The crystal water concentration
depends on water vapor pressure as well as conductivity in this case. Recently,
Rb5H3(SO4)4 was found to have the same crystal structure as this compound9. It is
expected that its behavior in proton conduction is similar to Cs5H3(SO4)4·nH2O though it
has been not studied yet. Figure 1.2 shows the conductivities of these compounds in the
5
corresponding temperature range. In this group of solid acid compounds, CsHSO4 has the
highest conductivity and Rb5H3(SO4)4 has the lowest conductivity. The others have very
similar conductivities at corresponding temperatures.
Since the superprotonic phases exist at high temperature (100~300°C), the phase
transition events are observed during heating up or cooling down the sample. The
enthalpy of the phase transitions agrees well with values calculated from the differences
in the entropy, which is caused by the change of the proton configurations from ordered
to random state.11 Under the following rules, the configuration of the protons is expressed
by Equation (2). 11
(1) Each oxygen atom has two and only two protons.
(2) Each hydrogen bond has one and only one proton.
(3) The hydrogen bonds are directed towards the neighboring oxygen atoms.
(4) Interaction between nonneighboring H2O molecules does not influence the
distribution of hydrogen bond configurations.
The enthalpy change by phase transition is then described by Equation (3).
(2)
)ln( RTSTH ssss (3)
The reported ΔHsp for CsH2PO4 is 11.4 kJ/mol12, and the calculated value is 11.7 kJ/mol.
For CsHSO4, the reported value is 6.11 kJ/mol, and the calculated is 6.15 kJ/mol.
6
1.3 Chemical stability
In order to operate a fuel cell with solid acid electrolyte, it is required that the
electrolytes are stable under a hydrogen, oxygen, and humidified atmosphere.
Unfortunately, all sulfates and serenates are not stable under a hydrogen atmosphere
because they form H2S or H2Se. For example, cesium hydrogen sulfate and hydrogen gas
react to form hydrogen sulfate13 by the reaction,
½ CsHSO4(s) + H2(g) ¼ Cs2SO4(s) + H2O(g) + ¼ H2S(s) (4)
Even worse, H2S and H2Se act to poison the platinum catalyst, leading to decreased
activity of the fuel cell. Therefore these compounds are not suitable as electrolytes.
Phosphates, phosphites and arsenates react with neither hydrogen nor oxygen below their
melting temperature.
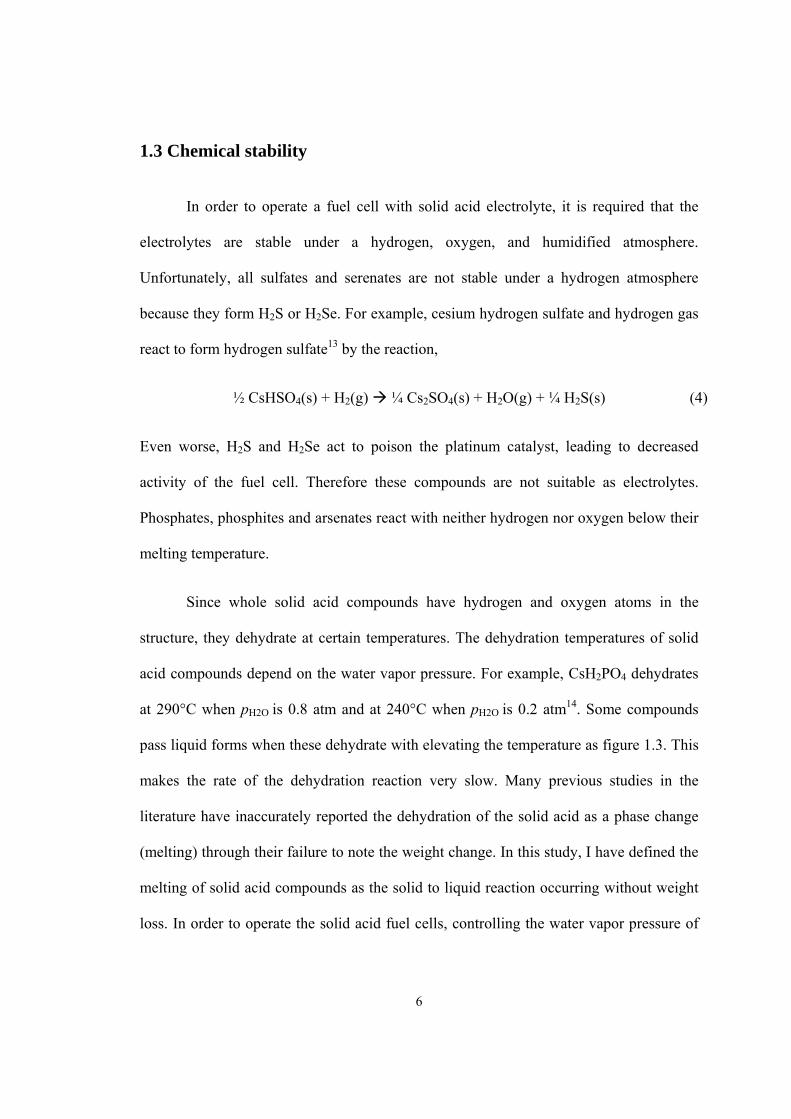
Since whole solid acid compounds have hydrogen and oxygen atoms in the
structure, they dehydrate at certain temperatures. The dehydration temperatures of solid
acid compounds depend on the water vapor pressure. For example, CsH2PO4 dehydrates
at 290°C when pH2O is 0.8 atm and at 240°C when pH2O is 0.2 atm14. Some compounds
pass liquid forms when these dehydrate with elevating the temperature as figure 1.3. This
makes the rate of the dehydration reaction very slow. Many previous studies in the
literature have inaccurately reported the dehydration of the solid acid as a phase change
(melting) through their failure to note the weight change. In this study, I have defined the
melting of solid acid compounds as the solid to liquid reaction occurring without weight
loss. In order to operate the solid acid fuel cells, controlling the water vapor pressure of
7
the atmosphere in the cell is very important. In Chapter 3, the details of the dehydration
behavior of CsH2PO4 are reported.
Figure 1.3. Dehydration process of CsH2PO4 during elevating temperature under the constant
water vapor pressure
Because solid acid compounds have acids in the structure, they react with many
metals and ceramics, as acids do at high temperatures. It is known that Pt, SiO2, TiO2,
and some polymers are stable with solid acid compounds at high temperature. However,
the number of compatible materials for use in the components of fuel cells, such as
catalysts and electrodes, is very limited.
Most solid acid compounds are water soluble and some of these are deliquescent
materials. The typical deliquescent compounds are CsHPO3H or KHPO3H. These
materials absorb water from the atmosphere very quickly and their solid forms are not
stable under ambient atmosphere at room temperature. It is reported that these
compounds can be stabilized by putting high surface area SiO2 powder in the
compounds7 or nano-sized SiO215. On the other hand, the water insoluble compounds,
Ba3-xKxHx(PO4)2 (x~1.0, R3m:Ha ) is reported though it has relatively low conductivity
(~10-4Ω-1cm-1)16. On the preliminary work, it is observed that the conductivity of this
compound depends on the water vapor pressure.
8
1.4 Fuel cell application of solid acid compounds
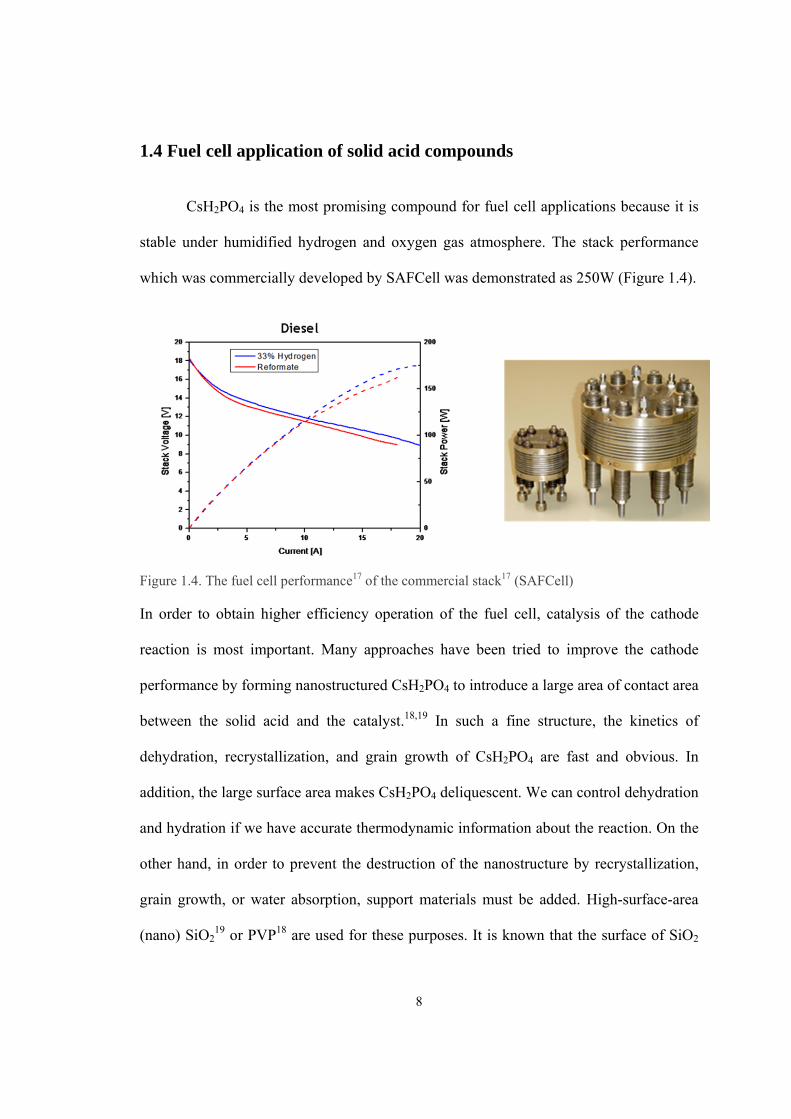
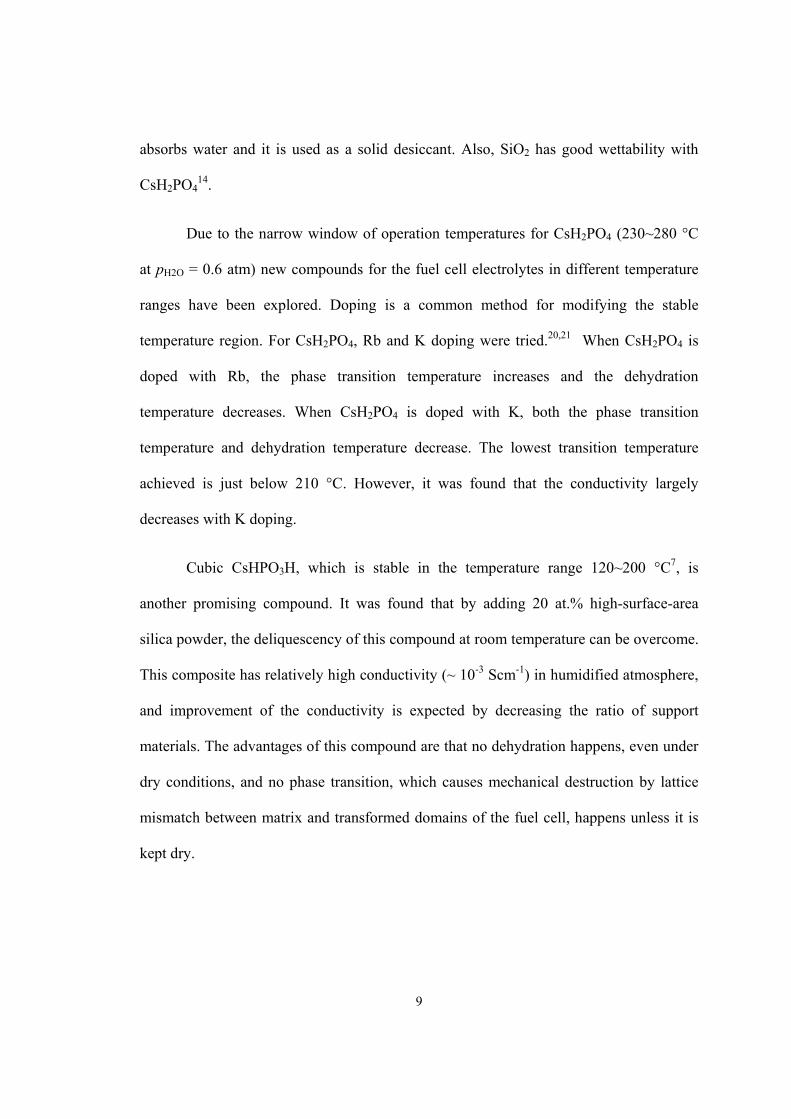
CsH2PO4 is the most promising compound for fuel cell applications because it is
stable under humidified hydrogen and oxygen gas atmosphere. The stack performance
which was commercially developed by SAFCell was demonstrated as 250W (Figure 1.4).
Figure 1.4. The fuel cell performance17 of the commercial stack17 (SAFCell)
In order to obtain higher efficiency operation of the fuel cell, catalysis of the cathode
reaction is most important. Many approaches have been tried to improve the cathode
performance by forming nanostructured CsH2PO4 to introduce a large area of contact area
between the solid acid and the catalyst.18,19 In such a fine structure, the kinetics of
dehydration, recrystallization, and grain growth of CsH2PO4 are fast and obvious. In
addition, the large surface area makes CsH2PO4 deliquescent. We can control dehydration
and hydration if we have accurate thermodynamic information about the reaction. On the
other hand, in order to prevent the destruction of the nanostructure by recrystallization,
grain growth, or water absorption, support materials must be added. High-surface-area
(nano) SiO219 or PVP18 are used for these purposes. It is known that the surface of SiO2
9
absorbs water and it is used as a solid desiccant. Also, SiO2 has good wettability with
CsH2PO414.
Due to the narrow window of operation temperatures for CsH2PO4 (230~280 °C
at pH2O = 0.6 atm) new compounds for the fuel cell electrolytes in different temperature
ranges have been explored. Doping is a common method for modifying the stable
temperature region. For CsH2PO4, Rb and K doping were tried.20,21 When CsH2PO4 is
doped with Rb, the phase transition temperature increases and the dehydration
temperature decreases. When CsH2PO4 is doped with K, both the phase transition
temperature and dehydration temperature decrease. The lowest transition temperature
achieved is just below 210 °C. However, it was found that the conductivity largely
decreases with K doping.
Cubic CsHPO3H, which is stable in the temperature range 120~200 °C7, is
another promising compound. It was found that by adding 20 at.% high-surface-area
silica powder, the deliquescency of this compound at room temperature can be overcome.
This composite has relatively high conductivity (~ 10-3 Scm-1) in humidified atmosphere,
and improvement of the conductivity is expected by decreasing the ratio of support
materials. The advantages of this compound are that no dehydration happens, even under
dry conditions, and no phase transition, which causes mechanical destruction by lattice
mismatch between matrix and transformed domains of the fuel cell, happens unless it is
kept dry.
10
Bibliography
1 Louie, M. W., Kislitsyn, M., Bhattacharya, K. & Haile, S. M. "Phase transformation and
hysteresis behavior in Cs1−xRbxH2PO4". Solid State Ionics 181, 173-179, (2010).
2 Baranov, A. I., Khiznichenko, V. P. & Shuvalov, L. A. "High-Temperature Phase-
Transitions and Proton Conductivity in Some KDP-Family Crystals". Ferroelectrics 100,
135-141, (1989).
3 Chisholm, C. R. I., Merle, R. B., Boysen, D. A. & Haile, S. M. "Superprotonic phase
transition in CsH(PO3H)". Chemistry of Materials 14, 3889-3893, (2002).
4 Baranov, A. I., Shuvalov, L. A. & Shchagina, N. M. "Superion Conductivity and Phase-
Transitions in CsHSO4 and CsHSeO4 Crystals". Jetp Letters 36, 459-462, (1982).
5 Baranov, A. I., Khiznichenko, V. P., Sandler, V. A. & Shuvalov, L. A. "Frequency
Dielectric-Dispersion in the Ferroelectric and Superionic Phases of CsH2PO4".
Ferroelectrics 81, 1147-1150, (1988).
6 Ikeda, A., Kitchaev, D. & Haile, S. M. "Phase behavior of doped (Rb, K) cubic
CsH2PO4". Chemistry of the materials, (2012).
7 Nagao, M., Ikeda, A. & Haile, S. M. "Proton conduction in CsH(PO3H) under dry or
humid conditions". ECS proceedings, (2012).
8 Lavrova, G. V., Ponomareva, V. G. & Burgina, E. B. "Proton conductivity and structural
dynamics in Cs5H3(SO4)4/SiO2 composites". Solid State Ionics 176, 767-771, (2005).
9 Panithipongwut, C. & Haile, S. M. "High-temperature phase behavior in the Rb3H(SO4)2-
RbHSO4 pseudo-binary system and the new compound Rb5H3(SO4)4". Solid State Ionics
213, 53-57, (2012).
10 Baranov, A. I., Sinitsyn, V. V., Vinnichenko, V. Y., Jones, D. J. & Bonnet, B.
"Stabilisation of disordered superprotonic phases in crystals of the M5H3(AO4)4 •xH2O
family". Solid State Ionics 97, 153-160, (1997).
11
11 Chisholm, C. R. I. & Haile, S. M. "Entropy evaluation of the superprotonic phase of
CsHSO4: Pauling's ice rules adjusted for systems containing disordered hydrogen-bonded
tetrahedra". Chemistry of Materials 19, 270-279, (2007).
12 Haile, S. M., Chisholm, C. R. I., Sasaki, K., Boysen, D. A. & Uda, T. "Solid acid proton
conductors: from laboratory curiosities to fuel cell electrolytes". Faraday Discussions
134, 17-39, (2007).
13 Uda, T., Boysen, D. A. & Haile, S. M. "Thermodynamic, thermomechanical, and
electrochemical evaluation of CsHSO4". Solid State Ionics 176, 127-133, (2005).
14 Ikeda, A. & Haile, S. M. "The thermodynamics and kinetics of the dehydration of
CsH2PO4 studied in the presence of SiO2". Solid State Ionics 213, 63-71, (2012).
15 Bondarenko, A. S., Zhou, W. & Bouwmeester, H. J. M. "Superprotonic KH(PO3H)–SiO2
composite electrolyte for intermediate temperature fuel cells". Journal of Power Sources
194, 843-846, (2009).
16 Chisholm, C. R. I., Toberer, E. S., Louie, M. W. & Haile, S. M. "Engineering the Next
Generation of Solid State Proton Conductors: Synthesis and Properties of Ba3-
xKxHx(PO4)2". Chemistry of Materials 22, 1186-1194, (2010).
17 Safcell_Inc, http://www.safcell.com/_img/DieselPerformance.png
18 Varga, A., Brunelli, N. A., Louie, M. W., Giapis, K. P. & Haile, S. M. "Composite
nanostructured solid-acid fuel-cell electrodes via electrospray deposition". Journal of
Materials Chemistry 20, 6309-6315, (2010).
19 Papandrew, A. B., Chisholm, C. R. I., Elgammal, R. A., Ozer, M. M. & Zecevic, S. K.
"Advanced Electrodes for Solid Acid Fuel Cells by Platinum Deposition on CsH2PO4".
Chemistry of Materials 23, 1659-1667, (2011).
20 Louie, M. W., Kislitsyn, M., Bhattacharya, K. & Haile, S. M. "Phase transformation and
hysteresis behavior in Cs1-xRbxH2PO4". Solid State Ionics 181, 173-179, (2010).
21 Ikeda, A. & Haile, S. M. "Examination of the superprotonic transition and dehydration
behavior of Cs0.75Rb0.25H2PO4 by thermogravimetric and differential thermal analyses".
Solid State Ionics 181, 193-196, (2010).
12
Chapter 2 Experimental methods
2.1 Synthesis
For many water-soluble solid acid compounds, the most common method used to
obtain the target compounds is precipitation. Generally, acids and carbonates are used as
starting materials. An aqueous solution with stoichiometric ratio of the carbonate and
acid is prepared and then the product is precipitated by evaporating the water or by
adding organic solvents. In cases where the precipitation reaction occurs very quickly,
small grains with uniform composition are obtained; however, sometimes secondary
phases are formed as well. On the other hand, by the slow precipitation method it is
possible to obtain very large crystals, as large as several centimeters. These large crystals
are high purity and single phase.
For compounds that are insoluble in water, such like BaHPO4, pH-controlled
basic solutions are used for precipitation. Acetates are used for making the aqua-solution
with alkali earth metal ions. In order to obtain large crystals of these compounds, it is
necessary to control the precipitation rate. The gel method has been reported for this
purpose. In this method, high viscosity liquid solution glass is filled to a tube, then the
other solution is poured. Since ionic species in the high viscosity solution are provided
very slowly, the precipitation rate can be controlled.
The melting method is favorable for solid solutions, such as Cs1-xRbxH2PO4, or
compounds with multiple anion species, for example, Cs3(H2PO4)(HSO4)2. In this method,
the starting material (a mixed powder) is heated to above its melting temperature (>
13
200 °C) in a sealed or humidified atmosphere to prevent decomposition. The product is
then cooled down slowly. Here is the list of the synthesis methods for several solid acid
compounds in Table 2.1.
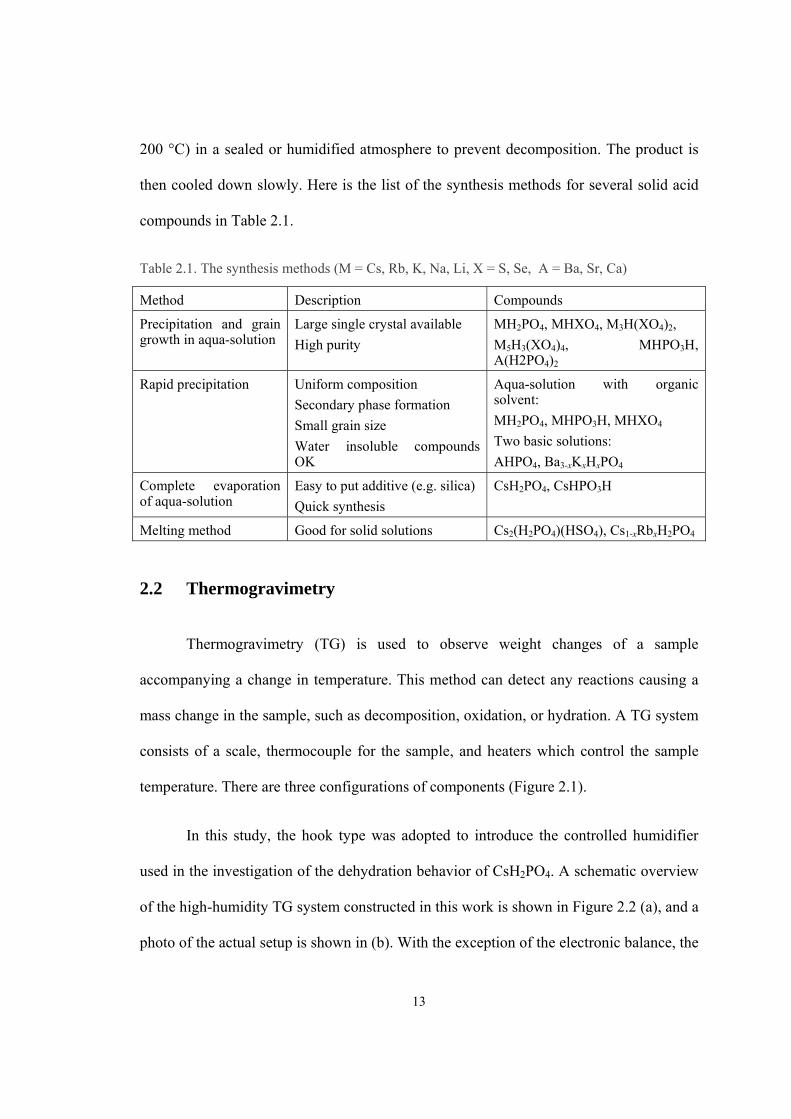
Table 2.1. The synthesis methods (M = Cs, Rb, K, Na, Li, X = S, Se, A = Ba, Sr, Ca)
Method Description Compounds
Precipitation and grain growth in aqua-solution
Large single crystal available
High purity
MH2PO4, MHXO4, M3H(XO4)2,
M5H3(XO4)4, MHPO3H, A(H2PO4)2
Rapid precipitation Uniform composition
Secondary phase formation
Small grain size
Water insoluble compounds OK
Aqua-solution with organic solvent:
MH2PO4, MHPO3H, MHXO4
Two basic solutions:
AHPO4, Ba3-xKxHxPO4
Complete evaporation of aqua-solution
Easy to put additive (e.g. silica)
Quick synthesis
CsH2PO4, CsHPO3H
Melting method Good for solid solutions Cs2(H2PO4)(HSO4), Cs1-xRbxH2PO4
2.2 Thermogravimetry
Thermogravimetry (TG) is used to observe weight changes of a sample
accompanying a change in temperature. This method can detect any reactions causing a
mass change in the sample, such as decomposition, oxidation, or hydration. A TG system
consists of a scale, thermocouple for the sample, and heaters which control the sample
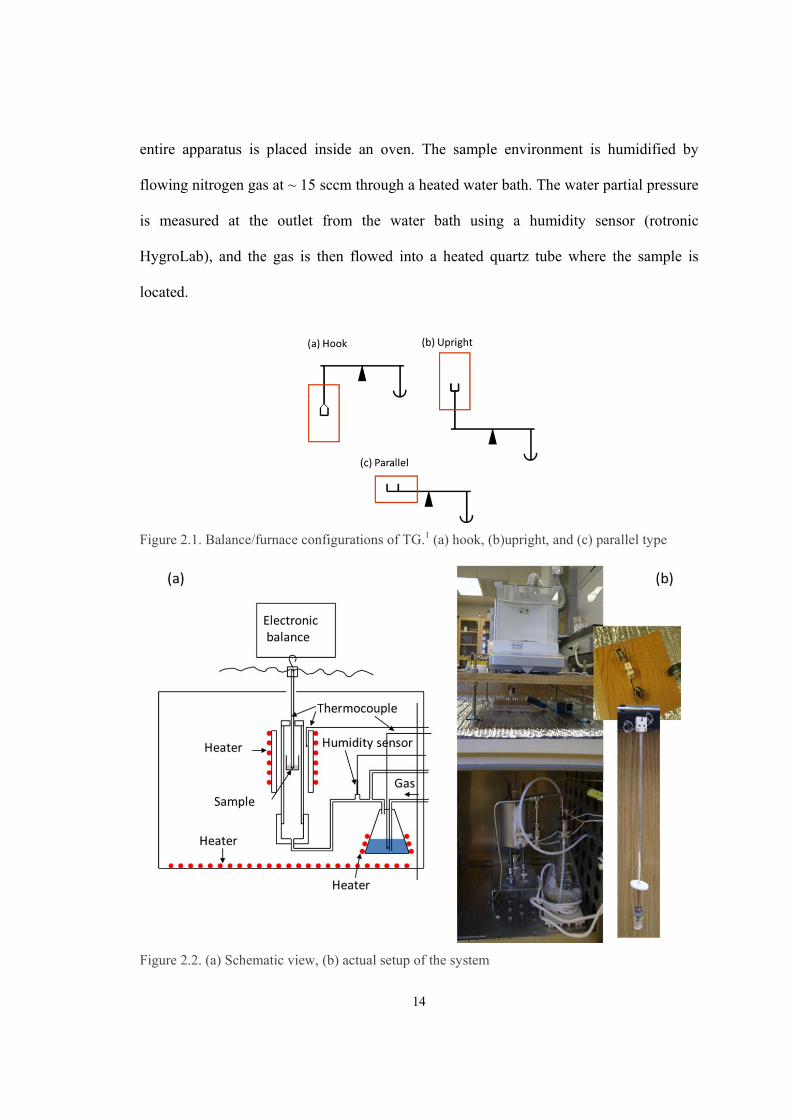
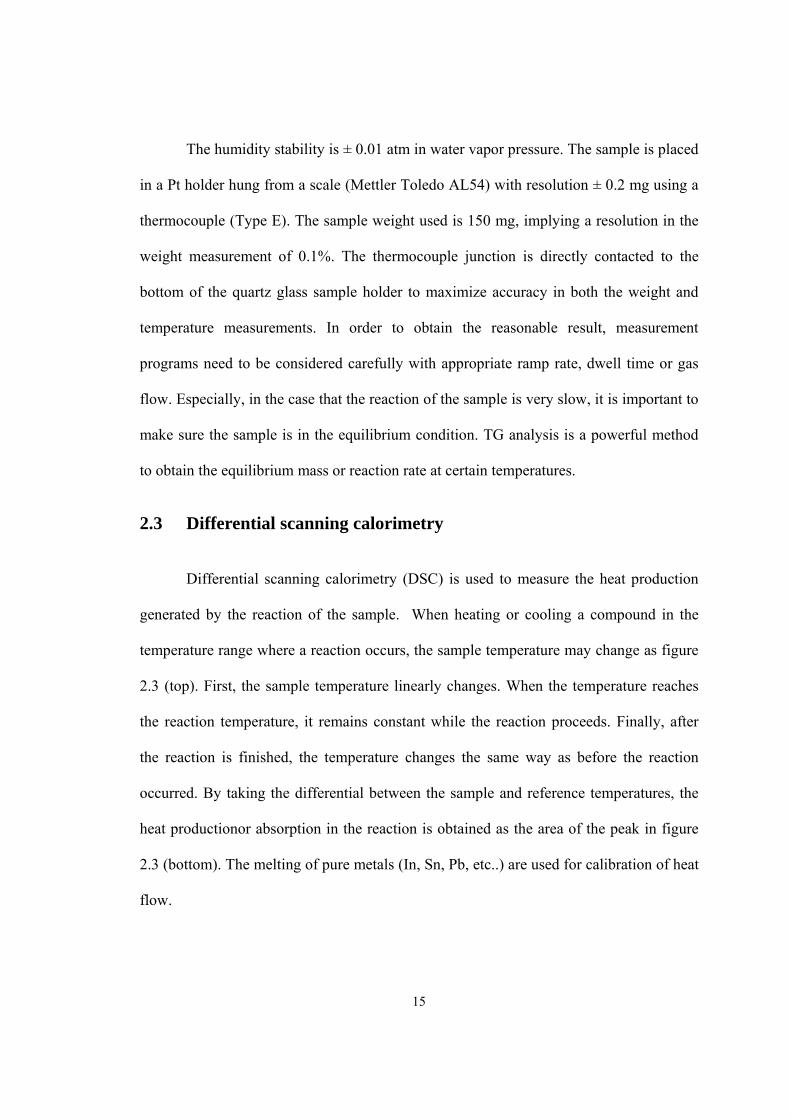
temperature. There are three configurations of components (Figure 2.1).
In this study, the hook type was adopted to introduce the controlled humidifier
used in the investigation of the dehydration behavior of CsH2PO4. A schematic overview
of the high-humidity TG system constructed in this work is shown in Figure 2.2 (a), and a
photo of the actual setup is shown in (b). With the exception of the electronic balance, the
14
entire apparatus is placed inside an oven. The sample environment is humidified by
flowing nitrogen gas at ~ 15 sccm through a heated water bath. The water partial pressure
is measured at the outlet from the water bath using a humidity sensor (rotronic
HygroLab), and the gas is then flowed into a heated quartz tube where the sample is
located.
Figure 2.1. Balance/furnace configurations of TG.1 (a) hook, (b)upright, and (c) parallel type
Figure 2.2. (a) Schematic view, (b) actual setup of the system
15
The humidity stability is ± 0.01 atm in water vapor pressure. The sample is placed
in a Pt holder hung from a scale (Mettler Toledo AL54) with resolution ± 0.2 mg using a
thermocouple (Type E). The sample weight used is 150 mg, implying a resolution in the
weight measurement of 0.1%. The thermocouple junction is directly contacted to the
bottom of the quartz glass sample holder to maximize accuracy in both the weight and
temperature measurements. In order to obtain the reasonable result, measurement
programs need to be considered carefully with appropriate ramp rate, dwell time or gas
flow. Especially, in the case that the reaction of the sample is very slow, it is important to
make sure the sample is in the equilibrium condition. TG analysis is a powerful method
to obtain the equilibrium mass or reaction rate at certain temperatures.
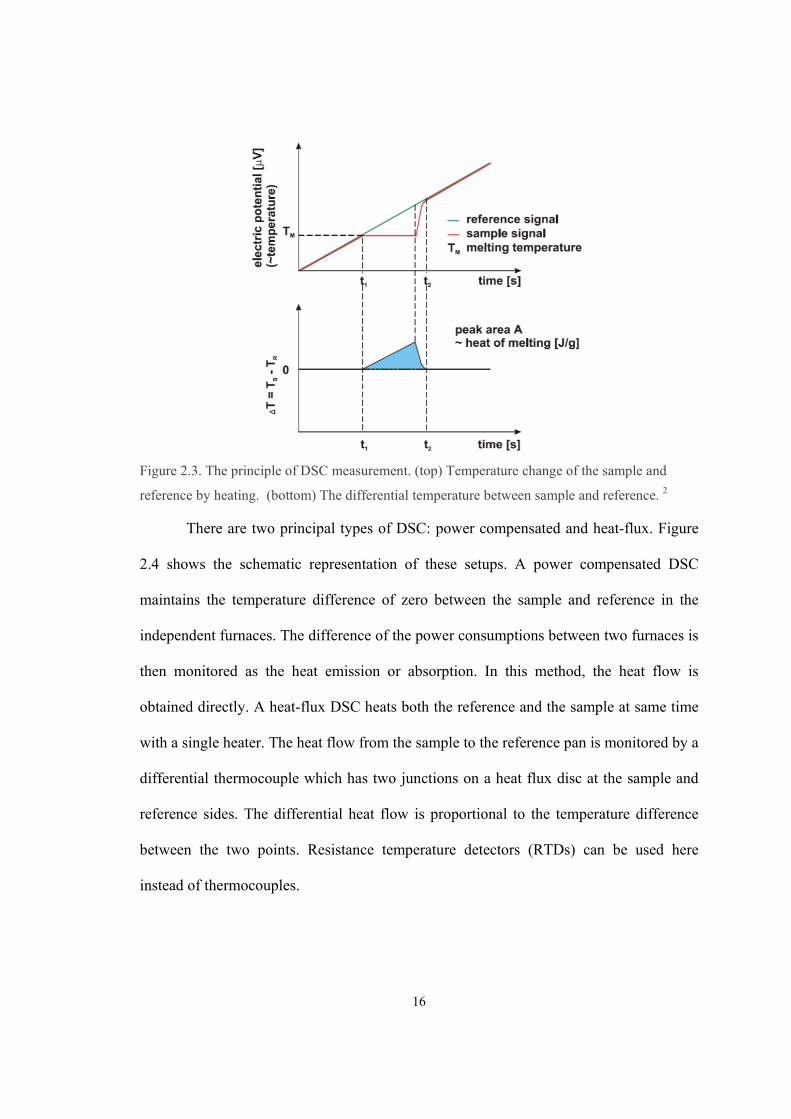
2.3 Differential scanning calorimetry
Differential scanning calorimetry (DSC) is used to measure the heat production
generated by the reaction of the sample. When heating or cooling a compound in the
temperature range where a reaction occurs, the sample temperature may change as figure
2.3 (top). First, the sample temperature linearly changes. When the temperature reaches
the reaction temperature, it remains constant while the reaction proceeds. Finally, after
the reaction is finished, the temperature changes the same way as before the reaction
occurred. By taking the differential between the sample and reference temperatures, the
heat productionor absorption in the reaction is obtained as the area of the peak in figure
2.3 (bottom). The melting of pure metals (In, Sn, Pb, etc..) are used for calibration of heat
flow.
16
Figure 2.3. The principle of DSC measurement. (top) Temperature change of the sample and
reference by heating. (bottom) The differential temperature between sample and reference. 2
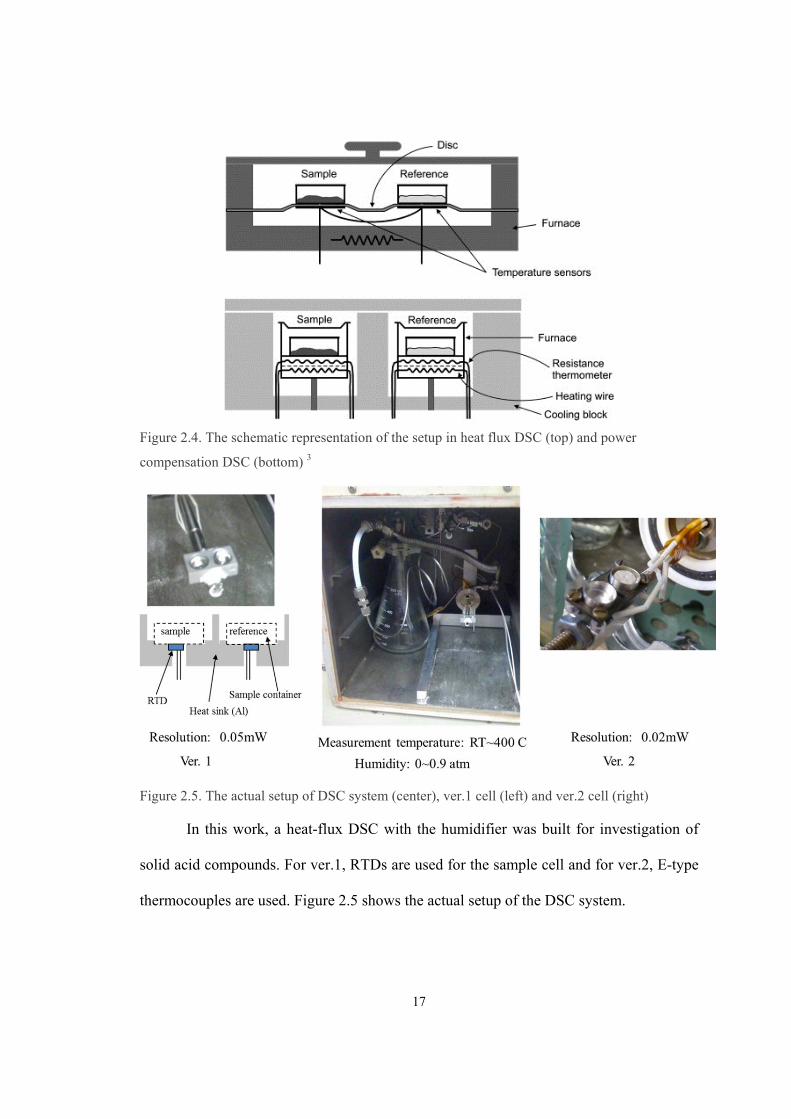
There are two principal types of DSC: power compensated and heat-flux. Figure
2.4 shows the schematic representation of these setups. A power compensated DSC
maintains the temperature difference of zero between the sample and reference in the
independent furnaces. The difference of the power consumptions between two furnaces is
then monitored as the heat emission or absorption. In this method, the heat flow is
obtained directly. A heat-flux DSC heats both the reference and the sample at same time
with a single heater. The heat flow from the sample to the reference pan is monitored by a
differential thermocouple which has two junctions on a heat flux disc at the sample and
reference sides. The differential heat flow is proportional to the temperature difference
between the two points. Resistance temperature detectors (RTDs) can be used here
instead of thermocouples.
17
Figure 2.4. The schematic representation of the setup in heat flux DSC (top) and power
compensation DSC (bottom) 3
Figure 2.5. The actual setup of DSC system (center), ver.1 cell (left) and ver.2 cell (right)
In this work, a heat-flux DSC with the humidifier was built for investigation of
solid acid compounds. For ver.1, RTDs are used for the sample cell and for ver.2, E-type
thermocouples are used. Figure 2.5 shows the actual setup of the DSC system.
18
2.4 AC impedance spectroscopy
To obtain the ionic conductivity of solid electrolytes, AC impedance spectroscopy
is usually used. When a DC voltage is applied to solid electrolytes, all movable ions
migrate to the electrodes and then stop moving. On the other hand, when AC voltage is
applied, the ions oscillate parallel to the direction of the potential gradient with a
frequency that depends on the AC voltage frequency. The current I(ω) is measured and
the impedance, Z(ω) is calculated from the voltage E(ω) and current as
)(
)()(
I
EZ (1)
where ω is the frequency of the AC voltage. The absolute value of the impedance |Z| can
be obtained by the measured voltage, current, and phase difference θ (obtained from
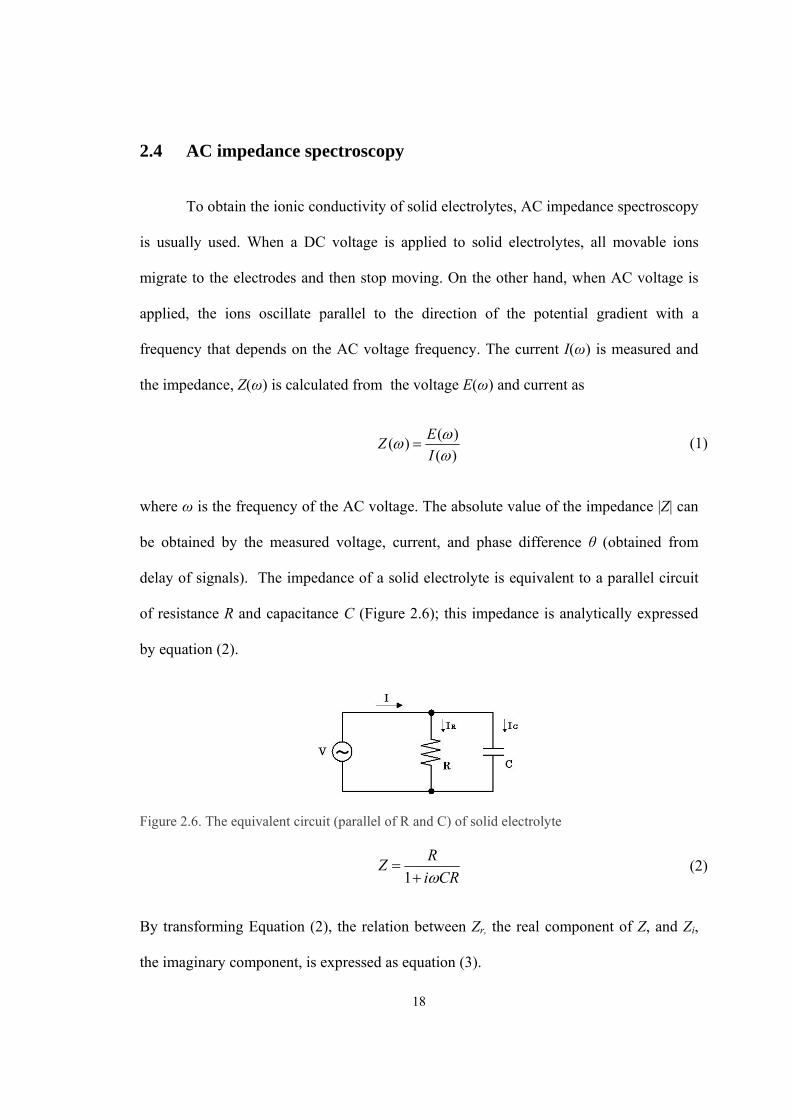
delay of signals). The impedance of a solid electrolyte is equivalent to a parallel circuit
of resistance R and capacitance C (Figure 2.6); this impedance is analytically expressed
by equation (2).
Figure 2.6. The equivalent circuit (parallel of R and C) of solid electrolyte
CRi
RZ
1 (2)
By transforming Equation (2), the relation between Zr, the real component of Z, and Zi,
the imaginary component, is expressed as equation (3).
19
2
22
22
RZ
RZ ir (3)
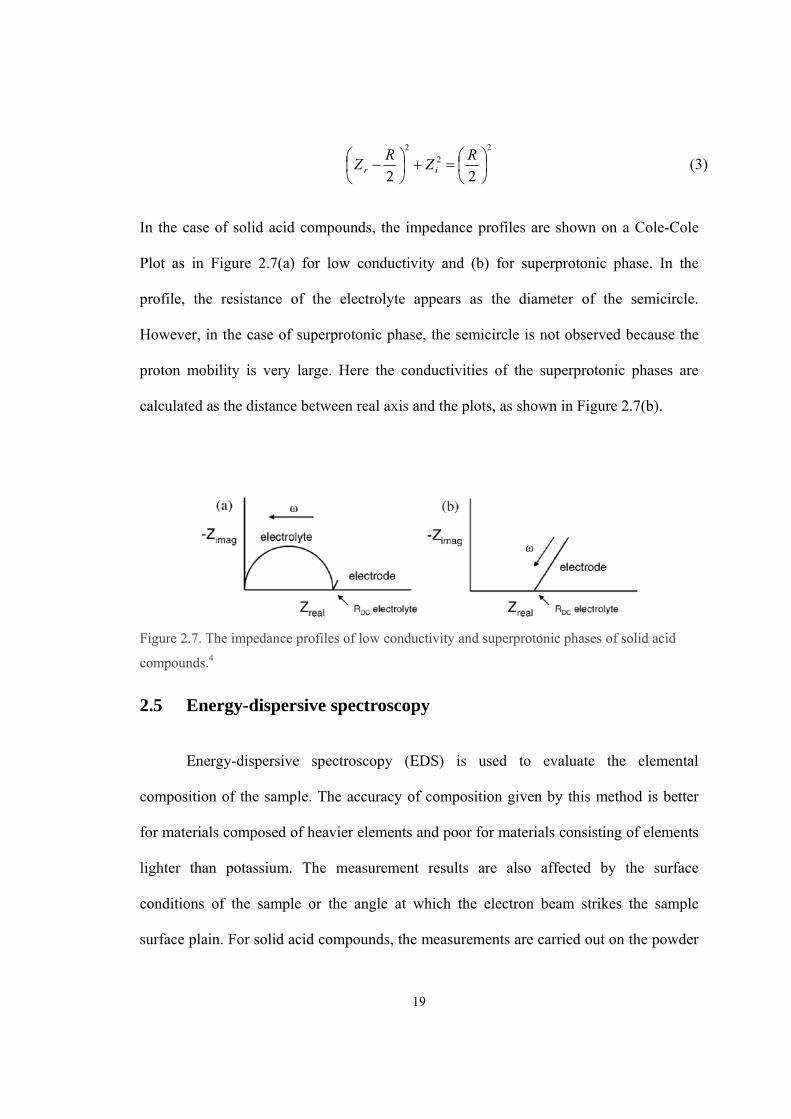
In the case of solid acid compounds, the impedance profiles are shown on a Cole-Cole
Plot as in Figure 2.7(a) for low conductivity and (b) for superprotonic phase. In the
profile, the resistance of the electrolyte appears as the diameter of the semicircle.
However, in the case of superprotonic phase, the semicircle is not observed because the
proton mobility is very large. Here the conductivities of the superprotonic phases are
calculated as the distance between real axis and the plots, as shown in Figure 2.7(b).
Figure 2.7. The impedance profiles of low conductivity and superprotonic phases of solid acid
compounds.4
2.5 Energy-dispersive spectroscopy
Energy-dispersive spectroscopy (EDS) is used to evaluate the elemental
composition of the sample. The accuracy of composition given by this method is better
for materials composed of heavier elements and poor for materials consisting of elements
lighter than potassium. The measurement results are also affected by the surface
conditions of the sample or the angle at which the electron beam strikes the sample
surface plain. For solid acid compounds, the measurements are carried out on the powder
20
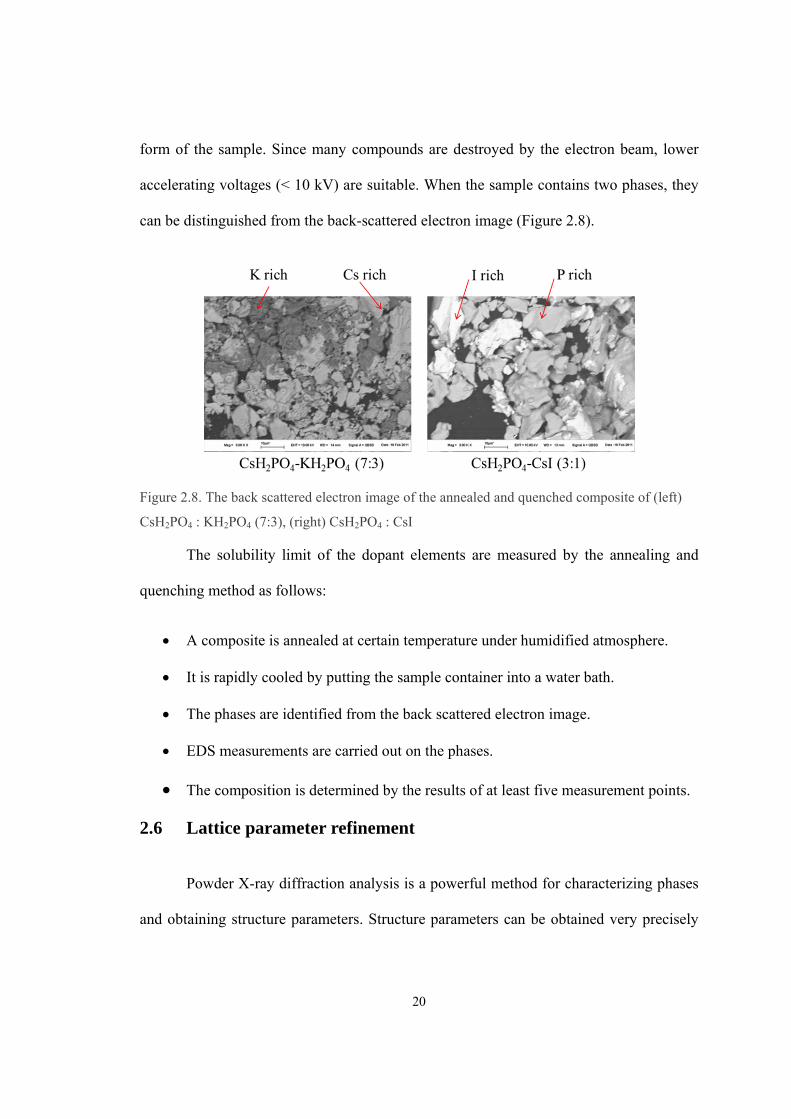
form of the sample. Since many compounds are destroyed by the electron beam, lower
accelerating voltages (< 10 kV) are suitable. When the sample contains two phases, they
can be distinguished from the back-scattered electron image (Figure 2.8).
Figure 2.8. The back scattered electron image of the annealed and quenched composite of (left)
CsH2PO4 : KH2PO4 (7:3), (right) CsH2PO4 : CsI
The solubility limit of the dopant elements are measured by the annealing and
quenching method as follows:
A composite is annealed at certain temperature under humidified atmosphere.
It is rapidly cooled by putting the sample container into a water bath.
The phases are identified from the back scattered electron image.
EDS measurements are carried out on the phases.
The composition is determined by the results of at least five measurement points.
2.6 Lattice parameter refinement
Powder X-ray diffraction analysis is a powerful method for characterizing phases
and obtaining structure parameters. Structure parameters can be obtained very precisely
21
by using Nelson-Riley extrapolation method or by combination of the internal standard
and Rietveld refinement.
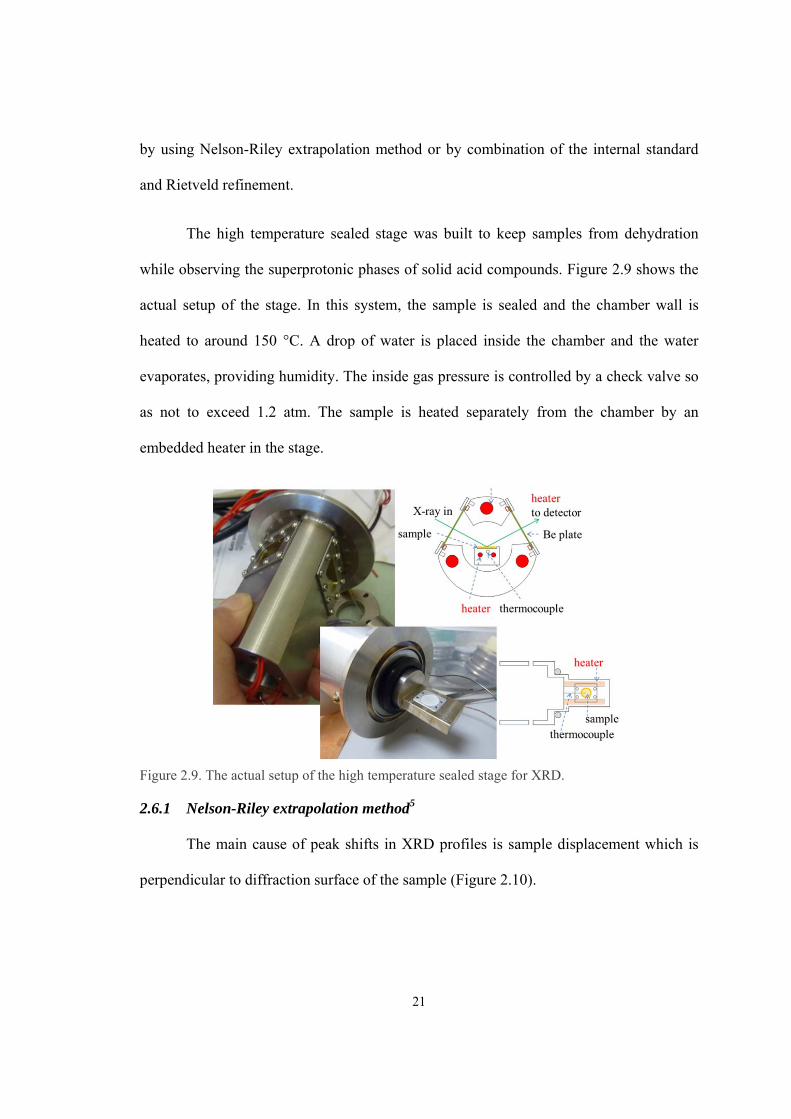
The high temperature sealed stage was built to keep samples from dehydration
while observing the superprotonic phases of solid acid compounds. Figure 2.9 shows the
actual setup of the stage. In this system, the sample is sealed and the chamber wall is
heated to around 150 °C. A drop of water is placed inside the chamber and the water
evaporates, providing humidity. The inside gas pressure is controlled by a check valve so
as not to exceed 1.2 atm. The sample is heated separately from the chamber by an
embedded heater in the stage.
Figure 2.9. The actual setup of the high temperature sealed stage for XRD.
2.6.1 Nelson-Riley extrapolation method5
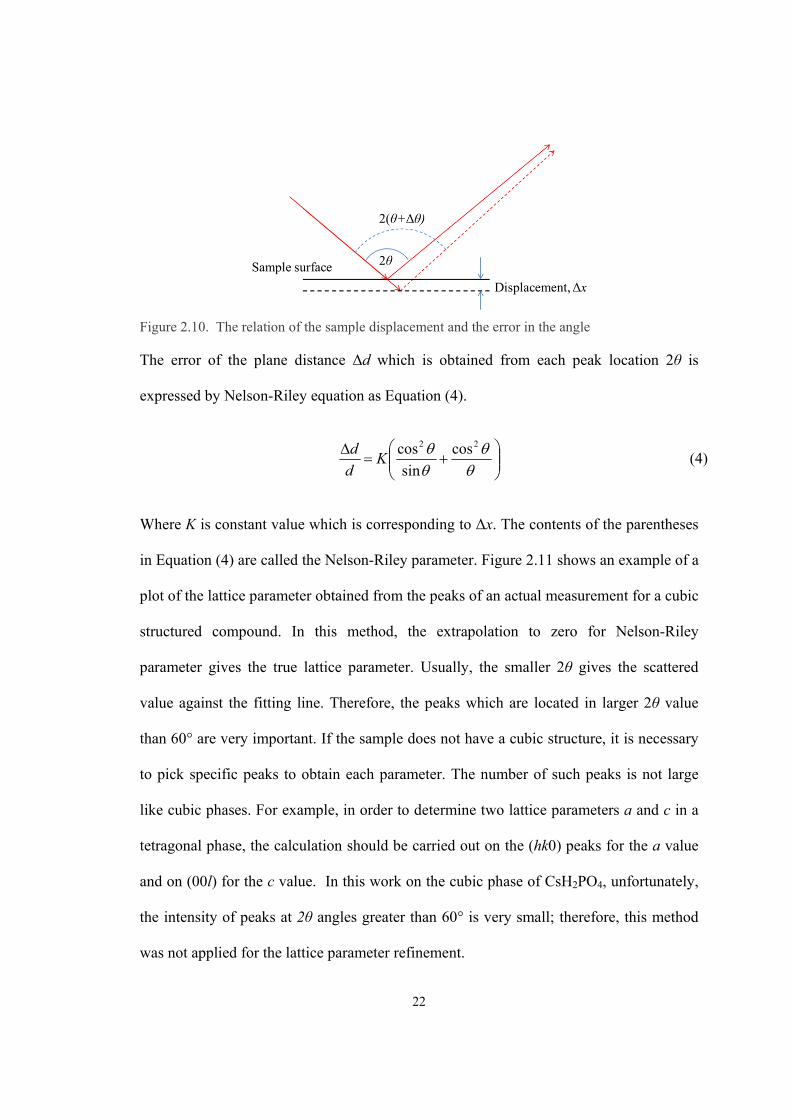
The main cause of peak shifts in XRD profiles is sample displacement which is
perpendicular to diffraction surface of the sample (Figure 2.10).
22
Figure 2.10. The relation of the sample displacement and the error in the angle
The error of the plane distance Δd which is obtained from each peak location 2θ is
expressed by Nelson-Riley equation as Equation (4).
22 cos
sin
cosK
d
d (4)
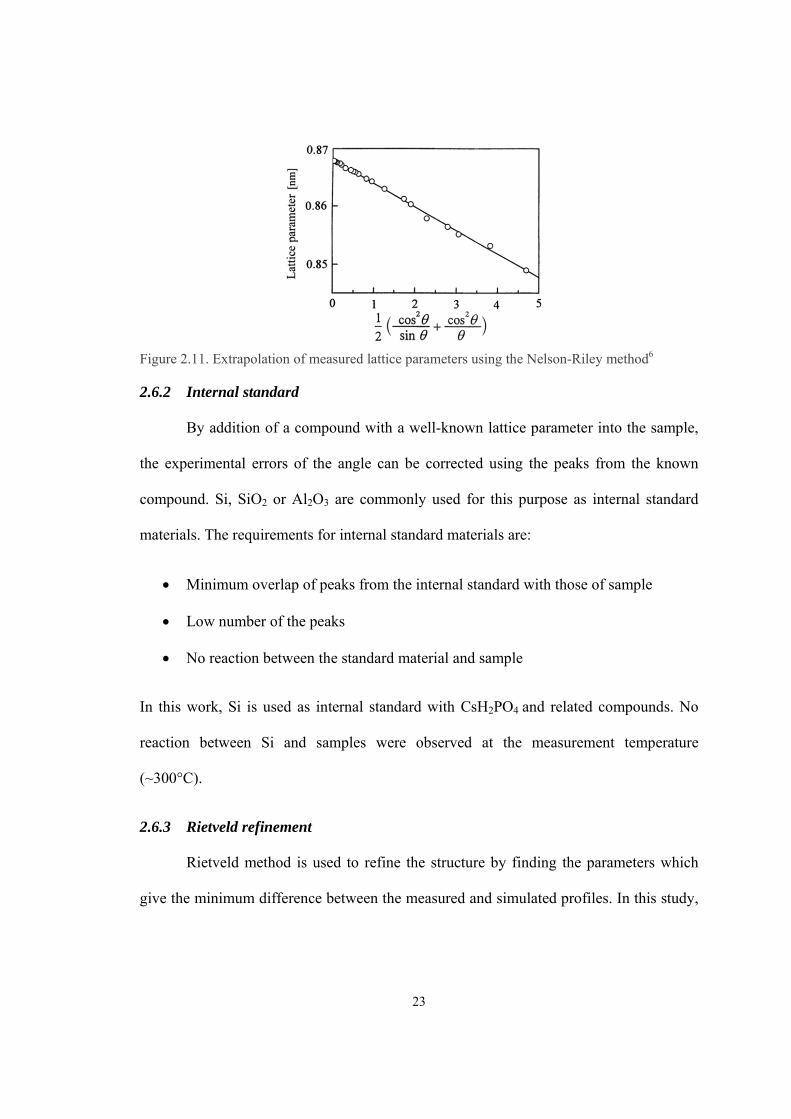
Where K is constant value which is corresponding to Δx. The contents of the parentheses
in Equation (4) are called the Nelson-Riley parameter. Figure 2.11 shows an example of a
plot of the lattice parameter obtained from the peaks of an actual measurement for a cubic
structured compound. In this method, the extrapolation to zero for Nelson-Riley
parameter gives the true lattice parameter. Usually, the smaller 2θ gives the scattered
value against the fitting line. Therefore, the peaks which are located in larger 2θ value
than 60° are very important. If the sample does not have a cubic structure, it is necessary
to pick specific peaks to obtain each parameter. The number of such peaks is not large
like cubic phases. For example, in order to determine two lattice parameters a and c in a
tetragonal phase, the calculation should be carried out on the (hk0) peaks for the a value
and on (00l) for the c value. In this work on the cubic phase of CsH2PO4, unfortunately,
the intensity of peaks at 2θ angles greater than 60° is very small; therefore, this method
was not applied for the lattice parameter refinement.
23
Figure 2.11. Extrapolation of measured lattice parameters using the Nelson-Riley method6
2.6.2 Internal standard
By addition of a compound with a well-known lattice parameter into the sample,
the experimental errors of the angle can be corrected using the peaks from the known
compound. Si, SiO2 or Al2O3 are commonly used for this purpose as internal standard
materials. The requirements for internal standard materials are:
Minimum overlap of peaks from the internal standard with those of sample
Low number of the peaks
No reaction between the standard material and sample
In this work, Si is used as internal standard with CsH2PO4 and related compounds. No
reaction between Si and samples were observed at the measurement temperature
(~300°C).
2.6.3 Rietveld refinement
Rietveld method is used to refine the structure by finding the parameters which
give the minimum difference between the measured and simulated profiles. In this study,
24
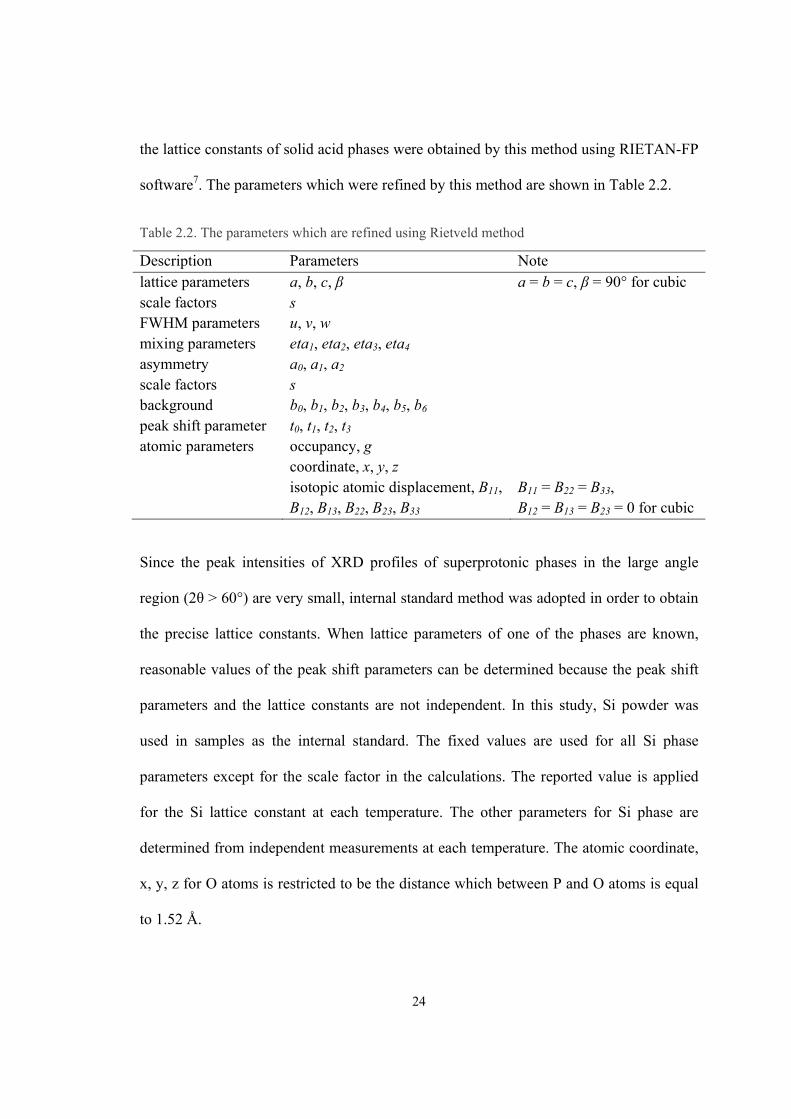
the lattice constants of solid acid phases were obtained by this method using RIETAN-FP
software7. The parameters which were refined by this method are shown in Table 2.2.
Table 2.2. The parameters which are refined using Rietveld method
Description Parameters Note lattice parameters a, b, c, β a = b = c, β = 90° for cubic scale factors s FWHM parameters u, v, w mixing parameters eta1, eta2, eta3, eta4 asymmetry a0, a1, a2 scale factors s background b0, b1, b2, b3, b4, b5, b6 peak shift parameter t0, t1, t2, t3 atomic parameters occupancy, g coordinate, x, y, z isotopic atomic displacement, B11,
B12, B13, B22, B23, B33 B11 = B22 = B33, B12 = B13 = B23 = 0 for cubic
Since the peak intensities of XRD profiles of superprotonic phases in the large angle
region (2θ > 60°) are very small, internal standard method was adopted in order to obtain
the precise lattice constants. When lattice parameters of one of the phases are known,
reasonable values of the peak shift parameters can be determined because the peak shift
parameters and the lattice constants are not independent. In this study, Si powder was
used in samples as the internal standard. The fixed values are used for all Si phase
parameters except for the scale factor in the calculations. The reported value is applied
for the Si lattice constant at each temperature. The other parameters for Si phase are
determined from independent measurements at each temperature. The atomic coordinate,
x, y, z for O atoms is restricted to be the distance which between P and O atoms is equal
to 1.52 Å.
25
Bibliography
1 Price, D., www.sump4.com/downloads/TGA.ppt
2 Netzsch, http://www.benelux-
scientific.be/fileadmin/user_files/pdf/workshop_netzsch2009/intro_to_thermal_analysis.p
df
3 Bunjes, H. & Unruh, T. "Characterization of lipid nanoparticles by differential scanning
calorimetry, X-ray and neutron scattering". Advanced Drug Delivery Reviews 59, 379-
402, (2007).
4 Haile, S. M., Chisholm, C. R. I., Sasaki, K., Boysen, D. A. & Uda, T. "Solid acid proton
conductors: from laboratory curiosities to fuel cell electrolytes". Faraday Discussions
134, 17-39, (2007).
5 Cullity, B. D. ELEMENTS OF X-RAY DIFFRACTION 3rd edition. 326 (1956).
6 Yoshio Waseda, E. M., Kozo Shinoda. X-Ray Diffraction Crystallography: Introduction,
Examples and Solved Problems. (2011).
7 Izumi, F. & Momma, K. "Three-dimensional visualization in powder diffraction".
Applied Crystallography XX 130, 15-20, (2007).
26
Chapter 3 Dehydration-hydration of CsH2PO4 1
3.1. Introduction
Under sufficient humidification, the compound CsH2PO4 transforms at 228 °C
and 1 atm total pressure to a stable, cubic phase of high conductivity, recognized as the
superprotonic phase. The conductivity in the superprotonic state renders CsH2PO4 an
attractive material for fuel cell and other electrochemical applications 2. As discussed in a
recent overview of the literature regarding the high temperature properties of CsH2PO4,
some have suggested that the jump in conductivity at the purported transition is an
artifact of dehydration, but the evidence in favor of a polymeric transformation is
overwhelming 3. Essential to the observation and utilization of the superprotonic phase is
the application of sufficient humidity so as to prevent the dehydration that otherwise
occurs under ambient levels of humidification above the transition temperature 2. Several
recent studies have appeared describing the dehydration thermodynamics and kinetics of
CsH2PO4. The first semi-quantitative study was that of Boysen 2 who reported the
dehydration temperature of CsH2PO4 at selected water vapor pressures (over the T and
OH2p ranges 205~280 °C and 0.01~0.35 atm, respectively) by detecting, in closed
chamber cells, small humidity increases resulting from dehydration. Taninouchi et al.
determined the dehydration temperature through a combination of thermogravimetric
analysis and conductivity measurements at OH2
p = 0.008 ~ 0.4 atm 4-6. At temperatures
below 265 °C and water partial pressures below 0.22 atm, CsH2PO4 was observed to
undergo direct dehydration to the solid product CsPO3. At higher OH2p and intermediate
temperatures, however, a stable liquid product corresponding to incomplete dehydration
27
(CsH2(1-x)PO4-x(l) with x close to 0.4 but dependent on OH2p ) was detected. Thus, a triple
point corresponding to the three-phase equilibrium between CsH2PO4(sp,s), CsH2(1-x)PO4-
x(l), and CsPO3(s) was observed at T = 265 °C and OH2
p = 0.22 atm.
While these studies have revealed the general features of the T-OH2
p phase
behavior of CsH2PO4, several aspects remain unresolved. For example, under high
humidity conditions, as reported by Taninouchi et. al. 6, different values for dehydration
temperatures were obtained from thermogravimetric and conductivity measurements.
Furthermore, the phase stability in the near vicinity of the triple point has not been fully
clarified. Because the dehydration kinetics of CsH2PO4 are extremely slow (even the
solid-solid dehydration remains undetectable by TG for as long as 20 hours under
isothermal, isobaric conditions 4), it is plausible that in such experiments equilibrium was
not attained and is responsible for the differences, despite the fact that the results were
extrapolated to zero heating rates. Kinetic effects are expected to be particularly acute for
high-humidity, fixed-heating-rate experiments that traverse the liquid phase, due to
sample consolidation by capillary forces generated by the presence of the liquid and the
concomitant loss of surface area. In the present work we re-examine the thermodynamics
and kinetics of dehydration of CsH2PO4 by thermal analysis. The measurements are
facilitated by the use of high-surface-area silica as an additive to enhance the overall rates
of the process and ensure access to thermodynamic behavior. The rehydration behavior of
CsPO3, which sheds light on both thermodynamic and kinetic properties of this system, is
also evaluated.
28
3.2. Experimental details
Polycrystalline powders of CsH2PO4 were prepared by combining the starting
reagents of Cs2CO3 (Alfa Aesar, 99.99%) and H3PO4 (ACS, 85% w/w aqueous solution)
in a molar ratio of 1:2 in aqueous solution. Rapid precipitation of CsH2PO4 was induced
by injecting the solution into methanol, yielding material with a particle size of ~ 10 m.
The CsH2PO4 was then combined with 20 wt % amorphous silica powder (Alfa Aesar,
S.A 330-410, 325 mesh) and homogenized by mechanical agitation. For
thermogravimetric (TG) experiments, the composite was used in loose powder form,
whereas for differential scanning calorimetry (DSC) experiments, the powder was lightly
pressed into solid compacts (~ 85% theoretical density) using a uniaxial press. Selected
experiments were further performed using cesium metaphosphate, CsPO3, the preparation
of which is described below along with the associated measurements.
Microstructural features were observed by scanning electron microscopy (LEO
1550 VP FESEM). The accelerating voltage was 10 kV. The phase structure was
determined by Rietveld refinement from X-ray powder diffraction (Philips X’Pert Pro,
CuK radiation).
Thermogravimetric (TG) analysis was carried out using an in-house-constructed
system, the operation of which is discussed in detail elsewhere 4. In brief, the sample is
placed on a glass container incorporating a thermocouple junction (Type E) which, in
turn, is hung from a balance (Mettler Toledo AL54) into a humidified oven that also
incorporates a humidity sensor. The accessible water partial pressure and temperature
ranges are, respectively, 0.02~0.75 atm and 50~400 ºC, with stabilities of 0.01 atm and
29
0.04 ºC, respectively. The mass resolution of the system is 0.1 mg, implying for a
typical sample weight of 130 mg a relative resolution of 0.08%.
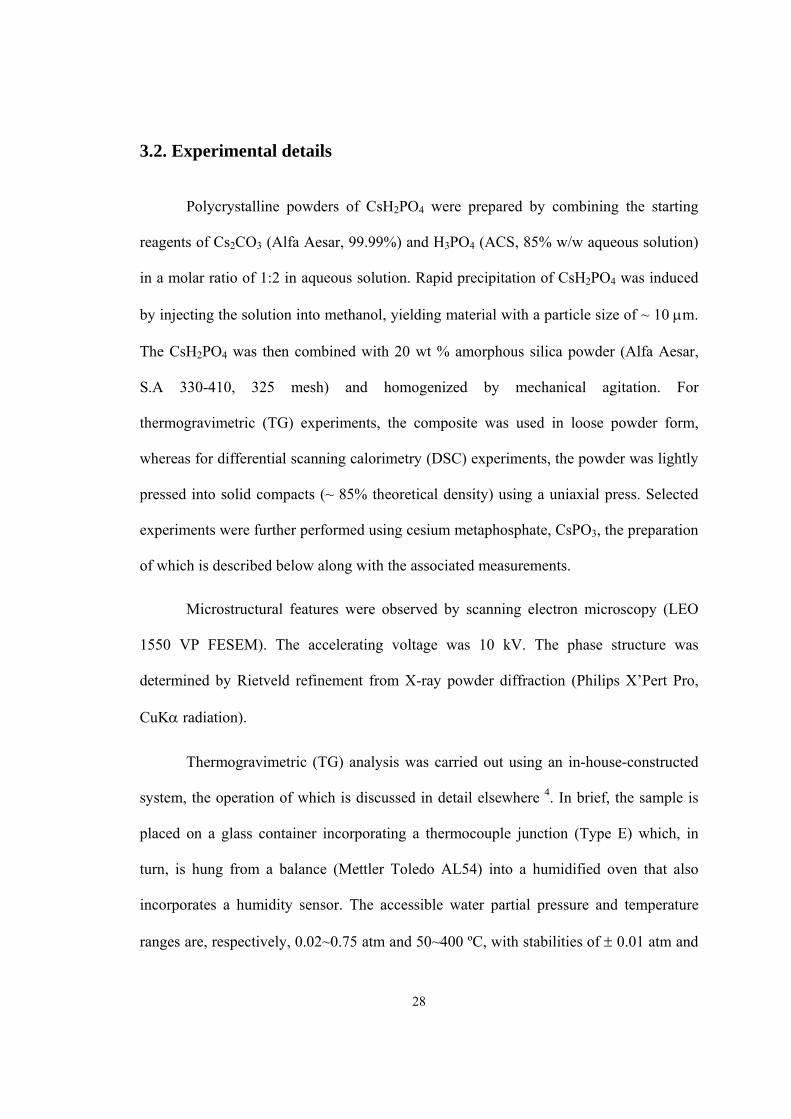
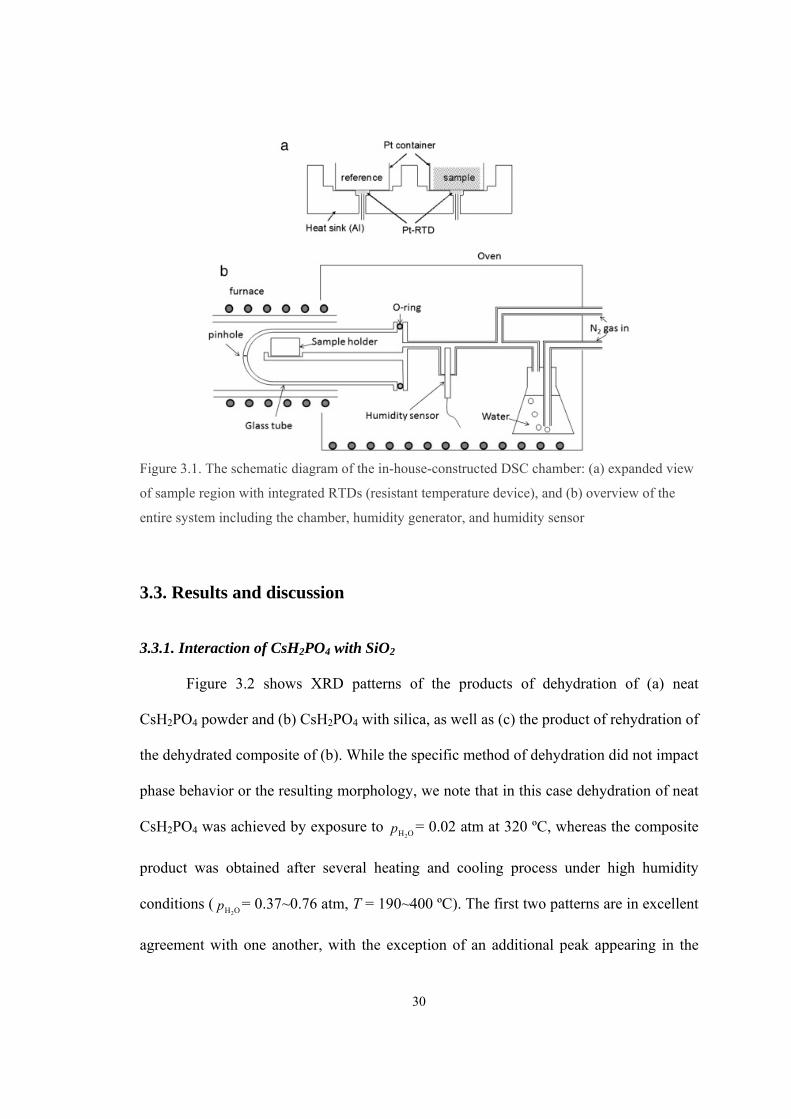
Heat flow measurements were carried out using a second, in-house-constructed
system, shown schematically in Figure 3.1. The sample and reference containers are
placed on an Al heat sink holder incorporating Pt resistance temperature devices (RTD).
The resistances of the two RTDs are measured by a multimeter (KEITHLEY 2420) and
converted to temperature values. The difference between the two is converted to heat
flow, calibrated using melting enthalpy of pure Sn (7.03 kJ/mol) at its normal melting
temperature 231.9 ºC. Humid N2 gas is introduced to the chamber and humidity is
observed by humidity sensor (rotronic Hygrolab). The accessible temperature and water
partial pressure ranges are, respectively, 0.02~0.90 atm and 100~400 ºC, with stabilities
of 0.01 atm and 0.01 ºC, respectively. The heat flow resolution of the system is 0.05
mW. For a typical heating rate of 0.5 ºC/min and a typical sample weight of 63 mg, the
resolution for the thermal signature was 0.02 J/g. For both TG and DSC measurements,
the actual rather than nominal OH2
p is reported throughout.
30
Figure 3.1. The schematic diagram of the in-house-constructed DSC chamber: (a) expanded view
of sample region with integrated RTDs (resistant temperature device), and (b) overview of the
entire system including the chamber, humidity generator, and humidity sensor
3.3. Results and discussion
3.3.1. Interaction of CsH2PO4 with SiO2
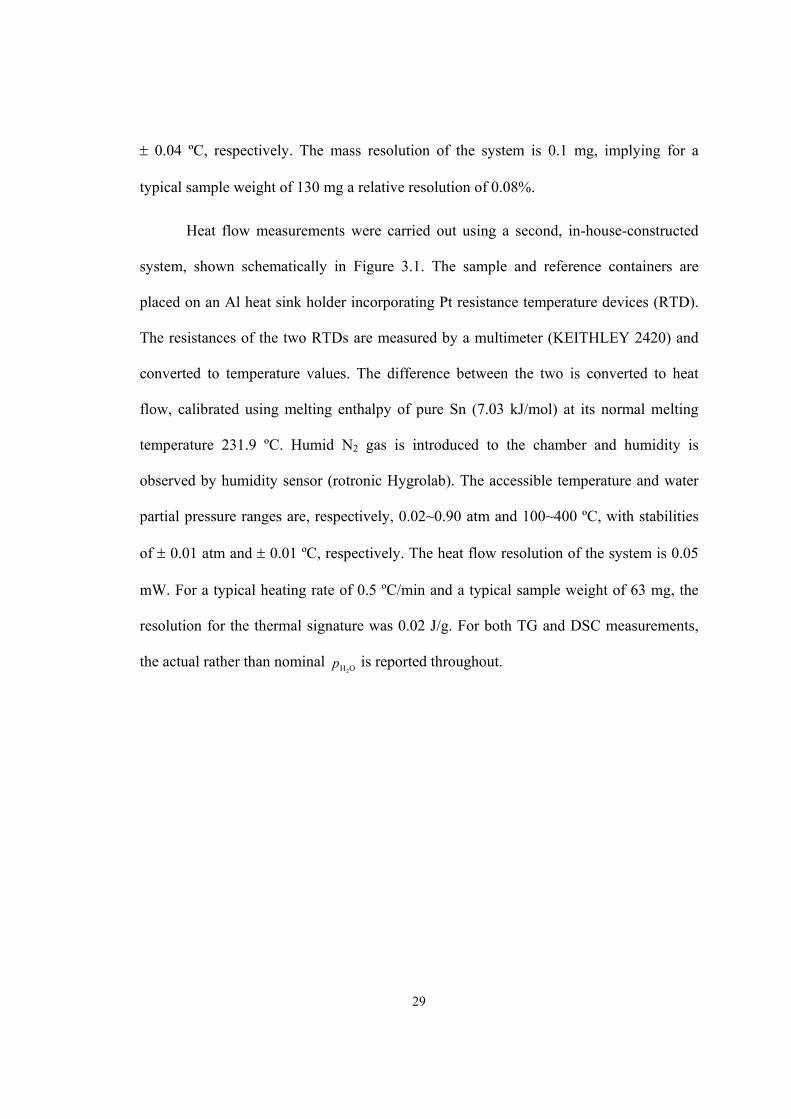
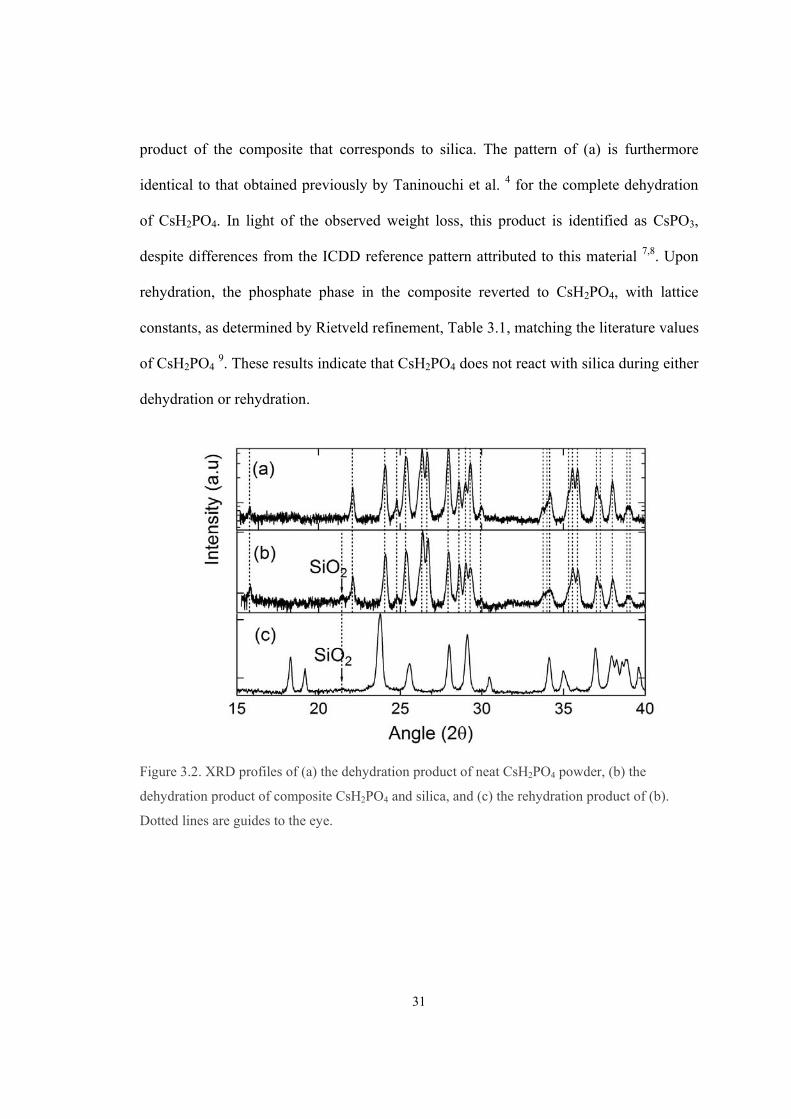
Figure 3.2 shows XRD patterns of the products of dehydration of (a) neat
CsH2PO4 powder and (b) CsH2PO4 with silica, as well as (c) the product of rehydration of
the dehydrated composite of (b). While the specific method of dehydration did not impact
phase behavior or the resulting morphology, we note that in this case dehydration of neat
CsH2PO4 was achieved by exposure to OH2
p = 0.02 atm at 320 ºC, whereas the composite
product was obtained after several heating and cooling process under high humidity
conditions ( OH2p = 0.37~0.76 atm, T = 190~400 ºC). The first two patterns are in excellent
agreement with one another, with the exception of an additional peak appearing in the
31
product of the composite that corresponds to silica. The pattern of (a) is furthermore
identical to that obtained previously by Taninouchi et al. 4 for the complete dehydration
of CsH2PO4. In light of the observed weight loss, this product is identified as CsPO3,
despite differences from the ICDD reference pattern attributed to this material 7,8. Upon
rehydration, the phosphate phase in the composite reverted to CsH2PO4, with lattice
constants, as determined by Rietveld refinement, Table 3.1, matching the literature values
of CsH2PO4 9. These results indicate that CsH2PO4 does not react with silica during either
dehydration or rehydration.
Figure 3.2. XRD profiles of (a) the dehydration product of neat CsH2PO4 powder, (b) the
dehydration product of composite CsH2PO4 and silica, and (c) the rehydration product of (b).
Dotted lines are guides to the eye.
32
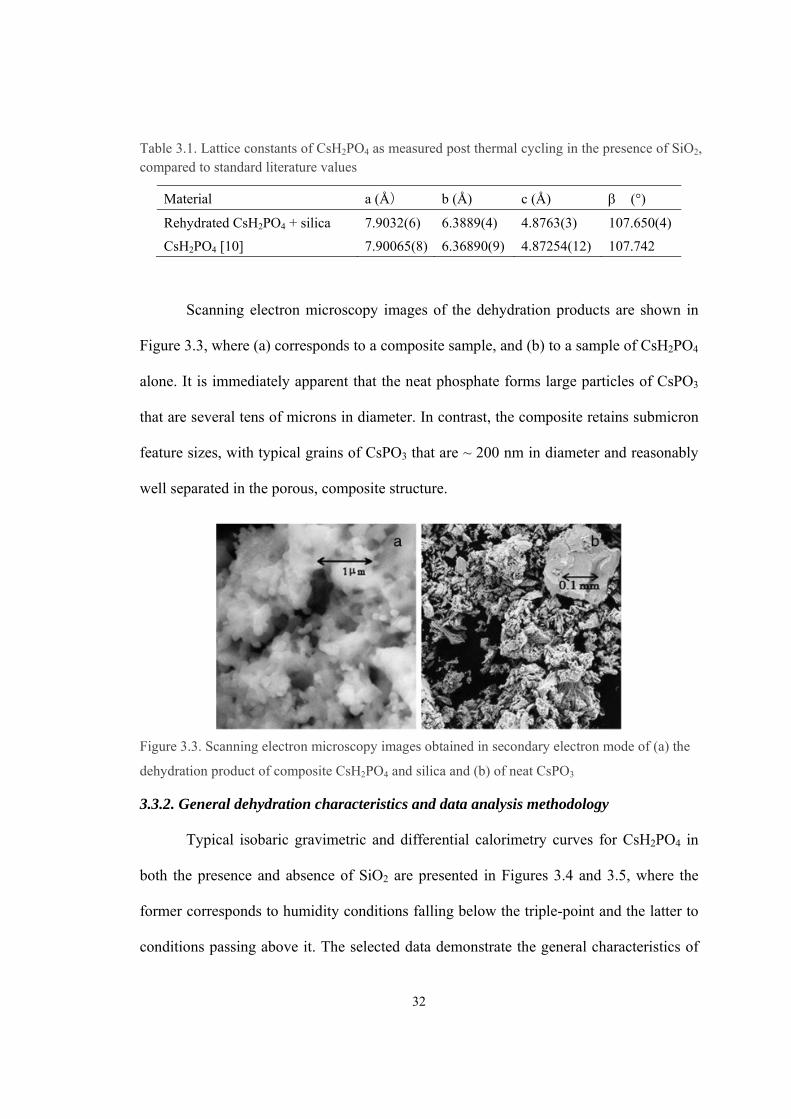
Table 3.1. Lattice constants of CsH2PO4 as measured post thermal cycling in the presence of SiO2, compared to standard literature values
Material a (Å) b (Å) c (Å) (°)
Rehydrated CsH2PO4 + silica 7.9032(6) 6.3889(4) 4.8763(3) 107.650(4)
CsH2PO4 [10] 7.90065(8) 6.36890(9) 4.87254(12) 107.742
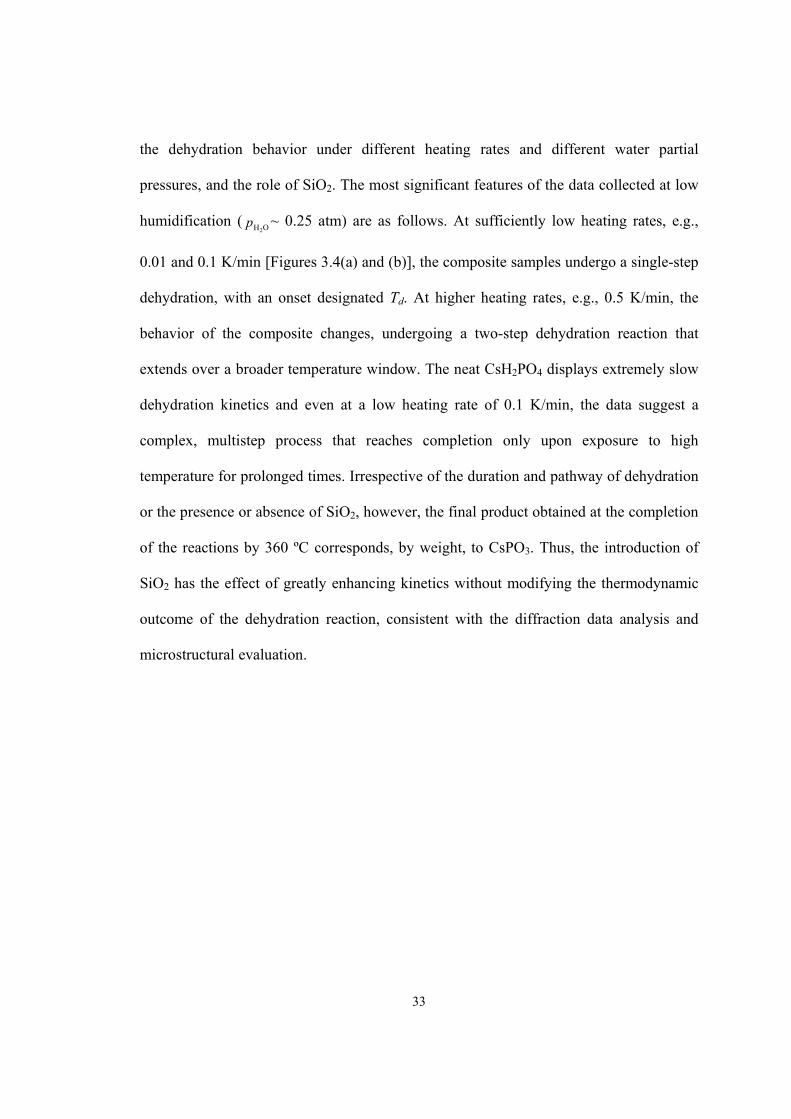
Scanning electron microscopy images of the dehydration products are shown in
Figure 3.3, where (a) corresponds to a composite sample, and (b) to a sample of CsH2PO4
alone. It is immediately apparent that the neat phosphate forms large particles of CsPO3
that are several tens of microns in diameter. In contrast, the composite retains submicron
feature sizes, with typical grains of CsPO3 that are ~ 200 nm in diameter and reasonably
well separated in the porous, composite structure.
Figure 3.3. Scanning electron microscopy images obtained in secondary electron mode of (a) the
dehydration product of composite CsH2PO4 and silica and (b) of neat CsPO3
3.3.2. General dehydration characteristics and data analysis methodology
Typical isobaric gravimetric and differential calorimetry curves for CsH2PO4 in
both the presence and absence of SiO2 are presented in Figures 3.4 and 3.5, where the
former corresponds to humidity conditions falling below the triple-point and the latter to
conditions passing above it. The selected data demonstrate the general characteristics of
33
the dehydration behavior under different heating rates and different water partial
pressures, and the role of SiO2. The most significant features of the data collected at low
humidification ( OH2p ~ 0.25 atm) are as follows. At sufficiently low heating rates, e.g.,
0.01 and 0.1 K/min [Figures 3.4(a) and (b)], the composite samples undergo a single-step
dehydration, with an onset designated Td. At higher heating rates, e.g., 0.5 K/min, the
behavior of the composite changes, undergoing a two-step dehydration reaction that
extends over a broader temperature window. The neat CsH2PO4 displays extremely slow
dehydration kinetics and even at a low heating rate of 0.1 K/min, the data suggest a
complex, multistep process that reaches completion only upon exposure to high
temperature for prolonged times. Irrespective of the duration and pathway of dehydration
or the presence or absence of SiO2, however, the final product obtained at the completion
of the reactions by 360 ºC corresponds, by weight, to CsPO3. Thus, the introduction of
SiO2 has the effect of greatly enhancing kinetics without modifying the thermodynamic
outcome of the dehydration reaction, consistent with the diffraction data analysis and
microstructural evaluation.
34
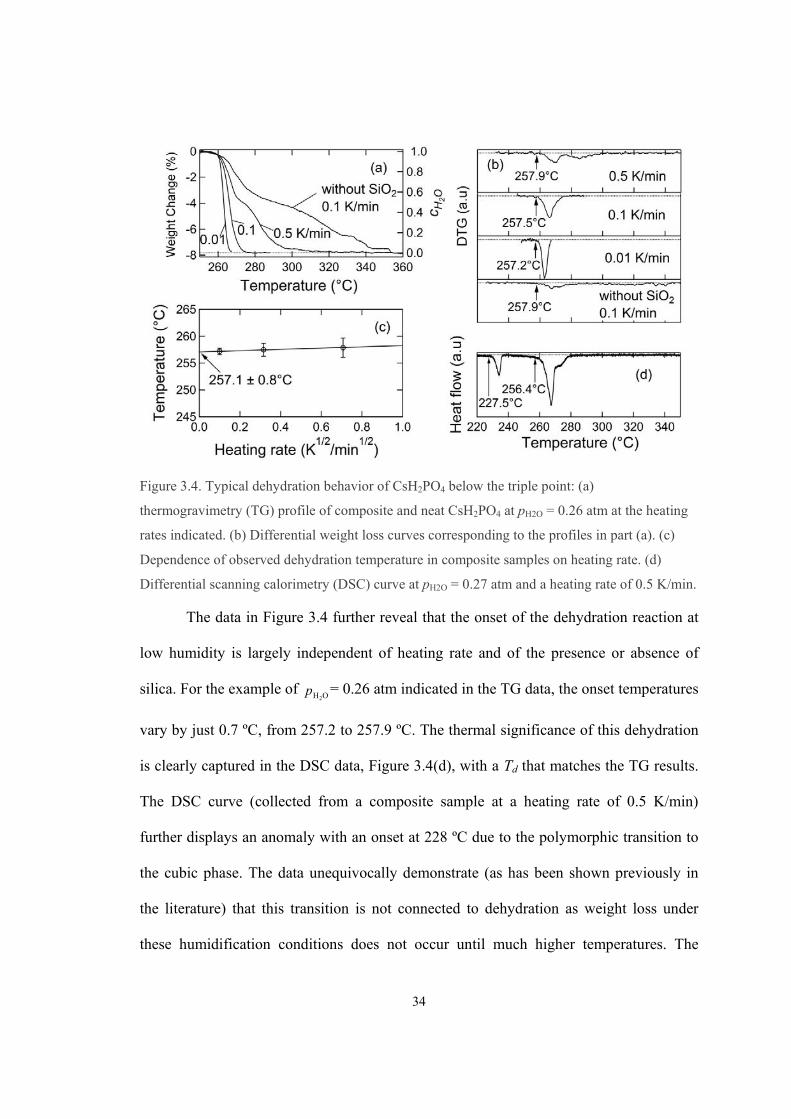
Figure 3.4. Typical dehydration behavior of CsH2PO4 below the triple point: (a)
thermogravimetry (TG) profile of composite and neat CsH2PO4 at pH2O = 0.26 atm at the heating
rates indicated. (b) Differential weight loss curves corresponding to the profiles in part (a). (c)
Dependence of observed dehydration temperature in composite samples on heating rate. (d)
Differential scanning calorimetry (DSC) curve at pH2O = 0.27 atm and a heating rate of 0.5 K/min.
The data in Figure 3.4 further reveal that the onset of the dehydration reaction at
low humidity is largely independent of heating rate and of the presence or absence of
silica. For the example of OH2p = 0.26 atm indicated in the TG data, the onset temperatures
vary by just 0.7 ºC, from 257.2 to 257.9 ºC. The thermal significance of this dehydration
is clearly captured in the DSC data, Figure 3.4(d), with a Td that matches the TG results.
The DSC curve (collected from a composite sample at a heating rate of 0.5 K/min)
further displays an anomaly with an onset at 228 ºC due to the polymorphic transition to
the cubic phase. The data unequivocally demonstrate (as has been shown previously in
the literature) that this transition is not connected to dehydration as weight loss under
these humidification conditions does not occur until much higher temperatures. The
35
enthalpy recorded is 11.7 ± 1.1 kJ/mol, consistent with the values summarized in
reference 3 and validating the calibration of the heat signal. The TG data for the same
sample type and experimental conditions, shown in differential form in Figure 3.4(b),
indicate that the second dehydration step is relatively well defined, with an onset of ~ 280
ºC, but that the signal is barely detectable by DSC. The composite sample is considered
to be out of equilibrium at a heating rate of 0.5 K/min and thus the nature of this second
dehydration was not further investigated.
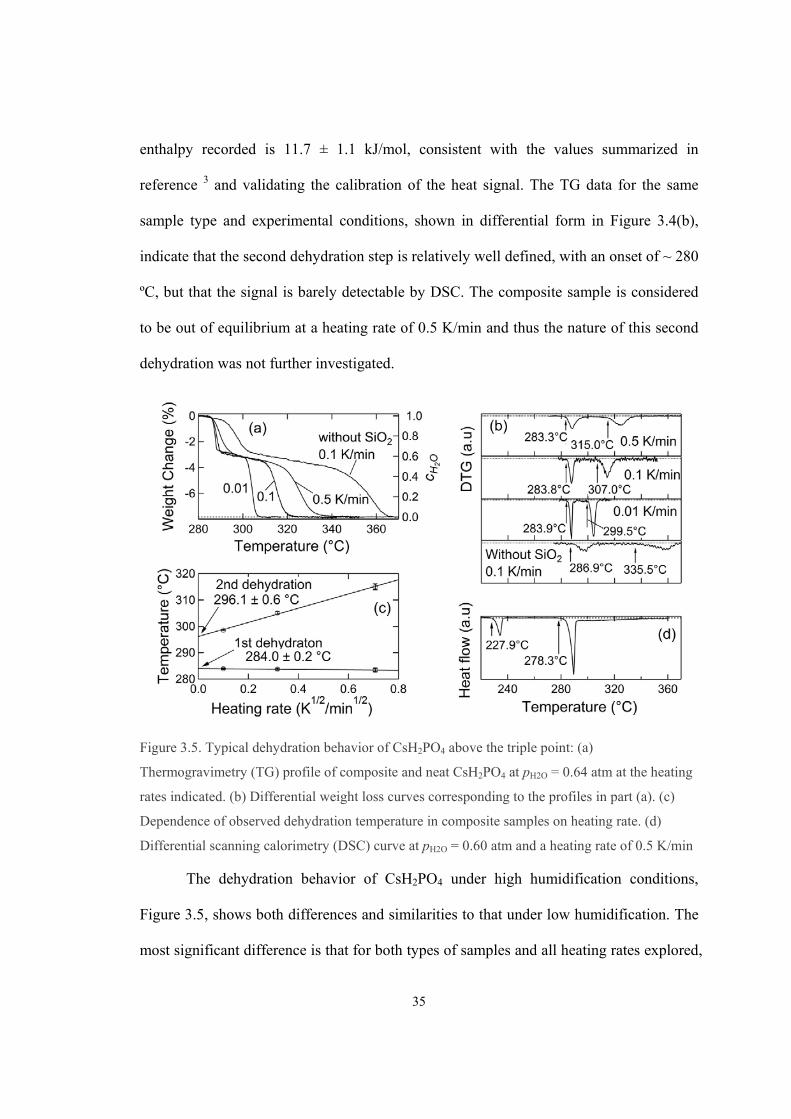
Figure 3.5. Typical dehydration behavior of CsH2PO4 above the triple point: (a)
Thermogravimetry (TG) profile of composite and neat CsH2PO4 at pH2O = 0.64 atm at the heating
rates indicated. (b) Differential weight loss curves corresponding to the profiles in part (a). (c)
Dependence of observed dehydration temperature in composite samples on heating rate. (d)
Differential scanning calorimetry (DSC) curve at pH2O = 0.60 atm and a heating rate of 0.5 K/min
The dehydration behavior of CsH2PO4 under high humidification conditions,
Figure 3.5, shows both differences and similarities to that under low humidification. The
most significant difference is that for both types of samples and all heating rates explored,
36
the dehydration process occurs in two distinct and well-resolved steps. An initial sharp
weight change is followed by a slight, monotonic weight loss (a sloping plateau in the TG
plot), and then a second, sharp weight change. Thus, as suggested by Taninouchi 4, an
intermediate phase of variable H2O content is stable at high OH2p and intermediate
temperatures. The magnitudes of the weight changes reveal that the intermediate phase
has a composition CsH2(1-x)PO4-x with an initial, low-temperature x value of 0.33 and a
final, high-temperature value of 0.4 ~ 0.5, depending on heating rate. All samples that
displayed this two-step dehydration process emerged from the experimental TG apparatus
as densified, almost glassy compacts, whereas those that displayed only a single-step
process remained in the form of loose powders, suggesting, in agreement with the
observations of Taninouchi, that the intermediate phase is a liquid.
Close examination of the data in Figures 3.5(a) and (b) reveals that, amongst the
composite samples, the onset of the first dehydration event, Td1, is independent of heating
rate for rates between 0.01 and 0.5 K/min (occurring in this case at 284.0 ± 0.2 ºC). As in
the low humidity experiments, the absence of SiO2 greatly decelerates the overall kinetics.
The effect is so significant here, however, that the onset of this first dehydration event is
retarded by 5 to 6 ºC. Turning to the second dehydration step, the data reveal that not
only is this process sensitive to the nature of the sample, it is highly sensitive to heating
rate, unlike the first dehydration step. Specifically, the apparent onset temperature, Td2,
shifts to increasingly higher values with increasing heating rate, dT/dt = R. Such behavior,
also observed by Taninouchi 6, suggests that the dehydration of CsH2(1-x)PO4-x(l) to form
CsPO3(s) is a substantially slower reaction than the dehydration of CsH2PO4. To account
for the thermal/kinetic lag in the system and to extract the thermodynamic value of the
37
onset of dehydration, the observed Td2 values were plotted against R½, Figure 3.5(c), and
extrapolated to R = 0. The DSC data, Figure 3.5(d), reveal clear thermal events associated
with the superprotonic transition (with an onset value again of 228 ºC), and the first
dehydration event, with Td1 = 278.3 ºC, at a temperature generally consistent with the TG
data. Reminiscent of the low humidity data, however, the second dehydration event is
barely detectable in the DSC profile. Such behavior is consistent with a kinetically
constrained reaction for which heat release is too gradual to be recorded as a thermal
anomaly.
With the overall dehydration characteristics understood, the behavior of CsH2PO4
over a wide range of water partial pressures was explored. From the discussion presented
above, the dehydration reactions of interest are
(A) CsH2PO4 s,sp ↔ CsPO3 s H2O g (1)
(B) CsH2PO4 s,sp ↔ CsH2 1-xiPO4-xi
l xiH2O g (2)
(C) CsH2 1-xfPO4-xf
l ↔ CsPO3 s xfH2O g (3)
where xi and xf reflect the respective stoichiometries of the intermediate liquid phase
when it is first formed and then finally consumed during heating. The TG experiments
can detect all three of these dehydration steps and were performed using composite
samples at water partial pressures between 0.26 and 0.76 atm and a fixed heating rate of
0.01 K/min. At this slow heating rate the onset temperatures of Reactions (A) and (B) are
accurately obtained from TG data, whereas the overestimation of Td2 (Reaction C) is less
than 3 ºC. The DSC measurements can detect Reactions (A) and (B) as well as the
superprotonic transition, the onset behavior of which is largely independent of heating
38
rate. Measurements were performed at 0.5 K/min over the water partial pressures range
of 0.06 atm to 0.90 atm. To ensure accurate positioning of the triple point, measurements
in the OH2p range of 0.29 to 0.42 atm were repeated multiple times (and results confirmed
to be reproducible). At low humidities, at which dehydration would be expected to occur
at the lowest temperatures, additional isothermal gravimetric measurements were carried
out using partially dehydrated samples (composed of CsH2PO4, CsPO3, and SiO2) at
conditions in the near vicinity of the low temperature phase boundary of Reaction (A). It
was anticipated that the presence of both phosphate phases would overcome any
nucleation barrier and hence aid the transformation kinetics.
For each individual, constant ramp-rate measurement, the decomposition
temperature was defined as the onset of the thermal event, as implied through-out the
preceding discussion. In the case of the DSC profiles, a numerical procedure described in
detail elsewhere 10 was employed to precisely establish this onset. In the case of the TG
profiles, the onset was determined from the dTG plots by evaluating the intersection
between the baseline and the tangent of the dTG peak. Overall, it is to be emphasized that
the presence of SiO2 in composite samples here is believed to allow rapid access to
thermodynamic conditions, and for this reason is an advance over previous studies of
dehydration behavior.
3.3.3. Thermodynamics of dehydration
The TG and DSC data obtained from composite samples over the wide range of
conditions explored are presented in Figures 3.6 and 3.7, respectively. In agreement with
the discussion above, at low humidities ( OH2p < 0.5 atm) a single-step dehydration process
occurs, whereas at high humidities a two-step process is evident (Figure 3.6). In addition,
39
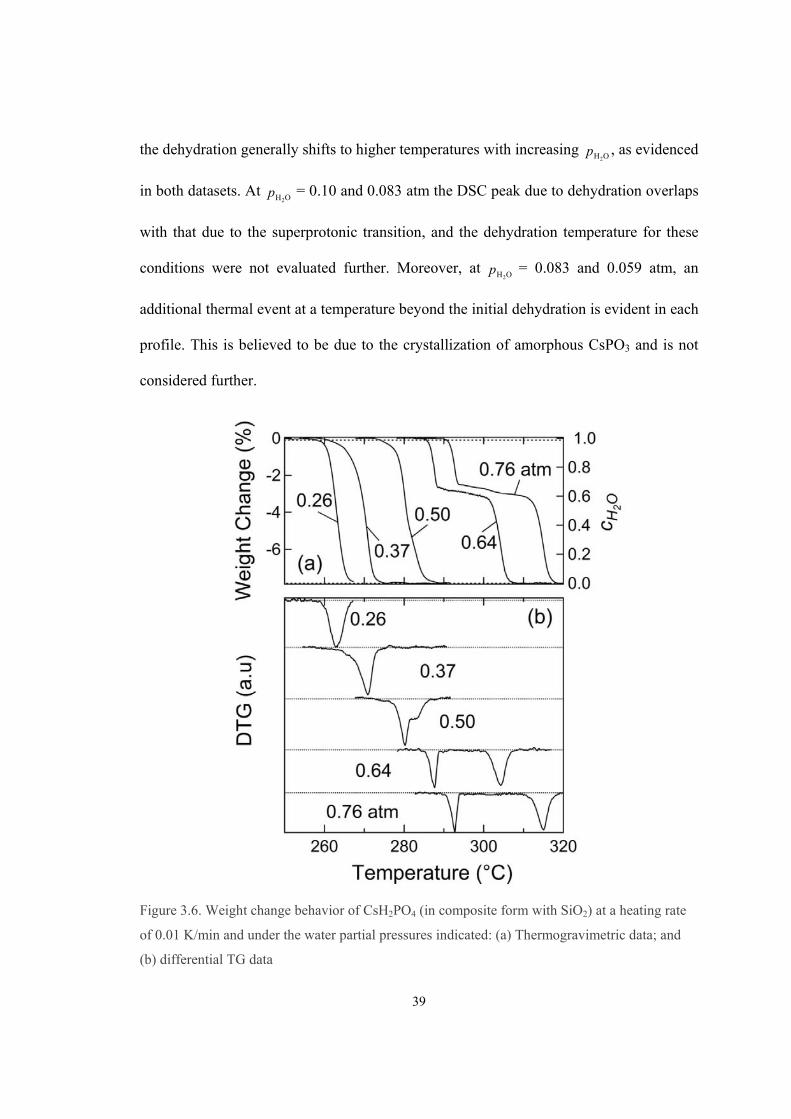
the dehydration generally shifts to higher temperatures with increasing OH2p , as evidenced
in both datasets. At OH2
p = 0.10 and 0.083 atm the DSC peak due to dehydration overlaps
with that due to the superprotonic transition, and the dehydration temperature for these
conditions were not evaluated further. Moreover, at OH2p = 0.083 and 0.059 atm, an
additional thermal event at a temperature beyond the initial dehydration is evident in each
profile. This is believed to be due to the crystallization of amorphous CsPO3 and is not
considered further.
Figure 3.6. Weight change behavior of CsH2PO4 (in composite form with SiO2) at a heating rate
of 0.01 K/min and under the water partial pressures indicated: (a) Thermogravimetric data; and
(b) differential TG data
40
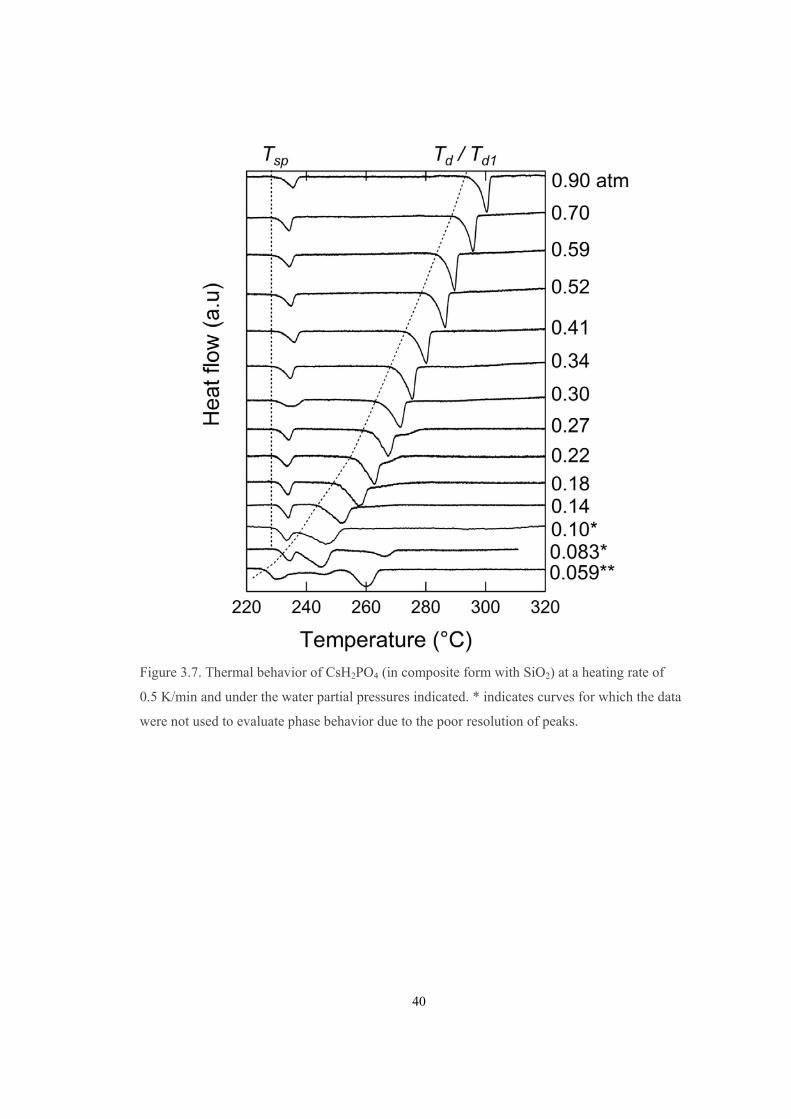
Figure 3.7. Thermal behavior of CsH2PO4 (in composite form with SiO2) at a heating rate of
0.5 K/min and under the water partial pressures indicated. * indicates curves for which the data
were not used to evaluate phase behavior due to the poor resolution of peaks.
41
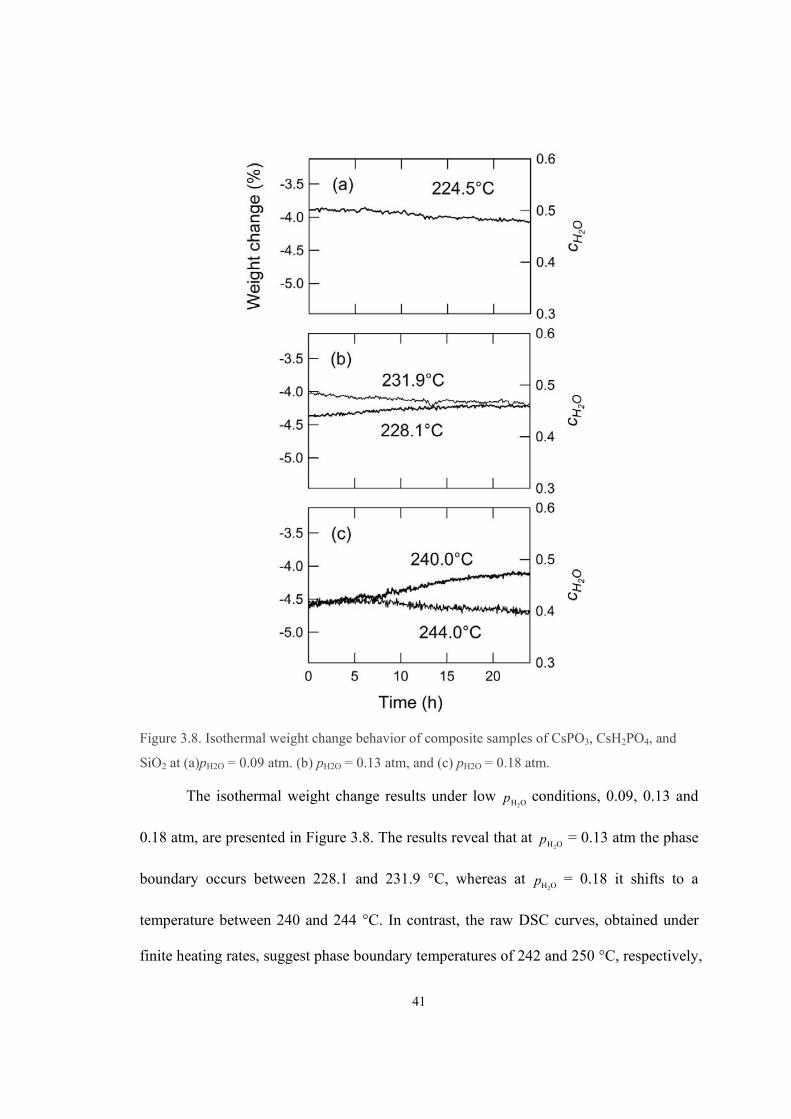
Figure 3.8. Isothermal weight change behavior of composite samples of CsPO3, CsH2PO4, and
SiO2 at (a)pH2O = 0.09 atm. (b) pH2O = 0.13 atm, and (c) pH2O = 0.18 atm.
The isothermal weight change results under low OH2p conditions, 0.09, 0.13 and
0.18 atm, are presented in Figure 3.8. The results reveal that at OH2
p = 0.13 atm the phase
boundary occurs between 228.1 and 231.9 °C, whereas at OH2
p = 0.18 it shifts to a
temperature between 240 and 244 °C. In contrast, the raw DSC curves, obtained under
finite heating rates, suggest phase boundary temperatures of 242 and 250 °C, respectively,
42
for these two atmosphere conditions (Figure 3.7). From the OH2p = 0.09 atm data, it is
evident that the phase boundary lies somewhere below 225 °C, a temperature
significantly lower than what has been previously suggested in the literature. The results
thus further demonstrate that extremely long times are required to observe the
equilibrium weight change behavior. While the change in weight is extremely gradual in
these datasets (0.0202 to 0.0234 mg/hr), the change is statistically greater than the
instrument drift and hence the results indeed reveal the location of the phase boundary.
43
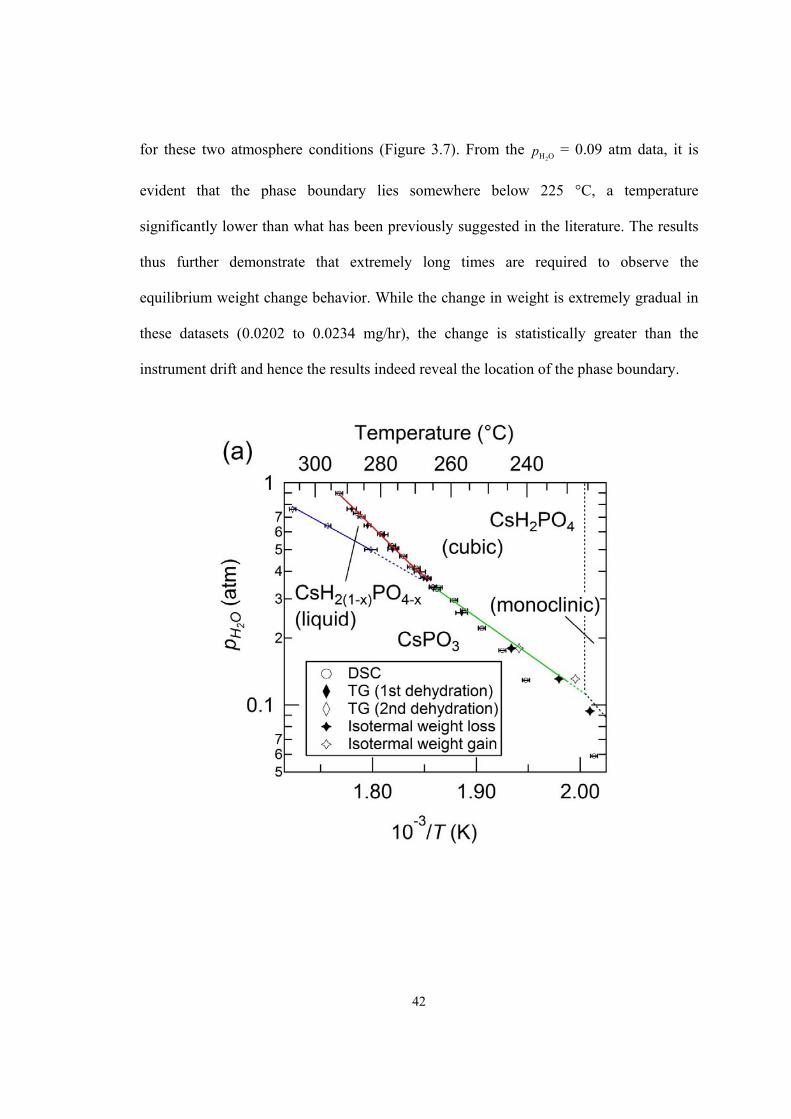
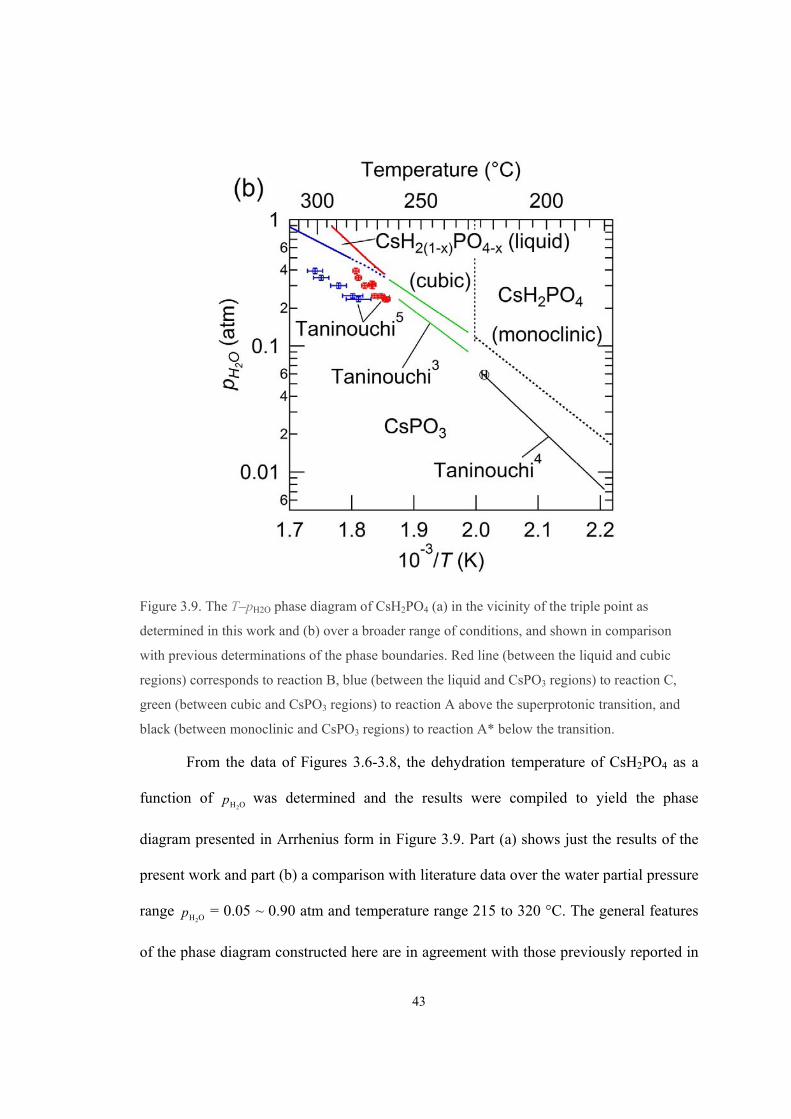
Figure 3.9. The – H2O phase diagram of CsH2PO4 (a) in the vicinity of the triple point as T p
determined in this work and (b) over a broader range of conditions, and shown in comparison
with previous determinations of the phase boundaries. Red line (between the liquid and cubic
regions) corresponds to reaction B, blue (between the liquid and CsPO3 regions) to reaction C,
green (between cubic and CsPO3 regions) to reaction A above the superprotonic transition, and
black (between monoclinic and CsPO3 regions) to reaction A* below the transition.
From the data of Figures 3.6-3.8, the dehydration temperature of CsH2PO4 as a
function of OH2
p was determined and the results were compiled to yield the phase
diagram presented in Arrhenius form in Figure 3.9. Part (a) shows just the results of the
present work and part (b) a comparison with literature data over the water partial pressure
range OH2
p = 0.05 ~ 0.90 atm and temperature range 215 to 320 °C. The general features
of the phase diagram constructed here are in agreement with those previously reported in
44
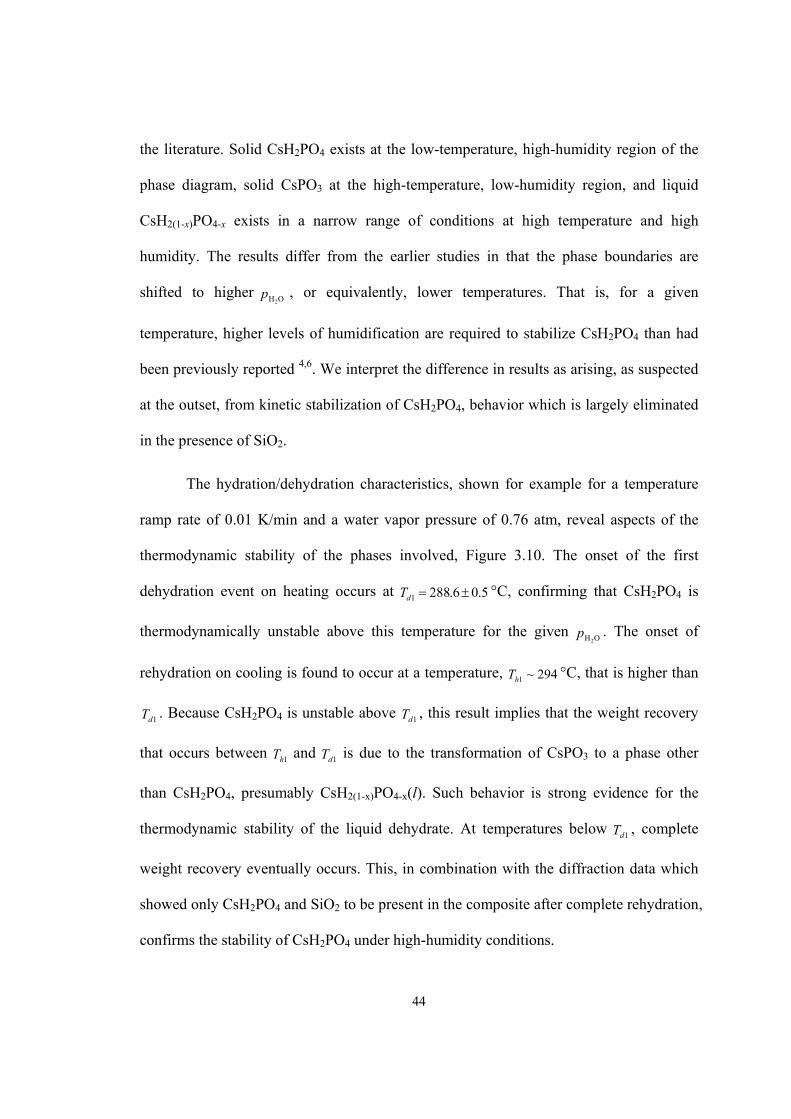
the literature. Solid CsH2PO4 exists at the low-temperature, high-humidity region of the
phase diagram, solid CsPO3 at the high-temperature, low-humidity region, and liquid
CsH2(1-x)PO4-x exists in a narrow range of conditions at high temperature and high
humidity. The results differ from the earlier studies in that the phase boundaries are
shifted to higherOH2
p , or equivalently, lower temperatures. That is, for a given
temperature, higher levels of humidification are required to stabilize CsH2PO4 than had
been previously reported 4,6. We interpret the difference in results as arising, as suspected
at the outset, from kinetic stabilization of CsH2PO4, behavior which is largely eliminated
in the presence of SiO2.
The hydration/dehydration characteristics, shown for example for a temperature
ramp rate of 0.01 K/min and a water vapor pressure of 0.76 atm, reveal aspects of the
thermodynamic stability of the phases involved, Figure 3.10. The onset of the first
dehydration event on heating occurs at 5.06.2881 dT °C, confirming that CsH2PO4 is
thermodynamically unstable above this temperature for the given OH2
p . The onset of
rehydration on cooling is found to occur at a temperature, 294~1hT °C, that is higher than
1dT . Because CsH2PO4 is unstable above 1dT , this result implies that the weight recovery
that occurs between 1hT and 1dT is due to the transformation of CsPO3 to a phase other
than CsH2PO4, presumably CsH2(1-x)PO4-x(l). Such behavior is strong evidence for the
thermodynamic stability of the liquid dehydrate. At temperatures below 1dT , complete
weight recovery eventually occurs. This, in combination with the diffraction data which
showed only CsH2PO4 and SiO2 to be present in the composite after complete rehydration,
confirms the stability of CsH2PO4 under high-humidity conditions.
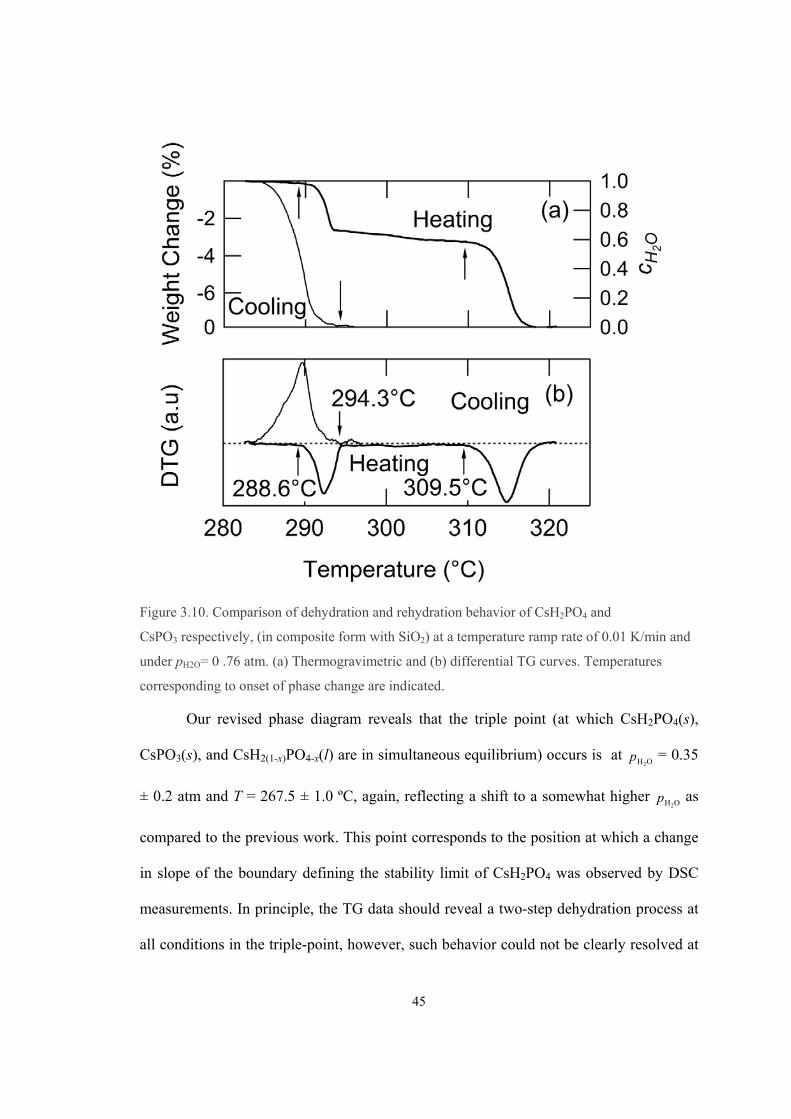
45
Figure 3.10. Comparison of dehydration and rehydration behavior of CsH2PO4 and
CsPO3 respectively, (in composite form with SiO2) at a temperature ramp rate of 0.01 K/min and
under pH2O= 0 .76 atm. (a) Thermogravimetric and (b) differential TG curves. Temperatures
corresponding to onset of phase change are indicated.
Our revised phase diagram reveals that the triple point (at which CsH2PO4(s),
CsPO3(s), and CsH2(1-x)PO4-x(l) are in simultaneous equilibrium) occurs is at OH2
p = 0.35
± 0.2 atm and T = 267.5 ± 1.0 ºC, again, reflecting a shift to a somewhat higher OH2p as
compared to the previous work. This point corresponds to the position at which a change
in slope of the boundary defining the stability limit of CsH2PO4 was observed by DSC
measurements. In principle, the TG data should reveal a two-step dehydration process at
all conditions in the triple-point, however, such behavior could not be clearly resolved at
46
OH2p = 0.37 atm (Figure 3.6). This is attributed to the extremely narrow stability region of
the liquid at this humidification level and to the slow dehydration kinetics, and is not
considered inconsistent with the proposed phase behavior. At all higher humidification
levels, two-step dehydration is clearly observed. At low humidification levels, a strong
difference between the isothermal (TG) and finite heating rate (DSC) results are clearly
evident. The phase boundary points determined from the isothermal measurements fall on
the line extrapolated from the high temperature boundary, supporting the conclusion that
the isothermal data reflect the true equilibrium.
All three phase boundaries determined in this study are linear in the Arrhenius
representation. Linear best fits to these boundaries yield the following expressions:
Reaction (A) T
p1000
)09.029.3(17.066.5log OH2 (5)
Reaction (B) T
p1000
)07.050.4(13.090.7log OH2 (6)
Reaction (C) T
p1000
)11.042.2(19.006.4log OH2
. (7)
Under the assumption of unit thermodynamic activity of the condensed phases and ideal
gas behavior of vapor phase H2O, the expressions above provide a direct measure of the
standard Gibbs free energy of the dehydration reactions of interest, Gdehy. Specifically,
these assumptions imply the following relationships
T
TGp
R
)(ln )A(dehy
OH2
(8)
Tx
TGp
i R
)(ln )B(dehy
OH2
(9)
47
Tx
TGp
f R)1(
)(ln )C(dehy
OH2
(10)
where the stoichiometric coefficient for H2O in reactions B and C is accounted for.
Because the dehydrated liquid, CsH2(1-x)PO4-x, is not a stoichiometric compound, with x
varying over the range of approximately 0.30 to 0.60 for the range of conditions
examined, the assumption here of unit activity in this phase introduces a finite but small
error. The standard Gibbs free energy of dehydration, in turn, can be expressed in terms
of the standard enthalpy, Hdehy, and entropy, Sdehy
, of dehydration according to
STHG dehydehydehy . (11)
Using the best-fit linear values reported in Eqs. (5)–(7), and taking the averaged x values,
03.031.0 ix and 02.040.0 fx , the standard enthalpy and entropy of dehydration for
reactions (A)–(C) were computed. The values are summarized in Table 3.2, along with
relevant prior literature estimates of these parameters. The standard enthalpy of reaction
(B) was further evaluated directly from the intensity of the DSC signal, and is also
provided in the table. The direct-calorimetric and the phase boundary based results are in
good agreement with one another. Data for an additional reaction, the low temperature
dehydration of monoclinic CsH2PO4 to solid CsPO3, referred to as A*, are also included
in the table. Because reaction A* can be considered a two-step process in which CsH2PO4
first transforms to the superprotonic phase then undergoes dehydration, the enthalpy and
entropy values can be computed according to dehy (A*) dehy (A) spH H H and
dehy (A*) dehy (A) spS S S . The calculation was carried out using the enthalpy and entropy
values of the superprotonic transition determined here by calorimetry (spH = 11.7 ± 1.1
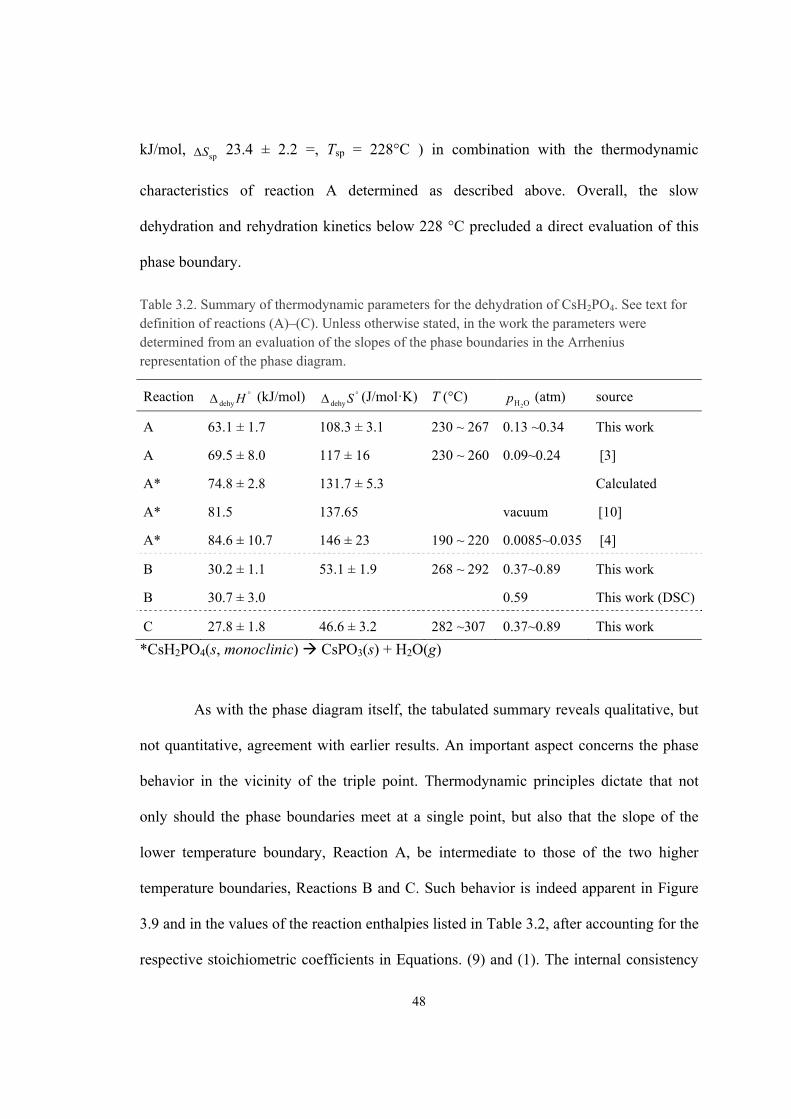
48
kJ/mol, spS 23.4 ± 2.2 =, Tsp = 228°C ) in combination with the thermodynamic
characteristics of reaction A determined as described above. Overall, the slow
dehydration and rehydration kinetics below 228 °C precluded a direct evaluation of this
phase boundary.
Table 3.2. Summary of thermodynamic parameters for the dehydration of CsH2PO4. See text for definition of reactions (A)–(C). Unless otherwise stated, in the work the parameters were determined from an evaluation of the slopes of the phase boundaries in the Arrhenius representation of the phase diagram.
Reaction Hdehy (kJ/mol) Sdehy
(J/mol·K) T (°C) OH2
p (atm) source
A 63.1 ± 1.7 108.3 ± 3.1 230 ~ 267 0.13 ~0.34 This work
A 69.5 ± 8.0 117 ± 16 230 ~ 260 0.09~0.24 [3]
A* 74.8 ± 2.8 131.7 ± 5.3 Calculated
A* 81.5 137.65 vacuum [10]
A* 84.6 ± 10.7 146 ± 23 190 ~ 220 0.0085~0.035 [4]
B 30.2 ± 1.1 53.1 ± 1.9 268 ~ 292 0.37~0.89 This work
B 30.7 ± 3.0 0.59 This work (DSC)
C 27.8 ± 1.8 46.6 ± 3.2 282 ~307 0.37~0.89 This work
*CsH2PO4(s, monoclinic) CsPO3(s) + H2O(g)
As with the phase diagram itself, the tabulated summary reveals qualitative, but
not quantitative, agreement with earlier results. An important aspect concerns the phase
behavior in the vicinity of the triple point. Thermodynamic principles dictate that not
only should the phase boundaries meet at a single point, but also that the slope of the
lower temperature boundary, Reaction A, be intermediate to those of the two higher
temperature boundaries, Reactions B and C. Such behavior is indeed apparent in Figure
3.9 and in the values of the reaction enthalpies listed in Table 3.2, after accounting for the
respective stoichiometric coefficients in Equations. (9) and (1). The internal consistency
49
of the present set of thermodynamic parameters can be further evaluated as follows. For a
liquid phase of fixed stoichiometry Reaction A is the chemical sum of Reactions B and C,
and hence the thermodynamic quantities dehyH and
dehyS must sum in an analogous
sense, i.e., dehy (A) dehy (B) (C)H H H . The enthalpy and entropy sums, 58.0 ± 2.9 kJ/mol
and 99.7± 5.1 J/mol K, respectively, are somewhat lower that the measured values for
reaction A, a difference reasonably attributed to the variable stoichiometry of the liquid
phase. Overall, the relatively small differences between the present set of values and
those reported in the earlier literature are taken to result from differences in experimental
conditions that either prevented access to equilibrium conditions at low temperatures 5 or
led to a convolution of the two-step dehydration behavior at high temperatures 11.
3.3.4. Kinetics of rehydration
As with dehydration of CsH2PO4, the rehydration kinetics of CsPO3 were found to
be highly dependent on the presence or absence of SiO2, as well as general sample
morphology. The isothermal (T = 238 ºC), fixed-humidity ( OH2p = 0.51 atm), weight gain
behavior of three different types of samples are shown in Figure 3.11: (a) a composite of
CsPO3 and SiO2 of the type shown in Figure 3.3(a) obtained by annealing a composite of
CsH2PO4 and SiO2 at T = 400 ºC and OH2p = 0.51 atm; (b) a loose powder of CsPO3 of the
type shown in Figure 3.3(b) obtained by annealing CsH2PO4 at 320 ºC and OH2
p = 0.02
atm; and (c) a dense, semi-transparent compact of CsPO3 obtained by annealing CsH2PO4
at T = 400 ºC and OH2p = 0.76 atm. Consistent with the phase behavior of Figure 3.8, the
samples undergo weight gain that plateaus only when the H2O uptake corresponds to
complete conversion of CsPO3 to CsH2PO4. More significantly, the hydration of the
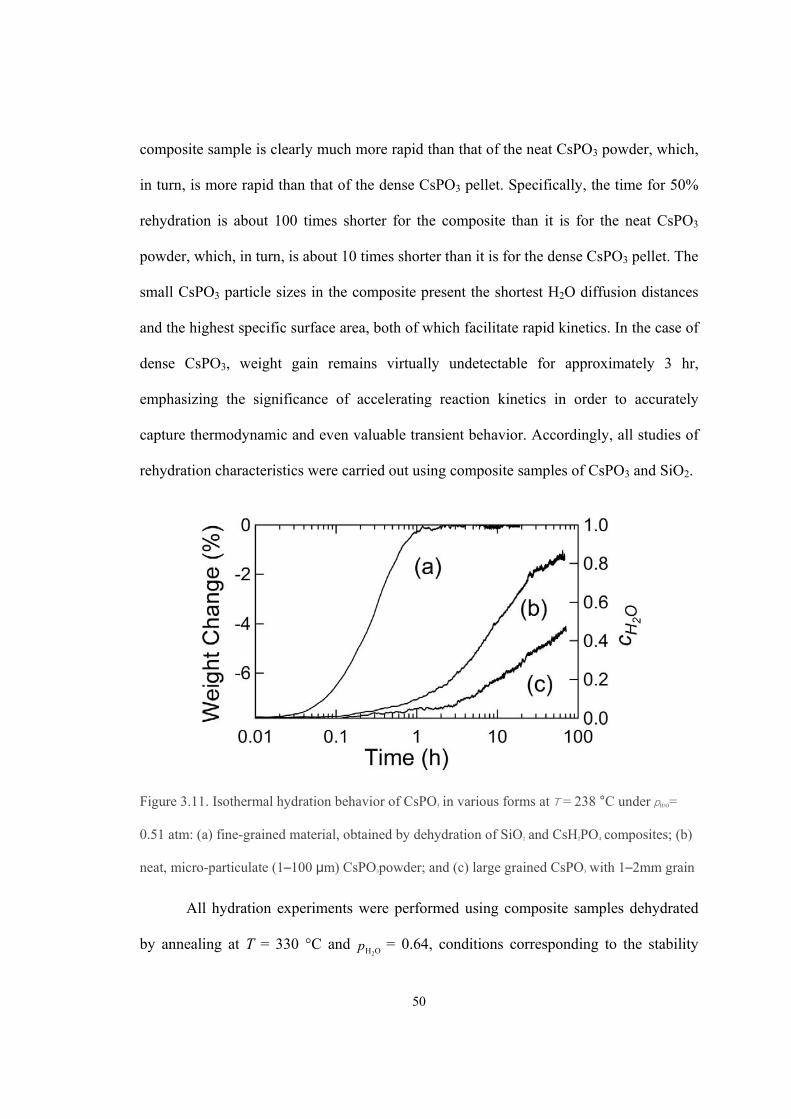
50
composite sample is clearly much more rapid than that of the neat CsPO3 powder, which,
in turn, is more rapid than that of the dense CsPO3 pellet. Specifically, the time for 50%
rehydration is about 100 times shorter for the composite than it is for the neat CsPO3
powder, which, in turn, is about 10 times shorter than it is for the dense CsPO3 pellet. The
small CsPO3 particle sizes in the composite present the shortest H2O diffusion distances
and the highest specific surface area, both of which facilitate rapid kinetics. In the case of
dense CsPO3, weight gain remains virtually undetectable for approximately 3 hr,
emphasizing the significance of accelerating reaction kinetics in order to accurately
capture thermodynamic and even valuable transient behavior. Accordingly, all studies of
rehydration characteristics were carried out using composite samples of CsPO3 and SiO2.
Figure 3.11. Isothermal hydration behavior of CsPO3 in various forms at = 238 °C under H2O= T p
0.51 atm: (a) fine-grained material, obtained by dehydration of SiO2 and CsH2PO4 composites; (b)
neat, micro-particulate (1–100 μm) CsPO3powder; and (c) large grained CsPO3 with 1–2mm grain
All hydration experiments were performed using composite samples dehydrated
by annealing at T = 330 °C and OH2
p = 0.64, conditions corresponding to the stability
51
field of CsPO3. A first series of rehydration measurements were carried out at several
temperatures within the range 205 to 282 ºC. After complete dehydration was achieved,
the system was rapidly cooled to the measurement temperature. The thermal lag of the
system is estimated at 5 min, much shorter than the many hours required to attain full
rehydration. A second series of measurements were carried out a fixed temperature of
243 ºC and several different water partial pressures. In this case, the OH2p was set to the
desired value while the sample was at 330 ºC. From this condition the sample was again
quenched to the measurement temperature and the weight gain monitored as a function of
time. For each series, a single sample was cycled through the relevant conditions.
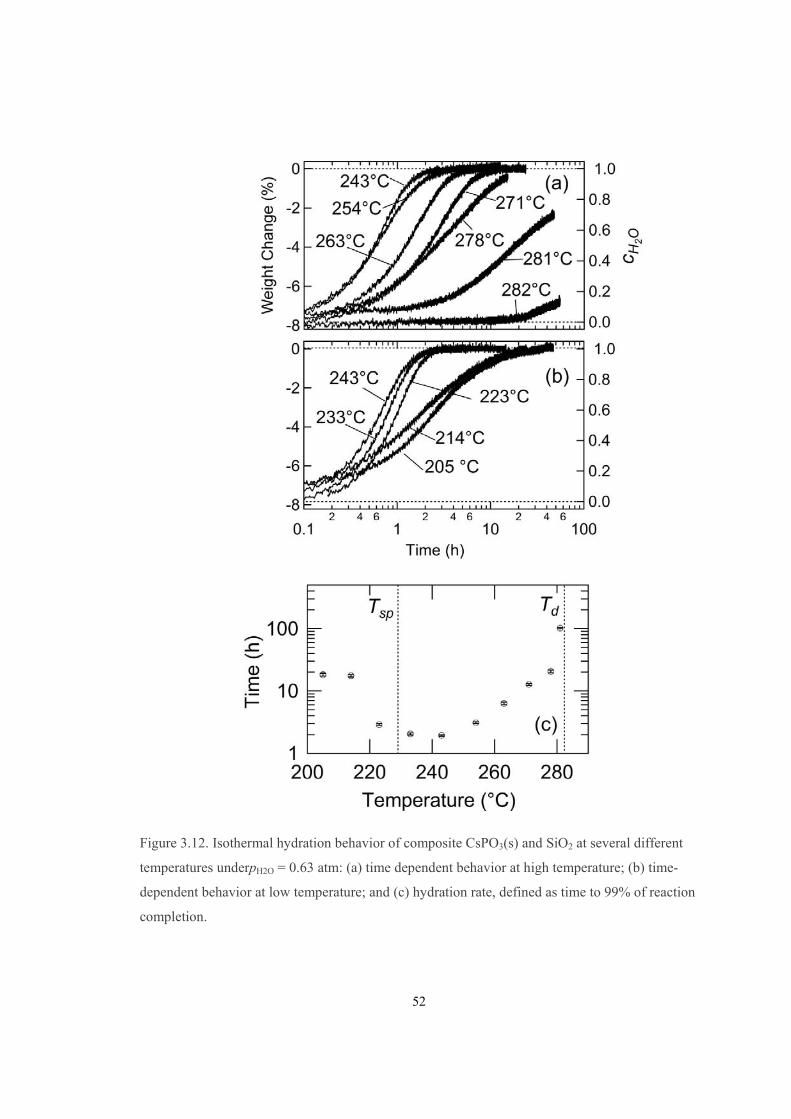
52
Figure 3.12. Isothermal hydration behavior of composite CsPO3(s) and SiO2 at several different
temperatures underpH2O = 0.63 atm: (a) time dependent behavior at high temperature; (b) time-
dependent behavior at low temperature; and (c) hydration rate, defined as time to 99% of reaction
completion.
53
The isothermal rehydration behavior under fixed OH2p = 0.64 atm shows a strong
dependence on temperature, Figure 3.12. The curves are similar in that each displays a
monotonic increase in weight without any plateau, indicative of a single-step
transformation of CsPO3(s) to CsH2PO4(s), despite the fact that the quench from 330 ºC
requires the system to traverse the stability field of (l). The differences are reflected in the
dramatically differing time constants. At the highest temperature, 282 ºC, detectable
weight gain occurs only after 20 hr under the humid conditions. Its eventual occurrence
confirms the location of the phase boundary between CsH2PO4(s) and CsH2(1-x)PO4-x(l).
As the temperature of the isothermal hold is decreased, the rate first increases, plateaus in
the mid-temperature range, and then increases again at the lowest temperatures, although
not becoming as sluggish as the high temperature measurement. The temperature
dependence of the hydration process is captured more directly in Figure 3.12 (b), in
which the time to reach 99% rehydration is shown. Rather remarkable on this plot is the
sharp difference in rehydration kinetics between 223 and 214 ºC: at 223 ºC the time to
99% rehydration is just 3 hr, whereas at 214 ºC it is 19 hr, virtually identical to the
rehydration time at 205 ºC.
The nonmonotonic dependence of the hydration rate constant on temperature can
be interpreted in terms of phase behavior. In the high temperature region, between 233
and 282 ºC, the hydration reaction occurs in the stability field of CsH2PO4 in its
superprotonic phase and thus the reaction can be presumed to directly yield CsH2PO4 (s,
sp). The increase in hydration rate with decreasing temperature (243 ºC and higher) can
be attributed to an increase in the thermodynamic driving force for the reaction, and the
behavior is unremarkable. At temperatures of 223 ºC and lower, the hydration reaction
54
occurs in the stability field of CsH2PO4 in its monoclinic phase. In general, at the lower
temperatures the rate of hydration decreases, but the trend is not gradual. Instead, a sharp
drop in rate is observed between 223 and 214 ºC, strongly suggesting a change in
mechanism, despite the occurrence of the rehydration within the same stability field. We
suggest that the behavior may be explained by the metastable occurrence of superprotonic
CsH2PO4 at 223 ºC. It has been observed elsewhere that, on cooling superprotonic
CsH2PO4, the high temperature phase can be retained in a supercooled state for long
periods below the thermodynamic transition temperature of 228 ºC 12. In the present
experiments, it is plausible that the cubic phase is nucleated during the process of cooling
to the anneal temperature of 223 ºC and further transformation at this temperature leads
to continued growth of the cubic phase. The discontinuity in rehydration rates between
223 and 214 ºC would then be directly attributable to a difference in the crystalline
structure of the hydrated phase. If this interpretation is correct, the implication is that the
diffusion coefficient of neutral water through polycrystalline CsH2PO4 is substantially
higher for the cubic, superprotonic form than the monoclinic, paraelectric form. The
slight decrease in kinetics as temperature is lowered from 243 to 223 ºC may be a result
of a decrease in the diffusion coefficient in cubic CsH2PO4 with decreasing temperature.
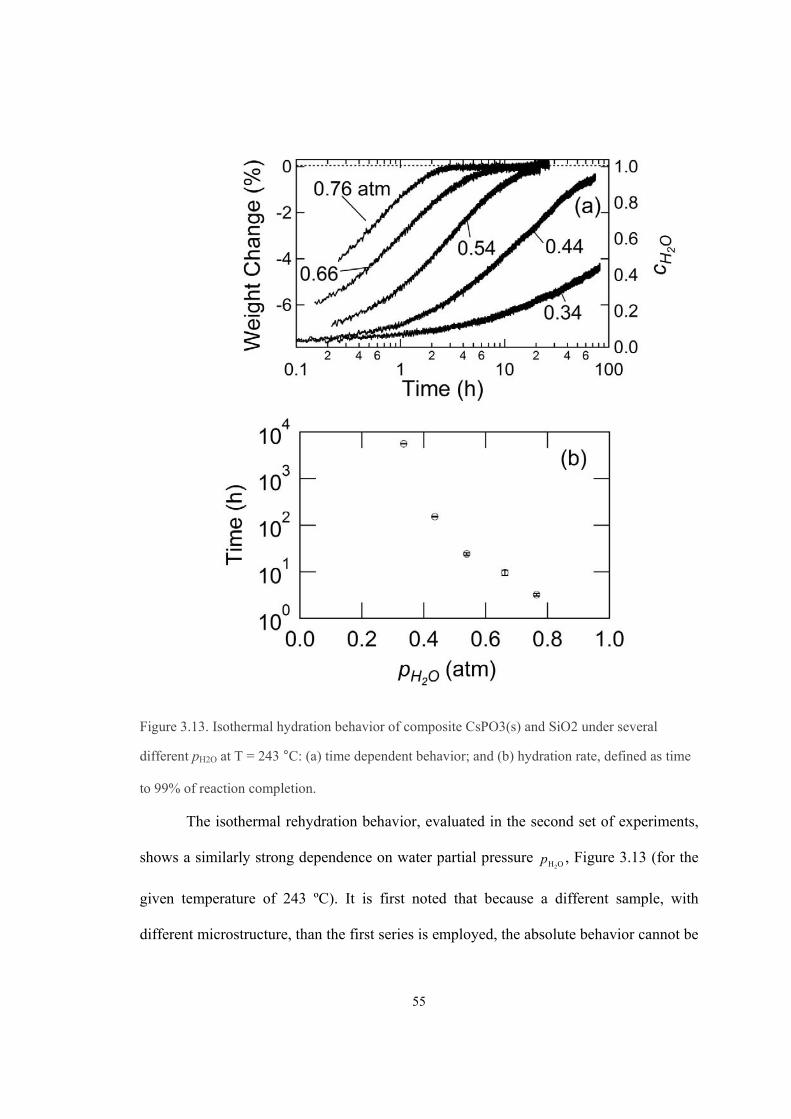
55
Figure 3.13. Isothermal hydration behavior of composite CsPO3(s) and SiO2 under several
different pH2O at T = 243 °C: (a) time dependent behavior; and (b) hydration rate, defined as time
to 99% of reaction completion.
The isothermal rehydration behavior, evaluated in the second set of experiments,
shows a similarly strong dependence on water partial pressure OH2
p , Figure 3.13 (for the
given temperature of 243 ºC). It is first noted that because a different sample, with
different microstructure, than the first series is employed, the absolute behavior cannot be
56
compared between the two series. Furthermore, in this case, initial weight gain under
high humidity occurs before the measurement system is stabilized in the new condition,
and the effective zero-point in time has been estimated by fitting an Avrami expression to
the later time data. As with the first set of experiments, the quench step from 330 ºC
requires the system to traverse the stability field of the liquid phase. Nevertheless, again,
the weight gain is monotonic and no plateaus are evident, indicating a single-step
hydration from CsPO3(s) to CsH2PO4(s, sp). Not surprisingly, the time to 99%
completion of the hydration reaction, Figure 3.13 (b), decreases monotonically with
increasing water partial pressure. By definition, the driving force for the reaction
increases with increasing OH2p . In addition to this factor, enhanced surface kinetics may
also contribute to the enhanced rate at high OH2
p .
4. Conclusions
By making use of silica as an additive, equilibrium phase behavior of CsH2PO4
with respect to dehydration was accessed. The silica, which does not react with CsH2PO4,
leads to a fine microstructure that facilitates equilibration with the atmosphere on
measurable timescales. All aspects of the phase behavior so determined are consistent
with thermodynamic expectations. The phase boundaries in the Arrhenius phase diagram
(Figure 3.9) are, furthermore, linear, and permit evaluation of the enthalpies and entropies
of the associated dehydration reactions (Table 3.2). The phase boundaries meet at the
triple point connecting CsH2PO4(s,sp), CsPO3(s), and CsH2(1-x)PO4-x(l), located at OH2
p =
0.35 ± 0.2 atm and T = 267.5 ± 1.0 ºC, with slopes also consistent with thermodynamic
expectations. The thermodynamic stabilities of the liquid dehydrate, CsH2(1-x)PO4-x(l), and
57
of CsH2PO4 are demonstrated by the fact that, in the relevant stability fields, any
dehydration is reversed and the compounds recovered. On heating under low OH2
p ,
dehydration occurs via a single step reaction, reflecting the direct formation of CsPO3(s)
from CsH2PO4(s,sp), whereas at high OH2p , it occurs via a two-step process involving the
appearance of CsH2(1-x)PO4-x(l) at intermediate temperatures. The much greater heating
rate dependence of the second step suggests a sluggish mechanism involving H2O
diffusion through a continuous liquid layer. Overall, the dehydration temperatures
determined in this work are shifted to lower values than those previously reported, where
the discrepancy can be understood in terms of the extreme challenge in attaining
equilibrium behavior, particularly at lower temperatures. Rehydration and conversion of
CsPO3(s) to CsH2PO4(s) occurs over a period of several hours, depending on temperature,
water partial pressure, and morphology of the metaphosphate. As might be expected, high
OH2p and small particles favor rapid rehydration, whereas the temperature dependence of
rehydration behavior is nonmonotonic, reaching its fastest rate in the vicinity of the
superprotonic transition.
58
Bibliography
1 Ikeda, A. & Haile, S. M. "The thermodynamics and kinetics of the dehydration of
CsH2PO4 studied in the presence of SiO2". Solid State Ionics 213, 63-71, (2012).
2 Boysen, D. A., Uda, T., Chisholm, C. R. I. & Haile, S. M. "High-performance solid acid
fuel cells through humidity stabilization". Science 303, 68-70, (2004).
3 Haile, S. M., Chisholm, C. R. I., Sasaki, K., Boysen, D. A. & Uda, T. "Solid acid proton
conductors: from laboratory curiosities to fuel cell electrolytes". Faraday Discussions
134, 17-39, (2007).
4 Taninouchi, Y.-k., Uda, T., Awakura, Y., Ikeda, A. & Haile, S. M. "Dehydration
behavior of the superprotonic conductor CsH2PO4 at moderate temperatures: 230 to
260 °C". Journal of Materials Chemistry 17, 3182, (2007).
5 Taninouchi, Y.-k., Hatada, N., Uda, T. & Awakura, Y. "Phase Relationship of CsH2PO4-
CsPO3 System and Electrical Properties of CsPO3". Journal of the Electrochemical
Society 156, B572, (2009).
6 Taninouchi, Y.-k., Uda, T. & Awakura, Y. "Dehydration of CsH2PO4 at temperatures
higher than 260 °C and the ionic conductivity of liquid product". Solid State Ionics 178,
1648-1653, (2008).
7 ICDD 45-0617
8 ICDD 37-0027
9 Uesu, Y. & Kobayashi, J. "Crystal structure and ferroelectricity of cesium dihydrogen
phosphate CsH2PO4". Physica Status Solidi (a) 34, 475-481, (1976).
10 Ikeda, A. & Haile, S. M. "Examination of the superprotonic transition and dehydration
behavior of Cs0.75Rb0.25H2PO4 by thermogravimetric and differential thermal analyses".
Solid State Ionics 181, 193-196, (2010).
11 Yaglov, V. N., Rudko, P. K. & Navikov, G. I. "Dehydration of Cesium Dihydrogen
Phosphate". Russian Journal of Physical Chemistry,Ussr 46, 310-&, (1972).

59
12 Louie, M. W., Kislitsyn, M., Bhattacharya, K. & Haile, S. M. "Phase transformation and
hysteresis behavior in Cs1−xRbxH2PO4". Solid State Ionics 181, 173-179, (2010).
60
Chapter 4 Phase behavior of cation doped cubic CsH2PO4
4.1. Introduction
Cubic CsH2PO4 has high conductivity and, as such, is attractive compound as a
fuel cell electrolyte for operation in the temperature range of 230~280 ºC 1. In an earlier
publication we reported the thermodynamic and kinetic of the dehydration for cubic
CsH2PO42. The lower limit of operation temperature of CsH2PO4 fuel cell corresponds to
the phase transition temperature, Ts = 227 ºC, from monoclinic to cubic phase. This
polymorphic phase transition is independent of pH2O. On the other hand, the upper limit of
the operation temperature corresponds to the dehydration temperature, Td, which depends
strongly on pH2O. For example, Td is 290 ºC at pH2O = 0.8 atm and 230 ºC at 0.15 atm. The
relatively narrow stability window for cubic CsH2PO4 presents challenges for fuel cell
operation. While these are not insurmountable, increasing Td and lowering Ts are
technologically desirable. In this work we evaluated the phase behavior in the CDP-RDP
(RbH2PO4) and CDP-KDP(KH2PO4) pseudo-binary systems as a means for manipulating
these temperatures. Beyond near-term implications for fuel cell operation, such a study
has the potential to provide broad insight into the crystal-chemical factors governing
superprotonic behavior.
At ambient conditions, CDP and RDP have distinct monoclinic structures,
precluding the possibility of complete solid solubility. It has been shown, however, that
Rb is highly soluble in monoclinic CDP, up to 80% at ambient temperatures3. The
structure of monoclinic and cubic Cs1-xRbxH2PO4 is reported by Cowan 3, Louie 4,
Martsinkevich 5, and Matsuo 6. They claimed that Rb has large solubility for both phases.
61
Cubic structure of RbH2PO4 and monoclinic structure (P21/m) are also reported by Botez
7 under high pressure. Therefore, the whole range solubility of cubic CDP and cubic
RbH2PO4 is expected. Louie reported that Ts of Cs1-xRbxH2PO4 increases by Rb content.
We reported Td of Cs0.75Rb0.25H2PO4 and it was slightly lower than CDP 8. K, being only
slightly smaller than Rb, is also a good candidate for the substitution on the Cs site. The
structure of monoclinic or cubic Cs1-xKxH2PO4 has not reported. The examination of
cubic CDP under equilibrium condition to avoid dehydration is a challenge. Therefore,
the number of reports for these compounds is not many, except for conductivity
measurements. Some studies were done under the unstable conditions before the
dehydration reaction completes or under extremely high pressure.
In this work, we examined Cs1-xRbxH2PO4 and Cs1-xKxH2PO4 under humid
atmosphere and observed the properties directly in the equilibrium condition by X-ray
diffraction (XRD), differential scanning calorimetry (DSC), and alternating current
impedance (AC impedance) measurements. We determined the solubility, Ts and Td, and
developed phase diagrams of these compounds. The lattice size and conductivity were
determined carefully, then, the effects of doping to these properties were discussed.
4.2. Experimental details
4.2.1. Sample preparation
Polycrystalline powders of CsH2PO4 and RbH2PO4 were synthesized by
combining the starting reagents Cs2CO3 (Alfa Aesar, 99.99%) or Rb2CO3 (Alfa Aesar,
99.99%) and H3PO4 (ACS, 85% w/w aqueous solution) in a molar ratio of 1:2 in aqueous
solution. The solutions were then gently heated, and solid CsH2PO4 and RbH2PO4
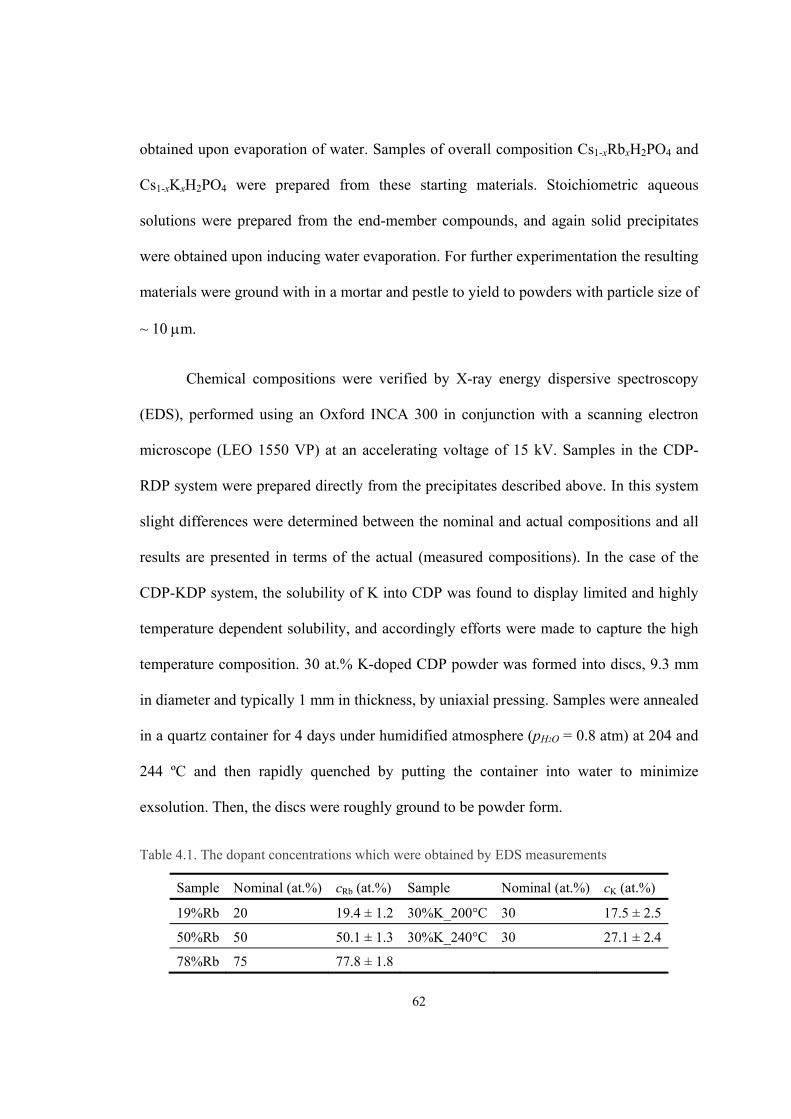
62
obtained upon evaporation of water. Samples of overall composition Cs1-xRbxH2PO4 and
Cs1-xKxH2PO4 were prepared from these starting materials. Stoichiometric aqueous
solutions were prepared from the end-member compounds, and again solid precipitates
were obtained upon inducing water evaporation. For further experimentation the resulting
materials were ground with in a mortar and pestle to yield to powders with particle size of
~ 10 m.
Chemical compositions were verified by X-ray energy dispersive spectroscopy
(EDS), performed using an Oxford INCA 300 in conjunction with a scanning electron
microscope (LEO 1550 VP) at an accelerating voltage of 15 kV. Samples in the CDP-
RDP system were prepared directly from the precipitates described above. In this system
slight differences were determined between the nominal and actual compositions and all
results are presented in terms of the actual (measured compositions). In the case of the
CDP-KDP system, the solubility of K into CDP was found to display limited and highly
temperature dependent solubility, and accordingly efforts were made to capture the high
temperature composition. 30 at.% K-doped CDP powder was formed into discs, 9.3 mm
in diameter and typically 1 mm in thickness, by uniaxial pressing. Samples were annealed
in a quartz container for 4 days under humidified atmosphere (pH2O = 0.8 atm) at 204 and
244 ºC and then rapidly quenched by putting the container into water to minimize
exsolution. Then, the discs were roughly ground to be powder form.
Table 4.1. The dopant concentrations which were obtained by EDS measurements
Sample Nominal (at.%) cRb (at.%) Sample Nominal (at.%) cK (at.%)
19%Rb 20 19.4 ± 1.2 30%K_200°C 30 17.5 ± 2.5
50%Rb 50 50.1 ± 1.3 30%K_240°C 30 27.1 ± 2.4
78%Rb 75 77.8 ± 1.8
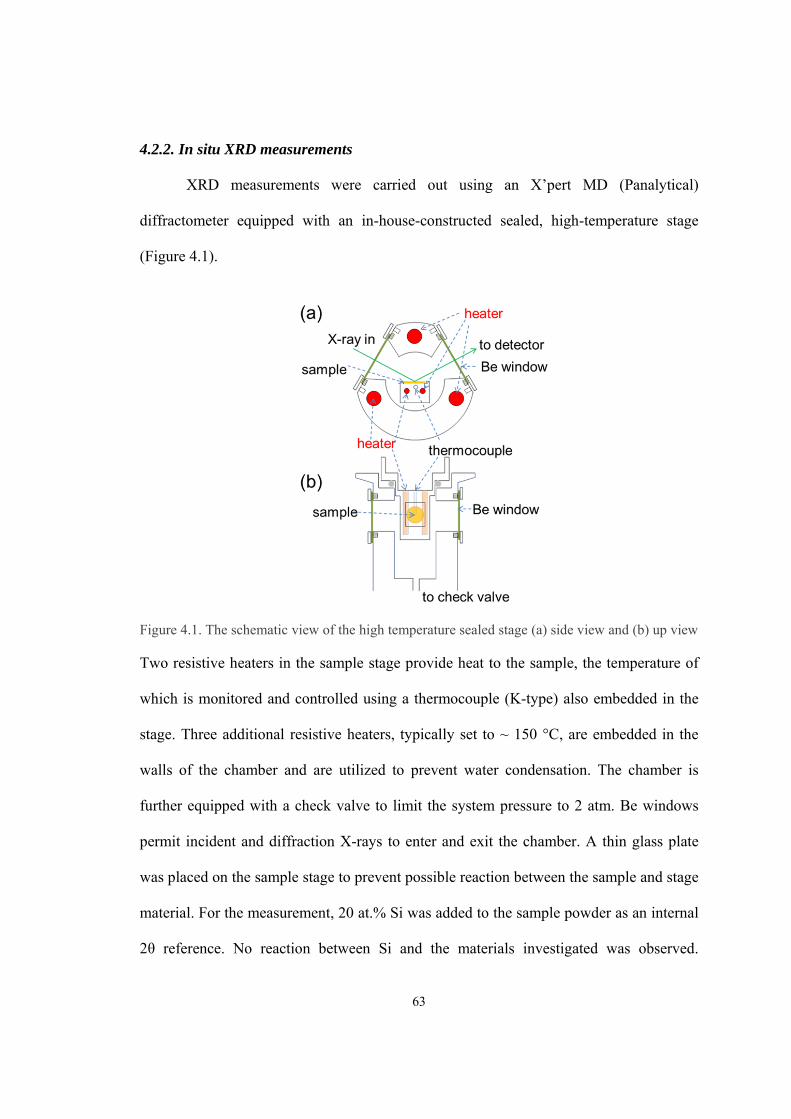
63
4.2.2. In situ XRD measurements
XRD measurements were carried out using an X’pert MD (Panalytical)
diffractometer equipped with an in-house-constructed sealed, high-temperature stage
(Figure 4.1).
Figure 4.1. The schematic view of the high temperature sealed stage (a) side view and (b) up view
Two resistive heaters in the sample stage provide heat to the sample, the temperature of
which is monitored and controlled using a thermocouple (K-type) also embedded in the
stage. Three additional resistive heaters, typically set to ~ 150 °C, are embedded in the
walls of the chamber and are utilized to prevent water condensation. The chamber is
further equipped with a check valve to limit the system pressure to 2 atm. Be windows
permit incident and diffraction X-rays to enter and exit the chamber. A thin glass plate
was placed on the sample stage to prevent possible reaction between the sample and stage
material. For the measurement, 20 at.% Si was added to the sample powder as an internal
2θ reference. No reaction between Si and the materials investigated was observed.
64
Measurements were typically carried out in the temperature range 150 to 300 °C in 10 °C
increments. At each temperature step, measurements were started after waiting more than
30 minutes for equilibration of the sample.
Exemplary diffraction data obtained from this system are presented in Figure 4.2
for the parent compound CDP. Consistent with the widely confirmed phase
transformation behavior, the data show CDP to remain entirely in the monoclinic phase to
220 °C. A two-phase mixture of the monoclinic and cubic phases is obtained at 230 °C,
and from 240 to 290 °C only diffraction peaks from the cubic phase are evident. The
material becomes entirely amorphous at 300 °C, corresponding to the liquid phase. Based
on the retention of the cubic phase to such high temperature 1, we estimate that a water
partial pressure of ~ 1 atm is attained in the sealed chamber. For all measurements,
crystallographic parameters were determined by Rietveld refinement using RIETAN-FP
software 9. The known thermal expansion behavior of Si 10 provided an internal 2 θ
standard to ensure accurate lattice parameter refinement. To facilitate refinement of
atomic positions, the P-O distance was fixed (at 1.52 Å 3) irrespective of temperature.
The refined parameters for CsH2PO4 (Pm3m) structures are shown in Table 4.2. Where
occupancy of Cs1, P1 is 1 and that of O1 is 0.1667, T is the temperature of the sample; a
is the lattice constant; x, y, z is the atomic coordinate of the atoms; B is the isotopic
atomic displacement; S is the goodness of the fit ; and Rp is the R-factor.
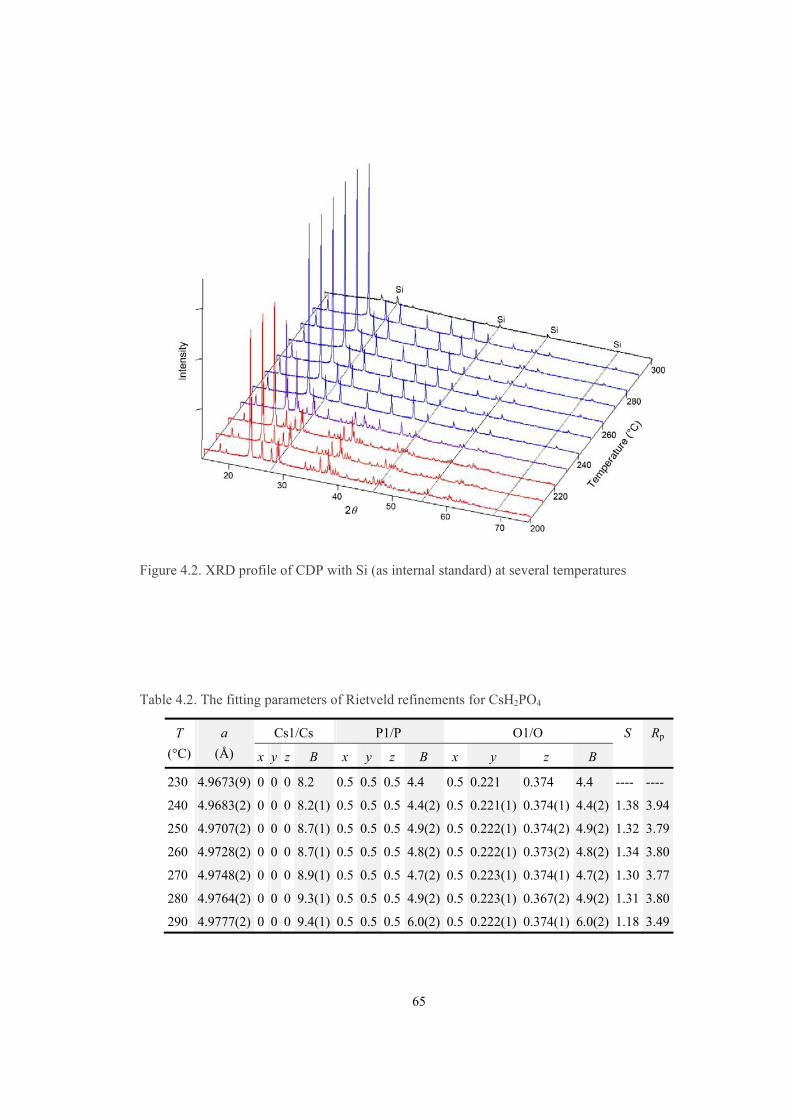
65
Figure 4.2. XRD profile of CDP with Si (as internal standard) at several temperatures
Table 4.2. The fitting parameters of Rietveld refinements for CsH2PO4
T
(°C)
a
(Å)
Cs1/Cs P1/P O1/O S Rp
x y z B x y z B x y z B
230 4.9673(9) 0 0 0 8.2 0.5 0.5 0.5 4.4 0.5 0.221 0.374 4.4 ---- ----
240 4.9683(2) 0 0 0 8.2(1) 0.5 0.5 0.5 4.4(2) 0.5 0.221(1) 0.374(1) 4.4(2) 1.38 3.94
250 4.9707(2) 0 0 0 8.7(1) 0.5 0.5 0.5 4.9(2) 0.5 0.222(1) 0.374(2) 4.9(2) 1.32 3.79
260 4.9728(2) 0 0 0 8.7(1) 0.5 0.5 0.5 4.8(2) 0.5 0.222(1) 0.373(2) 4.8(2) 1.34 3.80
270 4.9748(2) 0 0 0 8.9(1) 0.5 0.5 0.5 4.7(2) 0.5 0.223(1) 0.374(1) 4.7(2) 1.30 3.77
280 4.9764(2) 0 0 0 9.3(1) 0.5 0.5 0.5 4.9(2) 0.5 0.223(1) 0.367(2) 4.9(2) 1.31 3.80
290 4.9777(2) 0 0 0 9.4(1) 0.5 0.5 0.5 6.0(2) 0.5 0.222(1) 0.374(1) 6.0(2) 1.18 3.49
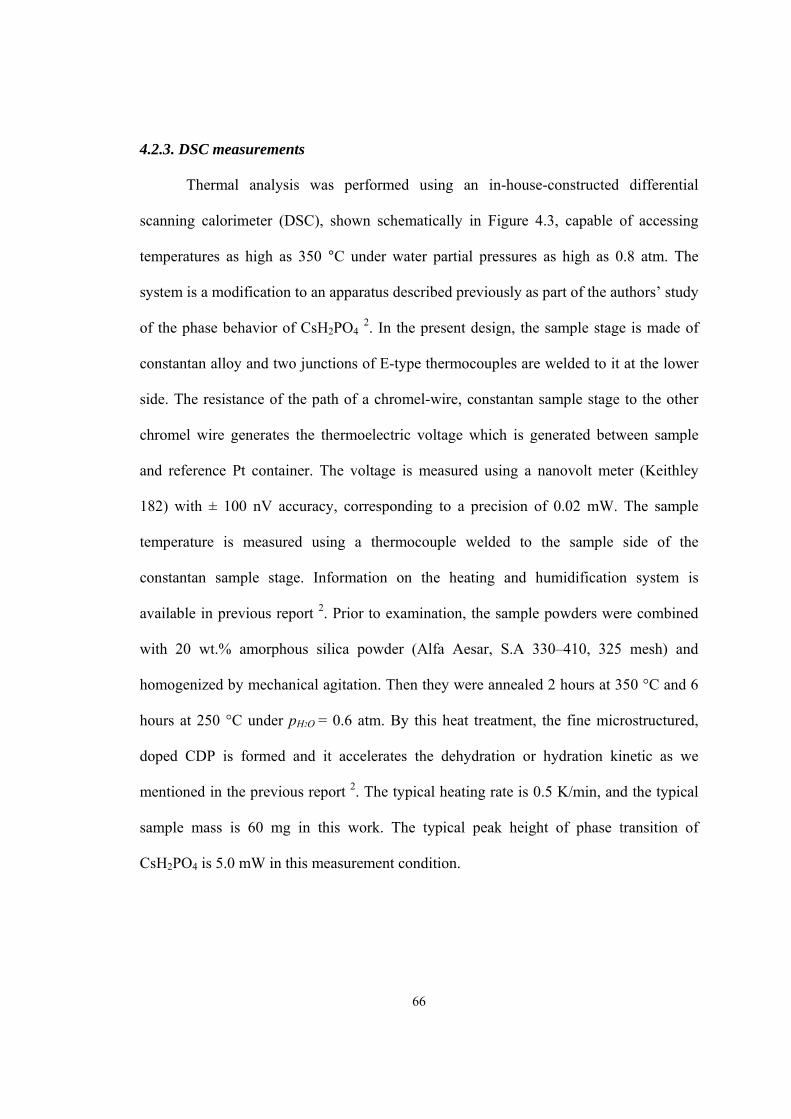
66
4.2.3. DSC measurements
Thermal analysis was performed using an in-house-constructed differential
scanning calorimeter (DSC), shown schematically in Figure 4.3, capable of accessing
temperatures as high as 350 °C under water partial pressures as high as 0.8 atm. The
system is a modification to an apparatus described previously as part of the authors’ study
of the phase behavior of CsH2PO4 2. In the present design, the sample stage is made of
constantan alloy and two junctions of E-type thermocouples are welded to it at the lower
side. The resistance of the path of a chromel-wire, constantan sample stage to the other
chromel wire generates the thermoelectric voltage which is generated between sample
and reference Pt container. The voltage is measured using a nanovolt meter (Keithley
182) with ± 100 nV accuracy, corresponding to a precision of 0.02 mW. The sample
temperature is measured using a thermocouple welded to the sample side of the
constantan sample stage. Information on the heating and humidification system is
available in previous report 2. Prior to examination, the sample powders were combined
with 20 wt.% amorphous silica powder (Alfa Aesar, S.A 330–410, 325 mesh) and
homogenized by mechanical agitation. Then they were annealed 2 hours at 350 °C and 6
hours at 250 °C under pH2O = 0.6 atm. By this heat treatment, the fine microstructured,
doped CDP is formed and it accelerates the dehydration or hydration kinetic as we
mentioned in the previous report 2. The typical heating rate is 0.5 K/min, and the typical
sample mass is 60 mg in this work. The typical peak height of phase transition of
CsH2PO4 is 5.0 mW in this measurement condition.
67
Figure 4.3. The schematic view of the measurement cell of DSC
4.2.4. AC impedance measurements
Conductivity of the samples was determined by A.C. impedance spectroscopy
(HP 4284A). Samples were formed into discs, 9.3 mm in diameter and typically 2 mm in
thickness, by uniaxial pressing ~491 MPa for 10 min to achieve a density of 99%.
Sputtered films of Pt or Ag, approximately 100 nm in thickness, served as electrodes.
Samples were placed in a horizontal tube furnace and held in place using Pt wire current
collectors. Measurements were carried out in the temperature range 180 to 280 °C under
humidified N2, pH2O = 0.9 atm, achieved by passing the inlet gas first through a water
bubbler held at 98 °C. Step changes in temperature of 5 to 10 °C were applied and the
system allowed to equilibrate for at least 30 minutes or until the impedance response had
stabilized before recording the final data. The temperature was measured using an
alumina sheathed E-type thermocouple placed in direct contact with the sample.
4.3. Results and discussion
4.3.1 Overall phase characteristics
Integration of the results of the comprehensive structural, thermal and transport
measurements of the materials, yielded the phase diagrams presented in Figure 4, part (a)
showing the CsH2PO4-RbH2PO4 system and (b) the CsH2PO4-KH2PO4 system. Circles
designate phase transition temperatures, squares dehydration temperatures, and triangles
68
phase boundaries, where data in blue were acquired by DSC measurements, those in
black by in situ XRD measurements, and those in red by EDS chemical analysis. The
CDP-RDP system has simple isomorphous phase behavior. The end-members are entirely
miscible at temperatures above 150 °C in both the monoclinic and cubic phases. The
superprotonic transition temperature monotonically increases and the dehydration
temperature largely decreases with increasing Rb content, resulting in a narrowing of the
superprotonic region. At ambient temperature (not shown) the solubility limit of Rb into
CDP is ~ 80 at. % 3, and the transformation of RDP into the CDP-like monoclinic phase
at 117 °C 11 facilitates complete solid solubility above this first transition.
In sharp contrast to the CsH2PO4-RbH2PO4 system, the CsH2PO4-KH2PO4 system
displays eutectic behavior. On introduction of K into CDP, the superprotonic transition
temperature shifts downward until the eutectic temperature of ~208 °C (20 °C lower than
the superprotonic temperature of neat CDP) is reached. The maximum solubility of K
into monoclinic CDP is ~ 20 at %, and that into cubic CDP is 27 at.%. The high
temperature solubility limit is surprisingly temperature insensitive. Beyond 27 at% the
cubic CDP-rich phase co-exists a KPD-rich phase, where the latter either adopts the
crystalline monoclinic structure of KDP 12, or at higher temperature, becomes a liquid.
Overall, dehydration temperature in this system decreases sharply on introduction of K,
particularly so within the single-phase superprotonic region. Accordingly, there is an
overall shift of the stable cubic region to lower temperature with increasing K content,
along with a slight narrowing of its stability window.
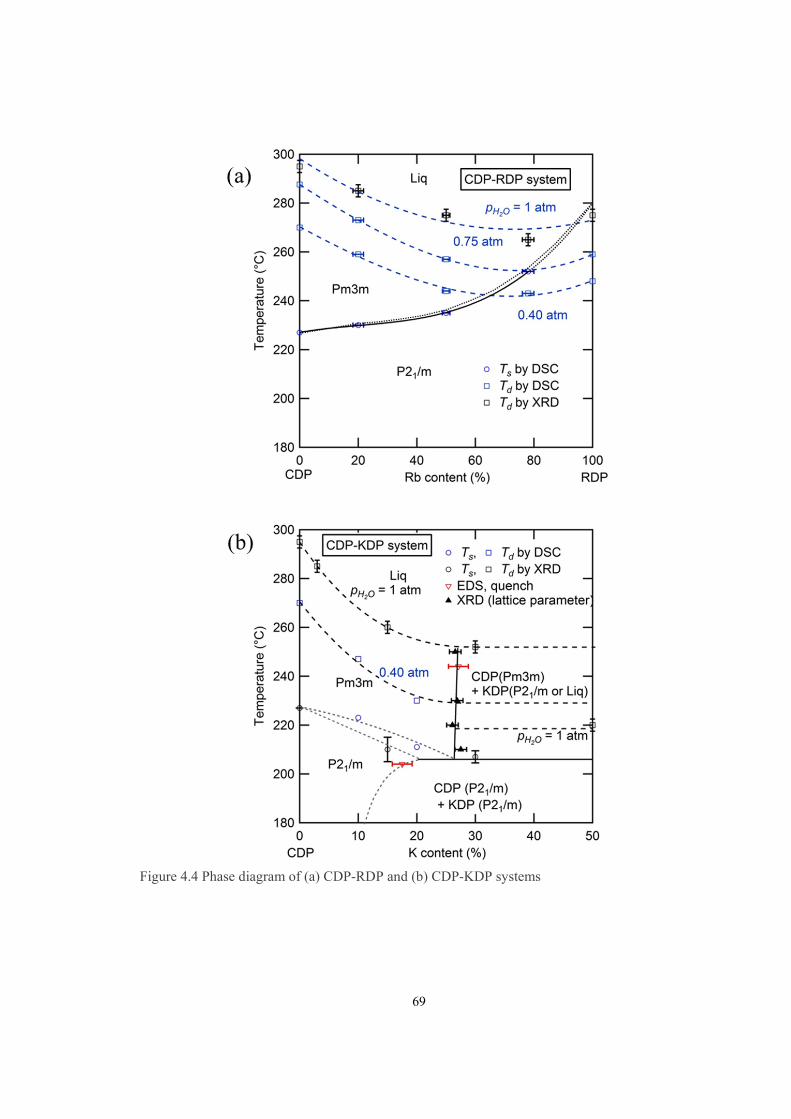
69
Figure 4.4 Phase diagram of (a) CDP-RDP and (b) CDP-KDP systems
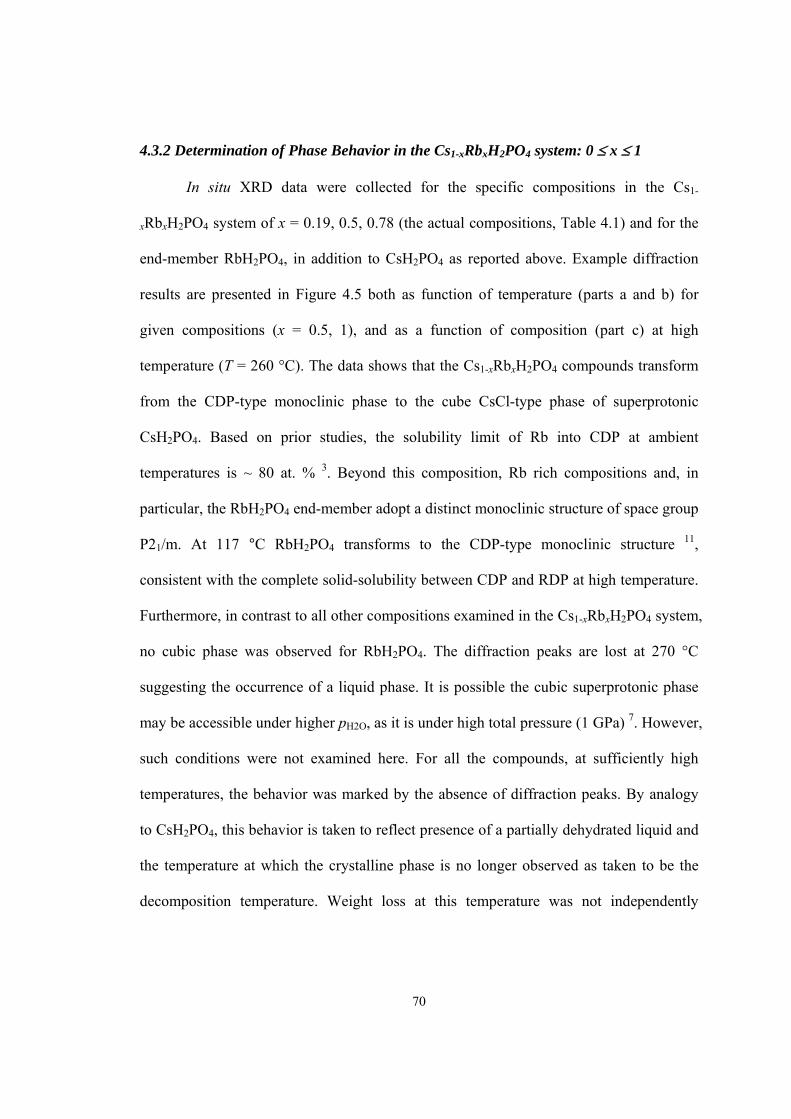
70
4.3.2 Determination of Phase Behavior in the Cs1-xRbxH2PO4 system: 0 x 1
In situ XRD data were collected for the specific compositions in the Cs1-
xRbxH2PO4 system of x = 0.19, 0.5, 0.78 (the actual compositions, Table 4.1) and for the
end-member RbH2PO4, in addition to CsH2PO4 as reported above. Example diffraction
results are presented in Figure 4.5 both as function of temperature (parts a and b) for
given compositions (x = 0.5, 1), and as a function of composition (part c) at high
temperature (T = 260 °C). The data shows that the Cs1-xRbxH2PO4 compounds transform
from the CDP-type monoclinic phase to the cube CsCl-type phase of superprotonic
CsH2PO4. Based on prior studies, the solubility limit of Rb into CDP at ambient
temperatures is ~ 80 at. % 3. Beyond this composition, Rb rich compositions and, in
particular, the RbH2PO4 end-member adopt a distinct monoclinic structure of space group
P21/m. At 117 °C RbH2PO4 transforms to the CDP-type monoclinic structure 11,
consistent with the complete solid-solubility between CDP and RDP at high temperature.
Furthermore, in contrast to all other compositions examined in the Cs1-xRbxH2PO4 system,
no cubic phase was observed for RbH2PO4. The diffraction peaks are lost at 270 °C
suggesting the occurrence of a liquid phase. It is possible the cubic superprotonic phase
may be accessible under higher pH2O, as it is under high total pressure (1 GPa) 7. However,
such conditions were not examined here. For all the compounds, at sufficiently high
temperatures, the behavior was marked by the absence of diffraction peaks. By analogy
to CsH2PO4, this behavior is taken to reflect presence of a partially dehydrated liquid and
the temperature at which the crystalline phase is no longer observed as taken to be the
decomposition temperature. Weight loss at this temperature was not independently
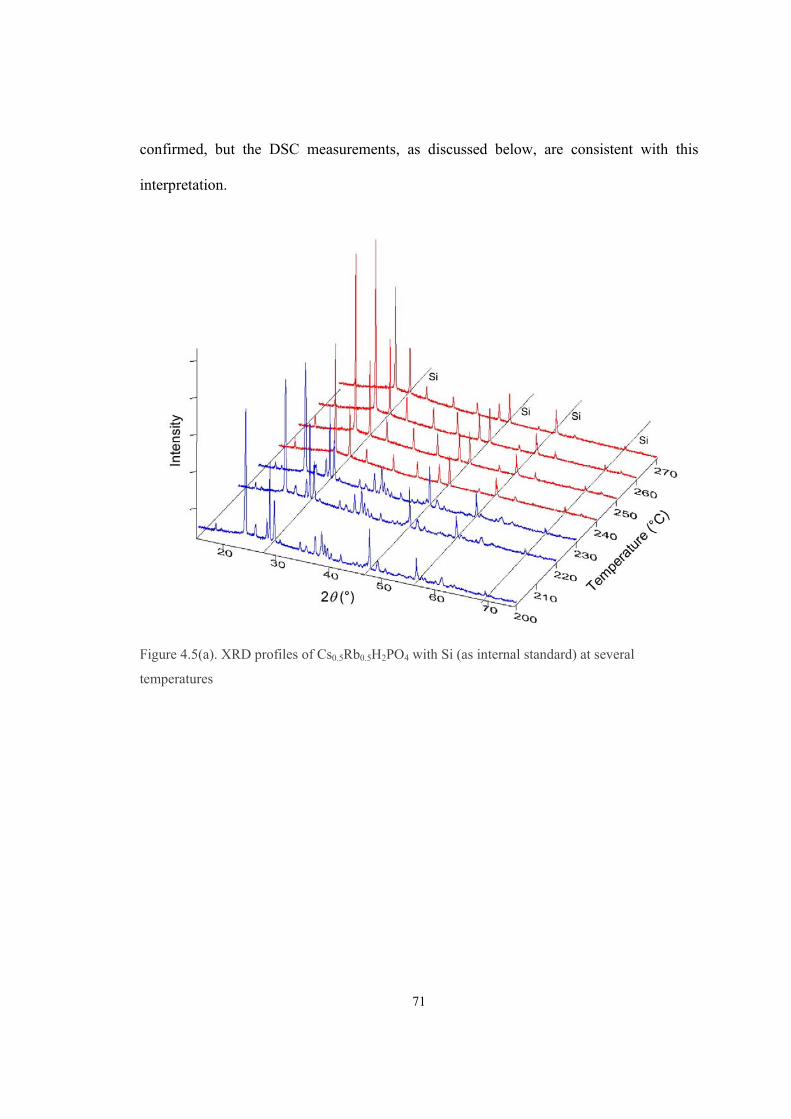
71
confirmed, but the DSC measurements, as discussed below, are consistent with this
interpretation.
Figure 4.5(a). XRD profiles of Cs0.5Rb0.5H2PO4 with Si (as internal standard) at several
temperatures
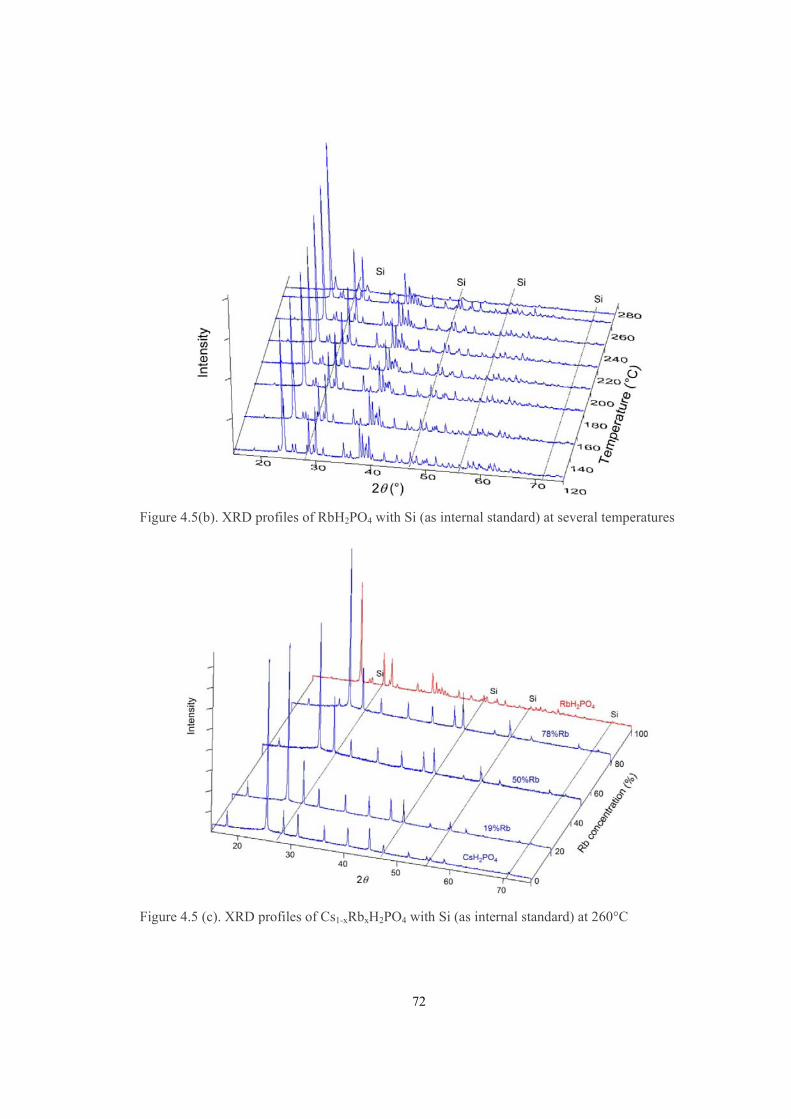
72
Figure 4.5(b). XRD profiles of RbH2PO4 with Si (as internal standard) at several temperatures
Figure 4.5 (c). XRD profiles of Cs1-xRbxH2PO4 with Si (as internal standard) at 260°C
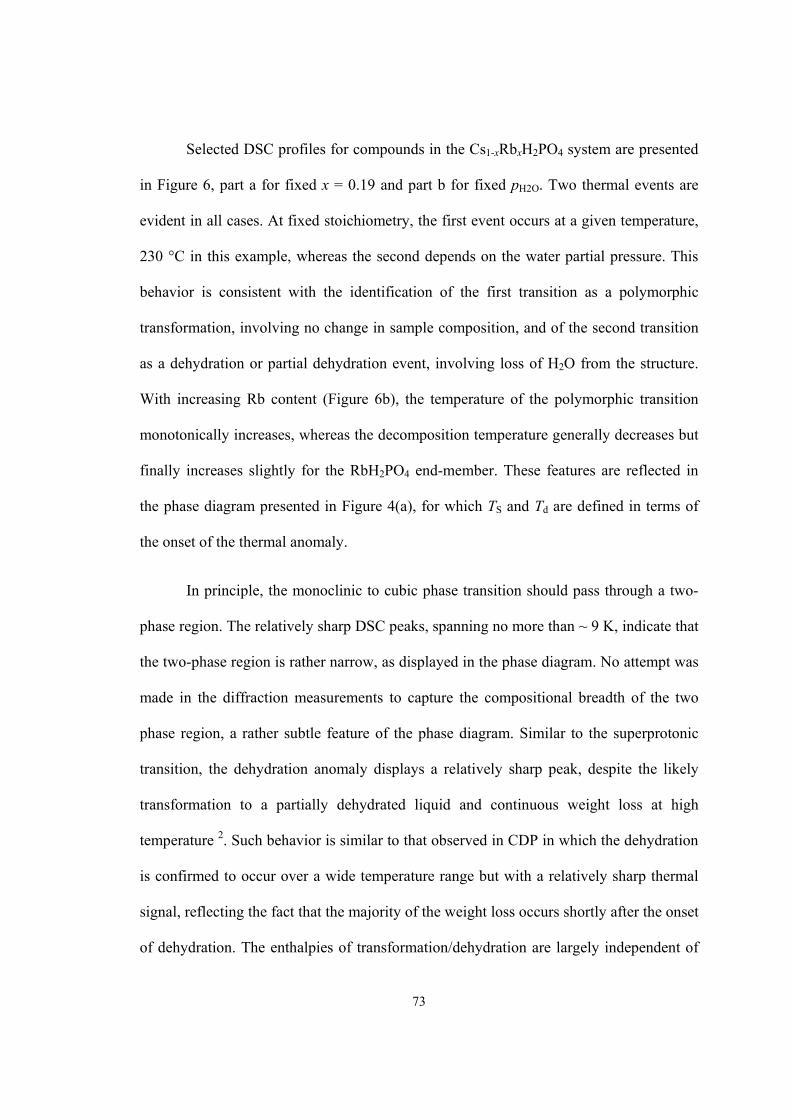
73
Selected DSC profiles for compounds in the Cs1-xRbxH2PO4 system are presented
in Figure 6, part a for fixed x = 0.19 and part b for fixed pH2O. Two thermal events are
evident in all cases. At fixed stoichiometry, the first event occurs at a given temperature,
230 °C in this example, whereas the second depends on the water partial pressure. This
behavior is consistent with the identification of the first transition as a polymorphic
transformation, involving no change in sample composition, and of the second transition
as a dehydration or partial dehydration event, involving loss of H2O from the structure.
With increasing Rb content (Figure 6b), the temperature of the polymorphic transition
monotonically increases, whereas the decomposition temperature generally decreases but
finally increases slightly for the RbH2PO4 end-member. These features are reflected in
the phase diagram presented in Figure 4(a), for which TS and Td are defined in terms of
the onset of the thermal anomaly.
In principle, the monoclinic to cubic phase transition should pass through a two-
phase region. The relatively sharp DSC peaks, spanning no more than ~ 9 K, indicate that
the two-phase region is rather narrow, as displayed in the phase diagram. No attempt was
made in the diffraction measurements to capture the compositional breadth of the two
phase region, a rather subtle feature of the phase diagram. Similar to the superprotonic
transition, the dehydration anomaly displays a relatively sharp peak, despite the likely
transformation to a partially dehydrated liquid and continuous weight loss at high
temperature 2. Such behavior is similar to that observed in CDP in which the dehydration
is confirmed to occur over a wide temperature range but with a relatively sharp thermal
signal, reflecting the fact that the majority of the weight loss occurs shortly after the onset
of dehydration. The enthalpies of transformation/dehydration are largely independent of
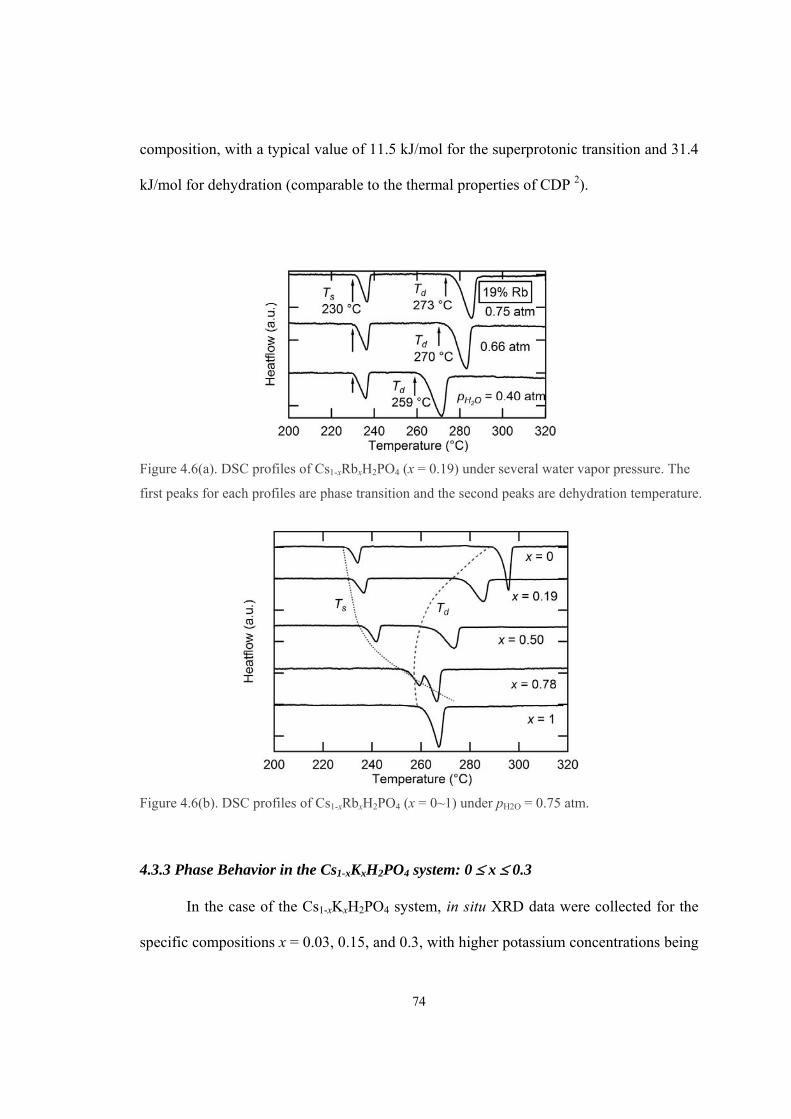
74
composition, with a typical value of 11.5 kJ/mol for the superprotonic transition and 31.4
kJ/mol for dehydration (comparable to the thermal properties of CDP 2).
Figure 4.6(a). DSC profiles of Cs1-xRbxH2PO4 (x = 0.19) under several water vapor pressure. The
first peaks for each profiles are phase transition and the second peaks are dehydration temperature.
Figure 4.6(b). DSC profiles of Cs1-xRbxH2PO4 (x = 0~1) under pH2O = 0.75 atm.
4.3.3 Phase Behavior in the Cs1-xKxH2PO4 system: 0 x 0.3
In the case of the Cs1-xKxH2PO4 system, in situ XRD data were collected for the
specific compositions x = 0.03, 0.15, and 0.3, with higher potassium concentrations being
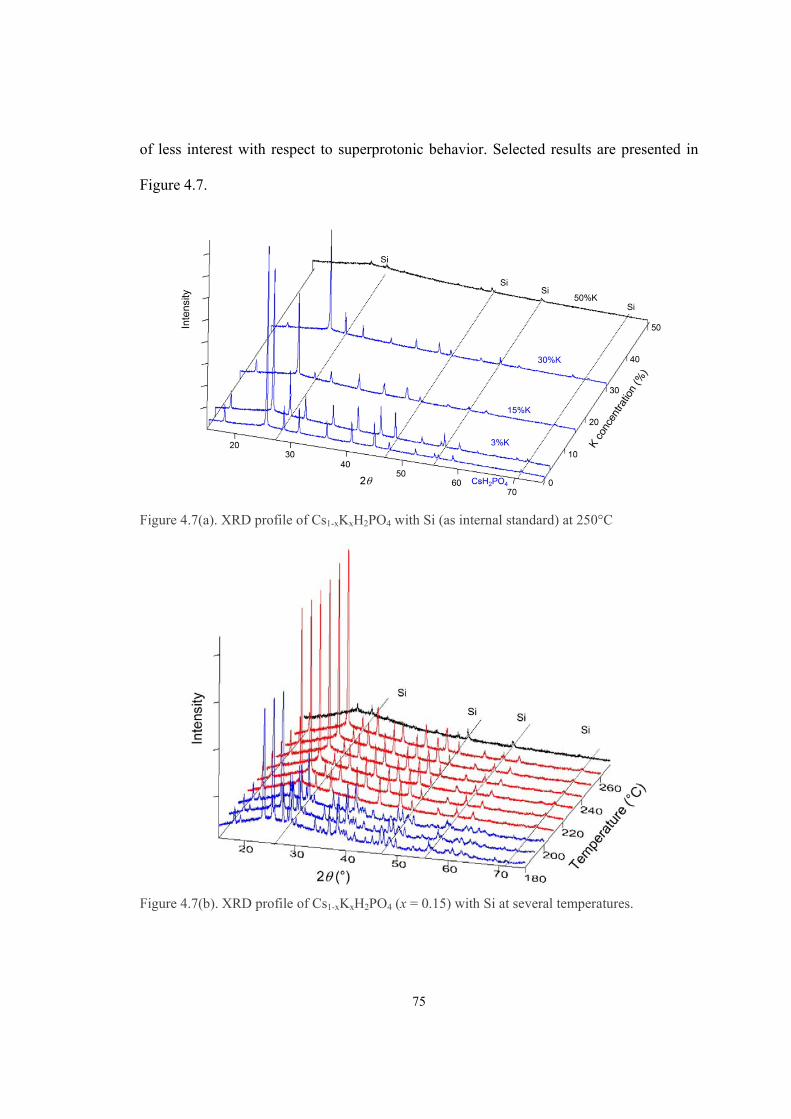
75
of less interest with respect to superprotonic behavior. Selected results are presented in
Figure 4.7.
Figure 4.7(a). XRD profile of Cs1-xKxH2PO4 with Si (as internal standard) at 250°C
Figure 4.7(b). XRD profile of Cs1-xKxH2PO4 (x = 0.15) with Si at several temperatures.
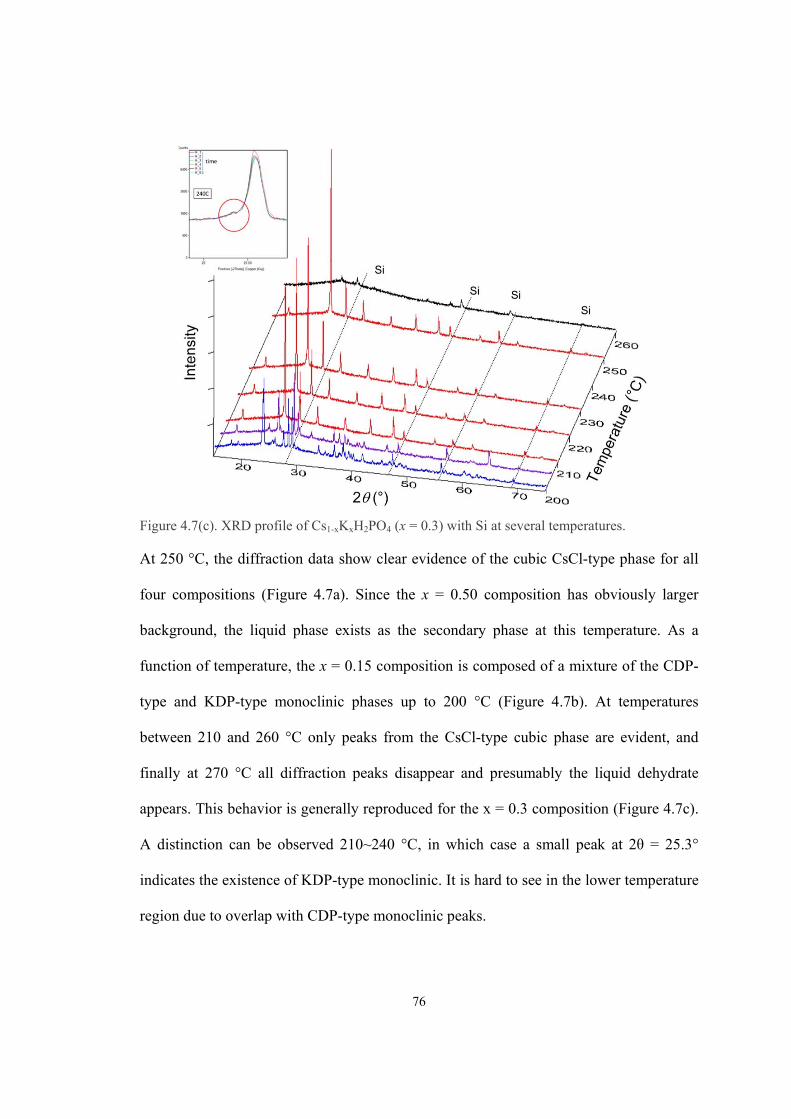
76
Figure 4.7(c). XRD profile of Cs1-xKxH2PO4 (x = 0.3) with Si at several temperatures.
At 250 °C, the diffraction data show clear evidence of the cubic CsCl-type phase for all
four compositions (Figure 4.7a). Since the x = 0.50 composition has obviously larger
background, the liquid phase exists as the secondary phase at this temperature. As a
function of temperature, the x = 0.15 composition is composed of a mixture of the CDP-
type and KDP-type monoclinic phases up to 200 °C (Figure 4.7b). At temperatures
between 210 and 260 °C only peaks from the CsCl-type cubic phase are evident, and
finally at 270 °C all diffraction peaks disappear and presumably the liquid dehydrate
appears. This behavior is generally reproduced for the x = 0.3 composition (Figure 4.7c).
A distinction can be observed 210~240 °C, in which case a small peak at 2θ = 25.3°
indicates the existence of KDP-type monoclinic. It is hard to see in the lower temperature
region due to overlap with CDP-type monoclinic peaks.
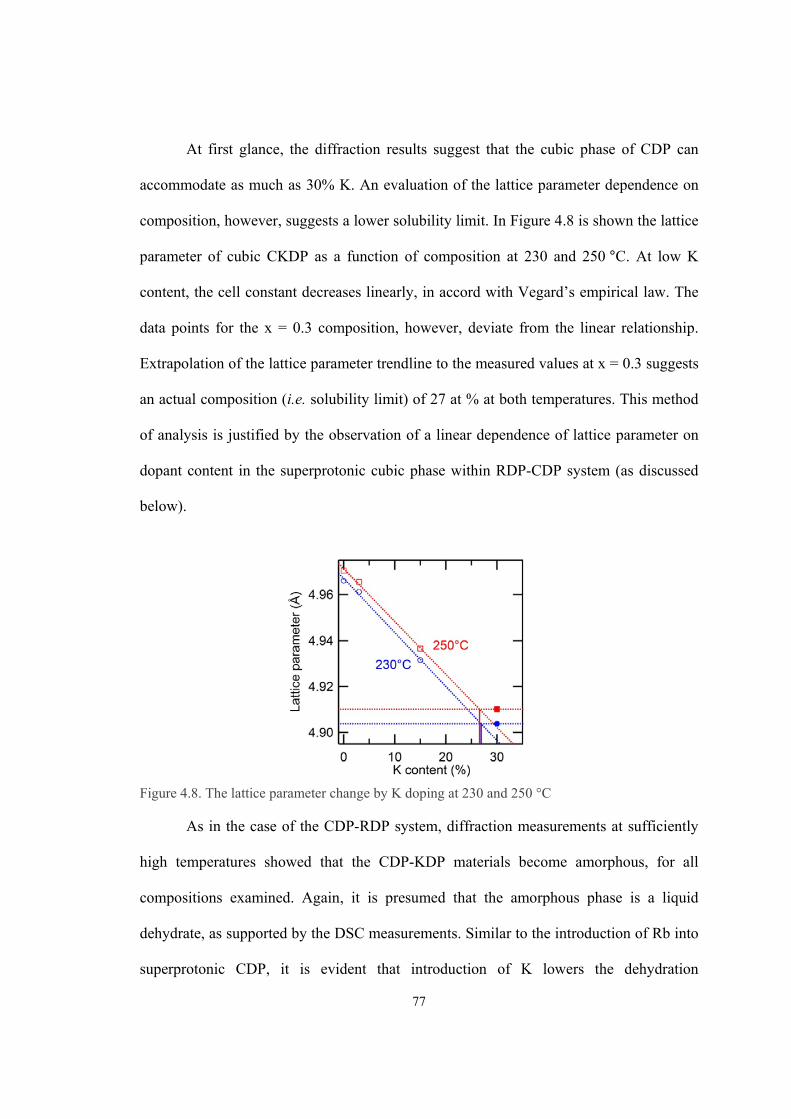
77
At first glance, the diffraction results suggest that the cubic phase of CDP can
accommodate as much as 30% K. An evaluation of the lattice parameter dependence on
composition, however, suggests a lower solubility limit. In Figure 4.8 is shown the lattice
parameter of cubic CKDP as a function of composition at 230 and 250 °C. At low K
content, the cell constant decreases linearly, in accord with Vegard’s empirical law. The
data points for the x = 0.3 composition, however, deviate from the linear relationship.
Extrapolation of the lattice parameter trendline to the measured values at x = 0.3 suggests
an actual composition (i.e. solubility limit) of 27 at % at both temperatures. This method
of analysis is justified by the observation of a linear dependence of lattice parameter on
dopant content in the superprotonic cubic phase within RDP-CDP system (as discussed
below).
Figure 4.8. The lattice parameter change by K doping at 230 and 250 °C
As in the case of the CDP-RDP system, diffraction measurements at sufficiently
high temperatures showed that the CDP-KDP materials become amorphous, for all
compositions examined. Again, it is presumed that the amorphous phase is a liquid
dehydrate, as supported by the DSC measurements. Similar to the introduction of Rb into
superprotonic CDP, it is evident that introduction of K lowers the dehydration
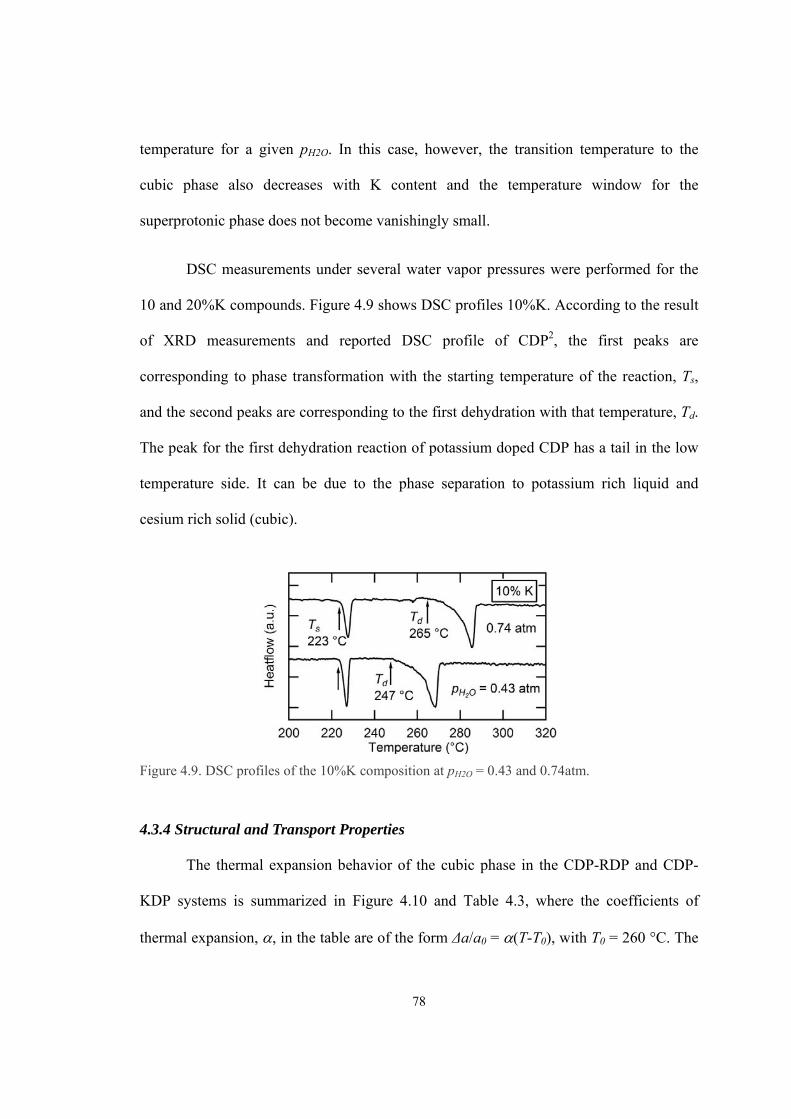
78
temperature for a given pH2O. In this case, however, the transition temperature to the
cubic phase also decreases with K content and the temperature window for the
superprotonic phase does not become vanishingly small.
DSC measurements under several water vapor pressures were performed for the
10 and 20%K compounds. Figure 4.9 shows DSC profiles 10%K. According to the result
of XRD measurements and reported DSC profile of CDP2, the first peaks are
corresponding to phase transformation with the starting temperature of the reaction, Ts,
and the second peaks are corresponding to the first dehydration with that temperature, Td.
The peak for the first dehydration reaction of potassium doped CDP has a tail in the low
temperature side. It can be due to the phase separation to potassium rich liquid and
cesium rich solid (cubic).
Figure 4.9. DSC profiles of the 10%K composition at pH2O = 0.43 and 0.74atm.
4.3.4 Structural and Transport Properties
The thermal expansion behavior of the cubic phase in the CDP-RDP and CDP-
KDP systems is summarized in Figure 4.10 and Table 4.3, where the coefficients of
thermal expansion, , in the table are of the form Δa/a0 = (T-T0), with T0 = 260 °C. The
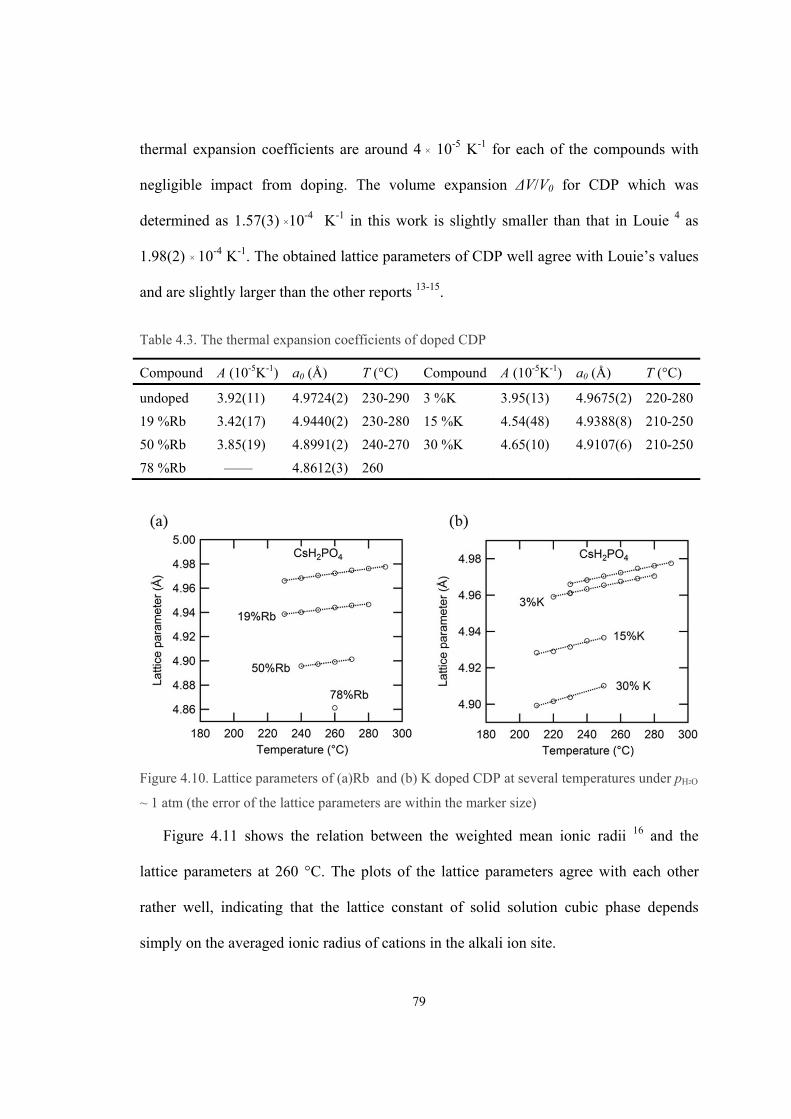
79
thermal expansion coefficients are around 4 × 10⁻⁵ K-1 for each of the compounds with
negligible impact from doping. The volume expansion ΔV/V0 for CDP which was
determined as 1.57(3) ×10-4 K-1 in this work is slightly smaller than that in Louie 4 as
1.98(2) × 10-4 K-1. The obtained lattice parameters of CDP well agree with Louie’s values
and are slightly larger than the other reports 13-15.
Table 4.3. The thermal expansion coefficients of doped CDP
Compound A (10-5K-1) a0 (Å) T (°C) Compound A (10-5K-1) a0 (Å) T (°C)
undoped 3.92(11) 4.9724(2) 230-290 3 %K 3.95(13) 4.9675(2) 220-280
19 %Rb 3.42(17) 4.9440(2) 230-280 15 %K 4.54(48) 4.9388(8) 210-250
50 %Rb 3.85(19) 4.8991(2) 240-270 30 %K 4.65(10) 4.9107(6) 210-250
78 %Rb —— 4.8612(3) 260
Figure 4.10. Lattice parameters of (a)Rb and (b) K doped CDP at several temperatures under pH2O
~ 1 atm (the error of the lattice parameters are within the marker size)
Figure 4.11 shows the relation between the weighted mean ionic radii 16 and the
lattice parameters at 260 °C. The plots of the lattice parameters agree with each other
rather well, indicating that the lattice constant of solid solution cubic phase depends
simply on the averaged ionic radius of cations in the alkali ion site.
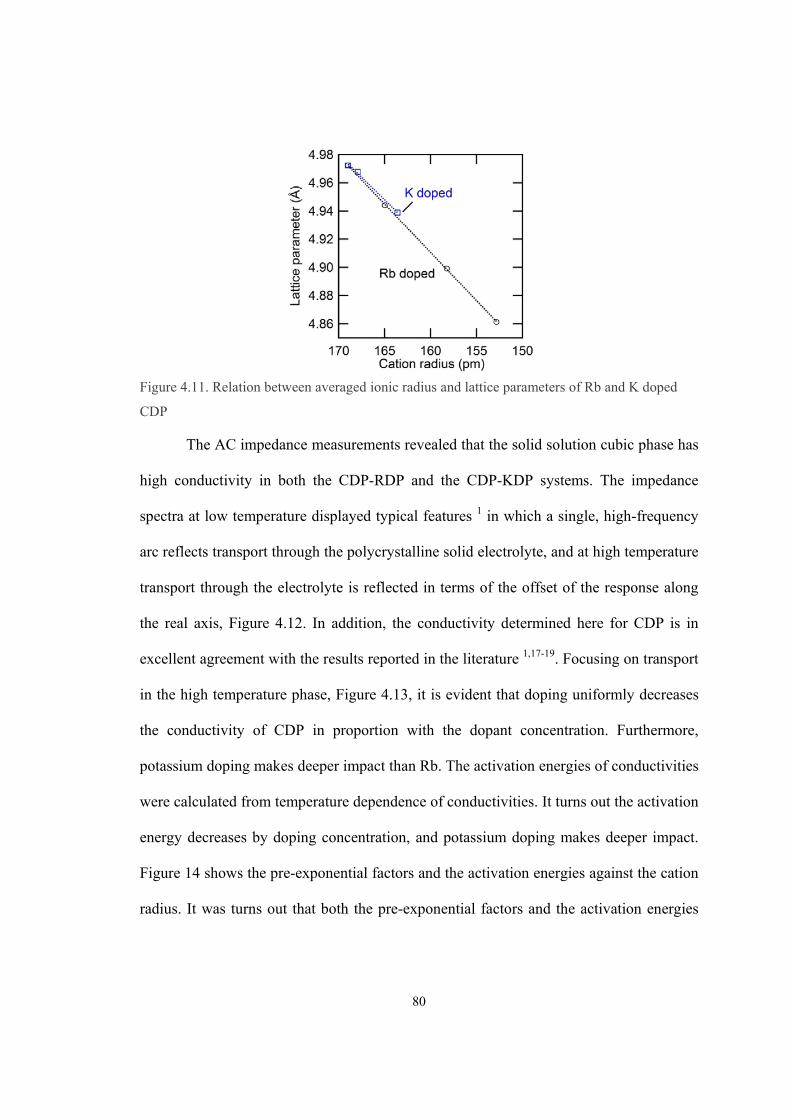
80
Figure 4.11. Relation between averaged ionic radius and lattice parameters of Rb and K doped
CDP
The AC impedance measurements revealed that the solid solution cubic phase has
high conductivity in both the CDP-RDP and the CDP-KDP systems. The impedance
spectra at low temperature displayed typical features 1 in which a single, high-frequency
arc reflects transport through the polycrystalline solid electrolyte, and at high temperature
transport through the electrolyte is reflected in terms of the offset of the response along
the real axis, Figure 4.12. In addition, the conductivity determined here for CDP is in
excellent agreement with the results reported in the literature 1,17-19. Focusing on transport
in the high temperature phase, Figure 4.13, it is evident that doping uniformly decreases
the conductivity of CDP in proportion with the dopant concentration. Furthermore,
potassium doping makes deeper impact than Rb. The activation energies of conductivities
were calculated from temperature dependence of conductivities. It turns out the activation
energy decreases by doping concentration, and potassium doping makes deeper impact.
Figure 14 shows the pre-exponential factors and the activation energies against the cation
radius. It was turns out that both the pre-exponential factors and the activation energies
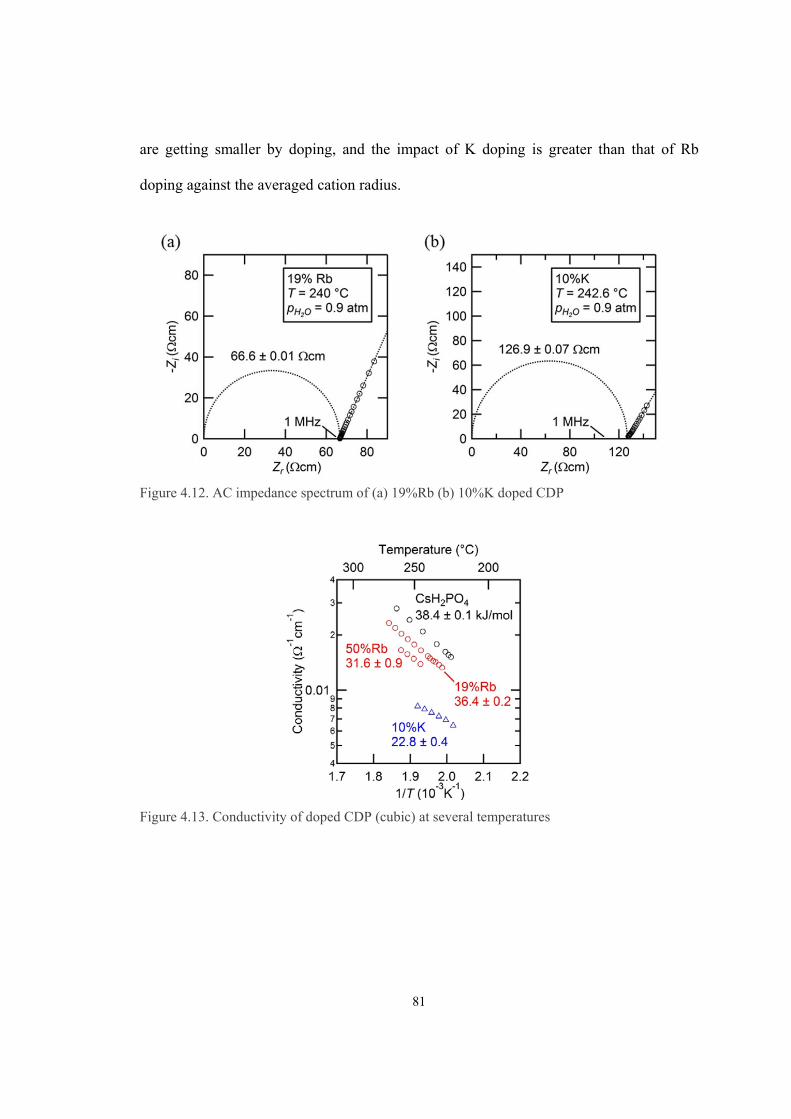
81
are getting smaller by doping, and the impact of K doping is greater than that of Rb
doping against the averaged cation radius.
Figure 4.12. AC impedance spectrum of (a) 19%Rb (b) 10%K doped CDP
Figure 4.13. Conductivity of doped CDP (cubic) at several temperatures
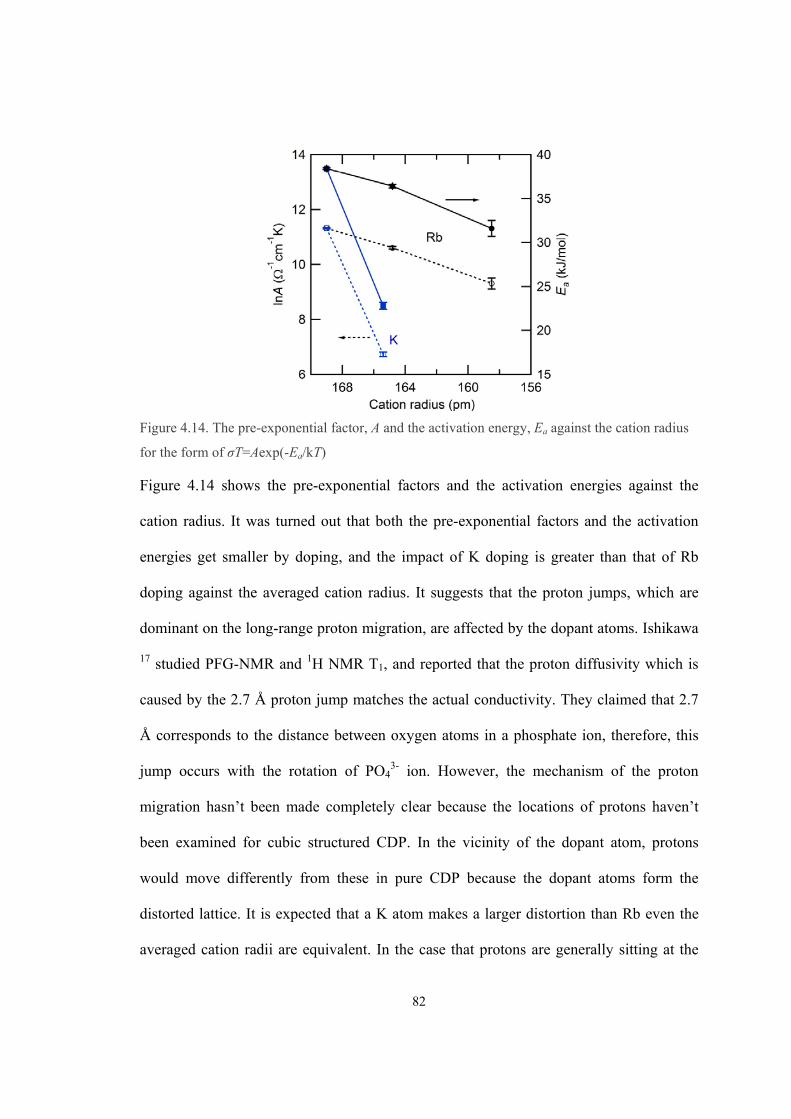
82
Figure 4.14. The pre-exponential factor, A and the activation energy, Ea against the cation radius
for the form of σT=Aexp(-Ea/kT)
Figure 4.14 shows the pre-exponential factors and the activation energies against the
cation radius. It was turned out that both the pre-exponential factors and the activation
energies get smaller by doping, and the impact of K doping is greater than that of Rb
doping against the averaged cation radius. It suggests that the proton jumps, which are
dominant on the long-range proton migration, are affected by the dopant atoms. Ishikawa
17 studied PFG-NMR and 1H NMR T1, and reported that the proton diffusivity which is
caused by the 2.7 Å proton jump matches the actual conductivity. They claimed that 2.7
Å corresponds to the distance between oxygen atoms in a phosphate ion, therefore, this
jump occurs with the rotation of PO43- ion. However, the mechanism of the proton
migration hasn’t been made completely clear because the locations of protons haven’t
been examined for cubic structured CDP. In the vicinity of the dopant atom, protons
would move differently from these in pure CDP because the dopant atoms form the
distorted lattice. It is expected that a K atom makes a larger distortion than Rb even the
averaged cation radii are equivalent. In the case that protons are generally sitting at the
83
face centered position, the protons have four nearest-neighbor cation sites. The charge
potential at the proton sites may depend on the configuration of cation sites. Since both
protons and cations are positive monovalent ions, the proton site in the largely shrunk
lattices would not be favorable for protons other than as possible proton sites. In such a
situation, the effective diffusion path of protons is fewer than undoped CDP. As the result,
the proton diffusivity of K or Rb doped CDP is lower than that of undoped CDP. In
respect to the change of the activation energy by doping, the proton jump from an
unfavorable to a normal position seems to occur more easily than that from a normal to
other normal position. Therefore, the overall activation energy can decrease by
introducing such an unfavorable site.
4.4. Conclusion
The CDP-RDP system displays complete solid solubility at all temperatures above
180 °C. At intermediate temperatures, the system adopts the CDP-type monoclinic phase.
At high temperatures, the materials adopt the superprotonic cubic phase of CDP. The
transition temperature increases monotonically with increasing Rb content, whereas the
dehydration temperature largely decreases, resulting in a narrowing of the region of
stability of the cubic phase. In the case of the end-member RbH2PO4 compound, this
phase cannot be observed under 1 atm pH2O and more extreme conditions (such as high
pressure) are required. While a two-phase region is expected between the monoclinic and
cubic phases, the width of this region is too small for easy detection. The thermal
expansion behavior is largely independent of dopant concentration, and within the single
phase cubic region the cell constant obeys Vegard’s law, linearly decreasing with Rb
84
content. The conductivity decreases by both Rb and K doping cases. The pre-exponential
factor and the activation energy decreases by doping. The impact of K doping is deeper
than that of Rb with the equivalent concentrations in the averaged cation radius. It
suggests that the proton jumps, which are dominant on the long-range proton migration,
are affected by the dopant atoms. In order to explain this phenomenon, the proton
migration mechanism in cubic CDP needs to be measured precisely.
85
Bibliography
1 Haile, S. M., Chisholm, C. R. I., Sasaki, K., Boysen, D. A. & Uda, T. "Solid acid proton
conductors: from laboratory curiosities to fuel cell electrolytes". Faraday Discussions
134, 17-39, (2007).
2 Ikeda, A. & Haile, S. M. "The thermodynamics and kinetics of the dehydration of
CsH2PO4 studied in the presence of SiO2". Solid State Ionics 213, 63-71, (2012).
3 Cowan, L. Superprotonic Solid Acid Phase Transitions and Stability, California Institute
of Technology, (2007).
4 Louie, M. W., Kislitsyn, M., Bhattacharya, K. & Haile, S. M. "Phase transformation and
hysteresis behavior in Cs1-xRbxH2PO4". Solid State Ionics 181, 173-179, (2010).
5 Martsinkevich, V. V., Ponomareva, V. G., Drebushchak, T. N., Lavrova, G. V. &
Shatskaya, S. S. "Structure of Cs1−xRbxH2PO4 solid solutions". Inorganic Materials 46,
765-769, (2010).
6 Matsuo, Y., Hatori, J., Yoshida, Y. & Ikehata, S. "Rule of superprotonic phase transition
in CsxRb1-xH2PO4". Solid State Ionics 213, 42-44, (2012).
7 Botez, C. E. et al. "High pressure synchrotron X-ray diffraction studies of superprotonic
transitions in phosphate solid acids". Solid State Ionics 213, 58-62, (2012).
8 Ikeda, A. & Haile, S. M. "Examination of the superprotonic transition and dehydration
behavior of Cs0.75Rb0.25H2PO4 by thermogravimetric and differential thermal analyses".
Solid State Ionics 181, 193-196, (2010).
9 Izumi, F. & Momma, K. "Three-dimensional visualization in powder diffraction".
Applied Crystallography XX 130, 15-20, (2007).
10 Dutta, B. N. "Lattice Constants and Thermal Expansion of Silicon up to 900 °C by X-Ray
Method". Physica Status Solidi 2, 984-987, (1962).
11 Komukae, M., Kawashima, K. & Osaka, T. "High-temperature phase transition in
RbH2PO4". Journal of the Physical Society of Japan 69, 2076-2081, (2000).
86
12 Botez, C. E., Carbajal, D., Adiraju, V. A. K., Tackett, R. J. & Chianelli, R. R.
"Intermediate-temperature polymorphic phase transition in KH2PO4: A synchrotron X-
ray diffraction study". Journal of Physics and Chemistry of Solids 71, 1576-1580, (2010).
13 Yamada, K. "Superprotonic conductor CsH2PO4 studied by 1H, 31P NMR and X-ray
diffraction". Solid State Ionics 175, 557-562, (2004).
14 Bronowska, W. "High-temperature phenomena in RbD2PO4 and CsH2PO4 polymeric
transformations or polymorphic phase transitions?". Materials Science-Poland 24, 229-
236, (2006).
15 Preisinger, A., Mereiter, K. & Bronowska, W. "The Phase Transition of CsH2PO4 (CDP)
at 505K". Materials Science Forum 166, 511-516, (1994).
16 Pauling, L. The Nature of the Chemical Bond. (Cornell University Press, 1960).
17 Ishikawa, A. et al. "Proton dynamics of CsH2PO4 studied by quasi-elastic neutron
scattering and PFG-NMR". Solid State Ionics 179, 2345-2349, (2008).
18 Otomo, J. et al. "Effect of water vapor on proton conduction of cesium dihydrogen
phosphateand application to intermediate temperature fuel cells". Journal of Applied
Electrochemistry 35, 865-870, (2005).
19 Boysen, D. A., Uda, T., Chisholm, C. R. I. & Haile, S. M. "High-performance solid acid
fuel cells through humidity stabilization". Science 303, 68-70, (2004).
87
Chapter 5 Phase transformation of CsH2PO4
5.1 Introduction
CsH2PO4 is an ionic crystal which is brittle and soft. After a single crystal
specimen transforms with LT phase (monoclinic) HT phase (cubic)LT phase, by
heating up and down under humid atmosphere, a lot of micro cracks are introduced and
the crystal loses its transparency. The phase transition mechanisms of metals have been
studied very well. These are investigated systematically and the crystallography, kinetics,
and thermodynamics of the phase transformations are revealed. However, the information
of the transformation mechanism for nonmetal materials is very limited because the
reports are much fewer.
The number of the experimental methods to observe the transformation of
CsH2PO4 is not many. Especially, it is very difficult to obtain the crystallographic
information for the following reasons: First, it is hard to prepare the sample which is
transformed from a single or large-grain crystal of the HT phase. In the case that a LT
phase crystal is used, it is not possible to observe microstructure change by LT to HT
phase transition, because HT cannot be frozen to room temperature and the sample makes
a second transition from HT to LT phase. Second, it is hard to observe the orientation of
domains by TEM because the electron beam destroys CsH2PO4. Third, SEM observation
is not possible at the temperature at which the cubic phase is stable.
The phase transitions of solid acid compounds are observed in many reports. The
domain structure of RbH3(SeO4)2 formed in the HT phase in the optical was reported by
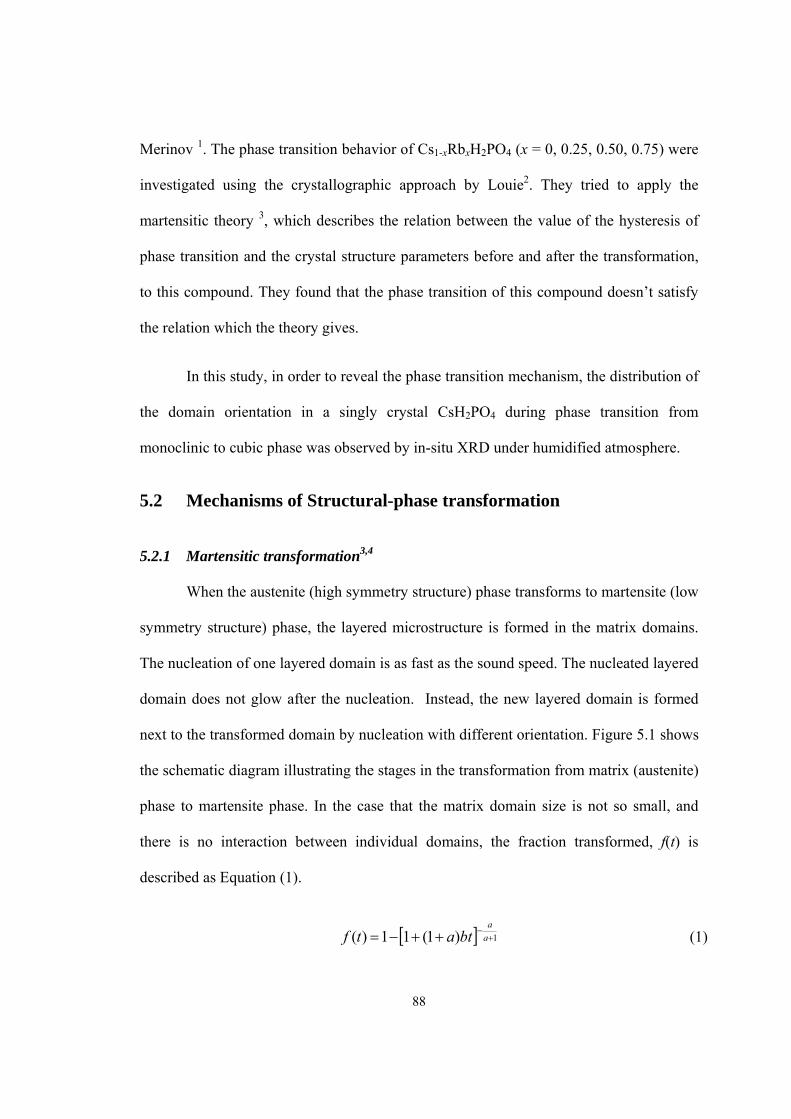
88
Merinov 1. The phase transition behavior of Cs1-xRbxH2PO4 (x = 0, 0.25, 0.50, 0.75) were
investigated using the crystallographic approach by Louie2. They tried to apply the
martensitic theory 3, which describes the relation between the value of the hysteresis of
phase transition and the crystal structure parameters before and after the transformation,
to this compound. They found that the phase transition of this compound doesn’t satisfy
the relation which the theory gives.
In this study, in order to reveal the phase transition mechanism, the distribution of
the domain orientation in a singly crystal CsH2PO4 during phase transition from
monoclinic to cubic phase was observed by in-situ XRD under humidified atmosphere.
5.2 Mechanisms of Structural-phase transformation
5.2.1 Martensitic transformation3,4
When the austenite (high symmetry structure) phase transforms to martensite (low
symmetry structure) phase, the layered microstructure is formed in the matrix domains.
The nucleation of one layered domain is as fast as the sound speed. The nucleated layered
domain does not glow after the nucleation. Instead, the new layered domain is formed
next to the transformed domain by nucleation with different orientation. Figure 5.1 shows
the schematic diagram illustrating the stages in the transformation from matrix (austenite)
phase to martensite phase. In the case that the matrix domain size is not so small, and
there is no interaction between individual domains, the fraction transformed, f(t) is
described as Equation (1).
1)1(11)( a
a
btatf (1)
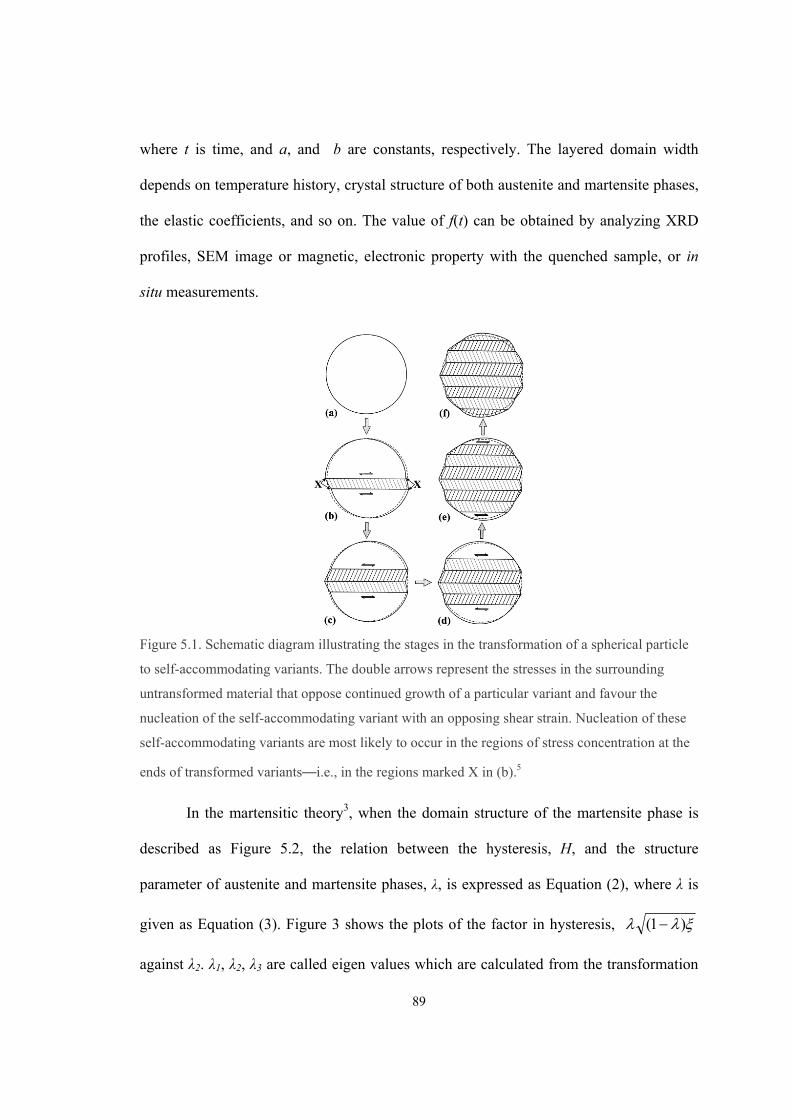
89
where t is time, and a, and b are constants, respectively. The layered domain width
depends on temperature history, crystal structure of both austenite and martensite phases,
the elastic coefficients, and so on. The value of f(t) can be obtained by analyzing XRD
profiles, SEM image or magnetic, electronic property with the quenched sample, or in
situ measurements.
Figure 5.1. Schematic diagram illustrating the stages in the transformation of a spherical particle
to self-accommodating variants. The double arrows represent the stresses in the surrounding
untransformed material that oppose continued growth of a particular variant and favour the
nucleation of the self-accommodating variant with an opposing shear strain. Nucleation of these
self-accommodating variants are most likely to occur in the regions of stress concentration at the
ends of transformed variants––i.e., in the regions marked X in (b).5
In the martensitic theory3, when the domain structure of the martensite phase is
described as Figure 5.2, the relation between the hysteresis, H, and the structure
parameter of austenite and martensite phases, λ, is expressed as Equation (2), where λ is
given as Equation (3). Figure 3 shows the plots of the factor in hysteresis, )1(
against λ2. λ1, λ2, λ3 are called eigen values which are calculated from the transformation
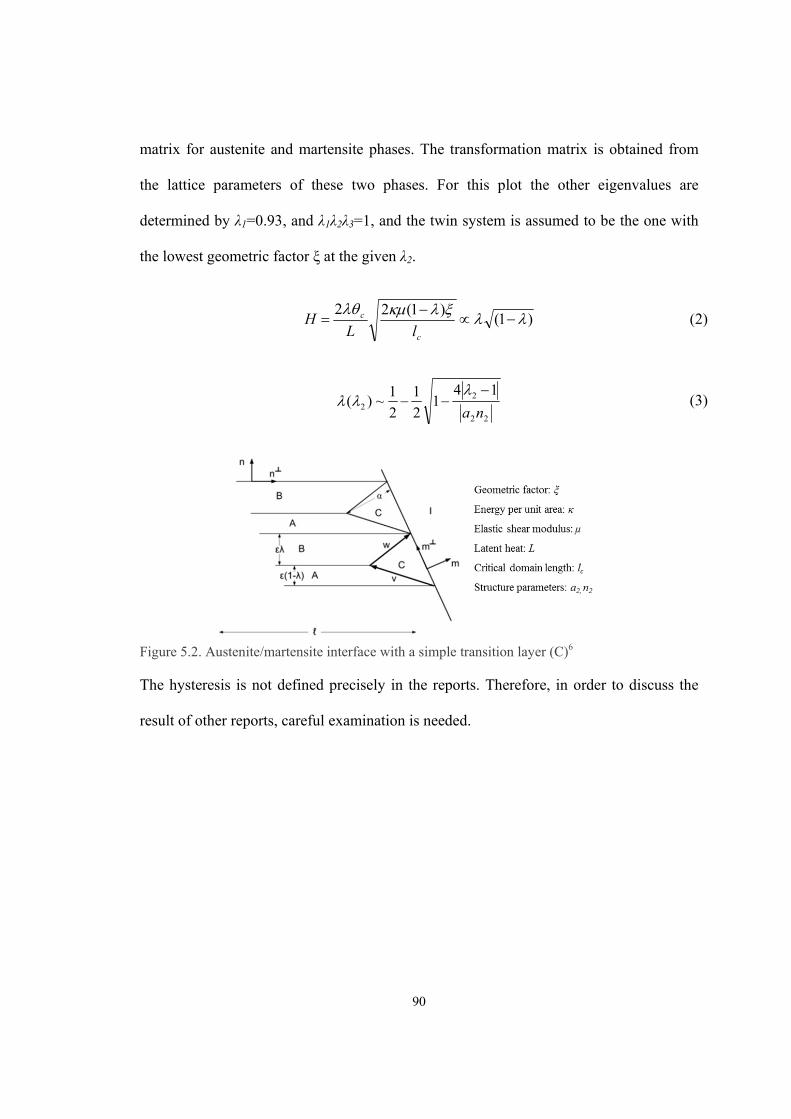
90
matrix for austenite and martensite phases. The transformation matrix is obtained from
the lattice parameters of these two phases. For this plot the other eigenvalues are
determined by λ1=0.93, and λ1λ2λ3=1, and the twin system is assumed to be the one with
the lowest geometric factor ξ at the given λ2.
)1()1(22
c
c
lLH (2)
22
22
141
2
1
2
1~)(
na
(3)
Figure 5.2. Austenite/martensite interface with a simple transition layer (C)6
The hysteresis is not defined precisely in the reports. Therefore, in order to discuss the
result of other reports, careful examination is needed.
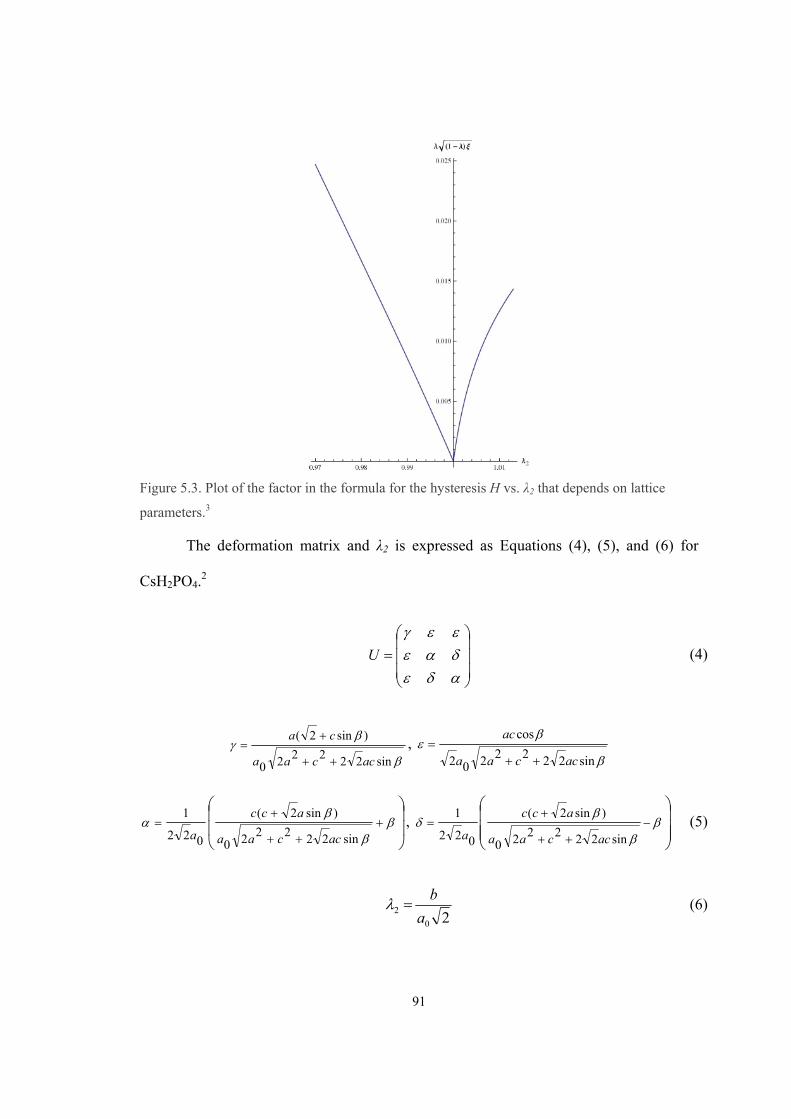
91
Figure 5.3. Plot of the factor in the formula for the hysteresis H vs. λ2 that depends on lattice
parameters.3
The deformation matrix and λ2 is expressed as Equations (4), (5), and (6) for
CsH2PO4.2
U (4)
sin222220
)sin2(
accaa
ca
,
sin2222202
cos
accaa
ac
sin222220
)sin2(
022
1
accaa
acc
a,
sin222220
)sin2(
022
1
accaa
acc
a (5)
20
2a
b (6)
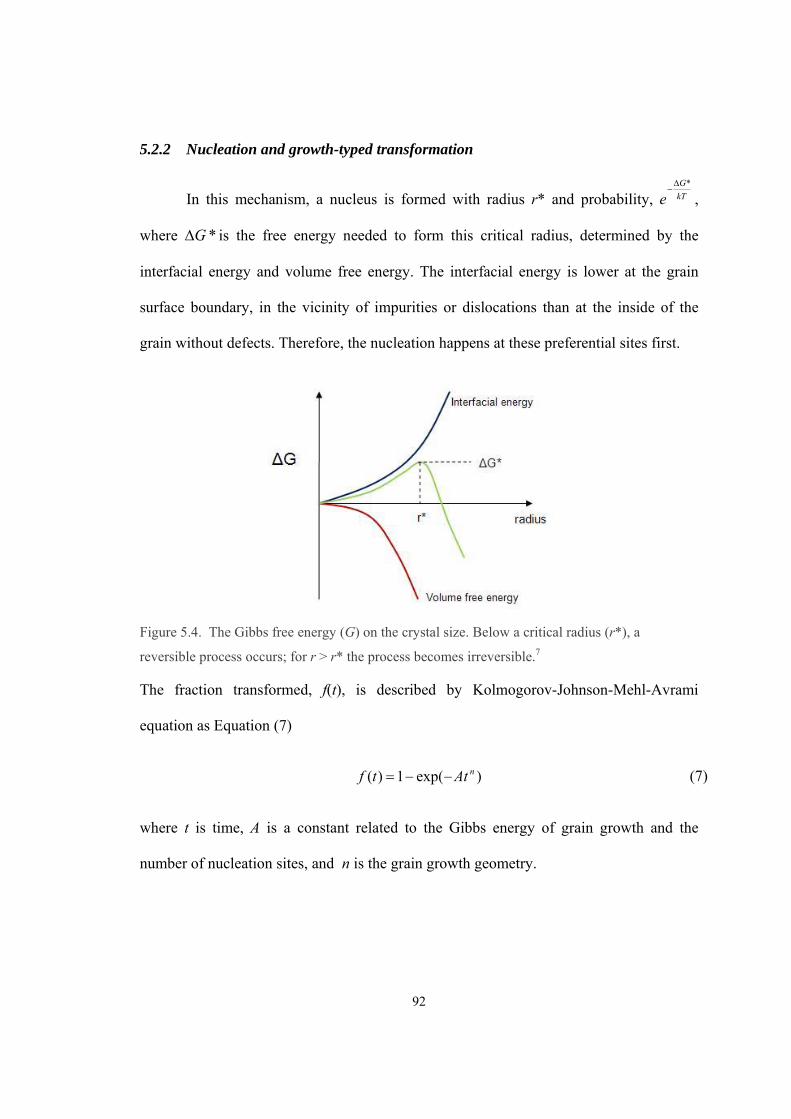
92
5.2.2 Nucleation and growth-typed transformation
In this mechanism, a nucleus is formed with radius r* and probability, kT
G
e*
,
where *G is the free energy needed to form this critical radius, determined by the
interfacial energy and volume free energy. The interfacial energy is lower at the grain
surface boundary, in the vicinity of impurities or dislocations than at the inside of the
grain without defects. Therefore, the nucleation happens at these preferential sites first.
Figure 5.4. The Gibbs free energy (G) on the crystal size. Below a critical radius (r*), a
reversible process occurs; for r > r* the process becomes irreversible.7
The fraction transformed, f(t), is described by Kolmogorov-Johnson-Mehl-Avrami
equation as Equation (7)
)exp(1)( nAttf (7)
where t is time, A is a constant related to the Gibbs energy of grain growth and the
number of nucleation sites, and n is the grain growth geometry.
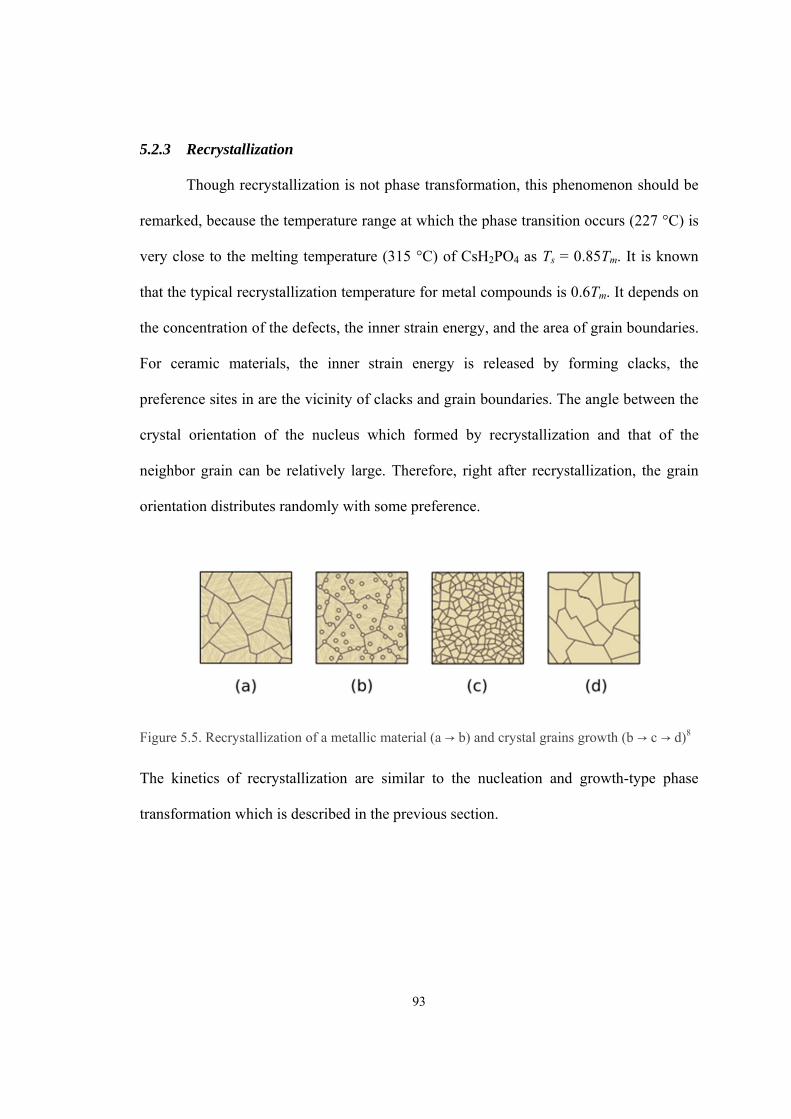
93
5.2.3 Recrystallization
Though recrystallization is not phase transformation, this phenomenon should be
remarked, because the temperature range at which the phase transition occurs (227 °C) is
very close to the melting temperature (315 °C) of CsH2PO4 as Ts = 0.85Tm. It is known
that the typical recrystallization temperature for metal compounds is 0.6Tm. It depends on
the concentration of the defects, the inner strain energy, and the area of grain boundaries.
For ceramic materials, the inner strain energy is released by forming clacks, the
preference sites in are the vicinity of clacks and grain boundaries. The angle between the
crystal orientation of the nucleus which formed by recrystallization and that of the
neighbor grain can be relatively large. Therefore, right after recrystallization, the grain
orientation distributes randomly with some preference.
Figure 5.5. Recrystallization of a metallic material (a → b) and crystal grains growth (b → c → d)8
The kinetics of recrystallization are similar to the nucleation and growth-type phase
transformation which is described in the previous section.
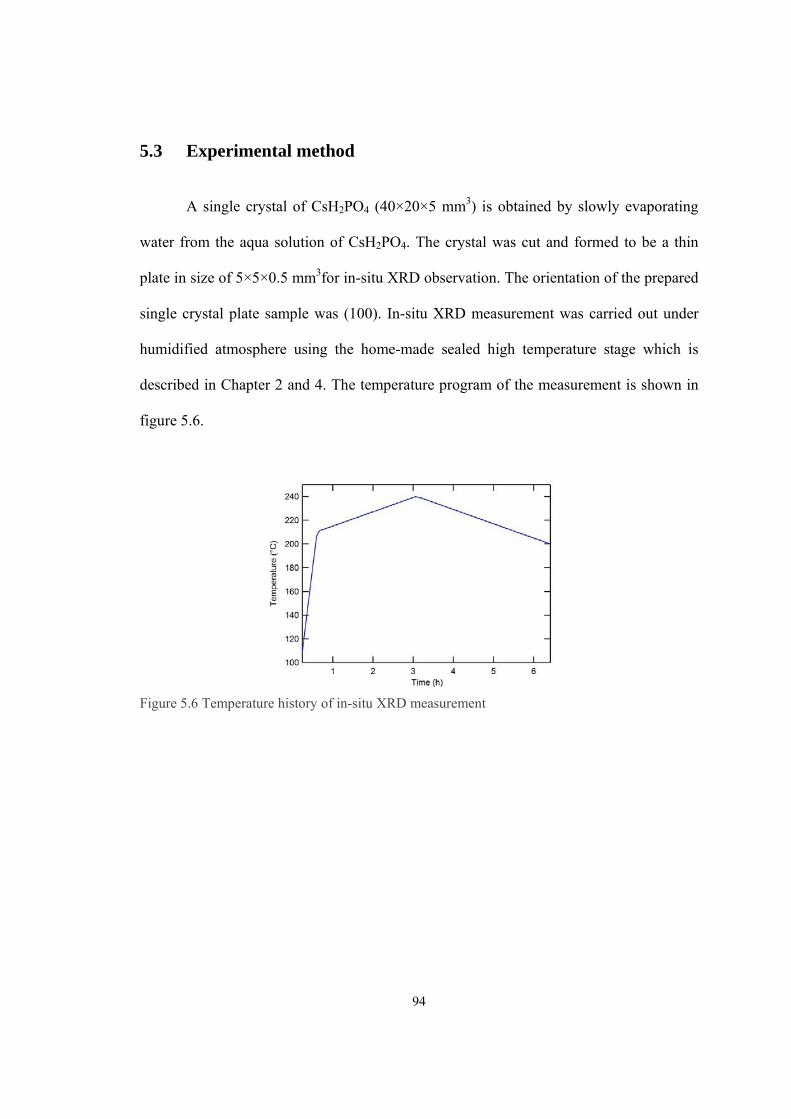
94
5.3 Experimental method
A single crystal of CsH2PO4 (40×20×5 mm3) is obtained by slowly evaporating
water from the aqua solution of CsH2PO4. The crystal was cut and formed to be a thin
plate in size of 5×5×0.5 mm3for in-situ XRD observation. The orientation of the prepared
single crystal plate sample was (100). In-situ XRD measurement was carried out under
humidified atmosphere using the home-made sealed high temperature stage which is
described in Chapter 2 and 4. The temperature program of the measurement is shown in
figure 5.6.
Figure 5.6 Temperature history of in-situ XRD measurement
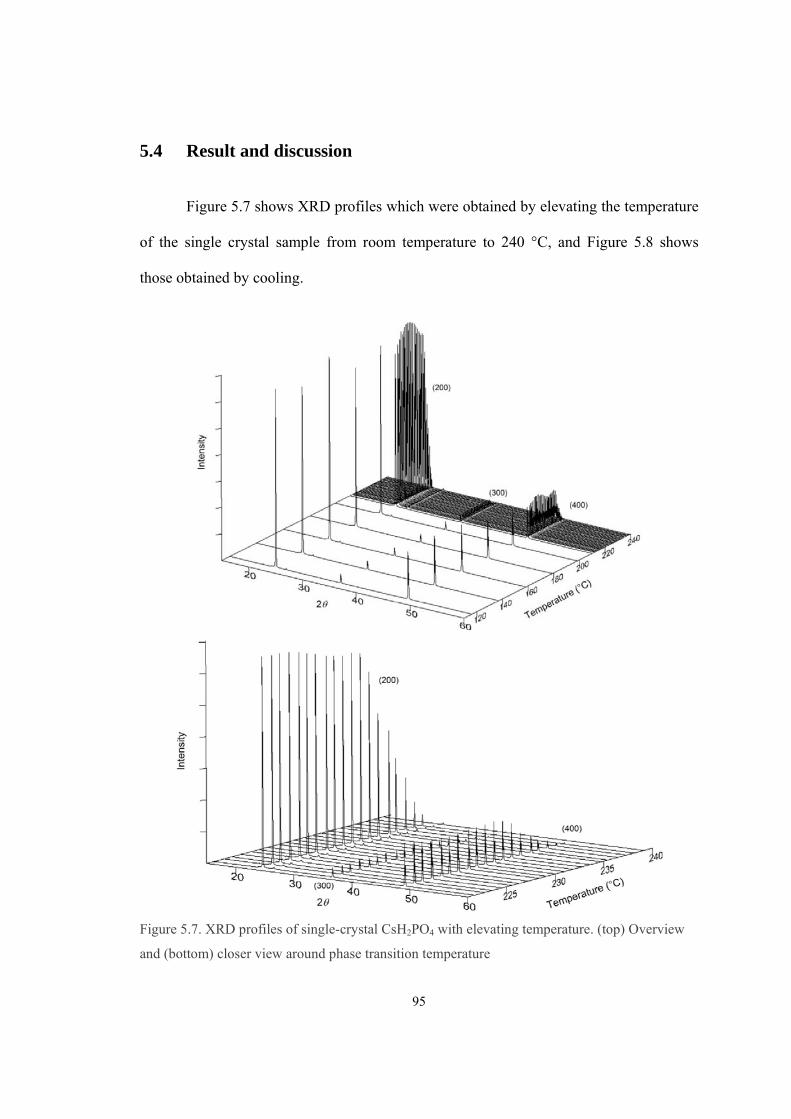
95
5.4 Result and discussion
Figure 5.7 shows XRD profiles which were obtained by elevating the temperature
of the single crystal sample from room temperature to 240 °C, and Figure 5.8 shows
those obtained by cooling.
Figure 5.7. XRD profiles of single-crystal CsH2PO4 with elevating temperature. (top) Overview
and (bottom) closer view around phase transition temperature
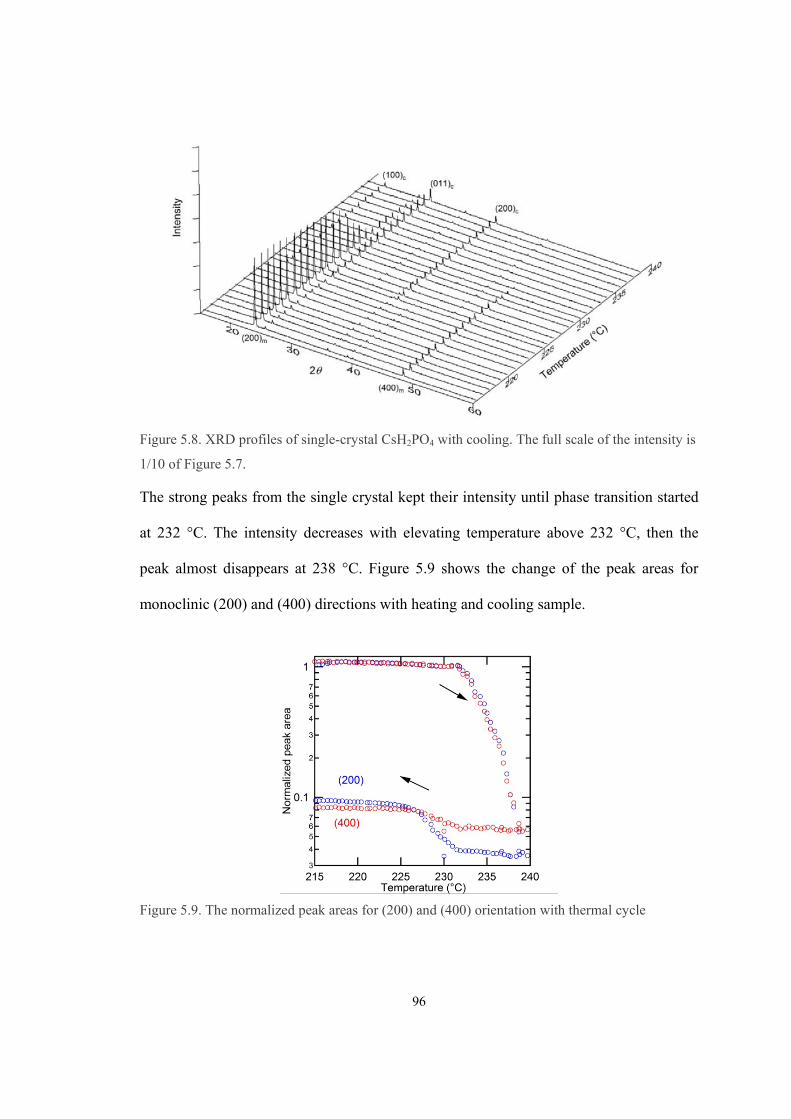
96
Figure 5.8. XRD profiles of single-crystal CsH2PO4 with cooling. The full scale of the intensity is
1/10 of Figure 5.7.
The strong peaks from the single crystal kept their intensity until phase transition started
at 232 °C. The intensity decreases with elevating temperature above 232 °C, then the
peak almost disappears at 238 °C. Figure 5.9 shows the change of the peak areas for
monoclinic (200) and (400) directions with heating and cooling sample.
Figure 5.9. The normalized peak areas for (200) and (400) orientation with thermal cycle
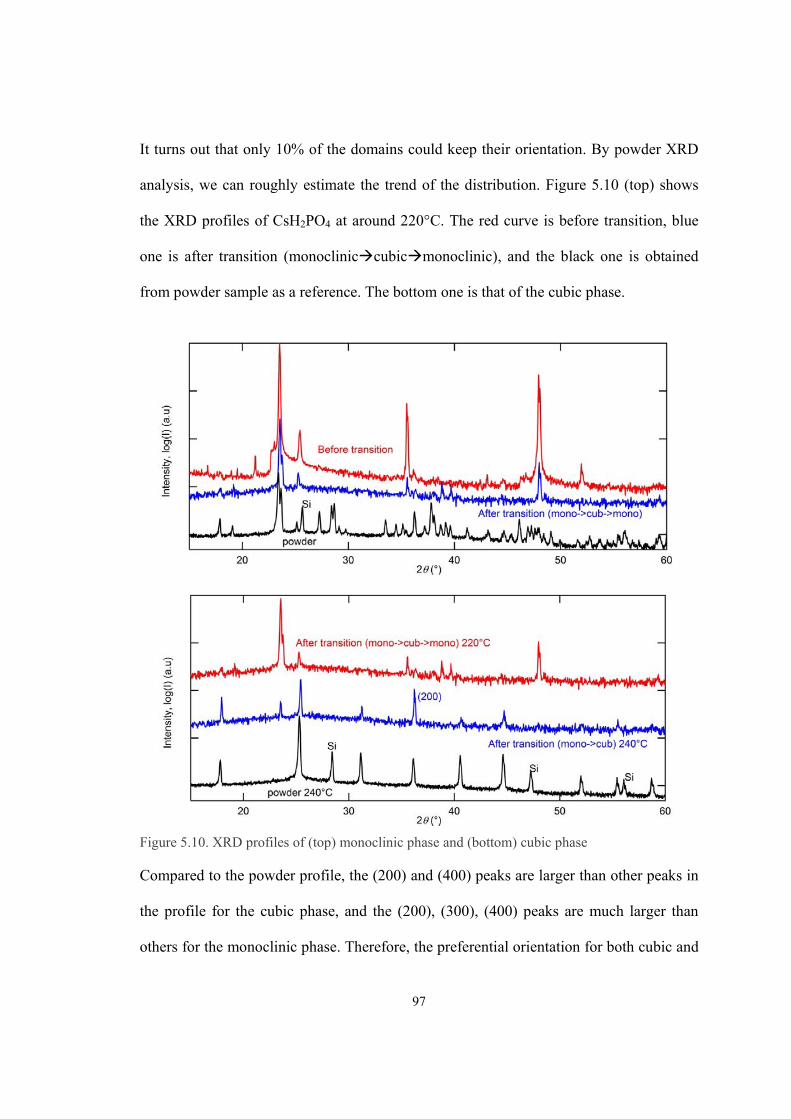
97
It turns out that only 10% of the domains could keep their orientation. By powder XRD
analysis, we can roughly estimate the trend of the distribution. Figure 5.10 (top) shows
the XRD profiles of CsH2PO4 at around 220°C. The red curve is before transition, blue
one is after transition (monocliniccubicmonoclinic), and the black one is obtained
from powder sample as a reference. The bottom one is that of the cubic phase.
Figure 5.10. XRD profiles of (top) monoclinic phase and (bottom) cubic phase
Compared to the powder profile, the (200) and (400) peaks are larger than other peaks in
the profile for the cubic phase, and the (200), (300), (400) peaks are much larger than
others for the monoclinic phase. Therefore, the preferential orientation for both cubic and
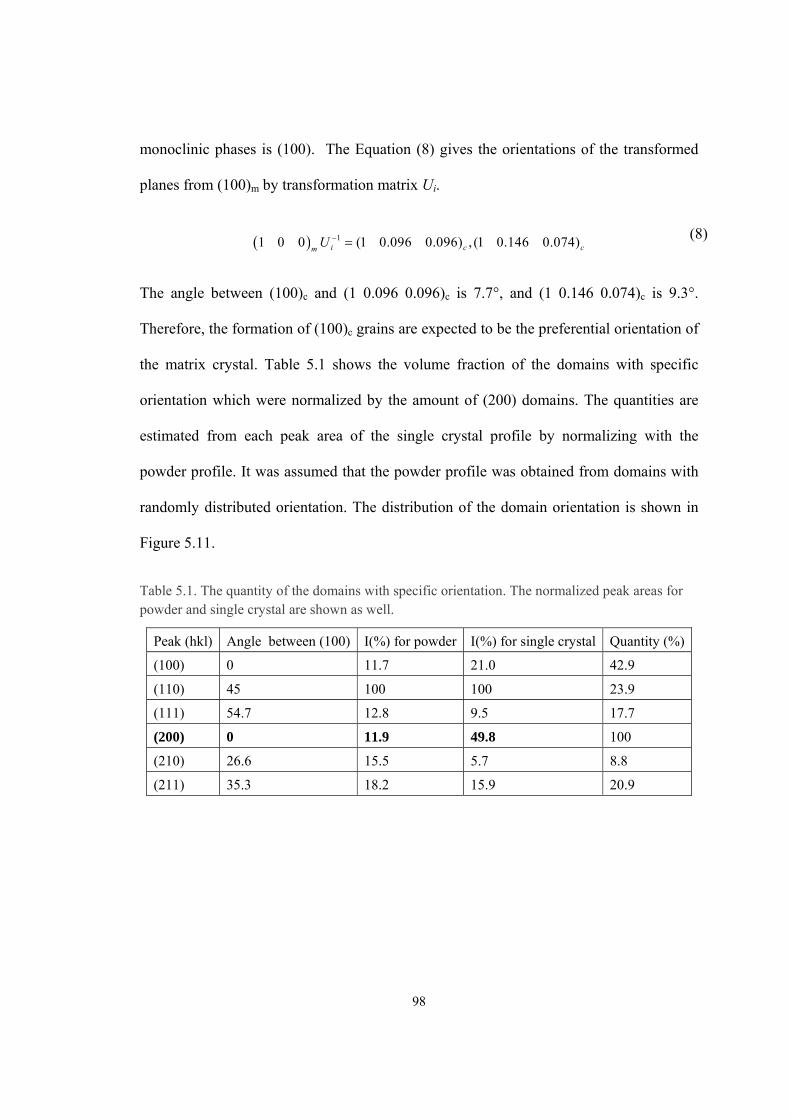
98
monoclinic phases is (100). The Equation (8) gives the orientations of the transformed
planes from (100)m by transformation matrix Ui.
11 0 0 (1 0.096 0.096) , (1 0.146 0.074)i c cmU (8)
The angle between (100)c and (1 0.096 0.096)c is 7.7°, and (1 0.146 0.074)c is 9.3°.
Therefore, the formation of (100)c grains are expected to be the preferential orientation of
the matrix crystal. Table 5.1 shows the volume fraction of the domains with specific
orientation which were normalized by the amount of (200) domains. The quantities are
estimated from each peak area of the single crystal profile by normalizing with the
powder profile. It was assumed that the powder profile was obtained from domains with
randomly distributed orientation. The distribution of the domain orientation is shown in
Figure 5.11.
Table 5.1. The quantity of the domains with specific orientation. The normalized peak areas for powder and single crystal are shown as well.
Peak (hkl) Angle between (100) I(%) for powder I(%) for single crystal Quantity (%)
(100) 0 11.7 21.0 42.9
(110) 45 100 100 23.9
(111) 54.7 12.8 9.5 17.7
(200) 0 11.9 49.8 100
(210) 26.6 15.5 5.7 8.8
(211) 35.3 18.2 15.9 20.9
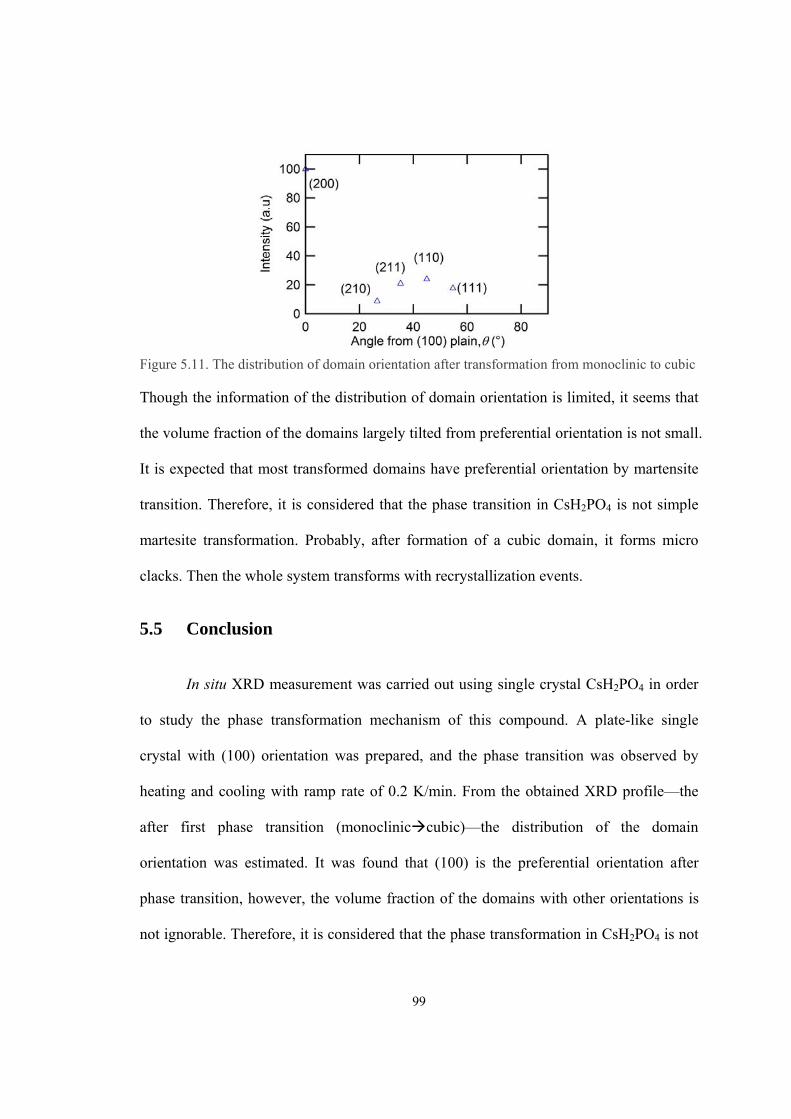
99
Figure 5.11. The distribution of domain orientation after transformation from monoclinic to cubic
Though the information of the distribution of domain orientation is limited, it seems that
the volume fraction of the domains largely tilted from preferential orientation is not small.
It is expected that most transformed domains have preferential orientation by martensite
transition. Therefore, it is considered that the phase transition in CsH2PO4 is not simple
martesite transformation. Probably, after formation of a cubic domain, it forms micro
clacks. Then the whole system transforms with recrystallization events.
5.5 Conclusion
In situ XRD measurement was carried out using single crystal CsH2PO4 in order
to study the phase transformation mechanism of this compound. A plate-like single
crystal with (100) orientation was prepared, and the phase transition was observed by
heating and cooling with ramp rate of 0.2 K/min. From the obtained XRD profile—the
after first phase transition (monocliniccubic)—the distribution of the domain
orientation was estimated. It was found that (100) is the preferential orientation after
phase transition, however, the volume fraction of the domains with other orientations is
not ignorable. Therefore, it is considered that the phase transformation in CsH2PO4 is not

100
simple martensitic, but that some other event, such as recrystallization, happens during
the transition process.
101
Bibliography
1 Merinov, B. V., Haile, S. M. & Bismayer, U. "Crystal structure of the "intermediate"
phase of the protonic conductor Rb3H(SeO4)2". Solid State Ionics 146, 355-365, (2002).
2 Louie, M. W., Kislitsyn, M., Bhattacharya, K. & Haile, S. M. "Phase transformation and
hysteresis behavior in Cs1-xRbxH2PO4". Solid State Ionics 181, 173-179, (2010).
3 Zhang, Z. Y., James, R. D. & Muller, S. "Energy barriers and hysteresis in martensitic
phase transformations". Acta Materialia 57, 4332-4352, (2009).
4 Christian, J. W. The theory of transformations in metals and alloys : an advanced
textbook in physical metallurgy. 2d edn, (Pergamon Press, 1975).
5 Kelly, P. M. & Francis Rose, L. R. "The martensitic transformation in ceramics — its
role in transformation toughening". Progress in Materials Science 47, 463-557, (2002).
6 Papandrew, A. B., Chisholm, C. R. I., Elgammal, R. A., Ozer, M. M. & Zecevic, S. K.
"Advanced Electrodes for Solid Acid Fuel Cells by Platinum Deposition on CsH2PO4".
Chemistry of Materials 23, 1659-1667, (2011).
7 Wikipedia, http://en.wikipedia.org/wiki/Nucleation
8 Wikipedia, http://wkp.maluke.com/en/Recrystallization_(metallurgy)
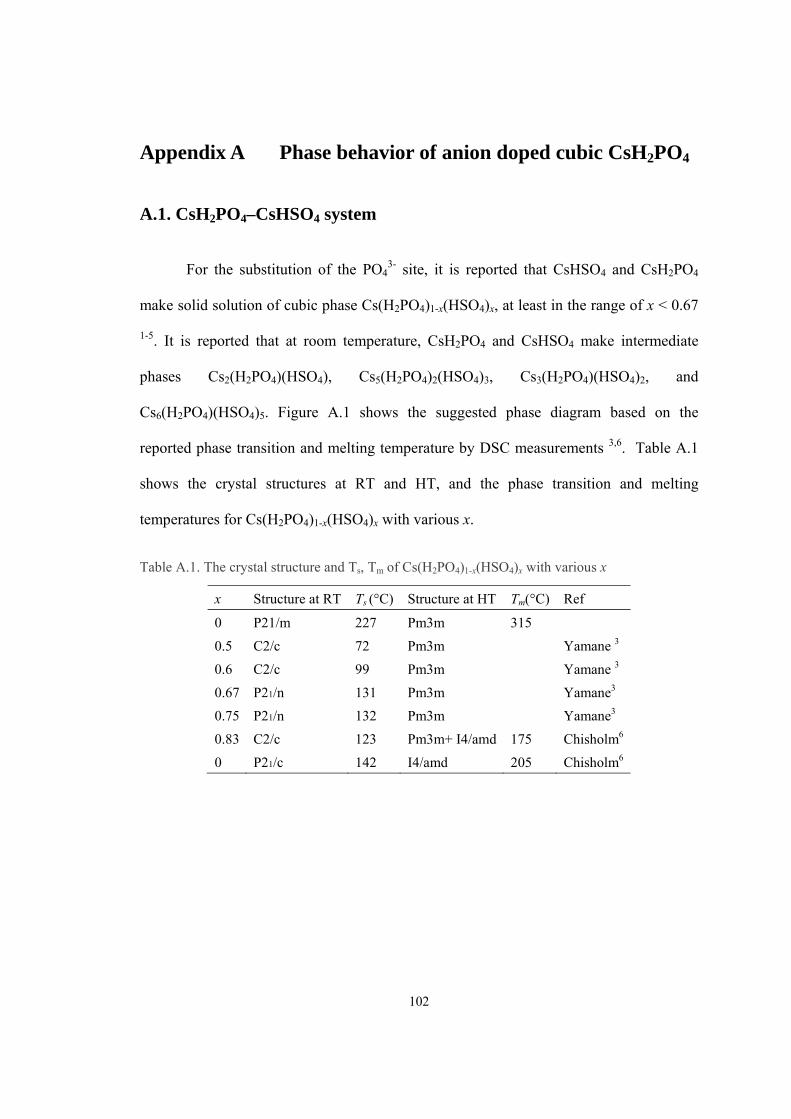
102
Appendix A Phase behavior of anion doped cubic CsH2PO4
A.1. CsH2PO4–CsHSO4 system
For the substitution of the PO43- site, it is reported that CsHSO4 and CsH2PO4
make solid solution of cubic phase Cs(H2PO4)1-x(HSO4)x, at least in the range of x < 0.67
1-5. It is reported that at room temperature, CsH2PO4 and CsHSO4 make intermediate
phases Cs2(H2PO4)(HSO4), Cs5(H2PO4)2(HSO4)3, Cs3(H2PO4)(HSO4)2, and
Cs6(H2PO4)(HSO4)5. Figure A.1 shows the suggested phase diagram based on the
reported phase transition and melting temperature by DSC measurements 3,6. Table A.1
shows the crystal structures at RT and HT, and the phase transition and melting
temperatures for Cs(H2PO4)1-x(HSO4)x with various x.
Table A.1. The crystal structure and Ts, Tm of Cs(H2PO4)1-x(HSO4)x with various x
x Structure at RT Ts (°C) Structure at HT Tm(°C) Ref
0 P21/m 227 Pm3m 315
0.5 C2/c 72 Pm3m Yamane 3
0.6 C2/c 99 Pm3m Yamane 3
0.67 P21/n 131 Pm3m Yamane3
0.75 P21/n 132 Pm3m Yamane3
0.83 C2/c 123 Pm3m+ I4/amd 175 Chisholm6
0 P21/c 142 I4/amd 205 Chisholm6
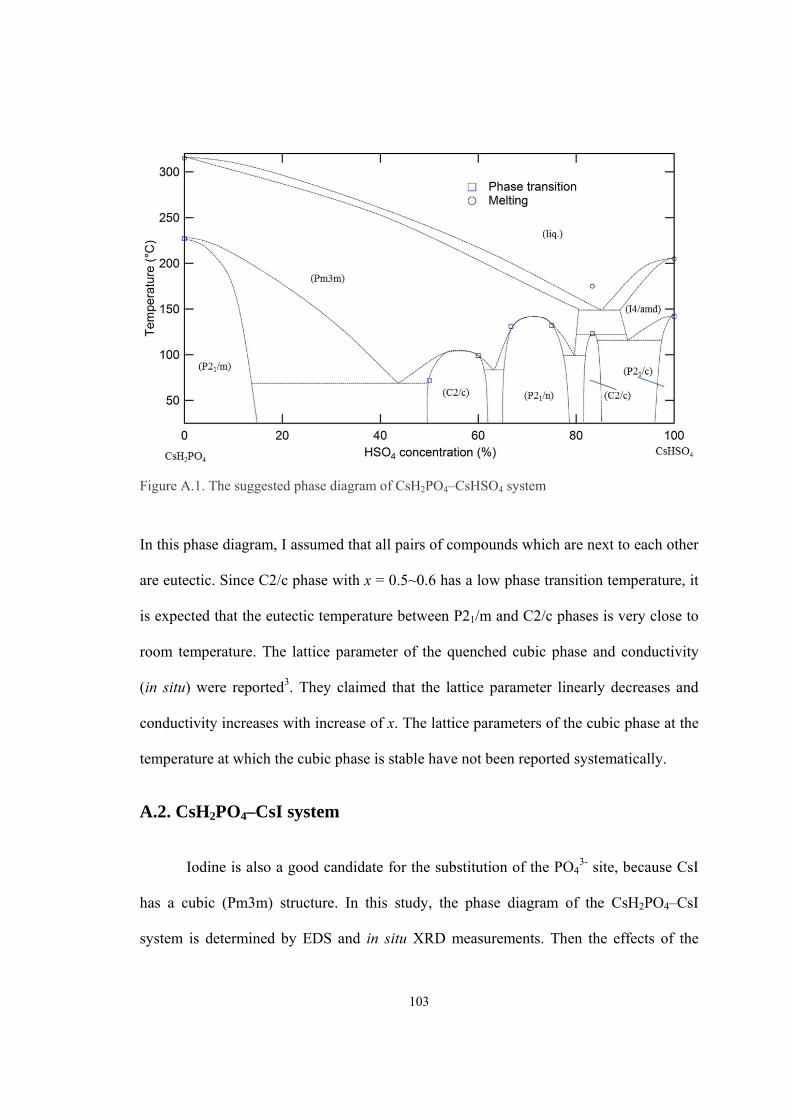
103
Figure A.1. The suggested phase diagram of CsH2PO4–CsHSO4 system
In this phase diagram, I assumed that all pairs of compounds which are next to each other
are eutectic. Since C2/c phase with x = 0.5~0.6 has a low phase transition temperature, it
is expected that the eutectic temperature between P21/m and C2/c phases is very close to
room temperature. The lattice parameter of the quenched cubic phase and conductivity
(in situ) were reported3. They claimed that the lattice parameter linearly decreases and
conductivity increases with increase of x. The lattice parameters of the cubic phase at the
temperature at which the cubic phase is stable have not been reported systematically.
A.2. CsH2PO4–CsI system
Iodine is also a good candidate for the substitution of the PO43- site, because CsI
has a cubic (Pm3m) structure. In this study, the phase diagram of the CsH2PO4–CsI
system is determined by EDS and in situ XRD measurements. Then the effects of the
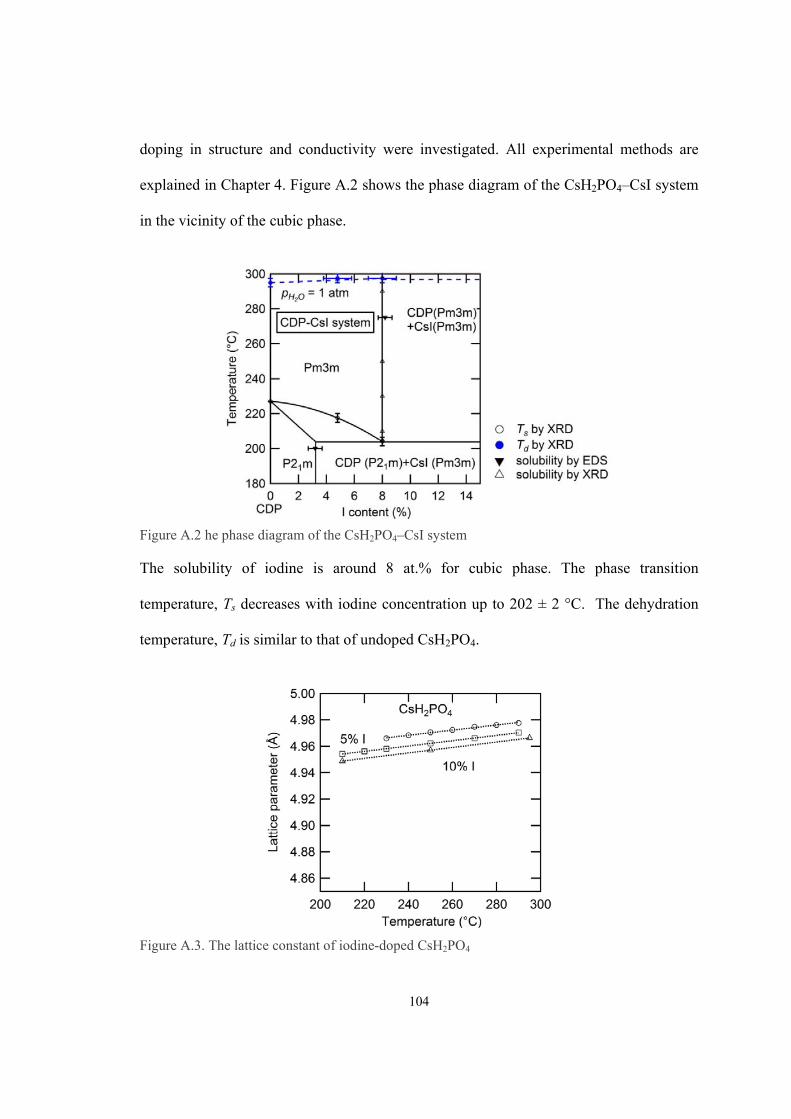
104
doping in structure and conductivity were investigated. All experimental methods are
explained in Chapter 4. Figure A.2 shows the phase diagram of the CsH2PO4–CsI system
in the vicinity of the cubic phase.
Figure A.2 he phase diagram of the CsH2PO4–CsI system
The solubility of iodine is around 8 at.% for cubic phase. The phase transition
temperature, Ts decreases with iodine concentration up to 202 ± 2 °C. The dehydration
temperature, Td is similar to that of undoped CsH2PO4.
Figure A.3. The lattice constant of iodine-doped CsH2PO4
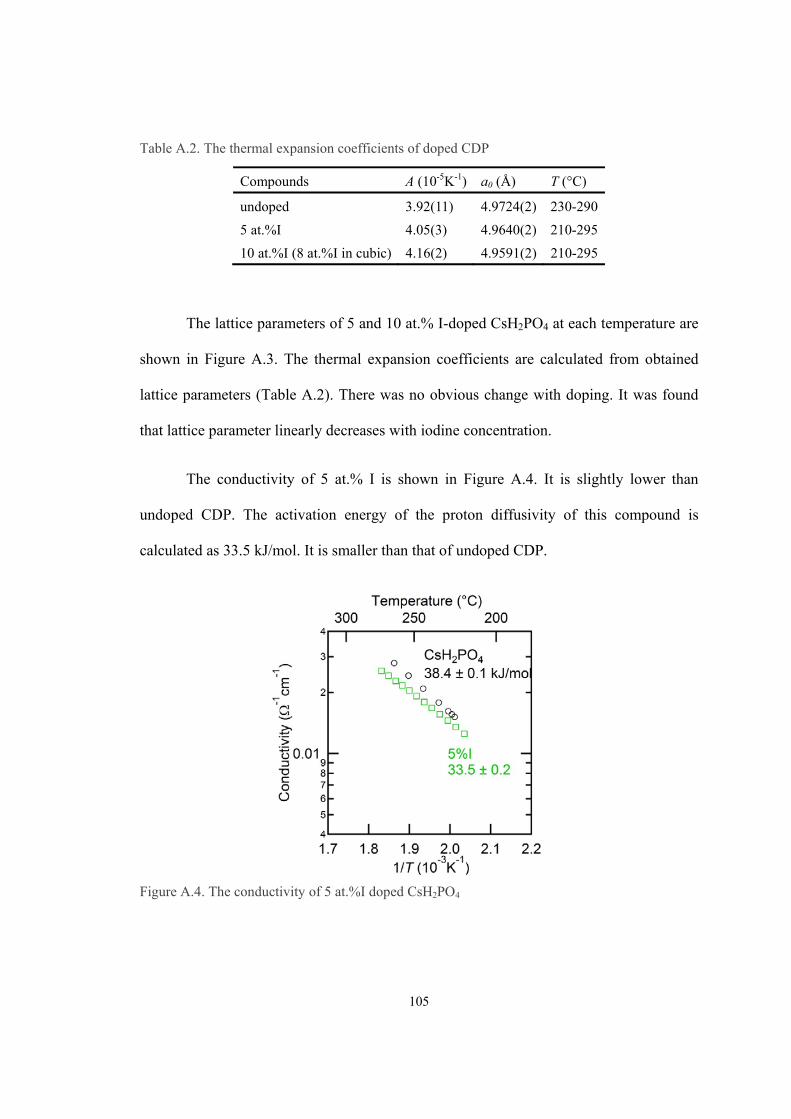
105
Table A.2. The thermal expansion coefficients of doped CDP
Compounds A (10-5K-1) a0 (Å) T (°C)
undoped 3.92(11) 4.9724(2) 230-290
5 at.%I 4.05(3) 4.9640(2) 210-295
10 at.%I (8 at.%I in cubic) 4.16(2) 4.9591(2) 210-295
The lattice parameters of 5 and 10 at.% I-doped CsH2PO4 at each temperature are
shown in Figure A.3. The thermal expansion coefficients are calculated from obtained
lattice parameters (Table A.2). There was no obvious change with doping. It was found
that lattice parameter linearly decreases with iodine concentration.
The conductivity of 5 at.% I is shown in Figure A.4. It is slightly lower than
undoped CDP. The activation energy of the proton diffusivity of this compound is
calculated as 33.5 kJ/mol. It is smaller than that of undoped CDP.
Figure A.4. The conductivity of 5 at.%I doped CsH2PO4
106
A.3 Conclusion
Both CsH2PO4-CsHSO4 and CsH2PO4-CsI systems are eutectic and the cubic
phase of these systems are stable at lower temperature region than the phase transition
temperature of undoped CsH2PO4. Unfortunately, neither doped CDP is stable for
practical use, because SO4 ions react with hydrogen and I ions react with oxygen gas at
the cubic stable temperature region. The lattice parameter linearly changes in both cases.
Therefore, it is expected that the lattice parameter of cubic CDP is expressed as Equation
(1)
200000 )()())((),,( TTBTTArrrraTrra aaccac (1)
where rc, ra, and T are the averaged cation and anion ionic radius, respectively. A and B
are the thermal expansion parameters. The conductivity of I-doped CDP was observed
and it was slightly lower than undoped CDP.
107
Bibliography
1 Chisholm, C. R. I. & Haile, S. M. "Superprotonic behavior of Cs2(HSO4)(H2PO4) - a new
solid acid in the CsHSO4-CsH2PO4 system". Solid State Ionics 136, 229-241, (2000).
2 Chisholm, C. R. I. & Haile, S. M. "Structure and thermal behavior of the new
superprotonic conductor Cs2(HSO4)(H2PO4)". Acta Crystallographica Section B-
Structural Science 55, 937-946, (1999).
3 Yamane, Y., Yamada, K. & Inoue, K. "Superprotonic solid solutions between CsHSO4
and CsH2PO4". Solid State Ionics 179, 483-488, (2008).
4 Haile, S. M., Lentz, G., Kreuer, K. D. & Maier, J. "Superprotonic Conductivity in
Cs3(HSO4)2(H2PO4)". Solid State Ionics 77, 128-134, (1995).
5 Haile, S. M. & Calkins, P. M. "X-ray diffraction study of Cs5(HSO4)3(H2PO4)2, a new
solid acid with a unique hydrogen-bond network". Journal of Solid State Chemistry 140,
251-265, (1998).
6 Chisholm, C. R. I. Superprotonic Phase Transitions in Solid Acids: Parameters affecting
the presence and stability of superprotonic transitions in the MHnXO4 family of
compounds (X=S, Se, P, As; M=Li, Na, K, NH4, Rb, Cs) Ph.D thesis, California Institute
of Technology, (2002).


![[thesis.library.caltech.edu] - Welcome to …thesis.library.caltech.edu/7076/1/Frydman_Thesis2012.pdfTitle Microsoft Word - Frydman_Thesis2012.docx](https://img.pdfslide.net/doc/110x75/5b2f75657f8b9a55208ceae1/-welcome-to-microsoft-word-frydmanthesis2012docx.jpg)