Embed Size (px)
Citation preview
Brookfield Property Partners L.P. NYSE: BPY TSX: BPY.UN
Supplemental Information For the quarter ended December 31
20
14
1
Brookfield Property Partners L.P.
FORWARD-LOOKING STATEMENTS
This supplemental information package contains “forward-looking information” within the meaning of Canadian provincial securities laws and applicable regulations and forward-looking statements within the meaning of “safe harbor” provisions of the United States Private Securities Litigation Reform Act of 1995. Forward-looking statements include statements that are predictive in nature, depend upon or refer to future events or conditions, include statements regarding our operations, business, financial condition, expected financial results, performance, prospects, opportunities, priorities, targets, goals, ongoing objectives, strategies and outlook, as well as the outlook for North American and international economies for the current fiscal year and subsequent periods, and include words such as “expects”, “anticipates”, “plans”, “believes”, “estimates”, “seeks”, “intends”, “targets”, “projects”, “forecasts”, “likely”, or negative versions thereof and other similar expressions, or future or conditional verbs such as “may”, “will”, “should”, “would” and “could”.
Although we believe that our anticipated future results, performance or achievements expressed or implied by the forward-looking statements and information are based upon reasonable assumptions and expectations, the reader should not place undue reliance on forward-looking statements and information because they involve known and unknown risks, uncertainties and other factors, many of which are beyond our control, which may cause our actual results, performance or achievements to differ materially from anticipated future results, performance or achievement expressed or implied by such forward-looking statements and information.
Factors that could cause actual results to differ materially from those contemplated or implied by forward-looking statements include, but are not limited to: risks incidental to the ownership and operation of real estate properties including local real estate conditions; the impact or unanticipated impact of general economic, political and market factors in the countries in which we do business; the ability to enter into new leases or renew leases on favourable terms; business competition; dependence on tenants’ financial condition; the use of debt to finance our business; the behavior of financial markets, including fluctuations in interest and foreign exchanges rates; uncertainties of real estate development or redevelopment; global equity and capital markets and the availability of equity and debt financing and refinancing within these markets; risks relating to our insurance coverage; the possible impact of international conflicts and other developments including terrorist acts; potential environmental liabilities; changes in tax laws and other tax related risks; dependence on management personnel; illiquidity of investments; the ability to complete and effectively integrate acquisitions into existing operations and the ability to attain expected benefits therefrom; operational and reputational risks; catastrophic events, such as earthquakes and hurricanes; and other risks and factors detailed from time to time in our documents filed with the securities regulators in Canada and the United States.
We caution that the foregoing list of important factors that may affect future results is not exhaustive. When relying on our forward-looking statements or information, investors and others should carefully consider the foregoing factors and other uncertainties and potential events. Except as required by law, we undertake no obligation to publicly update or revise any forward-looking statements or information, whether written or oral, that may be as a result of new information, future events or otherwise.
CAUTIONARY STATEMENT REGARDING USE OF NON-IFRS ACCOUNTING MEASURES This supplemental information package makes reference to net operating income ("NOI"), funds from operations ("FFO") and Company funds from operations (“Company FFO") on a total and per unit basis. These terms do not have any standardized meaning prescribed by International Financial Reporting Standards as issued by the International Accounting Standards Board ("IFRS") and therefore may not be comparable to similar measures presented by other companies. Brookfield Property Partners L.P. ("BPY" or the "partnership") defines NOI as revenues from commercial and hospitality operations of consolidated properties less direct property expenses. Our definition of FFO includes all of the adjustments that are outlined in the National Association of Real Estate Investment Trusts ("NAREIT") definition of funds from operations, including the exclusion of gains (or losses) from the sale of investment property, the add back of any depreciation and amortization related to real estate assets and the adjustment to reflect our interest in unconsolidated partnerships and joint ventures. In addition to the adjustments prescribed by NAREIT, we also make adjustments to exclude any unrealized fair value gains (or losses) that arise as a result of reporting under IFRS, and income taxes that arise as certain of our subsidiaries are structured as corporations as opposed to real estate investment trusts ("REIT"). These additional adjustments result in an FFO measure that is similar to that which would result if the partnership was organized as a REIT that determined net income in accordance with U.S. generally accepted accounting principles ("U.S. GAAP"), which is the type of organization on which the NAREIT definition is premised. Our FFO measure will differ from other organizations applying the NAREIT definition to the extent of certain differences between the IFRS and U.S. GAAP reporting frameworks, principally related to the recognition of lease termination income, which do not have a significant impact on the FFO measure reported. The partnership uses NOI and FFO to assess its operating results. NOI is important in assessing operating performance and FFO is a widely used measure to analyze real estate. The partnership reconciles FFO to net income attributable to Unitholders (see the glossary of terms for definition) as opposed to cashflow from operating activities as it believes net income attributable to Unitholders is the most comparable measure. Company FFO is defined as FFO before the impact of depreciation and amortization of non-real estate assets, transaction costs, gains (losses) associated with non-investment properties plus the FFO that would have been attributable to the partnership's shares of General Growth Properties, Inc. ("GGP") if all outstanding warrants of GGP were exercised on a cash-less basis. It also includes dilution adjustments to undiluted FFO as a result of the net settled warrants. Refer to last page of this supplemental package for certain definitions.
2
Brookfield Property Partners L.P.
TABLE OF CONTENTS
Page Page
Financial Overview Retail Segment, Cont'd
Current Quarter Highlights 4 Portfolio Summary 34
Income Statement 5 Historical Metrics 35
Balance Sheet 8 Leasing Metrics 36
Components of Net Asset Value 10 Top Tenants 37
Fair Value Continuity 11 Developments 38
Capital Recycling 13 Debt 39
Summary Statement of Cash Flows 14 Other Segments
Office Segment Financial Overview 41
Financial Overview 16 Summary of Industrial Properties 42
Net Operating Income 17 Industrial Developments and Land 43
Summary of Properties 19 Summary of Multi-family and Hotel Properties 44
Historical Occupancy 20 Triple Net Lease Top Tenants 45
Historical Rents 21 Debt 46
Leasing Activity 22 Corporate
Lease Expiry Analysis 24 Financial Overview 48
Top Tenants 25 Liquidity 49
Development Sites 26 Proportionate Debt Summary 50
Debt 27 Foreign Currency Hedge Position 51
Capital Expenditures 30 Capital Securities & Preferred Equity 52
Retail Segment Per Unit Information 53
Financial Overview 32 Unit Information 54
Net Operating Income 33 Glossary of Terms 55

Financial Overview
4
Brookfield Property Partners L.P.
Financial Overview CURRENT QUARTER HIGHLIGHTS
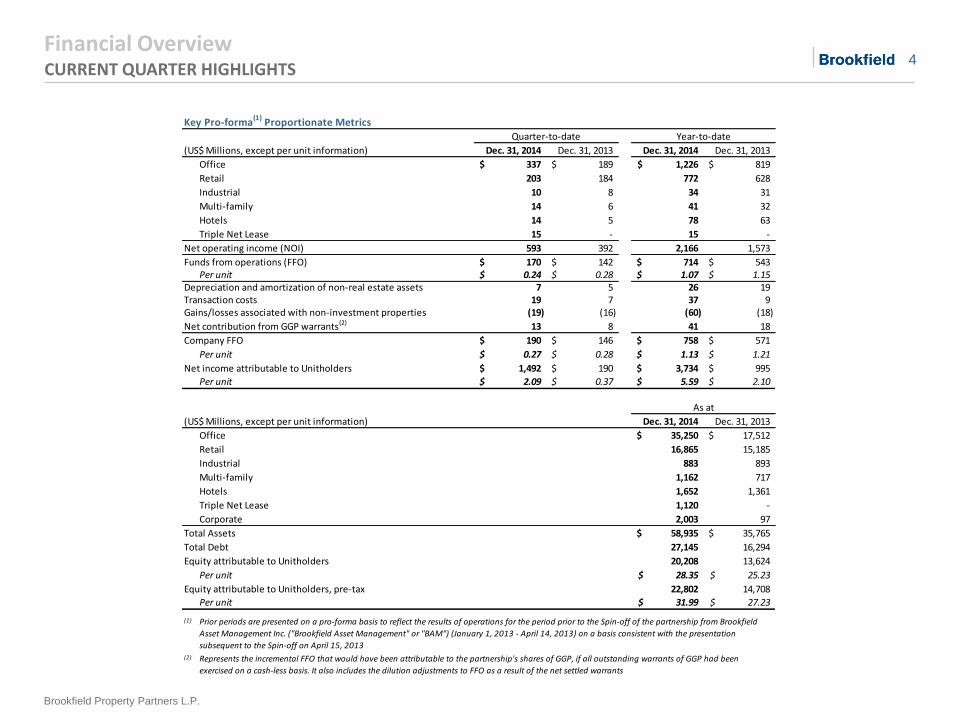
Key Pro-forma(1)
Proportionate Metrics
(US$ Millions, except per unit information) Dec. 31, 2014 Dec. 31, 2013 Dec. 31, 2014 Dec. 31, 2013
Office 337$ 189$ 1,226$ 819$
Retail 203 184 772 628
Industrial 10 8 34 31
Multi-family 14 6 41 32
Hotels 14 5 78 63
Triple Net Lease 15 - 15 -
Net operating income (NOI) 593 392 2,166 1,573
Funds from operations (FFO) 170$ 142$ 714$ 543$ Per unit 0.24$ 0.28$ 1.07$ 1.15$
Depreciation and amortization of non-real estate assets 7 5 26 19 Transaction costs 19 7 37 9 Gains/losses associated with non-investment properties (19) (16) (60) (18)
Net contribution from GGP warrants(2) 13 8 41 18
Company FFO 190$ 146$ 758$ 571$
Per unit 0.27$ 0.28$ 1.13$ 1.21$
Net income attributable to Unitholders 1,492$ 190$ 3,734$ 995$
Per unit 2.09$ 0.37$ 5.59$ 2.10$
(US$ Millions, except per unit information) Dec. 31, 2014 Dec. 31, 2013
Office 35,250$ 17,512$
Retail 16,865 15,185
Industrial 883 893
Multi-family 1,162 717
Hotels 1,652 1,361
Triple Net Lease 1,120 -
Corporate 2,003 97
Total Assets 58,935$ 35,765$
Total Debt 27,145 16,294
Equity attributable to Unitholders 20,208 13,624
Per unit 28.35$ 25.23$
Equity attributable to Unitholders, pre-tax 22,802 14,708
Per unit 31.99$ 27.23$
(1)
(2)
Year-to-dateQuarter-to-date
As at
Represents the incremental FFO that would have been attributable to the partnership's shares of GGP, if all outstanding warrants of GGP had been
exercised on a cash-less basis. It also includes the dilution adjustments to FFO as a result of the net settled warrants
Prior periods are presented on a pro-forma basis to reflect the results of operations for the period prior to the Spin-off of the partnership from Brookfield
Asset Management Inc. ("Brookfield Asset Management" or "BAM") (January 1, 2013 - April 14, 2013) on a basis consistent with the presentation
subsequent to the Spin-off on April 15, 2013
5
Brookfield Property Partners L.P.
Financial Overview INCOME STATEMENT
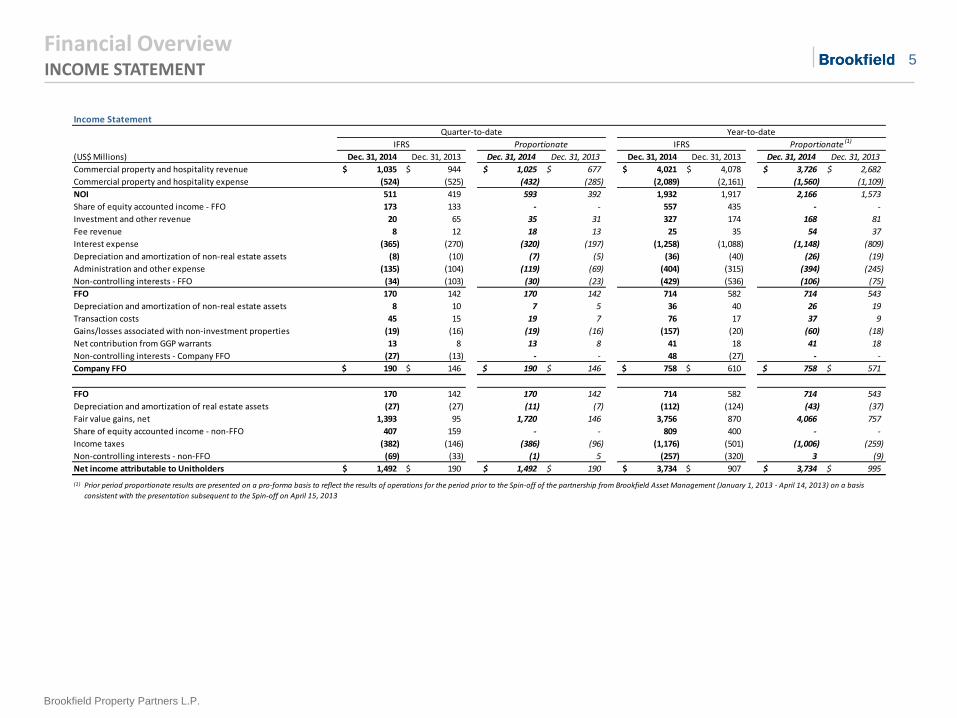
Income Statement
(US$ Millions) Dec. 31, 2014 Dec. 31, 2013 Dec. 31, 2014 Dec. 31, 2013 Dec. 31, 2014 Dec. 31, 2013 Dec. 31, 2014 Dec. 31, 2013
Commercial property and hospitality revenue 1,035$ 944$ 1,025$ 677$ 4,021$ 4,078$ 3,726$ 2,682$
Commercial property and hospitality expense (524) (525) (432) (285) (2,089) (2,161) (1,560) (1,109)
NOI 511 419 593 392 1,932 1,917 2,166 1,573
Share of equity accounted income - FFO 173 133 - - 557 435 - -
Investment and other revenue 20 65 35 31 327 174 168 81
Fee revenue 8 12 18 13 25 35 54 37
Interest expense (365) (270) (320) (197) (1,258) (1,088) (1,148) (809)
Depreciation and amortization of non-real estate assets (8) (10) (7) (5) (36) (40) (26) (19)
Administration and other expense (135) (104) (119) (69) (404) (315) (394) (245)
Non-controlling interests - FFO (34) (103) (30) (23) (429) (536) (106) (75)
FFO 170 142 170 142 714 582 714 543
Depreciation and amortization of non-real estate assets 8 10 7 5 36 40 26 19
Transaction costs 45 15 19 7 76 17 37 9
Gains/losses associated with non-investment properties (19) (16) (19) (16) (157) (20) (60) (18)
Net contribution from GGP warrants 13 8 13 8 41 18 41 18
Non-controlling interests - Company FFO (27) (13) - - 48 (27) - -
Company FFO 190$ 146$ 190$ 146$ 758$ 610$ 758$ 571$
FFO 170 142 170 142 714 582 714 543
Depreciation and amortization of real estate assets (27) (27) (11) (7) (112) (124) (43) (37)
Fair value gains, net 1,393 95 1,720 146 3,756 870 4,066 757
Share of equity accounted income - non-FFO 407 159 - - 809 400 - -
Income taxes (382) (146) (386) (96) (1,176) (501) (1,006) (259)
Non-controlling interests - non-FFO (69) (33) (1) 5 (257) (320) 3 (9)
Net income attributable to Unitholders 1,492$ 190$ 1,492$ 190$ 3,734$ 907$ 3,734$ 995$
(1)
Quarter-to-date Year-to-date
IFRS Proportionate IFRS Proportionate (1)
Prior period proportionate results are presented on a pro-forma basis to reflect the results of operations for the period prior to the Spin-off of the partnership from Brookfield Asset Management (January 1, 2013 - April 14, 2013) on a basis
consistent with the presentation subsequent to the Spin-off on April 15, 2013
6
Brookfield Property Partners L.P.
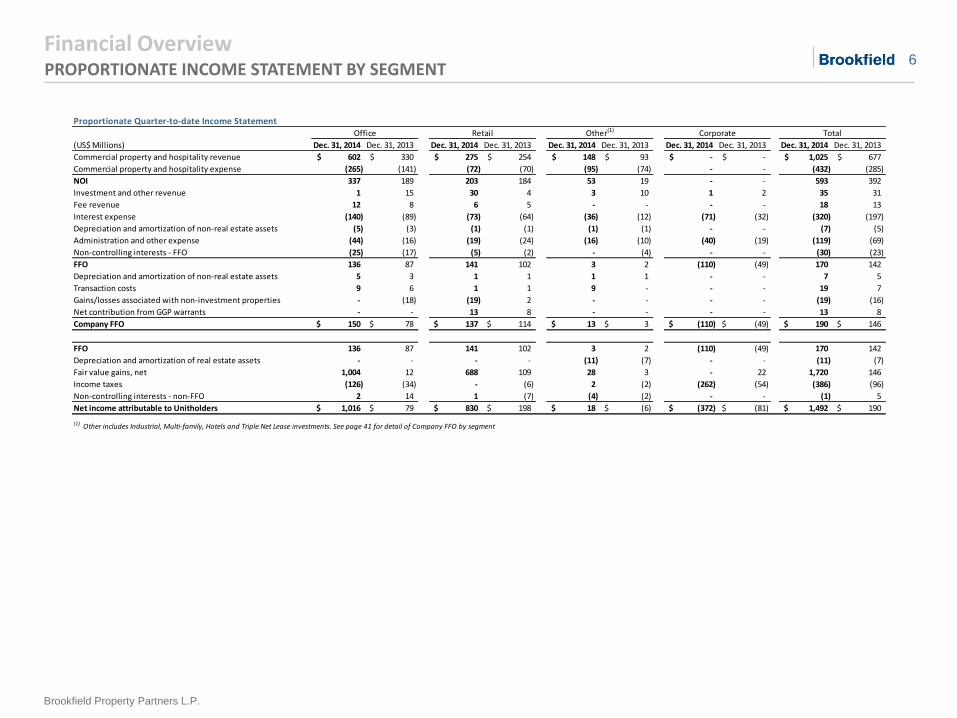
Financial Overview PROPORTIONATE INCOME STATEMENT BY SEGMENT
Proportionate Quarter-to-date Income Statement
(US$ Millions) Dec. 31, 2014 Dec. 31, 2013 Dec. 31, 2014 Dec. 31, 2013 Dec. 31, 2014 Dec. 31, 2013 Dec. 31, 2014 Dec. 31, 2013 Dec. 31, 2014 Dec. 31, 2013
Commercial property and hospitality revenue 602$ 330$ 275$ 254$ 148$ 93$ -$ -$ 1,025$ 677$
Commercial property and hospitality expense (265) (141) (72) (70) (95) (74) - - (432) (285)
NOI 337 189 203 184 53 19 - - 593 392
Investment and other revenue 1 15 30 4 3 10 1 2 35 31
Fee revenue 12 8 6 5 - - - - 18 13
Interest expense (140) (89) (73) (64) (36) (12) (71) (32) (320) (197)
Depreciation and amortization of non-real estate assets (5) (3) (1) (1) (1) (1) - - (7) (5)
Administration and other expense (44) (16) (19) (24) (16) (10) (40) (19) (119) (69)
Non-controlling interests - FFO (25) (17) (5) (2) - (4) - - (30) (23)
FFO 136 87 141 102 3 2 (110) (49) 170 142
Depreciation and amortization of non-real estate assets 5 3 1 1 1 1 - - 7 5
Transaction costs 9 6 1 1 9 - - - 19 7
Gains/losses associated with non-investment properties - (18) (19) 2 - - - - (19) (16)
Net contribution from GGP warrants - - 13 8 - - - - 13 8
Company FFO 150$ 78$ 137$ 114$ 13$ 3$ (110)$ (49)$ 190$ 146$
FFO 136 87 141 102 3 2 (110) (49) 170 142
Depreciation and amortization of real estate assets - - - - (11) (7) - - (11) (7)
Fair value gains, net 1,004 12 688 109 28 3 - 22 1,720 146
Income taxes (126) (34) - (6) 2 (2) (262) (54) (386) (96)
2 14 1 (7) (4) (2) - - (1) 5
Net income attributable to Unitholders 1,016$ 79$ 830$ 198$ 18$ (6)$ (372)$ (81)$ 1,492$ 190$
(1) Other includes Industrial, Multi-family, Hotels and Triple Net Lease investments. See page 41 for detail of Company FFO by segment
Office
Non-controlling interests - non-FFO
TotalOther(1) CorporateRetail
7
Brookfield Property Partners L.P.
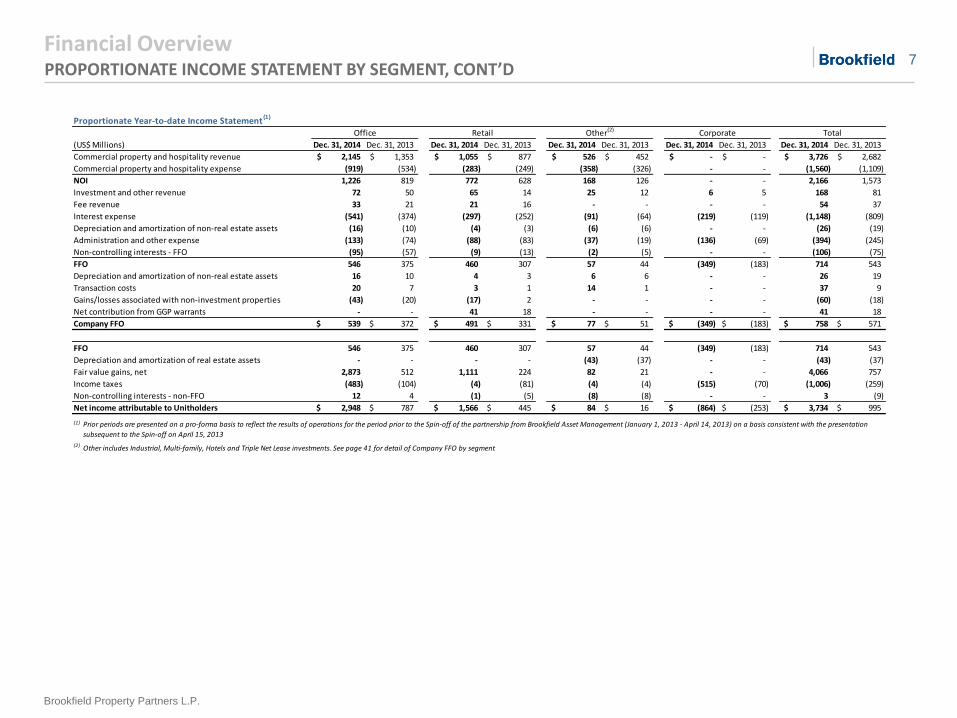
Financial Overview PROPORTIONATE INCOME STATEMENT BY SEGMENT, CONT’D
Proportionate Year-to-date Income Statement (1)
(US$ Millions) Dec. 31, 2014 Dec. 31, 2013 Dec. 31, 2014 Dec. 31, 2013 Dec. 31, 2014 Dec. 31, 2013 Dec. 31, 2014 Dec. 31, 2013 Dec. 31, 2014 Dec. 31, 2013
Commercial property and hospitality revenue 2,145$ 1,353$ 1,055$ 877$ 526$ 452$ -$ -$ 3,726$ 2,682$
Commercial property and hospitality expense (919) (534) (283) (249) (358) (326) - - (1,560) (1,109)
NOI 1,226 819 772 628 168 126 - - 2,166 1,573
Investment and other revenue 72 50 65 14 25 12 6 5 168 81
Fee revenue 33 21 21 16 - - - - 54 37
Interest expense (541) (374) (297) (252) (91) (64) (219) (119) (1,148) (809)
Depreciation and amortization of non-real estate assets (16) (10) (4) (3) (6) (6) - - (26) (19)
Administration and other expense (133) (74) (88) (83) (37) (19) (136) (69) (394) (245)
Non-controlling interests - FFO (95) (57) (9) (13) (2) (5) - - (106) (75)
FFO 546 375 460 307 57 44 (349) (183) 714 543
Depreciation and amortization of non-real estate assets 16 10 4 3 6 6 - - 26 19
Transaction costs 20 7 3 1 14 1 - - 37 9
Gains/losses associated with non-investment properties (43) (20) (17) 2 - - - - (60) (18)
Net contribution from GGP warrants - - 41 18 - - - - 41 18
Company FFO 539$ 372$ 491$ 331$ 77$ 51$ (349)$ (183)$ 758$ 571$
FFO 546 375 460 307 57 44 (349) (183) 714 543
Depreciation and amortization of real estate assets - - - - (43) (37) - - (43) (37)
Fair value gains, net 2,873 512 1,111 224 82 21 - - 4,066 757
Income taxes (483) (104) (4) (81) (4) (4) (515) (70) (1,006) (259)
12 4 (1) (5) (8) (8) - - 3 (9)
Net income attributable to Unitholders 2,948$ 787$ 1,566$ 445$ 84$ 16$ (864)$ (253)$ 3,734$ 995$
(1)
(2) Other includes Industrial, Multi-family, Hotels and Triple Net Lease investments. See page 41 for detail of Company FFO by segment
Corporate TotalOffice Retail
Prior periods are presented on a pro-forma basis to reflect the results of operations for the period prior to the Spin-off of the partnership from Brookfield Asset Management (January 1, 2013 - April 14, 2013) on a basis consistent with the presentation
subsequent to the Spin-off on April 15, 2013
Other(2)
Non-controlling interests - non-FFO
8
Brookfield Property Partners L.P.
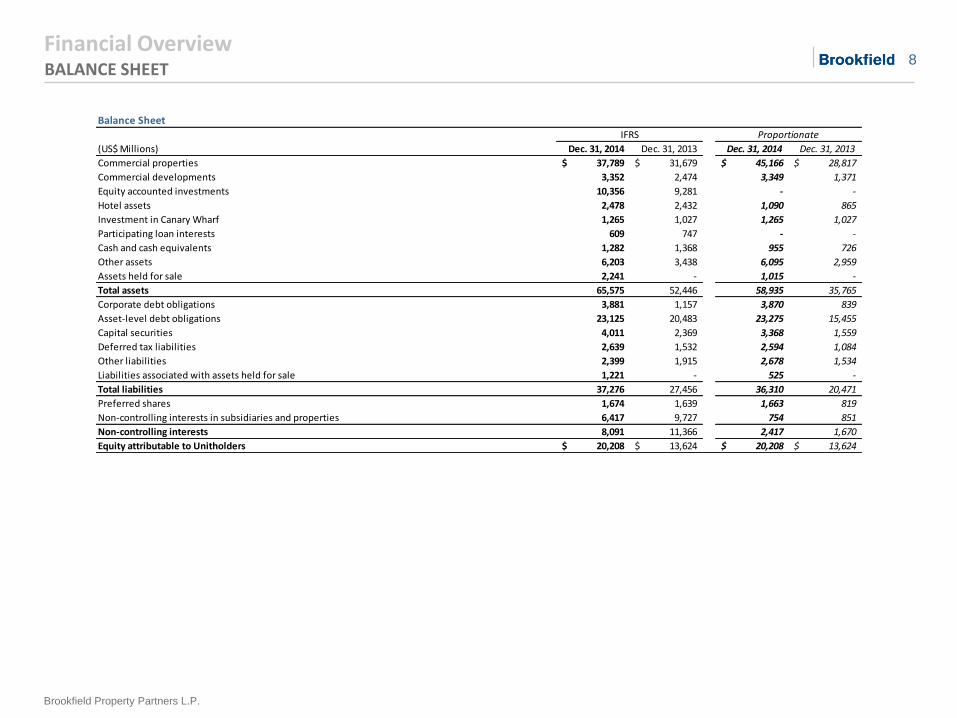
Financial Overview BALANCE SHEET
Balance Sheet
(US$ Millions) Dec. 31, 2014 Dec. 31, 2013 Dec. 31, 2014 Dec. 31, 2013
Commercial properties 37,789$ 31,679$ 45,166$ 28,817$
Commercial developments 3,352 2,474 3,349 1,371
Equity accounted investments 10,356 9,281 - -
Hotel assets 2,478 2,432 1,090 865
Investment in Canary Wharf 1,265 1,027 1,265 1,027
Participating loan interests 609 747 - -
Cash and cash equivalents 1,282 1,368 955 726
Other assets 6,203 3,438 6,095 2,959
Assets held for sale 2,241 - 1,015 -
Total assets 65,575 52,446 58,935 35,765
Corporate debt obligations 3,881 1,157 3,870 839
Asset-level debt obligations 23,125 20,483 23,275 15,455
Capital securities 4,011 2,369 3,368 1,559
Deferred tax liabilities 2,639 1,532 2,594 1,084
Other liabilities 2,399 1,915 2,678 1,534
Liabilities associated with assets held for sale 1,221 - 525 -
Total liabilities 37,276 27,456 36,310 20,471
Preferred shares 1,674 1,639 1,663 819
Non-controlling interests in subsidiaries and properties 6,417 9,727 754 851
Non-controlling interests 8,091 11,366 2,417 1,670
Equity attributable to Unitholders 20,208$ 13,624$ 20,208$ 13,624$
ProportionateIFRS
9
Brookfield Property Partners L.P.
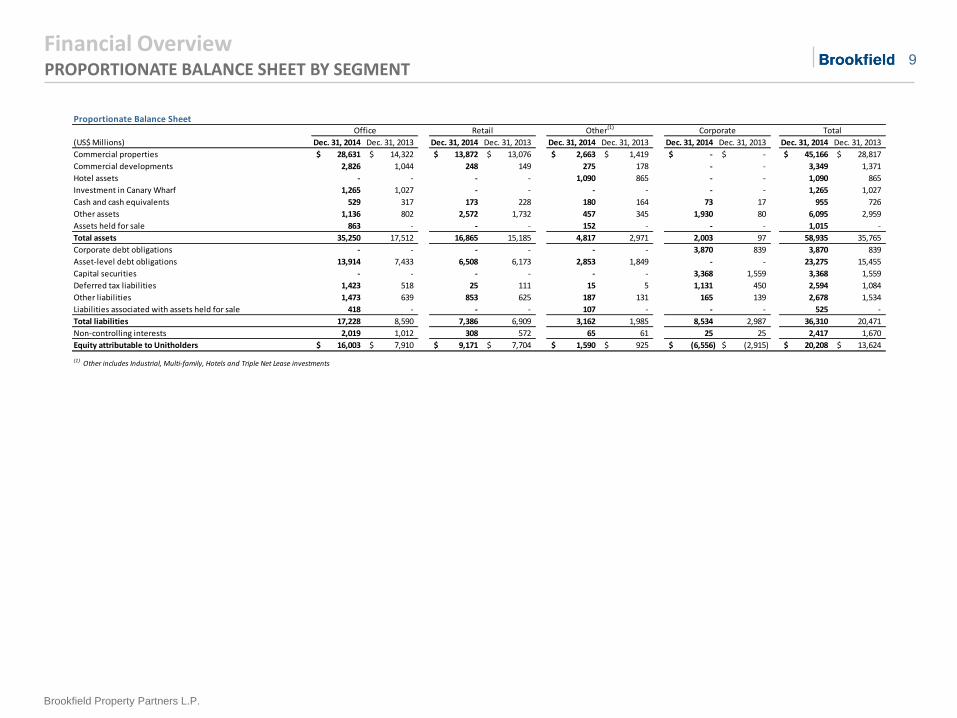
Financial Overview PROPORTIONATE BALANCE SHEET BY SEGMENT
Proportionate Balance Sheet
(US$ Millions) Dec. 31, 2014 Dec. 31, 2013 Dec. 31, 2014 Dec. 31, 2013 Dec. 31, 2014 Dec. 31, 2013 Dec. 31, 2014 Dec. 31, 2013 Dec. 31, 2014 Dec. 31, 2013
Commercial properties 28,631$ 14,322$ 13,872$ 13,076$ 2,663$ 1,419$ -$ -$ 45,166$ 28,817$
Commercial developments 2,826 1,044 248 149 275 178 - - 3,349 1,371
Hotel assets - - - - 1,090 865 - - 1,090 865
Investment in Canary Wharf 1,265 1,027 - - - - - - 1,265 1,027
Cash and cash equivalents 529 317 173 228 180 164 73 17 955 726
Other assets 1,136 802 2,572 1,732 457 345 1,930 80 6,095 2,959
Assets held for sale 863 - - - 152 - - - 1,015 -
Total assets 35,250 17,512 16,865 15,185 4,817 2,971 2,003 97 58,935 35,765
Corporate debt obligations - - - - - - 3,870 839 3,870 839
Asset-level debt obligations 13,914 7,433 6,508 6,173 2,853 1,849 - - 23,275 15,455
Capital securities - - - - - - 3,368 1,559 3,368 1,559
Deferred tax liabilities 1,423 518 25 111 15 5 1,131 450 2,594 1,084
Other liabilities 1,473 639 853 625 187 131 165 139 2,678 1,534
Liabilities associated with assets held for sale 418 - - - 107 - - - 525 -
Total liabilities 17,228 8,590 7,386 6,909 3,162 1,985 8,534 2,987 36,310 20,471
Non-controlling interests 2,019 1,012 308 572 65 61 25 25 2,417 1,670
Equity attributable to Unitholders 16,003$ 7,910$ 9,171$ 7,704$ 1,590$ 925$ (6,556)$ (2,915)$ 20,208$ 13,624$
(1) Other includes Industrial, Multi-family, Hotels and Triple Net Lease investments
TotalRetailOffice CorporateOther(1)
10
Brookfield Property Partners L.P.
Financial Overview COMPONENTS OF NET ASSET VALUE
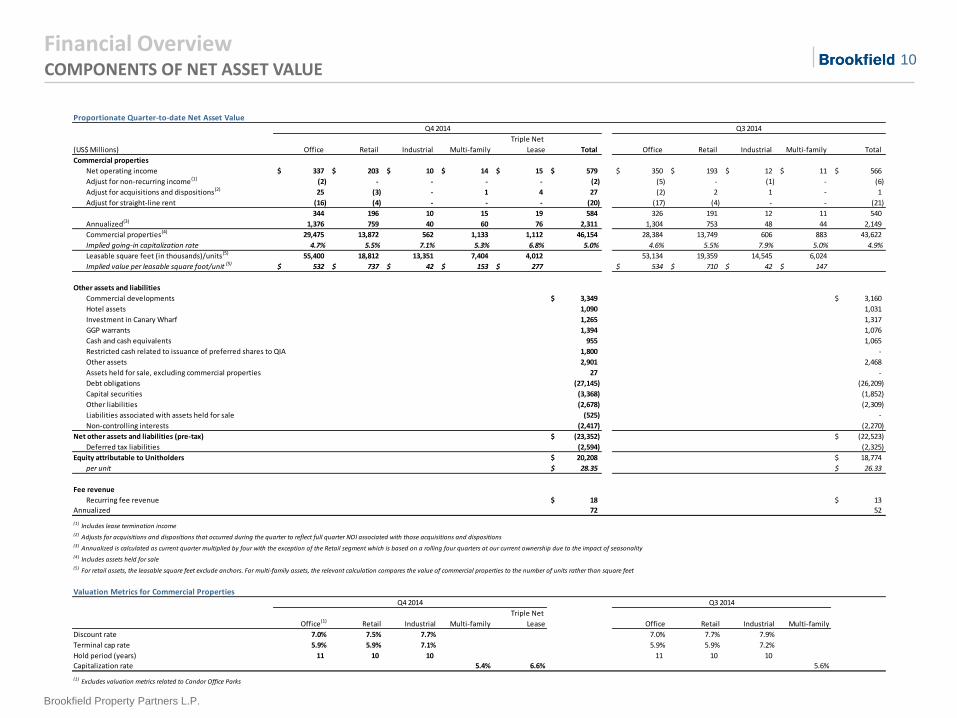
Proportionate Quarter-to-date Net Asset Value
(US$ Millions) Office Retail Industrial Multi-family
Triple Net
Lease Total Office Retail Industrial Multi-family Total
Commercial properties
Net operating income 337$ 203$ 10$ 14$ 15$ 579$ 350$ 193$ 12$ 11$ 566$
Adjust for non-recurring income (1) (2) - - - - (2) (5) - (1) - (6)
Adjust for acquisitions and dispositions(2) 25 (3) - 1 4 27 (2) 2 1 - 1
Adjust for straight-line rent (16) (4) - - - (20) (17) (4) - - (21)
344 196 10 15 19 584 326 191 12 11 540
Annualized(3) 1,376 759 40 60 76 2,311 1,304 753 48 44 2,149
Commercial properties(4) 29,475 13,872 562 1,133 1,112 46,154 28,384 13,749 606 883 43,622
Implied going-in capitalization rate 4.7% 5.5% 7.1% 5.3% 6.8% 5.0% 4.6% 5.5% 7.9% 5.0% 4.9%
Leasable square feet (in thousands)/units(5) 55,400 18,812 13,351 7,404 4,012 53,134 19,359 14,545 6,024
Implied value per leasable square foot/unit (5) 532$ 737$ 42$ 153$ 277$ 534$ 710$ 42$ 147$
Other assets and liabilities
Commercial developments 2,826$ 248$ 205$ 70$ -$ 3,349$ 3,160$
Hotel assets 1,090 1,031
Investment in Canary Wharf 1,265 1,317
GGP warrants 1,394 1,076
Cash and cash equivalents 955 1,065
Restricted cash related to issuance of preferred shares to QIA 1,800 -
Other assets 2,901 2,468
Assets held for sale, excluding commercial properties 27 -
Debt obligations (27,145) (26,209)
Capital securities (3,368) (1,852)
Other liabilities (2,678) (2,309)
Liabilities associated with assets held for sale (525) -
Non-controlling interests (2,417) (2,270)
Net other assets and liabilities (pre-tax) (23,352)$ (22,523)$
Deferred tax liabilities (2,594) (2,325)
Equity attributable to Unitholders 20,208$ 18,774$
per unit 28.35$ 26.33$
Fee revenue
Recurring fee revenue 12$ 6$ -$ -$ -$ 18$ 13$
Annualized 72 52
(1) Includes lease termination income(2) Adjusts for acquisitions and dispositions that occurred during the quarter to reflect full quarter NOI associated with those acquisitions and dispositions(3) Annualized is calculated as current quarter multiplied by four with the exception of the Retail segment which is based on a rolling four quarters at our current ownership due to the impact of seasonality(4) Includes assets held for sale(5) For retail assets, the leasable square feet exclude anchors. For multi-family assets, the relevant calculation compares the value of commercial properties to the number of units rather than square feet
Valuation Metrics for Commercial Properties
Office(1) Retail Industrial Multi-family
Triple Net
Lease Office Retail Industrial Multi-family
Discount rate 7.0% 7.5% 7.7% 7.0% 7.7% 7.9%
Terminal cap rate 5.9% 5.9% 7.1% 5.9% 5.9% 7.2%
Hold period (years) 11 10 10 11 10 10
Capitalization rate 5.4% 6.6% 5.6%
(1) Excludes valuation metrics related to Candor Office Parks
Q3 2014Q4 2014
Q3 2014Q4 2014
11
Brookfield Property Partners L.P.
Financial Overview FAIR VALUE CONTINUITY
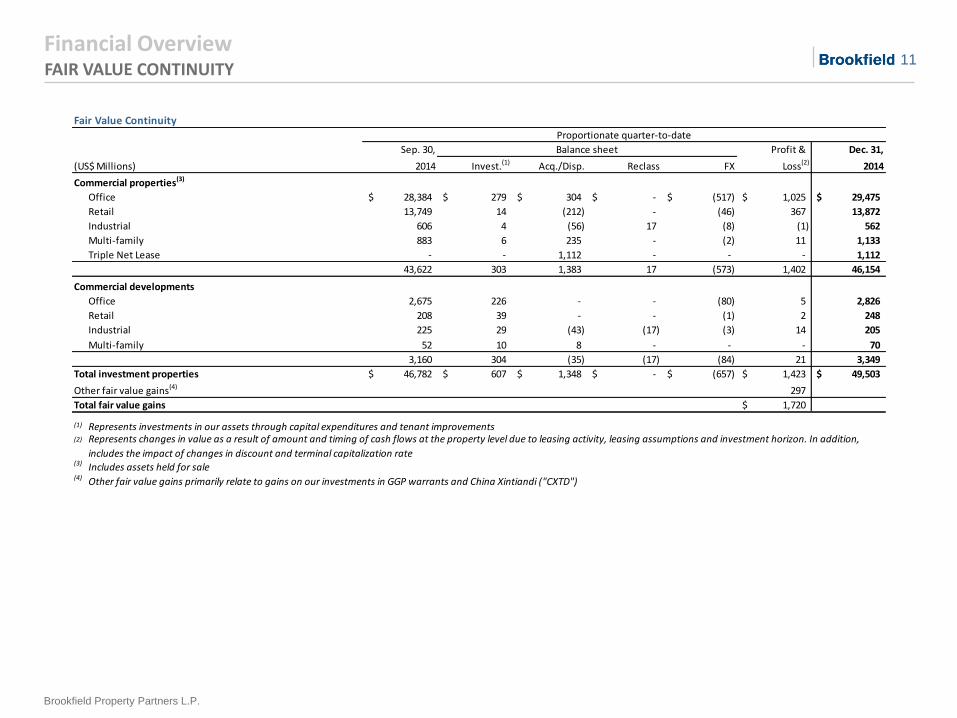
Fair Value Continuity
Sep. 30, Profit & Dec. 31,
(US$ Millions) 2014 Invest.(1) Acq./Disp. Reclass FX Loss(2) 2014
Commercial properties(3)
Office 28,384$ 279$ 304$ -$ (517)$ 1,025$ 29,475$
Retail 13,749 14 (212) - (46) 367 13,872
Industrial 606 4 (56) 17 (8) (1) 562
Multi-family 883 6 235 - (2) 11 1,133
Triple Net Lease - - 1,112 - - - 1,112
43,622 303 1,383 17 (573) 1,402 46,154
Commercial developments
Office 2,675 226 - - (80) 5 2,826
Retail 208 39 - - (1) 2 248
Industrial 225 29 (43) (17) (3) 14 205
Multi-family 52 10 8 - - - 70
3,160 304 (35) (17) (84) 21 3,349
Total investment properties 46,782$ 607$ 1,348$ -$ (657)$ 1,423$ 49,503$
Other fair value gains(4) 297
Total fair value gains 1,720$
(1) Represents investments in our assets through capital expenditures and tenant improvements(2)
(3) Includes assets held for sale(4) Other fair value gains primarily relate to gains on our investments in GGP warrants and China Xintiandi ("CXTD")
Proportionate quarter-to-date
Balance sheet
Represents changes in value as a result of amount and timing of cash flows at the property level due to leasing activity, leasing assumptions and investment horizon. In addition,
includes the impact of changes in discount and terminal capitalization rate
12
Brookfield Property Partners L.P.
Financial Overview FAIR VALUE CONTINUITY, CONT’D
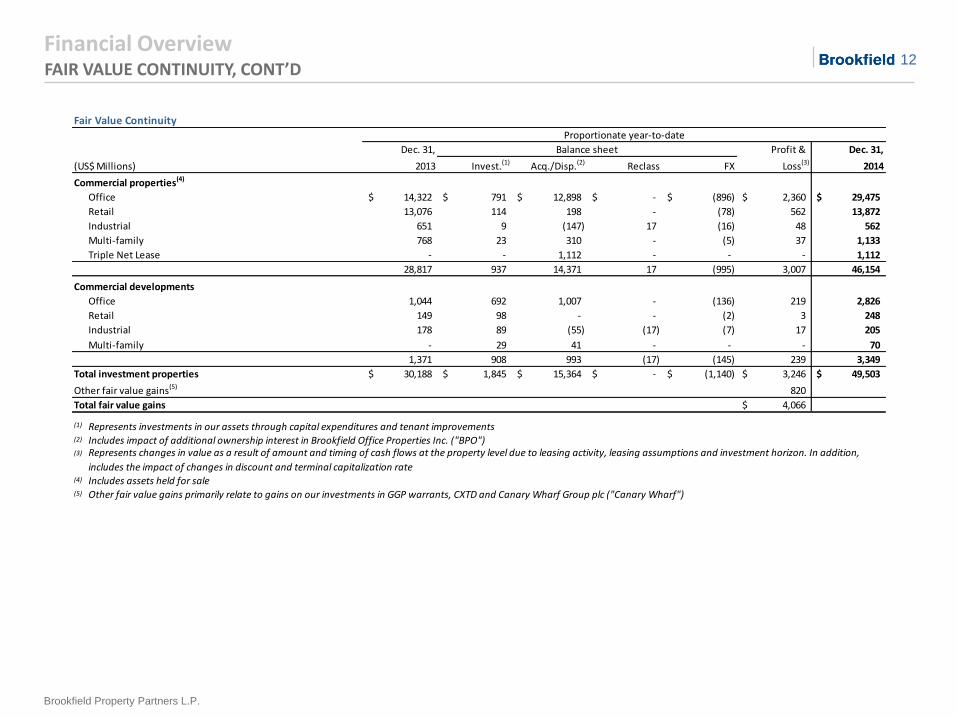
Fair Value Continuity
Dec. 31, Profit & Dec. 31,
(US$ Millions) 2013 Invest.(1) Acq./Disp.(2) Reclass FX Loss(3) 2014
Commercial properties(4)
Office 14,322$ 791$ 12,898$ -$ (896)$ 2,360$ 29,475$
Retail 13,076 114 198 - (78) 562 13,872
Industrial 651 9 (147) 17 (16) 48 562
Multi-family 768 23 310 - (5) 37 1,133
Triple Net Lease - - 1,112 - - - 1,112
28,817 937 14,371 17 (995) 3,007 46,154
Commercial developments
Office 1,044 692 1,007 - (136) 219 2,826
Retail 149 98 - - (2) 3 248
Industrial 178 89 (55) (17) (7) 17 205
Multi-family - 29 41 - - - 70
1,371 908 993 (17) (145) 239 3,349
Total investment properties 30,188$ 1,845$ 15,364$ -$ (1,140)$ 3,246$ 49,503$
Other fair value gains(5) 820
Total fair value gains 4,066$
(1) Represents investments in our assets through capital expenditures and tenant improvements(2) Includes impact of additional ownership interest in Brookfield Office Properties Inc. ("BPO")(3)
(4) Includes assets held for sale(5) Other fair value gains primarily relate to gains on our investments in GGP warrants, CXTD and Canary Wharf Group plc ("Canary Wharf")
Proportionate year-to-date
Balance sheet
Represents changes in value as a result of amount and timing of cash flows at the property level due to leasing activity, leasing assumptions and investment horizon. In addition,
includes the impact of changes in discount and terminal capitalization rate
13
Brookfield Property Partners L.P.
Financial Overview CAPITAL RECYCLING
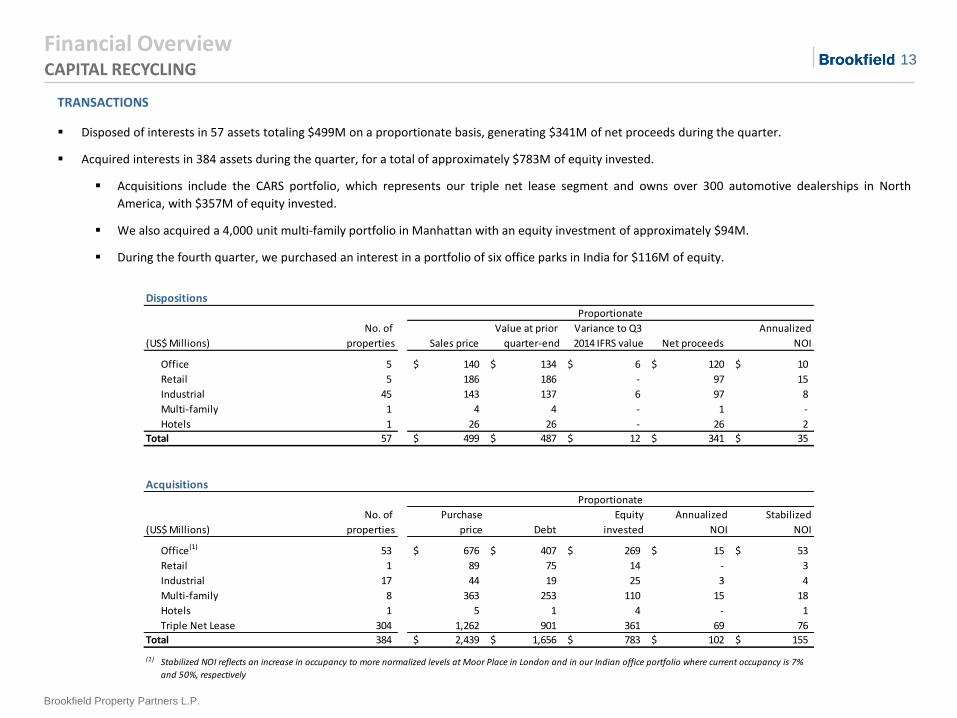
TRANSACTIONS
Disposed of interests in 57 assets totaling $499M on a proportionate basis, generating $341M of net proceeds during the quarter.
Acquired interests in 384 assets during the quarter, for a total of approximately $783M of equity invested.
Acquisitions include the CARS portfolio, which represents our triple net lease segment and owns over 300 automotive dealerships in North
America, with $357M of equity invested.
We also acquired a 4,000 unit multi-family portfolio in Manhattan with an equity investment of approximately $94M.
During the fourth quarter, we purchased an interest in a portfolio of six office parks in India for $116M of equity.
Dispositions
(US$ Millions) Sales price
Value at prior
quarter-end
Variance to Q3
2014 IFRS value Net proceeds
Annualized
NOI
Office 5 140$ 134$ 6$ 120$ 10$
Retail 5 186 186 - 97 15
Industrial 45 143 137 6 97 8
Multi-family 1 4 4 - 1 -
Hotels 1 26 26 - 26 2
Total 57 499$ 487$ 12$ 341$ 35$
Acquisitions
(US$ Millions)
Purchase
price Debt
Equity
invested
Annualized
NOI
Stabilized
NOI
Office(1) 53 676$ 407$ 269$ 15$ 53$
Retail 1 89 75 14 - 3
Industrial 17 44 19 25 3 4
Multi-family 8 363 253 110 15 18
Hotels 1 5 1 4 - 1
Triple Net Lease 304 1,262 901 361 69 76
Total 384 2,439$ 1,656$ 783$ 102$ 155$
(1) Stabilized NOI reflects an increase in occupancy to more normalized levels at Moor Place in London and in our Indian office portfolio where current occupancy is 7%
and 50%, respectively
Proportionate
Proportionate
No. of
properties
No. of
properties
14
Brookfield Property Partners L.P.
Financial Overview SUMMARY STATEMENT OF CASH FLOWS
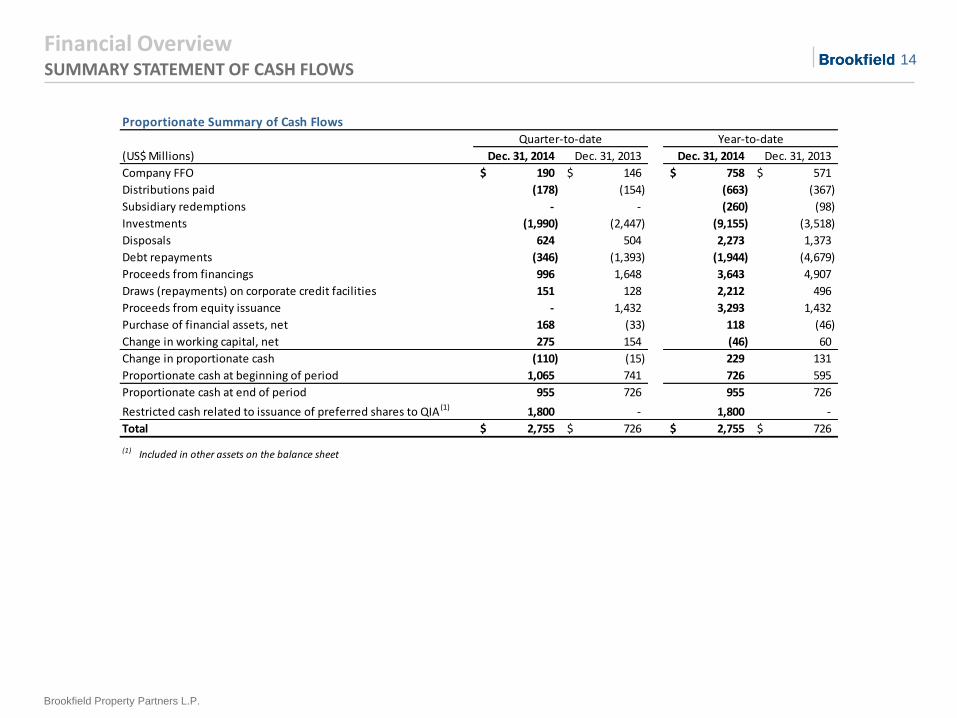
Proportionate Summary of Cash Flows
(US$ Millions) Dec. 31, 2014 Dec. 31, 2013 Dec. 31, 2014 Dec. 31, 2013
Company FFO 190$ 146$ 758$ 571$
Distributions paid (178) (154) (663) (367)
Subsidiary redemptions - - (260) (98)
Investments (1,990) (2,447) (9,155) (3,518)
Disposals 624 504 2,273 1,373
Debt repayments (346) (1,393) (1,944) (4,679)
Proceeds from financings 996 1,648 3,643 4,907
Draws (repayments) on corporate credit facilities 151 128 2,212 496
Proceeds from equity issuance - 1,432 3,293 1,432
Purchase of financial assets, net 168 (33) 118 (46)
Change in working capital, net 275 154 (46) 60
Change in proportionate cash (110) (15) 229 131
Proportionate cash at beginning of period 1,065 741 726 595
Proportionate cash at end of period 955 726 955 726
Restricted cash related to issuance of preferred shares to QIA (1) 1,800 - 1,800 -
Total 2,755$ 726$ 2,755$ 726$
(1) Included in other assets on the balance sheet
Quarter-to-date Year-to-date
Office Segment
16
Brookfield Property Partners L.P.
Office Segment
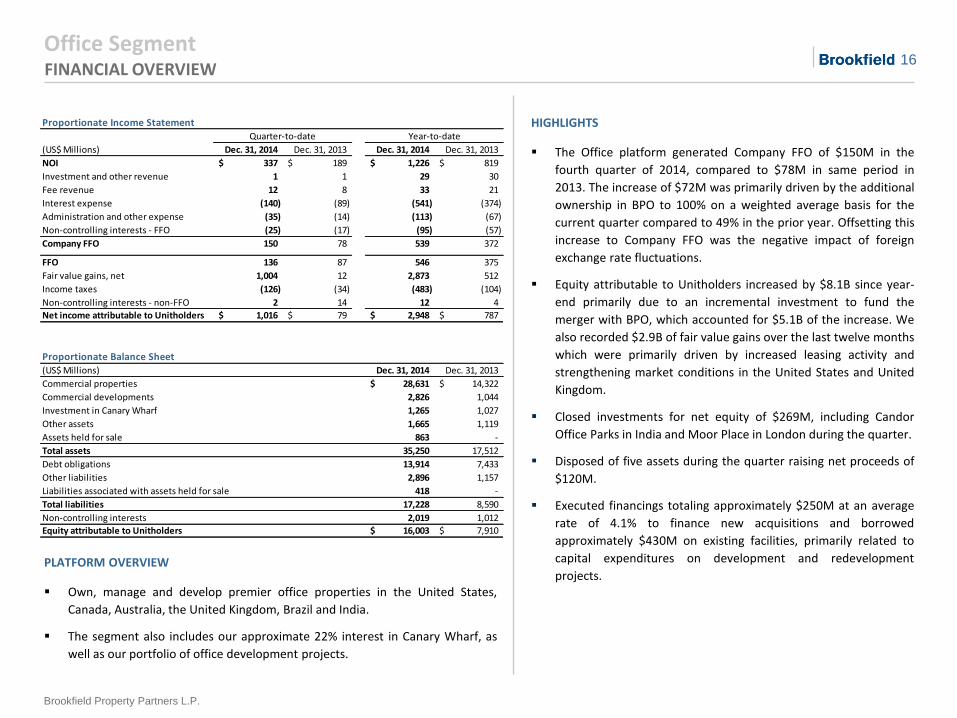
HIGHLIGHTS
The Office platform generated Company FFO of $150M in the
fourth quarter of 2014, compared to $78M in same period in
2013. The increase of $72M was primarily driven by the additional
ownership in BPO to 100% on a weighted average basis for the
current quarter compared to 49% in the prior year. Offsetting this
increase to Company FFO was the negative impact of foreign
exchange rate fluctuations.
Equity attributable to Unitholders increased by $8.1B since year-
end primarily due to an incremental investment to fund the
merger with BPO, which accounted for $5.1B of the increase. We
also recorded $2.9B of fair value gains over the last twelve months
which were primarily driven by increased leasing activity and
strengthening market conditions in the United States and United
Kingdom.
Closed investments for net equity of $269M, including Candor
Office Parks in India and Moor Place in London during the quarter.
Disposed of five assets during the quarter raising net proceeds of
$120M.
Executed financings totaling approximately $250M at an average
rate of 4.1% to finance new acquisitions and borrowed
approximately $430M on existing facilities, primarily related to
capital expenditures on development and redevelopment
projects.
FINANCIAL OVERVIEW
PLATFORM OVERVIEW
Own, manage and develop premier office properties in the United States,
Canada, Australia, the United Kingdom, Brazil and India.
The segment also includes our approximate 22% interest in Canary Wharf, as
well as our portfolio of office development projects.
Proportionate Income Statement
(US$ Millions) Dec. 31, 2014 Dec. 31, 2013 Dec. 31, 2014 Dec. 31, 2013
NOI 337$ 189$ 1,226$ 819$
Investment and other revenue 1 1 29 30
Fee revenue 12 8 33 21
Interest expense (140) (89) (541) (374)
Administration and other expense (35) (14) (113) (67)
Non-controlling interests - FFO (25) (17) (95) (57)
Company FFO 150 78 539 372
FFO 136 87 546 375
Fair value gains, net 1,004 12 2,873 512
Income taxes (126) (34) (483) (104)
Non-controlling interests - non-FFO 2 14 12 4
Net income attributable to Unitholders 1,016$ 79$ 2,948$ 787$
Proportionate Balance Sheet(US$ Millions) Dec. 31, 2014 Dec. 31, 2013
Commercial properties 28,631$ 14,322$
Commercial developments 2,826 1,044
Investment in Canary Wharf 1,265 1,027
Other assets 1,665 1,119
Assets held for sale 863 -
Total assets 35,250 17,512
Debt obligations 13,914 7,433
Other liabilities 2,896 1,157
Liabilities associated with assets held for sale 418 -
Total liabilities 17,228 8,590
Non-controlling interests 2,019 1,012
Equity attributable to Unitholders 16,003$ 7,910$
Quarter-to-date Year-to-date
17
Brookfield Property Partners L.P.
Office Segment NET OPERATING INCOME
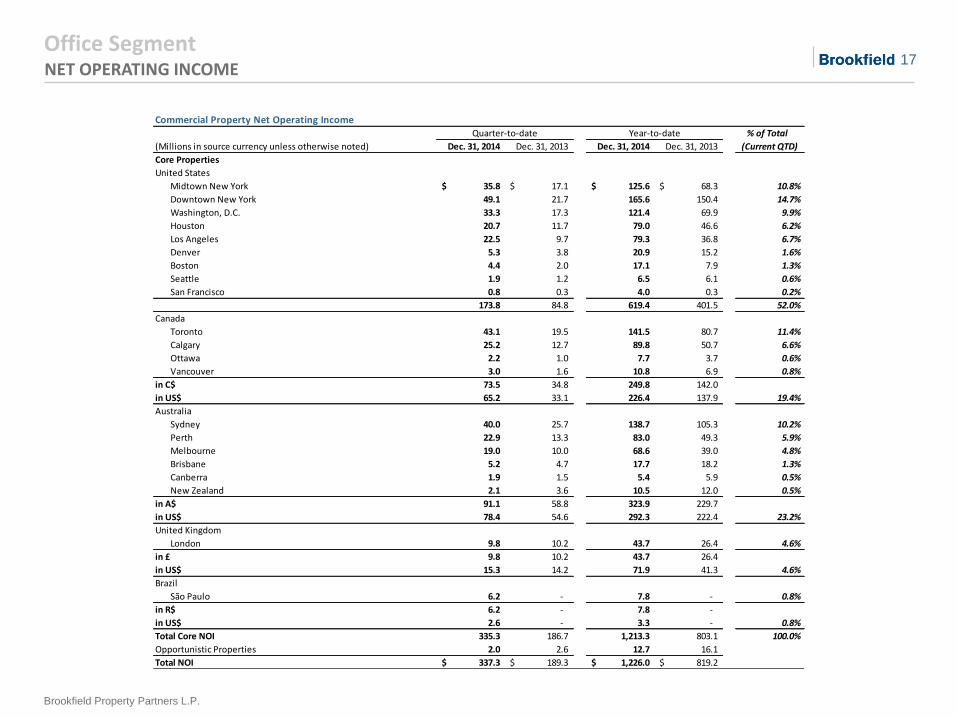
Commercial Property Net Operating Income% of Total
Dec. 31, 2014 Dec. 31, 2013 Dec. 31, 2014 Dec. 31, 2013 (Current QTD)
Core Properties
United States
Midtown New York 35.8$ 17.1$ 125.6$ 68.3$ 10.8%
Downtown New York 49.1 21.7 165.6 150.4 14.7%
Washington, D.C. 33.3 17.3 121.4 69.9 9.9%
Houston 20.7 11.7 79.0 46.6 6.2%
Los Angeles 22.5 9.7 79.3 36.8 6.7%
Denver 5.3 3.8 20.9 15.2 1.6%
Boston 4.4 2.0 17.1 7.9 1.3%
Seattle 1.9 1.2 6.5 6.1 0.6%
San Francisco 0.8 0.3 4.0 0.3 0.2%
173.8 84.8 619.4 401.5 52.0%
Canada
Toronto 43.1 19.5 141.5 80.7 11.4%
Calgary 25.2 12.7 89.8 50.7 6.6%
Ottawa 2.2 1.0 7.7 3.7 0.6%
Vancouver 3.0 1.6 10.8 6.9 0.8%
in C$ 73.5 34.8 249.8 142.0
in US$ 65.2 33.1 226.4 137.9 19.4%
Australia
Sydney 40.0 25.7 138.7 105.3 10.2%
Perth 22.9 13.3 83.0 49.3 5.9%
Melbourne 19.0 10.0 68.6 39.0 4.8%
Brisbane 5.2 4.7 17.7 18.2 1.3%
Canberra 1.9 1.5 5.4 5.9 0.5%
New Zealand 2.1 3.6 10.5 12.0 0.5%
in A$ 91.1 58.8 323.9 229.7
in US$ 78.4 54.6 292.3 222.4 23.2%
United Kingdom
London 9.8 10.2 43.7 26.4 4.6%
in £ 9.8 10.2 43.7 26.4
in US$ 15.3 14.2 71.9 41.3 4.6%
Brazil
São Paulo 6.2 - 7.8 - 0.8%
in R$ 6.2 - 7.8 -
in US$ 2.6 - 3.3 - 0.8%
Total Core NOI 335.3 186.7 1,213.3 803.1 100.0%
Opportunistic Properties 2.0 2.6 12.7 16.1
Total NOI 337.3$ 189.3$ 1,226.0$ 819.2$
Quarter-to-date Year-to-date
(Millions in source currency unless otherwise noted)
18
Brookfield Property Partners L.P.
Office Segment SAME PROPERTY NET OPERATING INCOME
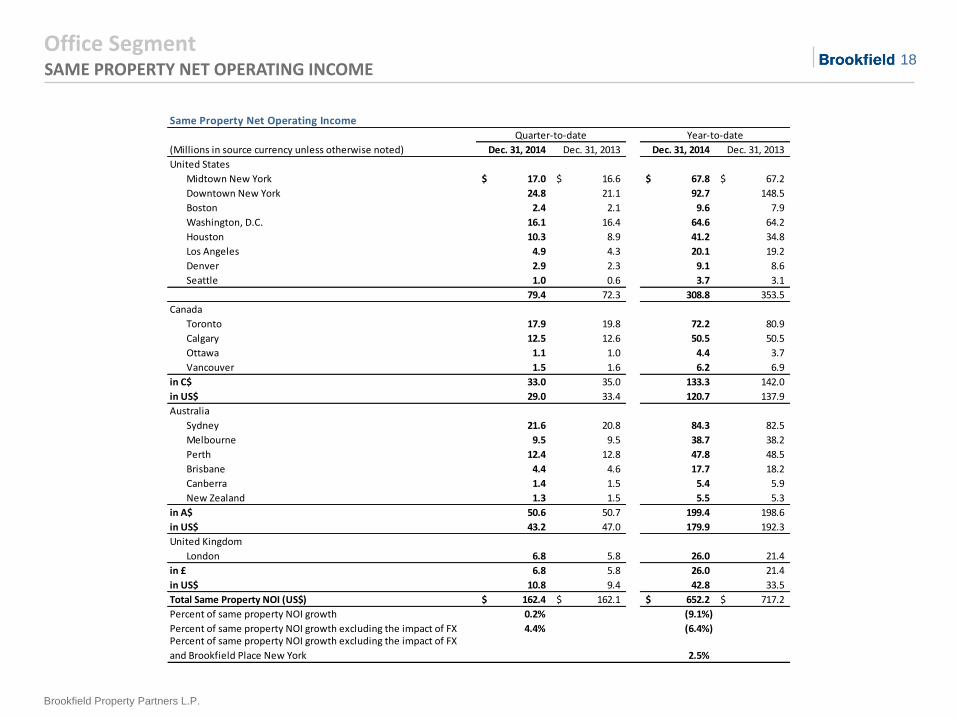
Same Property Net Operating Income
Dec. 31, 2014 Dec. 31, 2013 Dec. 31, 2014 Dec. 31, 2013
United States
Midtown New York 17.0$ 16.6$ 67.8$ 67.2$
Downtown New York 24.8 21.1 92.7 148.5
Boston 2.4 2.1 9.6 7.9
Washington, D.C. 16.1 16.4 64.6 64.2
Houston 10.3 8.9 41.2 34.8
Los Angeles 4.9 4.3 20.1 19.2
Denver 2.9 2.3 9.1 8.6
Seattle 1.0 0.6 3.7 3.1
79.4 72.3 308.8 353.5
Canada
Toronto 17.9 19.8 72.2 80.9
Calgary 12.5 12.6 50.5 50.5
Ottawa 1.1 1.0 4.4 3.7
Vancouver 1.5 1.6 6.2 6.9
in C$ 33.0 35.0 133.3 142.0
in US$ 29.0 33.4 120.7 137.9
Australia
Sydney 21.6 20.8 84.3 82.5
Melbourne 9.5 9.5 38.7 38.2
Perth 12.4 12.8 47.8 48.5
Brisbane 4.4 4.6 17.7 18.2
Canberra 1.4 1.5 5.4 5.9
New Zealand 1.3 1.5 5.5 5.3
in A$ 50.6 50.7 199.4 198.6
in US$ 43.2 47.0 179.9 192.3
United Kingdom
London 6.8 5.8 26.0 21.4
in £ 6.8 5.8 26.0 21.4
in US$ 10.8 9.4 42.8 33.5
Total Same Property NOI (US$) 162.4$ 162.1$ 652.2$ 717.2$
Percent of same property NOI growth 0.2% (9.1%)
Percent of same property NOI growth excluding the impact of FX 4.4% (6.4%)
2.5%
(Millions in source currency unless otherwise noted)
Quarter-to-date Year-to-date
Percent of same property NOI growth excluding the impact of FX
and Brookfield Place New York
19
Brookfield Property Partners L.P.
Office Segment SUMMARY OF PROPERTIES
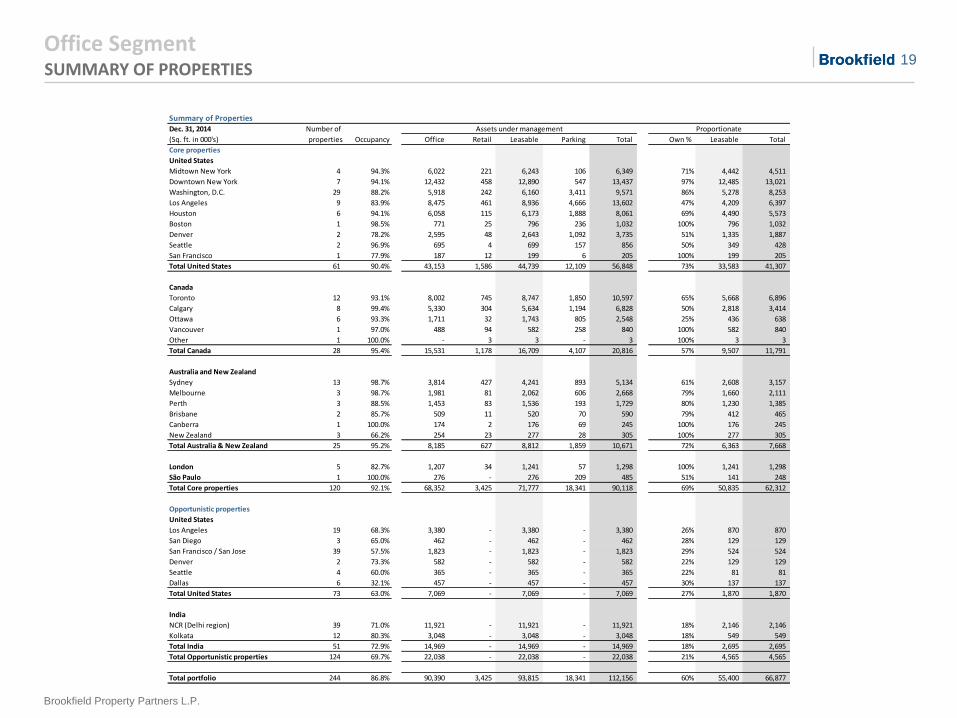
Summary of Properties
Dec. 31, 2014
(Sq. ft. in 000's) Occupancy Office Retail Leasable Parking Total Own % Leasable Total
Core properties
United States
Midtown New York 4 94.3% 6,022 221 6,243 106 6,349 71% 4,442 4,511
Downtown New York 7 94.1% 12,432 458 12,890 547 13,437 97% 12,485 13,021
Washington, D.C. 29 88.2% 5,918 242 6,160 3,411 9,571 86% 5,278 8,253
Los Angeles 9 83.9% 8,475 461 8,936 4,666 13,602 47% 4,209 6,397
Houston 6 94.1% 6,058 115 6,173 1,888 8,061 69% 4,490 5,573
Boston 1 98.5% 771 25 796 236 1,032 100% 796 1,032
Denver 2 78.2% 2,595 48 2,643 1,092 3,735 51% 1,335 1,887
Seattle 2 96.9% 695 4 699 157 856 50% 349 428
San Francisco 1 77.9% 187 12 199 6 205 100% 199 205
Total United States 61 90.4% 43,153 1,586 44,739 12,109 56,848 73% 33,583 41,307
Canada
Toronto 12 93.1% 8,002 745 8,747 1,850 10,597 65% 5,668 6,896
Calgary 8 99.4% 5,330 304 5,634 1,194 6,828 50% 2,818 3,414
Ottawa 6 93.3% 1,711 32 1,743 805 2,548 25% 436 638
Vancouver 1 97.0% 488 94 582 258 840 100% 582 840
Other 1 100.0% - 3 3 - 3 100% 3 3
Total Canada 28 95.4% 15,531 1,178 16,709 4,107 20,816 57% 9,507 11,791
Australia and New Zealand
Sydney 13 98.7% 3,814 427 4,241 893 5,134 61% 2,608 3,157
Melbourne 3 98.7% 1,981 81 2,062 606 2,668 79% 1,660 2,111
Perth 3 88.5% 1,453 83 1,536 193 1,729 80% 1,230 1,385
Brisbane 2 85.7% 509 11 520 70 590 79% 412 465
Canberra 1 100.0% 174 2 176 69 245 100% 176 245
New Zealand 3 66.2% 254 23 277 28 305 100% 277 305
Total Australia & New Zealand 25 95.2% 8,185 627 8,812 1,859 10,671 72% 6,363 7,668
London 5 82.7% 1,207 34 1,241 57 1,298 100% 1,241 1,298
São Paulo 1 100.0% 276 - 276 209 485 51% 141 248
Total Core properties 120 92.1% 68,352 3,425 71,777 18,341 90,118 69% 50,835 62,312
Opportunistic properties
United States
Los Angeles 19 68.3% 3,380 - 3,380 - 3,380 26% 870 870
San Diego 3 65.0% 462 - 462 - 462 28% 129 129
San Francisco / San Jose 39 57.5% 1,823 - 1,823 - 1,823 29% 524 524
Denver 2 73.3% 582 - 582 - 582 22% 129 129
Seattle 4 60.0% 365 - 365 - 365 22% 81 81
Dallas 6 32.1% 457 - 457 - 457 30% 137 137
Total United States 73 63.0% 7,069 - 7,069 - 7,069 27% 1,870 1,870
India
NCR (Delhi region) 39 71.0% 11,921 - 11,921 - 11,921 18% 2,146 2,146
Kolkata 12 80.3% 3,048 - 3,048 - 3,048 18% 549 549
Total India 51 72.9% 14,969 - 14,969 - 14,969 18% 2,695 2,695
Total Opportunistic properties 124 69.7% 22,038 - 22,038 - 22,038 21% 4,565 4,565
Total portfolio 244 86.8% 90,390 3,425 93,815 18,341 112,156 60% 55,400 66,877
Proportionate Number of
properties
Assets under management
20
Brookfield Property Partners L.P.
Office Segment HISTORICAL OCCUPANCY
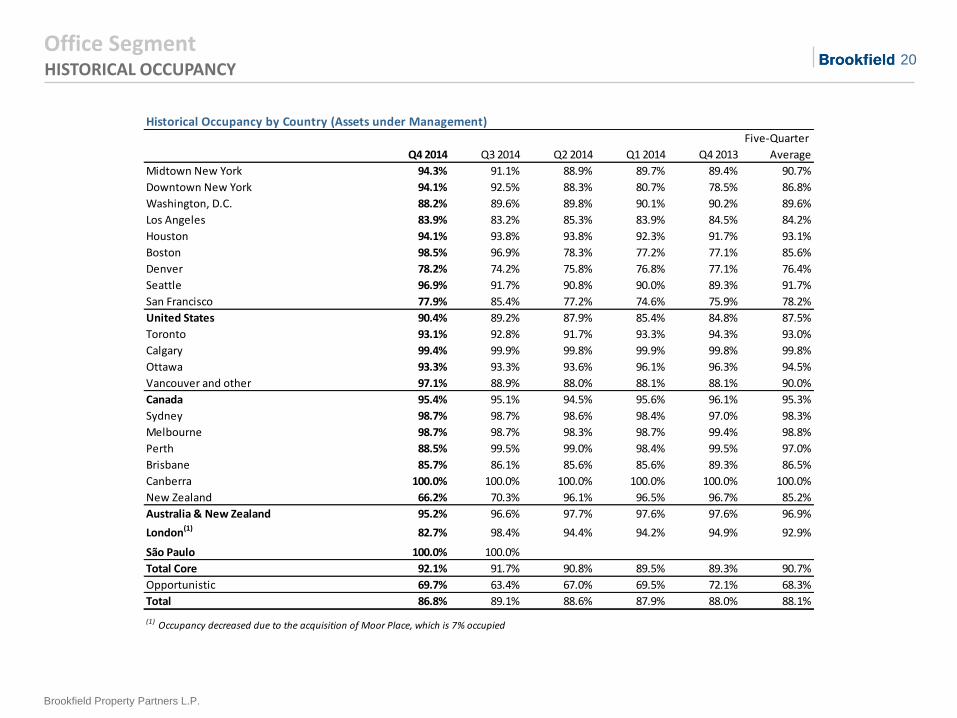
Historical Occupancy by Country (Assets under Management)
Q4 2014 Q3 2014 Q2 2014 Q1 2014 Q4 2013
Five-Quarter
Average
Midtown New York 94.3% 91.1% 88.9% 89.7% 89.4% 90.7%
Downtown New York 94.1% 92.5% 88.3% 80.7% 78.5% 86.8%
Washington, D.C. 88.2% 89.6% 89.8% 90.1% 90.2% 89.6%
Los Angeles 83.9% 83.2% 85.3% 83.9% 84.5% 84.2%
Houston 94.1% 93.8% 93.8% 92.3% 91.7% 93.1%
Boston 98.5% 96.9% 78.3% 77.2% 77.1% 85.6%
Denver 78.2% 74.2% 75.8% 76.8% 77.1% 76.4%
Seattle 96.9% 91.7% 90.8% 90.0% 89.3% 91.7%
San Francisco 77.9% 85.4% 77.2% 74.6% 75.9% 78.2%
United States 90.4% 89.2% 87.9% 85.4% 84.8% 87.5%
Toronto 93.1% 92.8% 91.7% 93.3% 94.3% 93.0%
Calgary 99.4% 99.9% 99.8% 99.9% 99.8% 99.8%
Ottawa 93.3% 93.3% 93.6% 96.1% 96.3% 94.5%
Vancouver and other 97.1% 88.9% 88.0% 88.1% 88.1% 90.0%
Canada 95.4% 95.1% 94.5% 95.6% 96.1% 95.3%
Sydney 98.7% 98.7% 98.6% 98.4% 97.0% 98.3%
Melbourne 98.7% 98.7% 98.3% 98.7% 99.4% 98.8%
Perth 88.5% 99.5% 99.0% 98.4% 99.5% 97.0%
Brisbane 85.7% 86.1% 85.6% 85.6% 89.3% 86.5%
Canberra 100.0% 100.0% 100.0% 100.0% 100.0% 100.0%
New Zealand 66.2% 70.3% 96.1% 96.5% 96.7% 85.2%
Australia & New Zealand 95.2% 96.6% 97.7% 97.6% 97.6% 96.9%
London(1) 82.7% 98.4% 94.4% 94.2% 94.9% 92.9%
São Paulo 100.0% 100.0%
Total Core 92.1% 91.7% 90.8% 89.5% 89.3% 90.7%
Opportunistic 69.7% 63.4% 67.0% 69.5% 72.1% 68.3%
Total 86.8% 89.1% 88.6% 87.9% 88.0% 88.1%
(1) Occupancy decreased due to the acquisition of Moor Place, which is 7% occupied
21
Brookfield Property Partners L.P.
Office Segment HISTORICAL RENTS
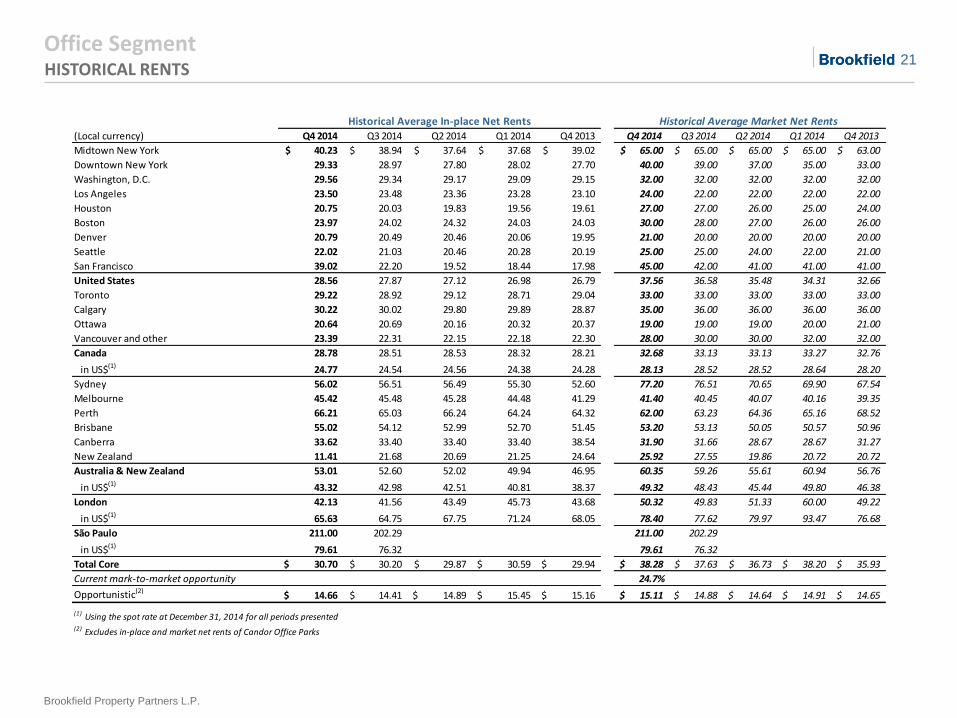
(Local currency) Q4 2014 Q3 2014 Q2 2014 Q1 2014 Q4 2013 Q4 2014 Q3 2014 Q2 2014 Q1 2014 Q4 2013
Midtown New York 40.23$ 38.94$ 37.64$ 37.68$ 39.02$ 65.00$ 65.00$ 65.00$ 65.00$ 63.00$
Downtown New York 29.33 28.97 27.80 28.02 27.70 40.00 39.00 37.00 35.00 33.00
Washington, D.C. 29.56 29.34 29.17 29.09 29.15 32.00 32.00 32.00 32.00 32.00
Los Angeles 23.50 23.48 23.36 23.28 23.10 24.00 22.00 22.00 22.00 22.00
Houston 20.75 20.03 19.83 19.56 19.61 27.00 27.00 26.00 25.00 24.00
Boston 23.97 24.02 24.32 24.03 24.03 30.00 28.00 27.00 26.00 26.00
Denver 20.79 20.49 20.46 20.06 19.95 21.00 20.00 20.00 20.00 20.00
Seattle 22.02 21.03 20.46 20.28 20.19 25.00 25.00 24.00 22.00 21.00
San Francisco 39.02 22.20 19.52 18.44 17.98 45.00 42.00 41.00 41.00 41.00
United States 28.56 27.87 27.12 26.98 26.79 37.56 36.58 35.48 34.31 32.66
Toronto 29.22 28.92 29.12 28.71 29.04 33.00 33.00 33.00 33.00 33.00
Calgary 30.22 30.02 29.80 29.89 28.87 35.00 36.00 36.00 36.00 36.00
Ottawa 20.64 20.69 20.16 20.32 20.37 19.00 19.00 19.00 20.00 21.00
Vancouver and other 23.39 22.31 22.15 22.18 22.30 28.00 30.00 30.00 32.00 32.00
Canada 28.78 28.51 28.53 28.32 28.21 32.68 33.13 33.13 33.27 32.76
in US$(1) 24.77 24.54 24.56 24.38 24.28 28.13 28.52 28.52 28.64 28.20
Sydney 56.02 56.51 56.49 55.30 52.60 77.20 76.51 70.65 69.90 67.54
Melbourne 45.42 45.48 45.28 44.48 41.29 41.40 40.45 40.07 40.16 39.35
Perth 66.21 65.03 66.24 64.24 64.32 62.00 63.23 64.36 65.16 68.52
Brisbane 55.02 54.12 52.99 52.70 51.45 53.20 53.13 50.05 50.57 50.96
Canberra 33.62 33.40 33.40 33.40 38.54 31.90 31.66 28.67 28.67 31.27
New Zealand 11.41 21.68 20.69 21.25 24.64 25.92 27.55 19.86 20.72 20.72
Australia & New Zealand 53.01 52.60 52.02 49.94 46.95 60.35 59.26 55.61 60.94 56.76
in US$(1) 43.32 42.98 42.51 40.81 38.37 49.32 48.43 45.44 49.80 46.38
London 42.13 41.56 43.49 45.73 43.68 50.32 49.83 51.33 60.00 49.22
in US$(1) 65.63 64.75 67.75 71.24 68.05 78.40 77.62 79.97 93.47 76.68
São Paulo 211.00 202.29 211.00 202.29
in US$(1) 79.61 76.32 79.61 76.32
Total Core 30.70$ 30.20$ 29.87$ 30.59$ 29.94$ 38.28$ 37.63$ 36.73$ 38.20$ 35.93$
Current mark-to-market opportunity 24.7%
Opportunistic(2)14.66$ 14.41$ 14.89$ 15.45$ 15.16$ 15.11$ 14.88$ 14.64$ 14.91$ 14.65$
(1) Using the spot rate at December 31, 2014 for all periods presented(2) Excludes in-place and market net rents of Candor Office Parks
Historical Average In-place Net Rents Historical Average Market Net Rents
22
Brookfield Property Partners L.P.
Office Segment LEASING ACTIVITY
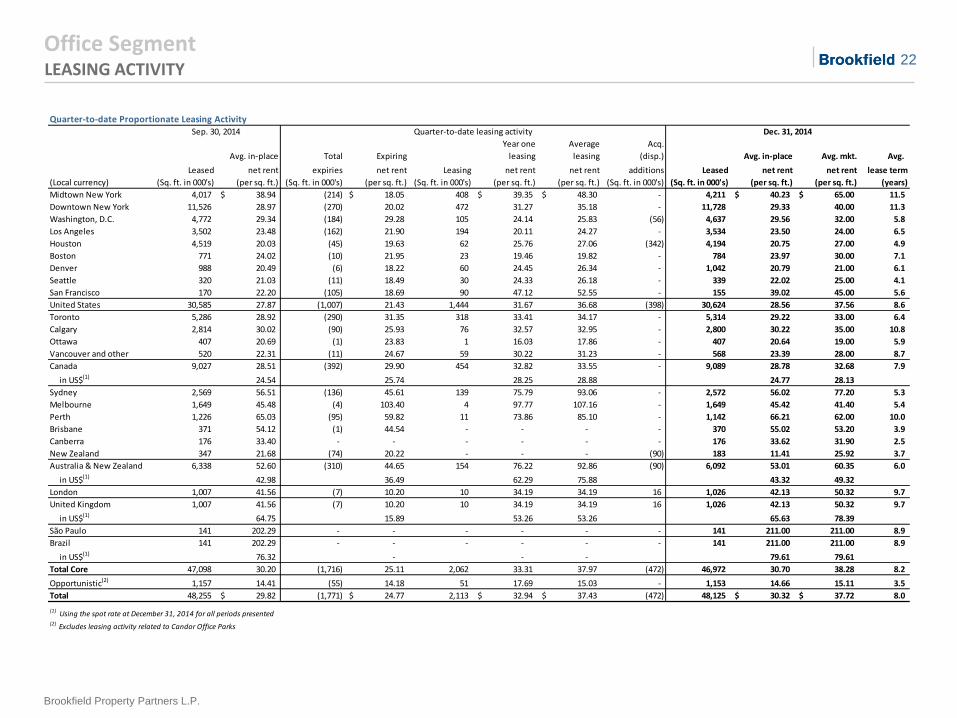
Quarter-to-date Proportionate Leasing Activity
Year one Average Acq.
Avg. in-place Total Expiring leasing leasing (disp.) Avg. in-place Avg. mkt. Avg.
Leased net rent expiries net rent Leasing net rent net rent additions Leased net rent net rent lease term
(Local currency) (Sq. ft. in 000's) (per sq. ft.) (Sq. ft. in 000's) (per sq. ft.) (Sq. ft. in 000's) (per sq. ft.) (per sq. ft.) (Sq. ft. in 000's) (Sq. ft. in 000's) (per sq. ft.) (per sq. ft.) (years)
Midtown New York 4,017 38.94$ (214) 18.05$ 408 39.35$ 48.30$ - 4,211 40.23$ 65.00$ 11.5
Downtown New York 11,526 28.97 (270) 20.02 472 31.27 35.18 - 11,728 29.33 40.00 11.3
Washington, D.C. 4,772 29.34 (184) 29.28 105 24.14 25.83 (56) 4,637 29.56 32.00 5.8
Los Angeles 3,502 23.48 (162) 21.90 194 20.11 24.27 - 3,534 23.50 24.00 6.5
Houston 4,519 20.03 (45) 19.63 62 25.76 27.06 (342) 4,194 20.75 27.00 4.9
Boston 771 24.02 (10) 21.95 23 19.46 19.82 - 784 23.97 30.00 7.1
Denver 988 20.49 (6) 18.22 60 24.45 26.34 - 1,042 20.79 21.00 6.1
Seattle 320 21.03 (11) 18.49 30 24.33 26.18 - 339 22.02 25.00 4.1
San Francisco 170 22.20 (105) 18.69 90 47.12 52.55 - 155 39.02 45.00 5.6
United States 30,585 27.87 (1,007) 21.43 1,444 31.67 36.68 (398) 30,624 28.56 37.56 8.6
Toronto 5,286 28.92 (290) 31.35 318 33.41 34.17 - 5,314 29.22 33.00 6.4
Calgary 2,814 30.02 (90) 25.93 76 32.57 32.95 - 2,800 30.22 35.00 10.8
Ottawa 407 20.69 (1) 23.83 1 16.03 17.86 - 407 20.64 19.00 5.9
Vancouver and other 520 22.31 (11) 24.67 59 30.22 31.23 - 568 23.39 28.00 8.7
Canada 9,027 28.51 (392) 29.90 454 32.82 33.55 - 9,089 28.78 32.68 7.9
in US$(1) 24.54 25.74 28.25 28.88 24.77 28.13
Sydney 2,569 56.51 (136) 45.61 139 75.79 93.06 - 2,572 56.02 77.20 5.3
Melbourne 1,649 45.48 (4) 103.40 4 97.77 107.16 - 1,649 45.42 41.40 5.4
Perth 1,226 65.03 (95) 59.82 11 73.86 85.10 - 1,142 66.21 62.00 10.0
Brisbane 371 54.12 (1) 44.54 - - - - 370 55.02 53.20 3.9
Canberra 176 33.40 - - - - - - 176 33.62 31.90 2.5
New Zealand 347 21.68 (74) 20.22 - - - (90) 183 11.41 25.92 3.7
Australia & New Zealand 6,338 52.60 (310) 44.65 154 76.22 92.86 (90) 6,092 53.01 60.35 6.0
in US$(1) 42.98 36.49 62.29 75.88 43.32 49.32
London 1,007 41.56 (7) 10.20 10 34.19 34.19 16 1,026 42.13 50.32 9.7
United Kingdom 1,007 41.56 (7) 10.20 10 34.19 34.19 16 1,026 42.13 50.32 9.7
in US$(1) 64.75 15.89 53.26 53.26 65.63 78.39
São Paulo 141 202.29 - - - - - - 141 211.00 211.00 8.9
Brazil 141 202.29 - - - - - - 141 211.00 211.00 8.9
in US$(1) 76.32 - - - 79.61 79.61
Total Core 47,098 30.20 (1,716) 25.11 2,062 33.31 37.97 (472) 46,972 30.70 38.28 8.2
Opportunistic(2) 1,157 14.41 (55) 14.18 51 17.69 15.03 - 1,153 14.66 15.11 3.5
Total 48,255 29.82$ (1,771) 24.77$ 2,113 32.94$ 37.43$ (472) 48,125 30.32$ 37.72$ 8.0
(1) Restated for the impact of foreign exchangeUsing the spot rate at December 31, 2014 for all periods presented(2) Excludes leasing activity related to Candor Office Parks
Sep. 30, 2014 Quarter-to-date leasing activity Dec. 31, 2014
23
Brookfield Property Partners L.P.
Office Segment LEASING ACTIVITY, CONT’D
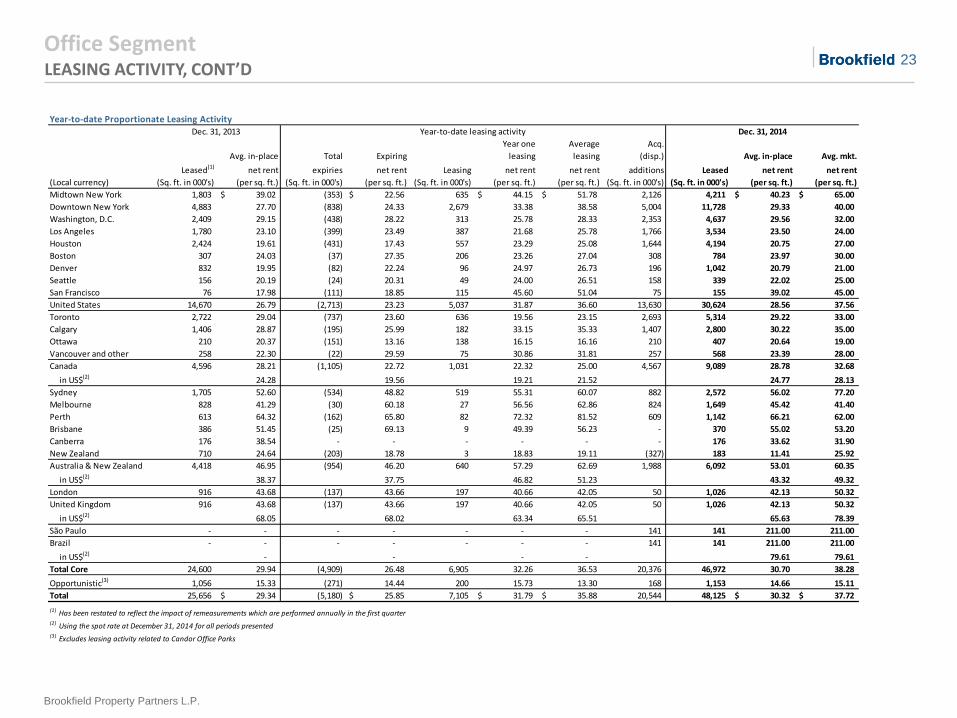
Year-to-date Proportionate Leasing Activity
Year one Average Acq.
Avg. in-place Total Expiring leasing leasing (disp.) Avg. in-place Avg. mkt.
Leased(1) net rent expiries net rent Leasing net rent net rent additions Leased net rent net rent
(Local currency) (Sq. ft. in 000's) (per sq. ft.) (Sq. ft. in 000's) (per sq. ft.) (Sq. ft. in 000's) (per sq. ft.) (per sq. ft.) (Sq. ft. in 000's) (Sq. ft. in 000's) (per sq. ft.) (per sq. ft.)
Midtown New York 1,803 39.02$ (353) 22.56$ 635 44.15$ 51.78$ 2,126 4,211 40.23$ 65.00$
Downtown New York 4,883 27.70 (838) 24.33 2,679 33.38 38.58 5,004 11,728 29.33 40.00
Washington, D.C. 2,409 29.15 (438) 28.22 313 25.78 28.33 2,353 4,637 29.56 32.00
Los Angeles 1,780 23.10 (399) 23.49 387 21.68 25.78 1,766 3,534 23.50 24.00
Houston 2,424 19.61 (431) 17.43 557 23.29 25.08 1,644 4,194 20.75 27.00
Boston 307 24.03 (37) 27.35 206 23.26 27.04 308 784 23.97 30.00
Denver 832 19.95 (82) 22.24 96 24.97 26.73 196 1,042 20.79 21.00
Seattle 156 20.19 (24) 20.31 49 24.00 26.51 158 339 22.02 25.00
San Francisco 76 17.98 (111) 18.85 115 45.60 51.04 75 155 39.02 45.00
United States 14,670 26.79 (2,713) 23.23 5,037 31.87 36.60 13,630 30,624 28.56 37.56
Toronto 2,722 29.04 (737) 23.60 636 19.56 23.15 2,693 5,314 29.22 33.00
Calgary 1,406 28.87 (195) 25.99 182 33.15 35.33 1,407 2,800 30.22 35.00
Ottawa 210 20.37 (151) 13.16 138 16.15 16.16 210 407 20.64 19.00
Vancouver and other 258 22.30 (22) 29.59 75 30.86 31.81 257 568 23.39 28.00
Canada 4,596 28.21 (1,105) 22.72 1,031 22.32 25.00 4,567 9,089 28.78 32.68
in US$(2) 24.28 19.56 19.21 21.52 24.77 28.13
Sydney 1,705 52.60 (534) 48.82 519 55.31 60.07 882 2,572 56.02 77.20
Melbourne 828 41.29 (30) 60.18 27 56.56 62.86 824 1,649 45.42 41.40
Perth 613 64.32 (162) 65.80 82 72.32 81.52 609 1,142 66.21 62.00
Brisbane 386 51.45 (25) 69.13 9 49.39 56.23 - 370 55.02 53.20
Canberra 176 38.54 - - - - - - 176 33.62 31.90
New Zealand 710 24.64 (203) 18.78 3 18.83 19.11 (327) 183 11.41 25.92
Australia & New Zealand 4,418 46.95 (954) 46.20 640 57.29 62.69 1,988 6,092 53.01 60.35
in US$(2) 38.37 37.75 46.82 51.23 43.32 49.32
London 916 43.68 (137) 43.66 197 40.66 42.05 50 1,026 42.13 50.32
United Kingdom 916 43.68 (137) 43.66 197 40.66 42.05 50 1,026 42.13 50.32
in US$(2) 68.05 68.02 63.34 65.51 65.63 78.39
São Paulo - - - - - - - 141 141 211.00 211.00
Brazil - - - - - - - 141 141 211.00 211.00
in US$(2) - - - - 79.61 79.61
Total Core 24,600 29.94 (4,909) 26.48 6,905 32.26 36.53 20,376 46,972 30.70 38.28
Opportunistic(3) 1,056 15.33 (271) 14.44 200 15.73 13.30 168 1,153 14.66 15.11
Total 25,656 29.34$ (5,180) 25.85$ 7,105 31.79$ 35.88$ 20,544 48,125 30.32$ 37.72$
(1) Has been restated to reflect the impact of remeasurements which are performed annually in the first quarter(2) Using the spot rate at December 31, 2014 for all periods presented(3) Excludes leasing activity related to Candor Office Parks
Dec. 31, 2013 Year-to-date leasing activity Dec. 31, 2014
24
Brookfield Property Partners L.P.
Office Segment LEASE EXPIRY ANALYSIS
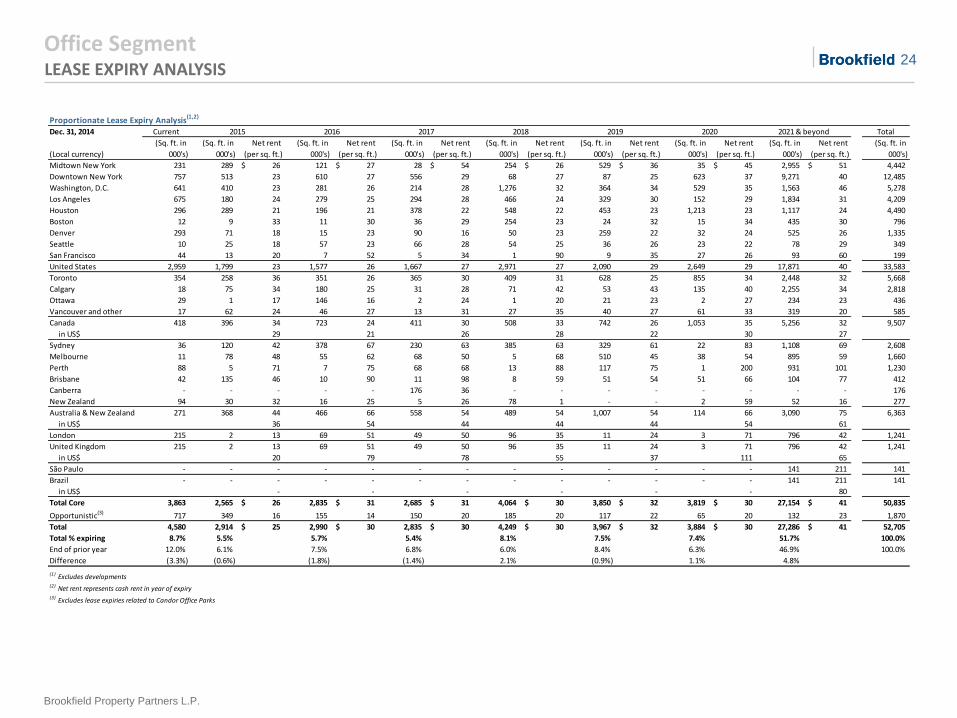
Proportionate Lease Expiry Analysis(1,2)
Dec. 31, 2014 Current Total
(Sq. ft. in
000's)
(Sq. ft. in
000's)
Net rent
(per sq. ft.)
(Sq. ft. in
000's)
Net rent
(per sq. ft.)
(Sq. ft. in
000's)
Net rent
(per sq. ft.)
(Sq. ft. in
000's)
Net rent
(per sq. ft.)
(Sq. ft. in
000's)
Net rent
(per sq. ft.)
(Sq. ft. in
000's)
Net rent
(per sq. ft.)
(Sq. ft. in
000's)
Net rent
(per sq. ft.)
(Sq. ft. in
000's)
Midtown New York 231 289 26$ 121 27$ 28 54$ 254 26$ 529 36$ 35 45$ 2,955 51$ 4,442
Downtown New York 757 513 23 610 27 556 29 68 27 87 25 623 37 9,271 40 12,485
Washington, D.C. 641 410 23 281 26 214 28 1,276 32 364 34 529 35 1,563 46 5,278
Los Angeles 675 180 24 279 25 294 28 466 24 329 30 152 29 1,834 31 4,209
Houston 296 289 21 196 21 378 22 548 22 453 23 1,213 23 1,117 24 4,490
Boston 12 9 33 11 30 36 29 254 23 24 32 15 34 435 30 796
Denver 293 71 18 15 23 90 16 50 23 259 22 32 24 525 26 1,335
Seattle 10 25 18 57 23 66 28 54 25 36 26 23 22 78 29 349
San Francisco 44 13 20 7 52 5 34 1 90 9 35 27 26 93 60 199
United States 2,959 1,799 23 1,577 26 1,667 27 2,971 27 2,090 29 2,649 29 17,871 40 33,583
Toronto 354 258 36 351 26 365 30 409 31 628 25 855 34 2,448 32 5,668
Calgary 18 75 34 180 25 31 28 71 42 53 43 135 40 2,255 34 2,818
Ottawa 29 1 17 146 16 2 24 1 20 21 23 2 27 234 23 436
Vancouver and other 17 62 24 46 27 13 31 27 35 40 27 61 33 319 20 585
Canada 418 396 34 723 24 411 30 508 33 742 26 1,053 35 5,256 32 9,507
in US$ 29 21 26 28 22 30 27
Sydney 36 120 42 378 67 230 63 385 63 329 61 22 83 1,108 69 2,608
Melbourne 11 78 48 55 62 68 50 5 68 510 45 38 54 895 59 1,660
Perth 88 5 71 7 75 68 68 13 88 117 75 1 200 931 101 1,230
Brisbane 42 135 46 10 90 11 98 8 59 51 54 51 66 104 77 412
Canberra - - - - - 176 36 - - - - - - - - 176
New Zealand 94 30 32 16 25 5 26 78 1 - - 2 59 52 16 277
Australia & New Zealand 271 368 44 466 66 558 54 489 54 1,007 54 114 66 3,090 75 6,363
in US$ 36 54 44 44 44 54 61
London 215 2 13 69 51 49 50 96 35 11 24 3 71 796 42 1,241
United Kingdom 215 2 13 69 51 49 50 96 35 11 24 3 71 796 42 1,241
in US$ 20 79 78 55 37 111 65
São Paulo - - - - - - - - - - - - - 141 211 141
Brazil - - - - - - - - - - - - - 141 211 141
in US$ - - - - - - 80
Total Core 3,863 2,565 26$ 2,835 31$ 2,685 31$ 4,064 30$ 3,850 32$ 3,819 30$ 27,154 41$ 50,835
Opportunistic(3) 717 349 16 155 14 150 20 185 20 117 22 65 20 132 23 1,870
Total 4,580 2,914 25$ 2,990 30$ 2,835 30$ 4,249 30$ 3,967 32$ 3,884 30$ 27,286 41$ 52,705
Total % expiring 8.7% 5.5% 5.7% 5.4% 8.1% 7.5% 7.4% 51.7% 100.0%
End of prior year 12.0% 6.1% 7.5% 6.8% 6.0% 8.4% 6.3% 46.9% 100.0%
Difference (3.3%) (0.6%) (1.8%) (1.4%) 2.1% (0.9%) 1.1% 4.8%
(1) Excludes developments (2) Net rent represents cash rent in year of expiry(3) Excludes lease expiries related to Candor Office Parks
2020 2021 & beyond
(Local currency)
2015 2016 2017 2018 2019
25
Brookfield Property Partners L.P.
Office Segment TOP TENANTS
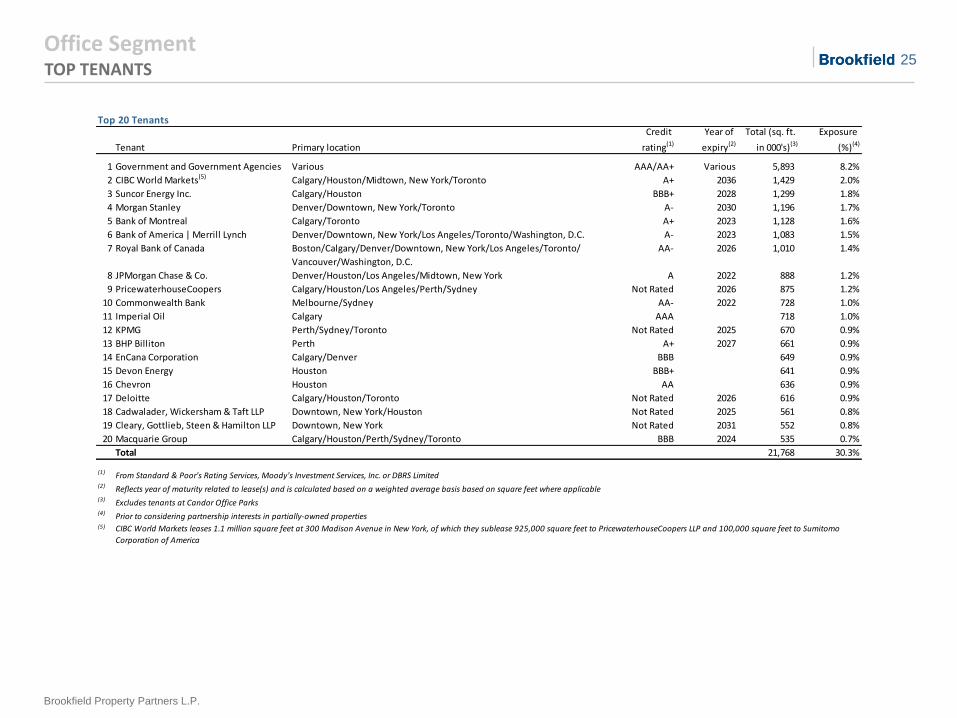
Top 20 Tenants
Tenant Primary location
Credit
rating(1)
Year of
expiry(2)
Total (sq. ft.
in 000's)(3)
Exposure
(%)(4)
1 Government and Government Agencies Various AAA/AA+ Various 5,893 8.2%
2 CIBC World Markets(5) Calgary/Houston/Midtown, New York/Toronto A+ 2036 1,429 2.0%
3 Suncor Energy Inc. Calgary/Houston BBB+ 2028 1,299 1.8%
4 Morgan Stanley Denver/Downtown, New York/Toronto A- 2030 1,196 1.7%
5 Bank of Montreal Calgary/Toronto A+ 2023 1,128 1.6%
6 Bank of America | Merrill Lynch Denver/Downtown, New York/Los Angeles/Toronto/Washington, D.C. A- 2023 1,083 1.5%
7 Royal Bank of Canada Boston/Calgary/Denver/Downtown, New York/Los Angeles/Toronto/
Vancouver/Washington, D.C.
AA- 2026 1,010 1.4%
8 JPMorgan Chase & Co. Denver/Houston/Los Angeles/Midtown, New York A 2022 888 1.2%
9 PricewaterhouseCoopers Calgary/Houston/Los Angeles/Perth/Sydney Not Rated 2026 875 1.2%
10 Commonwealth Bank Melbourne/Sydney AA- 2022 728 1.0%
11 Imperial Oil Calgary AAA 718 1.0%
12 KPMG Perth/Sydney/Toronto Not Rated 2025 670 0.9%
13 BHP Billiton Perth A+ 2027 661 0.9%
14 EnCana Corporation Calgary/Denver BBB 649 0.9%
15 Devon Energy Houston BBB+ 641 0.9%
16 Chevron Houston AA 636 0.9%
17 Deloitte Calgary/Houston/Toronto Not Rated 2026 616 0.9%
18 Cadwalader, Wickersham & Taft LLP Downtown, New York/Houston Not Rated 2025 561 0.8%
19 Cleary, Gottlieb, Steen & Hamilton LLP Downtown, New York Not Rated 2031 552 0.8%
20 Macquarie Group Calgary/Houston/Perth/Sydney/Toronto BBB 2024 535 0.7%
Total 21,768 30.3%
(1) From Standard & Poor's Rating Services, Moody's Investment Services, Inc. or DBRS Limited(2) Reflects year of maturity related to lease(s) and is calculated based on a weighted average basis based on square feet where applicable(3) Excludes tenants at Candor Office Parks(4) Prior to considering partnership interests in partially-owned properties(5) CIBC World Markets leases 1.1 million square feet at 300 Madison Avenue in New York, of which they sublease 925,000 square feet to PricewaterhouseCoopers LLP and 100,000 square feet to Sumitomo
Corporation of America
26
Brookfield Property Partners L.P.
Office Segment DEVELOPMENT SITES
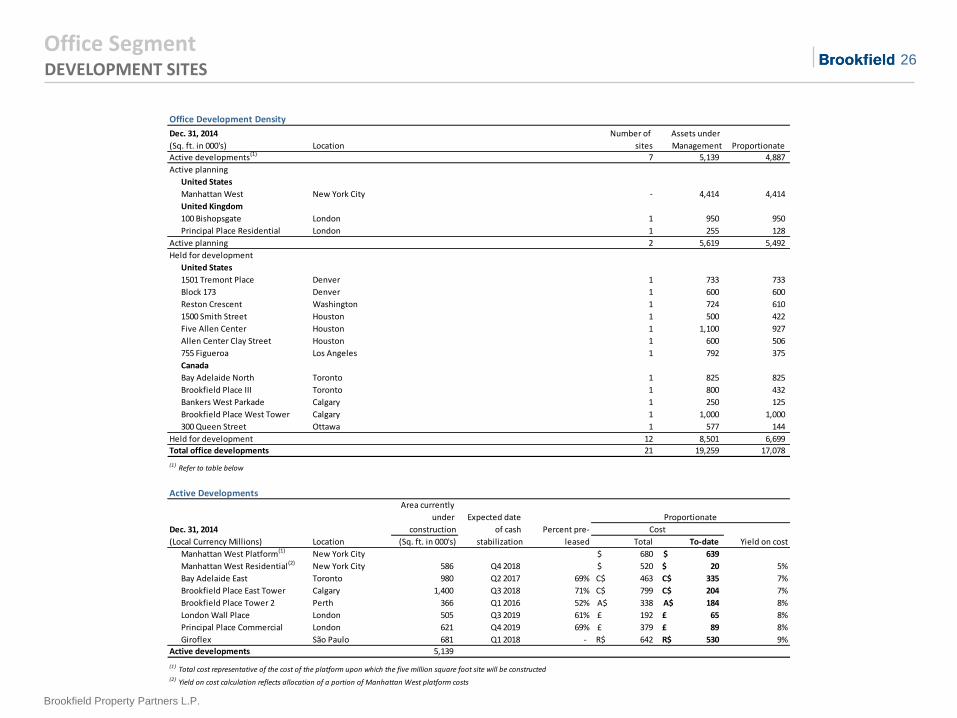
Office Development Density
Dec. 31, 2014 Number of
(Sq. ft. in 000's) Location sites
Active developments(1) 7 5,139 4,887
Active planning
United States
Manhattan West New York City - 4,414 4,414
United Kingdom
100 Bishopsgate London 1 950 950
Principal Place Residential London 1 255 128
Active planning 2 5,619 5,492
Held for development
United States
1501 Tremont Place Denver 1 733 733
Block 173 Denver 1 600 600
Reston Crescent Washington 1 724 610
1500 Smith Street Houston 1 500 422
Five Allen Center Houston 1 1,100 927
Allen Center Clay Street Houston 1 600 506
755 Figueroa Los Angeles 1 792 375
Canada
Bay Adelaide North Toronto 1 825 825
Brookfield Place III Toronto 1 800 432
Bankers West Parkade Calgary 1 250 125
Brookfield Place West Tower Calgary 1 1,000 1,000
300 Queen Street Ottawa 1 577 144
Held for development 12 8,501 6,699
Total office developments 21 19,259 17,078
(1) Refer to table below
Active Developments
Dec. 31, 2014
(Local Currency Millions) Location (Sq. ft. in 000's) Total To-date
Manhattan West Platform(1) New York City 680$ 639$
Manhattan West Residential (2) New York City 586 Q4 2018 520$ 20$ 5%
Bay Adelaide East Toronto 980 Q2 2017 69% 463C$ 335C$ 7%
Brookfield Place East Tower Calgary 1,400 Q3 2018 71% 799C$ 204C$ 7%
Brookfield Place Tower 2 Perth 366 Q1 2016 52% 338A$ 184A$ 8%
London Wall Place London 505 Q3 2019 61% 192£ 65£ 8%
Principal Place Commercial London 621 Q4 2019 69% 379£ 89£ 8%
Giroflex São Paulo 681 Q1 2018 - 642R$ 530R$ 9%
Active developments 5,139
(1) Total cost representative of the cost of the platform upon which the five million square foot site will be constructed(2) Yield on cost calculation reflects allocation of a portion of Manhattan West platform costs
Assets under
Management Proportionate
Percent pre-
leased
Proportionate
Area currently
under
construction
Expected date
of cash
stabilization
Cost
Yield on cost
27
Brookfield Property Partners L.P.
Office Segment DEBT
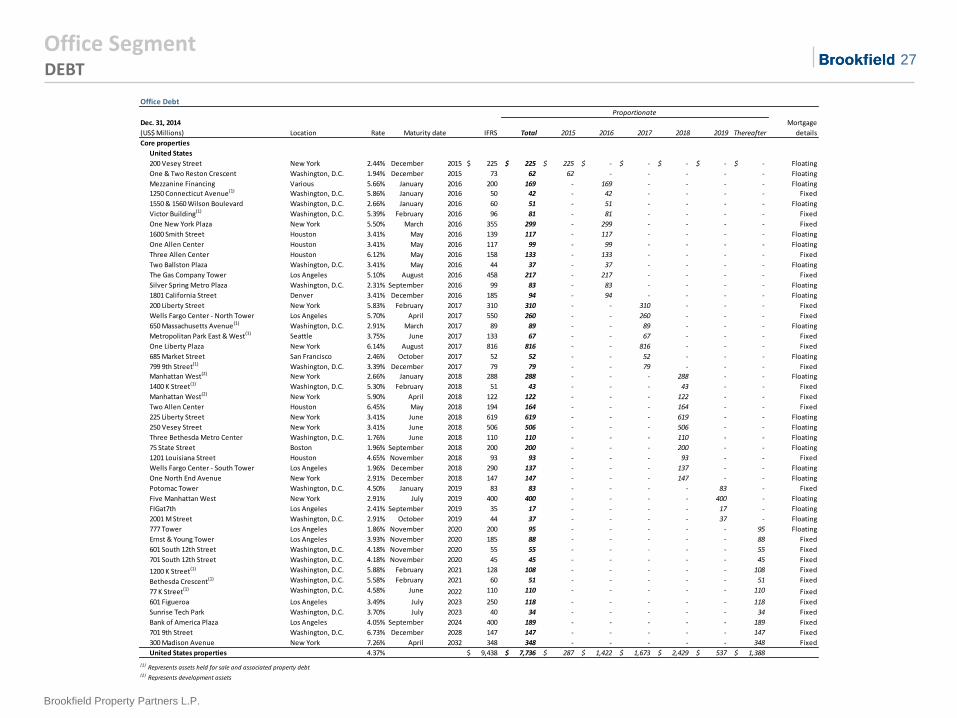
Office Debt
Location Rate IFRS Total 2015 2016 2017 2018 2019 Thereafter
Mortgage
details
Core properties
United States
200 Vesey Street: Lender1200 Vesey Street New York 2.44% December 2015 225$ 225$ 225$ -$ -$ -$ -$ -$ Floating
One Reston Crescent: Lender1One & Two Reston Crescent Washington, D.C. 1.94% December 2015 73 62 62 - - - - - Floating
Trizec Corporate 84%: Lender1Mezzanine Financing Various 5.66% January 2016 200 169 - 169 - - - - Floating
1250 Connecticut Ave: Lender11250 Connecticut Avenue(1) Washington, D.C. 5.86% January 2016 50 42 - 42 - - - - Fixed
1550 & 1560 Wilson Boulevard: Lender11550 & 1560 Wilson Boulevard Washington, D.C. 2.66% January 2016 60 51 - 51 - - - - Floating
Victor Building: Lender1Victor Building(1) Washington, D.C. 5.39% February 2016 96 81 - 81 - - - - Fixed
One New York Plaza: Lender1One New York Plaza New York 5.50% March 2016 355 299 - 299 - - - - Fixed
1600 Smith Street: Lender11600 Smith Street Houston 3.41% May 2016 139 117 - 117 - - - - Floating
One Allen Center: Lender1One Allen Center Houston 3.41% May 2016 117 99 - 99 - - - - Floating
Three Allen Center: Lender1Three Allen Center Houston 6.12% May 2016 158 133 - 133 - - - - Fixed
Two Ballston Plaza: Lender1Two Ballston Plaza Washington, D.C. 3.41% May 2016 44 37 - 37 - - - - Floating
The Gas Company Tower: Lender1The Gas Company Tower Los Angeles 5.10% August 2016 458 217 - 217 - - - - Fixed
Silver Spring Metro Plaza: Lender1Silver Spring Metro Plaza Washington, D.C. 2.31% September 2016 99 83 - 83 - - - - Floating
1801 California Street: Lender11801 California Street Denver 3.41% December 2016 185 94 - 94 - - - - Floating
200 Liberty Street: Lender1200 Liberty Street New York 5.83% February 2017 310 310 - - 310 - - - Fixed
Wells Fargo Center - North Tower: Lender1Wells Fargo Center - North Tower Los Angeles 5.70% April 2017 550 260 - - 260 - - - Fixed
650 Massachusetts Avenue: Lender1650 Massachusetts Avenue(1) Washington, D.C. 2.91% March 2017 89 89 - - 89 - - - Floating
Metropolitan Park East & West: Lender1Metropolitan Park East & West(1) Seattle 3.75% June 2017 133 67 - - 67 - - - Fixed
One Liberty Plaza: Lender1One Liberty Plaza New York 6.14% August 2017 816 816 - - 816 - - - Fixed
685 Market Street: Lender1685 Market Street San Francisco 2.46% October 2017 52 52 - - 52 - - - Floating
799 9th Street: Lender1799 9th Street(1) Washington, D.C. 3.39% December 2017 79 79 - - 79 - - - Fixed
Manhattan West: Lender3Manhattan West(2) New York 2.66% January 2018 288 288 - - - 288 - - Floating
1400 K Street: Lender11400 K Street(1) Washington, D.C. 5.30% February 2018 51 43 - - - 43 - - Fixed
Manhattan West: Lender2Manhattan West(2) New York 5.90% April 2018 122 122 - - - 122 - - Fixed
Two Allen Center: Lender1Two Allen Center Houston 6.45% May 2018 194 164 - - - 164 - - Fixed
225 Liberty Street: Lender4225 Liberty Street New York 3.41% June 2018 619 619 - - - 619 - - Floating
250 Vesey Street: Lender3250 Vesey Street New York 3.41% June 2018 506 506 - - - 506 - - Floating
Three Bethesda Metro Center: Lender2Three Bethesda Metro Center Washington, D.C. 1.76% June 2018 110 110 - - - 110 - - Floating
75 State Street: Lender275 State Street Boston 1.96% September 2018 200 200 - - - 200 - - Floating
1201 Louisiana Street: Lender11201 Louisiana Street Houston 4.65% November 2018 93 93 - - - 93 - - Fixed
Wells Fargo Center - South Tower: Lender1Wells Fargo Center - South Tower Los Angeles 1.96% December 2018 290 137 - - - 137 - - Floating
One North End Avenue: Lender1One North End Avenue New York 2.91% December 2018 147 147 - - - 147 - - Floating
Potomac Tower: Lender1Potomac Tower Washington, D.C. 4.50% January 2019 83 83 - - - - 83 - Fixed
Five Manhattan West: Lender2Five Manhattan West New York 2.91% July 2019 400 400 - - - - 400 - Floating
FIGat7th: Lender1FIGat7th Los Angeles 2.41% September 2019 35 17 - - - - 17 - Floating
2001 M Street: Lender22001 M Street Washington, D.C. 2.91% October 2019 44 37 - - - - 37 - Floating
777 Tower: Lender1777 Tower Los Angeles 1.86% November 2020 200 95 - - - - - 95 Floating
Ernst & Young Tower DTLA: Lender1Ernst & Young Tower Los Angeles 3.93% November 2020 185 88 - - - - - 88 Fixed
601 and 701 South 12th Street: Lender3601 South 12th Street Washington, D.C. 4.18% November 2020 55 55 - - - - - 55 Fixed
601 and 701 South 12th Street: Lender4701 South 12th Street Washington, D.C. 4.18% November 2020 45 45 - - - - - 45 Fixed
1200 K Street: Lender11200 K Street(1) Washington, D.C. 5.88% February 2021 128 108 - - - - - 108 Fixed
Bethesda Crescent: Lender1Bethesda Crescent(1) Washington, D.C. 5.58% February 2021 60 51 - - - - - 51 Fixed
77 K Street: Lender277 K Street(1) Washington, D.C. 4.58% June 2022 110 110 - - - - - 110 Fixed
601 Figueroa DTLA: Lender1601 Figueroa Los Angeles 3.49% July 2023 250 118 - - - - - 118 Fixed
Sunrise Tech Park: Lender2Sunrise Tech Park Washington, D.C. 3.70% July 2023 40 34 - - - - - 34 Fixed
Bank of America plaza DTLA: Lender2Bank of America Plaza Los Angeles 4.05% September 2024 400 189 - - - - - 189 Fixed
701 9th Avenue: Lender1701 9th Street Washington, D.C. 6.73% December 2028 147 147 - - - - - 147 Fixed
300 Madison Avenue: Lender1300 Madison Avenue New York 7.26% April 2032 348 348 - - - - - 348 Fixed
United States properties 4.37% 9,438$ 7,736$ 287$ 1,422$ 1,673$ 2,429$ 537$ 1,388$
(1) Represents assets held for sale and associated property debt(2) Represents development assets
Dec. 31, 2014
(US$ Millions) Maturity date
Proportionate
28
Brookfield Property Partners L.P.
Office Segment DEBT, CONT’D
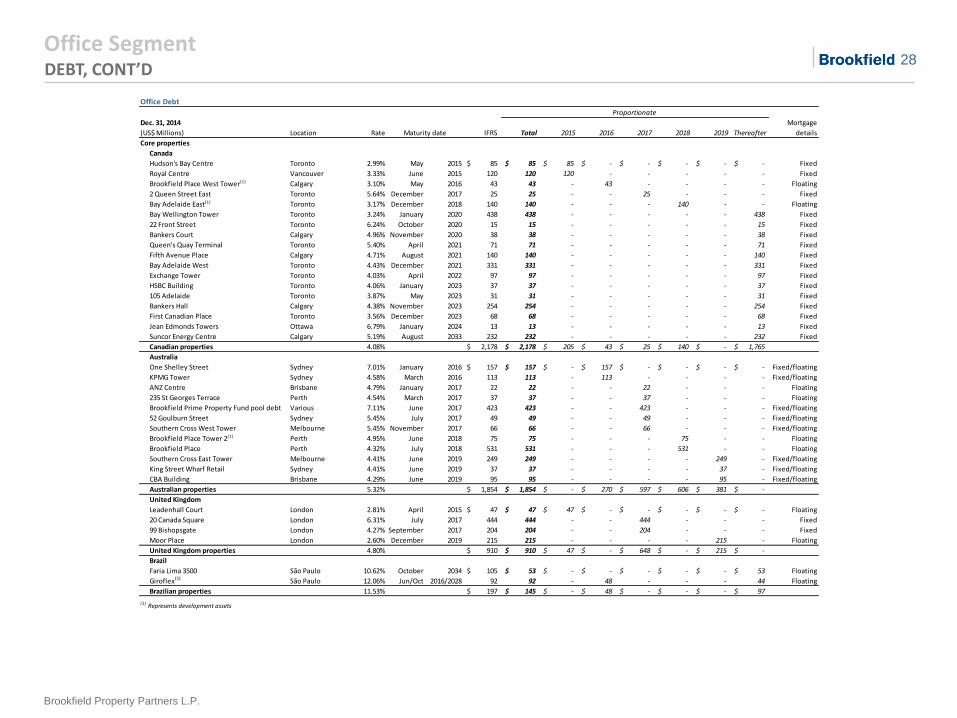
Office Debt
Location Rate IFRS Total 2015 2016 2017 2018 2019 Thereafter
Mortgage
details
Core properties
Canada
Hudson's Bay Centre: Lender1Hudson's Bay Centre Toronto 2.99% May 2015 85$ 85$ 85$ -$ -$ -$ -$ -$ Fixed
Royal Centre: Lender2Royal Centre Vancouver 3.33% June 2015 120 120 120 - - - - - Fixed
Brookfield Place Calgary West Tower: Lender1Brookfield Place West Tower(1) Calgary 3.10% May 2016 43 43 - 43 - - - - Floating
2 Queen Street East: Lender12 Queen Street East Toronto 5.64% December 2017 25 25 - - 25 - - - Fixed
Bay Adelaide East: Lender1Bay Adelaide East(1) Toronto 3.17% December 2018 140 140 - - - 140 - - Floating
Bay Wellington Tower: Lender3Bay Wellington Tower Toronto 3.24% January 2020 438 438 - - - - - 438 Fixed
22 Front Street: Lender122 Front Street Toronto 6.24% October 2020 15 15 - - - - - 15 Fixed
Bankers Court: Lender1Bankers Court Calgary 4.96% November 2020 38 38 - - - - - 38 Fixed
Queen's Quay Terminal: Lender1Queen's Quay Terminal Toronto 5.40% April 2021 71 71 - - - - - 71 Fixed
Fifth Avenue Place: Lender1Fifth Avenue Place Calgary 4.71% August 2021 140 140 - - - - - 140 Fixed
Bay Adelaide West: Lender1Bay Adelaide West Toronto 4.43% December 2021 331 331 - - - - - 331 Fixed
Exchange Tower: Lender2Exchange Tower Toronto 4.03% April 2022 97 97 - - - - - 97 Fixed
HSBC Building: Lender2HSBC Building Toronto 4.06% January 2023 37 37 - - - - - 37 Fixed
105 Adelaide: Lender2105 Adelaide Toronto 3.87% May 2023 31 31 - - - - - 31 Fixed
Bankers Hall: Lender3Bankers Hall Calgary 4.38% November 2023 254 254 - - - - - 254 Fixed
First Canadian Place: Lender3First Canadian Place Toronto 3.56% December 2023 68 68 - - - - - 68 Fixed
Jean Edmonds Towers: Lender1Jean Edmonds Towers Ottawa 6.79% January 2024 13 13 - - - - - 13 Fixed
SUNCOR Energy Centre: Lender3Suncor Energy Centre Calgary 5.19% August 2033 232 232 - - - - - 232 Fixed
Canadian properties 4.08% 2,178$ 2,178$ 205$ 43$ 25$ 140$ -$ 1,765$
Australia
One Shelley StreetOne Shelley Street Sydney 7.01% January 2016 157$ 157$ -$ 157$ -$ -$ -$ -$ Fixed/floating
KPMG TowerKPMG Tower Sydney 4.58% March 2016 113 113 - 113 - - - - Fixed/floating
ANZ CentreANZ Centre Brisbane 4.79% January 2017 22 22 - - 22 - - - Floating
235 St Georges Terrace: Lender4235 St Georges Terrace Perth 4.54% March 2017 37 37 - - 37 - - - Floating
Brookfield Prime Property FundBrookfield Prime Property Fund pool debt Various 7.11% June 2017 423 423 - - 423 - - - Fixed/floating
52 Goulburn Street52 Goulburn Street Sydney 5.45% July 2017 49 49 - - 49 - - - Fixed/floating
Southern Cross West TowerSouthern Cross West Tower Melbourne 5.45% November 2017 66 66 - - 66 - - - Fixed/floating
Brookfield Place Tower 2: Lender2Brookfield Place Tower 2(1) Perth 4.95% June 2018 75 75 - - - 75 - - Floating
Brookfield Place: Lender6Brookfield Place Perth 4.32% July 2018 531 531 - - - 531 - - Floating
Southern Cross East TowerSouthern Cross East Tower Melbourne 4.41% June 2019 249 249 - - - - 249 - Fixed/floating
King Street Wharf RetailKing Street Wharf Retail Sydney 4.41% June 2019 37 37 - - - - 37 - Fixed/floating
CBA Building CBA Building Brisbane 4.29% June 2019 95 95 - - - - 95 - Fixed/floating
Australian properties 5.32% 1,854$ 1,854$ -$ 270$ 597$ 606$ 381$ -$
United Kingdom
Leadenhall Court: Lender1Leadenhall Court London 2.81% April 2015 47$ 47$ 47$ -$ -$ -$ -$ -$ Floating
20 Canada Square 20 Canada Square London 6.31% July 2017 444 444 - - 444 - - - Fixed
99 Bishopsgate: Lender199 Bishopsgate London 4.27% September 2017 204 204 - - 204 - - - Fixed
Mooregate Exchange: Lender1Moor Place London 2.60% December 2019 215 215 - - - - 215 - Floating
United Kingdom properties 4.80% 910$ 910$ 47$ -$ 648$ -$ 215$ -$
Brazil
Faria Lima 3500Faria Lima 3500 São Paulo 10.62% October 2034 105$ 53$ -$ -$ -$ -$ -$ 53$ Floating
Giroflex(1) São Paulo 12.06% Jun/Oct 2016/2028 92 92 - 48 - - - 44 Floating
Brazilian properties 11.53% 197$ 145$ -$ 48$ -$ -$ -$ 97$
(1) Represents development assets
Dec. 31, 2014
(US$ Millions) Maturity date
Proportionate
29
Brookfield Property Partners L.P.
Office Segment DEBT, CONT’D
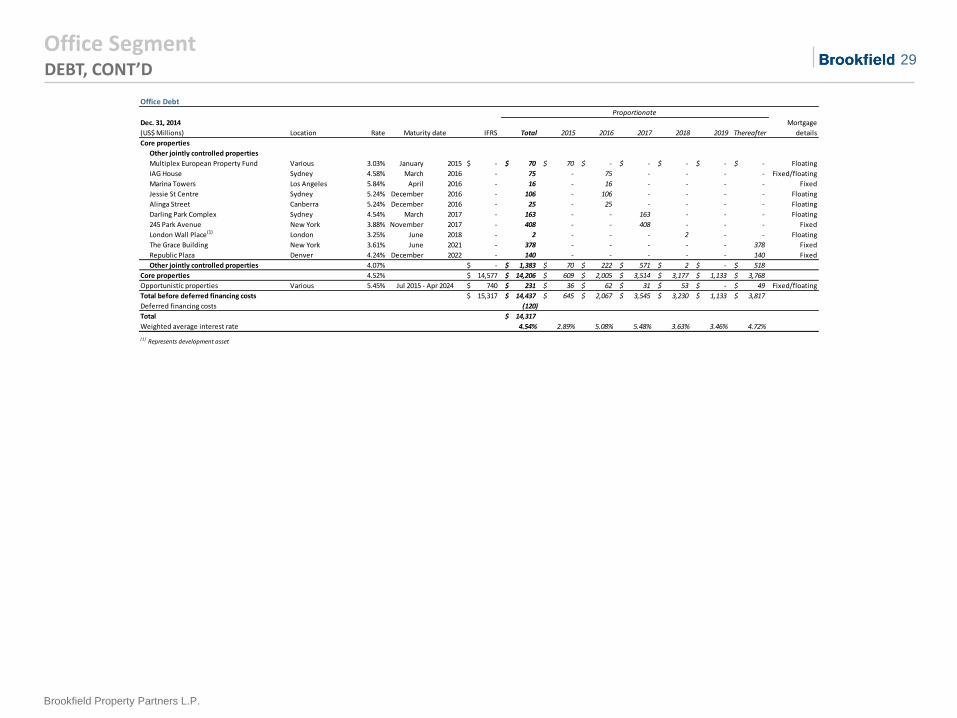
Office Debt
Location Rate IFRS Total 2015 2016 2017 2018 2019 Thereafter
Mortgage
details
Core properties
Other jointly controlled properties
MUEMultiplex European Property Fund Various 3.03% January 2015 -$ 70$ 70$ -$ -$ -$ -$ -$ Floating
IAG HouseIAG House Sydney 4.58% March 2016 - 75 - 75 - - - - Fixed/floating
Marina Towers: Lender1Marina Towers Los Angeles 5.84% April 2016 - 16 - 16 - - - - Fixed
Jessie St CentreJessie St Centre Sydney 5.24% December 2016 - 106 - 106 - - - - Floating
Alinga StreetAlinga Street Canberra 5.24% December 2016 - 25 - 25 - - - - Floating
Darling Park Complex: Lender4Darling Park Complex Sydney 4.54% March 2017 - 163 - - 163 - - - Floating
245 Park Avenue: Lender1245 Park Avenue New York 3.88% November 2017 - 408 - - 408 - - - Fixed
London Wall Place: Lender1London Wall Place(1) London 3.25% June 2018 - 2 - - - 2 - - Floating
The Grace BuildingThe Grace Building New York 3.61% June 2021 - 378 - - - - - 378 Fixed
Republic Plaza: Lender3Republic Plaza Denver 4.24% December 2022 - 140 - - - - - 140 Fixed
Other jointly controlled properties 4.07% -$ 1,383$ 70$ 222$ 571$ 2$ -$ 518$
Core properties 4.52% 14,577$ 14,206$ 609$ 2,005$ 3,514$ 3,177$ 1,133$ 3,768$
Opportunistic properties Various 5.45% 740$ 231$ 36$ 62$ 31$ 53$ -$ 49$ Fixed/floating
Total before deferred financing costs 15,317$ 14,437$ 645$ 2,067$ 3,545$ 3,230$ 1,133$ 3,817$
Deferred financing costs (120)
Total 14,317$
Weighted average interest rate 4.54% 2.89% 5.08% 5.48% 3.63% 3.46% 4.72%
(1) Represents development asset
Jul 2015 - Apr 2024
Dec. 31, 2014
(US$ Millions) Maturity date
Proportionate
30
Brookfield Property Partners L.P.
Office Segment CAPITAL EXPENDITURES
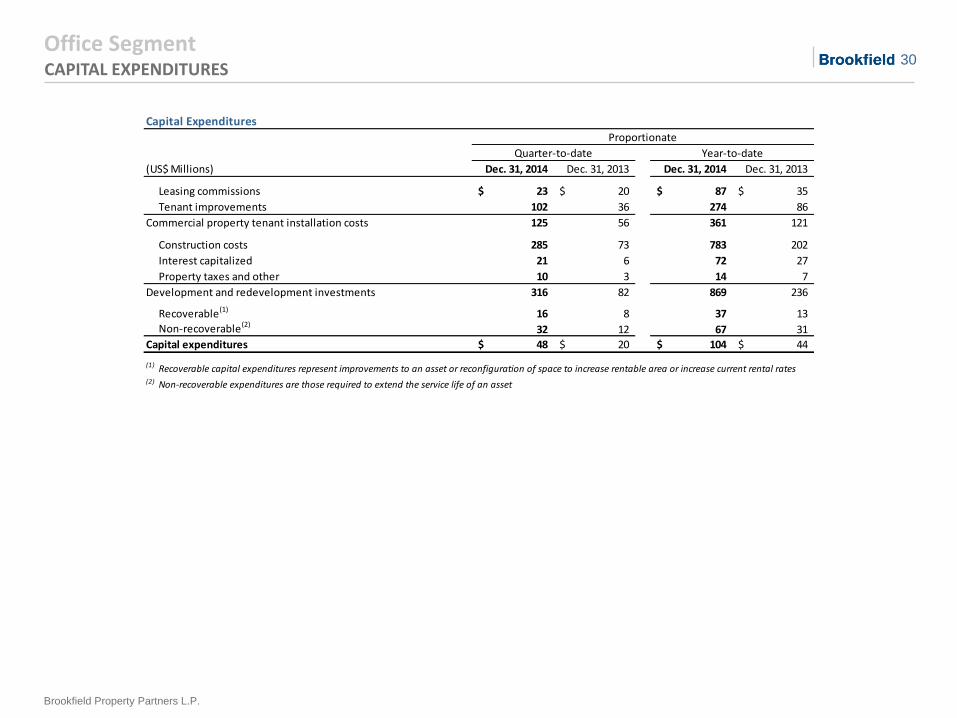
Capital Expenditures
(US$ Millions) Dec. 31, 2014 Dec. 31, 2013 Dec. 31, 2014 Dec. 31, 2013
Leasing commissions 23$ 20$ 87$ 35$
Tenant improvements 102 36 274 86
Commercial property tenant installation costs 125 56 361 121
Construction costs 285 73 783 202
Interest capitalized 21 6 72 27
Property taxes and other 10 3 14 7
Development and redevelopment investments 316 82 869 236
Recoverable(1) 16 8 37 13
Non-recoverable(2)32 12 67 31
Capital expenditures 48$ 20$ 104$ 44$
(1) Recoverable capital expenditures represent improvements to an asset or reconfiguration of space to increase rentable area or increase current rental rates(2) Non-recoverable expenditures are those required to extend the service life of an asset
Year-to-date
Proportionate
Quarter-to-date

Retail Segment
32
Brookfield Property Partners L.P.
Retail Segment FINANCIAL OVERVIEW
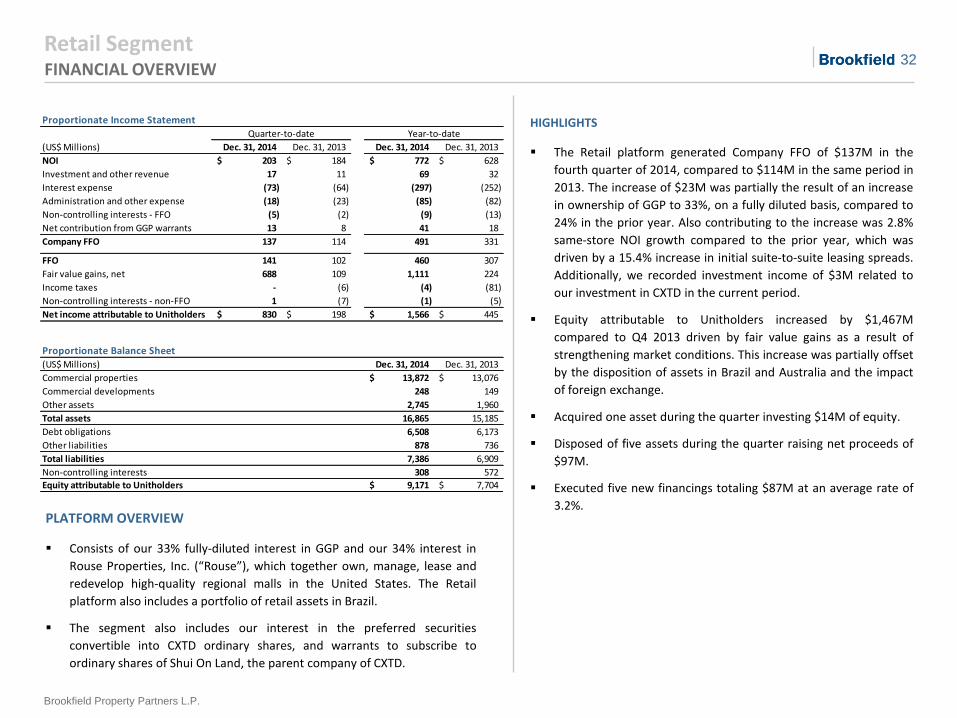
PLATFORM OVERVIEW
Consists of our 33% fully-diluted interest in GGP and our 34% interest in
Rouse Properties, Inc. (“Rouse”), which together own, manage, lease and
redevelop high-quality regional malls in the United States. The Retail
platform also includes a portfolio of retail assets in Brazil.
The segment also includes our interest in the preferred securities
convertible into CXTD ordinary shares, and warrants to subscribe to
ordinary shares of Shui On Land, the parent company of CXTD.
HIGHLIGHTS
The Retail platform generated Company FFO of $137M in the
fourth quarter of 2014, compared to $114M in the same period in
2013. The increase of $23M was partially the result of an increase
in ownership of GGP to 33%, on a fully diluted basis, compared to
24% in the prior year. Also contributing to the increase was 2.8%
same-store NOI growth compared to the prior year, which was
driven by a 15.4% increase in initial suite-to-suite leasing spreads.
Additionally, we recorded investment income of $3M related to
our investment in CXTD in the current period.
Equity attributable to Unitholders increased by $1,467M
compared to Q4 2013 driven by fair value gains as a result of
strengthening market conditions. This increase was partially offset
by the disposition of assets in Brazil and Australia and the impact
of foreign exchange.
Acquired one asset during the quarter investing $14M of equity.
Disposed of five assets during the quarter raising net proceeds of
$97M.
Executed five new financings totaling $87M at an average rate of
3.2%.
Proportionate Income Statement
(US$ Millions) Dec. 31, 2014 Dec. 31, 2013 Dec. 31, 2014 Dec. 31, 2013
NOI 203$ 184$ 772$ 628$
Investment and other revenue 17 11 69 32
Interest expense (73) (64) (297) (252)
Administration and other expense (18) (23) (85) (82)
Non-controlling interests - FFO (5) (2) (9) (13)
Net contribution from GGP warrants 13 8 41 18
Company FFO 137 114 491 331
FFO 141 102 460 307
Fair value gains, net 688 109 1,111 224
Income taxes - (6) (4) (81)
Non-controlling interests - non-FFO 1 (7) (1) (5)
Net income attributable to Unitholders 830$ 198$ 1,566$ 445$
Proportionate Balance Sheet(US$ Millions) Dec. 31, 2014 Dec. 31, 2013
Commercial properties 13,872$ 13,076$
Commercial developments 248 149
Other assets 2,745 1,960
Total assets 16,865 15,185
Debt obligations 6,508 6,173
Other liabilities 878 736
Total liabilities 7,386 6,909
Non-controlling interests 308 572
Equity attributable to Unitholders 9,171$ 7,704$
Quarter-to-date Year-to-date
33
Brookfield Property Partners L.P.
Retail Segment NET OPERATING INCOME
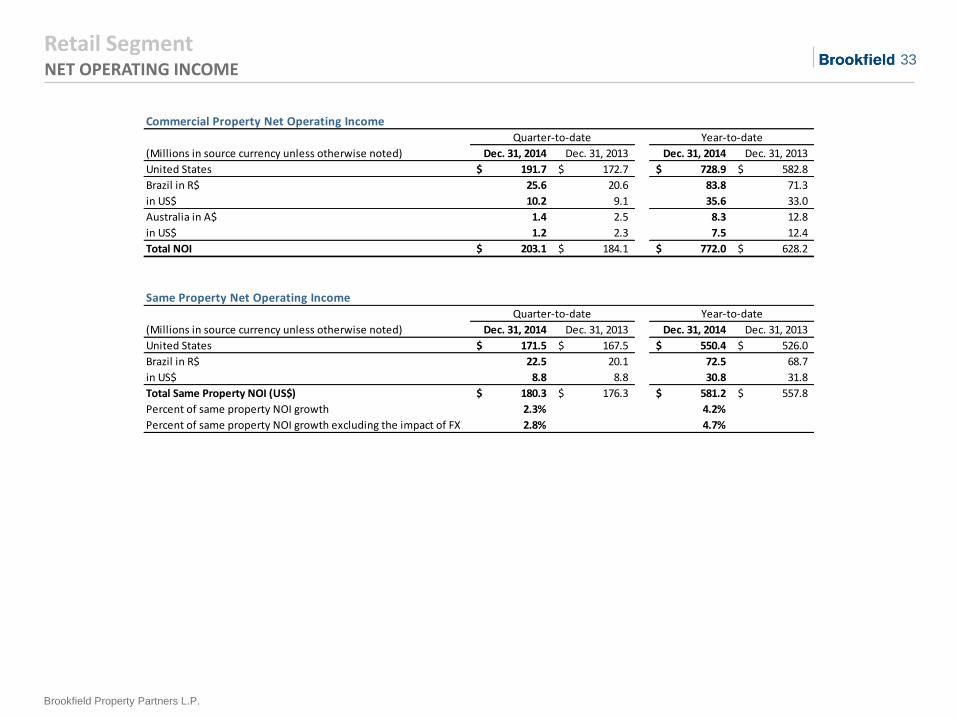
Commercial Property Net Operating Income
Dec. 31, 2014 Dec. 31, 2013 Dec. 31, 2014 Dec. 31, 2013
United States 191.7$ 172.7$ 728.9$ 582.8$
Brazil in R$ 25.6 20.6 83.8 71.3
in US$ 10.2 9.1 35.6 33.0
Australia in A$ 1.4 2.5 8.3 12.8
in US$ 1.2 2.3 7.5 12.4
Total NOI 203.1$ 184.1$ 772.0$ 628.2$
Same Property Net Operating Income
Dec. 31, 2014 Dec. 31, 2013 Dec. 31, 2014 Dec. 31, 2013
United States 171.5$ 167.5$ 550.4$ 526.0$
Brazil in R$ 22.5 20.1 72.5 68.7
in US$ 8.8 8.8 30.8 31.8
Total Same Property NOI (US$) 180.3$ 176.3$ 581.2$ 557.8$
Percent of same property NOI growth 2.3% 4.2%
Percent of same property NOI growth excluding the impact of FX 2.8% 4.7%
(Millions in source currency unless otherwise noted)
Quarter-to-date Year-to-date
(Millions in source currency unless otherwise noted)
Quarter-to-date Year-to-date
34
Brookfield Property Partners L.P.
Retail Segment PORTFOLIO SUMMARY
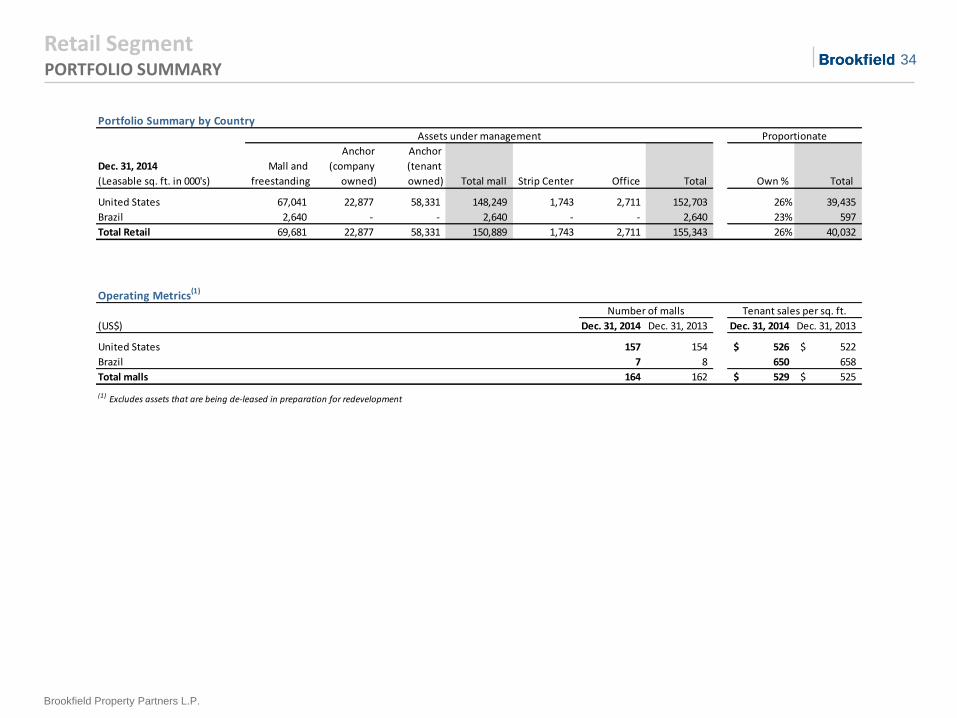
Portfolio Summary by Country
(Leasable sq. ft. in 000's) Strip Center Office Total Own % Total
United States 67,041 22,877 58,331 148,249 1,743 2,711 152,703 26% 39,435
Brazil 2,640 - - 2,640 - - 2,640 23% 597
Total Retail 69,681 22,877 58,331 150,889 1,743 2,711 155,343 26% 40,032
Operating Metrics(1)
(US$) Dec. 31, 2014 Dec. 31, 2013 Dec. 31, 2014 Dec. 31, 2013
United States 157 154 526$ 522$
Brazil 7 8 650 658
Total malls 164 162 529$ 525$
(1) Excludes assets that are being de-leased in preparation for redevelopment
Dec. 31, 2014
Total mall
Assets under management Proportionate
Number of malls Tenant sales per sq. ft.
Mall and
freestanding
Anchor
(company
owned)
Anchor
(tenant
owned)
35
Brookfield Property Partners L.P.
Retail Segment HISTORICAL METRICS
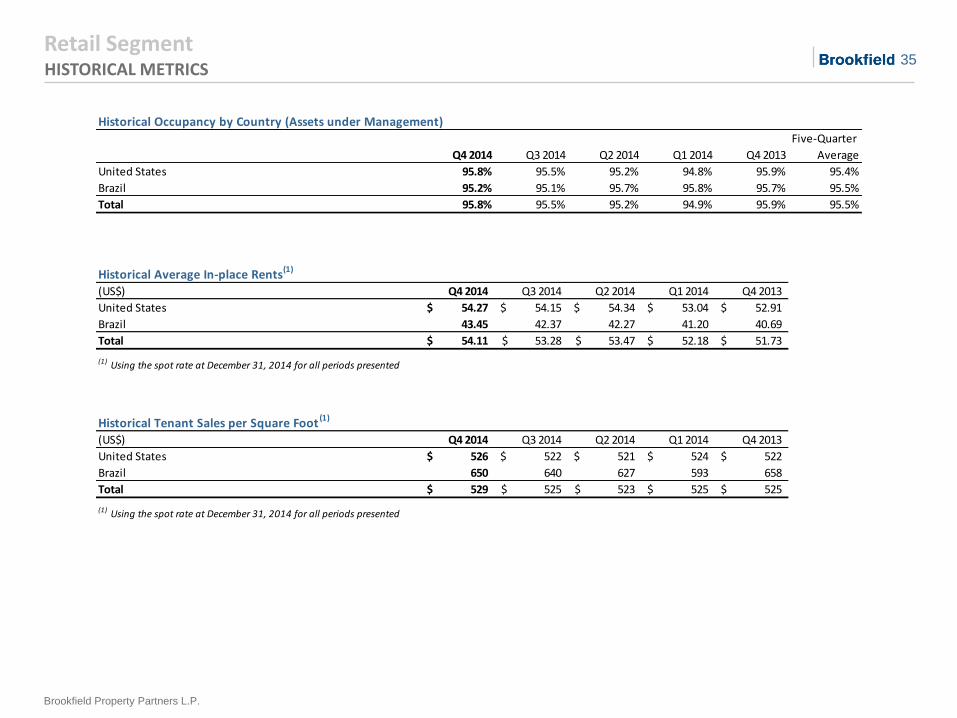
Historical Occupancy by Country (Assets under Management)
Q4 2014 Q3 2014 Q2 2014 Q1 2014 Q4 2013
Five-Quarter
Average
United States 95.8% 95.5% 95.2% 94.8% 95.9% 95.4%
Brazil 95.2% 95.1% 95.7% 95.8% 95.7% 95.5%
Total 95.8% 95.5% 95.2% 94.9% 95.9% 95.5%
Historical Average In-place Rents(1)
(US$) Q4 2014 Q3 2014 Q2 2014 Q1 2014 Q4 2013
United States 54.27$ 54.15$ 54.34$ 53.04$ 52.91$
Brazil 43.45 42.37 42.27 41.20 40.69
Total 54.11$ 53.28$ 53.47$ 52.18$ 51.73$
(1) Using the spot rate at December 31, 2014 for all periods presented
Historical Tenant Sales per Square Foot (1)
(US$) Q4 2014 Q3 2014 Q2 2014 Q1 2014 Q4 2013
United States 526$ 522$ 521$ 524$ 522$
Brazil 650 640 627 593 658
Total 529$ 525$ 523$ 525$ 525$
(1) Using the spot rate at December 31, 2014 for all periods presented
36
Brookfield Property Partners L.P.
Retail Segment LEASING METRICS
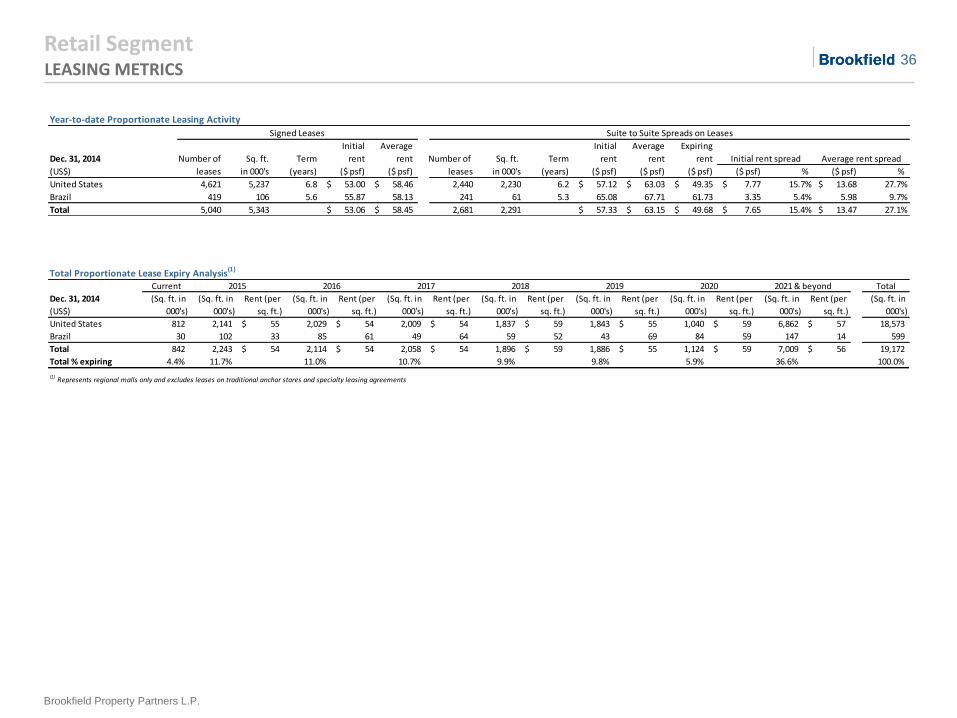
Year-to-date Proportionate Leasing Activity
Initial Average Initial Average Expiring
Dec. 31, 2014 Number of Sq. ft. Term rent rent Number of Sq. ft. Term rent rent rent
(US$) leases in 000's (years) ($ psf) ($ psf) leases in 000's (years) ($ psf) ($ psf) ($ psf) ($ psf) % ($ psf) %
United States 4,621 5,237 6.8 53.00$ 58.46$ 2,440 2,230 6.2 57.12$ 63.03$ 49.35$ 7.77$ 15.7% 13.68$ 27.7%
Brazil 419 106 5.6 55.87 58.13 241 61 5.3 65.08 67.71 61.73 3.35 5.4% 5.98 9.7%
Total 5,040 5,343 53.06$ 58.45$ 2,681 2,291 57.33$ 63.15$ 49.68$ 7.65$ 15.4% 13.47$ 27.1%
Initial rent spread Average rent spread
Signed Leases Suite to Suite Spreads on Leases
Total Proportionate Lease Expiry Analysis(1)
Current Total
(Sq. ft. in
000's)
(Sq. ft. in
000's)
Rent (per
sq. ft.)
(Sq. ft. in
000's)
Rent (per
sq. ft.)
(Sq. ft. in
000's)
Rent (per
sq. ft.)
(Sq. ft. in
000's)
Rent (per
sq. ft.)
(Sq. ft. in
000's)
Rent (per
sq. ft.)
(Sq. ft. in
000's)
Rent (per
sq. ft.)
(Sq. ft. in
000's)
Rent (per
sq. ft.)
(Sq. ft. in
000's)
United States 812 2,141 55$ 2,029 54$ 2,009 54$ 1,837 59$ 1,843 55$ 1,040 59$ 6,862 57$ 18,573
Brazil 30 102 33 85 61 49 64 59 52 43 69 84 59 147 14 599
Total 842 2,243 54$ 2,114 54$ 2,058 54$ 1,896 59$ 1,886 55$ 1,124 59$ 7,009 56$ 19,172
Total % expiring 4.4% 11.7% 11.0% 10.7% 9.9% 9.8% 5.9% 36.6% 100.0%
(1) Represents regional malls only and excludes leases on traditional anchor stores and specialty leasing agreements
2020 2021 & beyond
Dec. 31, 2014
(US$)
2015 2016 2017 2018 2019
37
Brookfield Property Partners L.P.
Retail Segment TOP TENANTS
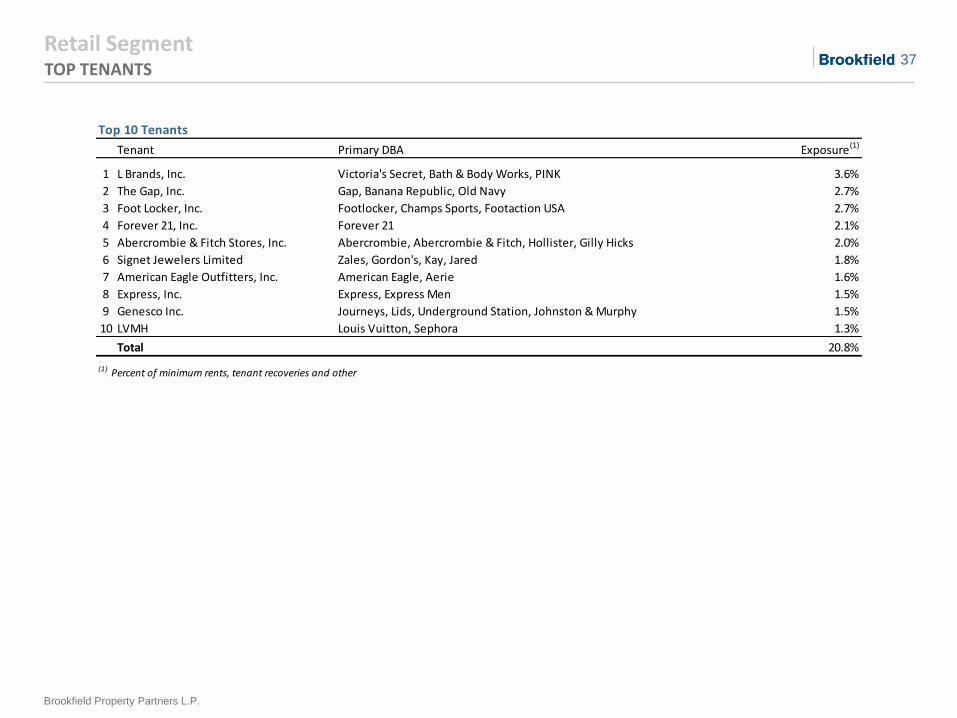
Top 10 Tenants
Tenant Primary DBA Exposure(1)
1 L Brands, Inc. Victoria's Secret, Bath & Body Works, PINK 3.6%
2 The Gap, Inc. Gap, Banana Republic, Old Navy 2.7%
3 Foot Locker, Inc. Footlocker, Champs Sports, Footaction USA 2.7%
4 Forever 21, Inc. Forever 21 2.1%
5 Abercrombie & Fitch Stores, Inc. Abercrombie, Abercrombie & Fitch, Hollister, Gilly Hicks 2.0%
6 Signet Jewelers Limited Zales, Gordon's, Kay, Jared 1.8%
7 American Eagle Outfitters, Inc. American Eagle, Aerie 1.6%
8 Express, Inc. Express, Express Men 1.5%
9 Genesco Inc. Journeys, Lids, Underground Station, Johnston & Murphy 1.5%
10 LVMH Louis Vuitton, Sephora 1.3%
Total 20.8%
(1) Percent of minimum rents, tenant recoveries and other
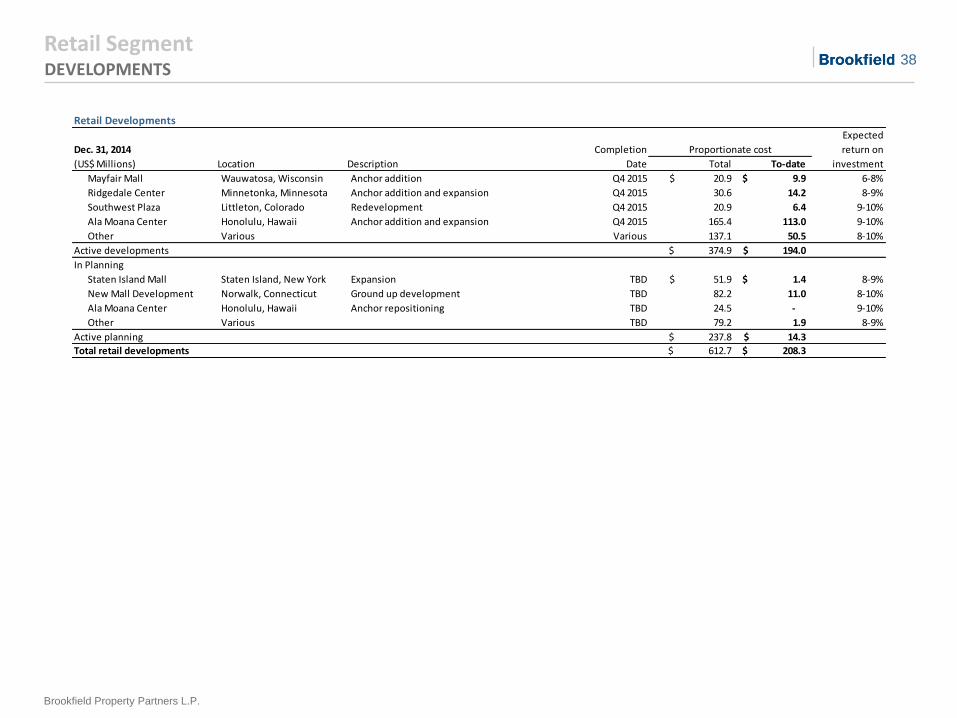
38
Brookfield Property Partners L.P.
Retail Segment DEVELOPMENTS
Retail Developments
Dec. 31, 2014
Expected
return on
(US$ Millions) Location Description Total To-date investment
Mayfair Mall Wauwatosa, Wisconsin Anchor addition Q4 2015 20.9$ 9.9$ 6-8%
Ridgedale Center Minnetonka, Minnesota Anchor addition and expansion Q4 2015 30.6 14.2 8-9%
Southwest Plaza Littleton, Colorado Redevelopment Q4 2015 20.9 6.4 9-10%
Ala Moana Center Honolulu, Hawaii Anchor addition and expansion Q4 2015 165.4 113.0 9-10%
Other Various Various 137.1 50.5 8-10%
Active developments 374.9$ 194.0$
In Planning
Staten Island Mall Staten Island, New York Expansion TBD 51.9$ 1.4$ 8-9%
New Mall Development Norwalk, Connecticut Ground up development TBD 82.2 11.0 8-10%
Ala Moana Center Honolulu, Hawaii Anchor repositioning TBD 24.5 - 9-10%
Other Various TBD 79.2 1.9 8-9%
Active planning 237.8$ 14.3$
Total retail developments 612.7$ 208.3$
Completion
Date
Proportionate cost
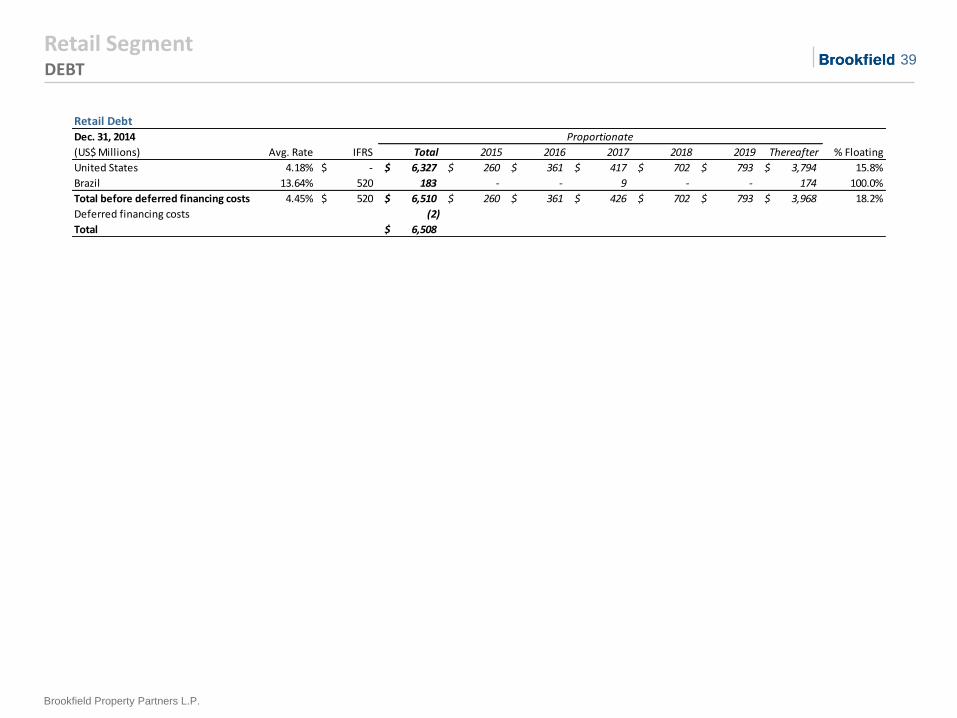
39
Brookfield Property Partners L.P.
Retail Segment DEBT
Retail Debt
Dec. 31, 2014
Avg. Rate IFRS Total 2015 2016 2017 2018 2019 Thereafter % Floating
United States 4.18% -$ 6,327$ 260$ 361$ 417$ 702$ 793$ 3,794$ 15.8%
Brazil 13.64% 520 183 - - 9 - - 174 100.0%
Total before deferred financing costs 4.45% 520$ 6,510$ 260$ 361$ 426$ 702$ 793$ 3,968$ 18.2%
Deferred financing costs (2)
Total 6,508$
Proportionate
(US$ Millions)

Other Segments
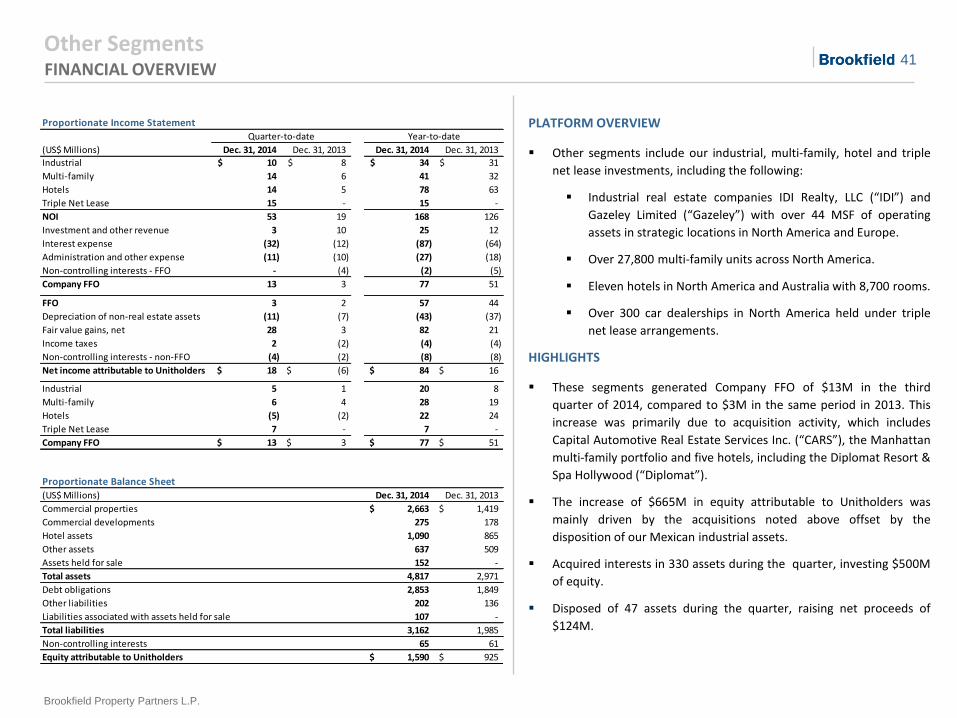
41
Brookfield Property Partners L.P.
Other Segments
PLATFORM OVERVIEW
Other segments include our industrial, multi-family, hotel and triple
net lease investments, including the following:
Industrial real estate companies IDI Realty, LLC (“IDI”) and
Gazeley Limited (“Gazeley”) with over 44 MSF of operating
assets in strategic locations in North America and Europe.
Over 27,800 multi-family units across North America.
Eleven hotels in North America and Australia with 8,700 rooms.
Over 300 car dealerships in North America held under triple
net lease arrangements.
HIGHLIGHTS
These segments generated Company FFO of $13M in the third
quarter of 2014, compared to $3M in the same period in 2013. This
increase was primarily due to acquisition activity, which includes
Capital Automotive Real Estate Services Inc. (“CARS”), the Manhattan
multi-family portfolio and five hotels, including the Diplomat Resort &
Spa Hollywood (“Diplomat”).
The increase of $665M in equity attributable to Unitholders was
mainly driven by the acquisitions noted above offset by the
disposition of our Mexican industrial assets.
Acquired interests in 330 assets during the quarter, investing $500M
of equity.
Disposed of 47 assets during the quarter, raising net proceeds of
$124M.
FINANCIAL OVERVIEW
Proportionate Income Statement
(US$ Millions) Dec. 31, 2014 Dec. 31, 2013 Dec. 31, 2014 Dec. 31, 2013
Industrial 10$ 8$ 34$ 31$
Multi-family 14 6 41 32
Hotels 14 5 78 63
Triple Net Lease 15 - 15 -
NOI 53 19 168 126
Investment and other revenue 3 10 25 12
Interest expense (32) (12) (87) (64)
Administration and other expense (11) (10) (27) (18)
Non-controlling interests - FFO - (4) (2) (5)
Company FFO 13 3 77 51
FFO 3 2 57 44
Depreciation of non-real estate assets (11) (7) (43) (37)
Fair value gains, net 28 3 82 21
Income taxes 2 (2) (4) (4)
Non-controlling interests - non-FFO (4) (2) (8) (8)
Net income attributable to Unitholders 18$ (6)$ 84$ 16$
Industrial 5 1 20 8
Multi-family 6 4 28 19
Hotels (5) (2) 22 24
Triple Net Lease 7 - 7 -
Company FFO 13$ 3$ 77$ 51$
Proportionate Balance Sheet(US$ Millions) Dec. 31, 2014 Dec. 31, 2013
Commercial properties 2,663$ 1,419$
Commercial developments 275 178
Hotel assets 1,090 865
Other assets 637 509
Assets held for sale 152 -
Total assets 4,817 2,971
Debt obligations 2,853 1,849
Other liabilities 202 136
Liabilities associated with assets held for sale 107 -
Total liabilities 3,162 1,985
Non-controlling interests 65 61
Equity attributable to Unitholders 1,590$ 925$
Quarter-to-date Year-to-date
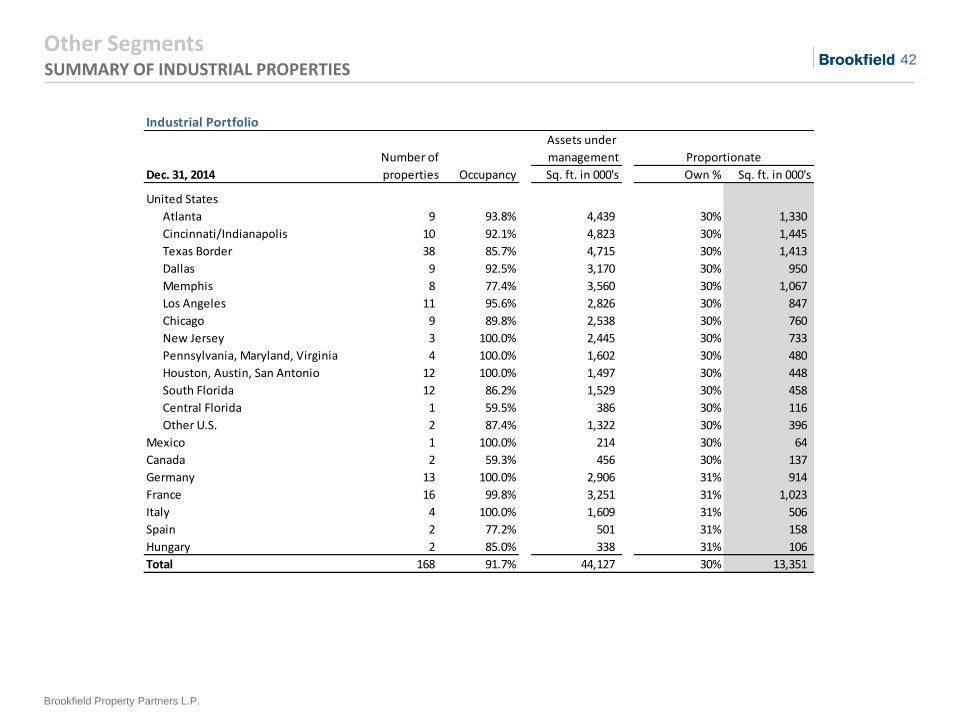
42
Brookfield Property Partners L.P.
Other Segments SUMMARY OF INDUSTRIAL PROPERTIES
Industrial Portfolio
Number of
Assets under
management
properties Occupancy Sq. ft. in 000's Own % Sq. ft. in 000's
United States
AtlantaAtlanta 9 93.8% 4,439 30% 1,330
Cincinnati/IndianapolisCincinnati/Indianapolis 10 92.1% 4,823 30% 1,445
Texas BorderTexas Border 38 85.7% 4,715 30% 1,413
DallasDallas 9 92.5% 3,170 30% 950
MemphisMemphis 8 77.4% 3,560 30% 1,067
Los AngelesLos Angeles 11 95.6% 2,826 30% 847
ChicagoChicago 9 89.8% 2,538 30% 760
New JerseyNew Jersey 3 100.0% 2,445 30% 733
Pennsylvania, Maryland, VirginiaPennsylvania, Maryland, Virginia 4 100.0% 1,602 30% 480
Houston, Austin, San AntonioHouston, Austin, San Antonio 12 100.0% 1,497 30% 448
South FloridaSouth Florida 12 86.2% 1,529 30% 458
Central FloridaCentral Florida 1 59.5% 386 30% 116
Other U.S.Other U.S. 2 87.4% 1,322 30% 396
Mexico 1 100.0% 214 30% 64
Canada 2 59.3% 456 30% 137
Germany 13 100.0% 2,906 31% 914
France 16 99.8% 3,251 31% 1,023
Italy 4 100.0% 1,609 31% 506
Spain 2 77.2% 501 31% 158
Hungary 2 85.0% 338 31% 106
Total 168 91.7% 44,127 30% 13,351
Dec. 31, 2014
Proportionate
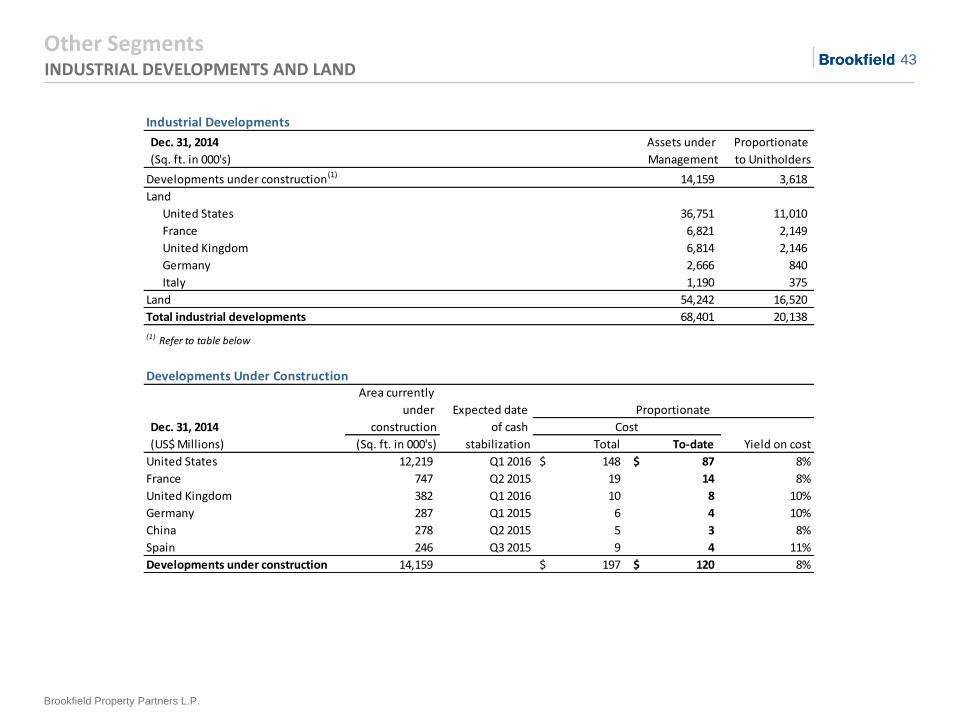
43
Brookfield Property Partners L.P.
Other Segments INDUSTRIAL DEVELOPMENTS AND LAND
Industrial Developments
Dec. 31, 2014
(Sq. ft. in 000's)
Developments under construction(1) 14,159 3,618
Land
United States 36,751 11,010
France 6,821 2,149
United Kingdom 6,814 2,146
Germany 2,666 840
Italy 1,190 375
Land 54,242 16,520
Total industrial developments 68,401 20,138
(1) Refer to table below
Developments Under Construction
Dec. 31, 2014
(US$ Millions) (Sq. ft. in 000's) Total To-date
United States 12,219 Q1 2016 148$ 87$ 8%
France 747 Q2 2015 19 14 8%
United Kingdom 382 Q1 2016 10 8 10%
Germany 287 Q1 2015 6 4 10%
China 278 Q2 2015 5 3 8%
Spain 246 Q3 2015 9 4 11%
Developments under construction 14,159 197$ 120$ 8%
Assets under
Management
Proportionate
to Unitholders
Area currently
under
construction
Expected date
of cash
stabilization
Proportionate
Cost
Yield on cost
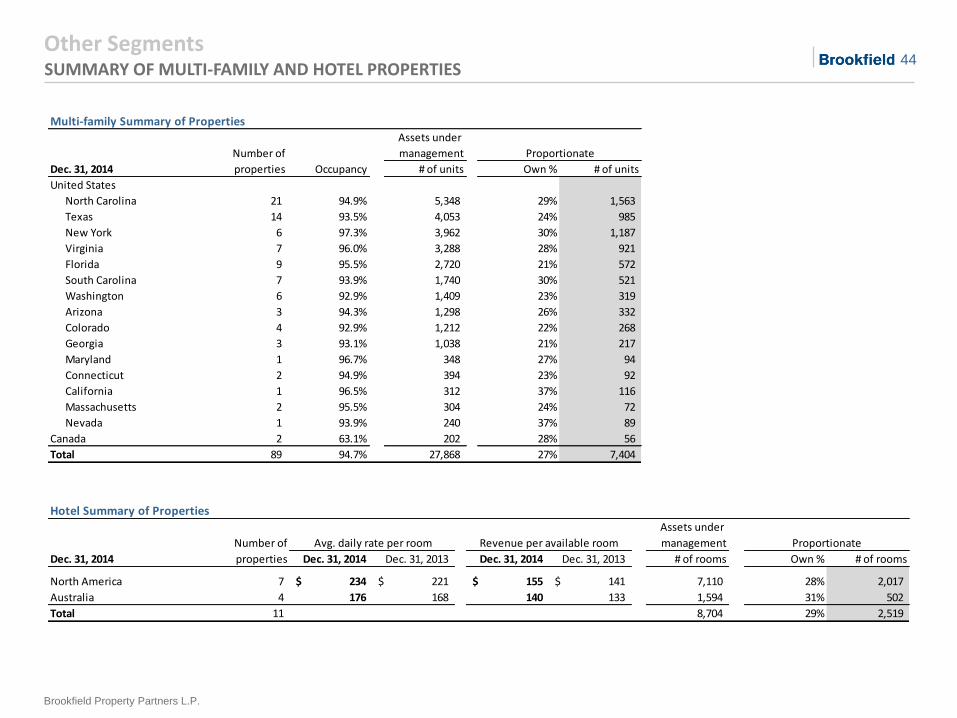
44
Brookfield Property Partners L.P.
Other Segments SUMMARY OF MULTI-FAMILY AND HOTEL PROPERTIES
Multi-family Summary of Properties
Number of
Assets under
management
properties Occupancy # of units Own % # of units
United States
NCNorth Carolina 21 94.9% 5,348 29% 1,563
TXTexas 14 93.5% 4,053 24% 985
NYNew York 6 97.3% 3,962 30% 1,187
VAVirginia 7 96.0% 3,288 28% 921
FLFlorida 9 95.5% 2,720 21% 572
SCSouth Carolina 7 93.9% 1,740 30% 521
WAWashington 6 92.9% 1,409 23% 319
AZArizona 3 94.3% 1,298 26% 332
COColorado 4 92.9% 1,212 22% 268
GAGeorgia 3 93.1% 1,038 21% 217
MDMaryland 1 96.7% 348 27% 94
CTConnecticut 2 94.9% 394 23% 92
CACalifornia 1 96.5% 312 37% 116
MAMassachusetts 2 95.5% 304 24% 72
NVNevada 1 93.9% 240 37% 89
Canada 2 63.1% 202 28% 56
Total 89 94.7% 27,868 27% 7,404
Proportionate
Dec. 31, 2014
Hotel Summary of Properties
Number of
properties Dec. 31, 2014 Dec. 31, 2013 Dec. 31, 2014 Dec. 31, 2013 # of rooms Own % # of rooms
North America 7 234$ 221$ 155$ 141$ 7,110 28% 2,017
Australia 4 176 168 140 133 1,594 31% 502
Total 11 8,704 29% 2,519
Dec. 31, 2014
Assets under
management ProportionateRevenue per available room Avg. daily rate per room
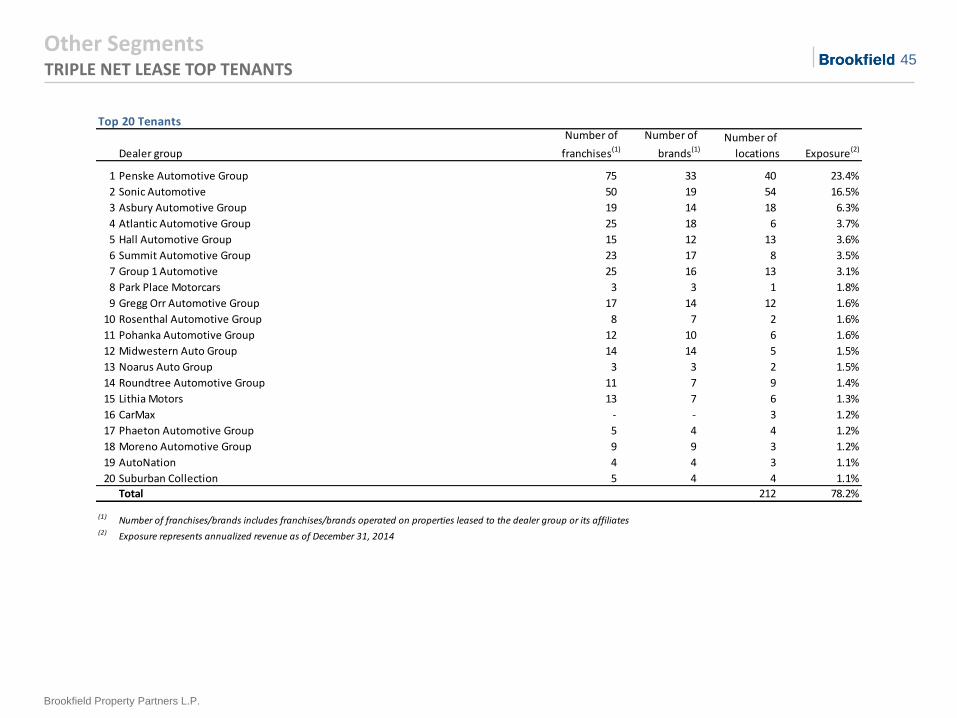
45
Brookfield Property Partners L.P.
Other Segments TRIPLE NET LEASE TOP TENANTS
Top 20 Tenants
Dealer group
Number of
franchises(1)
Number of
brands(1)
Number of
locations Exposure(2)
1 Penske Automotive Group 75 33 40 23.4%
2 Sonic Automotive 50 19 54 16.5%
3 Asbury Automotive Group 19 14 18 6.3%
4 Atlantic Automotive Group 25 18 6 3.7%
5 Hall Automotive Group 15 12 13 3.6%
6 Summit Automotive Group 23 17 8 3.5%
7 Group 1 Automotive 25 16 13 3.1%
8 Park Place Motorcars 3 3 1 1.8%
9 Gregg Orr Automotive Group 17 14 12 1.6%
10 Rosenthal Automotive Group 8 7 2 1.6%
11 Pohanka Automotive Group 12 10 6 1.6%
12 Midwestern Auto Group 14 14 5 1.5%
13 Noarus Auto Group 3 3 2 1.5%
14 Roundtree Automotive Group 11 7 9 1.4%
15 Lithia Motors 13 7 6 1.3%
16 CarMax - - 3 1.2%
17 Phaeton Automotive Group 5 4 4 1.2%
18 Moreno Automotive Group 9 9 3 1.2%
19 AutoNation 4 4 3 1.1%
20 Suburban Collection 5 4 4 1.1%
Total 212 78.2%
(1) Number of franchises/brands includes franchises/brands operated on properties leased to the dealer group or its affiliates(2) Exposure represents annualized revenue as of December 31, 2014
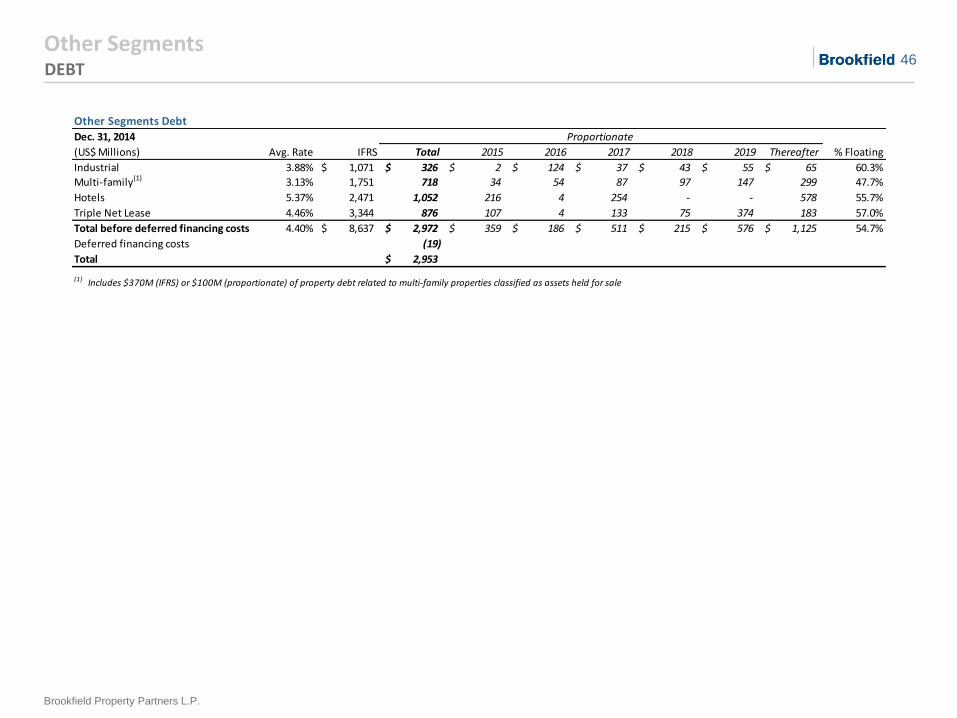
46
Brookfield Property Partners L.P.
Other Segments DEBT
Other Segments Debt
Dec. 31, 2014
Avg. Rate IFRS Total 2015 2016 2017 2018 2019 Thereafter % Floating
Industrial 3.88% 1,071$ 326$ 2$ 124$ 37$ 43$ 55$ 65$ 60.3%
Multi-family(1) 3.13% 1,751 718 34 54 87 97 147 299 47.7%
Hotels 5.37% 2,471 1,052 216 4 254 - - 578 55.7%
Triple Net Lease 4.46% 3,344 876 107 4 133 75 374 183 57.0%
Total before deferred financing costs 4.40% 8,637$ 2,972$ 359$ 186$ 511$ 215$ 576$ 1,125$ 54.7%
Deferred financing costs (19)
Total 2,953$
(1) Includes $370M (IFRS) or $100M (proportionate) of property debt related to multi-family properties classified as assets held for sale
Proportionate
(US$ Millions)

Corporate
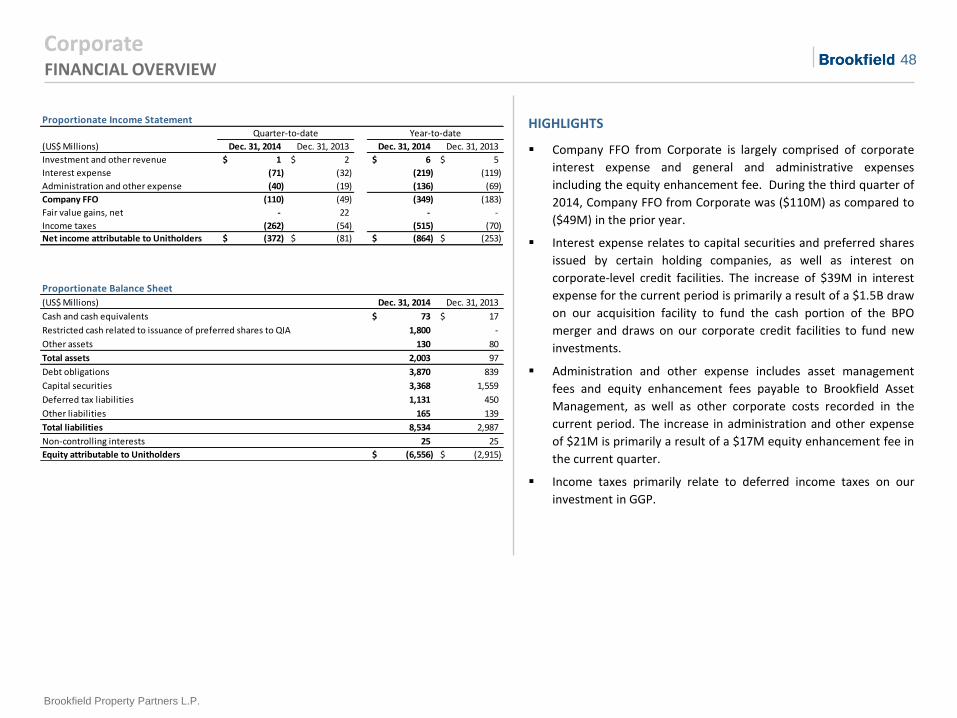
48
Brookfield Property Partners L.P.
Corporate
HIGHLIGHTS
Company FFO from Corporate is largely comprised of corporate
interest expense and general and administrative expenses
including the equity enhancement fee. During the third quarter of
2014, Company FFO from Corporate was ($110M) as compared to
($49M) in the prior year.
Interest expense relates to capital securities and preferred shares
issued by certain holding companies, as well as interest on
corporate-level credit facilities. The increase of $39M in interest
expense for the current period is primarily a result of a $1.5B draw
on our acquisition facility to fund the cash portion of the BPO
merger and draws on our corporate credit facilities to fund new
investments.
Administration and other expense includes asset management
fees and equity enhancement fees payable to Brookfield Asset
Management, as well as other corporate costs recorded in the
current period. The increase in administration and other expense
of $21M is primarily a result of a $17M equity enhancement fee in
the current quarter.
Income taxes primarily relate to deferred income taxes on our
investment in GGP.
FINANCIAL OVERVIEW
Proportionate Income Statement
(US$ Millions) Dec. 31, 2014 Dec. 31, 2013 Dec. 31, 2014 Dec. 31, 2013
Investment and other revenue 1$ 2$ 6$ 5$
Interest expense (71) (32) (219) (119)
Administration and other expense (40) (19) (136) (69)
Company FFO (110) (49) (349) (183)
Fair value gains, net - 22 - -
Income taxes (262) (54) (515) (70)
Net income attributable to Unitholders (372)$ (81)$ (864)$ (253)$
Proportionate Balance Sheet
(US$ Millions) Dec. 31, 2014 Dec. 31, 2013
Cash and cash equivalents 73$ 17$
Restricted cash related to issuance of preferred shares to QIA 1,800 -
Other assets 130 80
Total assets 2,003 97
Debt obligations 3,870 839
Capital securities 3,368 1,559
Deferred tax liabilities 1,131 450
Other liabilities 165 139
Total liabilities 8,534 2,987
Non-controlling interests 25 25
Equity attributable to Unitholders (6,556)$ (2,915)$
Quarter-to-date Year-to-date
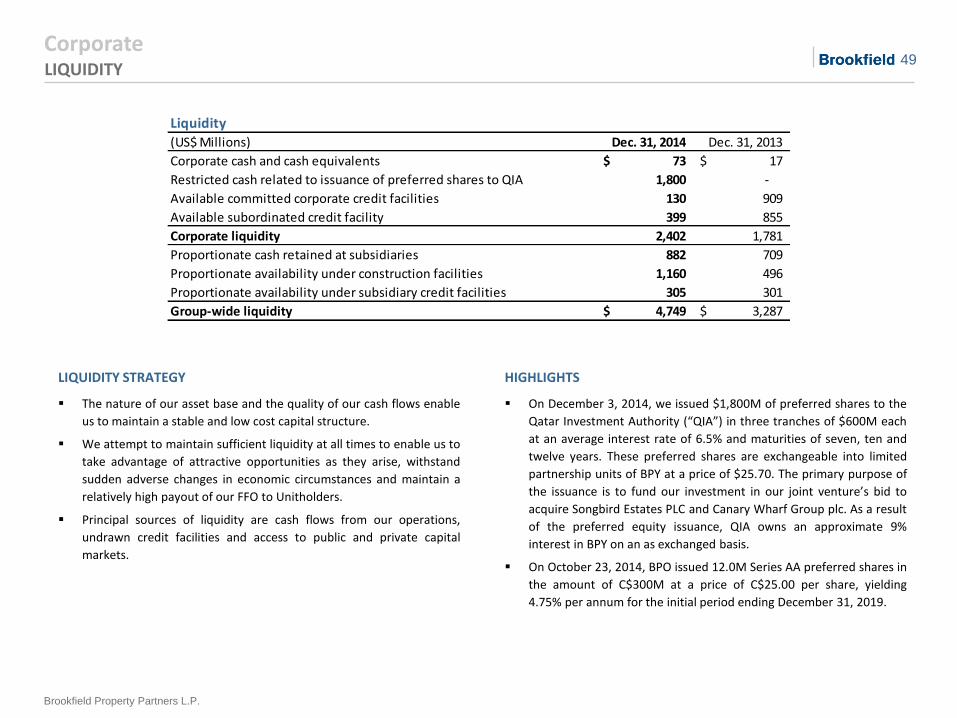
49
Brookfield Property Partners L.P.
Corporate
HIGHLIGHTS
On December 3, 2014, we issued $1,800M of preferred shares to the
Qatar Investment Authority (“QIA”) in three tranches of $600M each
at an average interest rate of 6.5% and maturities of seven, ten and
twelve years. These preferred shares are exchangeable into limited
partnership units of BPY at a price of $25.70. The primary purpose of
the issuance is to fund our investment in our joint venture’s bid to
acquire Songbird Estates PLC and Canary Wharf Group plc. As a result
of the preferred equity issuance, QIA owns an approximate 9%
interest in BPY on an as exchanged basis.
On October 23, 2014, BPO issued 12.0M Series AA preferred shares in
the amount of C$300M at a price of C$25.00 per share, yielding
4.75% per annum for the initial period ending December 31, 2019.
LIQUIDITY
LIQUIDITY STRATEGY
The nature of our asset base and the quality of our cash flows enable
us to maintain a stable and low cost capital structure.
We attempt to maintain sufficient liquidity at all times to enable us to
take advantage of attractive opportunities as they arise, withstand
sudden adverse changes in economic circumstances and maintain a
relatively high payout of our FFO to Unitholders.
Principal sources of liquidity are cash flows from our operations,
undrawn credit facilities and access to public and private capital
markets.
Liquidity
(US$ Millions) Dec. 31, 2014 Dec. 31, 2013
Corporate cash and cash equivalents 73$ 17$
Restricted cash related to issuance of preferred shares to QIA 1,800 -
Available committed corporate credit facilities 130 909
Available subordinated credit facility 399 855
Corporate liquidity 2,402 1,781
Proportionate cash retained at subsidiaries 882 709
Proportionate availability under construction facilities 1,160 496
Proportionate availability under subsidiary credit facilities 305 301
Group-wide liquidity 4,749$ 3,287$
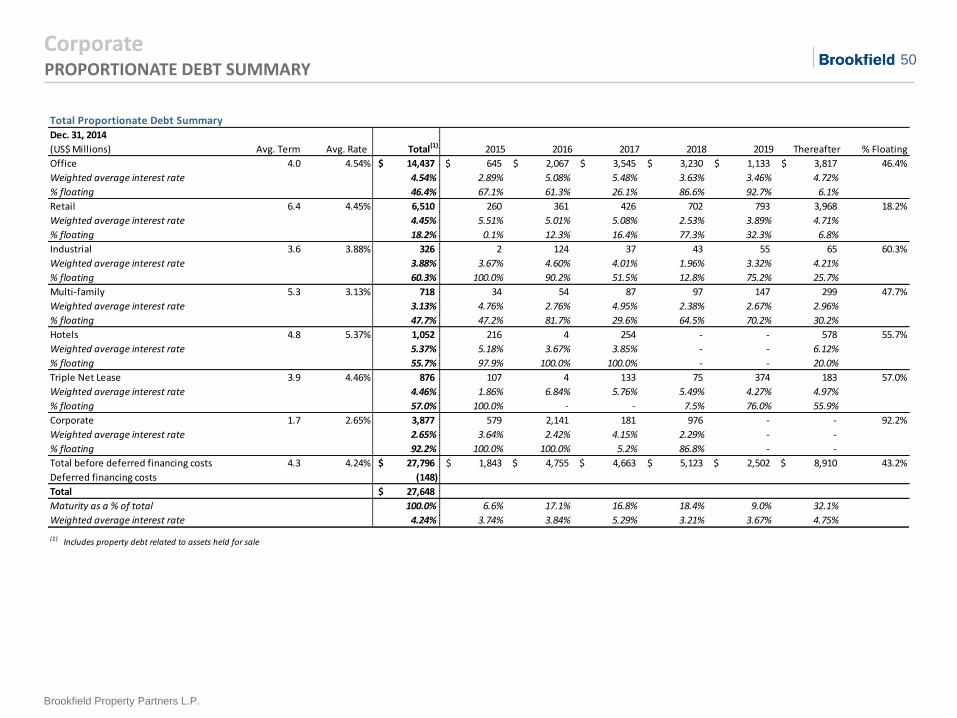
50
Brookfield Property Partners L.P.
Corporate PROPORTIONATE DEBT SUMMARY
Total Proportionate Debt Summary
Avg. Term Avg. Rate Total(1) 2015 2016 2017 2018 2019 Thereafter % Floating
Office 4.0 4.54% 14,437$ 645$ 2,067$ 3,545$ 3,230$ 1,133$ 3,817$ 46.4%
Weighted average interest rate 4.54% 2.89% 5.08% 5.48% 3.63% 3.46% 4.72%
% floating 46.4% 67.1% 61.3% 26.1% 86.6% 92.7% 6.1%
Retail 6.4 4.45% 6,510 260 361 426 702 793 3,968 18.2%
Weighted average interest rate 4.45% 5.51% 5.01% 5.08% 2.53% 3.89% 4.71%
% floating 18.2% 0.1% 12.3% 16.4% 77.3% 32.3% 6.8%
Industrial 3.6 3.88% 326 2 124 37 43 55 65 60.3%
Weighted average interest rate 3.88% 3.67% 4.60% 4.01% 1.96% 3.32% 4.21%
% floating 60.3% 100.0% 90.2% 51.5% 12.8% 75.2% 25.7%
Multi-family 5.3 3.13% 718 34 54 87 97 147 299 47.7%
Weighted average interest rate 3.13% 4.76% 2.76% 4.95% 2.38% 2.67% 2.96%
% floating 47.7% 47.2% 81.7% 29.6% 64.5% 70.2% 30.2%
Hotels 4.8 5.37% 1,052 216 4 254 - - 578 55.7%
Weighted average interest rate 5.37% 5.18% 3.67% 3.85% - - 6.12%
% floating 55.7% 97.9% 100.0% 100.0% - - 20.0%
Triple Net Lease 3.9 4.46% 876 107 4 133 75 374 183 57.0%
Weighted average interest rate 4.46% 1.86% 6.84% 5.76% 5.49% 4.27% 4.97%
% floating 57.0% 100.0% - - 7.5% 76.0% 55.9%
Corporate 1.7 2.65% 3,877 579 2,141 181 976 - - 92.2%
Weighted average interest rate 2.65% 3.64% 2.42% 4.15% 2.29% - -
% floating 92.2% 100.0% 100.0% 5.2% 86.8% - -
Total before deferred financing costs 4.3 4.24% 27,796$ 1,843$ 4,755$ 4,663$ 5,123$ 2,502$ 8,910$ 43.2%
Deferred financing costs (148)
Total 27,648$
Maturity as a % of total 100.0% 6.6% 17.1% 16.8% 18.4% 9.0% 32.1%
Weighted average interest rate 4.24% 3.74% 3.84% 5.29% 3.21% 3.67% 4.75%
(1) Includes property debt related to assets held for sale
Dec. 31, 2014
(US$ Millions)
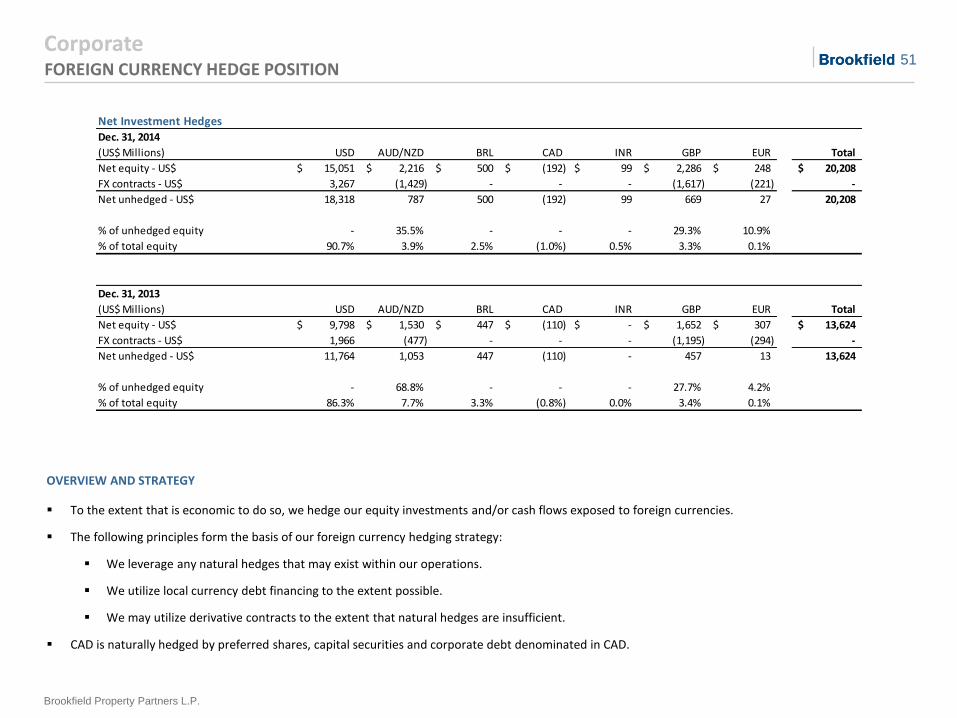
51
Brookfield Property Partners L.P.
Corporate FOREIGN CURRENCY HEDGE POSITION
OVERVIEW AND STRATEGY
To the extent that is economic to do so, we hedge our equity investments and/or cash flows exposed to foreign currencies.
The following principles form the basis of our foreign currency hedging strategy:
We leverage any natural hedges that may exist within our operations.
We utilize local currency debt financing to the extent possible.
We may utilize derivative contracts to the extent that natural hedges are insufficient.
CAD is naturally hedged by preferred shares, capital securities and corporate debt denominated in CAD.
Net Investment Hedges
Dec. 31, 2014
(US$ Millions) USD AUD/NZD BRL CAD INR GBP EUR Total
Net equity - US$ 15,051$ 2,216$ 500$ (192)$ 99$ 2,286$ 248$ 20,208$
FX contracts - US$ 3,267 (1,429) - - - (1,617) (221) -
Net unhedged - US$ 18,318 787 500 (192) 99 669 27 20,208
% of unhedged equity - 35.5% - - - 29.3% 10.9%
% of total equity 90.7% 3.9% 2.5% (1.0%) 0.5% 3.3% 0.1%
Dec. 31, 2013
(US$ Millions) USD AUD/NZD BRL CAD INR GBP EUR Total
Net equity - US$ 9,798$ 1,530$ 447$ (110)$ -$ 1,652$ 307$ 13,624$
FX contracts - US$ 1,966 (477) - - - (1,195) (294) -
Net unhedged - US$ 11,764 1,053 447 (110) - 457 13 13,624
% of unhedged equity - 68.8% - - - 27.7% 4.2%
% of total equity 86.3% 7.7% 3.3% (0.8%) 0.0% 3.4% 0.1%
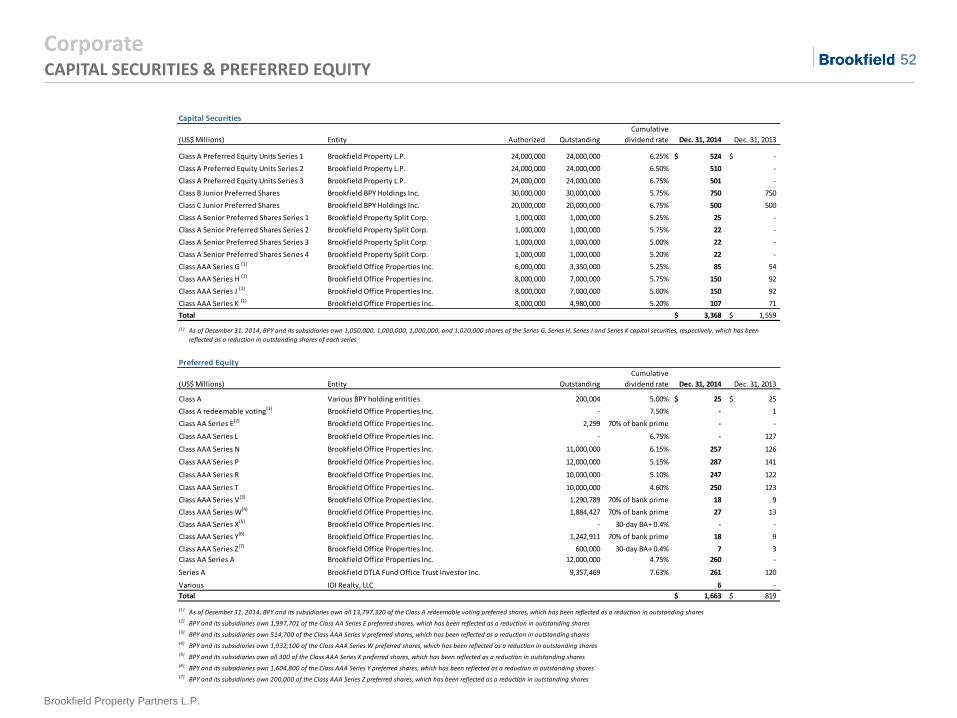
52
Brookfield Property Partners L.P.
Corporate CAPITAL SECURITIES & PREFERRED EQUITY
Capital Securities
Cumulative
(US$ Millions) Entity Authorized Outstanding dividend rate Dec. 31, 2014 Dec. 31, 2013
Class A Preferred Equity Units Series 1 Brookfield Property L.P. 24,000,000 24,000,000 6.25% 524$ -$
Class A Preferred Equity Units Series 2 Brookfield Property L.P. 24,000,000 24,000,000 6.50% 510 -
Class A Preferred Equity Units Series 3 Brookfield Property L.P. 24,000,000 24,000,000 6.75% 501 -
Class B Junior Preferred Shares Brookfield BPY Holdings Inc. 30,000,000 30,000,000 5.75% 750 750
Class C Junior Preferred Shares Brookfield BPY Holdings Inc. 20,000,000 20,000,000 6.75% 500 500
Class A Senior Preferred Shares Series 1 Brookfield Property Split Corp. 1,000,000 1,000,000 5.25% 25 -
Class A Senior Preferred Shares Series 2 Brookfield Property Split Corp. 1,000,000 1,000,000 5.75% 22 -
Class A Senior Preferred Shares Series 3 Brookfield Property Split Corp. 1,000,000 1,000,000 5.00% 22 -
Class A Senior Preferred Shares Series 4 Brookfield Property Split Corp. 1,000,000 1,000,000 5.20% 22 -
Class AAA Series G (1) Brookfield Office Properties Inc. 6,000,000 3,350,000 5.25% 85 54
Class AAA Series H (1) Brookfield Office Properties Inc. 8,000,000 7,000,000 5.75% 150 92
Class AAA Series J (1) Brookfield Office Properties Inc. 8,000,000 7,000,000 5.00% 150 92
Class AAA Series K (1) Brookfield Office Properties Inc. 8,000,000 4,980,000 5.20% 107 71
Total 3,368$ 1,559$
(1)
Preferred Equity
Cumulative
(US$ Millions) Entity Outstanding dividend rate Dec. 31, 2014 Dec. 31, 2013
Class A Various BPY holding entities 200,004 5.00% 25$ 25$
Class A redeemable voting(1) Brookfield Office Properties Inc. - 7.50% - 1
Class AA Series E(2) Brookfield Office Properties Inc. 2,299 70% of bank prime - -
Class AAA Series L Brookfield Office Properties Inc. - 6.75% - 127
Class AAA Series N Brookfield Office Properties Inc. 11,000,000 6.15% 257 126
Class AAA Series P Brookfield Office Properties Inc. 12,000,000 5.15% 287 141
Class AAA Series R Brookfield Office Properties Inc. 10,000,000 5.10% 247 122
Class AAA Series T Brookfield Office Properties Inc. 10,000,000 4.60% 250 123
Class AAA Series V(3) Brookfield Office Properties Inc. 1,290,789 70% of bank prime 18 9
Class AAA Series W(4) Brookfield Office Properties Inc. 1,884,427 70% of bank prime 27 13
Class AAA Series X(5) Brookfield Office Properties Inc. - 30-day BA+ 0.4% - -
Class AAA Series Y(6) Brookfield Office Properties Inc. 1,242,911 70% of bank prime 18 9
Class AAA Series Z(7) Brookfield Office Properties Inc. 600,000 30-day BA+ 0.4% 7 3
Class AA Series A Brookfield Office Properties Inc. 12,000,000 4.75% 260 -
Series A Brookfield DTLA Fund Office Trust Investor Inc. 9,357,469 7.63% 261 120
Various IDI Realty, LLC 6 -
Total 1,663$ 819$
(1)
(2)
(3)
(4)
(5)
(6)
(7)
BPY and its subsidiaries own 1,997,701 of the Class AA Series E preferred shares, which has been reflected as a reduction in outstanding shares
BPY and its subsidiaries own 514,700 of the Class AAA Series V preferred shares, which has been reflected as a reduction in outstanding shares
BPY and its subsidiaries own 1,932,100 of the Class AAA Series W preferred shares, which has been reflected as a reduction in outstanding shares
BPY and its subsidiaries own all 300 of the Class AAA Series X preferred shares, which has been reflected as a reduction in outstanding shares
BPY and its subsidiaries own 1,604,800 of the Class AAA Series Y preferred shares, which has been reflected as a reduction in outstanding shares
BPY and its subsidiaries own 200,000 of the Class AAA Series Z preferred shares, which has been reflected as a reduction in outstanding shares
As of December 31, 2014, BPY and its subsidiaries own 1,050,000, 1,000,000, 1,000,000, and 1,020,000 shares of the Series G, Series H, Series J and Series K capital securities, respectively, which has been
reflected as a reduction in outstanding shares of each series
As of December 31, 2014, BPY and its subsidiaries own all 13,797,320 of the Class A redeemable voting preferred shares, which has been reflected as a reduction in outstanding shares
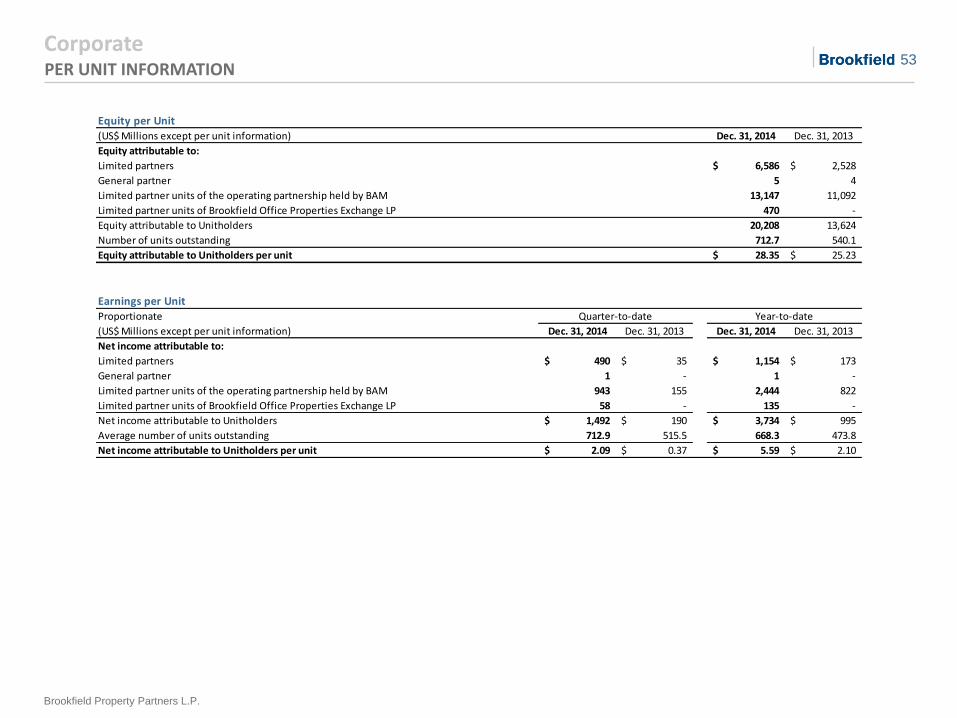
53
Brookfield Property Partners L.P.
Corporate PER UNIT INFORMATION
Equity per Unit(US$ Millions except per unit information) Dec. 31, 2014 Dec. 31, 2013
Equity attributable to:
Limited partners 6,586$ 2,528$
General partner 5 4
13,147 11,092
Limited partner units of Brookfield Office Properties Exchange LP 470 -
Equity attributable to Unitholders 20,208 13,624
Number of units outstanding 712.7 540.1
Equity attributable to Unitholders per unit 28.35$ 25.23$
Earnings per UnitProportionate
(US$ Millions except per unit information) Dec. 31, 2014 Dec. 31, 2013 Dec. 31, 2014 Dec. 31, 2013
Net income attributable to:
Limited partners 490$ 35$ 1,154$ 173$
General partner 1 - 1 -
Limited partner units of the operating partnership held by BAM 943 155 2,444 822
Limited partner units of Brookfield Office Properties Exchange LP 58 - 135 -
Net income attributable to Unitholders 1,492$ 190$ 3,734$ 995$
Average number of units outstanding 712.9 515.5 668.3 473.8
Net income attributable to Unitholders per unit 2.09$ 0.37$ 5.59$ 2.10$
Year-to-dateQuarter-to-date
Limited partner units of the operating partnership held by BAM
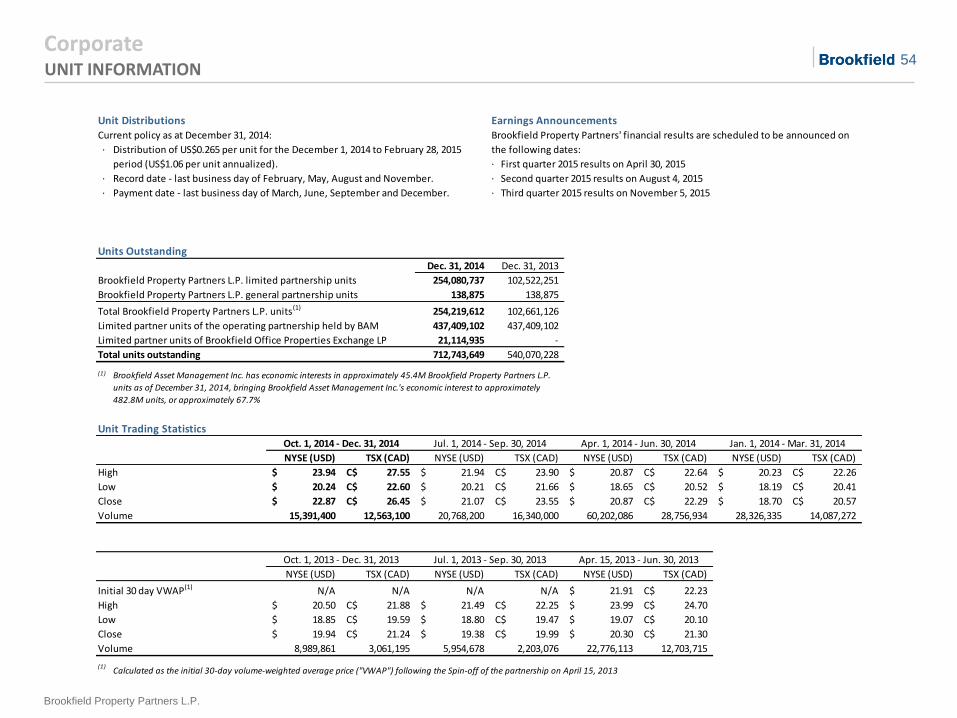
54
Brookfield Property Partners L.P.
Corporate UNIT INFORMATION
Unit Distributions Earnings AnnouncementsCurrent policy as at December 31, 2014:
∙
∙ First quarter 2015 results on April 30, 2015
∙ Record date - last business day of February, May, August and November. ∙ Second quarter 2015 results on August 4, 2015
∙ Payment date - last business day of March, June, September and December. ∙ Third quarter 2015 results on November 5, 2015
Units OutstandingDec. 31, 2014 Dec. 31, 2013
Brookfield Property Partners L.P. limited partnership units 254,080,737 102,522,251
Brookfield Property Partners L.P. general partnership units 138,875 138,875
Total Brookfield Property Partners L.P. units(1) 254,219,612 102,661,126
437,409,102 437,409,102
Limited partner units of Brookfield Office Properties Exchange LP 21,114,935 -
Total units outstanding 712,743,649 540,070,228
(1) B
Unit Trading Statistics
NYSE (USD) TSX (CAD) NYSE (USD) TSX (CAD) NYSE (USD) TSX (CAD) NYSE (USD) TSX (CAD)
High 23.94$ 27.55C$ 21.94$ 23.90C$ 20.87$ 22.64C$ 20.23$ 22.26C$
Low 20.24$ 22.60C$ 20.21$ 21.66C$ 18.65$ 20.52C$ 18.19$ 20.41C$
Close 22.87$ 26.45C$ 21.07$ 23.55C$ 20.87$ 22.29C$ 18.70$ 20.57C$
Volume 15,391,400 12,563,100 20,768,200 16,340,000 60,202,086 28,756,934 28,326,335 14,087,272
NYSE (USD) TSX (CAD) NYSE (USD) TSX (CAD) NYSE (USD) TSX (CAD)
Initial 30 day VWAP(1) N/A N/A N/A N/A 21.91$ 22.23C$
High 20.50$ 21.88C$ 21.49$ 22.25C$ 23.99$ 24.70C$
Low 18.85$ 19.59C$ 18.80$ 19.47C$ 19.07$ 20.10C$
Close 19.94$ 21.24C$ 19.38$ 19.99C$ 20.30$ 21.30C$
Volume 8,989,861 3,061,195 5,954,678 2,203,076 22,776,113 12,703,715
(1) CCalculated as the initial 30-day volume-weighted average price ("VWAP") following the Spin-off of the partnership on April 15, 2013
Apr. 15, 2013 - Jun. 30, 2013Jul. 1, 2013 - Sep. 30, 2013Oct. 1, 2013 - Dec. 31, 2013
Oct. 1, 2014 - Dec. 31, 2014
Distribution of US$0.265 per unit for the December 1, 2014 to February 28, 2015
period (US$1.06 per unit annualized).
Brookfield Property Partners' financial results are scheduled to be announced on
the following dates:
Limited partner units of the operating partnership held by BAM
Jul. 1, 2014 - Sep. 30, 2014 Jan. 1, 2014 - Mar. 31, 2014Apr. 1, 2014 - Jun. 30, 2014
Brookfield Asset Management Inc. has economic interests in approximately 45.4M Brookfield Property Partners L.P.
units as of December 31, 2014, bringing Brookfield Asset Management Inc.'s economic interest to approximately
482.8M units, or approximately 67.7%
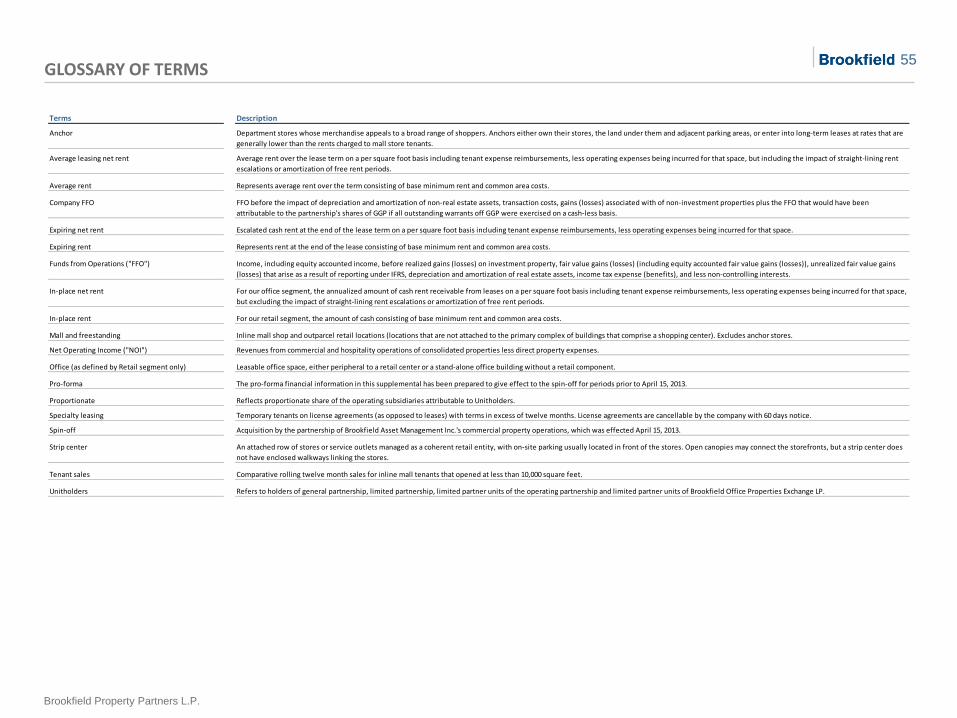
55
Brookfield Property Partners L.P.
GLOSSARY OF TERMS
Terms Description
Anchor Department stores whose merchandise appeals to a broad range of shoppers. Anchors either own their stores, the land under them and adjacent parking areas, or enter into long-term leases at rates that are
generally lower than the rents charged to mall store tenants.
Average leasing net rent Average rent over the lease term on a per square foot basis including tenant expense reimbursements, less operating expenses being incurred for that space, but including the impact of straight-lining rent
escalations or amortization of free rent periods.
Average rent Represents average rent over the term consisting of base minimum rent and common area costs.
Company FFO FFO before the impact of depreciation and amortization of non-real estate assets, transaction costs, gains (losses) associated with of non-investment properties plus the FFO that would have been
attributable to the partnership's shares of GGP if all outstanding warrants off GGP were exercised on a cash-less basis.
Expiring net rent Escalated cash rent at the end of the lease term on a per square foot basis including tenant expense reimbursements, less operating expenses being incurred for that space.
Expiring rent Represents rent at the end of the lease consisting of base minimum rent and common area costs.
Funds from Operations ("FFO") Income, including equity accounted income, before realized gains (losses) on investment property, fair value gains (losses) (including equity accounted fair value gains (losses)), unrealized fair value gains
(losses) that arise as a result of reporting under IFRS, depreciation and amortization of real estate assets, income tax expense (benefits), and less non-controlling interests.
In-place net rent For our office segment, the annualized amount of cash rent receivable from leases on a per square foot basis including tenant expense reimbursements, less operating expenses being incurred for that space,
but excluding the impact of straight-lining rent escalations or amortization of free rent periods.
In-place rent For our retail segment, the amount of cash consisting of base minimum rent and common area costs.
Mall and freestanding Inline mall shop and outparcel retail locations (locations that are not attached to the primary complex of buildings that comprise a shopping center). Excludes anchor stores.
Net Operating Income ("NOI") Revenues from commercial and hospitality operations of consolidated properties less direct property expenses.
Office (as defined by Retail segment only) Leasable office space, either peripheral to a retail center or a stand-alone office building without a retail component.
Pro-forma The pro-forma financial information in this supplemental has been prepared to give effect to the spin-off for periods prior to April 15, 2013.
Proportionate Reflects proportionate share of the operating subsidiaries attributable to Unitholders.
Specialty leasing Temporary tenants on license agreements (as opposed to leases) with terms in excess of twelve months. License agreements are cancellable by the company with 60 days notice.
Spin-off Acquisition by the partnership of Brookfield Asset Management Inc.'s commercial property operations, which was effected April 15, 2013.
Strip center An attached row of stores or service outlets managed as a coherent retail entity, with on-site parking usually located in front of the stores. Open canopies may connect the storefronts, but a strip center does
not have enclosed walkways linking the stores.
Tenant sales Comparative rolling twelve month sales for inline mall tenants that opened at less than 10,000 square feet.
Unitholders Refers to holders of general partnership, limited partnership, limited partner units of the operating partnership and limited partner units of Brookfield Office Properties Exchange LP.