Embed Size (px)
Citation preview
Brookfield Infrastructure Partners L.P. NYSE: BIP TSX: BIP.UN
Supplemental Information
For the quarter ended September 30 Q3
2013
1
Brookfield Infrastructure Partners L.P.
CAUTIONARY STATEMENT REGARDING FORWARD-LOOKING STATEMENTS
This Supplemental Information contains forward-looking information within the meaning of Canadian provincial securities laws and “forward-looking statements” within the meaning of certain securities
laws including Section 27A of the U.S. Securities Act of 1933, as amended, Section 21E of the U.S. Securities Exchange Act of 1934, as amended, “safe harbor” provisions of the United States
Private Securities Litigation Reform Act of 1995 and in any applicable Canadian securities regulations. We may make such statements in this report, in other filings with Canadian regulators or the
SEC or in other communications. The words “continue”, “expect”, “target”, “believe”, “objective”, “anticipate”, “plan”, “estimate”, derivatives thereof and other expressions of similar import, or the
negative variations thereof, and similar expressions of future or conditional verbs such as “will”, “may”, “should,” which are predictions of or indicate future events, trends or prospects and which do not
relate to historical matters, identify forward-looking statements. Forward-looking statements in this Supplemental Information include among others, statements with respect to our assets tending to
appreciate in value over time, growth in our assets and operations, increases in FFO per unit and resulting capital appreciation, returns on capital and on equity, increasing demand for commodities
and global movement of goods, expected capital expenditures, the impact of planned capital projects by customers of our railroad business on the performance and growth of that business, the extent
of our corporate, general and administrative expenses, our ability to close transactions, our capacity to take advantage of opportunities in the marketplace, the future prospects of the assets that
Brookfield Infrastructure operates or will operate, ability to identify, acquire and integrate new acquisition opportunities, long-term target return on our assets, recovery of the U.S. housing market,
sustainability of distribution levels, distribution growth and payout ratios, operating results and margins for our business and each operation, future prospects for the markets for our products,
Brookfield Infrastructure’s plans for growth through internal growth and capital investments, ability to achieve stated objectives, ability to drive operating efficiencies, return on capital expectations for
the business, contract prices and regulated rates for our operations, our expected future maintenance and capital expenditures, ability to deploy capital in accretive investments, our view of future
economic conditions, our ability to maintain sufficient financial liquidity, our ability to draw down funds under our bank credit facilities, our ability to secure financing through the issuance of equity or
debt, expansions of existing operations, financing plan for operating companies, foreign currency management activities and other statements with respect to our beliefs, outlooks, plans, expectations
and intentions. Although we believe that Brookfield Infrastructure’s anticipated future results, performance or achievements expressed or implied by the forward-looking statements and information are
based upon reasonable assumptions and expectations, the reader should not place undue reliance on forward-looking statements and information because they involve known and unknown risks,
uncertainties and other factors which may cause the actual results, performance or achievements of Brookfield Infrastructure to differ materially from anticipated future results, performance or
achievements expressed or implied by such forward-looking statements and information.
Factors that could cause actual results to differ materially from those contemplated or implied by forward-looking statements include: general economic and financial conditions in the countries in
which we do business which may impact market demand, foreign currency risk, the high level of government regulation affecting our businesses, the outcome and timing of various regulatory, legal
and contractual issues, global credit and financial markets, the competitive business environment in the industries in which we operate, the competitive market for acquisitions and other growth
opportunities, availability of equity and debt financing, the completion of various large capital projects by mining customers of our railroad business which themselves rely on access to capital and
continued favourable commodity prices, our ability to complete large capital expansion projects on time and within budget, ability to negotiate favourable take-or-pay contractual terms, traffic volumes
on our toll roads, acts of God, weather events, or similar events outside of our control, and other risks and factors detailed from time to time in documents filed by Brookfield Infrastructure with the
securities regulators in Canada and the United States, including Brookfield Infrastructure’s most recent Annual Report on Form 20-F under the heading “Risk Factors”.
We caution that the foregoing list of important factors that may affect future results is not exhaustive. When relying on our forward-looking statements to make decisions with respect to Brookfield
Infrastructure, investors and others should carefully consider the foregoing factors and other uncertainties and potential events. Except as required by law, Brookfield Infrastructure undertakes no
obligation to publicly update or revise any forward-looking statements or information, whether written or oral, that may be as a result of new information, future events or otherwise.
CAUTIONARY STATEMENT REGARDING USE OF NON-IFRS, ACCOUNTING MEASURES Although our financial results are determined in accordance with International Financial Reporting Standards (IFRS), the basis of presentation throughout much of this report differs from IFRS in that it
is organized by business segment and utilizes, funds from operations (FFO), adjusted funds from operations (AFFO), adjusted EBITDA and invested capital as important measures. This is reflective of
how we manage the business and, in our opinion, enables the reader to better understand our affairs. We provide a reconciliation to the most directly comparable IFRS measure on pages 24-31 of
this Supplemental Information. Readers are encouraged to consider both measures in assessing Brookfield Infrastructure's results.
BUSINESS ENVIRONMENT AND RISKS Brookfield Infrastructure's financial results are impacted by various factors, including the performance of each of our operations and various external factors influencing the specific platforms and
geographic locations in which we operate; macro-economic factors such as economic growth, changes in currency, inflation and interest rates; regulatory requirements and initiatives; and litigation
and claims that arise in the normal course of business. These and other factors are described in Brookfield Infrastructure’s most recent Annual Report on Form 20-F which is available on our website
at www.brookfieldinfrastructure.com and at www.sec.gov/edgar.shtml and www.sedar.com.
2
Brookfield Infrastructure Partners L.P.
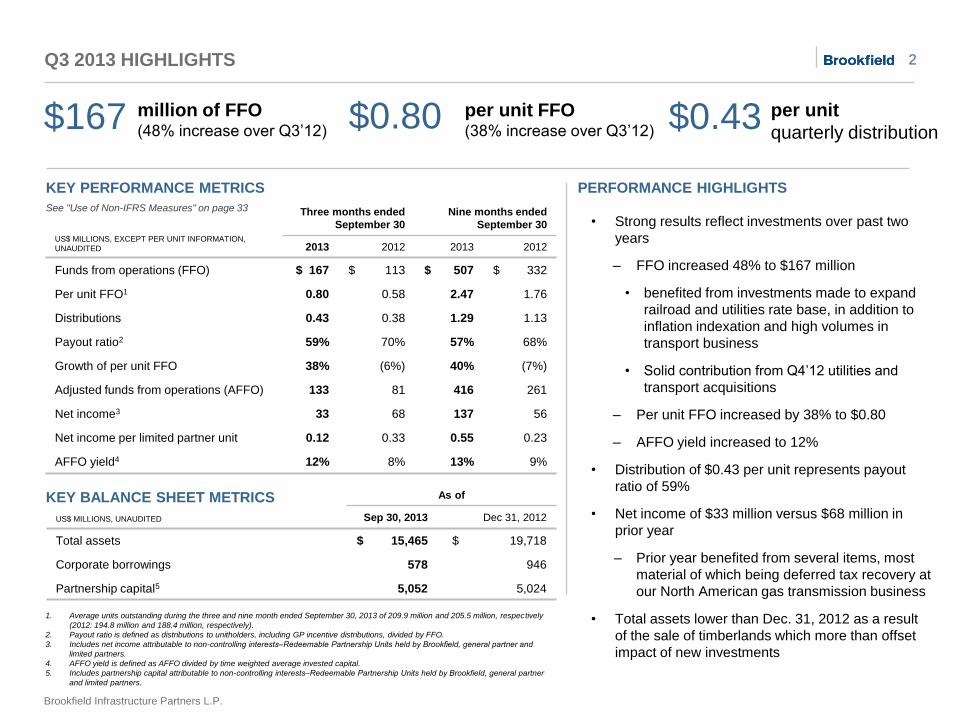
1. Average units outstanding during the three and nine month ended September 30, 2013 of 209.9 million and 205.5 million, respectively
(2012: 194.8 million and 188.4 million, respectively).
2. Payout ratio is defined as distributions to unitholders, including GP incentive distributions, divided by FFO.
3. Includes net income attributable to non-controlling interests‒Redeemable Partnership Units held by Brookfield, general partner and
limited partners.
4. AFFO yield is defined as AFFO divided by time weighted average invested capital.
5. Includes partnership capital attributable to non-controlling interests‒Redeemable Partnership Units held by Brookfield, general partner
and limited partners.
• Strong results reflect investments over past two
years
‒ FFO increased 48% to $167 million
• benefited from investments made to expand
railroad and utilities rate base, in addition to
inflation indexation and high volumes in
transport business
• Solid contribution from Q4’12 utilities and
transport acquisitions
‒ Per unit FFO increased by 38% to $0.80
‒ AFFO yield increased to 12%
• Distribution of $0.43 per unit represents payout
ratio of 59%
• Net income of $33 million versus $68 million in
prior year
‒ Prior year benefited from several items, most
material of which being deferred tax recovery at
our North American gas transmission business
• Total assets lower than Dec. 31, 2012 as a result
of the sale of timberlands which more than offset
impact of new investments
US$ MILLIONS, UNAUDITED
As of
Sep 30, 2013 Dec 31, 2012
Total assets $ 15,465 $ 19,718
Corporate borrowings 578 946
Partnership capital5 5,052 5,024
US$ MILLIONS, EXCEPT PER UNIT INFORMATION,
UNAUDITED
Three months ended
September 30
Nine months ended
September 30
2013 2012 2013 2012
Funds from operations (FFO) $ 167 $ 113 $ 507 $ 332
Per unit FFO1 0.80 0.58 2.47 1.76
Distributions 0.43 0.38 1.29 1.13
Payout ratio2 59% 70% 57% 68%
Growth of per unit FFO 38% (6%) 40% (7%)
Adjusted funds from operations (AFFO) 133 81 416 261
Net income3 33 68 137 56
Net income per limited partner unit 0.12 0.33 0.55 0.23
AFFO yield4 12% 8% 13% 9%
Q3 2013 HIGHLIGHTS
million of FFO (48% increase over Q3’12)
per unit
quarterly distribution $167 $0.43
KEY PERFORMANCE METRICS
KEY BALANCE SHEET METRICS
See "Use of Non-IFRS Measures" on page 33
PERFORMANCE HIGHLIGHTS
per unit FFO (38% increase over Q3’12)
$0.80
3
Brookfield Infrastructure Partners L.P.
FINANCING AND LIQUIDITY HIGHLIGHTS
• Completed $0.8 billion of financings bringing year-to-date
financings to $4 billion
‒ Extended average maturity of debt portfolio to almost
10 years
‒ No significant maturities in the next five years
• ~$2.4 billion1 of corporate level liquidity
• Overall group-wide liquidity of $2.7 billion1
BUSINESS DEVELOPMENT
• Invested a further $500 million into our Brazilian toll road
business, increasing our ownership to ~31%
• Acquired district energy systems in Houston and New
Orleans, expected to close by end of year
Q3 2013 HIGHLIGHTS (cont’d)
OPERATIONAL HIGHLIGHTS
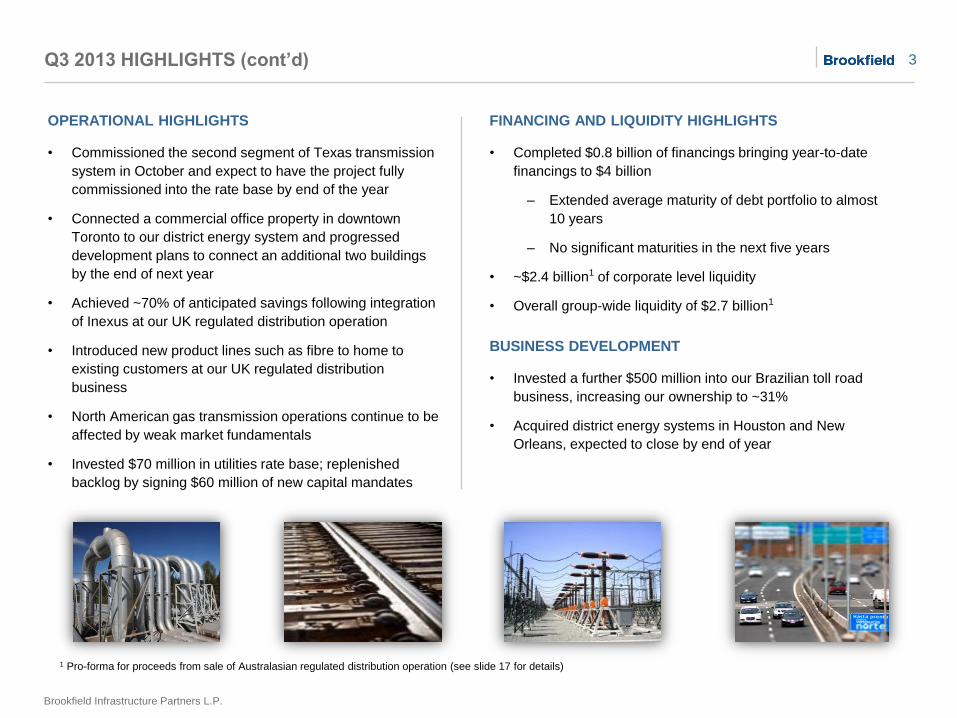
• Commissioned the second segment of Texas transmission
system in October and expect to have the project fully
commissioned into the rate base by end of the year
• Connected a commercial office property in downtown
Toronto to our district energy system and progressed
development plans to connect an additional two buildings
by the end of next year
• Achieved ~70% of anticipated savings following integration
of Inexus at our UK regulated distribution operation
• Introduced new product lines such as fibre to home to
existing customers at our UK regulated distribution
business
• North American gas transmission operations continue to be
affected by weak market fundamentals
• Invested $70 million in utilities rate base; replenished
backlog by signing $60 million of new capital mandates
1 Pro-forma for proceeds from sale of Australasian regulated distribution operation (see slide 17 for details)
4
Brookfield Infrastructure Partners L.P.
OUR BUSINESS
OUR MISSION
• To own and operate a globally diversified portfolio of high quality infrastructure assets that will generate sustainable, growing
distributions over the long term for our unitholders
PERFORMANCE TARGETS AND KEY MEASURES
• Target a 12% to 15% total annual return on invested capital measured over long term
• Expect to generate return from in-place cash flows plus growth through investments in upgrades and expansions of our asset base
• AFFO yield is a key performance metric which measures sustainable return on capital deployed
• Growth in FFO per unit is also a key performance metric as it is a proxy for our ability to increase distributions
BASIS OF PRESENTATION
• Our consolidated financial statements are prepared in accordance with International Financial Reporting Standards (IFRS) as
issued by the International Accounting Standards Board (IASB)
• For each operating platform, this Supplemental Information outlines Brookfield Infrastructure’s proportionate share of results in
order to demonstrate the impact of key value drivers of each operating platform on the partnership’s overall performance
5
Brookfield Infrastructure Partners L. P.
DISTRIBUTION PROFILE
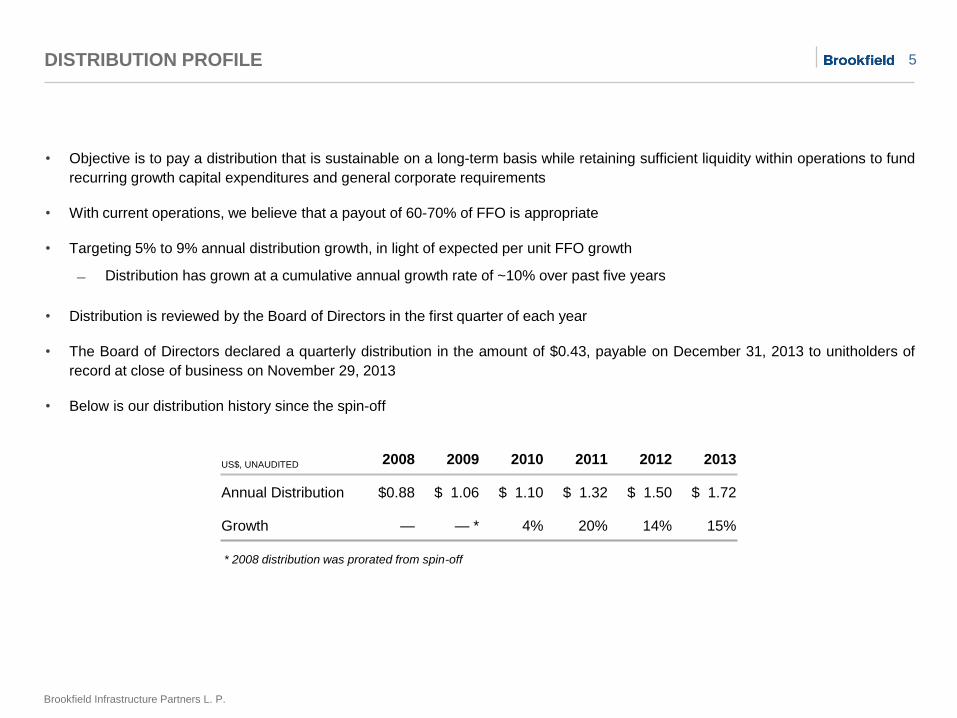
• Objective is to pay a distribution that is sustainable on a long-term basis while retaining sufficient liquidity within operations to fund
recurring growth capital expenditures and general corporate requirements
• With current operations, we believe that a payout of 60-70% of FFO is appropriate
• Targeting 5% to 9% annual distribution growth, in light of expected per unit FFO growth
Distribution has grown at a cumulative annual growth rate of ~10% over past five years
• Distribution is reviewed by the Board of Directors in the first quarter of each year
• The Board of Directors declared a quarterly distribution in the amount of $0.43, payable on December 31, 2013 to unitholders of
record at close of business on November 29, 2013
• Below is our distribution history since the spin-off
US$, UNAUDITED 2008 2009 2010 2011 2012 2013
Annual Distribution $0.88 $ 1.06 $ 1.10 $ 1.32 $ 1.50 $ 1.72
Growth — — * 4% 20% 14% 15%
* 2008 distribution was prorated from spin-off
6
Brookfield Infrastructure Partners L.P.
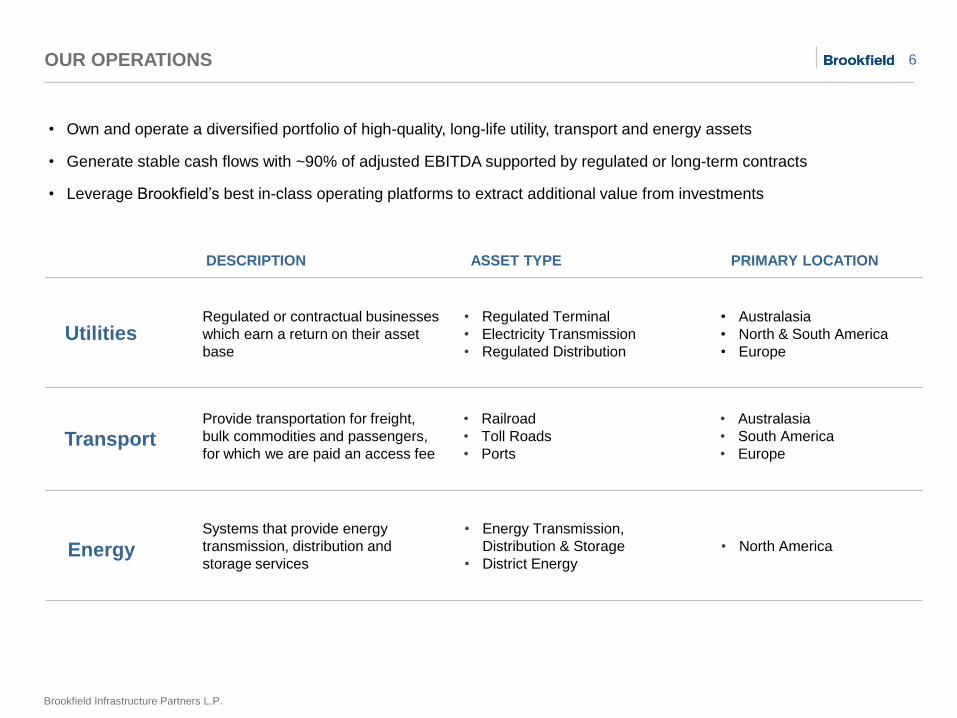
OUR OPERATIONS
• Own and operate a diversified portfolio of high-quality, long-life utility, transport and energy assets
• Generate stable cash flows with ~90% of adjusted EBITDA supported by regulated or long-term contracts
• Leverage Brookfield’s best in-class operating platforms to extract additional value from investments
Regulated or contractual businesses
which earn a return on their asset
base
• Regulated Terminal
• Electricity Transmission
• Regulated Distribution
• Australasia
• North & South America
• Europe
Provide transportation for freight,
bulk commodities and passengers,
for which we are paid an access fee
• Railroad
• Toll Roads
• Ports
• Australasia
• South America
• Europe
Systems that provide energy
transmission, distribution and
storage services
• Energy Transmission,
Distribution & Storage
• District Energy
• North America
Transport
Energy
Utilities
DESCRIPTION ASSET TYPE PRIMARY LOCATION
7
Brookfield Infrastructure Partners L.P.
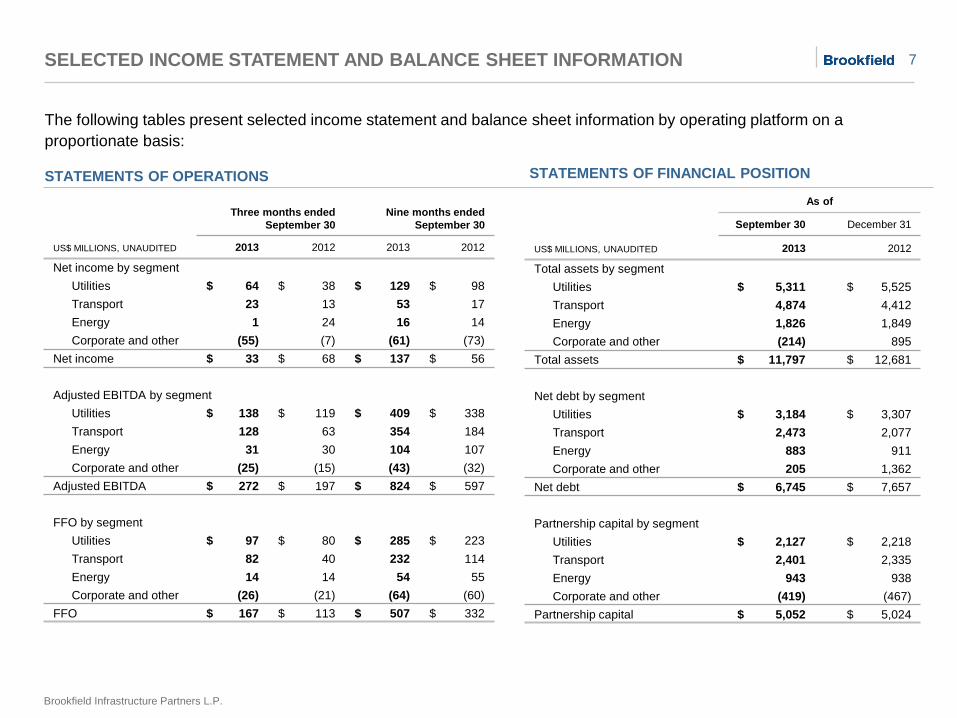
SELECTED INCOME STATEMENT AND BALANCE SHEET INFORMATION
US$ MILLIONS, UNAUDITED
Three months ended
September 30
Nine months ended
September 30
2013 2012 2013 2012
Net income by segment
Utilities $ 64 $ 38 $ 129 $ 98
Transport 23 13 53 17
Energy 1 24 16 14
Corporate and other (55) (7) (61) (73)
Net income $ 33 $ 68 $ 137 $ 56
Adjusted EBITDA by segment
Utilities $ 138 $ 119 $ 409 $ 338
Transport 128 63 354 184
Energy 31 30 104 107
Corporate and other (25) (15) (43) (32)
Adjusted EBITDA $ 272 $ 197 $ 824 $ 597
FFO by segment
Utilities $ 97 $ 80 $ 285 $ 223
Transport 82 40 232 114
Energy 14 14 54 55
Corporate and other (26) (21) (64) (60)
FFO $ 167 $ 113 $ 507 $ 332
STATEMENTS OF OPERATIONS
The following tables present selected income statement and balance sheet information by operating platform on a
proportionate basis:
US$ MILLIONS, UNAUDITED
As of
September 30 December 31
2013 2012
Total assets by segment
Utilities $ 5,311 $ 5,525
Transport 4,874 4,412
Energy 1,826 1,849
Corporate and other (214) 895
Total assets $ 11,797 $ 12,681
Net debt by segment
Utilities $ 3,184 $ 3,307
Transport 2,473 2,077
Energy 883 911
Corporate and other 205 1,362
Net debt $ 6,745 $ 7,657
Partnership capital by segment
Utilities $ 2,127 $ 2,218
Transport 2,401 2,335
Energy 943 938
Corporate and other (419) (467)
Partnership capital $ 5,052 $ 5,024
STATEMENTS OF FINANCIAL POSITION
OPERATING PLATFORMS
9
Brookfield Infrastructure Partners L.P.
US$ MILLIONS, UNAUDITED
Three months ended
September 30
Nine months ended
September 30
2013 2012 2013 2012
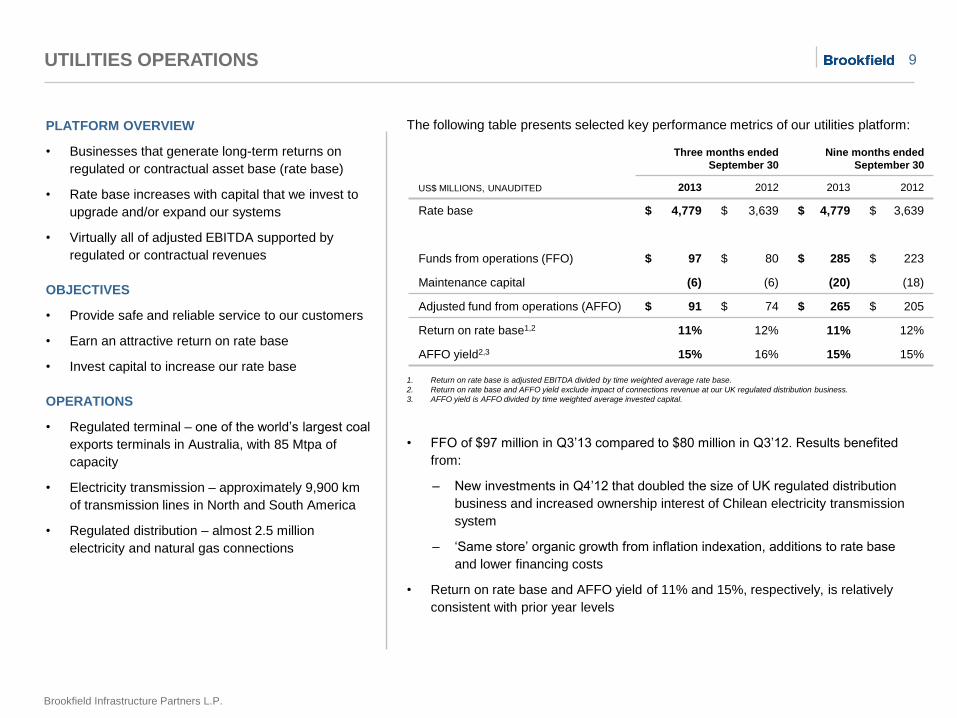
Rate base $ 4,779 $ 3,639 $ 4,779 $ 3,639
Funds from operations (FFO) $ 97 $ 80 $ 285 $ 223
Maintenance capital (6) (6) (20) (18)
Adjusted fund from operations (AFFO) $ 91 $ 74 $ 265 $ 205
Return on rate base1,2 11% 12% 11% 12%
AFFO yield2,3 15% 16% 15% 15%
UTILITIES OPERATIONS
PLATFORM OVERVIEW
• Businesses that generate long-term returns on
regulated or contractual asset base (rate base)
• Rate base increases with capital that we invest to
upgrade and/or expand our systems
• Virtually all of adjusted EBITDA supported by
regulated or contractual revenues
OBJECTIVES
• Provide safe and reliable service to our customers
• Earn an attractive return on rate base
• Invest capital to increase our rate base
OPERATIONS
• Regulated terminal – one of the world’s largest coal
exports terminals in Australia, with 85 Mtpa of
capacity
• Electricity transmission – approximately 9,900 km
of transmission lines in North and South America
• Regulated distribution – almost 2.5 million
electricity and natural gas connections
1. Return on rate base is adjusted EBITDA divided by time weighted average rate base.
2. Return on rate base and AFFO yield exclude impact of connections revenue at our UK regulated distribution business.
3. AFFO yield is AFFO divided by time weighted average invested capital.
The following table presents selected key performance metrics of our utilities platform:
• FFO of $97 million in Q3’13 compared to $80 million in Q3’12. Results benefited
from:
‒ New investments in Q4’12 that doubled the size of UK regulated distribution
business and increased ownership interest of Chilean electricity transmission
system
‒ ‘Same store’ organic growth from inflation indexation, additions to rate base
and lower financing costs
• Return on rate base and AFFO yield of 11% and 15%, respectively, is relatively
consistent with prior year levels
10
Brookfield Infrastructure Partners L.P.
UTILITIES OPERATIONS CONT’D
US$ MILLIONS, UNAUDITED
Three months ended
September 30
Nine months ended
September 30
2013 2012 2013 2012
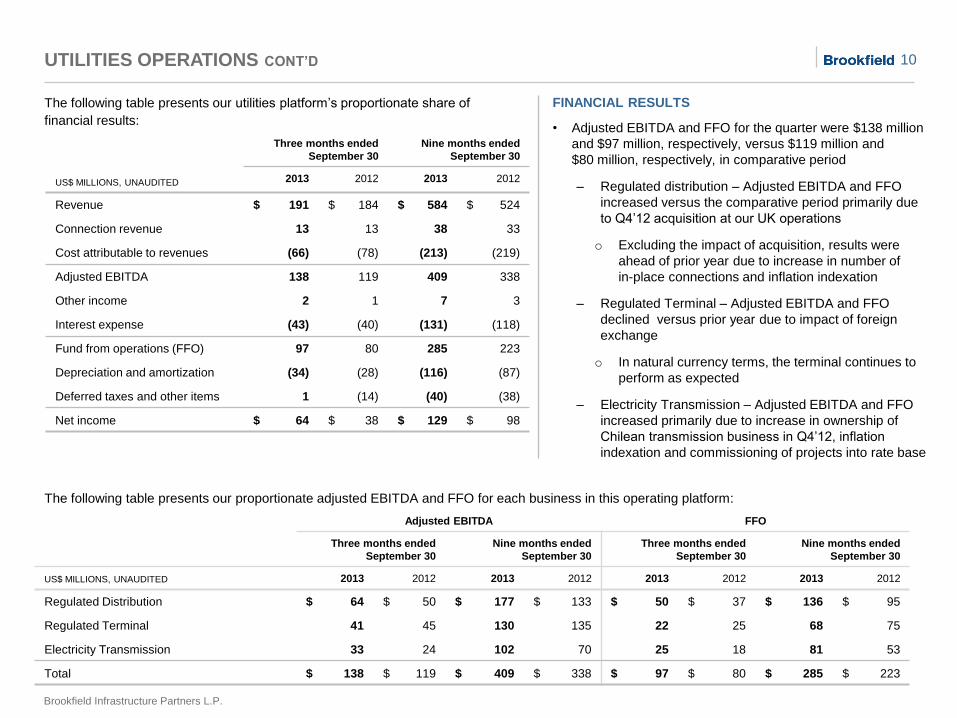
Revenue $ 191 $ 184 $ 584 $ 524
Connection revenue 13 13 38 33
Cost attributable to revenues (66) (78) (213) (219)
Adjusted EBITDA 138 119 409 338
Other income 2 1 7 3
Interest expense (43) (40) (131) (118)
Fund from operations (FFO) 97 80 285 223
Depreciation and amortization (34) (28) (116) (87)
Deferred taxes and other items 1 (14) (40) (38)
Net income $ 64 $ 38 $ 129 $ 98
Adjusted EBITDA FFO
Three months ended
September 30
Nine months ended
September 30
Three months ended
September 30
Nine months ended
September 30
US$ MILLIONS, UNAUDITED 2013 2012 2013 2012 2013 2012 2013 2012
Regulated Distribution $ 64 $ 50 $ 177 $ 133 $ 50 $ 37 $ 136 $ 95
Regulated Terminal 41 45 130 135 22 25 68 75
Electricity Transmission 33 24 102 70 25 18 81 53
Total $ 138 $ 119 $ 409 $ 338 $ 97 $ 80 $ 285 $ 223
The following table presents our utilities platform’s proportionate share of
financial results:
FINANCIAL RESULTS
• Adjusted EBITDA and FFO for the quarter were $138 million
and $97 million, respectively, versus $119 million and
$80 million, respectively, in comparative period
‒ Regulated distribution – Adjusted EBITDA and FFO
increased versus the comparative period primarily due
to Q4’12 acquisition at our UK operations
o Excluding the impact of acquisition, results were
ahead of prior year due to increase in number of
in-place connections and inflation indexation
‒ Regulated Terminal – Adjusted EBITDA and FFO
declined versus prior year due to impact of foreign
exchange
o In natural currency terms, the terminal continues to
perform as expected
‒ Electricity Transmission – Adjusted EBITDA and FFO
increased primarily due to increase in ownership of
Chilean transmission business in Q4’12, inflation
indexation and commissioning of projects into rate base
The following table presents our proportionate adjusted EBITDA and FFO for each business in this operating platform:
11
Brookfield Infrastructure Partners L.P.
UTILITIES OPERATIONS CONT’D
US$ MILLIONS, UNAUDITED
Three months ended
September 30
Nine months ended
September 30
2013 2012 2013 2012
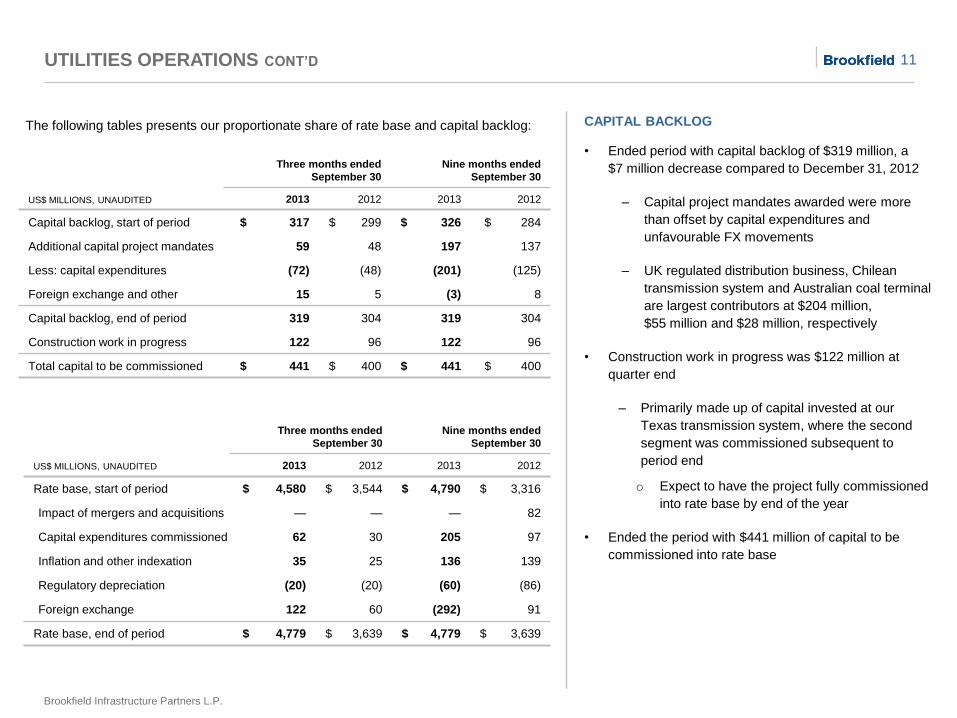
Capital backlog, start of period $ 317 $ 299 $ 326 $ 284
Additional capital project mandates 59 48 197 137
Less: capital expenditures (72) (48) (201) (125)
Foreign exchange and other 15 5 (3) 8
Capital backlog, end of period 319 304 319 304
Construction work in progress 122 96 122 96
Total capital to be commissioned $ 441 $ 400 $ 441 $ 400
The following tables presents our proportionate share of rate base and capital backlog:
US$ MILLIONS, UNAUDITED
Three months ended
September 30
Nine months ended
September 30
2013 2012 2013 2012
Rate base, start of period $ 4,580 $ 3,544 $ 4,790 $ 3,316
Impact of mergers and acquisitions — — — 82
Capital expenditures commissioned 62 30 205 97
Inflation and other indexation 35 25 136 139
Regulatory depreciation (20) (20) (60) (86)
Foreign exchange 122 60 (292) 91
Rate base, end of period $ 4,779 $ 3,639 $ 4,779 $ 3,639
CAPITAL BACKLOG
• Ended period with capital backlog of $319 million, a
$7 million decrease compared to December 31, 2012
‒ Capital project mandates awarded were more
than offset by capital expenditures and
unfavourable FX movements
‒ UK regulated distribution business, Chilean
transmission system and Australian coal terminal
are largest contributors at $204 million,
$55 million and $28 million, respectively
• Construction work in progress was $122 million at
quarter end
‒ Primarily made up of capital invested at our
Texas transmission system, where the second
segment was commissioned subsequent to
period end
o Expect to have the project fully commissioned
into rate base by end of the year
• Ended the period with $441 million of capital to be
commissioned into rate base
12
Brookfield Infrastructure Partners L.P.
US$ MILLIONS, UNAUDITED
Three months ended
September 30
Nine months ended
September 30
2013 2012 2013 2012
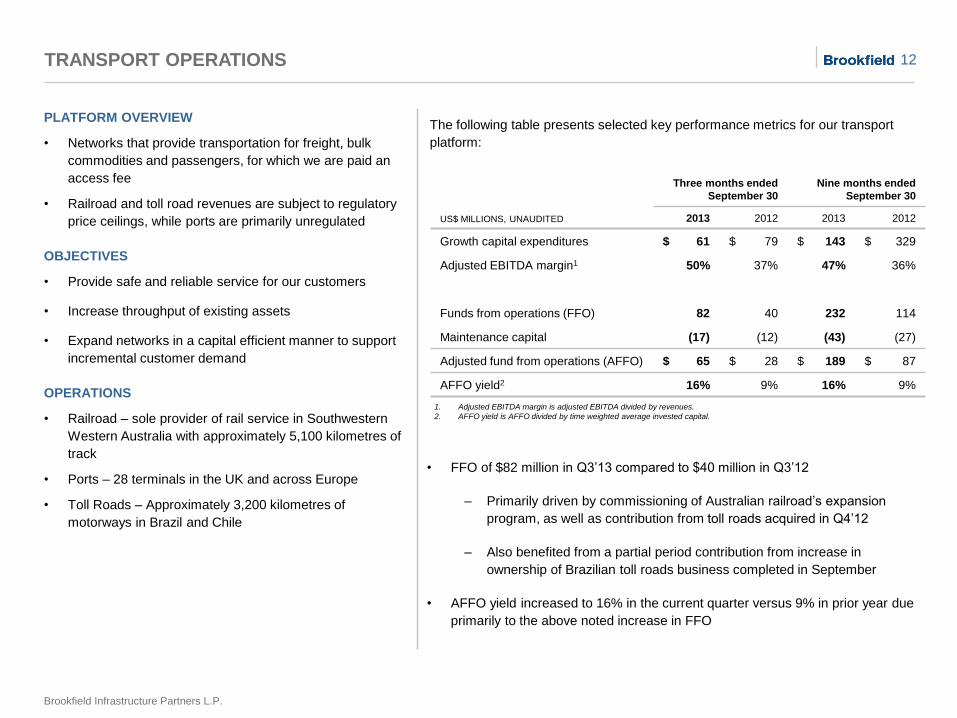
Growth capital expenditures $ 61 $ 79 $ 143 $ 329
Adjusted EBITDA margin1 50% 37% 47% 36%
Funds from operations (FFO) 82 40 232 114
Maintenance capital (17) (12) (43) (27)
Adjusted fund from operations (AFFO) $ 65 $ 28 $ 189 $ 87
AFFO yield2 16% 9% 16% 9%
TRANSPORT OPERATIONS
PLATFORM OVERVIEW
• Networks that provide transportation for freight, bulk
commodities and passengers, for which we are paid an
access fee
• Railroad and toll road revenues are subject to regulatory
price ceilings, while ports are primarily unregulated
OBJECTIVES
• Provide safe and reliable service for our customers
• Increase throughput of existing assets
• Expand networks in a capital efficient manner to support
incremental customer demand
OPERATIONS
• Railroad – sole provider of rail service in Southwestern
Western Australia with approximately 5,100 kilometres of
track
• Ports – 28 terminals in the UK and across Europe
• Toll Roads – Approximately 3,200 kilometres of
motorways in Brazil and Chile
1. Adjusted EBITDA margin is adjusted EBITDA divided by revenues.
2. AFFO yield is AFFO divided by time weighted average invested capital.
The following table presents selected key performance metrics for our transport
platform:
• FFO of $82 million in Q3’13 compared to $40 million in Q3’12
‒ Primarily driven by commissioning of Australian railroad’s expansion
program, as well as contribution from toll roads acquired in Q4’12
‒ Also benefited from a partial period contribution from increase in
ownership of Brazilian toll roads business completed in September
• AFFO yield increased to 16% in the current quarter versus 9% in prior year due
primarily to the above noted increase in FFO
13
Brookfield Infrastructure Partners L.P.
TRANSPORT OPERATIONS CONT’D
US$ MILLIONS, UNAUDITED
Three months ended
September 30
Nine months ended
September 30
2013 2012 2013 2012
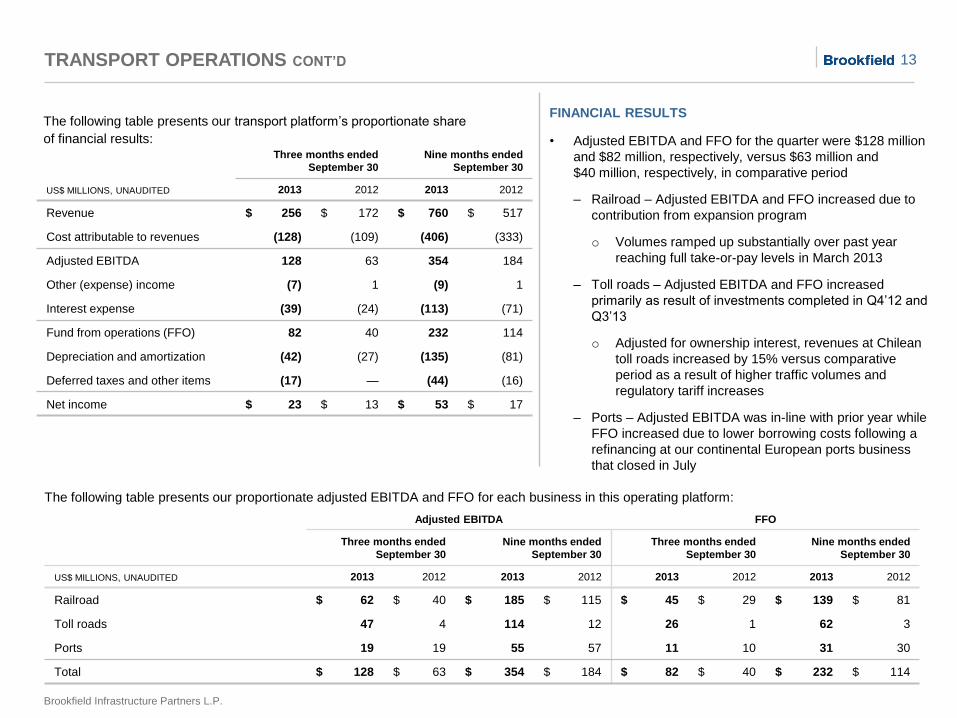
Revenue $ 256 $ 172 $ 760 $ 517
Cost attributable to revenues (128) (109) (406) (333)
Adjusted EBITDA 128 63 354 184
Other (expense) income (7) 1 (9) 1
Interest expense (39) (24) (113) (71)
Fund from operations (FFO) 82 40 232 114
Depreciation and amortization (42) (27) (135) (81)
Deferred taxes and other items (17) — (44) (16)
Net income $ 23 $ 13 $ 53 $ 17
The following table presents our transport platform’s proportionate share
of financial results:
FINANCIAL RESULTS
• Adjusted EBITDA and FFO for the quarter were $128 million
and $82 million, respectively, versus $63 million and
$40 million, respectively, in comparative period
‒ Railroad – Adjusted EBITDA and FFO increased due to
contribution from expansion program
o Volumes ramped up substantially over past year
reaching full take-or-pay levels in March 2013
‒ Toll roads – Adjusted EBITDA and FFO increased
primarily as result of investments completed in Q4’12 and
Q3’13
o Adjusted for ownership interest, revenues at Chilean
toll roads increased by 15% versus comparative
period as a result of higher traffic volumes and
regulatory tariff increases
‒ Ports – Adjusted EBITDA was in-line with prior year while
FFO increased due to lower borrowing costs following a
refinancing at our continental European ports business
that closed in July
The following table presents our proportionate adjusted EBITDA and FFO for each business in this operating platform:
Adjusted EBITDA FFO
Three months ended
September 30
Nine months ended
September 30
Three months ended
September 30
Nine months ended
September 30
US$ MILLIONS, UNAUDITED 2013 2012 2013 2012 2013 2012 2013 2012
Railroad $ 62 $ 40 $ 185 $ 115 $ 45 $ 29 $ 139 $ 81
Toll roads 47 4 114 12 26 1 62 3
Ports 19 19 55 57 11 10 31 30
Total $ 128 $ 63 $ 354 $ 184 $ 82 $ 40 $ 232 $ 114
14
Brookfield Infrastructure Partners L.P.
ENERGY OPERATIONS
PLATFORM OVERVIEW
• Systems that provide energy transportation, storage
and distribution services
• Profitability based on the volume and price achieved for
the provision of these services
• Businesses are typically unregulated or subject to price
ceilings
OBJECTIVES
• Provide safe and reliable service to our customers
• Satisfy customer growth requirements by increasing the
utilization of our assets and expanding our capacity in a
capital efficient manner
OPERATIONS
• Energy Transmission, Distribution & Storage – 15,500
kilometres of transmission pipelines, 300 billion cubic
feet of natural gas storage capacity in the U.S. and
Canada and over 50,000 connected gas distribution
customers
• District Energy – 522 Megawatt thermal district heating
system and 82,300 ton deep lake water cooling system
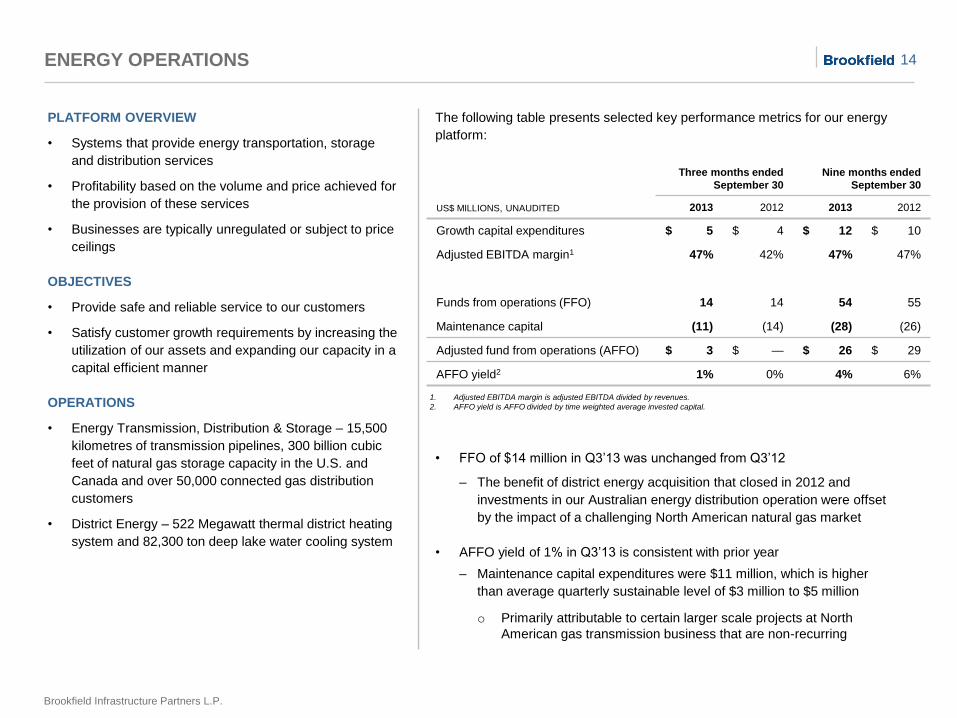
1. Adjusted EBITDA margin is adjusted EBITDA divided by revenues.
2. AFFO yield is AFFO divided by time weighted average invested capital.
The following table presents selected key performance metrics for our energy
platform:
• FFO of $14 million in Q3’13 was unchanged from Q3’12
‒ The benefit of district energy acquisition that closed in 2012 and
investments in our Australian energy distribution operation were offset
by the impact of a challenging North American natural gas market
• AFFO yield of 1% in Q3’13 is consistent with prior year
‒ Maintenance capital expenditures were $11 million, which is higher
than average quarterly sustainable level of $3 million to $5 million
o Primarily attributable to certain larger scale projects at North
American gas transmission business that are non-recurring
US$ MILLIONS, UNAUDITED
Three months ended
September 30
Nine months ended
September 30
2013 2012 2013 2012
Growth capital expenditures $ 5 $ 4 $ 12 $ 10
Adjusted EBITDA margin1 47% 42% 47% 47%
Funds from operations (FFO) 14 14 54 55
Maintenance capital (11) (14) (28) (26)
Adjusted fund from operations (AFFO) $ 3 $ — $ 26 $ 29
AFFO yield2 1% 0% 4% 6%
15
Brookfield Infrastructure Partners L.P.
ENERGY OPERATIONS CONT’D
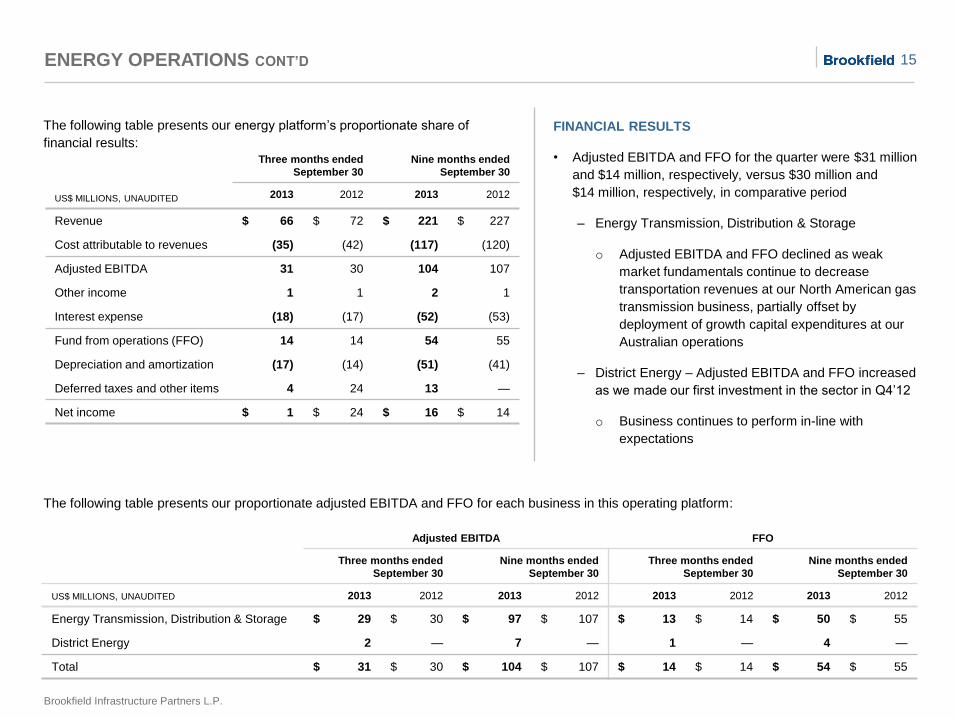
The following table presents our energy platform’s proportionate share of
financial results:
The following table presents our proportionate adjusted EBITDA and FFO for each business in this operating platform:
US$ MILLIONS, UNAUDITED
Three months ended
September 30
Nine months ended
September 30
2013 2012 2013 2012
Revenue $ 66 $ 72 $ 221 $ 227
Cost attributable to revenues (35) (42) (117) (120)
Adjusted EBITDA 31 30 104 107
Other income 1 1 2 1
Interest expense (18) (17) (52) (53)
Fund from operations (FFO) 14 14 54 55
Depreciation and amortization (17) (14) (51) (41)
Deferred taxes and other items 4 24 13 —
Net income $ 1 $ 24 $ 16 $ 14
Adjusted EBITDA FFO
Three months ended
September 30
Nine months ended
September 30
Three months ended
September 30
Nine months ended
September 30
US$ MILLIONS, UNAUDITED 2013 2012 2013 2012 2013 2012 2013 2012
Energy Transmission, Distribution & Storage $ 29 $ 30 $ 97 $ 107 $ 13 $ 14 $ 50 $ 55
District Energy 2 — 7 — 1 — 4 —
Total $ 31 $ 30 $ 104 $ 107 $ 14 $ 14 $ 54 $ 55
FINANCIAL RESULTS
• Adjusted EBITDA and FFO for the quarter were $31 million
and $14 million, respectively, versus $30 million and
$14 million, respectively, in comparative period
‒ Energy Transmission, Distribution & Storage
o Adjusted EBITDA and FFO declined as weak
market fundamentals continue to decrease
transportation revenues at our North American gas
transmission business, partially offset by
deployment of growth capital expenditures at our
Australian operations
‒ District Energy – Adjusted EBITDA and FFO increased
as we made our first investment in the sector in Q4’12
o Business continues to perform in-line with
expectations
16
Brookfield Infrastructure Partners L.P.
CORPORATE AND OTHER
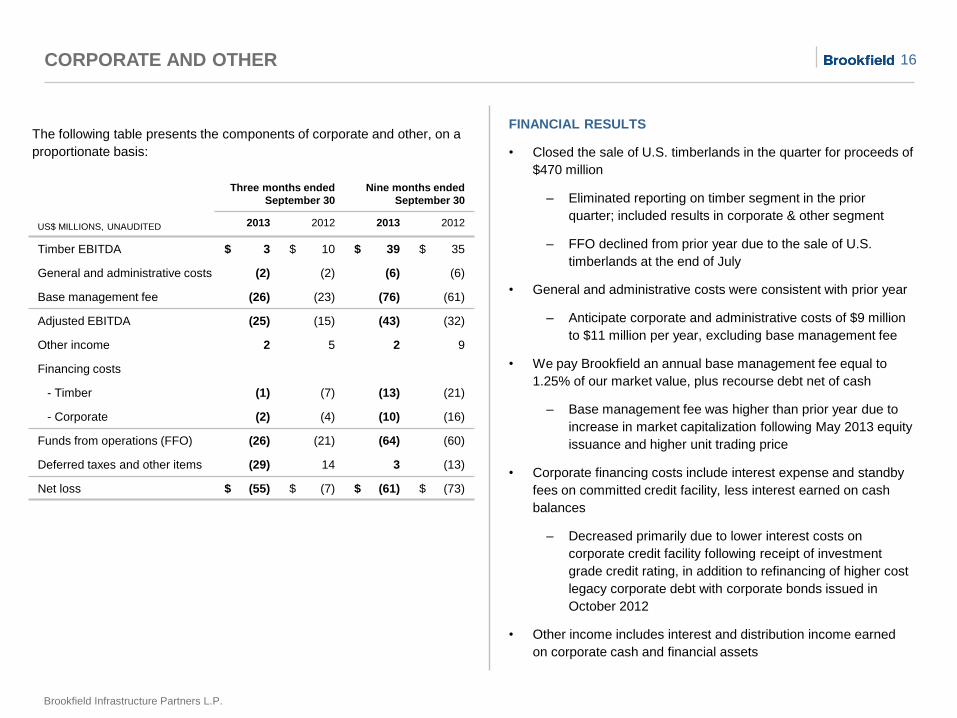
The following table presents the components of corporate and other, on a
proportionate basis:
FINANCIAL RESULTS
• Closed the sale of U.S. timberlands in the quarter for proceeds of
$470 million
‒ Eliminated reporting on timber segment in the prior
quarter; included results in corporate & other segment
‒ FFO declined from prior year due to the sale of U.S.
timberlands at the end of July
• General and administrative costs were consistent with prior year
‒ Anticipate corporate and administrative costs of $9 million
to $11 million per year, excluding base management fee
• We pay Brookfield an annual base management fee equal to
1.25% of our market value, plus recourse debt net of cash
‒ Base management fee was higher than prior year due to
increase in market capitalization following May 2013 equity
issuance and higher unit trading price
• Corporate financing costs include interest expense and standby
fees on committed credit facility, less interest earned on cash
balances
‒ Decreased primarily due to lower interest costs on
corporate credit facility following receipt of investment
grade credit rating, in addition to refinancing of higher cost
legacy corporate debt with corporate bonds issued in
October 2012
• Other income includes interest and distribution income earned
on corporate cash and financial assets
US$ MILLIONS, UNAUDITED
Three months ended
September 30
Nine months ended
September 30
2013 2012 2013 2012
Timber EBITDA $ 3 $ 10 $ 39 $ 35
General and administrative costs (2) (2) (6) (6)
Base management fee (26) (23) (76) (61)
Adjusted EBITDA (25) (15) (43) (32)
Other income 2 5 2 9
Financing costs
- Timber (1) (7) (13) (21)
- Corporate (2) (4) (10) (16)
Funds from operations (FFO) (26) (21) (64) (60)
Deferred taxes and other items (29) 14 3 (13)
Net loss $ (55) $ (7) $ (61) $ (73)
17
Brookfield Infrastructure Partners L.P.
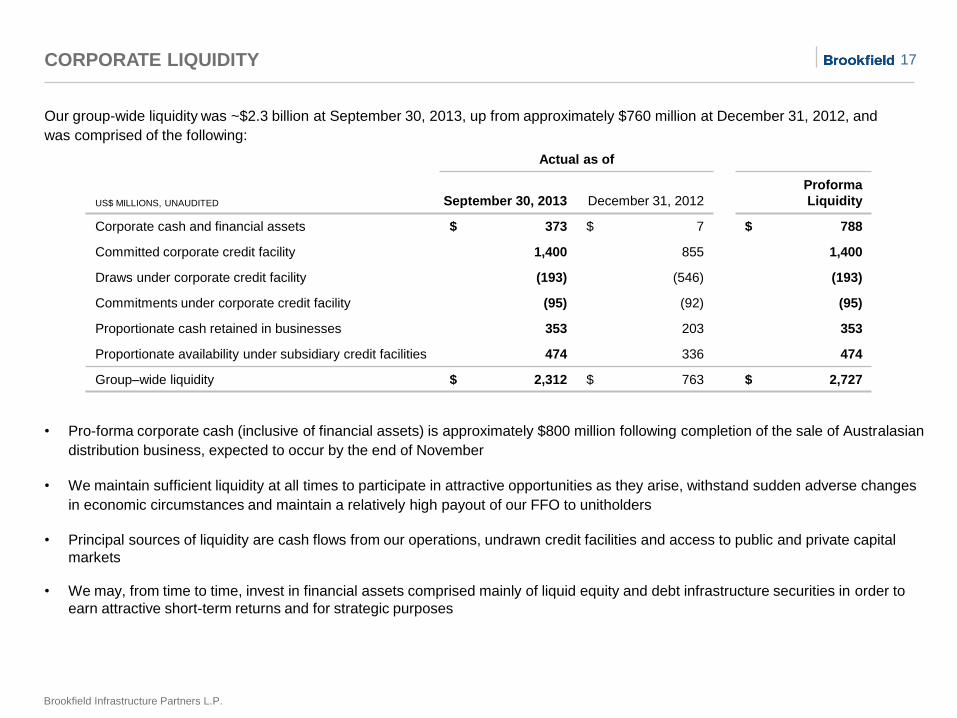
CORPORATE LIQUIDITY
Our group-wide liquidity was ~$2.3 billion at September 30, 2013, up from approximately $760 million at December 31, 2012, and
was comprised of the following:
US$ MILLIONS, UNAUDITED
Actual as of
September 30, 2013 December 31, 2012
Proforma
Liquidity
Corporate cash and financial assets $ 373 $ 7 $ 788
Committed corporate credit facility 1,400 855 1,400
Draws under corporate credit facility (193) (546) (193)
Commitments under corporate credit facility (95) (92) (95)
Proportionate cash retained in businesses 353 203 353
Proportionate availability under subsidiary credit facilities 474 336 474
Group–wide liquidity $ 2,312 $ 763 $ 2,727
• Pro-forma corporate cash (inclusive of financial assets) is approximately $800 million following completion of the sale of Australasian
distribution business, expected to occur by the end of November
• We maintain sufficient liquidity at all times to participate in attractive opportunities as they arise, withstand sudden adverse changes
in economic circumstances and maintain a relatively high payout of our FFO to unitholders
• Principal sources of liquidity are cash flows from our operations, undrawn credit facilities and access to public and private capital
markets
• We may, from time to time, invest in financial assets comprised mainly of liquid equity and debt infrastructure securities in order to
earn attractive short-term returns and for strategic purposes
18
Brookfield Infrastructure Partners L.P.
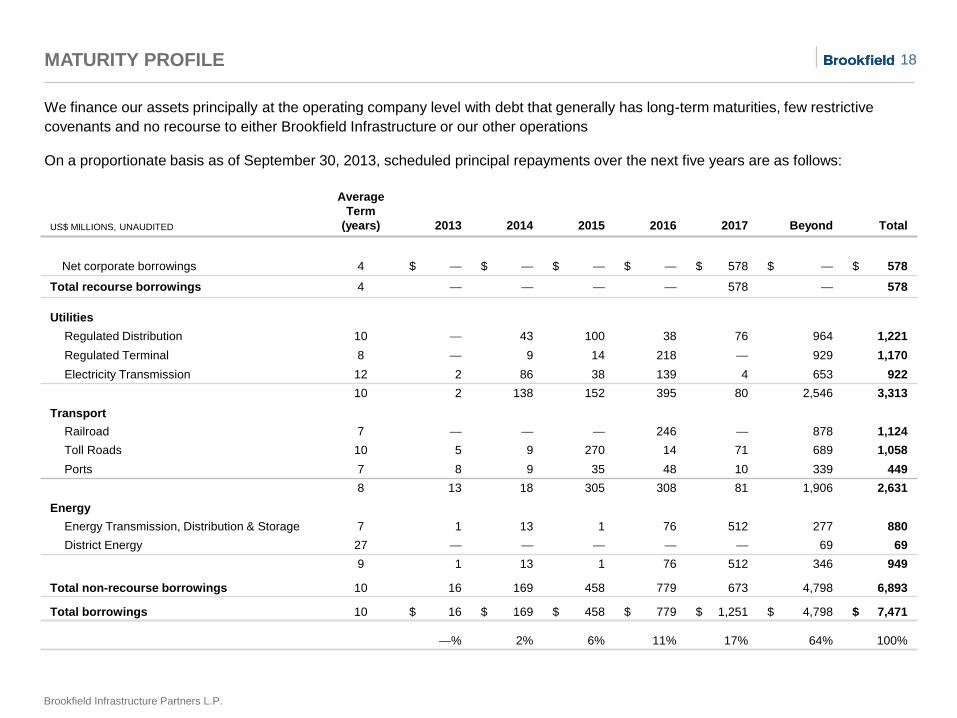
US$ MILLIONS, UNAUDITED
Average
Term
(years) 2013 2014 2015 2016 2017 Beyond Total
Net corporate borrowings 4 $ — $ — $ — $ — $ 578 $ — $ 578
Total recourse borrowings 4 — — — — 578 — 578
Utilities
Regulated Distribution 10 — 43 100 38 76 964 1,221
Regulated Terminal 8 — 9 14 218 — 929 1,170
Electricity Transmission 12 2 86 38 139 4 653 922
10 2 138 152 395 80 2,546 3,313
Transport
Railroad 7 — — — 246 — 878 1,124
Toll Roads 10 5 9 270 14 71 689 1,058
Ports 7 8 9 35 48 10 339 449
8 13 18 305 308 81 1,906 2,631
Energy
Energy Transmission, Distribution & Storage 7 1 13 1 76 512 277 880
District Energy 27 — — — — — 69 69
9 1 13 1 76 512 346 949
Total non-recourse borrowings 10 16 169 458 779 673 4,798 6,893
Total borrowings 10 $ 16 $ 169 $ 458 $ 779 $ 1,251 $ 4,798 $ 7,471
—% 2% 6% 11% 17% 64% 100%
MATURITY PROFILE
We finance our assets principally at the operating company level with debt that generally has long-term maturities, few restrictive
covenants and no recourse to either Brookfield Infrastructure or our other operations
On a proportionate basis as of September 30, 2013, scheduled principal repayments over the next five years are as follows:
19
Brookfield Infrastructure Partners L.P.
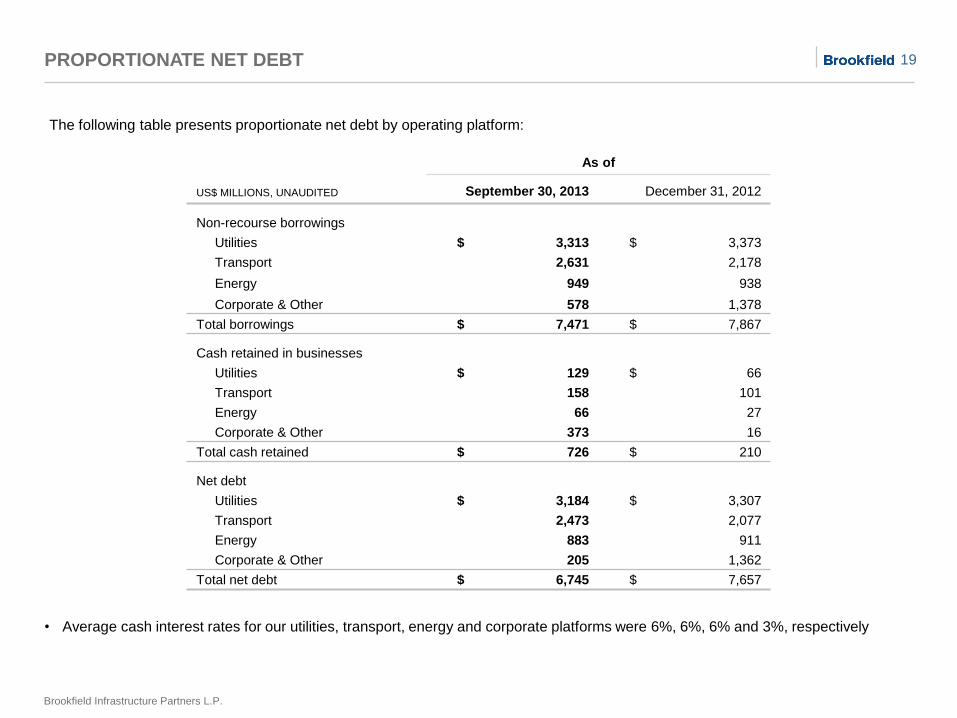
PROPORTIONATE NET DEBT
The following table presents proportionate net debt by operating platform:
US$ MILLIONS, UNAUDITED
As of
September 30, 2013 December 31, 2012
Non-recourse borrowings
Utilities $ 3,313 $ 3,373
Transport 2,631 2,178
Energy 949 938
Corporate & Other 578 1,378
Total borrowings $ 7,471 $ 7,867
Cash retained in businesses
Utilities $ 129 $ 66
Transport 158 101
Energy 66 27
Corporate & Other 373 16
Total cash retained $ 726 $ 210
Net debt
Utilities $ 3,184 $ 3,307
Transport 2,473 2,077
Energy 883 911
Corporate & Other 205 1,362
Total net debt $ 6,745 $ 7,657
• Average cash interest rates for our utilities, transport, energy and corporate platforms were 6%, 6%, 6% and 3%, respectively
20
Brookfield Infrastructure Partners L.P.
FOREIGN CURRENCY HEDGING STRATEGY
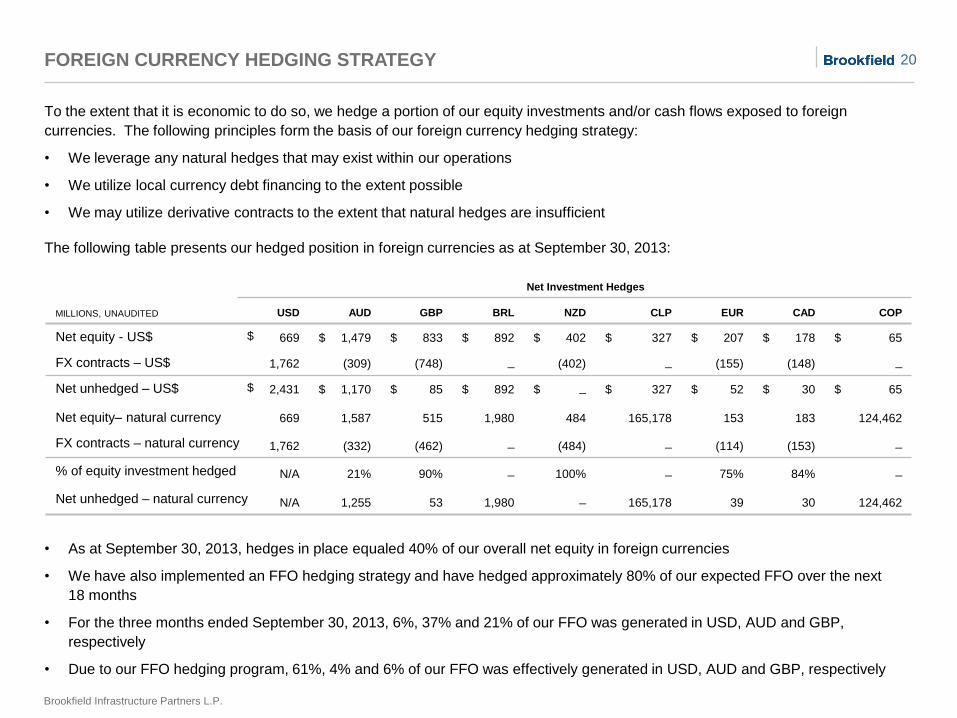
• As at September 30, 2013, hedges in place equaled 40% of our overall net equity in foreign currencies
• We have also implemented an FFO hedging strategy and have hedged approximately 80% of our expected FFO over the next
18 months
• For the three months ended September 30, 2013, 6%, 37% and 21% of our FFO was generated in USD, AUD and GBP,
respectively
• Due to our FFO hedging program, 61%, 4% and 6% of our FFO was effectively generated in USD, AUD and GBP, respectively
To the extent that it is economic to do so, we hedge a portion of our equity investments and/or cash flows exposed to foreign
currencies. The following principles form the basis of our foreign currency hedging strategy:
• We leverage any natural hedges that may exist within our operations
• We utilize local currency debt financing to the extent possible
• We may utilize derivative contracts to the extent that natural hedges are insufficient
The following table presents our hedged position in foreign currencies as at September 30, 2013:
MILLIONS, UNAUDITED
Net Investment Hedges
USD AUD GBP BRL NZD CLP EUR CAD COP
Net equity - US$ $ 669 $ 1,479 $ 833 $ 892 $ 402 $ 327 $ 207 $ 178 $ 65
FX contracts – US$ 1,762 (309) (748) _ (402) _ (155) (148) _
Net unhedged – US$ $ 2,431 $ 1,170 $ 85 $ 892 $ _ $ 327 $ 52 $ 30 $ 65
Net equity– natural currency 669 1,587 515 1,980 484 165,178 153 183 124,462
FX contracts – natural currency 1,762 (332) (462) _ (484) _ (114) (153) _
% of equity investment hedged N/A 21% 90% _ 100% _ 75% 84% _
Net unhedged – natural currency N/A 1,255 53 1,980 _ 165,178 39 30 124,462
21
Brookfield Infrastructure Partners L.P.
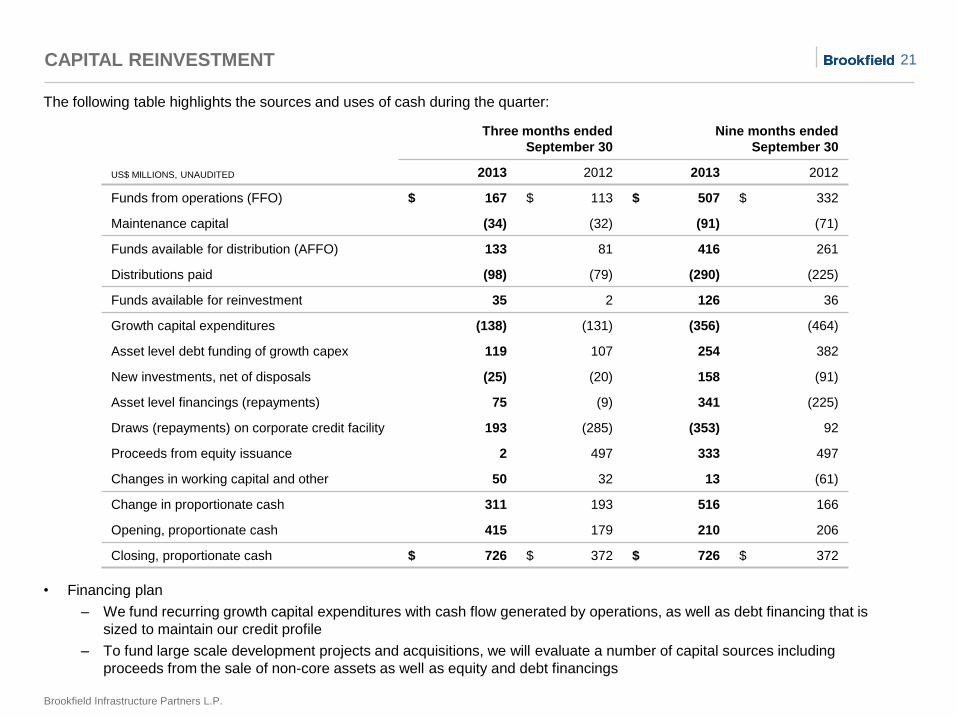
CAPITAL REINVESTMENT
• Financing plan
‒ We fund recurring growth capital expenditures with cash flow generated by operations, as well as debt financing that is
sized to maintain our credit profile
‒ To fund large scale development projects and acquisitions, we will evaluate a number of capital sources including
proceeds from the sale of non-core assets as well as equity and debt financings
The following table highlights the sources and uses of cash during the quarter:
US$ MILLIONS, UNAUDITED
Three months ended
September 30
Nine months ended
September 30
2013 2012 2013 2012
Funds from operations (FFO) $ 167 $ 113 $ 507 $ 332
Maintenance capital (34) (32) (91) (71)
Funds available for distribution (AFFO) 133 81 416 261
Distributions paid (98) (79) (290) (225)
Funds available for reinvestment 35 2 126 36
Growth capital expenditures (138) (131) (356) (464)
Asset level debt funding of growth capex 119 107 254 382
New investments, net of disposals (25) (20) 158 (91)
Asset level financings (repayments) 75 (9) 341 (225)
Draws (repayments) on corporate credit facility 193 (285) (353) 92
Proceeds from equity issuance 2 497 333 497
Changes in working capital and other 50 32 13 (61)
Change in proportionate cash 311 193 516 166
Opening, proportionate cash 415 179 210 206
Closing, proportionate cash $ 726 $ 372 $ 726 $ 372
22
Brookfield Infrastructure Partners L.P.
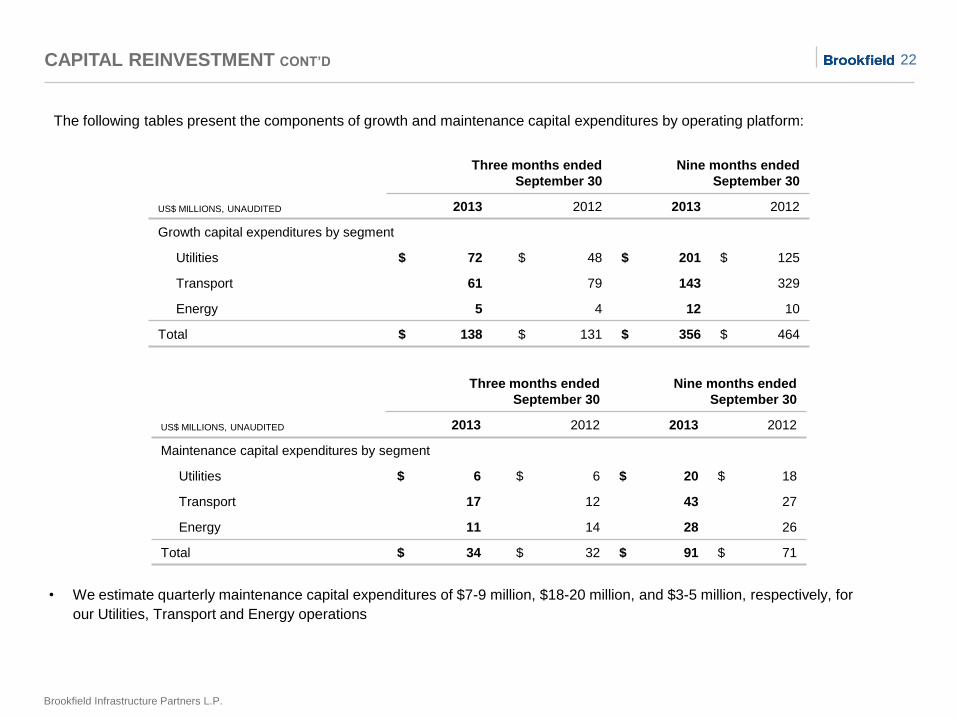
CAPITAL REINVESTMENT CONT’D
Three months ended
September 30
Nine months ended
September 30
US$ MILLIONS, UNAUDITED 2013 2012 2013 2012
Growth capital expenditures by segment
Utilities $ 72 $ 48 $ 201 $ 125
Transport 61 79 143 329
Energy 5 4 12 10
Total $ 138 $ 131 $ 356 $ 464
The following tables present the components of growth and maintenance capital expenditures by operating platform:
• We estimate quarterly maintenance capital expenditures of $7-9 million, $18-20 million, and $3-5 million, respectively, for
our Utilities, Transport and Energy operations
Three months ended
September 30
Nine months ended
September 30
US$ MILLIONS, UNAUDITED 2013 2012 2013 2012
Maintenance capital expenditures by segment
Utilities $ 6 $ 6 $ 20 $ 18
Transport 17 12 43 27
Energy 11 14 28 26
Total $ 34 $ 32 $ 91 $ 71
23
Brookfield Infrastructure Partners L.P.
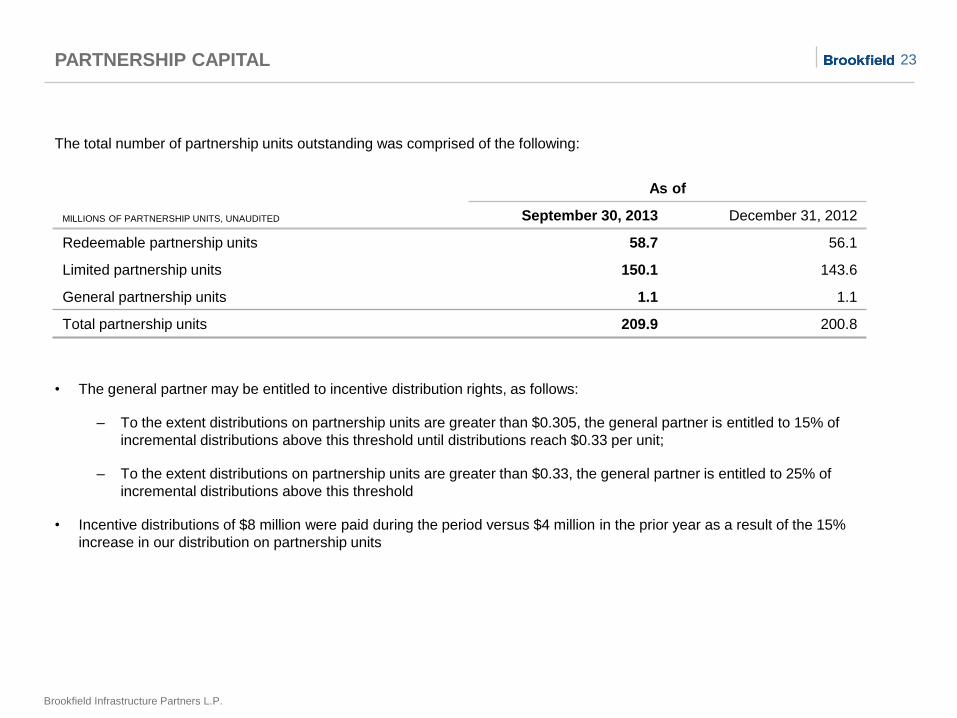
PARTNERSHIP CAPITAL
MILLIONS OF PARTNERSHIP UNITS, UNAUDITED
As of
September 30, 2013 December 31, 2012
Redeemable partnership units 58.7 56.1
Limited partnership units 150.1 143.6
General partnership units 1.1 1.1
Total partnership units 209.9 200.8
• The general partner may be entitled to incentive distribution rights, as follows:
‒ To the extent distributions on partnership units are greater than $0.305, the general partner is entitled to 15% of
incremental distributions above this threshold until distributions reach $0.33 per unit;
‒ To the extent distributions on partnership units are greater than $0.33, the general partner is entitled to 25% of
incremental distributions above this threshold
• Incentive distributions of $8 million were paid during the period versus $4 million in the prior year as a result of the 15%
increase in our distribution on partnership units
The total number of partnership units outstanding was comprised of the following:
APPENDIX – RECONCILIATION OF NON-IFRS FINANCIAL MEASURES
25
Brookfield Infrastructure Partners L.P.
RECONCILIATION OF NON-IFRS MEASURES TO IFRS MEASURES
US$ MILLIONS, UNAUDITED
Three months ended
September 30
Nine months ended
September 30
2013 2012 2013 2012
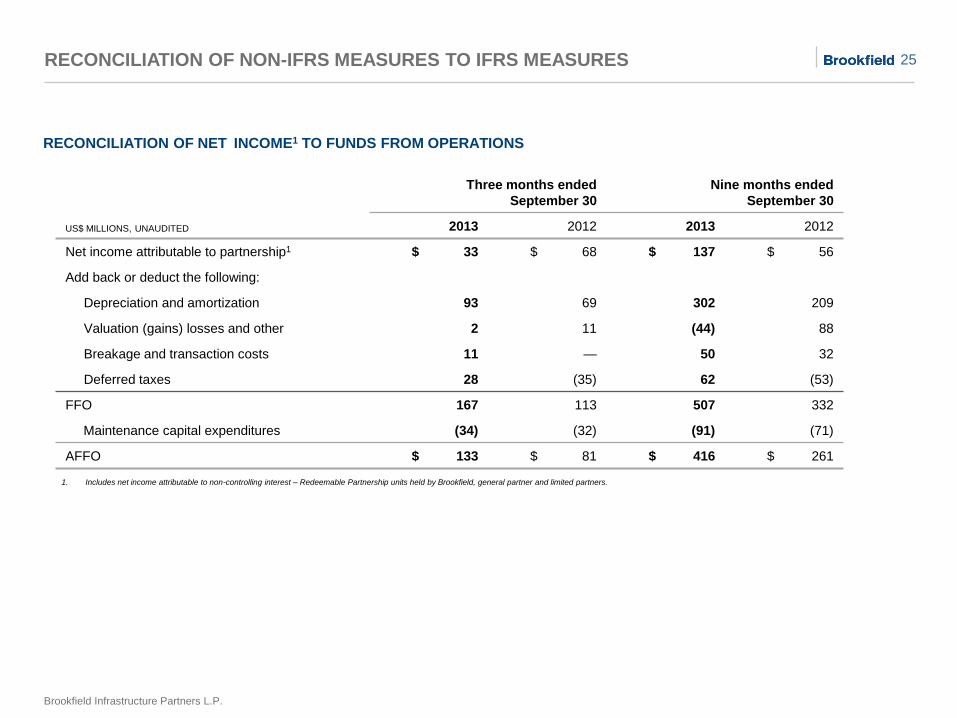
Net income attributable to partnership1 $ 33 $ 68 $ 137 $ 56
Add back or deduct the following:
Depreciation and amortization 93 69 302 209
Valuation (gains) losses and other 2 11 (44) 88
Breakage and transaction costs 11 — 50 32
Deferred taxes 28 (35) 62 (53)
FFO 167 113 507 332
Maintenance capital expenditures (34) (32) (91) (71)
AFFO $ 133 $ 81 $ 416 $ 261
RECONCILIATION OF NET INCOME1 TO FUNDS FROM OPERATIONS
1. Includes net income attributable to non-controlling interest – Redeemable Partnership units held by Brookfield, general partner and limited partners.
26
Brookfield Infrastructure Partners L.P.
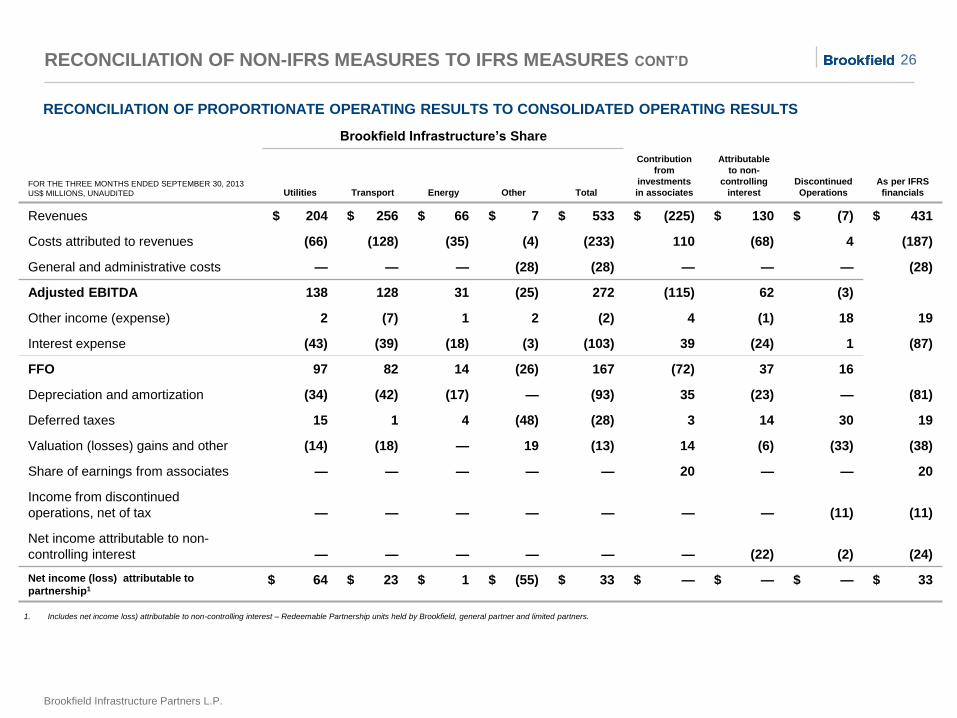
Brookfield Infrastructure’s Share
FOR THE THREE MONTHS ENDED SEPTEMBER 30, 2013
US$ MILLIONS, UNAUDITED Utilities Transport Energy Other Total
Contribution
from
investments
in associates
Attributable
to non-
controlling
interest
Discontinued
Operations
As per IFRS
financials
Revenues $ 204 $ 256 $ 66 $ 7 $ 533 $ (225) $ 130 $ (7) $ 431
Costs attributed to revenues (66) (128) (35) (4) (233) 110 (68) 4 (187)
General and administrative costs — — — (28) (28) — — — (28)
Adjusted EBITDA 138 128 31 (25) 272 (115) 62 (3)
Other income (expense) 2 (7) 1 2 (2) 4 (1) 18 19
Interest expense (43) (39) (18) (3) (103) 39 (24) 1 (87)
FFO 97 82 14 (26) 167 (72) 37 16
Depreciation and amortization (34) (42) (17) — (93) 35 (23) — (81)
Deferred taxes 15 1 4 (48) (28) 3 14 30 19
Valuation (losses) gains and other (14) (18) — 19 (13) 14 (6) (33) (38)
Share of earnings from associates — — — — — 20 — — 20
Income from discontinued
operations, net of tax — — — — — — — (11) (11)
Net income attributable to non-
controlling interest — — — — — — (22) (2) (24)
Net income (loss) attributable to
partnership1 $ 64 $ 23 $ 1 $ (55) $ 33 $ — $ — $ — $ 33
RECONCILIATION OF NON-IFRS MEASURES TO IFRS MEASURES CONT’D
RECONCILIATION OF PROPORTIONATE OPERATING RESULTS TO CONSOLIDATED OPERATING RESULTS
1. Includes net income loss) attributable to non-controlling interest – Redeemable Partnership units held by Brookfield, general partner and limited partners.
27
Brookfield Infrastructure Partners L.P.
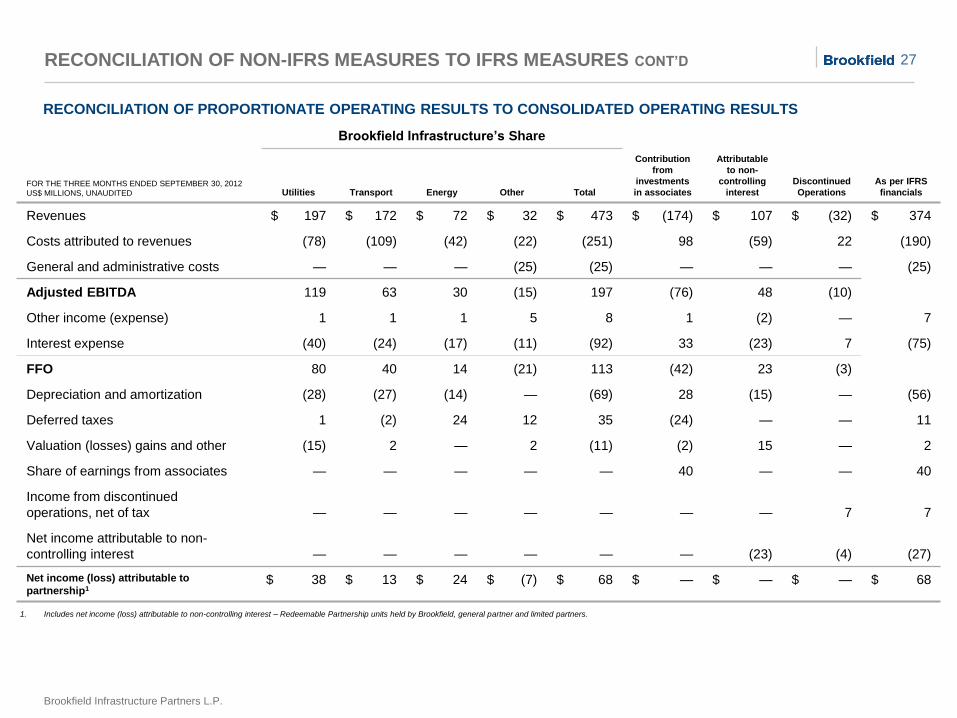
Brookfield Infrastructure’s Share
FOR THE THREE MONTHS ENDED SEPTEMBER 30, 2012
US$ MILLIONS, UNAUDITED Utilities Transport Energy Other Total
Contribution
from
investments
in associates
Attributable
to non-
controlling
interest
Discontinued
Operations
As per IFRS
financials
Revenues $ 197 $ 172 $ 72 $ 32 $ 473 $ (174) $ 107 $ (32) $ 374
Costs attributed to revenues (78) (109) (42) (22) (251) 98 (59) 22 (190)
General and administrative costs — — — (25) (25) — — — (25)
Adjusted EBITDA 119 63 30 (15) 197 (76) 48 (10)
Other income (expense) 1 1 1 5 8 1 (2) — 7
Interest expense (40) (24) (17) (11) (92) 33 (23) 7 (75)
FFO 80 40 14 (21) 113 (42) 23 (3)
Depreciation and amortization (28) (27) (14) — (69) 28 (15) — (56)
Deferred taxes 1 (2) 24 12 35 (24) — — 11
Valuation (losses) gains and other (15) 2 — 2 (11) (2) 15 — 2
Share of earnings from associates — — — — — 40 — — 40
Income from discontinued
operations, net of tax
—
— — — — — — 7 7
Net income attributable to non-
controlling interest — — — — — — (23) (4) (27)
Net income (loss) attributable to
partnership1 $ 38 $ 13 $ 24 $ (7) $ 68 $ — $ — $ — $ 68
RECONCILIATION OF NON-IFRS MEASURES TO IFRS MEASURES CONT’D
RECONCILIATION OF PROPORTIONATE OPERATING RESULTS TO CONSOLIDATED OPERATING RESULTS
1. Includes net income (loss) attributable to non-controlling interest – Redeemable Partnership units held by Brookfield, general partner and limited partners.
28
Brookfield Infrastructure Partners L.P.
Brookfield Infrastructure’s Share
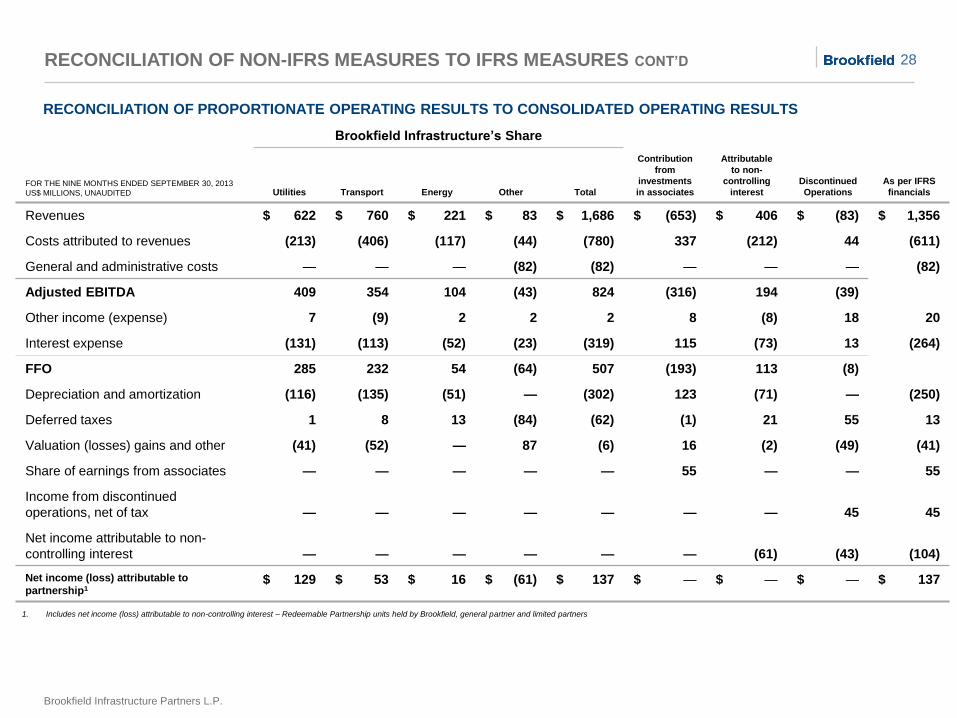
FOR THE NINE MONTHS ENDED SEPTEMBER 30, 2013
US$ MILLIONS, UNAUDITED Utilities Transport Energy Other Total
Contribution
from
investments
in associates
Attributable
to non-
controlling
interest
Discontinued
Operations
As per IFRS
financials
Revenues $ 622 $ 760 $ 221 $ 83 $ 1,686 $ (653) $ 406 $ (83) $ 1,356
Costs attributed to revenues (213) (406) (117) (44) (780) 337 (212) 44 (611)
General and administrative costs — — — (82) (82) — — — (82)
Adjusted EBITDA 409 354 104 (43) 824 (316) 194 (39)
Other income (expense) 7 (9) 2 2 2 8 (8) 18 20
Interest expense (131) (113) (52) (23) (319) 115 (73) 13 (264)
FFO 285 232 54 (64) 507 (193) 113 (8)
Depreciation and amortization (116) (135) (51) — (302) 123 (71) — (250)
Deferred taxes 1 8 13 (84) (62) (1) 21 55 13
Valuation (losses) gains and other (41) (52) — 87 (6) 16 (2) (49) (41)
Share of earnings from associates — — — — — 55 — — 55
Income from discontinued
operations, net of tax — — — — — — — 45 45
Net income attributable to non-
controlling interest — — — — — — (61) (43) (104)
Net income (loss) attributable to
partnership1 $ 129 $ 53 $ 16 $ (61) $ 137 $ — $ — $ — $ 137
RECONCILIATION OF NON-IFRS MEASURES TO IFRS MEASURES CONT’D
RECONCILIATION OF PROPORTIONATE OPERATING RESULTS TO CONSOLIDATED OPERATING RESULTS
1. Includes net income (loss) attributable to non-controlling interest – Redeemable Partnership units held by Brookfield, general partner and limited partners
29
Brookfield Infrastructure Partners L.P.
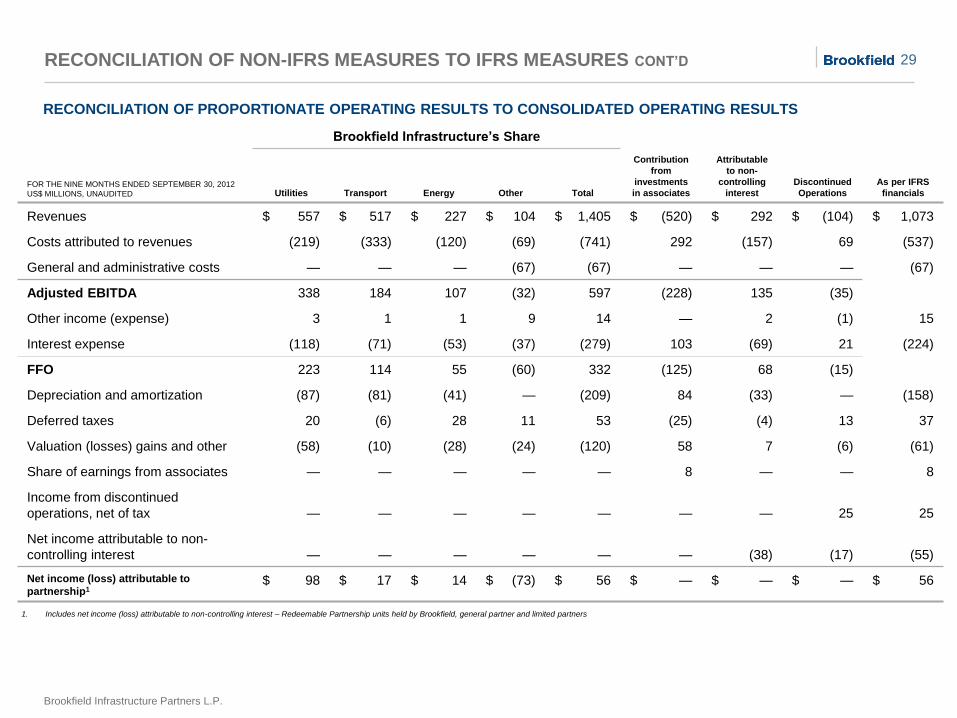
Brookfield Infrastructure’s Share
FOR THE NINE MONTHS ENDED SEPTEMBER 30, 2012
US$ MILLIONS, UNAUDITED Utilities Transport Energy Other Total
Contribution
from
investments
in associates
Attributable
to non-
controlling
interest
Discontinued
Operations
As per IFRS
financials
Revenues $ 557 $ 517 $ 227 $ 104 $ 1,405 $ (520) $ 292 $ (104) $ 1,073
Costs attributed to revenues (219) (333) (120) (69) (741) 292 (157) 69 (537)
General and administrative costs — — — (67) (67) — — — (67)
Adjusted EBITDA 338 184 107 (32) 597 (228) 135 (35)
Other income (expense) 3 1 1 9 14 — 2 (1) 15
Interest expense (118) (71) (53) (37) (279) 103 (69) 21 (224)
FFO 223 114 55 (60) 332 (125) 68 (15)
Depreciation and amortization (87) (81) (41) — (209) 84 (33) — (158)
Deferred taxes 20 (6) 28 11 53 (25) (4) 13 37
Valuation (losses) gains and other (58) (10) (28) (24) (120) 58 7 (6) (61)
Share of earnings from associates — — — — — 8 — — 8
Income from discontinued
operations, net of tax — — — — — — — 25 25
Net income attributable to non-
controlling interest — — — — — — (38) (17) (55)
Net income (loss) attributable to
partnership1 $ 98 $ 17 $ 14 $ (73) $ 56 $ — $ — $ — $ 56
RECONCILIATION OF NON-IFRS MEASURES TO IFRS MEASURES CONT’D
RECONCILIATION OF PROPORTIONATE OPERATING RESULTS TO CONSOLIDATED OPERATING RESULTS
1. Includes net income (loss) attributable to non-controlling interest – Redeemable Partnership units held by Brookfield, general partner and limited partners
30
Brookfield Infrastructure Partners L.P.
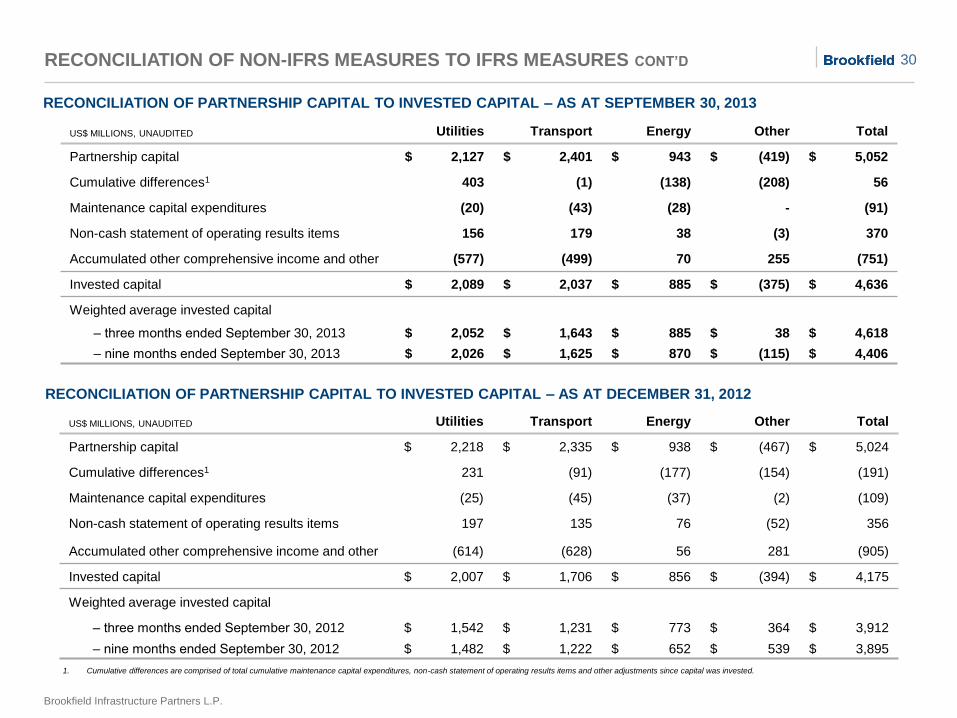
RECONCILIATION OF NON-IFRS MEASURES TO IFRS MEASURES CONT’D
1. Cumulative differences are comprised of total cumulative maintenance capital expenditures, non-cash statement of operating results items and other adjustments since capital was invested.
US$ MILLIONS, UNAUDITED Utilities Transport Energy Other Total
Partnership capital $ 2,127 $ 2,401 $ 943 $ (419) $ 5,052
Cumulative differences1 403 (1) (138) (208) 56
Maintenance capital expenditures (20) (43) (28) - (91)
Non-cash statement of operating results items 156 179 38 (3) 370
Accumulated other comprehensive income and other (577) (499) 70 255 (751)
Invested capital $ 2,089 $ 2,037 $ 885 $ (375) $ 4,636
Weighted average invested capital
‒ three months ended September 30, 2013 $ 2,052 $ 1,643 $ 885 $ 38 $ 4,618
‒ nine months ended September 30, 2013 $ 2,026 $ 1,625 $ 870 $ (115) $ 4,406
RECONCILIATION OF PARTNERSHIP CAPITAL TO INVESTED CAPITAL – AS AT SEPTEMBER 30, 2013
RECONCILIATION OF PARTNERSHIP CAPITAL TO INVESTED CAPITAL – AS AT DECEMBER 31, 2012
US$ MILLIONS, UNAUDITED Utilities Transport Energy Other Total
Partnership capital $ 2,218 $ 2,335 $ 938 $ (467) $ 5,024
Cumulative differences1 231 (91) (177) (154) (191)
Maintenance capital expenditures (25) (45) (37) (2) (109)
Non-cash statement of operating results items 197 135 76 (52) 356
Accumulated other comprehensive income and other (614) (628) 56 281 (905)
Invested capital $ 2,007 $ 1,706 $ 856 $ (394) $ 4,175
Weighted average invested capital
‒ three months ended September 30, 2012 $ 1,542 $ 1,231 $ 773 $ 364 $ 3,912
‒ nine months ended September 30, 2012 $ 1,482 $ 1,222 $ 652 $ 539 $ 3,895
31
Brookfield Infrastructure Partners L.P.
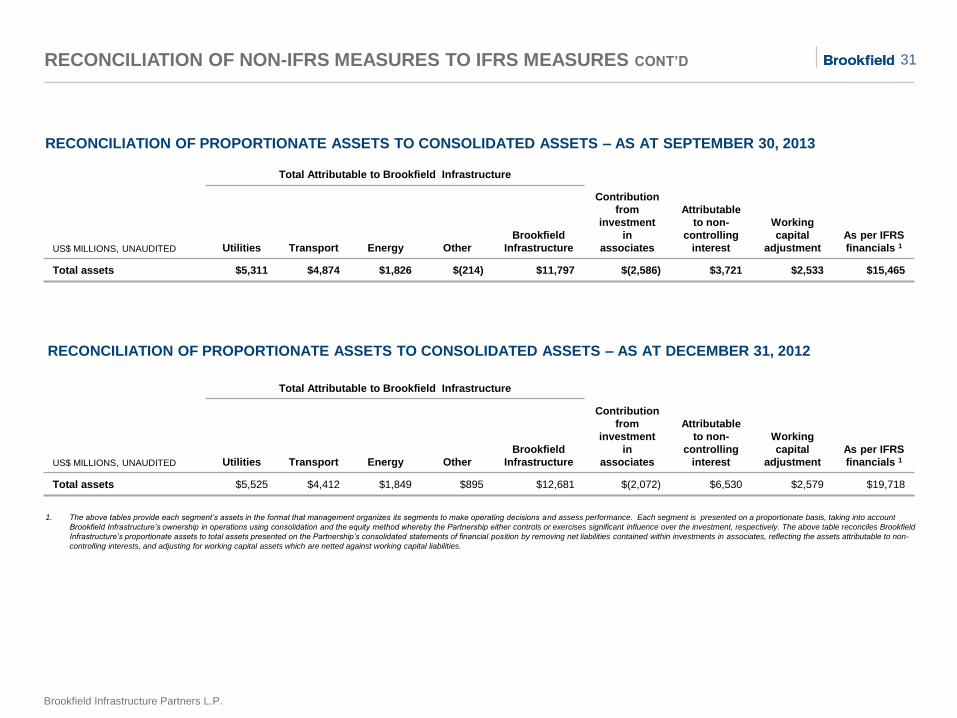
RECONCILIATION OF NON-IFRS MEASURES TO IFRS MEASURES CONT’D
Total Attributable to Brookfield Infrastructure
US$ MILLIONS, UNAUDITED Utilities Transport Energy Other
Brookfield
Infrastructure
Contribution
from
investment
in
associates
Attributable
to non-
controlling
interest
Working
capital
adjustment
As per IFRS
financials 1
Total assets $5,311 $4,874 $1,826 $(214) $11,797 $(2,586) $3,721 $2,533 $15,465
Total Attributable to Brookfield Infrastructure
US$ MILLIONS, UNAUDITED Utilities Transport Energy Other
Brookfield
Infrastructure
Contribution
from
investment
in
associates
Attributable
to non-
controlling
interest
Working
capital
adjustment
As per IFRS
financials 1
Total assets $5,525 $4,412 $1,849 $895 $12,681 $(2,072) $6,530 $2,579 $19,718
1. The above tables provide each segment’s assets in the format that management organizes its segments to make operating decisions and assess performance. Each segment is presented on a proportionate basis, taking into account
Brookfield Infrastructure’s ownership in operations using consolidation and the equity method whereby the Partnership either controls or exercises significant influence over the investment, respectively. The above table reconciles Brookfield
Infrastructure’s proportionate assets to total assets presented on the Partnership’s consolidated statements of financial pos ition by removing net liabilities contained within investments in associates, reflecting the assets attributable to non-
controlling interests, and adjusting for working capital assets which are netted against working capital liabilities.
RECONCILIATION OF PROPORTIONATE ASSETS TO CONSOLIDATED ASSETS – AS AT SEPTEMBER 30, 2013
RECONCILIATION OF PROPORTIONATE ASSETS TO CONSOLIDATED ASSETS – AS AT DECEMBER 31, 2012
32
Brookfield Infrastructure Partners L.P.
US$ MILLIONS, UNAUDITED
As of
September 30,
2013
December 31,
2012
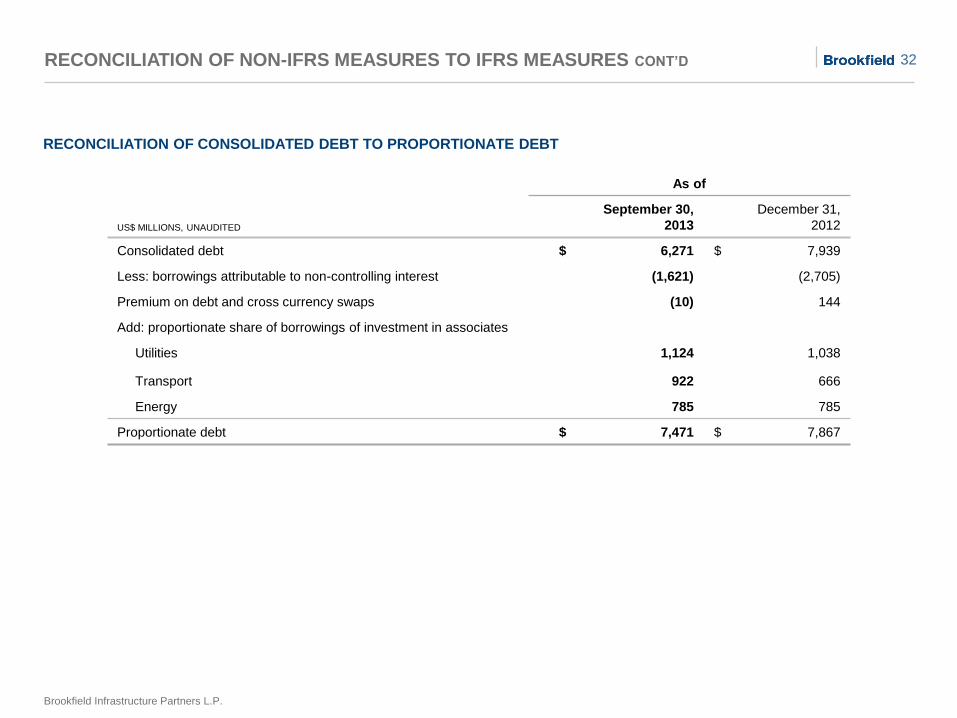
Consolidated debt $ 6,271 $ 7,939
Less: borrowings attributable to non-controlling interest (1,621) (2,705)
Premium on debt and cross currency swaps (10) 144
Add: proportionate share of borrowings of investment in associates
Utilities 1,124 1,038
Transport 922 666
Energy 785 785
Proportionate debt $ 7,471 $ 7,867
RECONCILIATION OF NON-IFRS MEASURES TO IFRS MEASURES CONT’D
RECONCILIATION OF CONSOLIDATED DEBT TO PROPORTIONATE DEBT
33
Brookfield Infrastructure Partners L.P.
USE OF NON-IFRS MEASURES
• Funds from operations (FFO), adjusted funds from operations (AFFO), adjusted EBITDA, invested capital and their per
share equivalents, where applicable, are non-IFRS measures which do not have any standard meaning prescribed by IFRS and
therefore may not be comparable to similar measures presented by other companies
‒ FFO, AFFO and invested capital are reconciled to Net Income and Partnership capital, respectively, the closest measures
determined under IFRS on pages 25 and 30, respectively
• FFO is defined as net income excluding the impact of depreciation and amortization, deferred income taxes, breakage and
transaction costs, non-cash valuation gains or losses, and other items
‒ Brookfield Infrastructure uses FFO to assess its operating results
• Adjusted EBITDA is defined as FFO excluding the impact of interest expense, and other income or expenses
‒ Brookfield Infrastructure uses Adjusted EBITDA as a measure of operating performance
• AFFO is a measure of our sustainable cash flow and is calculated as FFO less maintenance capital expenditures
‒ In order to assess our performance as stewards of capital, we also focus on AFFO yield, which is a proxy for our returns on
invested capital
• Invested capital is meant to track the initial investment that we make in a business plus all cash flow that we re-invest in the
business