Embed Size (px)
Citation preview

MEuNMHOLTECINTERNATIONAL
Holtec Center, 555 Lincoln Drive West, Marlton, NJ 08053
Telephone (856) 797-0900
Fax (856) 797-0909
Kimberly HardinC/O U.S. Nuclear Regulatory CommissionATTN: Document Control DeskWashington, DC 20555-0001
February 27, 2009
Reference:
Subject:
1. USNRC Docket No. 71-9261 (HI-STAR 100), TAC L240292. Holtec Project 50143. Conversation Record for Phone Call held onJanuary 14, 2009 (ML4. Holtec Letter 5014666 dated September 39, 2008
Supplemental Information to Support Response to 2nd Request for AdditionalInformation (RAI) on License Amendment Request (LAR) 9261-5 to HI-STAR 100Certificate of Compliance (CoC) No. 9261
Dear Ms. Hardin:
On January 14, 2009 the NRC and Holtec held a teleconference (Reference 3) to discuss someclarifying questions on the second response to RAI (Reference 4). This letter and the attachmentsprovide the reconciliation of those clarifying questions.
Attachment I to this letter contains the specific responses to the questions; and Attachment 2contains the updated SAR sections. As stated in the conversation record, Staff will be adding thenecessary clarifications to the CoC and SER as presented in question 5 and 6; therefore no responseis provided.
Document ID: 5014678~/
C)

MEu.MHOLTECINTERNATIONAL
Holtec Center, 555 Lincoln Drive West, Marlton, NJ 08053
Telephone (856) 797-0900
Fax (856) 797-0909
U. S. Nuclear Regulatory CommissionATTN: Document Control DeskDocument ID 5014678Page 2 of 2
The following attachments are provided with this letter:
Attachment 1: Response to Clarifying Questions.
Attachment 2: Proposed Revised SAR Sections 2.7, 2.A, 2.1, 7.1, and 8.1. All changed sections areprovided and are labeled as "Proposed Rev. 13c".
Sincerely,
Tammy MorinActing Licensing Manager,Project Manager, LAR 9261-5Holtec International
cc: USNRC Document Control Desk, hardcopy onlyMs. Kimberly Hardin, Sr. Project Manager, NRC/NMSS/SFSTMr. Eric Benner, Licensing Branch Chief, NRC/NMSS/SFST, Letter onlyMr. Larry Pulley, PSE&G, Letter only via emailGroup 1, Holtec, Letter only via email

Attachment I to Holtec Letter 5014678Response to Clarifying Questions
Question 1:
On Drawing 4082, Sheet 6, Mid-Plane, for HI-STAR HB and drawing 3913 for HI-STAR100, Staff questioned to removal of radial gussets, exterior shell holding Holtite-A,neutron shielding material. Was this evaluated for structural effects. There needs to besome recognition as a design changem in Supplement 2.1 and provide an evaluationsummary.
Holtec Response to Question 1:
The radial gussets were removed from the space between the inner and outer shells. Theheat load of the HI-STAR HB casks are so low they are not needed to conduct the heatradially. The description of the design difference has been added to 2.1.0. An evaluationsummary was added to 2.1.6.
Question 2:
Regarding question 2-4, Section 2.1.7.1 needs to be revised to include the RAI response,which justifies the use of the Holtec differential equation method for HI-STAR HBimplementation. Specifically,
- Clarify the use of the wording in the SAR - the Hexel manufacturer's cataloguestates that dynamic crush strengths are a function of "initial" velocity. There is noinformation suggesting that the "Z" factors in the differential equation method area function of crush material density - (maybe crush strength).
- Use of identical dynamic multiplier (or dynamic correlation function), representedby a linear function of concomitant crush velocity, should be captured in the SARas the basis for using the predictive simulation without impact limiter droptesting.
- Holtec proprietary report results need to be summarized (RAI response and keytechnical basis) in Section 2.1.7.1.
- Per page 23 of 26, Holtec Calculation Package HI-208417, Rev. 0, 9/29/08, do notgive the explicit for of the Dynamic Correlation Function in the SAR.
Holtec Response to Question 2:
Additional discussion and summary with appropriate clarification was added to 2.1.7.1consistent with the response that was provided in the second RAI, question 2-4.
Question 3:
Clarify wording in Chapter 7 about pocket trunnions possible use as tie-down devices.
Page 1 of 2

Attachment I to Holtec Letter 5014678Response to Clarifying Questions
Holtec Response to Question 3:
Pocket trunnions will not be used as tie-down devices therefore the wording in 7.1.5, Step3, was modified as requested.
Question 4:
Clarify the neutron shield tests.
Holtec Response to Question 4:
Wording in 8.1.5.4 was modified as requested.
Question 7:
Page 2.7-3P: Reference 2.1.7.4 - not found in supplement 2.1.11 reference.
Holtec Response to Question 7:
The incorrect reference was eliminated in four places (two in Section 2.7 and two insection 2.A). The '¼ scale model drawings of the impact limiters tested were never a partof-the application and therefore the sentences that indicated this were also removed.
Question 8:
Page 2.A-23: Revision 2 for Reference 2.A.7, "Impact Limiter Test Report - SecondSeries, 1998. Referenece 10 of the calculation package, HI-208417 is Revision 3-undated.
Holtec Response to Question 8:
The correct Revision number and date are provided in Reference 2.A.7.
Page 2 of 2

Attachment 2 to Holtec Letter 5014678(110 pages)

2.7 HYPOTHETICAL ACCIDENT CONDITIONS
It was shown in the preceding section that the load combinations for normal conditions of transportdo not induce stresses or stress intensities in excess of allowables. Therefore, it is concluded that theeffectiveness of the HI-STAR 100 System is not reduced under normal conditions of transport.
The hypothetical accident conditions, as defined in I0CFR71.73 and Regulatory Guide 7.9, areapplied to the HI-STAR 100 System in the required sequence. The system is first subjected to a 9meter (30 foot) drop in the most damaging orientation, then subject to a I meter (40 inch) drop ontoa 6 inch diameter mild steel pin (of length sufficient to cause damage to the steel structure), followedby a 1475°F temperature fire environment for 30 minutes, and finally to a water immersion test.
The overpack containment boundary is also subjected to deep immersion in accordance with1OCFR71.61.
It is shown in the following subsections that the HI-STAR 100 System meets the standards set forthin I OCFR7 1, when it is subjected to the hypothetical accident conditions specified in I OCFR71.73.In particular, sufficient analytical and experimental evidence is presented herein to support theconclusion that HI-STAR 100 packaging, when subjected to hypothetical accident conditions, hasadequate structural integrity to satisfy the subcriticality, containment, shielding, and temperaturerequirements of I OCFR7 1.
2.7.1 Free Drop
In this section the performance and structural integrity of the HI-STAR 100 System is evaluated forthe most severe drop events. The drop events that are potentially most damaging are the end drops(top or bottom), the side drop, the orientation for which the center of gravity is directly over thepoint of impact, an oblique drop where the angle of impact is somewhere between center of gravityover corner and a near side drop, and an orientation where package rotation after an impact at oneend induces a larger impact deceleration when the other end impacts the target (e.g., slapdown).
The structural assessment of the package is performed in two parts. In the first part, a numericalmodel to simulate the drop events is prepared and benchmarked against 1/8 scale static tests of theHI-STAR 100 impact limiters, and '/4-scale dynamic drop tests of the Hi-STAR 100 Package. Thisnumerical/experimental effort is carried out to confirm that the maximum rigid body decelerationsexperienced by the package are less than the design basis values set forth in Table 2.1.10. In thesecond part, the structural integrity of components under the inertia loads due to design basisdeceleration levels is evaluated. The deceleration sustained by the internals, such as the fuel basket,are further amplified in recognition of the elasticity of the internal structures. The dynamic amplifieris considered as an added multiplier on the rigid body deceleration in the structural assessments.Dynamic amplifiers applicable to components of the package have been developed from evaluatingthe behavior of simplified models.
HI-STAR SAR Proposed Rev. 13cREPORT HI-951251 2.7-1

Part One: Maximum Rigid Body Deceleration Under IOCFR71.73 Free Dron Event
The determination of the AL-STAR impact limiter performance under postulated I OCFR71.73 freedrop events was carried out in six phases as summarized below and further elaborated in Appendix2.A.
Characterize honeycomb material crush behavior: Coupons of both unidirectional and cross-core honeycomb materials at different nominal crush strength values were prepared andtested. A typical pressure vs. deflection curve is shown in Figure 2.A.2.1 in Appendix 2.A.The pressure in the flat portion of the curve denotes the crush pressure.
Mathematical correlation of the data from the population of coupons tested showed that thepressure/crush curve for a honeycomb stock can be represented by one equation wherein thecrush pressure, pc, is the sole variable. This commonality in the deformation characteristic ofthe AL-STAR honeycomb materials of different crush strength is extremely helpful insimplifying the dynamic model for the impact limiter.
ii. AL-STAR Force-Crush Relationship: The AL-STAR impact limiter is a radially symmetricstructure whose external and internal diameters are fixed: the I.D. is set by the overpackdiameter at its extremities and the O.D. is limited by rail transport considerations to 128".Within this annular space, the arrangement of the aluminum honeycomb material is specifiedso that the impact limiter can absorb the kinetic energy from a 30' drop event in anyorientation. The axial dimension of the impact limiter is also limited by considerations of theoverall weight of the packaging. To design the impact limiter within the above-mentionedconstraints called for a method to predict the force required to crush the impact limiter by agiven amount in any given orientation. The mathematical model to define the force-crush (F-d) curve is described in Appendix 2.A. The F-d model was used to establish the nominalcrush strengths of the honeycomb sectors used in the various locations of the AL-STARhoneycomb volume to obtain the desired energy absorption characteristics in the equipment.
iii. Static Scale Model Tests: The static 1/8 scale model tests consisted of preparing 1/8 scalemodels of the AL-STAR impact limiter and subjecting them to static crush tests in variousorientations under normal and abnormal temperature conditions. One object of these testswas to confirm the validity of the theoretical F-d model. Confirming the structural adequacyof the AL-STAR backing structure (which is a thick carbon steel weldment) and the externalskin were also objectives of the scale model test. The 1/8 scale static tests, as described inAppendix 2.A, met all project goals: a weakness in the AL-STAR backing structure wasidentified and corrected in a redesign of the backing structure. The test data also showed thatHoltec's F-d model provided a reasonably accurate analytical tool to predict the staticcrushing behavior of AL-STAR in the various potential crushing orientations. The adequacyof the F-d model to predict static crush behavior was an essential prerequisite for thedynamic test correlation effort that followed.
NI-STAR SAR Proposed Rev. 13cREPORT HI-951251 2.7-2

iv. Dynamic Scale Model Tests: A 1/4 scale model of the HI-STAR 100 Package, including AL-STAR impact limiters, was used for drop testing. Appendix 2.A herein provides a completesynopsis of the AL-STAR impact limiter design development program, including the 1/4scale model drop tests which demonstrated the performance of the package. The objectivesof the drop tests may be stated as follows:
Select a sufficient number of drop orientations to ensure that under the worst-caseorientations, the structural adequacy of the package is demonstrated by testing.
ii. Prove that the peak rigid body decelerations experienced by the package in any of thetests is below the Table 2.1.10 design basis value.
iii. Demonstrate that the impact limiters prevent the cask from direct contact with theunyielding surface and remain attached through the end of the drop event.
Four drop configurations, namely, vertical (top end), horizontal (side), center-of-gravity-over-corner (CGOC), and slap-down (fully described in Appendix 2.A) were identified as acomplete set capable of realizing the aforementioned objectives. The tests were performed intwo distinct series as described below.
The first test series, conducted in August 1997, indicated the need to modify the honeycombmaterial crush strength utilized. The first dynamic test series also helped quantify thedynamic multiplier applicable to the statically determined honeycomb crush strength underimpact conditions.
The second test series showed that the peak deceleration in all four drop orientations testedmet the Table 2.1.10 limits. Despite meeting deceleration limits, the attachment boltsbetween the bottom impact limiter and the overpack failed in the side drop test. This requiredan additional design improvement to the bottom impact limiter-to-overpack attachmentdesign, and re-performance of the side drop test. For the final four tests used for evaluation.in Appendix 2.A, no attachment bolts sustained a failure.
v. AL-STAR Dynamic Response Model: The 1/4 scale tests provided valuable information onthe package response which was used to confirm the veracity of Holtec's dynamic simulationmodel developed for predicting the package response under the other drop conditions. Likeall orthotropic materials, the crushing of the honeycomb requires greater force under animpact load than the load necessary to achieve the same extent of crush under staticconditions. The conversion of the static "force (F) - crush (d)" model to dynamic conditionssimply means applying a dynamic factor to the formula. In other words, under dynamicconditions, the relation between crush force "F" and crush "d" is given as:
F = Z f (d)
where f(d) is the crush force corresponding to the compression "d" under static conditions
HI-STAR SAR Proposed Rev. 13cREPORT HI-951251 2.7-3

and Z is the dynamic multiplier function. The value of Z was quantified by the first series of1/4 scale dynamic scale model test, such that a dynamic response simulation model could bedeveloped that satisfied all equilibrium expectations.
In addition to comparing the predicted peak decelerations with the measured value, theduration of crushing and crush depth predicted by the dynamic model were also comparedwith the measured test data. The comparisons, presented in Appendix 2.A, confirm theability of the dynamic model to simulate the behavior of the package under a drop event.
vi. Sensitivity Studies: A significant result from the 1/4 scale model dynamic tests was acomplete validation of the dynamic model. For every test performed, the AL-STAR dynamicmodel was able to simulate the peak accelerations, total crush, and crush duration withreasonable agreement. The experimentally benchmarked mathematical model could now beused to simulate drop events for a variety of HI-STAR 100 package weights and honeycombcrush strengths. Results of the simulations to determine the effects of variations in aluminumhoneycomb crush strengths and package weights are presented in Appendix 2.A.
The results summarized in Table 2.A.5 of Appendix 2.A demonstrates that the maximum rigid bodydeceleration experienced by the HI-STAR 100 package equipped with the AL-STAR impact limiterwill be less than 60g's regardless of the orientation of impact. Therefore, in the balance of analysesperformed to evaluate the consequences of "free drop" under the provisions of 1OCFR71.73, thepackage will be assumed to be subject to a rigid body deceleration equal to 60 g's. It is clear frominspection of the geometry of the package that the most vulnerable direction of inertia loading forthe HI-STAR fuel basket is the transverse direction wherein the flat panels of the basket aresubjected to lateral inertia loading from the contained SNF. As mentioned earlier, the flexibility ofbasket panel acts to further amplify the package deceleration, which must be considered in theevaluation of results from the stress analysis model. In summary, the net result of the work effortdescribed in the foregoing and further elaborated in Appendix 2.A was to confirm the validity of 60gas the design basis rigid body deceleration for the 1OCFR71.73 drop event.
In Appendix 2.A, additional supporting technical information requested in Paragraph 2.7 of Reg.Guide 7.9 is provided. Information provided includes free-body diagrams, sketches, governingequations, test method for model testing, scaling factors, discussion of the law of similitude,measurements of crush, impact duration, deceleration histograms, effect of tolerances on packageresponse, and demonstration that the model test will give conservative results for peak g-force andmaximum deformation.
Additionally, Reg. Guide 7.9 calls for evaluation of the response of the package in terms of stressand strain to components and structural members, including investigation of structural stability aswell as the consequences of the combined effects of temperature gradients, pressure, and other loads.Part Two of the work effort, described in the following, fulfills the above Reg. Guide 7.9stipulations.
HI-STAR SAR Proposed Rev. 13cREPORT HI-951251 2.7-4

Part Two: Stress Analysis
The second part of the analysis is performed using the ANSYS finite element software [2.6.4]. TheMPC and overpack models used here are identical to those presented in Section 2.6. The loads areapplied to the models in accordance with the load combinations defined in Table 2.1.6 (Load CasesF3), Table 2.1.7 (Load Cases E3), and Table 2.1.9 (Load Cases 1-16) for hypothetical accidentconditions of transport. The detailed application of each load case is described in the subsections thatfollow. The presentation and content follows the formatting requirements of Regulatory Guide 7.9.The results from conditions of "Heat" and "Cold" are considered together in the followingpresentation.
The analysis of the different hypothetical accident conditions of transport are carried out usinggeneral finite element models of the MPC and the overpack as well as calculations based onsimplified models amenable to strength of materials solutions. The analyses using strength ofmaterials solutions focus on specific loading conditions applied to component parts of the MPCand/or the overpack. The finite element analysis of the overpack involves a complex 3-D model ofthe overpack to which a series of loads are applied. The results from the solutions are thencombined in a post-processing phase to make up the different accident load combination. Given thecomplexity of the overpack finite element analysis model, some discussion of the stress report ispresented to facilitate an understanding of the conclusions. For each of the load combinations, thefollowing components are identified for reporting purposes:
1. Seal2. Bolts3. Lid4. Inner Shell (including the top flange)5. Intermediate Shells6. Baseplate7. Enclosure
The postprocessor collects the nodal stresses from the finite element solution, for each of thecomponents in turn, and reports the principal stresses and the stress intensity at selected locationswhere physical reasoning suggests that high stresses may occur under the different postulated loadcombinations. In order to identify the minimum safety factor for each of the above components afterthe load cases are combined, the collection of nodes is sorted by stress intensity magnitude indescending order. Therefore, since the hypothetical accident condition load combinations involve acomparison of primary stress intensities, a minimum safety factor for each of the definedcomponents in the model may be identified as occurring at the node point with the largest calculatedstress intensity. Safety factors are computed using the allowable stress intensities for the material atthe reference temperature identified for the component and reported under one of the seven groupsidentified above. The post-processor collects, sorts, and reports the necessary information to enabledocumentation of the satisfaction of the applicable requirements. The following items are collectedand evaluated for each load combination:
HI-STAR SAR Proposed Rev. 13cREPORT HI-951251 2.7-5

Seals: The normal force in each of the springs representing the seal is reported and shown to remainin compression under the load. Maintaining a compressive load in the seal springs assures that thereis no separation at the component interfaces.
Bolts: The bolts are initially preloaded by applying an initial strain sufficient to result in the desiredpre-stress. Subsequent to the application of the different loads to form a specified load combination,the bolts are shown not to unload.
Lid: For each load combination, the lid primary membrane plus primary bending stress intensitiesare compared to the allowable values at the designated reference temperature.
Inner Shell: Primary membrane and primary membrane plus bending stress intensity distributionsare examined and compared to allowable stress intensity values
Intermediate Shells: The five intermediate shells are .examined at stress location points andcompared to allowable stress intensities at the appropriate reference temperature. Since accidentconditions of transport represent a Level D condition (where the comparison of calculated value vs.allowable value is always based on stress intensity), there is no differentiation between intermediateshells considered as Class I or Class 3 components.
Baseplate: Primary membrane plus bending stress intensities are compared to allowable values atthe component reference temperature.
Enclosure: The plate and shell elements making up the enclosure for the Holtite-A material arecompared to primary membrane stress intensity allowable values.
In the finite element analysis of all load combinations associated with hypothetical accident events,the initial preload case of the bolts and the internal pressure case are included in the finalcombination. Since no secondary stresses need be evaluated per the ASME Code requirements for anaccident level event, the thermal stress load case for the "Heat" condition is not included as aspecific load case. However, the allowable stress intensities used for the safety factor evaluation areobtained at the appropriate "Heat" condition reference temperature. In the reporting of safety factors,the variation in allowable stress intensity with temperature is ignored; this introduces an additionalmeasure of conservatism in the reported safety factors since the reference temperatures (Table2.1.21) are higher than the actual calculated temperatures. For the "Cold" condition, there are notemperature gradients developed. The interaction stresses developed to maintain compatibility underthe uniform ambient temperature change are included in the analysis and are treated as primarystresses in the evaluation of the safety factor.
HI-STAR SAR Proposed Rev. 13cREPORT HI-951251 2.7-6
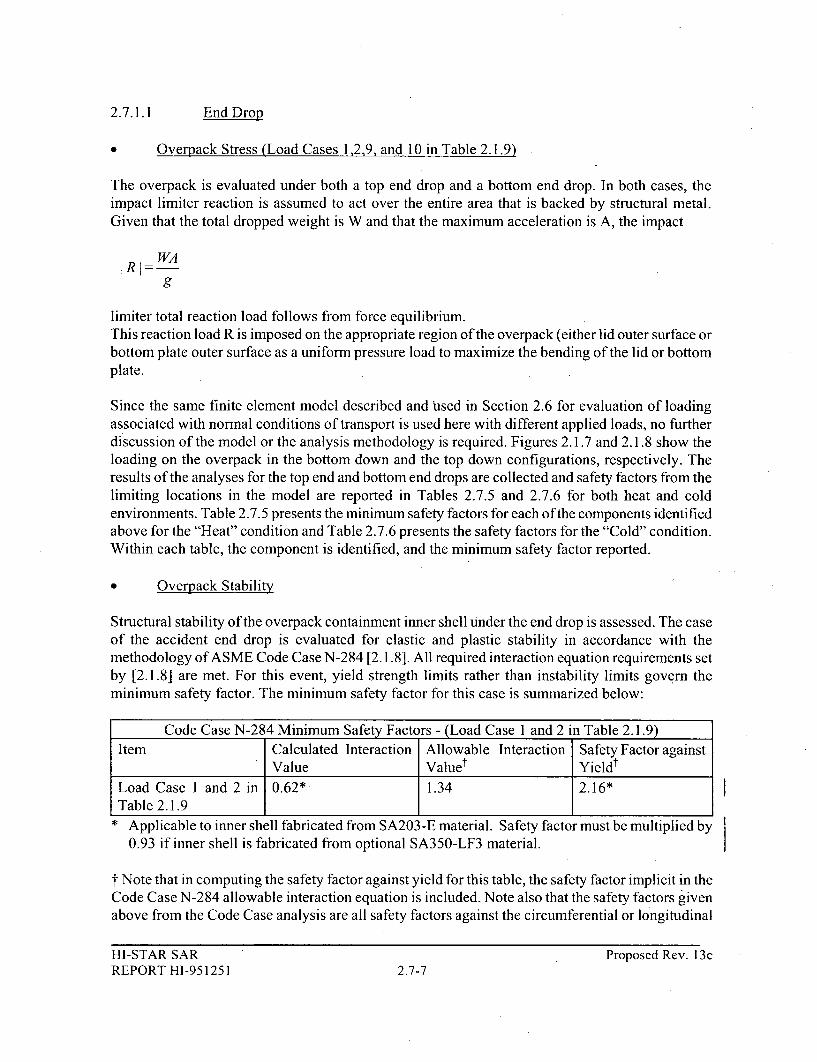
2.7.1.1 End Drop
* Overpack Stress (Load Cases 1,2,9, and 10 in Table 2.1.9)
The overpack is evaluated under both a top end drop and a bottom end drop. In both cases, theimpact limiter reaction is assumed to act over the entire area that is backed by structural metal.Given that the total dropped weight is W and that the maximum acceleration is A, the impact
SR WAg
limiter total reaction load follows from force equilibrium.This reaction load R is imposed on the appropriate region of the overpack (either lid outer surface orbottom plate outer surface as a uniform pressure load to maximize the bending of the lid or bottomplate.
Since the same finite element model described and trsed in Section 2.6 for evaluation of loadingassociated with normal conditions of transport is used here with different applied loads, no furtherdiscussion of the model or the analysis methodology is required. Figures 2.1.7 and 2.1.8 show theloading on the overpack in the bottom down and the top down configurations, respectively. Theresults of the analyses for the top end and bottom end drops are collected and safety factors from thelimiting locations in the model are reported in Tables 2.7.5 and 2.7.6 for both heat and coldenvironments. Table 2.7.5 presents the minimum safety factors for each of the components identifiedabove for the "Heat" condition and Table 2.7.6 presents the safety factors for the "Cold" condition.Within each table, the component is identified, and the minimum safety factor reported.
* Overpack Stability
Structural stability of the overpack containment inner shell Under the end drop is assessed. The caseof the accident end drop is evaluated for elastic and plastic stability in accordance with themethodology of ASME Code Case N-284 [2.1.8]. All required interaction equation requirements setby [2.1.8] are met. For this event, yield strength limits rather than instability limits govern theminimum safety factor. The minimum safety factor for this case is summarized below:
Code Case N-284 Minimum Safety Factors - (Load Case I and 2 in Table 2.1.9)Item Calculated Interaction Allowable Interaction Safety Factor against
Value Valuet YieldtLoad Case 1 and 2 in 0.62* 1.34 2.16*Table 2.1.9
* Applicable to inner shell fabricated from SA203-E material. Safety factor must be multiplied by
0.93 if inner shell is fabricated from optional SA350-LF3 material.
t Note that in computing the safety factor against yield for this table, the safety factor implicit in theCode Case N-284 allowable interaction equation is included. Note also that the safety factors givenabove from the Code Case analysis are all safety factors against the circumferential or longitudinal
HI-STAR SAR Proposed Rev. 13cREPORT HI-951251 2.7-7

stresses reaching the material yield stress. The actual safety factors against instability are larger thanthe factors reported in the table. In other words, yield strength rather than stability is the limitingcondition. Finally, note that fabrication stresses have been included in the stability calculations eventhough these stresses are self-limiting. Therefore, all results corresponding to the calculated stabilityinteraction equations are very conservative.
The result for the heat environment bound the similar result for the cold environment since yieldstrengths and elastic modulus are higher. Therefore, no analysis is performed for stability under coldconditions.
Closure Bolt Analysis
Stresses are developed in the closure bolts due to pre-load, pressure loads, temperature loads, andaccident loads. Closure bolts are explored in detail in Reference [2.6.3], which.deals with theanalysis of shipping casks. The analysis of the overpack closure bolts under normal conditions oftransport has been reported in Section 2.6. This subsection presents the results for the analysis forthe hypothetical accident end drop. The analysis follows the procedures defined in Reference [2.6.3].The allowable stresses used for the closure bolts follows that reference. Note that the analysesprovide alternative confirmation of the results from the finite element analysis; namely, under any ofthe identified load combinations, the bolts do not unload.
The following combined load case is for the hypothetical top end drop accident condition oftransport. This drop conservatively assumes a nearly vertical orientation with the impact limiterreaction load applied at the outermost location of the lid. This results in the closure bolts resistingthe inertial load from the MPC plus contents in addition to the inertia load from the closure lid itself.In reality, the load from the MPC would not load the bolts.
Top End Drop: Pressure, temperature, and pre-load loads are included.
Reference [2.6.3] reports safety factors defined as the calculated stress divided by the allowablestress for the load combination. This definition of safety factor is the inverse of the definitionconsistently used in this SAR. In summarizing the closure bolt analyses, results are reported usingthe safety factor definition of allowable stress divided by calculated stress. The following result forclosure lid bolting for the top end drop hypothetical accident condition of transport is obtained.
Overpack Closure Bolt - Safety Factor (Load Case 2 in Table 2.1.9)Combined Load Case Safety Factor on
Bolt Tension
Average Tensile Stress 1.30
It is seen from the above table that the safety factor is greater than 1.0 as required. Note that theaverage tensile stress reflects the preload stress required for successful performance of the bolts aswell as the applied load from the hypothetical accident drop event.
HI-STAR SAR Proposed Rev. 13cREPORT HI-951251 2.7-8

0 MPC Fuel Basket Stability and Stress (Load Case F3.a in Table 2.1.6)
Under top or bottom end drop in a hypothetical accident condition of transport, the MPC is subjectto its own amplified self-weight, causing compressive longitudinal stress in the fuel basket cellwalls. The following analysis demonstrates that stability or yield is not a credible safety concern inthe fuel basket walls under a hypothetical end drop accident condition of transport.
MPC Fuel Basket Stability
Stability of the basket panels, under longitudinal deceleration loading (Load Cases F3.a in Table2.1.6), is demonstrated in the following manner. Table 2.2.1 provides the weight of each fuel basket(including sheathing and neutron absorber panels). The corresponding metal areas of the basketbearing on the MPC baseplate or top lid can be computed for each MPC basket by direct calculationfrom the appropriate drawings. Dividing weight by bearing area and multiplying by the design basisdeceleration for the hypothetical accident from Table 2.1.10 gives the axial stress in the load bearingwalls. The results for each basket are compared and the bounding result (maximum weight/area)reported below:
Fuel Basket Compressive Stress For End Drop (Load Case F3.a)
Item Weight (lb.) Bearing Area (sq. inch) Stress (psi)Bounding Basket (at 23,535 346.61 4,07460g's deceleration)
To demonstrate that elastic instability in the basket panels is not credible, the flat panel bucklingstress, ncr, (critical stress level at which elastic buckling may occur) is computed using the formulain reference [2.6.1].
For conservatism, the MPC fuel basket is modeled as a rectangular plate simply supported along twosides and uniformly compressed in the parallel direction. The width of the plate is equal to themaximum unsupported width of a panel from all fuel basket types. Reference [2.6.1 ] provides thecritical stress formula for these conditions as
2.3 TC E ( Tj2acr 12(1l-V 2 )W
where T is the panel thickness and W is the width of the panel, E is the Young's Modulus at themetal temperature and v is the metal Poisson's Ratio. The following table summarizes thecalculation for the critical buckling stress using the formula given above:
HI-STAR SAR Proposed Rev. 13cREPORT HI-951251 2.7-9
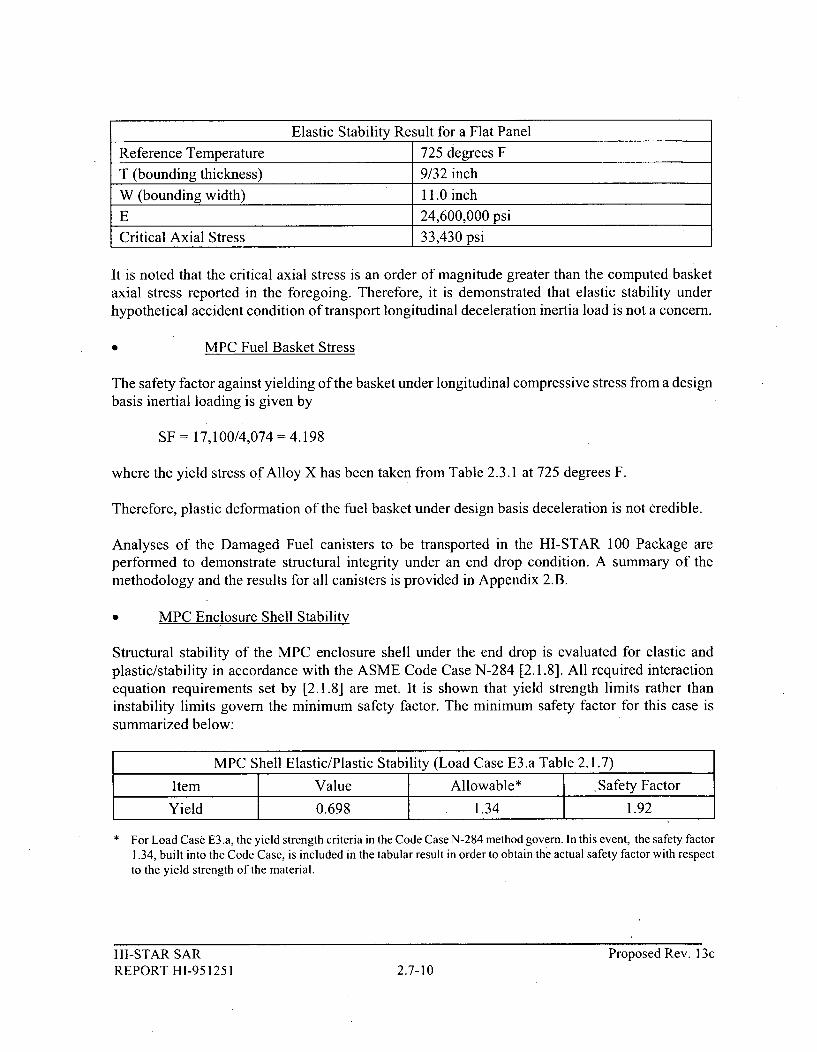
Elastic Stability Result for a Flat Panel
Reference Temperature 725 degrees F
T (bounding thickness) 9/32 inch
W (bounding width) 11.0 inch
E 24,600,000 psi
Critical Axial Stress 33,430 psi
It is noted that the critical axial stress is an order of magnitude greater than the computed basketaxial stress reported in the foregoing. Therefore, it is demonstrated that elastic stability underhypothetical accident condition of transport longitudinal deceleration inertia load is not a concern.
0 MPC Fuel Basket Stress
The safety factor against yielding of the basket under longitudinal compressive stress from a designbasis inertial loading is given by
SF = 17,100/4,074 = 4.198
where the yield stress of Alloy X has been taken from Table 2.3.1 at 725 degrees F.
Therefore, plastic deformation of the fuel basket under design basis deceleration is not credible.
Analyses of the Damaged Fuel canisters to be transported in the HI-STAR 100 Package areperformed to demonstrate structural integrity under an end drop condition. A summary of themethodology and the results for all canisters is provided in Appendix 2.B.
0 MPC Enclosure Shell Stability
Structural stability of the MPC enclosure shell under the end drop is evaluated for elastic andplastic/stability in accordance with the ASME Code Case N-284 [2.1.8]. All required interactionequation requirements set by [2.1.8] are met. It is shown that yield strength limits rather thaninstability limits govern the minimum safety factor. The minimum safety factor for this case issummarized below:
MPC Shell Elastic/Plastic Stability (Load Case E3.a Table 2.1.7)
Item Value Allowable* .Safety Factor
Yield 0.698 1.34 1.92
For Load Case E3.a, the yield strength criteria in the Code Case N-284 method govern. In this event, the safety factor
1.34, built into the Code Case, is included in the tabular result in order to obtain the actual safety factor with respectto the yield strength of the material.
HI-STAR SARREPORT HI-951251
Proposed Rev. 13c2.7-10
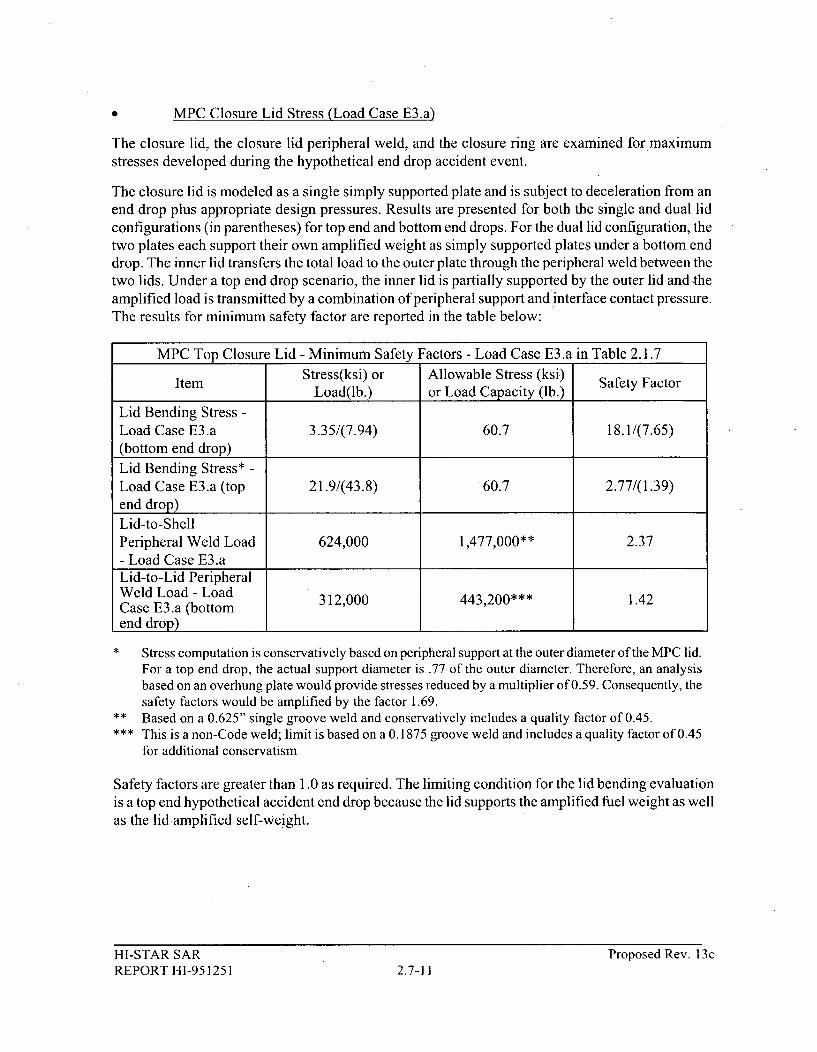
MPC Closure Lid Stress (Load Case E3.a)
The closure lid, the closure lid peripheral weld, and the closure ring are examined for maximumstresses developed during the hypothetical end drop accident event.
The closure lid is modeled as a single simply supported plate and is subject to deceleration from anend drop plus appropriate design pressures. Results are presented for both the single and dual lidconfigurations (in parentheses) for top end and bottom end drops. For the dual lid configuration, thetwo plates each support their own amplified weight as simply supported plates under a bottom enddrop. The inner lid transfers the total load to the outer plate through the peripheral weld between thetwo lids. Under a top end drop scenario, the inner lid is partially supported by the outer lid and theamplified load is transmitted by a combination of peripheral support and interface contact pressure.The results for minimum safety factor are reported in the table below:
MPC Top Closure Lid - Minimum Safety Factors - Load Case E3.a in Table 2.1.7Stress(ksi) or Allowable Stress (ksi)
Item Load(lb.) or Load Capacity (lb.) Safety FactorLid Bending Stress -Load Case E3.a 3.35/(7.94) 60.7 18.1/(7.65)(bottom end drop)
Lid Bending Stress* -Load Case E3.a (top 21.9/(43.8) 60.7 2.77/(1.39)end drop)Lid-to-ShellPeripheral Weld Load 624,000 1,477,000** 2.37- Load Case E3.aLid-to-Lid PeripheralWeld Load - LoadCe Loa (btom 312,000 443,200*** 1.42Case E3.a (bottomend drop)
* Stress computation is conservatively based on peripheral support at the outer diameter of the MPC lid.For a top end drop, the actual support diameter is .77 of the outer diameter. Therefore, an analysisbased on an overhung plate would provide stresses reduced by a multiplier of 0.59. Consequently, thesafety factors would be amplified by the factor 1.69.
** Based on a 0.625" single groove weld and conservatively includes a quality factor of 0.45.*** This is a non-Code weld; limit is based on a 0.1875 groove weld and includes a quality factor of 0.45
for additional conservatism
Safety factors are greater than 1.0 as required. The limiting condition for the lid bending evaluationis a top end hypothetical accident end drop because the lid supports the amplified fuel weight as wellas the lid -amplified self-weight.
HI-STAR SARREPORT HI-951251
Proposed Rev. 13c2.7-11

0 MPC Baseplate and Canister Stress (Load Case E3.a)
Load Case E3.a provides the limiting accident loading on the baseplate wherein the combined effectof a 60g deceleration plus external pressure is considered. The top end hypothetical accidentcondition is limiting in transport, and here it is conservatively assumed that accident externalpressure acts simultaneously, which exceeds the requirements of Table 2.1.7. The results aresummarized below:
MPC Baseplate Minimum Safety Factors - Load Cases E3, Table 2.1.7Item Value (ksi) Allowable (ksi) Safety Factor
Center of Baseplate -Primary Bending (Load 22.12 67.32 3.04Case E3)Shell Bending Stress at 67.32 2.14Connection to Baseplate
Note that all safety factors are greater than 1.0. Also, note that the calculated stress conservativelyincludes both primary and secondary self-limiting stress components. For the hypothetical transportdrop accident, the safety factor computed for the shell bending stress intensity need only considerthe effect of primary membrane plus bending stresses that are to be compared against the ultimatestress at temperature for this ASME Code Service Level D event. Since secondary stresses havebeen included in the evaluation, the reported result for safety factor is conservatively low.
0 Trojan MPC Spacer
The Trojan MPC-24E/EF enclosure vessel is 9 inches shorter in length than the generic MPC-24E/EF enclosure vessel. Thus, when the Trojan MPC-24E/EF is transported inside the HI-STAR100, the axial clearance between the MPC lid and the HI-STAR 100 closure plate is greater than 10inches. In order to prevent the Trojan MPC from thrusting forward and impacting the closure plateduring a top-end drop or a tip-over event (i.e., slapdown), a spacer device is positioned on top of theMPC lid. The Trojan MPC spacer, depicted in Figure 1.1.5, is fabricated from SA240-304 stainlesssteel in the shape of a circular I-beam. The web of the spacer measures 1-inch thick and has a meandiameter of 60 inches. The total height of the MPC spacer is 9 inches.
During a top end drop, the MPC spacer must support the amplified weight of a fully loaded TrojanMPC-24E/EF. Based on a bounding MPC weight of 90,000 lb (Table 2.2.4) and a boundingdeceleration of 60g (Table 2.1.10), the maximum compressive stress in the web is computed asfollows.
Cross-sectional area of web (A) = n x D x t = n (60) (1) 188.5 in2
Amplified weight of MPC (P) = G x W = (60) (90,000) = 5.4 x 10⁶ lb
Compressive stress in web = P/A = (5.4 x 10⁶)/ 188.5 = 28,647 psi
HI-STAR SAR Proposed Rev. 13cREPORT H1-951251 2.7-12

From Table 2.1.18, the primary membrane stress intensity limit for Alloy X (of which SA240-304 isa member) under Level D conditions is 44.9 ksi at 400'F. Therefore, the safety factor againstcompressive failure of the Trojan MPC spacer, per ASME Code Subsection NB stress limits, is
SF = 44,900 / 28,647 = 1.56
2.7.1.2 Side Drop (Load Cases F3 in Table 2.1.6, E3 in Table 2.1.7, and 3 and 11 in Table 2.1.9)
MPC Fuel Basket and Canister Finite Element Analysis (Load Cases E3.b, E3.c inTable 2.1.7 and Load Cases F3.b, F3.c in Table 2.1.6)
The MPC configurations are assessed for a hypothetical accident condition of transport side drop.All fuel cells are loaded with design basis spent nuclear fuel (SNF). Evaluations are performed forthe 0 degree and the 45 degree circumferential orientations of the fuel basket as defined in Figures2.1.3 and 2.1.4 and are obtained using the finite element model described in Section 2.6.
The results for each MPC configuration for the two different drop orientations are evaluated for eachappropriate load case listed in Tables 2.1.6 and 2.1.7. Analyses are performed only for the hotambient temperature condition since this is the bounding case for the MPC; as noted in Section 2.6,allowable stresses are lower for the "heat" environmental condition.
* Elastic/Plastic Stability of the MPC Fuel Basket
Following the provisions of Appendix F of the ASME Code [2.1.12] for stability analysis ofSubsection NG structures, (F1331.5(a)(1)), a comprehensive buckling analysis is performed usingANSYS. For this analysis, ANSYS's large deformation capabilities are used. This feature allowsANSYS to account for large nodal rotations in the fuel basket, which are characteristic of columnbuckling. The large deflection option is "turned on" so that equilibrium equations for each loadincrement are computed based on the current deformed shape. The interaction between compressiveand lateral loading, caused by the deformation, is included in a rigorous manner. Subsequent to thelarge deformation analysis, the basket panel that is most susceptible to buckling failure is identifiedby a review of the results. The lateral displacement of a node located at the mid-span of the panel ismeasured for the range of impact decelerations. The buckling or collapse load is defined as theimpact deceleration for which a slight increase in its magnitude results in a disproportionate increasein the lateral displacement.
The stability requirement for the MPC fuel basket under lateral loading is satisfied if two-thirds ofthe collapse deceleration load is greater than the design basis horizontal acceleration (Table 2.1.10).Figures 2.7.1, through 2.7.6 are plots of lateral displacement versus impact deceleration forrepresentative fuel baskets. It should be noted that the displacements in Figures 2.7.1, 2.7.2, 2.73,2.74, and 2.7.5 are expressed in lxl 10- inch and Figure 2.7.6 is expressed in lxl0-2 inch. The plotsclearly show that the large deflection collapse load of the MPC fuel basket is greater than 1.5 timesthe inertia load corresponding to the design basis deceleration for all baskets in all orientations.Thus, the requirements of Appendix F are met for lateral deceleration loading under Subsection NGstress limits for faulted conditions. Therefore, it is concluded that stability of the spent fuel basketcell walls is assured under the hypothetical accident side drop (from 30') condition of transport.
HI-STAR SAR Proposed Rev. 13cREPORT HI-951251 2.7-13

An alternative solution for the stability of the fuel basket panel is obtained using the methodologyespoused in NUREG/CR-6322 [2.7.3]. In particular, the fuel basket panels are considered as wideplates in accordance with Section 5 ofNUREG/CR-6322. Eq.(19) in that section is utilized with the"K" factor set to the value appropriate to a clamped panel. Material properties are selectedcorresponding to a metal temperature of 500 degrees F which bounds computed metal temperaturesat the periphery of the basket. The critical buckling stress is:
acrK2 2 i E 2 ()
where h is the panel thickness, a is the unsupported panel length, E is the Young's Modulus of AlloyX at 500 degrees F (Table 2.3.1), v is Poisson's Ratio, and K=0.65 (per Figure 6 of NUREG/CR-6322).
Parameters appropriate to a MPC-24E basket are used; the following table shows the results from thefinite element stress analysis and from the stability calculation.
Panel Buckling Results From NUREG/CR-6322
Item Finite Element Stress (ksi) Critical Buckling Stress (ksi) Factor of SafetyStress 13.339 49.826 3.74
For a stainless steel member under an accident condition load, the recommended safety factor is2.12. It is seen that the calculated safety factor exceeds this value; therefore, an independentconfirmation of the stability predictions of the large deflection analysis is obtained based onclassical plate stability analysis.
Overpack Stress Analysis (Load Cases 3 and II in Table 2.1.9)
The overpack is assumed to be subject to a 60g side drop in the manner of the load combinations ofTable 2.1.9 for both heat and cold environmental conditions as prescribed by Regulatory Guide 7.9.Reaction loads provided by the impact limiters are imposed as vertical pressures at each end of theoverpack on areas of the structure that serve as backing. The applied mechanical loading is internalpressure, inertia load from the MPC and inertia load from the overpack self-weight. Figure 2.1.9shows the assumed loading for this simulation. Figures 2.7.7, and Figures 2.7.11-2.7.13 are useful toaid in understanding the methodology used to apply the MPC loads and the balancing impact limiterreactions. Figure 2.7.7 shows a view of the overpack looking along the longitudinal axis for thegeneral case of an oblique drop. While the intent of the figure is to describe the reaction loads fromthe impact limiter under a general oblique drop orientation, only the features necessary to elaborateon the side drop reaction load are discussed here. A region defined by the angle 0 supports theapplied loading in a side drop.
HI-STAR SAR Proposed Rev. 13cREPORT HI-951251 2.7-14

This angle is 18 degrees for the side drop and is chosen based on two considerations. First, thepredictions from the theoretical model at the time of maximum "g" loading are examined and aprojected loaded area on the top forging and bottom plate estimated. Second, the post-dropevaluation of the tested impact limiters from the one-eighth scale static test and the one-quarter scaledynamic test were visually examined and provided insight into the extent of the loaded region of theoverpack at the impact limiter-hard surface interface. From these two evaluations, a conservativelylow angle estimate is made for the finite element analysis. Figure 2.7.12 shows the extent around theperiphery of the loading imposed by the MPC. From Section 2.6, the angle over which the MPC loadis applied to the inner shell of the overpack is 72 degrees from the vertical on each half of theoverpack. This angle is determined from the detailed analysis of the MPC enclosure shell and thefuel basket under 60g loading. The inertia load from overpack self-weight is applied by imposing anamplified value for the gravitational constant. Details of the finite element model have beendiscussed in Section 2.6. The results of the finite element analyses for load cases 3 and 11 in Table2.1.9, for the overpack, are post-processed as previously discussed; Tables 2.7.5 and 2.7.6summarize the results for each overpack component and identify the minimum safety factors.
2.7.1.3 Comer Drop
Figures 2.1.10 and 2.1.11 show the assumed loading for the bottom center of gravity over comer(CGOC) drop and the top CGOC drop, respectively. The impact limiter reaction load is applied as apressure loading acting on two surfaces. From the geometry of the cask, with impact limiters inplace, the angle of impact is 67.5 degrees from the horizontal plane. Although the theoretical andtested deceleration levels are below 60g's, the design basis 60g-deceleration load is used as the inputloading and applied vertically. Therefore, a 55g load is applied along the longitudinal axis of thecask, and a 23g load is applied perpendicular to the cask longitudinal axis.
The lateral inertia load from the MPC, amplified by the appropriate multiplier corresponding to23g's, is applied in the manner shown in Figures 2.7.11 and 2.7.12. The longitudinal component ofthe load from the MPC, amplified by 55g, is applied as a pressure over the inside surface of the lidas shown in Figure 2.7.8. In reality, the load would be applied over a narrow annulus near theoutside radius of the lid because of the raised "landing region". To maximize lid and bolt stress,however, the load is applied as a uniform pressure in the finite element model. The correspondinglateral and longitudinal loads from the overpack self-weight are applied by imposing amplifiedgravitational accelerations in the appropriate directions.
The loading from the impact limiter at the other end of the overpack, not involved in the impact, isapplied as a uniform pressure over the surface of the backed area at the other impact limiter. Figure2.7.10 shows the loading on the outside surface of the bottom plate that arises from the bottom endimpact limiter during simulation of a top end drop. The total bottom impact limiter weight isamplified by 55g's and applied as a pressure load. At the top end, where the impact limiter providesthe distributed crush force to balance the inertia forces, the balancing reaction loads from the impactlimiter are applied as a distributed side pressure loading and a distributed end surface pressure. Theextent of the loaded region for this drop orientation is defined by the angle 0 in Figure 2.7.7. For thiscase, the angle is approximately 68 degrees since a large "backed" area of the impact limiter isinvolved in resisting the crush. The angle is consistent with the predictions from the intersectiongeometry analysis used to develop the force-deformation data used in Appendix 2.A. That force-
HI-STAR SAR Proposed Rev. 13cREPORT HI-951251 2.7-15

crush model has been successfully used to predict maximum decelerations and extent of crush. Staticfinite element models require setting a fixed origin to insure satisfaction of all equilibrium equations.The center of gravity-over-corner orientation, in theory, provides automatic satisfaction of momentequilibrium so that all forces and moments at such a fixed origin location should be zero.
In this analysis and in the general oblique drop analysis, the fixed point is assumed at a location atthe end of the overpack not impacted. The results from the finite element simulation confirm that thecomputed reactions are negligibly small compared to the applied loads. The loads from internalpressure are self -balancing and do not alter the calculation of equilibrium reactions. Tables 2.7.5and 2.7.6 summarize the results from these analyses.
Results for the MPC and its internals have been discussed in Subsections 2.7.1.1 and 2.7.1.2 for theend and side drops, respectively, under the action of 60g deceleration and appropriate pressureloading. Under an oblique drop at an angle 0 with respect to the target plane (0 = 0 degrees equalsthe side drop), the MPC and its internals experience deceleration loads parallel and perpendicular tothe MPC longitudinal axis. Each of these deceleration components, however, is less than the 60gdesign basis deceleration used in the end and side drop analyses. For the pure end drop, all stressesin the fuel basket and in the MPC canister (enclosure vessel) are axial. For the pure side drop, theconservative analysis of a 2-D section of the fuel basket and enclosure vessel gives rise to stresses ina plane perpendicular to the longitudinal axis of the MPC/fuel basket.
The results for any oblique drop can be obtained by a linear combination of the results for pure enddrop and pure side drop. That is, the combined stress intensity is formed from the results of the twoindividual cases, after adjustment for the actual lateral and longitudinal "g" levels experienced bythe components.
The MPC lid and baseplate are thick plate components; as such, the stress intensities experienced inthe end drop orientation (which loads the lid and/or the baseplate in flexure) bound all other cases.Therefore, in what follows; only the enclosure vessel and the fuel basket need be considered. Foreach of these structures, the result "R0", at a general oblique drop angle 0, is expressed in terms ofthe result for an end drop "R90 " and the result obtained for a pure side drop "R0" as:
Re = R90D-9-- + R0. 60 ).60) 60j
where gE and gs are the axial and lateral decelerations imposed on the MPC canister and fuel basketduring the oblique drop at angle 0.
Since gE = 60 sin 0, and gs = 60 cos 0,
for a design basis oblique drop where the vertical deceleration is 60 g's, the result for the obliquedrop is always expressed in the form,
R0 = R 9o sin 0 + R0 cos 0
The following results are obtained for the end drop and side drop analyses:
HI-STAR SAR Proposed Rev. 13cREPORT HI-951251 2.7-16

End Drop:
Fuel Basket - maximum longitudinal membrane stress = 4,074 psi
Enclosure Vessel - maximum longitudinal compressive stress = 11,260 psi
The enclosure vessel result is obtained from the Code Case N-284 evaluation for a bottom end dropand conservatively bounds the result for a top end drop. The longitudinal compressive stress in theenclosure vessel includes the effect of external pressure.
Side Drop:
Stress intensity results for the fuel basket and enclosure vessel are summarized in Table 2.7.4. FromTable 2.7.4, for the pure side drop, the minimum safety factor for the fuel basket is 1.17 (primarymembrane plus primary bending). The corresponding minimum safety factor for the enclosurevessel is 2.64 (again, for primary membrane plus primary bending). The preceding results areobtained by surveying the summary of minimum safety factors in Table 2.7.4 for all MPC's and bothfuel basket orientations within the MPC.
For the pure side drop orientation, the stress intensities (SI) associated with the minimum safetyfactors are:
Fuel Basket SI = 47,060 psiEnclosure Vessel SI = 24,650 psi
The stress intensities at the most limiting location for the general oblique drop orientation are thencomputed as:
Fuel Basket SI = 4,074 sin 0 + 47,060 cos 0
Enclosure Vessel SI = 11,260 sin 0 + 24,650 cos 0
For the corner drop, 0 = 67.50 leading to the following final results:
C.G. OVER CORNER DROPMPC SAFETY FACTORS
Item Calculated S.I. Allowable S.I. Safety FactorFuel Basket 21,773 psi 55,450 psit 2.55Enclosure Vessel 19,836 psi 65,200 psi • 3.29
at 725°Ftt at 450'F
As expected, the safety factors obtained for the corner drop are larger than the corresponding valuesobtained for the side drop.
HI-STAR SAR Proposed Rev. 13cREPORT HI-951251 2.7-17

Results for general oblique drop angles are now considered for the overpack. In particular, a 30-degree oblique drop is deemed to be most representative of a scenario where only a primary impactis involved. The general formula utilized in the preceding for the specific case of center-of-gravity-over-corner can also be used for a 30-degree drop angle. The following results are reported for thefuel basket and enclosure vessel.
30 DEGREE OBLIQUE DROPMPC SAFETY FACTORS
Item Calculated Allowable Safety FactorS.I. (psi) S.I. (psi)
Fuel Basket 42,792 55,450' 1.30Enclosure Vessel 26,978 65,200" 2.42
t at 725°Fft at 450'F
2.7.1.3.1 MPC "F Class" Enclosure Vessel Lid-to-Shell Weld
The Holtec MPCs labeled with the suffix "F" (designated as "F Class" in this subsection) areintended to store non-intact fuel (defined as damaged fuel in the latest revision of ISG-1 and"failed fuel and fuel debris" in this SAR).
To be certified to store loose fuel debris, the MPC must fulfill the function of the "secondarycontainment" required by 1 OCFR71.63(b). To qualify as a "secondary containment", the MPCEnclosure Vessel must be able to withstand the accident condition loading without releasing itscontents. The accident condition mechanical loading for the secondary containment is identicalto those for the primary containment, namely the inertia forces produced by a 60g deceleration.From Table 2.1.7, the pressure loads applicable to the MPC Enclosure Vessel during ahypothetical vertical end drop (Load Case E3.a) are the normal condition pressures. Therefore,per Table 2.1.1, the maximum pressure differential that exists across the MPC shell when a dropoccurs is 60 psig. For conservatism, however, the accident condition internal pressure of 200psig is used to qualify the MPC Enclosure Vessel as a secondary containment. All candidatevulnerable locations in the MPC Enclosure Vessel must be analyzed to ensure that a thru-wallbreach in the pressure-retaining boundary does not occur under the loading combination definedabove. In the case of the primary containment (the HI-STAR 100 overpack), the location ofcontainment vulnerability is the cask lid-to-body forging bolted joint; the evaluation of the lid-to-body closure bolt has been analyzed to demonstrate containment integrity and the results ofthe evaluation summarized in Subsection 2.7.1.1 of the SAR. For the MPC "F Class", consideredas secondary containment, the corresponding locations of vulnerability are the two extremities ofthe Enclosure Vessel where the vessel shell is joined to flat (plate-like) members.
The top lid-to-shell joint, a J-groove (partial penetration) joint made at the plant after fuelloading, is one candidate location, as this weld cannot be volumetrically examined even thoughthe top lid is relatively thick. The MPC baseplate to the shell weld, on the other hand,.is a shop-fabricated and volumetrically examined junction. However, because the baseplate is thinner than
HI-STAR SAR Proposed Rev. 13cREPORT HI-951251 2.7-18

the top lid, it may experience greater flexural action under the accident condition mechanicalloading, resulting in somewhat greater junction region stresses. Therefore, the weld joints at bothextremities of the MPC Enclosure Vessel are denoted as candidate locations whose structuralintegrity under the load combination appropriate to the MPC's secondary containment functionmust be demonstrated.
a. Top lid-to-shell joint
For'MPCs with the "F" designation, this joint has been buttressed with a thick tapered shell anddeeper J-groove weld than that utilized in the standard MPC Enclosure Vessel. A Holtecproprietary position paper, DS-213, "Acceptable Flaw Size in MPC Lid-to-Shell Welds",submitted to the NRC in support of the original certification of HI-STAR 100 in 1999demonstrates that the largest postulated flaw in the most adverse orientation in the lid-to-shelljoint in the "F" canister will not propagate under the impulsive inertia loading arising from a 60gaxial deceleration of the MPC's contents.
An elastic stress analysis in the spirit of the ASME Code documented below likewise shows alarge margin of safety against joint failure. For conservatism, the following assumptions aremade.
i. The closure ring (the structural member present to provide a second welded barrieragainst leakage of the contents) is assumed to be absent.
ii. Even though a thru-wall failure of the joint is the appropriate failure criterion for thejoint, non-exceedance of the ASME Code Section III Subsection NB stress intensity limitsappropriate to Level D limits, which will occur at a much lower loading level, is set down as theacceptance limit. However, no weld efficiency factor is applied to the lid-to-shell weld since it isnot required by Subsection NB.
iii. The MPC model with the heaviest contents (MPC-32) is used in the analysis to bound theresults for all "Type F" MPC models.
The MPC top lid may be fabricated as a single thick circular plate, or may by fabricated as a duallid with the outer lid attached to the shell with the "J" groove weld, and the inner lid attached tothe outer lid around the common periphery. The dual lid configuration has been analyzed forboth Normal Conditions of Transport and Hypothetical Accident Conditions of Transport forMPC's carrying intact fuel; the results are documented in Subsection 2.6.1.3.1.2, and 2.7.1.1,respectively. The evaluation for the "F Class" MPC to provide secondary containment capabilityutilizes the same analytical model but introduces additional assumptions into the analysis todirect load to the lid-to-shell weld. In particular, a top end drop is postulated with the dual lidssubjected to a 60g deceleration loading from the fuel, fuel basket, and lid weight, together withthe accident internal pressure of the MPC. During a top end drop, the MPC cannot rotate relativeto the HI-STAR overpack because of close clearances between the vessel shell and the innersurface of the overpack cavity. Therefore, regardless of the angle of impact, the reaction loadfrom the HI-STAR to equilibrate the applied loads on the lid is uniformly distributed around thecircumference. A bounding condition for this analysis for secondary containment is presumed to
HI-STAR SAR Proposed Rev. 13cREPORT HI-951251 2.7-19

be a top end drop where the Enclosure Vessel shell is assumed to contact the support (the HI-STAR lid) before the Enclosure Vessel lid; with this conservative assumption, the peripheralweld is subject to the entire applied load. The key results from the analyses (the case of dual lidsbounds the analysis assuming a single thick lid) to support qualification of the MPC "F Class" assecondary containment are summarized in the table below:
KEY RESULTS FOR SECONDARY CONTAINMENT QUALIFICATION OF F CLASSMPC's - Load Case E3.a in Table 2.1.7 (Top End Drop)
Item Stress Intensity Allowable Stress Intensity @ 550 Safety(ksi) or Load (lb) Degrees F (ksi) or Load Capacity (lb) Factor
Structural LidBending Stress 46.05 60.7 1.32Intensity
Shield Plug Bending 46.65 60.7 1.30Stress Intensity
Lid-to-Shell Weld 5,268,000 6,627,000 1.26Load
Primary Local AxialMembrane Stress 24.53 40.45 1.65Intensity at ShellContact Interface
b. Baseplate-to-Shell Joint
Because the baseplate-to-shell connection is a volumetrically examined, full penetration joint,flaw propagation under the accident condition inertia loads is not a concern for this location. Asin the case of the top lid-to-shell junction, the baseplate-to-shell joint is established to besufficiently robust if the stress intensity limits under the above load combination (appropriate for§71.63(b)) are below their corresponding limits for level D condition for Section III Class I(NB) components. Since the baseplate-to-shell joint in the MPC "F Class" units is identical tothe joint in the MPC's used for intact fuel, no new analyses are required. The results ofevaluation of this joint are reported in Subsection 2.7.1.1 and demonstrate substantial safetyfactors.
The above analyses demonstrate that the Enclosure Vessel for "Type F" MPCs is capable ofserving as a "secondary containment" as required by §71.63(b).
2.7.1.4 Oblique Drops
HI-STAR SARREPORT HI-951251
Proposed Rev. 13c2.7-20
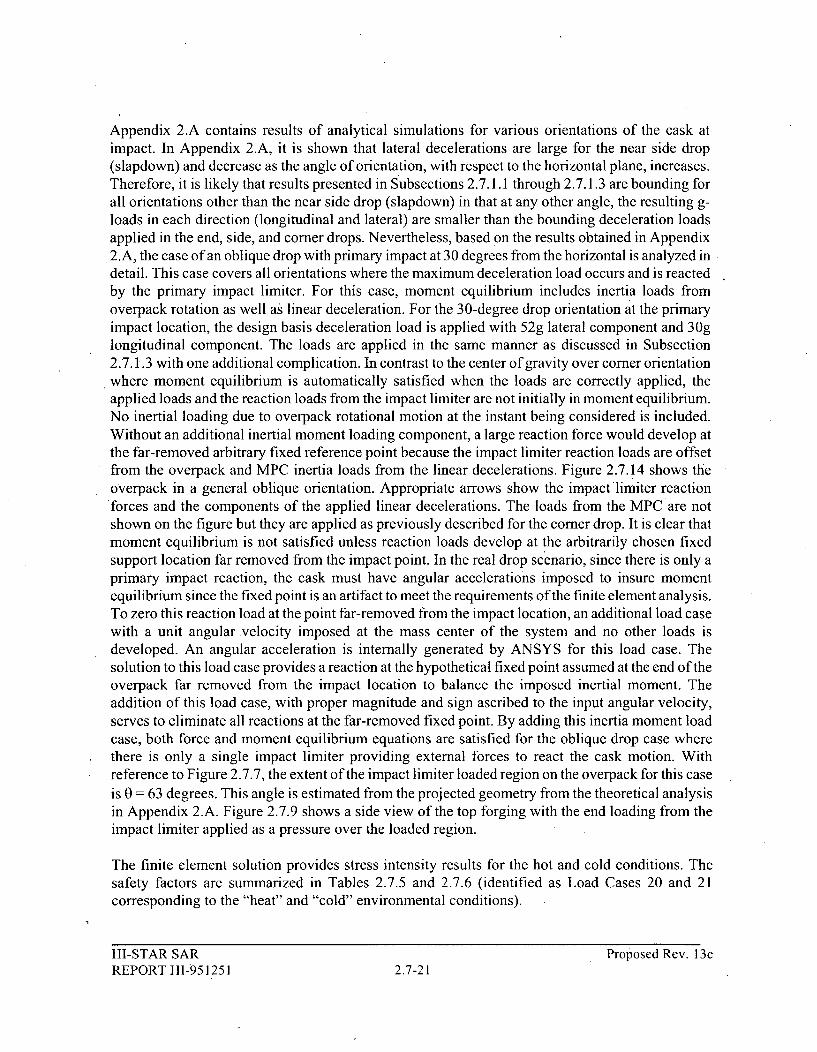
Appendix 2.A contains results of analytical simulations for various orientations of the cask atimpact. In Appendix 2.A, it is shown that lateral decelerations are large for the near side drop(slapdown) and decrease as the angle of orientation, with respect to the horizontal plane, increases.Therefore, it is likely that results presented in Subsections 2.7.1.1 through 2.7.1.3 are bounding forall orientations other than the near side drop (slapdown) in that at any other angle, the resulting g-loads in each direction (longitudinal and lateral) are smaller than the bounding deceleration loadsapplied in the end, side, and corner drops. Nevertheless, based on the results obtained in Appendix
.2.A, the case of an oblique drop with primary impact at 30 degrees from the horizontal is analyzed indetail. This case covers all orientations where the maximum deceleration load occurs and is reactedby the primary impact limiter. For this case, moment equilibrium includes inertia loads fromoverpack rotation as well as linear deceleration. For the 30-degree drop orientation at the primaryimpact location, the design basis deceleration load is applied with 52g lateral component and 30glongitudinal component. The loads are applied in the same manner as discussed in Subsection2.7.1.3 with one additional complication. In contrast to the center of gravity over comer orientationwhere moment equilibrium is automatically satisfied when the loads are correctly applied, theapplied loads and the reaction loads from the impact limiter are not initially in moment equilibrium.No inertial loading due to overpack rotational motion at the instant being considered is included.Without an additional inertial moment loading component, a large reaction force would develop atthe far-removed arbitrary fixed reference point because the impact limiter reaction loads are offsetfrom the overpack and MPC inertia loads from the linear decelerations. Figure 2.7.14 shows theoverpack in a general oblique orientation. Appropriate arrows show the impact limiter reactionforces and the components of the applied linear decelerations. The loads from the MPC are notshown on the figure but they are applied as previously described for the comer drop. It is clear thatmoment equilibrium is not satisfied unless reaction loads develop at the arbitrarily chosen fixedsupport location far removed from the impact point. In the real drop scenario, since there is only aprimary impact reaction, the cask must have angular accelerations imposed to insure momentequilibrium since the fixed point is an artifact to meet the requirements of the finite element analysis.To zero this reaction load at the point far-removed from the impact location, an additional load casewith a unit angular velocity imposed at the mass center of the system and no other loads isdeveloped. An angular acceleration is internally generated by ANSYS for this load case. Thesolution to this load case provides a reaction at the hypothetical fixed point assumed at the end of theoverpack far removed from the impact location to balance the imposed inertial moment. Theaddition of this load case, with proper magnitude and sign ascribed to the input angular velocity,serves to eliminate all reactions at the far-removed fixed point. By adding this inertia moment loadcase, both force and moment equilibrium equations are satisfied for the oblique drop case wherethere is only a single impact limiter providing external forces to react the cask motion. Withreference to Figure 2.7.7, the extent of the impact limiter loaded region on the overpack for this caseis 0 = 63 degrees. This angle is estimated from the projected geometry from the theoretical analysisin Appendix 2.A. Figure 2.7.9 shows a side view of the top forging with the end loading from theimpact limiter applied as a pressure over the loaded region.
The finite element solution provides stress intensity results for the hot and cold conditions. Thesafety factors are summarized in Tables 2.7.5 and 2.7.6 (identified as Load Cases 20 and 21corresponding to the "heat" and "cold" environmental conditions).
HI-STAR SAR Proposed Rev. 13cREPORT HI-951251 2.7-21

The near side drop with impact at the secondary impact limiter (slapdown) is a special case that alsomerits detailed analysis. For this case, the angle of the cask with the target is near zero degrees,similar to that used for the side drop analysis. The nature of the equilibrium equations is quitedifferent, however. For the side drop, Figure 2.7.17 shows that equilibrium is satisfied by impactlimiter reaction pressures at both impact locations. The reaction lateral pressure distribution at eachimpact limiter is distributed in the manner described by Figure 2.7.7. For the side drop evaluation,no introduction of a rotational component to the overpack is required to insure moment equilibrium.For the analysis of the near side drop secondary impact case, all of the reaction force required toinsure that force equilibrium is maintained under the inertia induced loads, is imposed at the locationof the secondary impact limiter. Figure 2.7.18 shows a side view of the overpack with the reactionload applied over a specified arc in the same manner as described by Figure 2.7.7. At the time ofpeak secondary impact deceleration, the theoretical analysis predicted minimal axial deceleration.Therefore, to perform the stress analysis using the finite element model, no axial deceleration isimposed. Referring to Figure 2.7.7, the angle 0 for this evaluation is chosen on the basis of observedexperimental results and theoretical prediction. The angle is related to the angle associated with theobserved crush depth of the impact limiter itself. For a near side drop, the outer diameter of theimpact limiter is known, and if the crush depth is observed, calculated, or measured, the angularextent of impact limiter crushed material is easily determined. The outer radius, "Ri" of the impactlimiter, and the observed and calculated crush depth (see results in Appendix 2.A for a full scaleimpact limiter), "d", are:
Ri = 64"; d = 15"
Therefore, the angle "T" (on either side of a vertical diameter through the impact limiter) that isassociated with the extent of loaded crushed surface of the impact limiter is obtained from simplegeometry as:
Cos(9p) = I -d/Ri
The angle over which the load is applied at the crushed surface of the impact limiter is calculated tobe:
T = 40 degrees (measured from the vertical, on both sides of the vertical centerline).
The angle of significant reaction loads on the interface surface of the top forging, is greater than thisangle. However, it is conservative to perform the finite element analysis of the "slapdown"secondary impact event, using the load angle
0 = (p = 40 degrees.
Note that this angle used for the "slapdown" evaluation is larger than the conservative value used toevaluate the side drop. This reflects the increased crush imparted to the impact limiter since the.entire amplified load is reacted at the top end. The load from the MPC is imposed on the appropriateinside surface of the inner shell as a uniform load in the same manner as for the side drop analysis.Moment equilibrium is provided by imposing the additional pure rotation on the overpack sufficientto generate opposite reaction forces that zero out the combined reactions at the "balance point" from
HI-STAR SAR Proposed Rev. 13cREPORT HI-951251 2.7-22

the applied inertia decelerations plus the pure rotation case. Because the MPC is constrained withinthe overpack, no departure from a uniform load transfer to the overpack is anticipated. Therefore, theenforcement of moment equilibrium for this condition is ensured solely by the determination of aproper balancing moment by determining an appropriate angular acceleration for the overpack. Thisassumption has little effect on the computation of the primary stress intensity distribution that resultsfrom the impact.
The results of the analysis are tabulated and combined with other load conditions, and the combinedload case is designated as "Load Case 22". Bolt preload, internal pressure, and the inertia loads arecombined to form this "slapdown" simulation. The top-end secondary impact analysis reportedherein bounds a similar analysis of the bottom end secondary impact case. Summary results forminimum safety factors are reported in Table 2.7.5 only for the "Heat" environmental condition asprevious results have demonstrated that this case produces the minimum safety factors. Only primarystress intensities are surveyed and reported in accordance with ASME requirements. Also evaluatedis the bolt stress, the net friction force, and the state of the seals and lands. From the post-processedresults, it is concluded that no bolts are overstressed, no portion of the seals suffer unloading, andthat there is sufficient frictional force to insure that the lid is maintained in position.
The preceding discussion focussed on the transport overpack analyses. The minimum safety factorsfor the MPC fuel basket and enclosure vessel, for arbitrary drop orientation, are obtained from thegeneral formulation in the preceding subsection 2.7.1.3. The angle that provides the maximumcombined stress intensity (S.I.) can be determined by classical means, and the minimum safety factorestablished. The results are summarized in the table below:
GENERAL OBLIQUE DROP ORIENTATIONMPC - SAFETY FACTORS
Drop Orientation Calculated AllowableItem Angle S.I. (psi) S.I. (psi) Safety Factor
(Degrees)Fuel Basket 4.54 47,208 55,450 1.17
Enclosure Vessel 24.55 27,100 65,200 2.41
2.7.1.5 Comparison with Allowable Stresses
Tables 2.7.4 through 2.7.8 summarize the limiting safety factor obtained for each hypothetical freedrop accident condition of transport defined by the requirements of Regulatory Guide 7.9. Inparticular, Table 2.7.4 is a summary of safety factors from the analyses of the MPC fuel basket andenclosure vessel, and Tables 2.7.5 and 2.7.6 report safety factors from the overpack analyses.Finally, Tables 2.7.7 and 2.7.8 contain safety factor summary results from miscellaneous evaluationsreported within the text. From these results, tables are constructed that summarize limiting safetyfactors for all of the hypothetical accident conditions of transport that are associated with dropevents. Tables 2.7.1 through Tables 2.7.3 present the overall summary of the most limiting safetyfactor for each of the components of interest for all hypothetical accident conditions of transport. Itis concluded from these tables that large factors of safety exist in the fuel basket, in the MPC shell,and in the various components of the overpack under all hypothetical accident conditions of
HI-STAR SAR Proposed Rev. 13cREPORT HI-951251 2.7-23

transport associated with free drop events.
It is noted that the overpack finite element results are developed using a 3-D model of the overpack.Even though symmetry conditions reduce the size of the model, there are over 8000 elements and11000 nodes.
The postulated accident conditions all tend to load localized regions of the overpack. As anillustration, consider Load Case 20, the 30-degree oblique top-end impact with the target. Thelimiting results for safety factors are reported in Table 2.7.5. Figures 2.7.15 and 2.7.16 show stressintensity distributions for the inner shell and for the assemblage of intermediate shells, respectively.As expected, the regions of highest stress intensity are naturally concentrated near the impactedregion.
2.7.2 Puncture
Overpack Structural Components
1 OCFR71 mandates that a puncture event be considered as a hypothetical accident condition. For thisevent, it is postulated that the package falls freely through a distance of 1 meter and impacts a 6 inchdiameter mild steel bar. The effects of the puncture drop are most severe when the steel bar isperpendicular to the impact surface. Therefore, all puncture analyses assume that the bar isperpendicular to the impact surface. It is assumed that the steel bar has a flow stress equal to 48,000psi, which is representative of mild steel. The maximum resisting force can then be calculated as
FR = Dx 48,000 psi = 1.357 x10⁶ lb4
where D equals the diameter of the steel bar.
IAp- FR gW
Since the maximum force applied to the cask is limited to the above value, the average decelerationof the cask canrbe computed assuming it to be rigid. The average deceleration of the cask (pluscontents) (weight = W) is determined as:
For a bounding (low) weight of 230,000 lb. (Table 2.2.1), for example, the rigid body averagedeceleration over the time duration of impact, is 5.9g.
Candidate locations for impact that have the potential to cause the most severe damage are near thecenter of the closure plate (top-end puncture), the center of the bottom plate (bottom puncture), andthe center height of the overpack shells (side puncture). In accordance with Regulatory Guide 7.9,local damage near the point of impact and the overall effect on the package must be assessed.
An estimate of local puncture resistance is obtained by using Nelms' equation [2.7.1] that is
HI-STAR SAR Proposed Rev. 13cREPORT HI-951251 2.7-24

generally applicable only for lead backed shells. Nevertheless, it is useful to obtain an indication asto whether a potential problem exists in the HI-STAR 100 System. The equation is applied using anultimate strength of 70,000 psi that is appropriate for the selected impact regions. Nelms' equationpredicts a minimum thickness of material necessary to preclude significant puncture damage. Forthe HI-STAR 100 System,
tm =2.65 inch
Inasmuch as the HI-STAR 100 overpack has substantially more material thickness in the baseplate,the closure plate, the top flange and the inner plus the initial intermediate shell, the overpack meetslocal puncture requirements as required by Nelms' equation.
The global effects of puncture are calculated using the overpack model described in Section 2.6,which is the same model that is used for the drop assessments. Figures 2.1.12 through 2.1.14 showfree body diagrams of the overpack for the side, top, and bottom puncture events, respectively. Ineach case, the nodes on the surface of the overpack that directly impact the steel bar are fixed in alldegrees of freedom. By then applying acceleration, Ap, a reaction force develops at those nodesequal in magnitude with FR. Tables 2.7.5 and 2.7.6 summarize the safety factors for the overpackcomponents obtained for the puncture acceleration computed above for both heat and coldenvironmental conditions. Note that for the stress intensities in the lid and baseplate, the higheststresses are exactly under the impact point. The results include the effect of the interface contactstress between the puncture pin and the plate surface. This local effect is not required to be includedin the stress intensity comparison with allowable values for the hypothetical accident. Therefore, inthe reporting of safety factors, the effect of local surface pressure is not included; rather, the radialand tangential stresses at the load point are used to form the stress intensity and set the lateralsurface stress to zero. Tables 2.7.5 and 2.7.6 specifically identify this item by a note. Figure 2.7.17shows the stress intensity distribution in the lid resulting from a top-end puncture analysis. Thelocalized nature of the stress intensity distribution is clearly evident. The reported safety factors inthe summary tables are adjusted to eliminate the effect of non-primary stress components.
* Closure Bolts
The methodology to analyze closure bolts is provided in reference [2.6.3] prepared for analysis ofshipping casks. The analysis of the overpack closure bolts under normal conditions of transport, inaccordance with the provisions of [2.6.3], has been reported in Section 2.6. In this subsection, thesimilar analysis for the hypothetical puncture accident is summarized. The analysis follows theprocedures defined in Reference [2.6.3] and uses the allowable stresses for the closure bolts in thatreference.
The following combined load case is analyzed for the hypothetical pin puncture accident conditionof transport.
Puncture: Pressure, temperature, and pre-load loads are included.
HI-STAR SAR Proposed Rev. 13cREPORT HI-951251 2.7-25

Reference [2.6.3] reports safety factors defined as the calculated stress combination divided by theallowable stress for the load combination. This definition of safety factor is the inverse of thedefinition consistently used in this SAR. In summarizing the closure bolt analysis, results arereported using the SAR safety factor definition of allowable 'stress divided by calculated stress. Thefollowing result for closure lid bolting for the top end drop hypothetical accident condition oftransport is obtained.
Overpack Closure Bolt - Safety Factor (Load Case 7 in Table 2.1.9)
Item Safety Factor on Bolt Tension
Average Tensile Stress in Bolt 1.86
2.7.3 Thermal
In this subsection, the structural consequences of the thirty-minute fire event are evaluated using themetal temperature data from Section 3.5 where a detailed analysis of the fire and post-fire conditionis presented. Specifically, it desired to establish that:
1. The metal temperature, averaged across any section of the containment boundary,remains below the maximum permissible temperature for the Level A condition inthe ASME Code for NB components. Strictly speaking, the fire event is a Level Dcondition for which Subsection NB of the ASME Code, Section III does notprescribe a specific metal temperature limit. The Level A limit is imposed herein forconvenience because it obviates the need for creep considerations to ascertain post-fire containment integrity.
2. The external skin of the overpack, directly exposed to the fire will not slump (i.e.,suffer rapid primary creep). This condition is readily ruled out for steel componentsif the metal temperature remains below 50% of the metal melting point.
3. Internal interferences among the constituents of the HI-STAR 100 System do notdevelop due to their differential thermal expansion during and after the fire transient.
4. Overpack closure bolts will not unload during a transport fire.
5. The helium retention boundary and the containment boundary both continue toperform their function as ASME "NB" pressure vessels.
2.7.3.1 Summary of Pressures and Temperatures
The following peak temperatures (per Tables 3.5.4 and 3.4.11) and pressures are used in Subsections2.7.3.2, 2.7.3.3, and 2.7.3.4.
Overpack closure plate/bolts 514 degrees F (post-fire)Overpack bottom plate 662 degrees F (post-fire)
HI-STAR SAR Proposed Rev. 13cREPORT HI-951251 2.7-26

Overpack outer closure 226 degrees F (initial pre-fire cold temperature);1348 degrees F (maximum)
Overpack containment shell 395 degrees F (MPC -Shell post-fire temp. - increment of 24degrees F (from data in Table 3.4.11))
MPC-Shell 419 degrees F (post-fire)Basket (center) 751 degrees F (post-fire)Basket (periphery) 478 degrees F (MPC-Shell post fire + 59 degrees F - (from
data in Table 3.4.11))
It should be noted that the overpack containment shell, closure plate, and bottom plate temperaturesare not specifically reported in Table 3.5.4. The temperatures listed above are based on the closesttemperature report location. The overpack containment shell temperature is the lowest temperaturethat occurs prior to the fire accident and is used for the differential thermal expansion analysis. Theoverpack containment shell temperature falls (post-fire) below the outside basket temperature andsubsequently lags the basket temperature by 24 degrees F. The 24 degree F lag is the same lag thatoccurs in the normal heat condition listed in Table 3.4.11 (i.e., 306 degrees F for the MPC outer shellsurface - 282 degrees F for the overpack inner surface). This will maximize the potential forinterference between the overpack and the MPC. Similarly, the temperature difference between theMPC shell and the fuel basket periphery will be essentially the same exists in the normal heatconditions of transport. Therefore, from Table 3.4.11, the basket peripheral temperature for the fireevent analyses is set as the MPC shell temperature plus the maximum difference (365-306) degreesF from the table.
Subsection 3.5.3 contains a discussion of the peak bulk temperatures occurring during and afterthefire transient. It is concluded in that section that:
1. The containment boundary protected by the intermediate shells remains below 500degrees F (SA-203-E material).
-2. The containment boundary that is within the confines of the impact limiters remainsbelow 700 degrees F (SA-350 LF3 material).
3. The portion of the containment boundary directly exposed to the fire may have localouter surface temperatures in excess of 700 degrees F, but the bulk metal temperatureof the material volume remains under 700 degrees F (SA-350 LF3 material).
The conclusions in Subsection 3.5.3 enable the statement that the containment boundary metal bulktemperatures remain at or below the upper limits permitted by the ASME Code. Therefore, stressevaluations that make comparisons to allowable stresses to demonstrate that the containmentboundary continues to perform as a viable pressure vessel use allowable stresses that are given in theASME Code (i.e., there is no extrapolation of allowable stresses beyond the recognized code limits).For the helium retention boundary stress calculations, however, allowable stresses for aconservatively high temperature (see Table 2.1.2 and 2.1.21) are used when pressure vessel codecompliance is demonstrated.
From Table 3.5.4 in Subsection 3.5.4 of Chapter 3, it is concluded that:
HI-STAR SAR Proposed Rev. 13cREPORT HI-951251 2.7-27

The maximum temperature of the ferritic steel material in the body of the HI-STAR 100overpack (the outer enclosure and the intermediate shells outside of the containmentboundary is well below 50% of the material melting point. (The melting point of carbon andlow alloy steels is approximately 2750 degrees F, per Mark's Standard Handbook, NinthEdition, pp 6-11.)
The shielding experiences temperatures above its stated limit for effectiveness. This meansthat a limited loss of shielding effectiveness may occur. The shielding analysis in Chapter 5(Subsection 5.1.2) recognizes this and conservatively assumes that all shielding is lost inpost-fire shielding analyses.
Pressures during the fire transient are bounded by the internal and the external design pressures foraccident conditions for the MPC shell as stated in Section 2.1. For internal pressure, Table 3.5.3supports this conclusion. The following calculation is presented to support the conclusion for MPCexternal pressure.
The overpack annulus initial fill pressure is 14 psig (max.) per the specification in Chapter 7. Theoverpack annulus lower bound fill temperature is 70 degrees F. The fire condition MPC shell peaktemperature is 419 degrees F per Table 3.5.4 and the use of this as the average gas temperature in theannulus is conservative.
Using the above data, the fire condition peak pressure in the annulus between the overpack and theMPC shell is calculated by using the ideal gas law with constant volume assumed in the gap as:
pfire= (14+14.7) x (419 + 460)/(70 + 460) = 47.6 psia = 32.9 psig.
2.7.3.2 Differential Thermal Expansion
The methodology for establishing that there will be no restraint of free thermal expansion has beenpresented in Subsection 2.6.1.2 for normal conditions of transport. The same methodology is appliedin this subsection to evaluate the potential for component interference during and after the postulatedhypothetical fire. For conservatism, use the temperatures in the overpack and the MPC temperaturesthat will maximize the potential for interference between the overpack and the MPC regardless of atwhat point in time the temperatures occurred. It is shown that there is no structural restraint of free-end expansion in the axial or radial directions under the most limiting temperature differencebetween the hot basket and the colder overpack/enclosure vessel. Thus, the ability to remove fuel bynormal means is not inhibited by structural constraint of free-end expansion. The table belowsummarizes the results obtained for the limiting MPC temperature distributions assumed.
THERMOELASTIC DISPLACEMENTS IN THE MPC ANDOVERPACK UNDER FIRE CONDITION
CANISTER - FUEL BASKETRadial Direction(in.) Axial Direction (in.)
Worst Case Unit Initial Clearance Final Gap Clearance Final Gap
Bounding MPC 0.1875 0.117 2.0 1.672
HI-STAR SAR Proposed Rev. 13cREPORT HI-951251 2.7-28
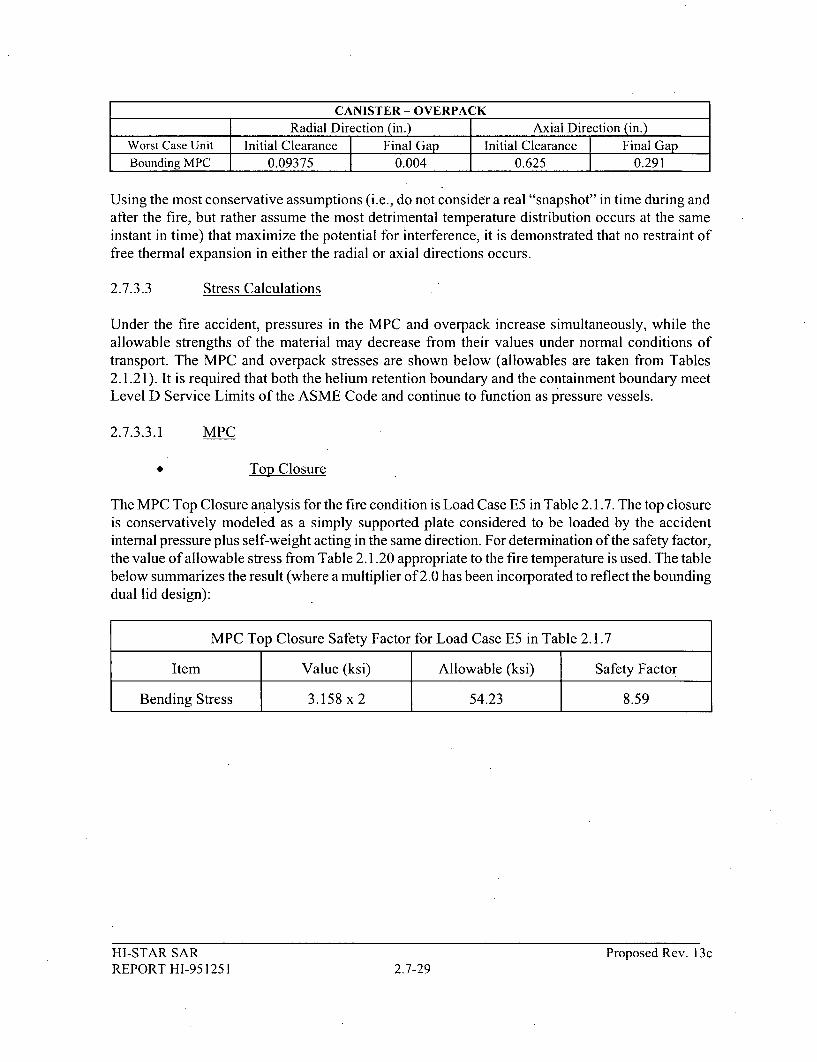
CANISTER - OVERPACK
Radial Direction (in.) Axial Direction (in.)Worst Case Unit Initial Clearance Final Gap Initial Clearance Final GapBounding MPC 0.09375 0.004 0.625 0.291
Using the most conservative assumptions (i.e., do not consider a real "snapshot" in time during andafter the fire, but rather assume the most detrimental temperature distribution occurs at the sameinstant in time) that maximize the potential for interference, it is demonstrated that no restraint offree thermal expansion in either the radial or axial directions occurs.
2.7.3.3 Stress Calculations
Under the fire accident, pressures in the MPC and overpack increase simultaneously, while theallowable strengths of the material may decrease from their values under normal conditions oftransport. The MPC and overpack stresses are shown below (allowables are taken from Tables2.1.21). It is required that both the helium retention boundary and the containment boundary meetLevel D Service Limits of the ASME Code and continue to function as pressure vessels.
2.7.3.3.1
0
MPC
Top Closure
The MPC Top Closure analysis for the fire condition is Load Case E5 in Table 2.1.7. The top closureis conservatively modeled as a simply supported plate considered to be loaded by the accidentinternal pressure plus self-weight acting in the same direction. For determination of the safety factor,the value of allowable stress from Table 2.1.20 appropriate to the fire temperature is used. The tablebelow summarizes the result (where a multiplier of 2.0 has been incorporated to reflect the boundingdual lid design):
MPC Top Closure Safety Factor for Load Case E5 in Table 2.1.7
Item Value (ksi) Allowable (ksi) Safety Factor
Bending Stress 3.158 x 2 54.23 8.59
HI-STAR SARREPORT HI-951251
Proposed Rev. 13c2.7-29

Baseplate
Under the fire accident condition, the baseplate is subject to accident internal pressure (200 psi). Ifthe HI-STAR 100 is assumed to be in the vertical position, then the baseplate also may support theweight of the fuel basket and the fuel loading. If the HI-STAR 100 is assumed to be oriented in thehorizontal position, then the baseplate supports only internal pressure. For a conservative analysis, itis assumed that the internal pressure stress and the stress from basket weight and from fuel weightadd. This Load Case E5 is summarized below. The second row is the result that is obtained if thebasket and fuel weight is neglected.
MPC Baseplate Safety Factor under Hypothetical Fire Accident
Item Value (ksi) Allowable (ksi) Safety Factor
Baseplate BendingStress (Including 46.32 54.23 1.17Basket and FuelWeight)
Baseplate BendingStress (Neglecting 42.28 54.23 1.28Basket, Fuel, andSelf Weight)
0 Shell
The MPC shell is examined for elastic/plastic stability under the fire accident external pressure usingthe ASME Code Case N-284 analysis method. The result from the stability analysis for Load CaseE5 in Table 2.1.7 is summarized below:
MPC Canister Safety Factor - Stability under External Accident Pressure
Item Calculated AllowableInteraction Factor Interaction Factor Safety Factor
Elastic Stability 0.845 1.00 1.18
The shell is also analyzed for stress under the accident internal pressure by using the Lame' solutionpreviously used in Section 2.6. The stress due to the internal accident pressure of 200 psi is (P =
pressure, r = MPC radius, t = shell thickness):
HI-STAR SARREPORT HI-951251
Proposed Rev. 13c2.7-30
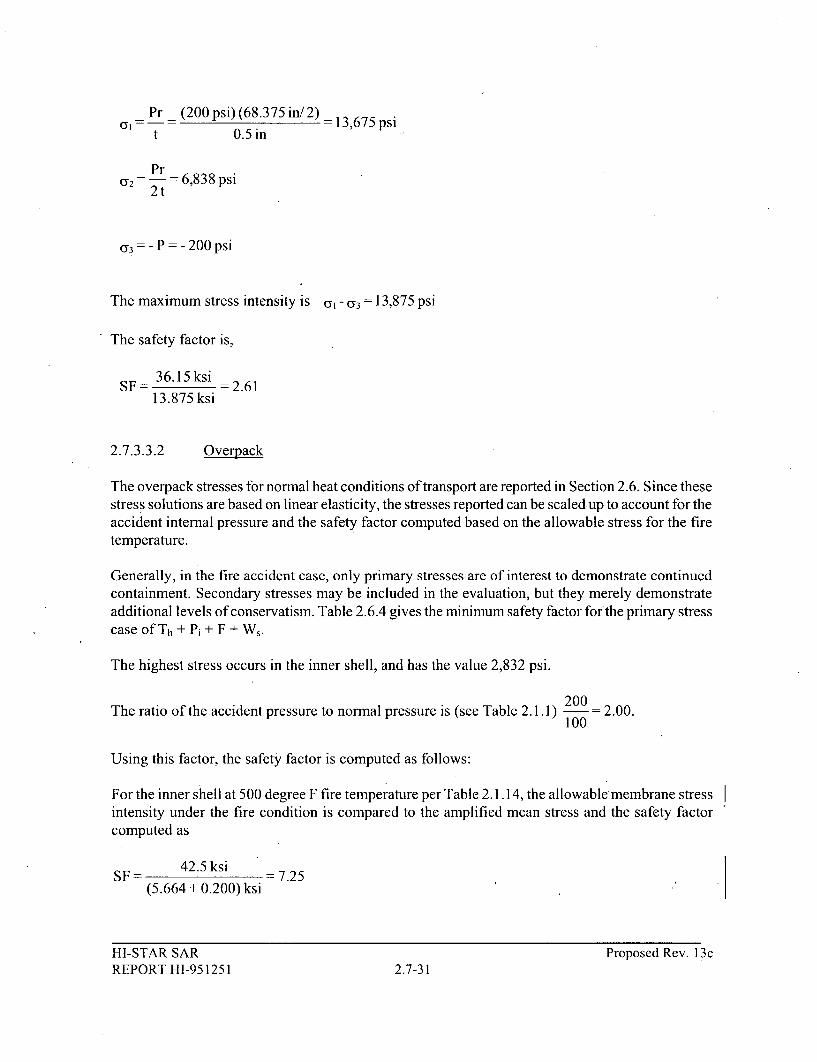
71 - Pr (200 psi) (68.375 in/ 2) 13,675 psit 0.5 in
Pr(72 - - 6,838 psi
2t
3 =-P =-200 psi
The maximum stress intensity is 1 - 3= 13,875 psi
The safety factor is,
36.15 ks iSF= - 2.61
13.875 ksi
2.7.3.3.2 Overpack
The overpack stresses for normal heat conditions of transport are reported in Section 2.6. Since thesestress solutions are based on linear elasticity, the stresses reported can be scaledup to account for theaccident internal pressure and the safety factor computed based on the allowable stress for the firetemperature.
Generally, in the fire accident case, only primary stresses are of interest to demonstrate continuedcontainment. Secondary stresses may be included in the evaluation, but they merely demonstrateadditional levels of conservatism. Table 2.6.4 gives the minimum safety factor for the primary stresscase of Th + Pi + F + Ws.
The highest stress occurs in the inner shell, and has the value 2,832 psi.
'200The ratio of the accident pressure to normal pressure is (see Table 2.1.1) 200 2.00.100
Using this factor, the safety factor is computed as follows:
For the inner shell at 500 degree F fire temperature per Table 2.1.14, the allowable membrane stressintensity under the fire condition is compared to the amplified mean stress and the safety factorcomputed as
SF= 42.5 ks = 7.25(5.664 + 0.200) ksi
HI-STAR SAR Proposed Rev. 13cREPORT HI-951251 2.7-31

2.7.3.3.3 Closure Bolts
Under the fire transient, it is required to demonstrate that the stresses in the closure bolts do notexceed allowable limits and the bolted joint does not unload to the extent that the pressure boundaryis breached. To that end, an analysis of the fire condition is carried out with the purpose ofdetermining the bolt stresses under the applied loading. The methodology employed for this analysisis that presented in the report, "Stress Analysis for Closure Bolts for Shipping Casks" [2.6.3]. Theloadings applied are fire temperature, bolt preload, and accident internal pressure. The followingresult for closure lid bolting for the hypothetical fire accident is obtained.
Overpack Closure Bolt - Safety Factor (Load Case 19 in Table 2.1.9)
Combined Load Case Safety Factor onBolt Tension
Average Tensile Stress 1.69
The average bolt tensile stress under the conditions of pressure, preload, and thermal effectsappropriate to the hypothetical fire accident condition of transport is 8.5% greater than the averagebolt tensile stress computed under the normal heat condition of transport. Therefore, it is concludedthat there will be only minor unloading of the bolted joint and no breach of containment.
2.7.3.3.4 Bounding Thermal Stresses During the Fire Transient
Regulatory Guide 7.6, Section C.7 states that the extreme total stress intensity range between theinitial state and accident conditions should be less than twice the adjusted value of the alternatingstress intensity at 10 cycles given by the appropriate fatigue curves. It is demonstrated here thatunder very conservative assumptions on the calculation of thermal stresses, this regulatoryrequirement is met by the HI-STAR 100 System.
Under the fire transient, thermal gradients can lead to secondary or peak stresses due to localconstraint by adjacent material that is at a lower temperature. The ASME Code does not require thatsecondary stresses be held to any limit for Level D Service Conditions. Nevertheless, boundingcalculations are performed here to estimate the magnitude of the thermal stress. The most limitingsecondary stress intensity state arises by conservatively assuming complete restraint of material bysurrounding cooler material and has the solution:
[I =EaAT
where
E = Young's Modulus at temperaturecX = coefficient of linear thermal expansionAT = temperature change from 70 degrees F, the assumed assembly temperature
For the fuel basket, AT = 775 - 70 = 705 degrees F. The use of 775 degrees F is justified as follows:
HI-STAR SAR Proposed Rev. 13cREPORT HI-951251 2.7-32

The peak temperature of the fuel basket is 950 degrees F during the fire per Table 2.1.2. For aconservative estimate of the temperature between two adjacent points on the fuel basket, use thebounding hypothetical accident temperature limit for the enclosure vessel lid or baseplate from Table2.1.2 as representative of the change between two adjacent points on the fuel basket. Therefore, noextrapolation of data is required for the calculations to follow.
From the material property table for Alloy X,
E = 24.282 x 10⁶ psia = 9.853 X 10⁻⁶ inch/inch- degree F
Therefore,
CY = 24.282 x 9.853 x 705 = 168,672 psi
The conservative assumption is made that the maximum peak stress intensity due to mechanicalloading plus thermal constraint occur at the same point at the same instant in time and reaches thevalue of Su at room temperature. Thus, the total stress intensity range from assembly to thishypothetical conservative state is
SR = 168,672 + 75,000 = 243,672 psi
The alternating stress intensity range, after accounting for temperature effects of Young's Modulus,is
Sa = SR x Young's Modulus (70' F)2 Young's Modulus (775°F)
28.14=121,836 psi x2 8= 141,194 PSI24.282=11lpi
For the overpack, the most severely constrained material is at the bottom plate. Material propertiesfor this calculation are the values available at 700 degrees F and the peak temperature isconservatively set at 700 degrees F.
Young's Modulus = E = 24.9 x 10⁶ psi (at 700 degrees F)
Coefficient of linear thermal expansion = a = 7.52 x 10⁻⁶ inch/inch-degrees F (Estimated)
Therefore, the secondary stress intensity due to fully constrained thermal growth is
cy = 24.9 x 7.52 x (700-70) = 117,966 psi
HI-STAR SAR Proposed Rev. 13cREPORT HI-951251 2.7-33

Conservatively, assuming that the membrane plus primary bending stress intensity achieves theultimate strength at room temperature, at the same location in space and at the same instant in time,gives the total stress intensity range at this hypothetical location as
SR = 117,966 + 75,000 = 192,966 psi
The alternating stress intensity range, after accounting for temperature effects of Young's Modulus,is
192,966 28.14Sa - x =109,037 psi
2 24.9
These computed values for bounding alternating stress intensities are used in the next subsection forcomparisons with allowable values.
2.7.3.4 Comparison of Fire Accident Results with Allowable Stresses
Stress
The safety factors for the MPC and overpack during a fire are addressed in Section 2.7.3.3. Thelowest safety factors are 1.18 and 7.74 for the MPC and overpack, respectively.
Bounding Fire Transient
In accordance with Regulatory Position C.7 of the Regulatory Guide 7.6, Figure 1-9.2.1 of ASME,Section 111, Appendix I, gives the 10-cycle alternating stress intensity range as
SALT (Alloy X) = 700,000 psi
Using the calculated stress intensity range from Subsection 2.7.3.3, the safety factor for the MPCbasket is
SF - 700,000 = 4.96141,194
Figure 1-9.1 of ASME Section III, Appendix I is used for the overpack even though the temperatureis limited to below 700 degrees F. It is conservative to use this curve for this short time event sinceincreased temperatures will improve the material ductility. From that table, the 10-cycle alternatingstress intensity range is given as 400,000 psi. Therefore using the aforementioned calculated resultsfor stress intensity range from Subsection 2.7.3.3, the safety factor is computed as:
400,000SF =3.67
109,037
An analysis of the threaded holes in the top closure has been performed to assess the length of
HI-STAR SAR Proposed Rev. 13cREPORT HI-951251 2.7-34

engagement and stress requirements imposed on the connection by the transport loads. Themethodology used to evaluate the connection is that set forth in Machinery's Handbook and uses thespecific characteristics of the threaded joint. As part of the calculation, it is demonstrated that thebolt force required to maintain the seal (seal seating load plus pressure force) is only 27% of the totalbolt preload force that must be applied to ensure bolt performance under the various drop scenarios.That is, there is 73% excess capacity. Therefore, the momentary joint decompression due to thehypothetical fire accident is not sufficient to unload the seal.
The above calculations demonstrate that the requirements of Paragraph C.7 of Regulatory Guide 7.6are satisfied.
2.7.4 Immersion - Fissile Material
In order for the spent nuclear fuel in the HI-STAR 100 System to become flooded with water, a leakmust develop in both the overpack containment structure and the MPC enclosure vessel. Theanalysis provided demonstrates that both the overpack containment boundary and the MPCenclosure vessel meet the applicable stress and stress intensity allowables for normal conditions oftransport and hypothetical accident conditions. Therefore, no leak will develop.
I OCFR71.73(c)(5) specifies that fissile material packages, in those cases where water inleakage hasnot been assumed for criticality analysis, must be evaluated for immersion under a head of water ofat least 0.9 m (3 ft.) in the attitude for which maximum leakage is expected. The criticality analysespresented in Chapter 6 conservatively assumes flooding with water at optimum moderation.Therefore, this paragraph is not applicable. However, analysis is presented to demonstrate that thereis no water inleakage and verify that the flooded assumption made in the criticality analysis isconservative.
A head of water at a depth of 0.9 m (3 ft.) is equal to'1.3 psi. This pressure is bounded by the MPCenclosure vessel normal condition of transport and hypothetical accident condition externalpressures listed in Table 2.1.11 The head of water (1.3 psi) is also bounded by the hypotheticalaccident condition external pressure for the overpack. Analysis provided in this chapterdemonstrates that both the overpack containment boundary and the MPC enclosure vessel meet theapplicable stress and stress intensity allowables for normal conditions of transport and hypotheticalaccident conditions. Therefore, there is no in-leakage of water into the overpack or MPC under ahead of water at a depth of 0.9 m (3 ft.).
2.7.5 Immersion - All Packages
Deep submergence of the HI-STAR 100 System in 200 meters (656 ft.) of water creates an externalpressure load equal to 284 psi, which is less than the external design pressure of 300 psi. Thiscondition is established as Load Case 18 in Table 2.1.9. Since the containment boundary is notpunctured, stability of the package can be evaluated considering an undamaged package. The resultsfor an external pressure of 300 psi bound the results for 21.7 psi gauge pressure that is established inI OCFR71.73(c)(6) as the applicable external pressure for this evaluation. The elastic/plastic stabilityof the overpack has been examined using the methodology of ASME Code Case N-284. In theanalysis, all structural resistance to the external pressure is conservatively concentrated in the inner
HI-STAR SAR Proposed Rev. 13cREPORT HI-951251 2.7-35
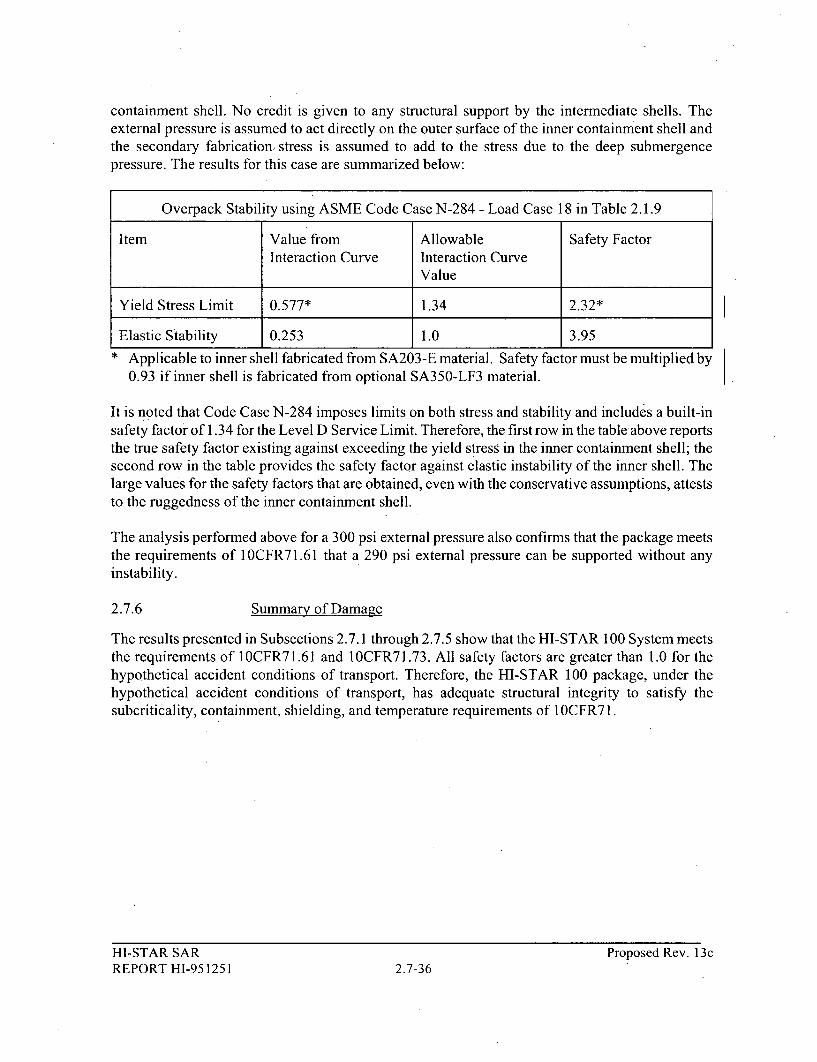
containment shell. No credit is given to any structural support by the intermediate shells. Theexternal pressure is assumed to act directly on the outer surface of the inner containment shell andthe secondary fabrication, stress is assumed to add to the stress due to the deep submergencepressure. The results for this case are summarized below:
Overpack Stability using ASME Code Case N-284 - Load Case 18 in Table 2.1.9
Item Value from Allowable Safety FactorInteraction Curve Interaction Curve
Value
Yield Stress Limit 0.577* 1.34 2.32*
Elastic Stability 0.253 1.0 3.95* Applicable to inner shell fabricated from SA203-E material. Safety factor must be multiplied by
0.93 if inner shell is fabricated from optional SA350-LF3 material.
It is noted that Code Case N-284 imposes limits on both stress and stability and includes a built-insafety factor of 1.34 for the Level D Service Limit. Therefore, the first row in the table above reportsthe true safety factor existing against exceeding the yield stress in the inner containment shell; thesecond row in the table provides the safety factor against elastic instability of the inner shell. Thelarge values for the safety factors that are obtained, even with the conservative assumptions, atteststo the ruggedness of the inner containment shell.
The analysis performed above for a 300 psi external pressure also confirms that the package meetsthe requirements of I OCFR71.61 that a 290 psi external pressure can be supported without anyinstability.
2.7.6 Summary of Damage
The results presented in Subsections 2.7.1 through 2.7.5 show that the HI-STAR 100 System meetsthe requirements of 1 0CFR71.61 and 1 OCFR71.73. All safety factors are greater than 1.0 for thehypothetical accident conditions of transport. Therefore, the HI-STAR 100 package, under thehypothetical accident conditions of transport, has adequate structural integrity to satisfy thesubcriticality, containment, shielding, and temperature requirements of 1 OCFR7 1.
HI-STAR SARREPORT HI-951251
Proposed Rev. 13c2.7-36

Table 2.7.1
MINIMUM SAFETY FACTORS FOR THE MPC FUEL BASKET UNDER HYPOTHETICAL ACCIDENT CONDITIONS OFTRANSPORT
Load Case Load Combinationt Safety Factor Location in SAR where CalculationsNumber or Results are Presented
F3
F3.a D + H', end drop 4.19 Subsection 2.7.1.1; Table 2.7.7
F3.b D + H', 00 side drop 1.16 Table 2.7.4
F3.c D + H', 450 side drop 1.28 Table 2.7.4
The symbols used for loads are defined in Subsection 2.1.2.1.
HI-STAR SARREPORT HI-951251
Proposed Rev. 13c2.7-37
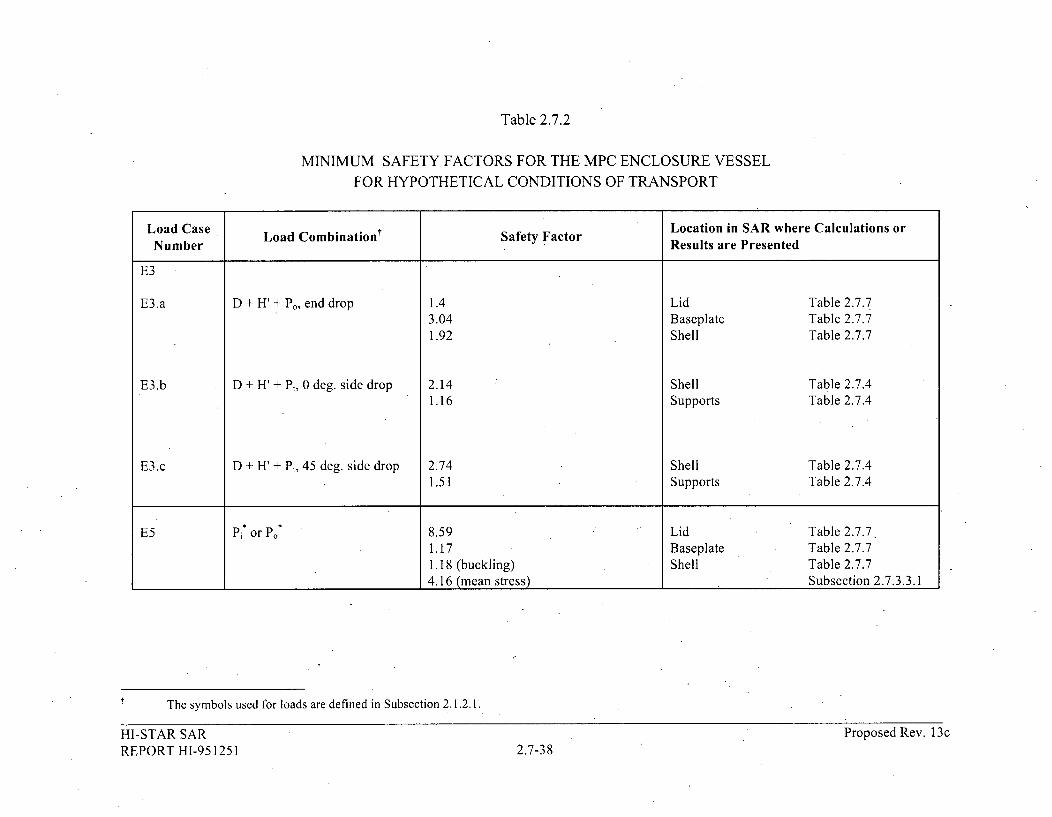
Table 2.7.2
MINIMUM SAFETY FACTORS FOR THE MPC ENCLOSURE VESSELFOR HYPOTHETICAL CONDITIONS OF TRANSPORT
Load Case Load Combinationt Safety Factor Location in SAR where Calculations orNumber Results are Presented
E3
E3.a D + H' + Po, end drop 1.4 Lid Table 2.7.73.04 Baseplate Table 2.7.71.92 Shell Table 2.7.7
E3,b D + H' + Pi, 0 deg. side drop 2.14 Shell Table 2.7.41.16 Supports Table 2.7.4
E3.c D + H' + Pi, 45 deg. side drop 2.74 Shell Table 2.7.41.51 Supports Table 2.7.4
E5 Pj* or Po* 8.59 Lid Table 2.7.71.17 Baseplate Table 2.7.71.18 (buckling) Shell Table 2.7.74.16 (mean stress) Subsection 2.7.3.3.1
The symbols used for loads are defined in Subsection 2.1.2.1.
HI-STAR SARREPORT HI-951251
Proposed Rev. 13c2.7-38

Table 2.7.3
MINIMUM SAFETY FACTORS FOR THE OVERPACKFOR HYPOTHETICAL ACCIDENT CONDITIONS OF TRANSPORT
Load Case Location in SAR whereNumbe Load Combinationt Safety Factor Calculations or Results areNumber
Presented
I T, + Dba + Pi + F + W, 2.16 Table 2.7.8
2 Th + Dt• + Pi + F + W, 1.75 Table 2.7.5
3 Th + Dsa + Pi + F + W, 2.19 (see note 2) Table 2.7.5
4 Th + Dea + Pi + F + Ws 1.49 Table 2.7.5
5 Th + Dga + P1 + F + WS 2.60 (see note 2) Table 2.7.5
6 Th + Ps + Pi + F + W 2.80 (see note 2) Table 2.7.5
7 Tb + P, + Pi + F + W, 2.03 (see note 1) Table 2.7.5
8 Th + Pb + Pi + F + W, 1.46 Table 2.7.5
9 T, + Dba + Po + F + W, 4.17 Table 2.7.6
10 T, + D, + Po + F + W, 1.87 'Table 2.7.6
11 T, + D, + PD , + F + W, 2.19 Table 2.7.6
12 T, + De, + Po + F + Ws 1.73 Table 2.7.6
13 Tc + Dga + Po + F + Ws 2.65 Table 2.7.6
14 T, + P, + Po + F + Ws 3.05 Table 2.7.6
15 T, + P, + Po + F + WS 2.09 (see note 1) Table 2.7.6
16 TC + Pb + P, + F + W, 1.46 Table 2.7.6
17 Tr+ Pi + F + W, pre-load maintained Subsection 2.7.3.4
18 Po* 2.32 Table 2.7.8
19 Pi + Tf+ F + W, 7.25 Subsection 2.7.3.3.2
20 Th + Dga + Pi + F + Ws 1.77 Table 2.7.5
21 T, + Dga + Pi + F + Ws 1.84 Table 2.7.6
22 T + Dga + Pi + F + W, 2.14 (see note 2) Table 2.7.5
Note: 1. This reported stress is directly under the point of impact. Therefore, the calculated value does notrepresent a primary stress; however, primary stress levels are met by this peak stress intensity.
2. Applicable to inner shell fabricated from SA203-E material. Safety factor must be multiplied by 0.93if inner shell is fabricated from optional SA350-LF3 material.
t The symbols used here are defined in Subsection 2.1.2.1.
HI-STAR SARREPORT HI-951251
Proposed Rev. 13c2.7-39

Table 2.7.4 - FINITE ELEMENT ANALYSIS RESULTS
MINIMUM SAFETY FACTORS FOR MPC COMPONENTS UNDER ACCIDENT CONDITIONS
MPC-24 MPC-32 MPC-68
Component - 30 Ft. Side Drop, 30 Ft. Side Drop, 30 Ft. Side Drop, 30 Ft. Side Drop, 30 Ft. Side Drop, 30 Ft. Side Drop,Stress Result 00 Orientation 450 Orientation 00 Orientation 450 Orientation 00 Orientation 450 OrientationLoad Case F3.b or Load Case F3.c or Load Case F3.b or Load Case F3.c or Load Case F3.b or Load Case F3.c or
E3.b E3.c E3.b E3.c E3.b E3.c
Fuel Basket - Primary 2.80 3.85 2.78 3.90 3.07 4.30Membrane (Pm)
Fuel Basket- Local 2.64 1.56Membrane Plus Primary 1.19 1.29 1.19 1.28
Bending (PL + Pb)
Enclosure Vessel - Primary 6.43 6.88 5.77 6.95 5.65 7.13
Membrane (Pm)
Enclosure Vessel - Local 3.07 2.74Membrane Plus Primary 4.24 4.28 2.14 3.56
Bending (PL + Pb)
Basket Supports - Primary N/A N/A 2.72 3.83 6.68 8.68
Membrane (Pm)
Basket Supports - LocalMembrane Plus Primary 3.89 4.75Bending (PL + Pb)
HI-STAR SARREPORT HI-951251
Proposed Rev. 13c2.7-40

Table 2.7.4 (Continued) - FINITE ELEMENT ANALYSIS RESULTS
MINIMUM SAFETY FACTORS FOR MPC COMPONENTS UNDER ACCIDENT CONDITIONS
MPC-24E/EF
Component - 30 Ft. Side Drop, 30 Ft. Side Drop,Stress Result 0 deg Orientation 45 deg Orientation
Load Case F3.b or Load Case F3.c or E3.cE3.b
Fuel Basket - Primary 2.75 3.80Membrane (Pm)
Fuel Basket - LocalMembrane Plus Primary 1.16 1.28Bending (PL + Pb)
Enclosure Vessel -Primary Membrane (Pm)
Enclosure Vessel - LocalMembrane Plus Primary 3.15 4.14Bending (PL + Pb)
HI-STAR SARREPORT HI-951251
Proposed Rev. 13c
2.7-41

Table 2.7.5 - FINITE ELEMENT ANALYSIS RESULTSFOR OVERPACK COMPONENTS UNDER ACCIDENT CONDITIONS (Hot Environment)MINIMUM SAFETY FACTORS
30 Ft. C.G. Over-the-30 Ft. Bottom End Drop 30 Ft. Top End Drop 30 Ft. Side Drop BottomCorer-Drop
Component - Stress Result LaCaeIodCse2odCse3Bottom-Cormer DropLoad Case 1 Load Case 2 Load Case 3LodCs4
Load Case 4
Lid - Local Membrane Plus Primary 34.04 1.75 2.60 7.76Bending (PL + Pb)
Inner Shell - Local Membrane Plus 4.35 (Note 2) 10.02 (Note 2) 2.19 (Note 2) 2.93 (Note 2)Primary Bending (PL + Pb)
Inner Shell - Primary Membrane (P,,) 4.48 (Note 2) 7.39 (Note 2) 2.45 (Note 2) 2.33 (Note 2)
Intermediate Shells - Local Membrane 6.63 7.95 2.33 1.49Plus Primary Bending (PL + Pb)
Baseplate - Local Membrane Plus 7.05 21.6 4.71 2.78Primary Bending (PL + Pb)
Enclosure Shell - Primary Membrane 16.44 12.23 2.19 5.48(PM) I I II
Notes: I.
2.
Load cases are defined in Table 2.1.9.
Applicable to inner shell fabricated from SA203-E material. Safety factor must be multiplied by 0.93 if inner shelloptional SA350-LF3 material.
is fabricated from
HI-STAR SARREPORT HI-951251
Proposed Rev. 13c2.7-42

Table 2.7.5 (Continued) - FINITE ELEMENT ANALYSIS RESULTS
MINIMUM SAFETY FACTORS FOR OVERPACK COMPONENTS UNDER ACCIDENT CONDITIONS (Hot Environment)
30 Ft. C.G. Over- Bottom End 30 Ft. - 30 degree 30 Ft. -the-Top-Corner Side Puncture Top End Puncture Bto n 0F.-3 ere 3 t
Component - Stress Result Drop Sid case 6 End case Puncture Drop SlapdownDrop Load Case 6 Lo 2 ad Case 7
Load Case 5 Load Case 8 Load Case 20 Load Case 22
Lid - Local Membrane Plus Primary 2.03 (See NoteBending (PL + Pb) 3.69 5.70 2) 6.29 1.77 2.22
Inner Shell - Local Membrane PlusPinnry Sell n (La ebra P3.16 (Note 3) 2.80 (Note 3) 29.29 (Note 3) 9.52 (Note 3) 2.78 (Note 3) 2.73 (Note 3)Primary Bending (PL -+ Pb) _________________ _______
Inner Shell - Primary Membrane (P,,) 2.60 (Note 3) 5.95 (Note 3) 26.5 (Note 3) 10.61 (Note 3) 2.45 (Note 3) 2.14 (Note 3)
Intermediate Shells - Local Membrane 3.52 6.19 32.52 15.12 3.28 2.88Plus Primary Bending (PL + Pb)
Baseplate - Local Membrane Plus 6.95 21.62 28.62 1.46 27.32 17.9Primary Bending (PL 4: Pb)
Enclosure Shell - Primary Membrane 3.56 4.53 51.32 29.9 8.02 2.40(Pro)
Notes: I. Load cases are defined in Table 2.1.9.
2. Stress Intensity computed just outboard of the loaded area since surface stress is not a primary stress component.
3. Applicable to inner shell fabricated from SA203-E material. Safety factor must be multiplied by 0.93 if inner shell is fabricated from optionalSA350-LF3 material.
HI-STAR SARREPORT HI-951251
Proposed Rev. 13c2.7-43

Table 2.7.6 - FINITE ELEMENT ANALYSIS RESULTS
MINIMUM SAFETY FACTORS FOR OVERPACK COMPONENTS UNDER ACCIDENT CONDITIONS (Cold Environment)
30 Ft. C.G. Over-the-30 Ft. Bottom End Drop 30 Ft. Top End Drop 30 Ft. Side Drop BottomCorer-Drop
Component - Stress Result LodCs odCs 0La aeIIBottom-Comer DropLoad Case 9 Load Case 10 Load Case 11LadCse1
Load Case 12
Lid - Local Membrane PlusPrimary Bending 30.29 1.87 2.73 8.00
(P1, + Pb)
Inner Shell - Local MembranePlus Primary Bending (PL + Pb)
Inner Shell - Primary Membrane 4.37 7.33 2.47 2.36(P,.)
Intermediate Shells - LocalMembrane Plus Primary 4.95 8.66 2.61 1.73Bending (PL + Ph)
Baseplate - Local Membrane 17.07 4.80 2.73Plus Primary Bending (PL + Pb)
Enclosure Shell - Primary 20.08 18.4 2.45 5.71-Membrane (P,,)
Notes: 1. Load cases are defined in Table 2.1.9.
HI-STAR SARREPORT HI-951251
Proposed Rev. 13c
2.7-44

Table 2.7.6 (Continued) - FINITE ELEMENT ANALYSIS RESULTS
MINIMUM SAFETY FACTORS FOR OVERPACK COMPONENTS UNDER ACCIDENT CONDITIONS (Cold Environment)
30 Ft. C.G. Over-the-Top-Corner Side Puncture Top End Puncture Bottom End Puncture 30 Ft.. - 30 degree Drop
Component - Stress Result Drop Load Case 14 Load Case 15 Load Case 16 Load Case 21Load Case 13
Lid - Local Membrane PlusPrimary Bending 3.91 5.91 2.09 (See Note 2) 6.64 1.84
(PL + Pb)
Inner Shell - Local Membrane 3.21 3.05 24.97 8.54 2.78Plus Primary Bending (PL + Pb)
Inner Shell - Primary Membrane(P.) 2.65 7.60 17.03 9.59 2.48
Intermediate Shells - LocalMembrane Plus Primary 4.10 7.06 27.55 14.9 3.81Bending (PL + Pb)
Baseplate - Local Membrane 7.08 29.69 47.25 1.46 21.91Plus Primary Bending (PL + Pb)
Enclosure Shell - Primary 4.13 5.17 57.21 76.5 9.64Membrane (P,,)
Notes: 1. Load cases are defined in Table 2.1.9.
2. Surface pressure not included in safety factor evaluation since it is not a primary stress.
HI-STAR SARREPORT HI-951251
Proposed Rev. 13c2.7-45
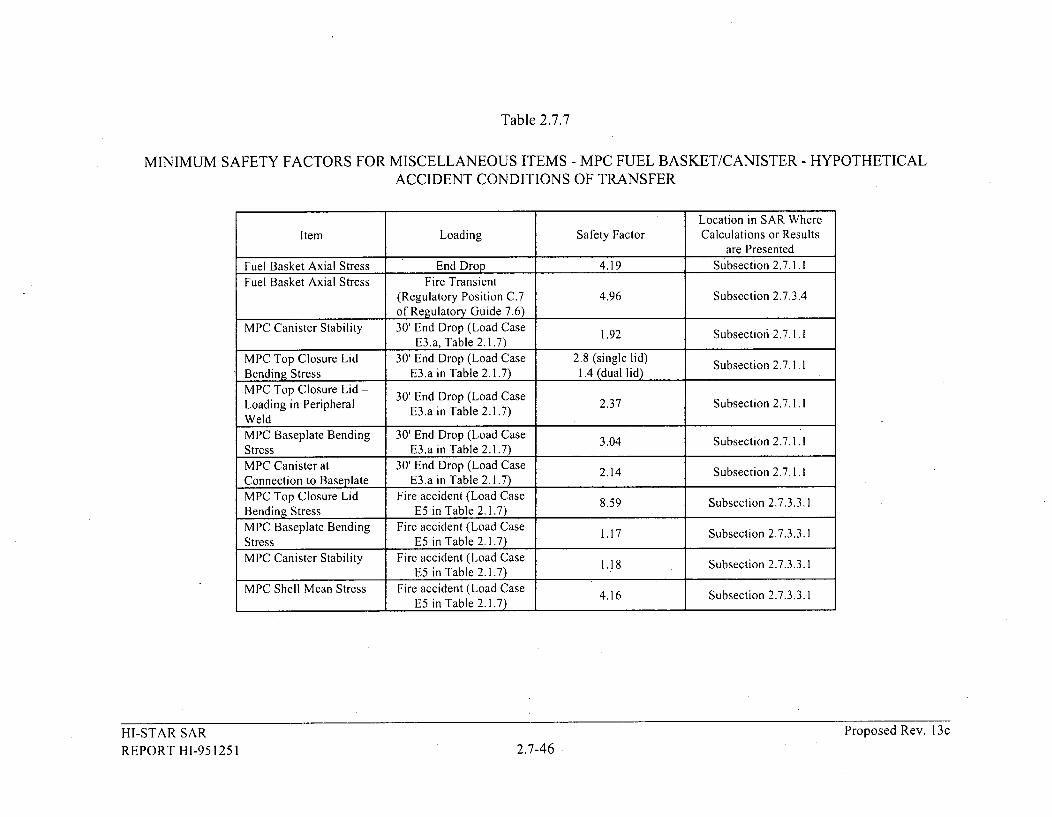
Table 2.7.7
MINIMUM SAFETY FACTORS FOR MISCELLANEOUS ITEMS - MPC FUEL BASKET/CANISTER - HYPOTHETICALACCIDENT CONDITIONS OF TRANSFER
Location in SAR WhereItem Loading Safety Factor Calculations or Results
are Presented
Fuel Basket Axial Stress End Drop 4.19 Subsection 2.7. 1.1Fuel Basket Axial Stress Fire Transient
(Regulatory Position C.7 4.96 Subsection 2.7.3.4of Regulatory Guide 7.6)
MPC Canister Stability 30' End Drop (Load Case 1.92 Subsection 2.7.1.1E3.a, Table 2.1.7)
MPC Top Closure Lid 30' End Drop (Load Case 2.8 (single lid) Subsection 2.7.1.1Bending Stress E3.a in Table 2.1.7) 1.4 (dual lid)MPC Top Closure Lid - 30' End Drop (Load CaseLoading in Peripheral E3.a in Table 2.1.7) 2.37 Subsection 2.7.1.1WeldMPC Baseplate Bending 30' End Drop (Load Case 3.04 Subsection 2.7.1.1Stress E3.a in Table 2.1.7)
MPC Canister at 30' End Drop (Load Case 2.14 Subsection 2.7.1.1Connection to Baseplate E3.a in Table 2.1.7)MPC Top Closure Lid Fire accident (Load Case 8.59 Subsection 2.7.3.3.1Bending Stress E5 in Table 2.1.7)
MPC Baseplate Bending Fire accident (Load Case 1.17 Subsection 2.7.3.3.1Stress E5 in Table 2.1.7)MPC Canister Stability Fire accident (Load Case
MP Cnstr tbiiy 5 nTale21.)1.18 Subsection 2.7.3.3.1E5 in Table 2.1.7)
MPC Shell Mean Stress Fire accident (Load Case 4.16 Subsection 2.7.3.3.11 E5 in Table 2.1.7) 1
HI-STAR SARREPORT HI-951251
Proposed Rev. 13c
2.7-46

Table 2.7.8
MINIMUM SAFETY FACTORS FOR MISCELLANEOUS ITEMS - OVERPACK -HYPOTHETICAL ACCIDENT CONDITIONS OF TRANSPORT
Location in SAR
Item Loading Safety Factor Where Calculationsor Results are
Presented
30' End Drop (LoadOverpack Stability Cases I and 2 in 2.16* Subsection 2.7.1.1
Table 2.1.9)
30' End Drop (LoadClosure Bolts Case 2 in Table 1.30 Subsection 2.7.1.1
2.1.9)
Closure Bolts Top End Puncture 1.86 Subsection 2.7.2
Overpack Inner Shell Fire Transient 7.25 Subsection 2.7.3.3.2Mean Stress
Closure Bolts Fire Transient 1.69 Subsection 2.7.3.3.3
Fire Transient
Overpack Stress (Regulatory Position 3.67 Subsection 2.7.3.4C.7 of Regulatory
Guide 7.6)
Overpack Stability Immersion (Load(Yield Stress Case 18 in Table 2.32* Subsection 2.7.5
Criteria) 2.1.9)
Overpack Stability Immersion (Load(vrack Stab Case 18 in Table 3.95 Subsection 2.7.5(Stability Criteria) 2.1.9)
* Applicable to inner shell fabricated from SA203-E material. Safety factor must be multiplied by
0.93 if inner shell is fabricated from optional SA350-LF3 material.
HI-STAR SARREPORT HI-951251
Proposed Rev. 13c2.7-47

APPENDIX 2.A:DESIGN, TESTING, AND COMPUTER SIMULATION OF THE AL-STAR TM
IMPACT LIMITER
2.A.1 INTRODUCTION
As stated in Subsection 2.7, the central purpose of the AL-STARTM impact limiter is to limit thepackage maximum deceleration, aYmax , under a postulated drop event to a specified design value.For the regulatory 9-meter hypothetical free drop event, the AL-STAR design is engineered tolimit the maximum rigid body deceleration to 60 times the acceleration due to gravity (Table2.1.10). The HI-STAR packaging, consisting of the loaded overpack and top and bottom impactlimiters (illustrated in Figure 2.A.l.1) is essentially a cylindrical body with a rigid interior(namely, the overpack) surrounded by a pair of relatively soft crushable structures. Thecrushable structure (impact limiter) must deform and absorb the kinetic energy of impact withoutdetaching itself from the overpack, disintegrating, or otherwise malfunctioning. A fallingcylindrical body may theoretically impact the target surface in an infinite number of orientations;the impact limiter must limit the HI-STAR 100 decelerations to below 60g's and preserve thelimiter-to-overpack connection regardless of the impact orientation. Figure 2.A.1.2 presents theside drop event. In general, a drop event orientation is defined by the angle of the HI-STAR 100longitudinal axis, 0, with the impact surface. In this notation, 0 = 0 means a side drop and 0 =900 implies a vertical or end drop scenario. Inasmuch as the top and bottom impact limiter aremade Of identical crush material, the top or bottom vertical drop events are mathematically andphysically equivalent as far as the impact limiter design is concerned. In any orientation, thedrop height is measured from the lowest point on the package.
An intermediate value of 0, 0 = 67.50, warrants special mention. At 0 = 67.5 degrees, the pointof impact is directly below the center of gravity (C.G.) of the HI-STAR 100 package. This droporientation is traditionally called the C.G.-over-corner (CGOC) configuration. The CGOCorientation is the demarcation line between single and dual impact events. At 90'> 0 > 67.50, theleading end of the packaging (denoted as the "primary" impact limiter) is the sole participant inabsorbing the incident kinetic energy. At 0 < 67.50 drop orientations, the initial impact andcrush of the leading (primary) impact limiter is followed by the downward rotation of the systemwith the initial impact surface acting as the pivot, culminating in the impact of the opposite(secondary) impact limiter on the target surface. In the dual impact scenarios, the first andsecond impact limiter crush events are referred to as the "primary" and "secondary" impacts,respectively. It is reasonable to speculate that for certain values of 0, the secondary impact maybe the more severe of the two. As stated earlier, the design of AL-STAR must ensure that ctmax <60, regardless of the value of 0.
The AL-STAR attachment design must ensure that both impact limiters remain attached to thecask during and after the impact event. The impact limiters are also required to prevent caskbody-to-unyielding target contact.
HI-STAR SAR Proposed Rev. 13cREPORT HI-951251 2.A-1

Finally, the package design must satisfy all criteria in ambient temperature conditions rangingfrom -20' to 100°F, and with humidity ranging from 0 to 100%. Therefore, the impact limiterdesign must be functionally insensitive to temperature and environmental conditions.
An aluminum honeycomb-based impact limiter design was selected as the preferred material fordevelopment. The detailed design of the AL-STAR impact limiters is presented in HoltecDrawing C1765 located in Section 1.4. A pictorial view of AL-STAR is presented in Figure2.A.1.3.
Figure 2.A.1.3 indicates that in addition to the crushable honeycomb, the AL-STAR containstwo internal cylindrical shells (also denoted as "rings"), which are stiffened with radial gussets.These carbon steel shells are sized to behave as undeformable surfaces during impact events.They are essentially the "backbone" of the impact limiter, lending a predictability to the impactlimiter crush behavior and forcing the energy absorption to occur in the honeycomb metal mass.The design of this backbone structure was a subject of in-depth computer and experimental 1/8scale static testing, as documented in Holtec Report HI-962501 [2.A.4] and summarized inSection 2.A.4 herein.
Another noteworthy aspect of the AL-STAR impact limiter design is the arrangement of uniaxialand cross core (biaxial) honeycombs. Regions of the honeycomb space that experience impactloading in only one direction are equipped with unidirectional honeycomb sectors. The regionswhere the direction of the impact loads can vary have cross-core (bi-directional) honeycomb.material, as detailed in Subsection 2.3.1.5.
To summarize, the design objectives of the AL-STAR impact limiter are set down as fivediscrete items, namely:
i. Limit peak deceleration (cUmax) to 60g's under all potential drop orientations.
ii. Impact limiter must not detach from the cask under a 9-meter drop event, under anyimpact orientation.
iii. The impact limiters must bring the cask body to a complete stop, such that the overpackdoes not come in physical contact with the target surface.
iv. Crush material must be equally effective at -20' and 1 00'F, with humidity ranging from 0to 100%.
v. All external surfaces must be corrosion-resistant.
The last two objectives are realized by utilizing aluminum honeycomb (Type 5052) as crushmaterial and stainless steel (Type 304), for the external skin enclosure. As shown in the ASMECode (Section II, Part D, Table Y-1), the essential property of the constituent material for thehoneycomb and the external skin, namely the yield strength remains constant in the -20' F to
HI-STAR SAR Proposed Rev. 13c'REPORT HI-951251 2.A-2

1000 F range. The surface of the carbon steel impact limiter backbone is painted to limitcorrosion.
The remaining design objectives, namely, limiting of the maximum rigid body deceleration,Oxmam, to 60 g's under a 9-meter drop event, maintaining positive attachment of the AL-STARimpact limiters to the overpack, and preventing contact of the overpack with the unyieldingsurface, are demonstrated by a combination of numerical simulations and scale model static anddynamic testing. This was accomplished through a research and development effort that isbroadly subdivided into six phases, as follows:
Phase 1: Characterize the honeycomb pressure-deflection relationship.
Phase 2: Propose a force (static) vs. crush (F vs. d) model for AL-STAR.
Phase 3: Perform 1/8 scale model static compression tests to validate the force-crush model and to establish the adequacy of the AL-STAR backbonestructure.
Phase 4: Conduct 9-meter quarter-scale model dynamic drop tests in selectedlimiting drop configurations and obtain test data.
Phase 5: Simulate the experimental drop tests with a suitable "dynamic model" andestablish that the dynamic model predictions of deceleration, crush andevent time duration reasonably match the experimentally measured values.A reasonable prediction of the peak decelerations of each drop event is theminimum for the dynamic model to be acceptable.
Phase 6: Utilize the experimentally confirmed dynamic model to evaluate theeffects of tolerances on crush properties and on package weight, and toconfirm the adequacy of the full-scale impact limiter design.
It is of crucial importance that the dynamic model benchmarked in Phase 5 be of high reliability,since it becomes the analytical model for the accident-event response prediction of the packagingwhen tolerances on material behavior and package mass are considered (Phase 6).
In this appendix, a description of the overall program and results for each of the six phases ispresented.
2.A.2 Phase 1: Material Pressure-Crush Relationship
The extent of deflection, A, sustained by a honeycomb material when subjected to a uniformpressure, p, is an essential element of information in the impact limiter design. Towards this end,coupon specimens of uniaxial and cross-core honeycomb of various nominal crush strengths anddensities were compression-tested by the material manufacturer. The results showed that allhoneycomb coupons shared some common load-deflection characteristics, namely:
HI-STAR SAR Proposed Rev. 13cREPORT HI-951251 2.A-3

The initial pressure-deflection curve resembled an elastic material (pressure roughly proportionalto deflection).
Upon reaching a limiting pressure, the material crushed at near constant pressure until the crushreached approximately 60-70 percent of the initial thickness. The required crush force had toincrease rapidly to achieve small incremental crushing for strains beyond approximately 60-70percent.
Figure 2.A.2.1 shows a typical static pressure-deflection curve for a 1 "-thick honeycombspecimen. The curve with the initial peak is that of an un-precrushed honeycomb specimen; thecurve without the peak (shown as a dashed line only where a difference occurs) corresponds to apre-crushed specimen. Dynamic testing subsequently showed that removal of the initial peak bypre-crushing the material was a desired feature whenever a large flat area of honeycomb materialexperienced a crush force (such as in a 90 degree end drop).
Curve fitting of data from all tested coupons indicated that a single mathematical relationshipbetween the applied pressure and compression strain could be developed. The mathematicalrelationship can provide a reasonable fit for coupons of all crush strengths (crush strengthdefined as the pressure corresponding to the flat portion of the curve in Figure 2.A.2.1; i.e., it isthe constant pressure at which the honeycomb undergoes near-perfect plastic deformation). Inother words, the pressure, p, for a given strain, F, is represented by a unique function of the crushpressure, Pc, i.e.
,p = f (p!, 0)
The relationship between p and compression strain was used in the subsequent mathematicalefforts to simulate AL-STAR crush behavior. The above mathematical relation was developed tosimulate material behavior for a honeycomb material under both non-pre-crushed and pre-crushed conditions.
2.A.3 Phase 2: Static Force-Crush Prediction Model
An essential step towards the development of a reliable dynamic model to simulate the impact ofa dropped HI-STAR 100 package is to develop a static force-crush model that can subsequentlybe validated by scale model tests. The force-crush model should reliably duplicate the resistanceprovided by an impact limiter for a range of crush orientations for the full range of crush depths.
The required force-crush model for AL-STAR is developed using the concept ofinterpenetration, which is explained using the case of the side drop (0 = 0) as an example (Figure2.A.3.1 (a)).
The condition existing in all impact limiter drop scenarios is that the relatively soft honeycombmaterial lies between two "hard" surfaces that are advancing towards each other during theimpact. One of these two rigid surfaces is the essentially unyielding target (Rigid Body 1) and
HI-STAR SAR Proposed Rev. 13cREPORT HI-951251 2.A-4

the other is the structural backbone of the impact limiter (Rigid Body 2). While the target surfaceis flat, the backbone structure is cylindrical in profile. When squeezed between the two surfaces,the honeycomb material (at each instant in time) will crush at one or both interface locations. To.determine which interface surface will undergo crushing at a given point during the impactevent, the concept of interpenetration area is utilized as explained below.
In this concept, two separate crush scenarios, one assuming that the crush occurs at the externalinterface (target-to-impact limiter), and the other assuming that the crushing is at the internalinterface (structural backbone/overpack-to-impact limiter), are compared at each instant during asimulated compression of the impact limiter. A metal honeycomb impact limiter, in general, mayhave multiple honeycomb material sections crushing at each interface. For simplicity inexplaining the concept of interpenetration, we assume that each of the interfaces is characterizedby a uniform distribution of honeycomb having crush pressures p, and P2, respectively. Todetermine the resistive force developed to crush the impact limiter by a small amount, d, againstthe external target, the impact limiter is assumed to penetrate the target by the amount "d"without deformation. The resulting area A1 for the case of side drop, illustrated in Figure2.A.3.1(b), can be computed as an algebraic expression in the amount of approach, d. (Foroblique drop events, ANSYS [2.A.1] or CADKEY [2.A.2] are used to compute interpenetrationarea as a function of incremental interpenetration.) The pressure-compression relationship for thehoneycomb stock at the external interface provides the crush pressure pi that develops due todeformation "d". The total force required for crush "d", at the external interface, is thereforeequal to pIAi.
In the second (independent) scenario, the impact limiter external surface is assumed to undergono movement; rather, the backbone structure (along with the overpack) advances towards thetarget by an amount d (Figure 2.A.3. 1(c)). Once again, assuming that the cylindrical rigid bodymoves through an amount "d", the resistance pressure developed in the honeycomb materiallying in the path of penetration is available from the appropriate material pressure-compressioncurve. If the pressure corresponding to the deformation is P2 and the projected area at the internalinterface is A2, then the total resistive force encountered in realizing an approach equal to "d"between the overpack-backbone assemblage and the target under this latter scenario is p2A2. Inan actual drop event, at each instant during the. event, incremental crush occurs at one of the twointerfaces. If p1A1 < p2A2 at a given instant then crushing will occur at the external interface.Likewise, p1A1 > p2A2 will imply that crushing will occur internal to the impact limiter. Thesmaller of p1A1 and P2 A2 is the required crush force and the corresponding location of crush iswhere the honeycomb material will compress to realize the approach equal to d. This "inequalitytest" to determine where crushing occurs is performed at every increment of crush during thesimulation of the event. The appropriate value of the crush force is used in the equilibriumequations at that instant. The concept of interpenetration at two interfaces has been confirmedduring testing of the impact limiters; the total crush is observed to be a sum of compression ateach of the two interfaces.
To construct a mathematical force-deformation relationship for AL-STAR in any givenorientation, the above process is repeated as the crush "d" is increased in small incrementsstarting with the beginning of compression (d = 0). It is quite clear that the development of the
HI-STAR SAR Proposed Rev. 13cREPORT HI-951251 2.A-5

force-deflection model (F-d model) for AL-STAR in any orientation is a straightforward analysisin 3-D geometry. The F-d curve for AL-STAR for any given value of 0 can be developed where,other than the geometry of the impact limiter, the crush strengths p of the honeycomb materialsutilized in the impact limiter are the only other required inputs.
The force (F) vs. crush (d) relationship developed using the foregoing method is referred to asthe F-d model that is subject to validation by appropriate 1/8 scale model compression testsdescribed in the following section.
2.A.4 Phase 3: One-Eighth Scale Model Static Compression Tests
The 1/8 scale model tests consist of subjecting scaled replicas of the full-size AL-STAR to staticcompression tests in an engineered fixture such that the force-compression curve for the scaledmodel can be obtained in various orientations of compression. The scale model is made bymaking the diameters and length of the model one-eighth of the full-size AL-STAR. Thethicknesses of the backbone components (i.e., the inner and outer shells and gussets), and theexternal skin (see Figure 2.A.1.3) are also scaled to one-eighth times the correspondingdimensions (to the nearest sheet metal gage, where applicable) in the full-size AL-STAR. In theone-eighth model, the performance of the attachment system is not assessed nor is the cask bodymodeled. However, the interface between overpack and impact limiter where the compressionload is resisted is properly simulated. The crush pressure is a material property of the energyabsorbing material; therefore, the material (and its density) is not scaled. The 1/8 scale model,therefore, has approximately (1/8)3, or 1/512 the volume and weight of the full-size unit. Holtecdocuments [2.A.3, 2.A.4] provide complete details on the 1/8 scale model geometry andfabrication. The static compression behavior of such a 1/8-scale model is correlated with that ofa full-size unit using the geometric scaling information. For example, under an axial compressiontest the area under crush in the scale model will be 1/64 of the full-size AL-STAR (recall that thediameter is scaled down by a factor of 8). Therefore, the crush force (which is crush forcepressure times the area under crush) will be 1/64 of the full-size unit. On the other hand, thecrush stroke (extent of deformation before "lock up") will be 1/8 of the full-size AL-STARbecause the axial length of the scale model (which corresponds to the height of the crush columnin axial compression) is one-eighth of the full-size hardware. Thus, the total energy absorbed(force times compression) will be (1/8)3 of the full-size unit. The same scaling factor can beshown to apply in all directions of crush.
In summary, the 1/8 scale model scales the geometric dimensions of AL-STAR. The previouslydiscussed F-d model is required to translate the force-crush relationship from the 1/8 scalereplica to the full-size unit. In order to use the analytical F-d model as a valid vehicle forpredicting the force-crush of the full-size (or quarter-scale) AL-STAR, it is necessary to checkits prediction ability against actual test data from 1/8-scale model static compression tests.
HI-STAR SAR Proposed Rev. 13cREPORT HI-951251 2.A-6
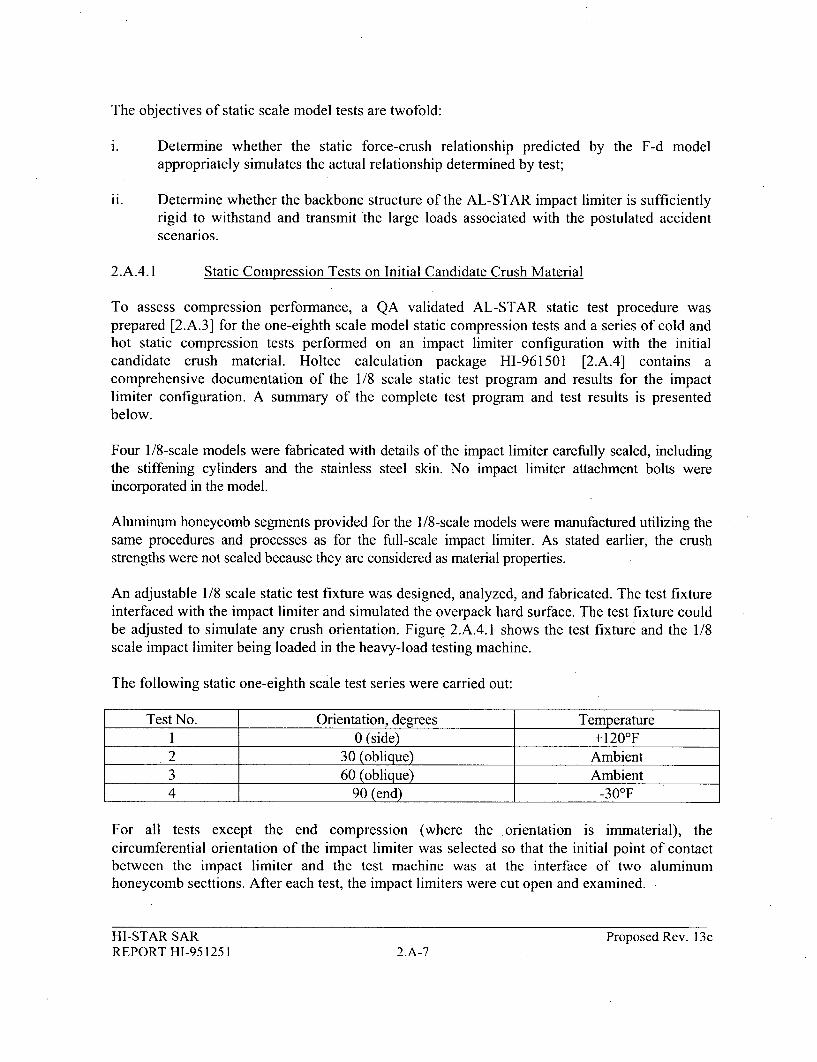
The objectives of static scale model tests are twofold:
i. Determine whether the static force-crush relationship predicted by the F-d modelappropriately simulates the actual relationship determined by test;
ii. Determine whether the backbone structure of the AL-STAR impact limiter is sufficientlyrigid to withstand and transmit the large loads associated with the postulated accidentscenarios.
2.A.4.1 Static Compression Tests on Initial Candidate Crush Material
To assess compression performance, a QA validated AL-STAR static test procedure wasprepared [2.A.3] for the one-eighth scale model static compression tests and a series of cold andhot static compression tests performed on an impact limiter configuration with the initialcandidate crush material. Holtec calculation package HI-961501 [2.A.4] contains acomprehensive documentation of the 1/8 scale static test program and results for the impactlimiter configuration. A summary of the complete test program and test results is presentedbelow.
Four 1/8-scale models were fabricated with details of the impact limiter carefully scaled, includingthe stiffening cylinders and the stainless steel skin. No impact limiter attachment bolts wereincorporated in the model.
Aluminum honeycomb segments provided for the 1/8-scale models were manufactured utilizing thesame procedures and processes as for the full-scale impact limiter. As stated earlier, the crushstrengths were not scaled because they are considered as material properties.
An adjustable 1/8 scale static test fixture was designed, analyzed, and fabricated. The test fixtureinterfaced with the impact limiter and simulated the overpack hard surface. The test fixture couldbe adjusted to simulate any crush orientation. Figure 2.A.4.1 shows the test fixture and the 1/8scale impact limiter being loaded in the heavy-load testing machine.
The following static one-eighth scale test series were carried out:
Test No. Orientation, degrees Temperature1 0 (side) +120°F2 30 (oblique) Ambient3 60 (oblique) Ambient4 90 (end) -30OF
For all tests except the end compression (where the orientation is immaterial), thecircumferential orientation of the impact limiter was selected so that the initial point of contactbetween the impact limiter and the test machine was at the interface of two aluminumhoneycomb secttions. After each test, the impact limiters were cut open and examined.
HI-STAR SAR Proposed Rev. 13cREPORT HI-951251 2.A-7

Observations Based on 1/8 Scale Model Testine
Effect of Ambient Temperature:
The end compression test was performed with the impact limiter cold (-30'F), the sidecompression test was performed with the impact limiter hot (+120'F), and the twooblique tests performed at ambient temperature. The material behavior showed noinfluence of test temperature. This confirms the expected result since the aluminumhoneycomb and stainless steel skin yield strengths are insensitive to temperature in therange of interest (-20' F to 1000 F) as prescribed in Table Y-1 of the ASME Code.
Side compression orientation - 0 degree:
The inner stiffening cylinder experienced considerable permanent deformation. The gussetswhich buttress the inner cylinder buckled. The outer stiffening cylinder performedelastically.
Oblique compression orientation:
Two oblique orientation static tests were performed. The 30-degree oblique test againshowed the need to thicken the inner stiffening cylinder and to rearrange the stiffeninggussets.
The 60-degree oblique test was a complete success; no plastic deformation of the backbonestructure was indicated.
As would be expected, in those cases where the hard region (backbone structure) of theimpact limiter sustained deformations, the scale model exhibited greater flexibility in thephysical testing than the analytical prediction (the flexibility of the backbone structure addedto the crush of the honeycomb resulting in a greater total measured deflection).
End compression orientation - 90 degree:
The end-compression orientation is,, structurally speaking, the least complicated of thefour test configurations. The loading of the AL-STAR scale model in this test is purelyaxisymmetric. The initial peak in the pressure/deformation curve seen in the coupon tests(Figure 2.A.2.1) was clearly evident in the axial (end) compression test (Figure 2.A.4.3). Thebackbone structure performed without sustaining plastic deformation.
HI-STAR SAR Proposed Rev. 13cREPORT HI-951251 2.A-8
Comparison of experimental and analytical predictions
Out of the four static 1/8-scale model tests, two tests (side compression and 30-degreeoblique) were unsatisfactory because the backbone structure of the impact limiter did notremain elastic. These tests served to identify the need to reinforce the AL-STAR backbonestructure. The other tests, namely end-compression (90 degree) and 60-degree oblique,wherein the backbone structure performed as designed, showed close agreement with thenumerical model. Figures 2.A.4.3 and 2.A.4.4, respectively, show the static test results for90-degree (end-compression) and 60 degree (oblique) cases, along with the prediction of theF-d model. There is good agreement between the computer model and the test data.
In summary, the 1/8 scale model static test program identified the required design changes to theinternal structure of the impact limiters. The 1/8 scale model tests showed that the load-compliancecharacteristics of AL-STAR are insensitive to the changes in the ambient environment. Acomparison of the test results with the mathematical model predictions from the F-d model indicatedthat the mathematical model was in good agreement with 1/8-scale static crush tests whenever thebackbone structure performed as required (i.e. remained elastic). Since the crush geometry of thescale model was not altered by the strengthening of the backbone, any subsequent reinforcing of thebackbone did not alter the F-d relationship for the impact limiter. The two successful static teststhat showed excellent agreement with the computer F-d model, therefore, continued to serve as avalid benchmark of the numerical model after the backbone is stiffened. The reinforcedbackbone structure is incorporated into the final design drawings for the AL-STAR, and wasconfirmed as acceptable during the dynamic (1/4-scale) model drop tests. Subsequent to theone-quarter scale dynamic tests and the analytical correlation (Phases 4-6), three additional 1/ 8 th
,.scale confirmatory static tests were performed on impact limiters that included the internalbackbone structure and the final crush material orientations used in the quarter-scale drop testsand in the analytical correlation. These additional confirmatory static tests were performed atroom temperature. The tests simulated the crush orientation corresponding to the side drop, the"center-of-gravity-over corner" drop, and the end drop, respectively. Force-deflection resultsfrom the static test are compared with the predictions from the theory for the 1/81h-scale impactlimiters. Subsection 2.A. 10 discusses the results obtained from these three additional static tests.
2.A.5 Phase 4: 9 Meter Quarter-Scale Model Drop Tests
The one-quarter scale model dynamic tests provide physical confirmation of the HI-STARimpact limiter design and the performance of the attachment system.
In the 1/4 scale model drop test program, an instrumented scale model of the HI-STAR 100 dual-purpose cask was assembled with the top and bottom AL-STAR impact limiters, raised to a height of9 meters (measured from the lowest point on the package), and then released to free fall onto anunyielding concrete and steel armor target (unyielding target). The impact limiter attachment systemis reproduced in the model using the appropriate scale for bolt diameters, etc.
HI-STAR SAR Proposed Rev. 13cREPORT HI-951251 2.A-9
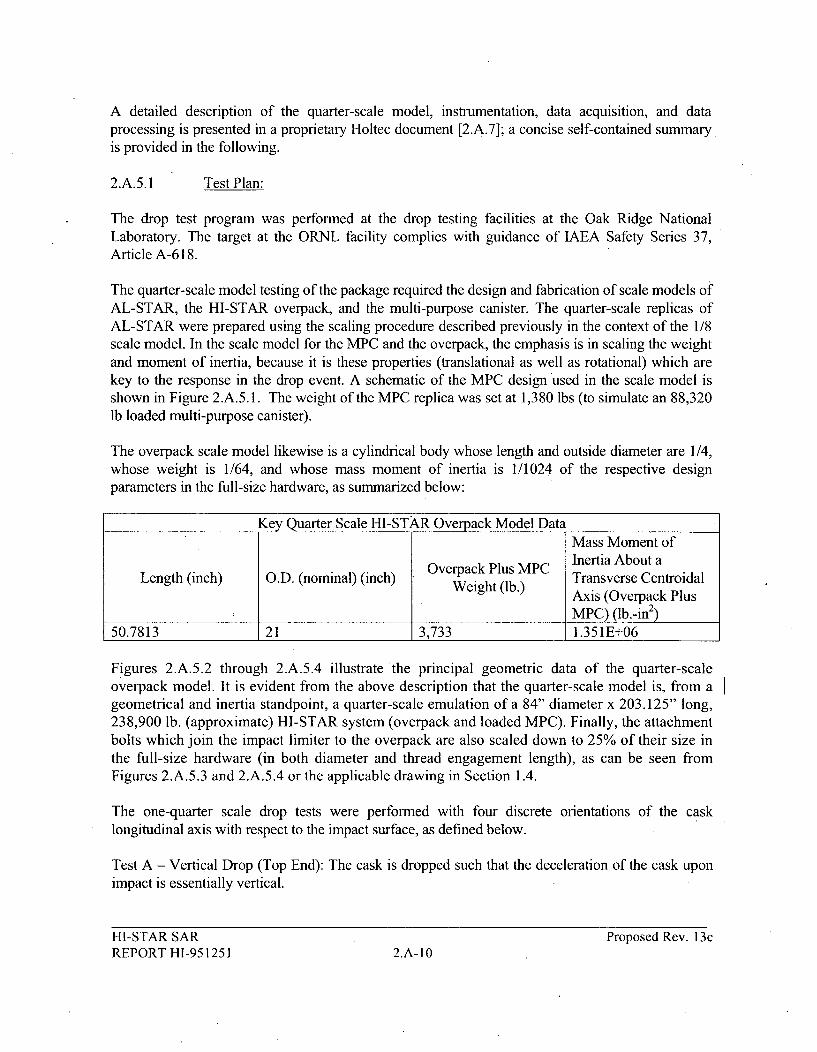
A detailed description of the quarter-scale model, instrumentation, data acquisition, and dataprocessing is presented in a proprietary Holtec document [2.A.7]; a concise self-contained summaryis provided in the following.
2.A.5.1 Test Plan:
The drop test program was performed at the drop testing facilities at the Oak Ridge NationalLaboratory. The target at the ORNL facility complies with guidance of IAEA Safety Series 37,Article A-618.
The quarter-scale model testing of the package required the design and fabrication of scale models ofAL-STAR, the HI-STAR overpack, and the multi-purpose canister. The quarter-scale replicas ofAL-STAR were prepared using the scaling procedure described previously in the context of the 1/8scale model. In the scale model for the MPC and the overpack, the emphasis is in scaling the weightand moment of inertia, because it is these properties (translational as well as rotational) which arekey to the response in the drop event. A schematic of the MPC design used in the scale model isshown in Figure 2.A.5. 1. The weight of the MPC replica was set at 1,380 lbs (to simulate an 88,320lb loaded multi-purpose canister).
The overpack scale model likewise is a cylindrical body whose length and outside diameter are 1/4,whose weight is 1/64, and whose mass moment of inertia is 1/1024 of the respective designparameters in the full-size hardware, as summarized below:
Key Quarter Scale HI-STAR Overpack Model DataMass Moment ofInertia About a
Length (inch) O.D. (nominal) (inch) Overpack Plus MPG Transverse CentroidalWeight (lb.) Axis (Overpack Plus
MPC) (lb.-in2)50.7813 21 3,733 1.351E+06
Figures 2.A.5.2 through 2.A.5.4 illustrate the principal geometric data of the quarter-scaleoverpack model. It is evident from the above description that the quarter-scale model is, from ageometrical and inertia standpoint, a quarter-scale emulation of a 84" diameter x 203.125" long,238,900 lb. (approximate) HI-STAR system (overpack and loaded MPC). Finally, the attachmentbolts which join the impact limiter to the overpack are also scaled down to 25% of their size inthe full-size hardware (in both diameter and thread engagement length), as can be seen fromFigures 2.A.5.3 and 2.A.5.4 or the applicable drawing in Section 1.4.
The one-quarter scale drop tests were performed with four discrete orientations of the casklongitudinal axis with respect to the impact surface, as defined below.
Test A - Vertical Drop (Top End): The cask is dropped such that the deceleration of the cask uponimpact is essentially vertical.
HI-STAR SAR Proposed Rev. 13cREPORT HI-951251 2.A-10
Test B: Center of Gravity-Over-Corner (CGOC): For HI-STAR 100, C.G.-over-corner means anorientation wherein the axis of the cask is at 67.50 from the horizontal at the instant of release at the9-meter height. This test seeks to establish the adequacy of the impact limiter under non-symmetricimpact loading.
Test C - Side Drop: The cask is held horizontal with the lowest point on the package 9 meters abovethe target surface when released for free fall. In this test, both impact limiters participate, and theimpact impulse is essentially equally divided between them.
Test D - Slapdown: In this test, the cask axis is held at 15' from the horizontal with the lowest pointof the cask assembly at 9 meters from the impact surface. The orientation is such that the top endimpact limiter impacts the surface first and the bottom end impact limiter experiences the secondaryimpact.
Each of the four tests has distinct impact characteristics. For example, in the "side drop" testboth impact limiters will strike the target simultaneously; only one impact limiter sustains impactin the "end drop" test. The CGOC test involves a primary impact on one impact limiter at anangle such that the gravity vector is oriented with a line passing through the cask center ofgravity and the lowest corner of the limiter. Finally, the slapdown test involves impact at bothimpact limiters with a very slight time separation. These four tests are deemed to adequatelyrepresent the limiting impact scenarios under the hypothetical accident conditions of1OCFR71.73.
The torque values used to secure the attachment bolts in the scale model package warrant specialmention. The impact limiter attachment bolts serve two major functions during transportation:
1. During normal transport, the attachment bolts ensure that the impact limiters remainattached to the HI-STAR 100 overpack during a 1Og axial deceleration as mandatedby IOCFR71.45, and during exposure to normal vibratory loading that mayreasonably be expected during the course of a normal transport operation. To ensureagainst loss of attachment due to vibratory loading during normal transport, an initialbolt pre-stress of 30,000 psi has been set, based on common engineering practice. Forthe bolt diameters specified for the HI-STAR 100 package, the pre-load torque is 245ft-lb. and 1,500 ft-lb for the top and bottom impact limiter attachment bolts,respectively.
2. During the hypothetical accident, the attachment bolts ensure that the impact limitersremain attached to the HI-STAR 100 overpack during and after the impact with theunyielding surface.
The bottom impact limiter is attached to the overpack by 16 bolts aligned with the longitudinalaxis of the overpack and arranged in a circular pattern (Figure 2.A.5.4 shows the bottom view ofthe one-quarter scale replica). These bolts perform their function by developing tensile stress toresist loading during the hypothetical accident. Because of close clearances with the overpackshielding, the bottom impact limiter also has a set of eight circumferentially arranged alignment
HI-STAR SAR Proposed Rev. 13cREPORT HI-951251 2.A-1 I

pins that fit into mating holes in the overpack bottom plate. These mating holes are pluggedwhen the impact limiter is not in place.
The top impact limiter is .attached to the overpack using twenty radial bolts that are. designed toresist relative motion and transfer loads by shear (Figure 2.A.5.3 shows the top view of the one-quarter scale replica).
Although the attachment analyses do not require pre-load (by application of an initial bolttorque) to demonstrate that the required performance during normal transport conditions isachieved, the presence of pre-load serves only to enhance the performance of bolting whichresists loads by developing tensile bolt forces (bottom impact limiter attachment bolts). Pre-stress in the bottom impact limiter attachment bolts serves to develop an interfacial pressurebetween the two components being joined together. This interfacial pressure acts as a reserveagainst separation at the interface of the impact limiter and the overpack when the external forceor moment act to separate them during the drop event. The actual tensile stress bolt will risesignificantly over the initial pre-stress if and only if the external load acting to break apart theinterface is large enough to cancel out the interfacial pressure.
The effect of pre-load on the performance of bolting that resists loads by shear (top impactlimiter attachment bolts) is different. The presence of both tensile stress (due to bolt pre-load)and shear stress in the bolt (due to the impact loads in a drop event) will increase the maximumprincipal stress in the bolt, which will consequently reduce the shear capacity of the bolts.Applying a pre-load in excess of the required amount in the 1/4 scale HI-STAR 100 drop testswill therefore result in a conservative evaluation of the top impact limiter attachment bolts.
Based on the initial torque values set in the full-scale package, the appropriate bolt pre-loadtorque for the 1/4-scale impact limiter attachment bolts is (to the nearest foot-pound):
Top impact limiter (radial) bolts: 4 ft-lb. (full scale equivalent = 245 ft.-lb)Bottom impact limiter (axial) bolts: 23 ft-lb. (full scale equivalent =1500 ft.-lb.)
Since a bolt pre-load will enhance the performance of bolts (located at the bottom impact limiterinterface) that resist loading by developing tensile stress, the bolt torque was conservatively setat 20 ft-lb. or below for the bottom impact limiter bolts. Since a bolt pre-load will degrade theperformance of bolts (located at the top impact limiter interface) that resist loading bydeveloping shear stress, the bolt torque was conservatively set at 4 ft-lb. or above for the topimpact limiter bolts.
The end drop onto the top impact limiter tests the resistance of the twenty radial attachment boltsagainst failure from shear. The use of an initial torque value (15 ft-lb.), in excess of 4 ft-lb., isconservative for evaluation of the performance of the bolts to resist shearing strains (i.e., asnoted earlier, due to an interaction relation between tension and shear, the presence of any tensilestrain will reduce the allowable shear strain prior to failure).
HI-STAR SAR Proposed Rev. 13cREPORT HI-951251 2.A-1 2

The C.G. over comer drop used an initial torque of 15 ft-lb., a value below the mandated valueof 20 ft-lb. on the bottom impact limiter. This is again conservative for the evaluation of theperformance of the bottom impact limiter attachment bolts, since the presence of additionalprestress would enhance the ability of the bolts to retain the impact limiter in position.
The slapdown test was performed using low initial bolt torque values for both impact limitersthat simulated "hand-tight" values. Thus, there is almost no contribution from pre-load on thebolts on either impact limiter. In the slapdown drop, the bottom impact limiter experienced thelargest deceleration. This test demonstrated that the use of a lower pre-load on the most highlyloaded attachment bolt does not affect the ability of the bolts to perform their required function.
Finally, the final side drop used the bolt pre-loads that correlate with the final bolt pre-loadsspecified (top impact limiter - 4 ft-lb.; bottom impact limiter - 20 ft-lb.) for the one-quarter scaletests.
A minimum of five calibrated unidirectional accelerometers was installed on the test package foreach test. Schematics of the accelerometer locations and numbering system for all four tests arepresented in Figures 2.A.5.5 and 2.A.5.6.
The accelerometers are placed at three axial locations along the height of the overpack model and atdifferent circumferential locations at each axial location. The placement of the accelerometersaxially reflects locations consistent with the detailed 2-D finite element analyses of the MPC thatconservatively neglected the effect of stiffening provided to the MPC shell by the MPC baseplate.Figure 2.A.5..2 shows the three cutouts of the outer 5/8" thick cylinder that are machined flat toposition the accelerometers. The following table provides the locations of the accelerometers.
HI-STAR SARREPORT H1-951251
Proposed Rev. 13c2.A-1 3

ACCELEROMETER LOCATIONS FOR ONE-QUARTER SCALE DROP TESTSNUMBER TOP END DROP SIDE DROP SLAPDOWN CG-OVER-CORNER
Axial Peripheral Axial Peripheral Axial Peripheral Axial Peripheral(inch) (degrees) (inch) (degrees) (inch) (degrees) (inch) (degrees)
44.781 0 5 0 44.781 0 5 0252 25 0 25 0 25 0 5 +1203 5 0 44.781 0 5 0 5 -1204 44.781 +120 25 +90 44.781 +120 44.781 05 44.781 -120 25 -90 44.781 -120 44.781 +1206 5 +120 -- 5 +120 44.781 -120
Notes:1. All accelerometer axial distances measured from top end surface of overpack model
(without impact limiters in place).2. Peripheral locations measured from plane containing accelerometer #1; clockwise
direction, viewed from Section A-A in Figures 2.A.5.5 and 2.A.5.6, is positive.
In addition to recording the deceleration during impact, a high-speed camera and a video camerawere used to record the test events. The high-speed camera was used to confirm orientation anglesjust prior to impact and to aid in the evaluation of extent of crush subsequent to the test. The testswere conducted by attaching the 1/4 scale package to a 15-ton mobile crane through appropriaterigging and lifting the package to the required height. An electronically activated guillotine-typecable cutter device was used for releasing the package for free fall. An array of photographs labelledFigures 2.A.5.7 through 2.A.5.13 provide pre-test and post-test visuals of the package. Thesephotographs show quite clearly that the post-crush impact limiters maintained their own physicalintegrity and the attachments to the overpack scale model suffered no failures.
The following acceptance criteria for the scale model dynamic drop tests were identified in the TestPlan [2.A. l]:
Filtered decelerations limited to a maximum of 60g's (after scaling to full-scale geometry)for all drop orientations.
* No impact of the cask body on the target surface.
No separation of impact limiters from the cask body through the entire drop event.
2.A.5.2 Results of First Series of Drop Tests
The first series of three one-quarter scale drop tests (types A, B, and C denoted above) wereperformed in August 1997 and produced significant information [2.A.5]. Table 2.A.1 shows themaximum filtered decelerations registered in the three one-quarter scale tests after the test results arescaled up to the full-scale AL-STAR (by dividing test results by four).
HI-STAR SARREPORT HI-951251
Proposed Rev. 13c2.A-14,

Table 2.A.1: Peak Decelerations from August 1997 Tests
Test I.D. Orientation Deceleration (g)A. End Drop 134B. C.G.-Over-Comer 37.84C. Side Drop 51.3
The peak filtered deceleration in the first end-drop test was clearly above the 60g-design limitestablished for the HI-STAR 100 design. The reasons for this discrepancy were determined to be theuse of a low value of the dynamic multiplier assumed in designing the impact limiter, and the lack ofpre-crush of the honeycomb material. Numerical analyses also indicated that the honeycombcompression modulus was dependent on the impact limiter velocity during the drops. This confirmslaboratory data available in the historical literature [2.A.9]. The velocity and decelerationinformation obtained from the first round dynamic drop tests enabled development of a simpledynamic correlation multiplier to be applied to the honeycomb material's static F-d behavior. Thismultiplier is an additional "experimentally based" input term in the computer prediction model forsimulation of dynamic drop events [2.A.6]. Data from the initial test series shows that this multiplieris independent of test orientation and is a function of the ratio of crush velocity during the crushingprocess divided by the impact velocity at the initiation of crush. Based on the numerical analysis ofthe August 1997 tests, the honeycomb material was appropriately revised with new crush strengthsand new sets of 1/4 scale model impact limiters were manufactured. The correlation of the August1997 quarter-scale tests with the numerical results from the computer model is presented in section2.A.6.
In summary, the chief contribution of the August tests, therefore, lay in providing the database toquantify the crushing characteristic of the honeycomb material under dynamic conditions [2.A.6].Since none of these tests is ascribed to confirmation of the final performance of the AL-STARimpact limiters, no accelerometer raw or filtered results are included herein. The full set ofacceleration data (both raw and filtered) is provided in [2.A.5].
2.A.5.3 Results of the Second Series of Drop Tests
The second round of one-quarter scale dynamic drop tests, conducted in December 1997 andFebruary 1998, using the new (lower crush strength) impact limiter materials, occurred in threephases. The first phase consisted of the top end drop, CGOC drop, and side drop tests. While thedecelerations in all cases were within the design limit, the attachment system for the bottom impactlimiter did not survive the side drop test. The attachment system was redesigned prior to theremaining (slapdown) test. The slapdown test is considered to be the most definitive test of thecask/impact limiter attachment integrity. The slapdown test was successfully completed, with thebottom impact limiter remaining in place during and after the secondary impact, on December 29,1997 in Phase 2 of the second test series. In order to confirm the adequacy of the attachment systemunder side drop conditions, the side drop test was repeated in February 1998 during Phase 3. Thistest reconfirmed the attachment system integrity.
HI-STAR SAR Proposed Rev. 13cREPORT HI-951251 2.A-15

The results from the second round test series demonstrates that the HI-STAR 100 package meets alltest acceptance criteria, namely:
Appropriately filtered decelerations of less than 60g's (after appropriate scaling to reflect thefull-size mass and geometry) for all tested orientations;
All attachment bolts remained intact, ensuring that the impact limiters do not separate fromthe cask body through and after the drop event;
No impact of the cask body on the target surface.
Figures 2.A.5.14 through 2.A.5.21, drawn from reference 2.A.7, provide the raw (unfiltered) andfiltered deceleration time-histories for each of the four drop scenarios for the key accelerometersused to assess package performance. The accelerometer station numbers indicated in theseaccelerograms are located by referring to Figures 2.A.5.5 or 2.A.5.6, as applicable. The test report[2.A.7] provides the necessary background to justify the use of this data to evaluate packageperformance. The following remarks are pertinent concerning the results presented in Figures2.A.5.14 through 2.A.5.21.
End Drop Decelerations (Figures 2.A.5.14, 2.A.5.15, and 2.A.5.15a-c)
All accelerometers for this test recorded decelerations in the direction of crush. Two accelerometerswere subsequently determined to be defective (documented in [2.A.7]). The figures show the raw,the filtered response at 450Hz cut-off frequency, and a combined plot of the raw and filtered datacovering a reduced time period. All of these results are obtained from the records from the workingaccelerometers. All working accelerometers gave essentially identical response; the final evaluationof performance presented herein is the average of the response from the accelerometers deemed tobe recording correctly. Figures 2.A.5.15b and 2.A.5.15c demonstrate that the sensitivity to cut-offfilter frequency is small even up to 1250Hz.
Center of Gravity Over Comer Decelerations (Figures 2.A.5.16, 2.A.5.17, and 2.A5.17a)
The CGOC test was performed immediately after the end drop using the same set of accelerometers.The evaluation of the data after this test clearly determined that the same two accelerometers deemedsuspect in the end drop test was also providing erroneous date here. Subsequent independent plateimpact tests that definitively showed that these accelerometers were indeed faulty are documented in[2.A.7]. The acceleration data in the figures represents the vertical acceleration obtained byappropriate combination of the raw time data from the longitudinal and lateral mountedaccelerometers on the inclined scale model cask. The raw vertical accelerations were then subject tofiltering to remove non-rigid body behavior. Raw, filtered, and combined raw and filtered data overthe strong response time period are presented.
HI-STAR SAR Proposed Rev. 13cREPORT HI-951251 2.A-1 6

Slap Down Decelerations (Figures 2.A.5.18, 2.A.5.19, and 2.A.5.19a)
Although the initial release of the package was at an angle of 15 degrees from the horizontal, thehigh-speed camera showed that impact occurred with the overpack longitudinal axis at an angle of7.2 degrees from the horizontal. The numerical simulation of this test reflected the actual angle ofimpact rather than the initial setting at nine meters. The results for all accelerometers (raw data andfiltered) are provided in [2.A.7]. The raw and filtered data presented in the figures here represent thedeceleration at the bottom end of the package that experiences the larger magnitude secondaryimpact. Numerical analysis demonstrated that the peak deceleration from secondary impact isinsensitive to impact angles between 5 and 12 degrees from the horizontal and decreases as the angleincreases above 12 degrees. Raw, filtered, and combined raw and filtered data over the strongresponse time period are presented.
Side Drop Decelerations (Figures 2.A.5.20, 2.A.5.21, and 2.A.5.21a)
Both impact limiters are supposed to impact the target simultaneously in this test. An evaluation ofthe individual accelerometer data and an examination of the high-speed camera film clearlyindicated that there was a small angle existing between the overpack longitudinal axis and the targethorizontal surface at the moment of impact. This caused the expected result that accelerometerreadings at one end of the package were slightly higher than readings at the other end. The results forraw and filtered data represent results obtained by averaging the data from the accelerometers at theends of the package. Raw, filtered, and combined raw and filtered data over the strong response timeperiod are presented.
The filter frequency used for the End Drop and CGOC Drop is 450 Hz. The filter frequency used forthe Slap Down and Side Drops was 350 Hz. These filter frequencies were established byexamination of the power spectral density function for each raw data trace that clearly showed thatthe majority of the energy occurred at frequencies well below the cut-off frequency. Independentconfirmation of the appropriateness of the cut-off frequencies was made by determining the lowestfrequency of elastic vibration of the package acting as either a bar or a simply supported beam. Asdescribed above, the sensitivity to cut-off frequency was examined for the end drop case by re-analyzing the data for three cut-off frequencies.
Table 2.A.2 provides the peak deceleration data culled from the above-mentioned accelograms forthe four drop scenarios after filtering to remove high frequency effects. The table contains the resultsfrom the actual 1/4-scale experiments scaled up to the full-size packaging. The test report [2.A.7]provides the detailed information on this final one-quarter scale dynamic drop test series with rawand filtered outputs from all accelerometers. The test report also includes details on the filteringmethodology, on the data reduction, and on the evaluation of the performance of the variousaccelerometers used in each of the tests.
HI-STAR SAR Proposed Rev. 13cREPORT HI-951251 2.A-17

In all of the four final one-quarter scale dynamic drop tests, the impact limiter attachmentssuccessfully performed without a single attachment bolt failure (ensuring that the impact limiters didnot separate from the overpack), rigid body decelerations were below 60 g's, and the cask body didnot contact the unyielding target surface. Also, additional crush margin remained in the aluminumhoneycomb material.
Table 2.A.2: Peak Decelerations from AL-STAR TM Drop Tests (Second Series)
PeakTest Case Orientation Decelerations (g)
A End-Drop 53.9B C.G.-over-Comer 38.8C Side Drop 45.7D Slap-Down 59
2.A.6 Phase 5: Numerical Prediction Model for Dynamic Analysis.
The numerical prediction model for dynamic drop events utilizes the previously discussed force-crush (F-d) model and incorporates the information into the dynamic equations of equilibrium.Using the procedure discussed previously, the static F-d curves for the AL-STAR impact limiterunder the four drop scenarios are readily constructed. Figures 2.A.6.1 to 2.A.6.4, respectively,provide the static force vs. crush plots for the full scale impact limiter with test orientations fordrop cases A, B, C, and D (primary impact). An appropriate analytical fit for each curve isdeveloped using the commercial graphing package Deltagraph [2.A.8]. Figures 2.A.6.1 through2.A.6.4 also provide curves for upper and lower bound material strengths.
We now discuss the application of the F-d model to the prediction of impact limiter performancein a dynamic drop environment. In symbolic form, we can write the static resistive (crush) force,F, as a function of the crush depth, A, where a zero value for A represents an uncrushedcondition.
F = f(A)
The above symbolic formula represents the data on Figures 2.A.6.1 to 2.A.6.4 in analytical form.We have previously explicitly discussed the mathematical concepts underlying the aboveformulation by referencing the particular case of a side drop. In general, the static F-d curve canbe expressed as a sum of local crush pressures multiplied by interface areas where the interfaceareas may be a function of the current crush. That is, the mathematical relation for staticcompression (which is validated by comparison to static testing) is also expressible in the form
HI-STAR SAR Proposed Rev. 13cREPORT HI-951251 2.A-1 8

f(A) j-pA,
where pi are the crush pressures of the materials participating in the crush and Ai are theinterface areas associated with the different crush strengths. The determination of the areas Ai asa function of crush depth, A, has previously been discussed within the context ofinterpenetration.
The dynamic model for simulating a packaging drop event consists of solving the classicalNewtonian equations of motion. In the case of a unidirectional impact such as an end drop(0'=90'), side drop (0=0), or CGOC drop, the equation of motion simply reduces to:
M dA Force + Mgdt2
where: M = mass of system undergoing deceleration
d2A/dt2 = second derivative of package movement (which is equal to the impactlimiter crush because the target is immovable and rigid).
The resistive "Force" opposes the downward movement and is given by the static force-crushfunctional relationship (appropriate for the drop orientation) multiplied by a dynamic multiplierZ. As noted earlier, there is historical evidence that metal honeycomb crush pressure is a linearfunction of velocity [2.A.9]. The Holtec correlation of the August 1997 test data by numericalsimulation [2.A.6] also confirmed that the best correlation is achieved if the dynamic multiplieris represented by a linear function of local crush velocity (dA/dt). Introducing the dynamicmultiplier, the dynamic equation of force equilibrium for a case involving only primary impactsbecomes
Md =2 ZF + Mg = Zf(A)+ Mg
The above equation is a second order non-linear differential equation in the time coordinate t,which can be solved for the post-contact event using any standard equation solver package. Theinitial condition is: @ t = 0, A = 0, dA/dt = Vo (approach velocity at impact). We note that sincethe acceleration is an explicit function of both deformation and velocity, maximum accelerationwill not, in general, occur at the instant when the velocity of the package is zero.
If the impact event involves both primary and secondary impacts, as is the case for the slapdownevent (indeed any event wherein 0<67.50), then both the mass M and rotational moment ofinertia I are involved. The modeling of a dual impact event is only slightly more involved than
HI-STAR SAR Proposed Rev. 13cREPORT HI-951251 2.A- 19

the single variable modeling of the single impact case discussed above. Figure 2.A.6.5 pictoriallyillustrates the sequence of events leading to an appropriate mathematical model. Figure 2.A.6.6provides the appropriate free-body diagrams associated with each portion of the event.
In the first step, the inertia force of the falling package is resisted by the crush force developed atthe primary impact location. While the downward momentum of the package is dissipated by theresistive force, the package also experiences the overturning couple produced by the non-co-linearity of the inertia force (which acts at the centroid) and the resistive force which acts at theprimary impact zone (Figure 2.A.6.5(a)). The dynamic equation of force equilibrium is givenabove in terms of the downward movement of the package centroid and the resistive force staticcompression curve, modified by the dynamic factor Z, appropriate to the initial orientation atprimary impact. The package decelerates and then begins to overturn, in effect pivoting about theinitial point of contact in the primary impact region, gathering angular momentum as the secondimpact limiter (mounted at the far end) approaches the target surface. Referring to Figure2.A.6.5(b), the dynamic equation insuring moment equilibrium during the overturning (beforethe initiation of the secondary impact) phase can be written as
I p = -MgR cos(q)dt2
where Ip: moment of inertia of the package about the pivot point
angular acceleration with respect to the horizontal plane
R: radial distance of the package C.G. with respect to the pivot point.
The initial conditions for this phase are: t= 0, 4 = 0, d4/dt = 0 where t is now redefined at theinitiation of rotational motion.
Finally, the secondary impact commences wherein the angular momentum of the package plusany linear momentum not dissipated by the primary impact is dissipated by the crushing of thesecond impact limiter. During the secondary impact phase, the equation of dynamic momentequilibrium can be written by inspection of Figure 2.A.6.5(c):
Sdt2 = - MgR cos(qb) + Zf (Db)D
where f(Dý) is the static resistive force at the secondary impact location under compression D4,Z is the current dynamic multiplier appropriate to the secondary impact location, D is themoment arm, and Ip is the moment of inertia of the package about the pivot point. During thisphase of the motion, the equation of dynamic force equilibrium is modified to reflect dynamicresistive forces from both impact limiters since the entire package may continue to move toward
HI-STAR SAR Proposed Rev. 13cREPORT HI-951251 2.A-20
the target surface with both impact limiters providing a dynamic resistive force. Therefore,during the final phase of the impact event, the dynamic force equilibrium equation can be writtenas
Md2AzM = ,+ Z2F2 +M9
where Zi and F, (i=1,2) represent the dynamic multiplier and static compression forceappropriate to the primary and secondary impact limiter behavior during the final phase of theevent. The dynamic multipliers Zi (i =1,2) reflect the current value of the local crush velocitiesat each of the limiters.
The above formulation assumes, for simplicity, that the pivot point does not slide during theoverturning or secondary impact phases.
It is evident from the foregoing that the impact limiter is essentially simulated by a non-linearspring whose static force-deformation curve is known a' priori (from the F-d model) as afunction of the drop orientation. The solution of this rigid body dynamics problem featuring upto two non-linear springs can be determined using any one of several standard software packagesavailable in the public domain. Holtec International utilizes the commercial package WORKINGMODEL [2.A. 10], which has been validated in the company's QA system for this purpose.
The dynamic simulation model, constructed in the manner of the foregoing, was utilized tosimulate all seven one-quarter scale drop events (three in the first series, four in the secondseries). In order to develop a high level of confidence, it was decided that the model should bevalidated at all three levels, namely, a comparison of acceleration, crush, and duration of impact.In other words, to be acceptable, the numerical prediction model must predict aXmax, maximumcrush sustained d max, and the duration of impact, with reasonable accuracy. Since the actualcrush d max could be measured, and the duration of impact and camax were available fromaccelerometer data, comparison between theory and experiment with respect to all three keyindicators was possible. Tables 2.A.3 and 2.A.4 provide the results in a concise form for all ofthe one-quarter scale dynamic drop tests for the first and second series, respectively.
Note that in the tables, the comparison is made after scaling up the model results to reflect a full-scale package.
HI-STAR SAR Proposed Rev. 13cREPORT HI-951251 2.A-21

Table 2.A.3: Comparison Between Test Data and Prediction Model Results (First Test Series)
Total Crush Impact DurationDeceleration (g's) Depth (inch) (milli-seconds)
Case I.D. Predicted Measured Predicted Measured Predicted MeasuredA. End-Dp 134.2 134.0 2.42 2.42 3.5 Not measuredDrop
B. C.G.O.C. 37.8 37.84 16 16 13.25 16.6C. SideDo 50.5 51.3 9.1 9.51 8.25 10.74Drop
Table 2.A.4: Comparison Between Test Data and Prediction Model Results (Second Test Series)
Deceleration (g's) Total Crush Depth Impact Duration(inch) (milli-seconds)
Case I.D. Predicted Measured Predicted Measured Max. Predicted MeasuredAvailable
A. End Drop 53.0 53.9 11.3 10.6 17.659 38.8 37.2B. C.G.-Over- 38.7 38.8 12* 9.82* 25.06 51.0 61/45.2ComerC. Side Drop 53.1
43.5 45.7 10.9 12.5 16 38.5 (averagedvalue)
D. Slap-Down
Primary 46.4 49.0 9.50 10.7 16 48.5 44.4
Secondary 59.9 59.0 12.8 13.5 16 35.8 41.2
* For C.G.-Over-Corner, only crush at the external interface is measured.
It is evident from both Tables 2.A.3 and 2.A.4 that the numerical prediction model is robust inpredicting all seven impact tests. Not only are peak values of (Xmax for each test predicted withgood agreement, but also the crush depth and impact duration is also reliably simulated.
A perusal of the numerical results in Table 2.A.4 yields two additional insights into the behaviorof AL-STAR which are most helpful in the "fine tuning" of the full-scale AL-STAR design:
The maximum deceleration, Utmax, predicted as well as measured, under the most limitingscenario (slapdown), is close to the permissible limit of 60g's.
ii. The maximum crush, predicted as well as measured, in all drop scenarios, is well belowthe available limit (i.e., the value at which the crush material will "lock up").
HI-STAR SARREPORT HI-951251
Proposed Rev. 13c2.A-22

The state-of-the-art manufacturing technology for aluminum honeycombs permits the material tobe manufactured within a total tolerance range of 12 to 13% (between the maximum andminimum values). The above observations suggest that the upper and lower bound range of crushpressures for the honeycomb material in the AL-STAR impact limiter should be set at 95% and82% of the values of honeycomb material used in the second series quarter-scale tests.
Finally, the agreement between the predictions and measured data in the above correlation effortfosters a high level of confidence in the numerical model, which can now be used to conductsensitivity studies.
2.A.7 Phase 6: Simulation of the Effects of Material Crush Strength Variation, PackageMass Tolerances, and Oblique Drop Orientations
Having ensured the technical reliability of the numerical prediction model, it is now necessary toevaluate the system behavior under all "limiting conditions". As noted earlier, the impact limitermaterials are insensitive to environmental temperature changes within the limits of -20' F and1000 F. Therefore, limiting conditions are broadly defined here as arising from two sources:
i. Variation in the impact limiter honeycomb crush strength due to materialmanufacturing tolerance.
ii. Variation in the package weight (due to different MPC types that may betransported in the HI-STAR 100 overpack, and manufacturing tolerances infabrication of the overpack and impact limiters).
iii Variation in package angle of impact with the target.
To examine all limiting scenarios, additional simulations using the mathematical model wereperformed. The crush strength of the honeycomb material was varied within the range permittedin the Holtec Drawing 1765. The packaging weight was set at its upper bound and lower boundvalue (upper bound weight is 280,000 lb., and lower bound weight is 270,000 lb. based on valueslisted in Table 2.2.1). Three additional drop orientations (30 degree, 45 degree, and 60 degreeorientation angle, measured from the horizontal) that were not the subject of tests were alsoanalyzed numerically using input crush strength data that would maximize the decelerations withan average weight. The purpose of these additional simulations with varied drop angle is toascertain which, if any, oblique drop orientation merits detailed finite element stress analysis tomeet the requirements of the Regulatory Guide. Figures 2.A.7.1-2.A.7.3 provide the static crushforce vs. crush depth information used in the dynamic simulation of these accident events. Table2.A.5 provides key output data, peak decelerations and maximum crush, as obtained from thesenumerical simulations.
HI-STAR SAR Proposed Rev. 13cREPORT HI-951251 2.A-23
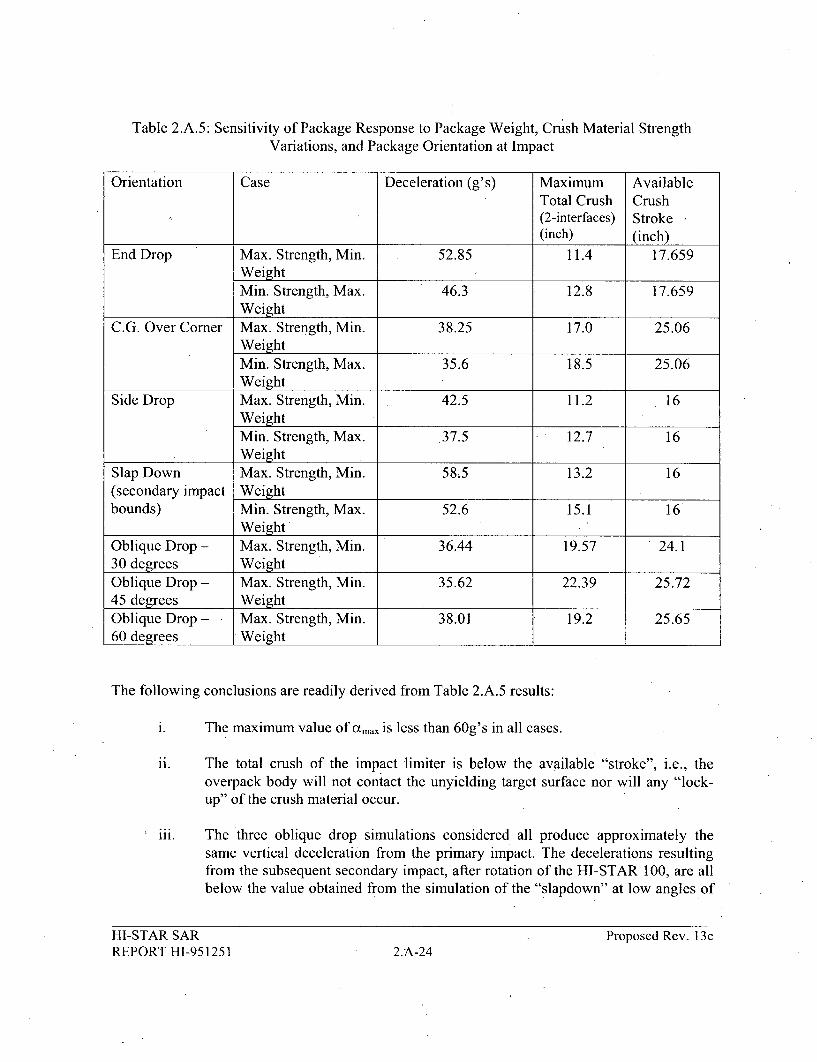
Table 2.A.5: Sensitivity of Package Response to Package Weight, Crush Material StrengthVariations, and Package Orientation at Impact
Orientation Case Deceleration (g's) Maximum AvailableTotal Crush Crush(2-interfaces) Stroke(inch) (inch)
End Drop Max. Strength, Min. 52.85 11.4 17.659WeightMin. Strength, Max. 46.3 12.8 17.659Weight
C.G. Over Corner Max. Strength, Min. 38.25 17.0 25.06WeightMin. Strength, Max. 35.6 18.5 25.06Weight
Side Drop Max. Strength, Min. 42.5 11.2 16WeightMin. Strength, Max. .37.5 12.7 16Weight
Slap Down Max. Strength, Min. 58.5 13.2 16(secondary impact Weightbounds) Min. Strength, Max. 52.6 15.1 16
WeightOblique Drop - Max. Strength, Min. 36.44 19.57 24.130 degrees WeightOblique Drop - Max. Strength, Min. 35.62 22.39 25.7245 degrees WeightOblique Drop - Max. Strength, Min. 38.01 19.2 25.6560 degrees Weight
The following conclusions are readily derived from Table 2.A.5 results:
1. The maximum value of uXmax is less than 60g's in all cases.
ii. The total crush of the impact limiter is below the available "stroke", i.e., theoverpack body will not contact the unyielding target surface nor will any "lock-up" of the crush material occur.
iii. The three oblique drop simulations considered all produce approximately thesame vertical deceleration from the primary impact. The decelerations resultingfrom the subsequent secondary impact, after rotation of the HI-STAR 100, are allbelow the value obtained from the simulation of the "slapdown" at low angles of
HI-STAR SARREPORT HI-951251
Proposed Rev. 13c2.A-24

impact. If the "limiting" oblique drop is considered as the simulation providingmaximum deceleration perpendicular to the longitudinal axis of the cask, then thedrop most likely to develop the largest bending of the overpack in the obliqueorientation is at 30 degree orientation (from the horizontal axis). Therefore, thiscase is subjected to detailed stress analysis in Section 2.7 with the applied-impactloading (along and perpendicular to the cask axis) balanced solely by the caskinertia forces and moments.
In conclusion, the above work provides full confidence that the HI-STAR 100 packaging willperform in the manner set forth in the NRC regulations (IOCFR71.73) under all conceivablehypothetical accident conditions of transport.
2.A.8 One-Foot Drop
Paragraph 2.6 of Reg. Guide 7.8 requires evaluation of the package response under a one-footdrop onto a flat unyielding surface in a position that is expected to inflict maximum damage.
Using the prediction model, the maximum deceleration sustained by the package under the one-foot end and side drop scenarios, the latter expected to produce maximum stress in the fuelbasket, was computed. Table 2.A.6 provides summary results for the limiting case of minimumpackage weight and upper bound material crush strength (so as to maximize the decelerations).
Table 2.A.6: Peak Decelerations Under One-Foot Drop Event
Max. Deceleration in Duration of ImpactScenario g's Crush (inch) (milli-seconds)
900 End Drop 17.25 0.85 20.00' Side Drop 11.45 1.33 26.0
2.A.9 Equivalent Dynamic Factor (EDF)
It is instructive to compute an effective equivalent dynamic factor on the predicted static crushforce corresponding to the instant of maximum deceleration during the drop event. Table 2.A.7presents the pseudo-deceleration (obtained by dividing the static force by the mass of thepackage) and the predicted deceleration; the ratio of the two is the "equivalent dynamic factor"(EDF). The EDF is also equal to the peak dynamic crush force divided by the static resistanceforce at the coincident instance of crush when the dynamic crush force is maximized. Note thatthe differences in package weight used in the table below reflect the actual weight of the impactlimiters used in each one-quarter scale drop test (after increasing to full-scale equivalent values).
HI-STAR SAR Proposed Rev. 13cREPORT HI-951251 2.A-25

Table 2.A.7: Equivalent Dynamic Factor (EDF) for Different Drop Scenarios
Predicted Force (lbs) Predicted Max.x 10-7 Deceleration
Participating Pseudo- DynamicPackage Accn (from Table
Scenario Static Dynamic Weight (lbs) static 2.A.4 EDF
End Drop 1.0785 1.454 274,336 39.313 53 1.348CGOC 0.8 1.059 273,680 29.231 38.7 1.324Drop
Side Drop 0.4 0.597 137,270* 29.14 43.5 1.493Slapdown 0.345 0.6607 t - 59.9 1.915
* Only half of the total package weight participates at each impact limiter.t Indeterminate for this drop configuration.
The last column of the above table demonstrates that the EDF, as defined above, is not a constantvalue independent of drop orientation.
2.A. 10 Additional 1 / 8th Scale Static Tests
Three additional static crush tests on 1 / 8th scale impact limiters have been performed subsequentto the completion of all quarter-scale dynamic testing and theoretical correlation. The F-d testresults for each of three impact limiter orientations are compared with the analytical F-dpredictions in Figures 2.A. 10.1-2.A. 10.3. Figure 2.A. 10.1 compares test results with theoreticalprediction for the crush orientation corresponding to a side impact, Figure 2.A. 10.2 presents theresults for the Center-of-Gravity-Over-Corner impact orientation, and Figure 2.A. 10.3 presentsresults for the end impact orientation. In all tests, the crush material orientation and locationduplicated the final configurations subjected to quarter-scale tests. The internal backbonestructure was also faithfully reproduced. The welds were also scaled to the extent practical giventhe thin material gages used for the one-eighth-scale model. In the three figures, the solid linewithout symbols represents the predictions of the theory developed for the F-d curves, whilefilled circles represent test results. Within the range tested for each orientation, good agreementis observed between theory and test for the side and CGOC crush orientation. For the end droporientation, however, the tested results suggest that inclusion of some elastic behavior at thecask-impact limiter interface into the theory might improve the static correlation. The dynamictest results presented in Table 2.A.4, however, demonstrate conclusively that the prediction ofpeak deceleration, extent of crush, and impact duration would not be affected by these elasticeffects that "smooth" the abrupt "staircase" shape of the F-d curve.
HI-STAR SARREPORT HI-951251
Proposed Rev. 13c2.A-26

2.A.1 I Conclusions
The AL-STAR impact limiter design was subjected to a series of static and dynamic tests tovalidate its functional performance. The 1/8 model static tests conducted under cold and hot, aswell as ambient conditions, confirmed that AL-STAR's functional characteristics areindependent of the environmental temperature conditions in the range specified in lOCFR71.73.The successful static tests on the 1/8 scale model (namely, end test and 600 oblique test) alsocorrelated well with the theoretical force-crush model developed by Holtec. Subsequent statictests, performed after the final successful one-quarter scale dynamic tests, provided additionalconfirmation of the validity of the fundamental F-d model.
The static compression tests were followed by quarter-scale drop tests. The first series, in August1997, consisting of three tests, provided the necessary test data to determine the dynamicmultiplier applicable to the honeycomb materials. The numerical model for simulating thedynamic crushing of AL-STAR showed good agreement with the first test series data when thecorrect dynamic factor was incorporated in the computer model (Table 2.A.3).
While the prediction model for simulating AL-STAR crushing under 9-meter drop conditionswas extremely well correlated, the peak deceleration under the end- drop condition in the August1997 tests exceeded the acceptance criteria.
The second series of tests wherein the crush strength of the honeycomb was lowered (as selectedby the prediction model), performed as expected. The agreement between the test data and theprediction model is high (Table 2.A.4).
The prediction model for AL-STAR therefore stands correlated with seven (7) quarter-scaledrop events. The first three tests used different honeycomb crush strength materials than the lastfour, proving the ability of the prediction model to predict the AL-STAR crush performance fora wide range of crush material properties. The backbone structure of AL-STAR, enhanced afterthe 1/8-model static compression tests, performed as designed in all seven quarter-scale droptests.
Finally, the AL-STAR-to-overpack attachment system remained intact and the cask did notcontact the unyielding target during all four final dynamic tests.
HI-STAR SAR Proposed Rev. 13cREPORT HI-951251 2.A-27

2.A. 12 References
[2.A.1]
[2.A.2]
[2.A.3]
[2.A.4]
[2.A.5]
[2.A.6]
[2.A.7]
[2.A.8]
[2.A.9]
[2.A.10]
[2.A.11]
ANSYS 5.3 Ansys Inc., 1996.
CADKEY, Version 7, 1996.
Project Procedure No. HPP-5014-5, HI-STAR Aluminum Honeycomb 1/8Scale Impact Limiter Static Test Procedure.
HI-STAR 1/8 Scale Impact Limiter Test Report, HI-961501, HoltecInternational, June 1996.
Holtec Report HI-971774, Revision 1, "Impact Limiter Test Results - 30'Drop Tests" - August 1997
Holtec Report HI-971823, Revision 0, ."Improved Correlation of ORNL30' Drop Tests" - August 1997
Holtec Report HI-981891, Revision 3, "Impact Limiter Test Report -
Second Series", 2007.
Deltagraph Pro 3.5, Deltapoint Software, 1995.
J.M. Lewallen and E.A. Ripperger, Energy Dissipating Characteristics ofTrussgrid Aluminum Honeycomb, SMRL RM-5, University of TexasStructural Mechanics Research Laboratory, 1962.
Working Model 3.0, Knowledge Revolution, 1995.
HI-STAR 100 Impact Limiter Test Program, Holtec Report No. HI-951278.
HI-STAR SARREPORT HI-951251
Proposed Rev. 13c2.A-28
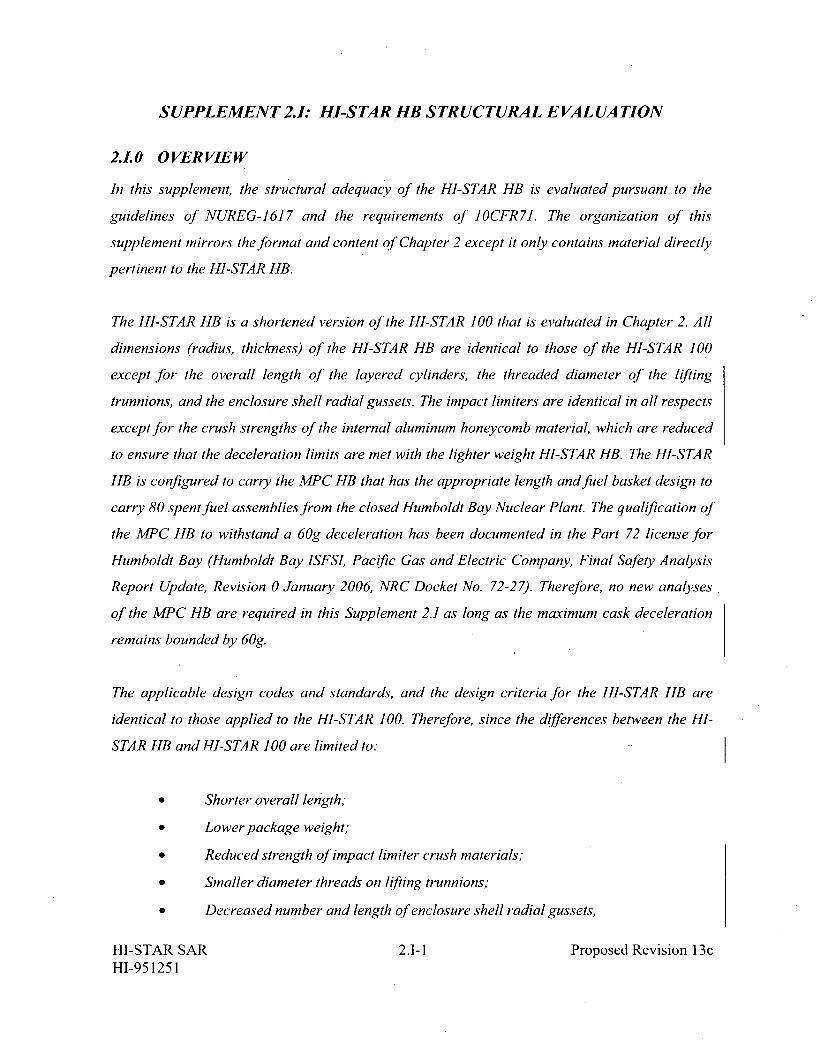
SUPPLEMENT 2.1: HI-STAR HB STRUCTURAL EVALUATION
2.1.0 OVERVIEW
In this supplement, the structural adequacy of the HI-STAR HB is evaluated pursuant to the
guidelines of NUREG-1617 and the requirements of 1OCFR71. The organization of this
supplement mirrors the format and content of Chapter 2 except it only contains material directly
pertinent to the HI-STAR HB.
The HI-STAR HB is a shortened version of the HI-STAR 100 that is evaluated in Chapter 2. All
dimensions (radius, thickness) of the HI-STAR HB are identical to those of the HI-STAR 100
except for the overall length of the layered cylinders, the threaded diameter of the lifting
trunnions, and the enclosure shell radial gussets. The impact limiters are identical in all respects
except for the crush strengths of the internal aluminum honeycomb material, which are reduced
to ensure that the deceleration limits are met with the lighter weight HI-STAR HB. The HI-STAR
HB is configured to carry the MPC HB that has the appropriate length and fuel basket design to
carry 80 spent fuel assemblies from the closed Humboldt Bay Nuclear Plant. The qualification of
the MPC HB to withstand a 60g deceleration has been documented in the Part 72 license for
Humboldt Bay (Humboldt Bay ISFSL, Pacific Gas and Electric Company, Final Safety Analysis
Report Update, Revision 0 January 2006, NRC Docket No. 72-27). Therefore, no new analyses
of the MPC HB are required in this Supplement 2.1 as long as the maximum cask deceleration
remains bounded by 60g.
The applicable design codes and standards, and the design criteria for the HI-STAR HB are
identical to those applied to the HI-STAR 100. Therefore, since the differences between the HI-
STAR HB and HI-STAR 100 are limited to:
* Shorter overall length;
* Lowerpackage weight;
* Reduced strength of impact limiter crush materials;
0 Smaller diameter threads on lifting trunnions;
0 Decreased number and length of enclosure shell radial gussets,
HI-STAR SAR 2.1-1 Proposed Revision 13cHI-951251

the supplement is focused on documenting the results from new evaluations required because of
the reported differences in length, weight, impact limiter crush strength, thread diameter, and
enclosure shell geometry. The reduced length and weight of the HI-STAR HB ensures that all
stress-based evaluations performed on the HI-STAR 100 produce safety factors that are lower
bounds for the same evaluation on the HI-STAR HB, except for the trunnion analysis discussed
below. Therefore, no stress-based calculations need to be performed, except those that involve
deceleration limits, because of the change in impact limiters, those that involve the lifting
trunnions, because of the smaller diameter threads, and those that involve the enclosure shell,
because of the modifications to the radial gussets; this supplement focuses only on providing
summaries for the new evaluations performed for the HI-STAR HB, which are documented in
Holtec calculation packages HI-2084158 [2.1.7.2] and HI-2033042 [2.1.7.3].
2.1. STRUCTURAL DESIGN
2.1.1.1 Discussion
The general discussion presented in Subsection 2.1.1 applies to the HI-STAR HB package.
Drawings for the components of the HI-STAR HB package are provided in Section 1.1. 4.
2.1.1.2 Design Criteria
The HI-STAR HB package meets the design criteria espoused in Section 2.1.2 in its entirety. For
the HI-STAR HB overpack, however, the option to replace the SA203-E plate used for the 2.5"
thick inner shell with comparable SA350 LF3 ring forgings, stacked to form the inner shell and
welded together with full penetrant welds, has been added to the drawings. The Nil Ductility
Transition Temperature is still required to be less than -70 degrees F when this option is used
(per Subsection 2.1.2.3). Accordingly, Table 2.1.22 lists SA350 LF3 as an optional material for
the inner shell. Similarly, Table 2.1.23 lists SA350 LF3 as an option for the port cover plates.
2.1.2 WEIGHTS AND CENTERS OF GRAVITY
Table 2.1.2.1 provides the weights of HI-STAR HB components as well as the total package
weight. The weight of the impact limiter is also provided. Table 2.1.2.1 also provides the location
of the calculated center of gravity for the HI-STAR HB package.
HI-STAR SAR 2.1-2 Proposed Revision 13cHI-951251

2.L3 MECHANICAL PROPERTIES OF MATERIALS
Materials for the HI-STAR HB package are identical to those used for the HI-STAR 100
package.
2.L4 GENERAL STANDARDS FOR ALL PACKAGES
The HI-STAR HB is a shorter and lighter version of the HI-STAR 100. Therefore, the features
presented in Section 2.4 apply to the HI-STAR HB.
2.L5 LIFTING AND TIE-DOWN STANDARDS
2.1.5.1 Lifting Devices
The lifting devices for the HI-STAR HB package are identical to those for the HI-STAR 100,
except that the threaded portion of the lifting trunnions has a slightly smaller diameter.
Therefore, even though the HI-STAR HB is lighter than the HI-STAR 100, the safety factors for
the HI-STAR HB lifting trunnions and the top flange interface are recalculated based on the
smaller trunnion diameter.
The embedded trunnion is analyzed as a cantilever beam in the same manner as described in
Subsection 2.5.1.1. Calculations demonstrate that the stresses in the trunnions comply with
NUREG-0612 provisions.
HI-STAR SARHI-951251
2.1-3 Proposed Revision 13c

Specifically, the following results are obtained:
Safety Factors from HI-STAR HB Lifting Trunnion Stress Analysisfor a Bounding Lifted Load of 161,200 lb
Item Value (ksi) or (lb) Allowable (ksi) or Safety Factoror (lb-in) (lb) or (lb-in)
Bending stress (Comparison 11.2 24.5 2.19with Yield Stress/6)
Shear stress (Comparison 4.76 14.7 3.09with Yield Stress/6)
Bending Moment(Comparison with Ultimate 208,600 574,400 2.75Moment/I 0)
Shear Force (Comparison 92, 690 282,500 3.05with Ultimate Force/l 0)
We note from the above that all safety factors are greater than 1.0. A factor of safety of exactly
1.0 means that the maximum stress, under apparent lift load D t is equal to the yield stress in
tension or shear divided by 6, or that the section moment or shear force is equal to the ultimate
section moment capacity or section force capacity divided by 10.
It is also important to note that safety factors associated with satisfaction of IOCFR71.45(a) are
double those reported in the table since 1OCFR 71.45 only requires a factor of safety of 3 on the
yield strength.
The top flange interface with the trunnion under the lifted load is analyzed in the same manner
as described in Subsection 2.5.1.2.2. The interface region is conservatively considered as
subject to the provisions of NUREG-0612, and the thread shear stress and bearing stress are
compared to 1/6 of the top forging yield stress in shear or compression. The following table
summarizes the results:
HI-STAR SARHI-951251
2.1-4 Proposed Revision 13c
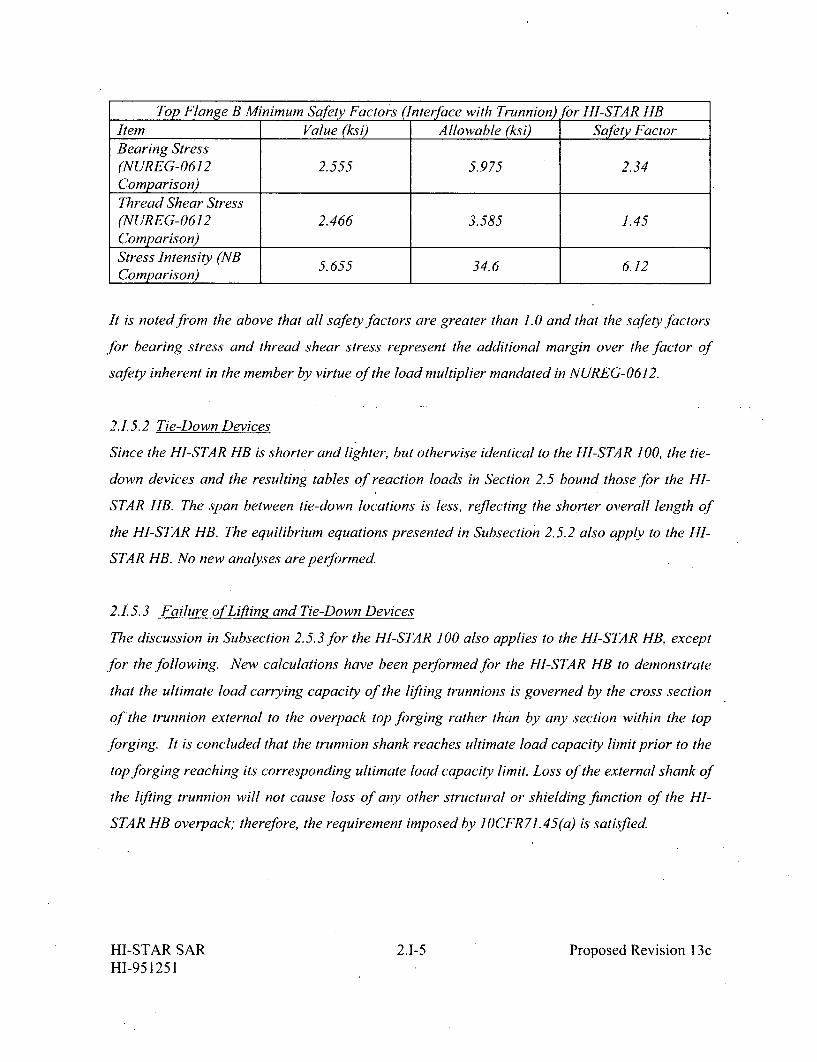
Top Flange B Minimum Safety Factors (Interface with Trunnion) or HI-STAR HBItem Value (ksi) Allowable (ksi) Safety FactorBearing Stress(NUREG-0612 2.555 5.975 2.34Comparison)
Thread Shear Stress(NUREG-0612 2.466 3.585 1.45Comparison)
Stress Intensity (NB 5.655 34.6 6.12Comparison) I
It is noted from the above that all safety factors are greater than 1.0 and that the safety factors
for bearing stress and thread shear stress represent the additional margin over the factor of
safety inherent in the member by virtue of the load multiplier mandated in NUREG-0612.
2.1.5.2 Tie-Down Devices
Since the HI-STAR HB is shorter and lighter, but otherwise identical to the HI-STAR 100, the tie-
down devices and the resulting tables of reaction loads in Section 2.5 bound those for the HI-
STAR HB. The span between tie-down locations is less, reflecting the shorter overall length of
the HI-STAR HB. The equilibrium equations presented in Subsection 2.5.2 also apply to the HI-
STAR HB. No new analyses are performed.
2.15.3 Failure of Liftinz and Tie-Down Devices
The discussion in Subsection 2.5.3 for the HI-STAR 100 also applies to the HI-STAR HB, except
for the following. New calculations have been performed for the HI-STAR HB to demonstrate
that the ultimate load carrying capacity of the lifting trunnions is governed by the cross section
of the trunnion external to the overpack top forging rather than by any section within the top
forging. It is concluded that the trunnion shank reaches ultimate load capacity limit prior to the
top forging reaching its corresponding ultimate load capacity limit. Loss of the external shank of
the lifting trunnion will not cause loss of any other structural or shielding function of the HI-
STAR HB overpack; therefore, the requirement imposed by IOCFR71.45(a) is satisfied.
HI-STAR SAR 2.1-5 Proposed Revision 13cHI-951251
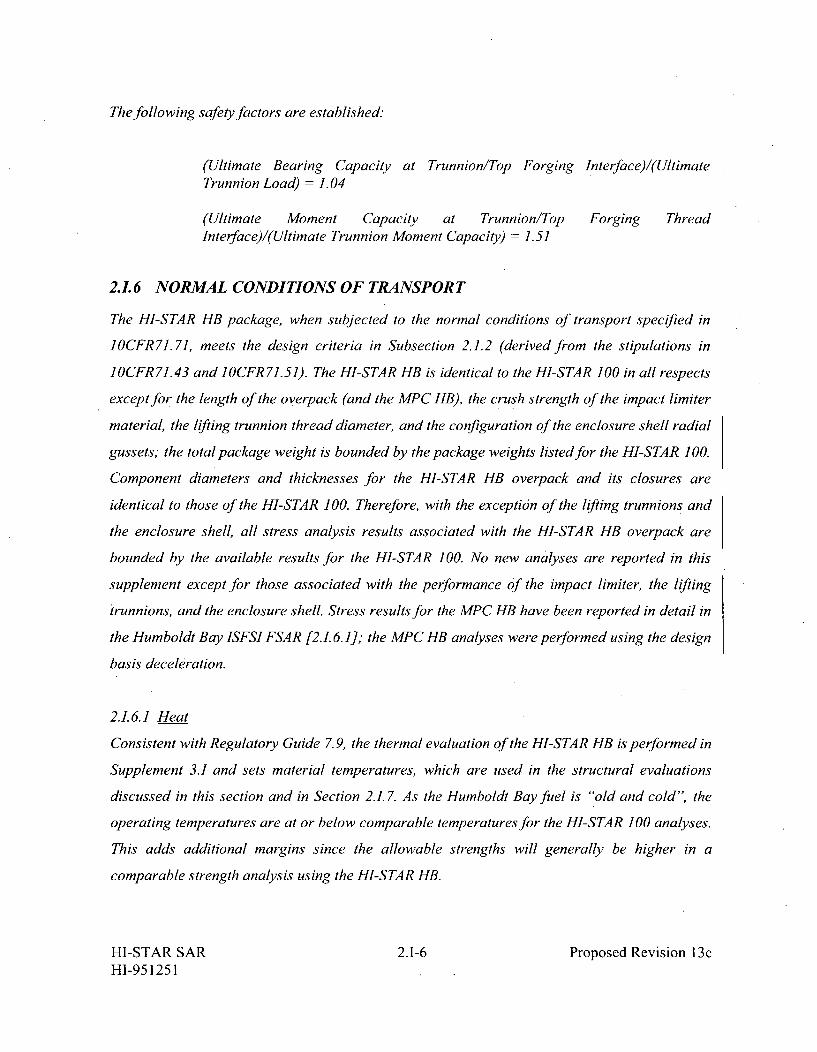
The following safety factors are established.
(Ultimate Bearing Capacity at Trunnion/Top Forging Interface)/(UltimateTrunnion Load) = 1.04
(Ultimate Moment Capacity at Trunnion/Top Forging ThreadInterface)/(Ultimate Trunnion Moment Capacity) = 1.51
2.L6 NORMAL CONDITIONS OF TRANSPORT
The HI-STAR HB package, when subjected to the normal conditions of transport specified in
IOCFR71.71, meets the design criteria in Subsection 2.1.2 (derived from the stipulations in
10CFR 71.43 and IOCFR71.51). The HI-STAR HB is identical to the HI-STAR 100 in all respects
except for the length of the overpack (and the MPC HB), the crush strength of the impact limiter
material, the lifting trunnion thread diameter, and the configuration of the enclosure shell radial
gussets; the total package weight is bounded by the package weights listed for the HI-STAR 100.
Component diameters and thicknesses for the HI-STAR HB overpack and its closures are
identical to those of the HI-STAR 100. Therefore, with the excepti6n of the lifting trunnions and
the enclosure shell, all stress analysis results associated with the HI-STAR HB overpack are
bounded by the available results for the HI-STAR 100. No new analyses are reported in this
supplement except for those associated with the performance of the impact limiter, the lifting
trunnions, and the enclosure shell. Stress results for the MPC HB have been reported in detail in
the Humboldt Bay ISFSI FSAR [2.1.6.1]; the MPC HB analyses were performed using the design
basis deceleration.
2.1.6.1 Heat
Consistent with Regulatory Guide 7.9, the thermal evaluation of the HI-STAR HB is performed in
Supplement 3.1 and sets material temperatures, which are used in the structural evaluations
discussed in this section and in Section 2.1.7. As the Humboldt Bay fuel is "old and cold", the
operating temperatures are at or below comparable temperatures for the HI-STAR 100 analyses.
This adds additional margins since the allowable strengths will generally be higher in a
comparable strength analysis using the HI-STAR HB.
HI-STAR SAR 2.1-6 Proposed Revision 13cHI-951251

Design pressures and design temperatures for all conditions of transport are listed in Tables
2.1.1 and 2.1.2, respectively. Since the design pressures and temperatures for the HI-STAR 100
and the HI-STAR HB are the same, and the HI-STAR HB is shorter than the HI-STAR 100, the
stress analyses for the HI-STAR 100 in Section 2.6 give bounding results for the HI-STAR HB,
except for the overpack enclosure shell.
In the HI-STAR HB, the number and length of the enclosure shell radial gussets have been
reduced significantly as compared to. the HI-STAR 100 (see drawings in Section 1.1.4).
Therefore, a new analysis has been performed for the HI-STAR HB to demonstrate the structural
integrity of the overpack enclosure shell and the overpack enclosure return under a bounding
internal pressure. It is shown that large safety factors exist against overstress due to an internal
pressure developing from off-gassing of the neutron shield material, combined with a reduced
external pressure. The minimum safety factors are summarized below:
Location Calculated Stress (ksi) Allowable Stress (ksi) Safety Factor
Enclosure Shell1.00 26.3 26.3
Return (bottom)
Enclosure Shell3.55 26.3 7.42
Return (top)
Enclosure Shell 4.32 17.5 4.05
Weld Shear 0.46 10.5 22.8
The change in the enclosure shell radial gussets also has a minor effect on the global response of
the HI-STAR HB overpack to a lateral drop because of the change in the gross metal cross
section. Specifically, the area moment of inertia of the HI-STAR HB, at a cross section through
the enclosure shell cavity, is roughly 5% lower than the HI-STAR 100 due to the difference in the
enclosure shell radial gussets. However, this small decrease in the gross section properties is
completely offset by the almost 40% decrease in the cask containment cavity length. The net
effect of the change in the enclosure shell radial gussets and the shorter cavity length is a HI-
STAR HB overpack that is stronger in bending than the HI-STAR 100 overpack.
HI-STAR SAR 2.1-7 Proposed Revision 13cHI-951251

In summary, because of the lower weight and shorter length, all stress analyses performed for
the HI-STAR 100 using the bounding deceleration inputs give stress results that are equal to or
greater than results using the HI-STAR HB.
2.1.6.2 Cold
No new or modified calculations or discussions are required for this subsection.
2.1.6.3 Reduced External Pressure
No new or modified calculations or discussions are required for this subsection. The stress
analysis of the overpack enclosure shell in Subsection 2.1.6.1 conservatively bounds the effect of
reduced external pressure (3.5 psia) by considering a higher pressure inside the enclosure shell
cavity.
2.1.6.4 Increased External Pressure
No additional analyses need be performed here to demonstrate package performance of the HI-
STAR HB.
2.1.6.5 Vibration
No new or modified calculations or discussions are required for this subsection.
2.1.6.6 Water Spray
The condition is not applicable to the HI-STAR HB System per Reg. Guide 7.8 [2.1.2].
2.1.6.7 Free Drop
The structural analysis of a 1-foot side drop has been performed for the HI-STAR 100 in
Subsections 2.6.1 and 2.6.2 for heat and cold conditions of normal transport. As demonstrated
in Subsections 2.6.1 and 2,.6.2, safety factors are well over 1. 0. Since the HI-STAR HB is shorter
and lighter than the HI-STAR 100, the safety factors determined in Subsections 2.6.1 and 2.6.2
are lower bounds for comparable safety factors for the HI-STAR HB. As final verification, the
decelerations for the free drop for the Hi-STAR HB are determined in Section 2.1.7 and shown to
HI-STAR SAR 2.1-8 Proposed Revision 13cH1I-951251
be less than the design basis limits for the 1-foot free drop. Results for the 1-foot drop
simulations are presented in Table 2.1.7.2.
2.1.6.8 Corner Drop
This condition is not applicable to the HI-STAR HB System per [2.1.2].
2.1.6.9 Compression
The condition is not applicable to the HI-STAR HB System per [2.1.2].
HI-STAR SARHI-951251
2.1-9 Proposed Revision 13c

2.L7 HYPOTHETICAL ACCIDENT CONDITIONS
The hypothetical accident conditions, as defined in I OCFR 71.73 and Regulatory Guide 7.9, have
been applied to the HI-STAR 100 System in the required sequence in Subsection 2.7.
It is shown in the following subsections that the HI-STAR HB System also meets the standards set
forth in 1OCFR71, when it is subjected to the hypothetical accident conditions specified in
IOCFR 71. 73.
2.1.7.1 Free Drop
In this subsection the performance and structural integrity of the HI-STAR HB System is
evaluated for the most severe drop events. The drop events that are potentially most damaging
are the end drops (top or bottom), the side drop, the orientation for which the center of gravity is
directly over the point of impact, an oblique drop where the angle of impact is somewhere
between center ofgravity over corner and a near side drop, and an orientation where package
rotation after an impact at one end induces a larger impact deceleration when the other end
impacts the target (i.e., slapdown).
As has been noted, the HI-STAR HB is shorter and lighter than the HI-STAR 100, but is identical
to the HI-STAR in all other aspects of geometry. The impact limiter crush strengths are adjusted
from those used in the H1-STAR 100 in order to ensure that the design basis deceleration limits
for the HI-STAR family continue to be met. In Section 2.7, the analysis was performed in two
parts. Initially, 1/8 and 1/4 scale testing was performed to establish the characteristics of the
impact limiter and to demonstrate that the experimentally obtained decelerations for all
orientations of the cask were below the design basis. Analytical models were developed and
demonstrated to be capable of predicting the observed responses from the experimental results.
These models were used to evaluate sensitivity to crush strength change and cask weight change.
Once it was established that the impact limiter configuration and crush strengths successfully
limited the rigid body decelerations of the cask to below the prescribed limits, various strength
analyses were performed to assess the state of stress in the cask components and ensure that the
proscribed stress limits were satisfied.
HI-STAR SAR 2.1-10 Proposed Revision 13cHI-951251

As the impact limiter for the HI-STAR HB has the same geometry as the HI-STAR 100 with the
sole difference being the impact limiter crush material, no qualification testing is employed In
lieu of testing, the same analytical methodology (the differential equation method) is used to
simulate the free drop tests and demonstrate the performance of the impact limiter for the HI-
STAR HB. The key features of the differential equation method are presented in [2.1.7.1], which
summarizes, in a single document, the general analysis method as it was first implemented for
the HI-STAR 100 license under 1OCFR 71.
The drop analysis of the HI-STAR HB Package using the differential equation method differs
from the drop analysis for the HI-STAR 100 only to the extent that:
" the axial length of the cylindrical body is reduced;
* the nominal strength of the energy absorbing honeycomb material is reduced;
* the mass of the package is reduced.
Sheet 1 of Holtec drawing C1 765 (Rev. 4) provides the reduced nominal crush strengths used in
the impact limiters for the HI-STAR HB.
The dynamic multipliers (or dynamic correlation function), which were originally determined for
the HI-STAR 100, remain valid for the HI-STAR HB Package for the following reasons. The
Hexcel manufacturer's catalog states that dynamic crush strengths are a function of impact
velocity only; there is no information suggesting that the dynamic multipliers in the differential
equation method are a function of crush material strength. Therefore, the drop analyses for the
HI-STAR HB impact limiters use the same dynamic multipliers (represented as a linear function
of the concomitant crush velocity) that were used for the HI-STAR 100. More information on the
dynamic multipliers, including the explicit form of the dynamic correlation function, is provided
in [2.1.7.1].
The results from the four free drop simulations of the HI-STAR HB are documented in Table
2.1.7.1 using the nominal strengths of the honeycomb energy absorbing material. Because of the
reduced length of the HI-STAR HB Package, the CGOC and slapdown angles are 58.63 degrees
HI-STAR SAR 2.1-11 Proposed Revision 13cHI-951251

and 6 or 10 degrees from the target plane, respectively. For the slapdown, the maximum
deceleration of the secondary impact (after filtering to eliminate, oscillations exceeding a
frequency of 350 Hz) was slightly larger at a 10 degree initial angle than it was at 6 degrees; the
maximum crush, however, was larger at 6 degrees as the initial orientation angle of the cask.
Therefore, simulations using nominal crush strength are reported for both orientations, although
sensitivity studies were performed only for the 6 degree initial orientation. The results show that
the HI-STAR HB impact limiters effectively protect the HI-STAR HB cask under the postulated
30-foot drop events by maintaining the peak cask rigid body deceleration below the design basis
limit of 60 g 's. Since the peak decelerations are below the values computed for the HI-STAR 100,
it is assured that the pin/bolt connections between the HI-STAR HB impact limiters and the HI-
STAR HB body maintain their structural integrity.
Consistent with the requirements for 1-foot free drops as part of the Normal Conditions of
Transport, two free drops (end drop and side drop) are also analyzed for the HI-STAR HB
Package using the nominal strengths (plus 15%) specified for the honeycomb energy absorbing
material. The maximum decelerations sustained by the Package, as well as the maximum impact
limiter crush and impact durations, are summarized in Table 2.1.7.2. Finally, Table 2.7.1.3
presents the results of some additional parametric simulations that set upper and lower limits on
permitted variation of the strength properties for the honeycomb material The analyses leading
to the reported results are documented in a supporting calculation package [2.1.7.2].
2.1.7.2 Puncture
No new or modified calculations need be performed to qualify the HI-STAR HB, as the structure
at the puncture locations is unchanged from the HI-STAR 100.
2.1.7.3 Thermal
Thermal evaluation of the fire accident is presented in Supplement 3.1. No new or modified
structural calculations need be performed to qualify the HI-STAR HBfor the fire accident.
2.1.7.4 Immersion - Fissile Material
No new or modified calculations need be performed to qualify the HI-STAR HB.
HI-STAR SAR 2.1-12 Proposed Revision 13cHI-951251
2.1.7.5 Immersion - All Packages
No new or modified calculations need be performed to qualify the HI-STAR HB.
2.1.7.6 Summary of Damage
The results presented in Subsections 2.1.7.1 through 2.1.7.5 show that the HI-STAR HB System
meets the requirements of IOCFR71.61 and 10CFR71.73. The results from simulation of the
hypothetical drop conditions produce deceleration levels that are below the design basis levels
for the HI-STAR 100 for crush strength variations of plus or minus 15% of the nominal values
specified for the HI-STAR HB impact limiters. Therefore, safety factors for the HI-STAR HB are
greater than 1.0 by virtue of comparison with the corresponding calculations for the HI-STAR
100 for the Hypothetical Accident Conditions of Transport. Therefore, the HI-STAR 100 HB
package, under the Hypothetical Accident Conditions of Transport, has adequate structural
integrity to satisfy the subcriticality, containment, shielding, and temperature requirements of
IOCFR71.
2.L8 SPECIAL FORM
This section is not applicable to the HI-STAR HB System. This application does not seek
approval for transport of special form radioactive material as defined in 1OCFR 71.4.
2.L9 FUEL RODS
The Humboldt Bay fuel is shorter than the design basis fuel carried by the HI-STAR 100;
therefore, the computations and conclusions in Section 2.9 encompass the HI-STAR HB. The
presence of "Undamaged Fuel Assemblies", which are defined in Table 1.0.1 will have no
significant effect on the structural response of the HI-STAR HB. This is because the only fuel
parameters that have an influence on the structural analyses are the fuel mass and center of
gravity height. Therefore, since an undamaged fuel assembly has essentially the same mass as an
intact fuel assembly, and the exterior fuel rods serve to confine the interior fuel rods (with
cladding in'unknown condition) preventing them from dislocating and falling to the bottom of the
fuel basket, the presence of undamaged fuel assemblies has no significant effect on the total
amount of stored fuel mass or the center of gravity height used as input in the drop analysis for
the HI-STAR HB.
HI-STAR SAR 2.1-13 Proposed Revision 13cHI-951251

2.1.10 MISCELLANEOUS ITEMS
No new appendices are introduced in Supplement 2.1. Also, since the HI-STAR 100 Package
meets applicable NUREG 1617/1 OCFR 71 requirements, so does the HI-STAR HB.
2.1.11 REFERENCES
[2.1.6.1] Pacific Gas and Electric Company, NRC Docket Number 72-27, Humboldt Bay
ISFSI, Final Safety Analysis Report Update, Revision 0, January 2006.
[2.1.7.1] A Classical Dynamics Based and Experimentally Benchmarked Impact Response
Computation Methodology for Al-STAR Equipped Casks, HI-2084137, Rev. 0.
[2.1.7.2] Calculation Package for HI-STAR HB Drop Analyses, HI-2084158, Rev. 0.
[2.1.7.3] Miscellaneous Calculations for the HI-STAR HB, HI-2033042, Rev. 4.
HI-STAR SARHI-951251
2.1-14 Proposed Revision 13c

Table 2.1.2.1 Weights and Center of Gravity of HI-STAR HR PackageItem Component Weight Total Weight (lb.) Location of C. G.
(lb.) above base of cask(inch)
Impact Limiter 13,000 26000MPC HB 59, 000 -HI-STAR HB (with 161,200 -loaded MPC HB)Total Package Weight - 187,200 -
Loaded Package - 61.4Center of Gravity* Includes approximately 32, 000 lb offuel
HI-STAR SARHI-951251
2.1-15 Proposed Revision 13c

Table 2.L 7.1 -HI-STAR HB 30' DROP RESULTS
CONFIGURATION MAXIMUM MAXIMUM DURATION COMMENTSDECELERATION CRUSH OF IMPACT(G 'S) (INCH) (SEC.)
30' TOP END 56.5 13.1 0.0425 Avg. strength=694DROP psi
30'BOTTOMEND 45.6 13.8 0.047 Strength=390psiDROP
30 'SIDE DROP 34.8 13.4 0.048530' CGOC 33.75 22 0.0665 Bottom down30' SLAPDO WN - 6 45.06* 15.08 0.0705 Secondary impactDEGREES limiter
30' SLAPDO WN - 45.88* 14.93 0.0964 Secondary impact10 DEGREES limiter
30'SLAPDOWN- 6 33.52* 11.43 - Primary impactDEGREES limiter
30'SLAPDOWN- 30.57* 13.82 Primary impact10 DEGREES limiter
*Reported result is subsequent to filtering to remove high frequency effects above 350 Hz.
Table 2.L 7.2 -HI-STAR HB 1'DROP RESULTS
COMMENTS MAXIMUM MAXIMUM DURATION COMMENTSDECELERATION CRUSH OF IMPACT(G'S) (INCH) (SEC)
1' TOP END DROP 14 1.07 0.0254 Crush strengthincreased by 15%
1' SIDE DROP 10 1.55 0.0305 Crush strengthI ._ increased by 15%
HI-STAR SARHI-951251
2.1-16 Proposed Revision 13c

Table 2.L 7.3 -HI-STAR HB 30' DROP RESULTS - SENSITIVITY ANALYSES
CONFIGURATION MAXIMUM MAXIMUM DURATION COMMENTSDECELERATION CRUSH OF IMPACT(G 'S) (INCH) (SEC.)
30' TOP END DROP 59 12.4 0.040 15% increase in crushstrength
30'BOTTOMEND 44.3 14.8 0.050 15% decrease in crushDROP strength30' SIDE DROP 38.5 12.2 0.0435 15% increase in crush
strength30' SIDE DROP 43* 15.2* 0.053 15% decrease in crush
strength30' CGOC 36.75 20.75 0.0608 15% increase in crush
strength
30' CGOC 30.55 23.75 0.0728 15% decrease in crushstrength
30' SLAPDOWN-6 49.17** 13.6 0.0718 Secondary IL - 15%DEGREES increase in crush
strength30'SLAPDOWN-6 34.9** 10.43 - Primary lL - 15%DEGREES increase in crush
strength30' SLAPDOWN -6 38.82** 17.08 0.0842 Secondary lL - 15%DEGREES decrease in crush
strength30'SLAPDOWN -6 30.28** 12.88 - Primary IL - 15% .
DEGREES decrease in crushstrength
* 1050 psi material experiences minimal lockup so peak deceleration value rises but remains
below the design basis limit.* * No filtering performed on deceleration time histories.
HI-STAR SARHI-951251
2.1-17 Proposed Revision e3c

7.1 PROCEDURE FOR LOADING AND PREPARATION FOR TRANSPORT OFTHE HI-STAR 100 SYSTEM
7.1.1 Overview of HI-STAR Loading Operations
The MPC loading operations described herein are for HI-STAR 100 systems prepared for "load-and-go" directly into transportation under 1 OCFR71. HI-STAR 100 systems that are loaded andstored on an ISFSI site must be prepared in accordance with the applicable Part 72 HI-STARFSAR or HI-STORM FSAR license and respective Certificate of Compliance (CoC). Any HI-STAR overpack and/or MPC deployed at an ISFSI must be confirmed to meet all conditions ofthe IOCFR71 CoC prior to shipment. The dryness criteria under the Part 72 CoC shall beconsidered acceptable for use in transport under Part 71 [7.1.2], [7.1.6].
The HI-STAR 100 System (HI-STAR) is used to load and transport spent nuclear fuel (SNF).The essential elements required to prepare the HI-STAR for fuel loading, to load the fuel, toready the system for transport, and to ship the HI-STAR are described below.
7.1.2 Preparation of HI-STAR for Loading
1. If the HI-STAR overpack has previously been used to transport SNF, the HI-STARoverpack is received and the personnel barrier, if attached, is removed. The securityseals, if used, are inspected to verify there was no tampering and that they match thecorresponding shipping documents.
2. The HI-STAR is visually receipt inspected to verify that there are no outward visualindications of impaired physical condition except for superficial marks and dents. Anyroad dirt is washed off and any foreign material is removed.
3. Radiological surveys are performed in accordance with 49CFR173.443 [7.1.3] and10CFR20.1906 [7.1.4]. Any issues are identified to site management and the overpack isdecontaminated as directed by site radiation protection and make appropriatenotifications as detailed in the surveillance requirements.
4. The impact limiters, if attached, are removed and a second visual inspection to verify thatthere are no outward visual indications of impaired physical condition is performed.
5. The HI-STAR overpack is upended. and the neutron shield relief devices are inspected toconfirm that they are installed, intact, and not covered by tape or any other covering.
7.1.3 Loading of Contents into HI-STAR
7.1.3.1 Loading of SNF into HI-STAR from a Spent Fuel Pool
1. The HI-STAR is positioned in the MPC loading area.
2. An empty MPC is upended and prepared for loading. The MPC is subjected to receipt
HI-STAR SAR Proposed Rev. 13bREPORT HI-951251 7.1-1

inspection (inspected for cleanliness and outward visual indications of impaired physicalcondition except for superficial marks and dents). Road dirt/debris and any foreignmaterial are removed from the MPC prior to placement in the spent fuel pool.Verification is made to ensure that the appropriate fuel spacers, as necessary, are used toposition the active fuel zone within the neutron absorber plates of the MPC, and limitaxial movement of the fuel assemblies in the MPC cavity. The empty MPC is raised andinserted into the HI-STAR overpack while being careful not to damage the HI-STARsealing surface. The MPC is inspected to ensure that the neutron absorber panelsheathing is present and there are no signs of potential damage to the neutron absorber.
3. The annulus is filled with clean (uncontaminated) water and the annulus seal is installedin the annulus between the MPC and the HI-STAR overpack.
ALARA Note:
A bottom protective cover may be attached to the cask bottom or placed in thedesignated preparation area or spent fuel pool. This will help prevent embeddingcontaminated particles in the cask bottom surface and ease the decontamination effort.Waterproof tape placed over empty bolt holes, and bolt plugs may also reduce the timerequired for decontamination. Wetting the components that enter the spent fuel poolmay reduce the amount of decontamination work to be performed later.
4. The MPC is filled with either spent fuel pool water or clean water and the HI-STAR israised and lowered into the spent fuel pool for fuel loading.
5. Prior to loading the fuel into the MPC, the user identifies the fuel to be loaded. A pre-loading verification is made to assure that damaged fuel and fuel debris will be placed indamaged fuel containers and that the DFCs will occupy authorized locations in the MPC.The fuel is independently verified to see that it meets the conditions of the CoC. The pre-selected assemblies are loaded into the MPC using DFCs as required, and a visualverification of the assembly identification is performed.
6. While still underwater, a thickly shielded lid (the MPC lid) is positioned over the poolsurface and the drain line is installed. The MPC lid drain line is guided into its receiverand the MPC lid is installed. The upper surface of the MPC lid will seat approximatelyflush with the top edge of the MPC shell when properly installed. The lid may beremoved and the drain line replaced should it be damaged during installation of the MPClid. The user performs a site-specific Time-to-Boil analysis. This determines a time limitthat ensures water in the MPC will not boil prior to the start of the draining operations. Ifit appears that the Time-to-Boil limit will be exceeded prior to draining the MPC, the usershall take appropriate action to prevent water from boiling.
ALARA Note:
HI-STAR SAR Proposed Rev. 13cREPORT HI-951251 7.1-2

Activated debris may have settled on flat surfaces of the cask during fuel loading. Casksurfaces suspected of carrying activated debris should be kept under water until apreliminary dose rate scan clears the cask for removal.
7. The lift attachment engages the HI-STAR overpack lifting trunnions to lift the HI-STARoverpack and loaded MPC close to the spent fuel pool surface.
8. The HI-STAR is removed from the spent fuel pool. If a lid retention system is beingused, it is installed to secure the MPC lid for the transfer to the cask preparation area.The lift attachment and HI-STAR overpack are sprayed with clean water to help removecontamination as they are removed from the spent fuel pool.
9. The HI-STAR overpack is placed in the designated preparation area and the liftattachment and lid retention system, as applicable, are removed.
10. The top surfaces of the MPC lid, upper accessible regions of the MPC external shell andthe upper flange of the HI-STAR overpack are decontaminated.
ALARA Note:
The water in the HI-STAR 100 overpack-to-MPC annulus provides personnel shielding.The level should be checked periodically and refilled accordingly. Pocket trunnions, ifpresent and not used are plugged to reduce radiation levels around the lower region ofthe overpack.
11. The temporary shield ring, if used, is installed. The annulus seal is removed, and anannulus shield is installed. The temporary shield ring provides additional personnelshielding around the top of the HI-STAR overpack during MPC closure operations. Theannulus shield also provides additional personnel shielding at the top of the annulus andprevents small items from being dropped into the annulus.
12. Dose rates are measured at the MPC lid and around the HI-STAR overpack to establishappropriate radiological control.
ALARA Warning:
Personnel should remain clear of the drain lines any time water is being pumped orpurged from the cask. Assembly crud, suspended in the water, may create a radiationhazard to workers. Dose rates will rise as water is drained from the cask. Continuousdose rate monitoring is recommended.
HI-STAR SAR Proposed Rev. 13cREPORT HI-951251 7.1-3

ALARA Warning:
The use of manual welding should be minimized and only used when deemedadvantageous from an ALARA perspective. If manual welding is elected, it should onlybe performed under conditions consistent with ALARA principals (e.g., utilizingtemporary shielding).
13. The MPC water level and water level in the annulus are lowered slightly; the MPC isvented or purged and checked for combustible gas concentrations. The MPC lid is sealwelded using an automated welding system, by manual welding, or a combination ofboth.
14. Visual examinations are performed on the tack welds. Liquid penetrant (PT)examinations are performed on the root and final passes. A volumetric examination isperformed on the MPC welds using the ultrasonic method to ensure that the completedweld is satisfactory. As an alternative to volumetric examination of the MPC lid-to-shellweld, a multi-layer PT may be performed including intermediate examinations afterapproximately every three-eighth inch of weld depth. Any unsatisfactory indications arerepaired in accordance with the code requirements [7.1.1].
15. At the appropriate time in the sequence of activities, based on the type of test performed(hydrostatic or pneumatic), an ASME pressure test of the MPC enclosure vessel isperformed in accordance with the requirements of Section III, Subsection NB, ArticleNB-6000 and applicable subarticles [7.1.1]. Any non-satisfactory conditions require theuser to determine the cause of the leak and make repairs as necessary to achieve asuccessful result.
ALARA Note:
Dose rates will rise as water is drained from the MPC. Continuous dose rate monitoringis recommended.
16. The MPC water is displaced from the MPC and the water is drained from the annulusarea.
17. The Forced Helium Dehydration (FHD) is connected to the MPC and is used to removemoisture from the MPC. To ensure that the MPC cavity is suitably dry either thetemperature or the dew point of the helium exiting the FHD demoisturizer shall be lessthan or equal to 22.9 'F for no less than 30 minutes.
18. The MPC helium backfill is adjusted to the pressure equivalent of greater than 0 psig andless than 44.8 psig at a reference temperature of 70 degrees Fahrenheit.
19. Cover plates are installed and seal welded over the MPC vent and drain ports and PTexaminations are performed on the root (for multi-pass welds) and final passes. Anyunsatisfactory indications are repaired in accordance with the code requirements.
HI-STAR SAR Proposed Rev. 13cREPORT HI-951251 7.1-4
20. The MPC closure ring is placed on the MPC.
21. The closure ring is aligned, tacked in place, and seal welded. Tack welds are visuallyexamined and PT examinations are performed on the root (for multi-pass welds) and finalwelds.
22. The annulus shield and the temporary shield ring (if used) are removed.
7.1.3.2 Not Used
7.1.3.3 Loading a Loaded and Sealed MPC into HI-STAR Overpack
1. After the HI-STAR overpack has been prepared in accordance with Section 7.1.2 above,it is placed in the MPC transfer location and is fitted with a mating device to interfacewith the transfer cask.
2. The transfer cask with loaded MPC is brought to the MPC transfer location and. placedatop the HI-STAR overpack and mating device.
3. The mating device is used to open the bottom of the transfer cask and the MPC islowered into the HI-STAR overpack.
4. The transfer cask and mating device are removed from the HI-STAR.
7.1.4 Closure of HI-STAR
1. The MPC lid and accessible areas at the top of the MPC shell are smeared for removablecontamination. Decontamination of the MPC lid and accessible areas at the top of theMPC may be performed at any time prior to closure of the HI-STAR overpack.
2. The sealing surfaces for the HI-STAR overpack are inspected for signs of damage. Anydamage that would prevent a seal is remedied, any old seals are discarded, new seals areinserted for the closure plate, and the closure plate is installed with the bolts torqued inaccordance with requirements in Table 7.1.1 and the order prescribed in Figure 7.1 .1.
3. The HI-STAR overpack annulus is dried by evacuating to a pressure of less than or equalto 3 torr. The overpack annulus shall be considered dry when it can hold a stablepressure of less than or equal to 3 torr for at least 30 minutes.
4. The HI-STAR overpack is then backfilled with helium gas to a pressure of greater than orequal to 10 psig and less than or equal to 14 psig.
5. Any old seals are removed from the HI-STAR overpack vent and drain plugs and theplugs are installed with new seals and torqued in accordance with Table 7.1.1.
6. All HI-STAR overpack containment boundary seals, e.g. closure plate, vent and drainports, are leak tested to assure they will provide long-term retention of the annulus
HI-STAR SAR Proposed Rev. 13cREPORT HI-951251 7.1-5

helium. All HI-STAR overpack containment boundary seals shall be leak tested inaccordance with ANSI N14.5 [7.1.5] and shall demonstrate compliance with the leakagerate acceptance criterion in SAR Section 4.1. Unacceptable leakage rates will requirerepair and re-testing of the seals. The leak test shall be performed within the 12-monthperiod prior to each shipment and after de-tensioning one or more overpack lid bolts,drain port, or the vent port plug;
7. The HI-STAR 100 overpack vent and drain port cover plates are installed.
8. The HI-STAR 100 overpack is surveyed for removable contamination per 49CFR173.443[7.1.3]. If necessary, the overpack is further decontaminated to meet the surveillancerequirements.
7.1.5 Preparation of HI-STAR for Transport
1. Verify the HI-STAR has been leak tested within the past 12 months and no overpack lidbolts and vent and drain port plugs have been de-tensioned. If not, the HI-STAR is leaktested in accordance with Step 6 of Section 7.1.4 above.
2. The relief devices on the neutron shield vessel are verified that they have been replacedwithin the past 5 years. If not, the relief devices are replaced.
ALARA Warning:
Dose rates around the unshielded bottom end of the cask may be higher that otherlocations around the cask. After the cask is downended on the transport frame, thebottom impact limiter should be installed promptly. Personnel should remain clear andexercise other appropriate ALARA controls when working around the bottom end of thecask.
3. Buttress plate is installed and the HI-STAR overpack is moved to the transport location.The HI-STAR is down-ended and placed on the transport vehicle. Pocket trunnions, ifpresent, are plugged.
4. HI-STAR is visually inspected for signs of impaired condition.
5. Contamination surveys are performed on the HI-STAR per 49CFR173.443 [7.1.3]. Ifnecessary, the overpack is further decontaminated to meet the surveillance requirements.
6. The impact limiters are installed on the HI-STAR and the bolts are torqued in accordancewith Table 7.1.1.
7. The tie-down system is installed and a security seal, one per impact limiter is installedand the seal numbers are recorded in the shipping documents.
8. Final radiation surveys of the package surfaces per 10CFR71.47 [7.1.4] and
HI-STAR SAR Proposed Rev. 13cREPORT HI-951251 7.1-6

49CFR173.443 [7.1.3] are performed and recorded in the shipping documents.
9. The personnel barrier is installed.
10. The assembled package is given a final inspection to verify that all conditions fortransport have been met (inspection steps may be performed in any order):
a. Verify that required radiation survey results are properly documented on theshipping documentation.
b. Perform a HI-STAR overpack surface temperature check. The accessible surfacesof the HI-STAR Package (impact limiters and personnel barrier) shall not exceedthe Exclusive Use temperature limits of49CFR173.442 [7.1.3].
c. Verify that all required leakage testing has been performed, the acceptance criteriahave been met, and the results have been documented on the shippingdocumentation.
d. Verify that the receiver has been notified of the impending shipment and that thereceiver has the appropriate procedures and equipment available to safely receiveand handle the HI-STAR (IOCFR20.1906(e)) [7.1.4].
e. Verify that the carrier has the written instructions and a list of appropriatecontacts for notification of accidents or delays.
f. Verify that the carrier has written instructions that the shipment is to be ExclusiveUse in accordance with 49CFR173.441 [7.1.3].
g. Verify that route approvals and notification to appropriate agencies have beencompleted.
h. Verify that the appropriate labels have been applied in accordance with49CFR172.403 [7.1.3].
1. Verify that the appropriate placards have been applied in accordance with49CFR172.500 [7.1.3].
j. Verify that all required information is recorded on the shipping documentation.
11. Following the above checks, the HI-STAR 100 System is released for transport.
Table 7.1.1HI-STAR 100 SYSTEM TORQUE REQUIREMENTS
Fastener Torque (ft-lbs) Pattern
HI-STAR SAR Proposed Rev. 13cREPORT HI-951251 7.1-7

Overpack Closure Plate Boltst, tt First Pass - Hand Tight See FigureSecond Pass - Wrench Tight 7.1.1Third Pass - 860 +25/-25Fourth Pass - 1725 +50/-50Final Pass - 2000 +250/-0
Overpack Vent and Drain Port Plugs 45+5/-2 None
Closure Plate Test Port Plug 45+5/-2 None
Top Impact Limiter Attachment Bolt 256+10/-0 None
Bottom Impact Limiter Attachment Bolt 1500+45/-0 None
t Detorquing shall be performed by turning the bolts counter-clockwise in 1/3 turn +/-30 degrees increments per pass according to Figure 7.1.1 for three passes. The bolts maythen be removed.
tt Bolts shall be cleaned and inspected for damage or excessive wear (replaced if necessary)and coated with a light layer of Fel-Pro Chemical Products, N-5000, Nuclear GradeLubricant (or equivalent).
HI-STAR SARREPORT HI-951251
Proposed Rev. 13c7.1-8

90
180 0
270
Figure 7.1.1; HI-STAR Closure Plate Bolt Torquing Pattern
HI-STAR SARREPORT HI-951251
Proposed Rev. e3c
CHAPTER 8: ACCEPTANCE TESTS AND MAINTENANCE PROGRAM
8.0 INTRODUCTION
This chapter identifies the acceptance tests and maintenance program to be conducted on theHI-STAR 100 Package to verify that the structures, systems, and components (SSCs) classifiedas important to safety have been fabricated, assembled, inspected, tested, accepted, andmaintained in accordance with the requirements set forth in this Safety Analysis Report (SAR),the applicable regulatory requirements, and the Certificate of Compliance (CoC). Theacceptance criteria and maintenance program described in this chapter fully comply with therequirements of IOCFR Part 71 [8.0.1].
8.1 ACCEPTANCE TESTS
This section provides the workmanship inspections and acceptance tests to be performed on theHI-STAR 100 Package prior to or during use. These inspections and tests provide assurancethat the HI-STAR 100 Package has been fabricated, assembled, inspected, tested, and acceptedfor use and loading under the conditions specified in this SAR and the CoC issued by the NRCin accordance with the requirements of 1 OCFR Part 71.
8.1.1 Visual Inspections and Measurements
The following visual inspections and measurements shall be performed on the HI-STAR 100Package, including the MPCs, in order to assure compliance with this SAR and the Certificateof Compliance. Inspections and measurements shall be performed in accordance with writtenand approved procedures and results shall be documented and become part of the qualitydocumentation package. Any area found to be under the specified minimum thickness shall berepaired in accordance with the applicable ASME code requirements.
I. Visual inspections and measurements shall be made and controls shall beexercised to ensure that the packaging conforms to the dimensions andtolerances specified on the applicable drawings referenced in the CoC,specifically the following:a. The radial neutron shield minimum thicknessb. The impact limiter neutron shield minimum thickness.c. The minimum flux trap sizes, if applicable.d. The minimum fuel cell pitch, if applicable.e. Correct thickness of top flange, closure plate, and bottom plate for gamma
shielding.f. Correct total measured thickness of inner shell plus intermediate shells over
the total surface area.2. The packaging shall be inspected for cleanliness and proper preparation for
shipping in accordance with written and approved procedures.3. The sealing surfaces (including the lid and all penetrations) shall be inspected to
ensure that there are no gouges, *cracks, or scratches that could result inunacceptable leakage.
HI-STAR SAR Proposed Rev. 13cREPORT HI-951251 8.1-1

4. The locations, types, and sizes of welds shall be confirmed by measurement tobe as specified on the drawings.
5. The packaging will be visually inspected to ensure it is conspicuously anddurably marked with the proper .markings/labels in accordance withlOCFR71.85(c) and if applicable also in accordance with ]OCFR 72.236(k).
6. Visual inspections shall be made to verify that neutron absorber panels arepresent on the basket cell walls as required by the basket design.
8.1.2 Weld Examinations
All weld examinations shall be performed in accordance with the applicable ASME Codesections as specified on the drawings [8.1.1]. Examination of MPC components shall beperformed per ASME Code Section III, Subsections NB, NF, and NG, per NB-5300, NF-5300,and NG-5300 and the code alternatives listed in Table 1.3.2, as applicable. Examination of theoverpack shall be performed per ASME Code, Subsection NB, NB-5300 for containmentboundary components, and Subsection NF, NF-5300 and the code alternatives listed in Table1.3.2 for non-containment boundary components.
The MPC lid-to-shell weld shall be verified by either volumetric examination using ultrasonicmethods or by surface examination using multi-layer liquid penetrant methods. Regardless ofwhich method is used, the root and final layers shall be examined by liquid penetrant. If liquidpenetrant alone is used, additional intermediate examinations shall be conducted after eachapproximately 3/8 inch of the weld is completed.
All weld examinations shall be performed in accordance with written and approved procedures,by qualified personnel, in accordance with SNT-TC-1A [8.1.2]. All results, including relevantindications, shall be made a permanent part of the quality records by video, photographic, orother means providing an equivalent retrievable record of weld integrity.
8.1.3 Structural and Pressure Tests
The HI-STAR 100 system containment boundary shall be examined and tested using pressuretesting, ultrasonic testing, MT and/or PT, as applicable, to verify that it is free of cracks,pinholes, uncontrolled voids or other defects that could significantly reduce the effectiveness ofthe packaging.
8.1.3.1 Lifting Trunnions
Two trunnions (located near the top of the HI-STAR overpack) are provided for vertical liftingand handling of the HI-STAR 100 Package without the impact limiters installed. The trunnionsare designed and shall be inspected and tested in accordance with ANSI N14.6 [8.1.3] asdetailed in this Subsection. The trunnions are fabricated using a high-strength and high-ductility material (see overpack drawing in Section 1.4). The trunnions contain no weldedcomponents.
In order to ensure that the lifting trunnions do not have any hidden material flaws, the trunnions
HI-STAR SAR Proposed Rev. 13cREPORT HI-951251 8.1-2

shall be tested at 300% of the maximum design (service) lifting load. The load shall be appliedfor a minimum of 10 minutes to the pair of lifting trunnions. The accessible parts of thetrunnions (areas outside the HI-STAR overpack), and the local HI-STAR 100 cask areas shallthen be visually examined to verify no deformation, distortion, or cracking has occurred. Anyevidence of deformation, distortion or cracking of the trunnion or adjacent HI-STAR 100 caskareas shall require replacement of the trunnion and/or repair of the HI-STAR 100 cask.Following any replacements and/or repair, the load testing shall be re-performed and thecomponents re-examined in accordance with the original procedure and acceptance criteria.Testing shall be performed in accordance with written and approved procedures. Certifiedmaterial test reports verifying trunnion material mechanical properties meet ASME CodeSection II requirements provide further verification of the trunnion load capabilities. Testresults shall be documented and shall become part of the final quality documentation package.
8.1.3.2 Pressure Testing
8.1.3.2.1 HI-STAR 100 Containment Boundary
The containment boundary of the HI-STAR Package shall be hydrostatically or pneumaticallypressure tested to 150 psig +10/-0 psig, in accordance with the requirements of the ASME CodeSection I11, Subsection NB, Article NB-6000 and the code alternatives listed in Table 1.3.2.The test pressure of 150 psig is 150% of the Maximum Normal Operating Pressure (MNOP).
The overpack pressure test may be performed at any time during fabrication after thecontainment boundary is complete. The HI-STAR overpack shall be assembled for this testwith the closure plate mechanical seal (only one required) or temporary test seal installed.
The test pressure shall be maintained for ten minutes. During this time period, the pressuregauge reading shall not fall below 150 psig. At the end often minutes, and while the pressure isbeing maintained at a minimum of 150 psig, the overpack shall be observed for leakage. Inparticular, the closure plate-to-top forging joint (the only credible leakage point) shall beexamined. If a leak is discovered, the overpack shall be emptied and an evaluation shall beperformed to determine the cause of the leakage. Repairs and retest shall be performed until the.pressure test acceptance criterion is met.
After completion of the pressure testing, the overpack closure plate shall be removed and theinternal surfaces shall be visually examined for cracking or deformation. Any evidence ofcracking or deformation shall be cause for rejection or repair and retest, as applicable. Theoverpack shall be required to be pressure tested until the examinations are found to beacceptable.
Test results shall be documented and shall become part of the final quality documentationpackage.
8.1.3.2.2 MPC Pressure Boundary
HI-STAR SAR Proposed Rev. 13cREPORT HI-951251 8.1-3

Pressure testing (hydrostatic or pneumatic) of the MPC pressure boundary shall be performedin accordance with the requirements of the ASME Code Section III, Subsection NB, ArticleNB-6000, applicable sub-articles, and the code alternatives listed in Table 1.3.2 when fieldwelding of the MPC lid-to-shell weld is completed. If hydrostatic testing is used, the MPC shallbe pressure tested to 125% of design pressure. The minimum hydrostatic test pressure shall be125 psig. If pneumatic testing is used, the MPC shall be pressure tested to 120% of the designpressure. The minimum pneumatic test pressure shall be 120 psig. Following completion of therequired hold period at the test pressure, and after determining the leakage acceptance criterionis met, the surface of the MPC lid-to-shell weld shall be re-examined by liquid penetrantexamination performed in accordance with ASME Code Section V, Article 6, with acceptancecriteria per ASME Code Section III, Subsection NB, Article NB-5350.
Test results shall be documented and shall become part of the final quality documentationrecord package.
8.1.3.3 Pneumatic Testing of the Neutron Shield Enclosure Vessel
A pneumatic pressure test of the neutron shield enclosure vessel shall be performed followingfinal closure welding of the enclosure shell returns and enclosure panels. The pneumatic testpressure shall be 37.5 +2.5,-0 psig, which is 125 percent of the relief device set pressure. Thetest shall be performed in accordance with approved written procedures.
During the test, the relief devices on the neutron shield enclosure vessel shall be removed. Oneof the relief device threaded connections is used for connection of the air pressure line and theother connection will be used for connection of the pressure gauge.
Following the introduction of pressurized gas into the neutron shield enclosure vessel, a 15-minute pressure hold time is required. If the neutron shield enclosure vessel fails to holdpressure, an approved soap bubble solution shall be applied to determine the location of theleak. The leak shall be repaired using weld repair procedures prepared in accordance with theASME Code Section III, Subsection NF, Article NF-4450. The pneumatic pressure test shall bere-performed until no pressure loss is observed.
Test results shall be documented and shall become part of the final quality documentationpackage.
8.1.4 Leakage Tests
Leakage testing shall be performed in accordance with the requirements of ANSI N14.5-1997[8.1.4]. Testing shall be performed in accordance with written and approved procedures. Aleakage test of the HI-STAR overpack shall be performed at any time after the containmentboundary fabrication is complete. The leakage test instrumentation shall have a minimum testsensitivity of 2.15x 10⁻⁶ atm cm 3/s (helium). Containment boundary welds shall have indicatedleakage rates not exceeding 4.3xl 0-6 atm cm3/s (helium).
HI-STAR SAR Proposed Rev. 13cREPORT HI-951251 8.1-4

8.1.5 Component and Material Tests
The majority of materials used in the HI-STAR overpack are ferritic steels. ASME CodeSection III and Regulatory Guides 7.11 [8.1.5] and 7.12 [8.1.6] require that certain materials betested in order to assure that these materials are not subject to brittle fracture failures.
Each plate or forging for the HI-STAR 100 Package containment boundary (overpack innershell, bottom plate, top flange, and closure plate) shall be required to be drop weight tested inaccordance with the requirements of Regulatory Guides 7.11 and 7.12, as applicable.Additionally, per the ASME Code Section III, Subsection NB, Article NB-2300, Charpy V-notch testing shall be performed on these materials. Weld material used in welding thecontainment boundary shall be Charpy V-notch tested in accordance with ASME Section II1,Subsection NB, Articles NB-2300 and NB-2430.
Non-containment portions of the overpack, as required, shall be Charpy V-notch tested inaccordance with ASME Section III, Subsection NF, Articles NF-2300, and NF-2430. The non-containment materials to be tested include the intermediate shells, overpack port cover plates,and applicable weld materials.
Tables 2.1.22 and 2.1.23 provide the test temperatures or TNDT, and test requirements to be usedwhen performing the testing specified above.
8.1.5.1 Valves, Relief Devices, and Fluid Transport Devices
There are no fluid transport devices associated with the HI-STAR 100 Package. The onlyvalve-like components in the HI-STAR 100 Package are the specially designed caps installed inthe MPC lid for the drain and vent ports. These caps are recessed inside the MPC lid andcovered by the fully welded vent and drain port cover plates. No credit is taken for the caps'ability to confine helium or radioactivity. After completion of drying and backfill operations,the drain and vent port cover plates are welded in place on the MPC lid and are leak tested toverify the MPC pressure boundary.
There are two relief devices (rupture discs) installed in the upper ledge surface of the neutronshield enclosure vessel of the HI-STAR overpack. These relief devices are provided for ventingpurposes under hypothetical fire accident conditions in which vapor formation from neutronshielding material degradation may occur. The relief devices are designed to relieve at 30 psig(± 5 psig).
8.1.5.2 Seals and Gaskets
Two concentric mechanical seals are provided on the HI-STAR overpack closure plate toprovide containment boundary sealing. Mechanical seals are also used on the overpack ventand drain port plugs of the HI-STAR overpack containment boundary. Each primary seal isindividually leak tested, in accordance with Subsection 8.1.4, prior to the HI-STAR 100Package's first use and during each loading operation. An independent and redundant seal isprovided for each penetration (e.g., closure plate, port cover plates, and closure plate test plug).
HI-STAR SAR Proposed Rev. 13cREPORT HI-951251 8.1-5

No containment credit is taken for these redundant seals and they are not leakage tested. Detailson these seals are provided in Chapter 4.
8.1.5.3 Transport Impact Limiter
The removable HI-STAR transport impact limiters consist of aluminum honeycomb crushmaterial arranged around a carbon steel structure and enclosed by a stainless steel shell. Thedrawings in Chapter 1 specify the .crush strength of the aluminum honeycomb materials(nominal +/- 7%) for each zone of the impact limiter. For manufacturing purposes, verificationof the impact limiter material is accomplished by performance of a crush test of sample blocksof aluminum honeycomb material for each large block manufactured. The verification tests areperformed in accordance with approved procedures. The certified test results shall be submittedto Holtec International with each shipment of material.
All welds on the HI-STAR impact limiter shall be visually examined in accordance with theASME Code, Section V, Article 9, with acceptance criteria per ASME Section III, SubsectionNF, Article NF-5360.
8.1.5.4 Neutron Shielding Material
Neutron shield properties of Holtite-A are provided in Chapter 1. Each manufactured lot ofneutron shield material shall be tested to verify that the material composition (aluminum andhydrogen), boron concentration, and neutron shield density (or specific gravity) meet therequirements specified in Chapter 1. A manufactured lot is defined as the total amount ofmaterial used to make any number of mixed batches comprised of constituent ingredients fromthe same lot/batch identification numbers supplied by the constituent manufacturer. Testingshall be performed in accordance with written and approved procedures and/or standards.Material composition, boron concentration, and density (or specific gravity) data for eachmanufactured lot of neutron shield material shall become -part of the quality recorddocumentation package.
The installation of the neutron shielding material shall be performed in accordance withwritten, approved, and qualified procedures. The procedures shall ensure that mix ratios andmixing methods are controlled in order to achieve proper material composition, boronconcentration and distribution, and that pours are controlled in order to prevent gaps or voidsfrom occurring in the material. Holtec International shall maintain samples of eachmanufactured lot of neutron shield material.
Users shall implement procedures which verify the integrity of the Holtite-A neutron shieldonce for each overpack. Neutron shield integrity shall be verified via measurements either atfirst use or with a check source using, at a maximum, a 6x6 inch test grid over the entiresurface of the neutron shield, including the impact limiters. Measurements shall be comparedto calculated values representative of either the check source being used or the loaded contents.
If a check source was used in the shielding integrity test, following the first fuel loading of eachHI-STAR 100 Package, a shielding effectiveness test shall be performed to verify the
HI-STAR SAR Proposed Rev. 13cREPORT HI-951251 8.1-6

effectiveness of the neutron shield using written and approved procedures. Calibrated radiationdetection equipment shall be used to take measurements at the surface of the HI-STARoverpack. Measurements shall be taken at three cross sectional planes through the radial shieldand at four points along each plane's circumference. The average measurement results fromeach sectional plane shall be compared to calculated values to assess the continuedeffectiveness of the neutron shield. The calculated values shall be representative of the loadedcontents (i.e., fuel type, enrichment, bumup, cooling time, etc...). Measurements shall bedocumented and become part of the quality documentation package.
8.1.5.5 Neutron Absorber Material
Each plate of neutron absorber shall be visually inspected for damage such as scratches, cracks,burrs, peeled cladding, foreign material embedded in the surfaces, voids, delamination, andsurface finish.
8.1.5.5.1 Boral
After manufacturing, a statistical sample of each lot of neutron absorber shall be tested usingwet chemistry and/or neutron attenuation testing to verify minimum 10B content (areal density)in samples taken from the ends of the panel. The minimum 1°B loading of the neutron absorberpanels for each MPC model must comply with the limits specified on the drawings. Any panelin which 1OB loading is less than the minimum allowed shall be rejected. Testing shall beperformed using written and approved procedures. Results shall be documented and becomepart of the cask quality records documentation package.
8.1.5.5.2 METAMIC®
NUREG/CR-5661 identifies the main reason for a penalty in the neutron absorber B-10 densityas the potential of neutron streaming due to non-uniformities in the neutron absorber, andrecommends comprehensive acceptance tests to verify the presence and uniformity of theneutron absorber for credits more than 75%. Since a 90% credit is taken for METAMIC®, thefollowing criteria must be satisfied:
* The boron carbide powder used in the manufacturing of METAMIC® must have smallparticle sizes to preclude neutron streaming.
" The 1°B areal density must comply with the limits specified on the drawings.
" The B 4C powder must be uniformly dispersed locally i.e. must not show any particleagglomeration. This precludes neutron streaming.
" The B4C powder must be uniformly dispersed macroscopically i.e. must have a consistentconcentration throughout the entire neutron absorber panel.
" The maximum B4C content in METAMIC® shall. be less than or equal to 33.0 weightpercent.
HI-STAR SAR Proposed Rev. 13cREPORT HI-951251 8.1-7

To ensure that the above requirements are met the following tests shall be performed:
" All lots of boron carbide powder are analyzed to meet particle size distributionrequirements.
" The following qualification testing shall be performed on the first production run ofMETAMIC® panels for the MPCs in order to validate the acceptability and consistency ofthe manufacturing process and verify the acceptability of the METAMIC® panels forneutron absorbing capabilities:
1) The boron carbide powder weight percent shall be verified by testing a sample fromforty different mixed batches. (A'mixed batch is defined as a single mixture ofaluminum powder and boron carbide powder used to make one or more billets. Eachbillet will produce several panels.) The samples shall be drawn from the mixingcontainers after mixing operations have been completed. Testing shall be performedusing the wet chemistry method.
2) The 1°B areal density shall be verified by testing a sample from one panel from each offorty different mixed batches. The samples shall be drawn from areas contiguous to themanufactured panels of METAMIC® and shall be tested using the wet chemistrymethod. Alternatively, or in addition to the wet chemistry tests, neutron attenuation testson the samples may be performed to quantify the actual 10B areal density.
3) To verify the local uniformity of the boron particle dispersal, neutron attenuationmeasurements of random test coupons shall be performed. These test coupons maycome from the production run or from pre-production trial runs.
4) To verify the macroscopic uniformity of the boron particle distribution, test samplesshall be taken from the sides of one panel from five different mixed batches before thepanels are cut to their final sizes. The sample locations shall be chosen to berepresentative of the final product. Wet chemistry or neutron attenuation shall beperformed on each of the samples.
* During production runs, testing of mixed batches shall be performed on a statistical basis toverify the correct boron carbide weight percent is being mixed.
" During production runs, samples from random METAMIC® panels taken from areascontiguous to the manufactured panels shall be tested via wet chemistry and/or neutronattenuation testing to verify the 1°B areal density. This test shall be performed to verify thecontinued acceptability of the manufacturing process.
The measurements of B 4C particle size, 10 B isotopic assay, uniformity of B4C distribution and10B areal density shall be made using written and approved procedures. Results shall bedocumented and become part of the cask quality records documentation package.
HI-STAR SAR Proposed Rev. 13cREPORT HI-951251 8.1-8

8.1.5.6 Gamma Shielding
The gamma shielding (steel) in the construction of the HI-STAR 100 package is dimensionallyinspected to assure compliance with the applicable drawings referenced in the CoC and asrequired in Subsection 8.1 .1.
8.1.6 Thermal Tests
The first fabricated HI-STAR 100 overpack was tested to confirm its heat transfer capability.The test was performed and documented in Holtec Document DOC-5014-01 [8.1.7]. The testshave shown that the HI-STAR 100 system is within acceptable limits and future thermal testingis no longer required.
HI-STAR SARREPORT HI-951251
Proposed Rev. 13c8.1-9