Embed Size (px)
Citation preview
1
2
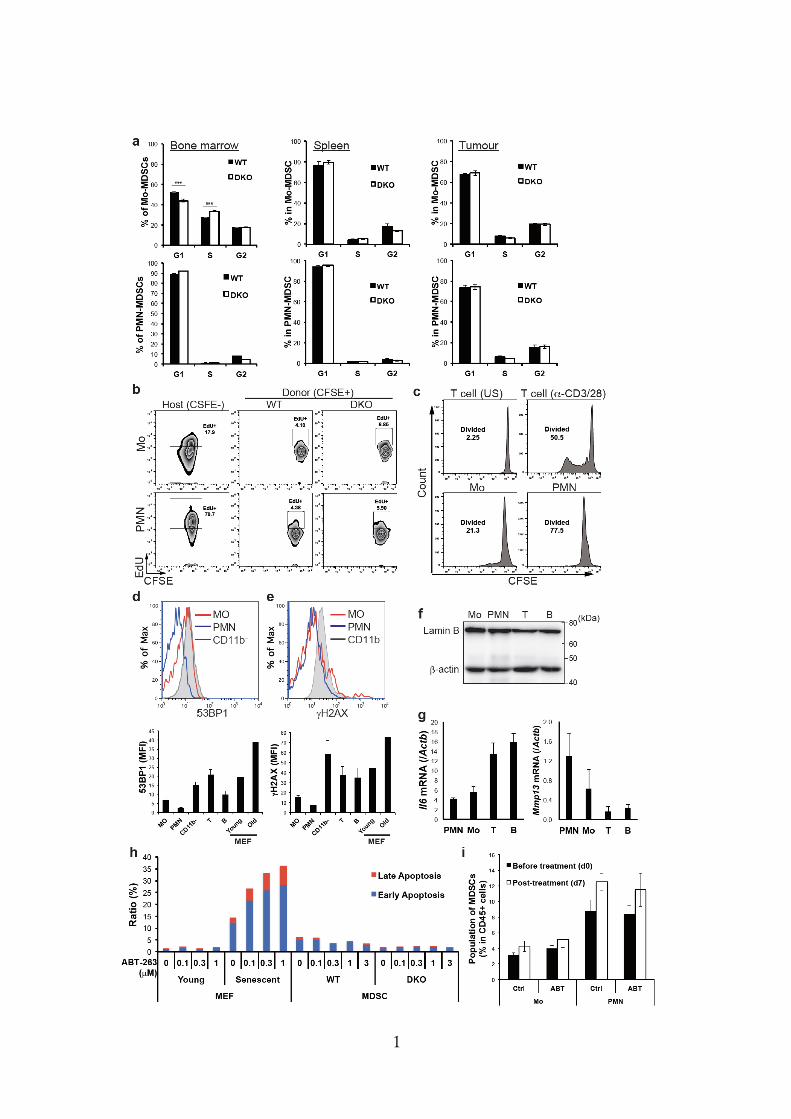
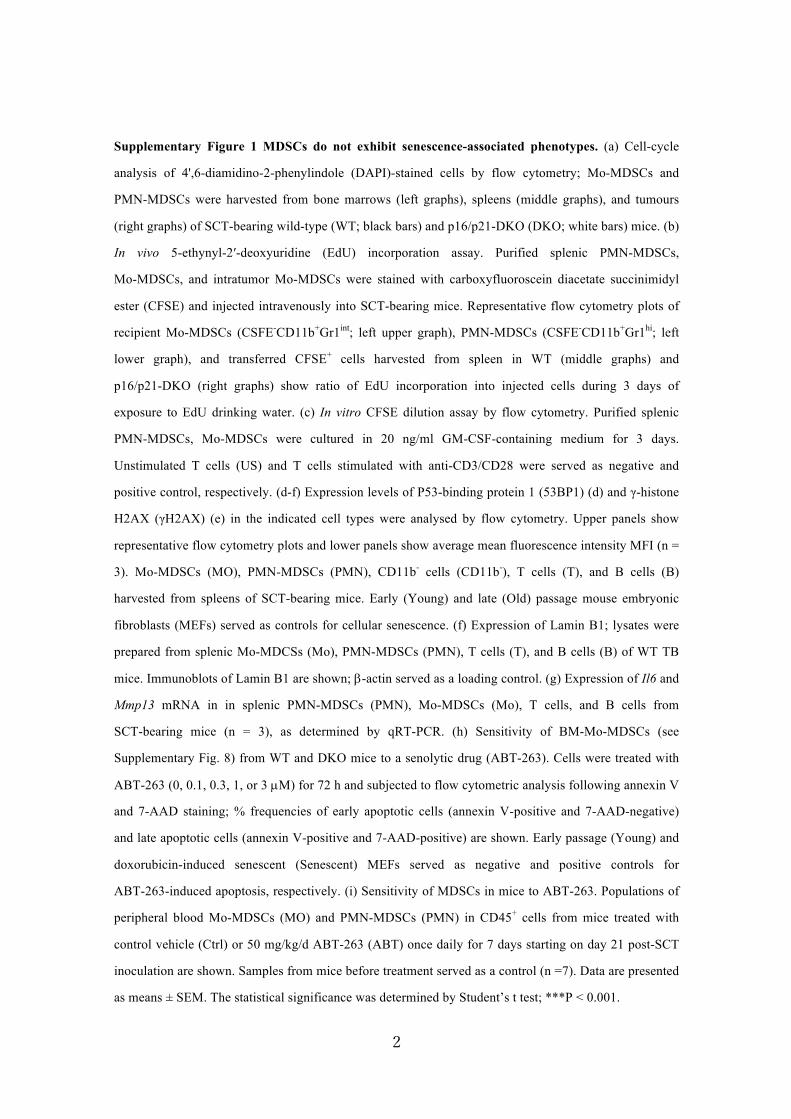
Supplementary Figure 1 MDSCs do not exhibit senescence-associated phenotypes. (a) Cell-cycle
analysis of 4',6-diamidino-2-phenylindole (DAPI)-stained cells by flow cytometry; Mo-MDSCs and
PMN-MDSCs were harvested from bone marrows (left graphs), spleens (middle graphs), and tumours
(right graphs) of SCT-bearing wild-type (WT; black bars) and p16/p21-DKO (DKO; white bars) mice. (b)
In vivo 5-ethynyl-2′-deoxyuridine (EdU) incorporation assay. Purified splenic PMN-MDSCs,
Mo-MDSCs, and intratumor Mo-MDSCs were stained with carboxyfluoroscein diacetate succinimidyl
ester (CFSE) and injected intravenously into SCT-bearing mice. Representative flow cytometry plots of
recipient Mo-MDSCs (CSFE-CD11b+Gr1int; left upper graph), PMN-MDSCs (CSFE-CD11b+Gr1hi; left
lower graph), and transferred CFSE+ cells harvested from spleen in WT (middle graphs) and
p16/p21-DKO (right graphs) show ratio of EdU incorporation into injected cells during 3 days of
exposure to EdU drinking water. (c) In vitro CFSE dilution assay by flow cytometry. Purified splenic
PMN-MDSCs, Mo-MDSCs were cultured in 20 ng/ml GM-CSF-containing medium for 3 days.
Unstimulated T cells (US) and T cells stimulated with anti-CD3/CD28 were served as negative and
positive control, respectively. (d-f) Expression levels of P53-binding protein 1 (53BP1) (d) and γ-histone
H2AX (γH2AX) (e) in the indicated cell types were analysed by flow cytometry. Upper panels show
representative flow cytometry plots and lower panels show average mean fluorescence intensity MFI (n =
3). Mo-MDSCs (MO), PMN-MDSCs (PMN), CD11b- cells (CD11b-), T cells (T), and B cells (B)
harvested from spleens of SCT-bearing mice. Early (Young) and late (Old) passage mouse embryonic
fibroblasts (MEFs) served as controls for cellular senescence. (f) Expression of Lamin B1; lysates were
prepared from splenic Mo-MDCSs (Mo), PMN-MDSCs (PMN), T cells (T), and B cells (B) of WT TB
mice. Immunoblots of Lamin B1 are shown; b-actin served as a loading control. (g) Expression of Il6 and
Mmp13 mRNA in in splenic PMN-MDSCs (PMN), Mo-MDSCs (Mo), T cells, and B cells from
SCT-bearing mice (n = 3), as determined by qRT-PCR. (h) Sensitivity of BM-Mo-MDSCs (see
Supplementary Fig. 8) from WT and DKO mice to a senolytic drug (ABT-263). Cells were treated with
ABT-263 (0, 0.1, 0.3, 1, or 3 µM) for 72 h and subjected to flow cytometric analysis following annexin V
and 7-AAD staining; % frequencies of early apoptotic cells (annexin V-positive and 7-AAD-negative)
and late apoptotic cells (annexin V-positive and 7-AAD-positive) are shown. Early passage (Young) and
doxorubicin-induced senescent (Senescent) MEFs served as negative and positive controls for
ABT-263-induced apoptosis, respectively. (i) Sensitivity of MDSCs in mice to ABT-263. Populations of
peripheral blood Mo-MDSCs (MO) and PMN-MDSCs (PMN) in CD45+ cells from mice treated with
control vehicle (Ctrl) or 50 mg/kg/d ABT-263 (ABT) once daily for 7 days starting on day 21 post-SCT
inoculation are shown. Samples from mice before treatment served as a control (n =7). Data are presented
as means ± SEM. The statistical significance was determined by Student’s t test; ***P < 0.001.

3
Supplementary Figure 2 Tumour Growth is inhibited in p16/p21-DKO mice but not in p16KO or
p21KO mice. Tumour size in SCT-injected WT, p16KO, p21KO, and p16/p21-DKO mice. Data of WT
and p16/p21-DKO are also shown in Figure 2a. Data are represented as the means ± SEM. The statistical
significance was determined by Student’s t test; ***P < 0.001; NS, not significant.
***NS
NS
0
200
400
600
800
1000
1200
1400
1600
1800
0 5 10 15 20 25 30
Tu
mo
r v
olu
me
(m
m3)
Time after inoculation (days)
WT (N=12)
p16KO (N=6)
p21KO (N=7)
p16/21DKO (N=11)
4
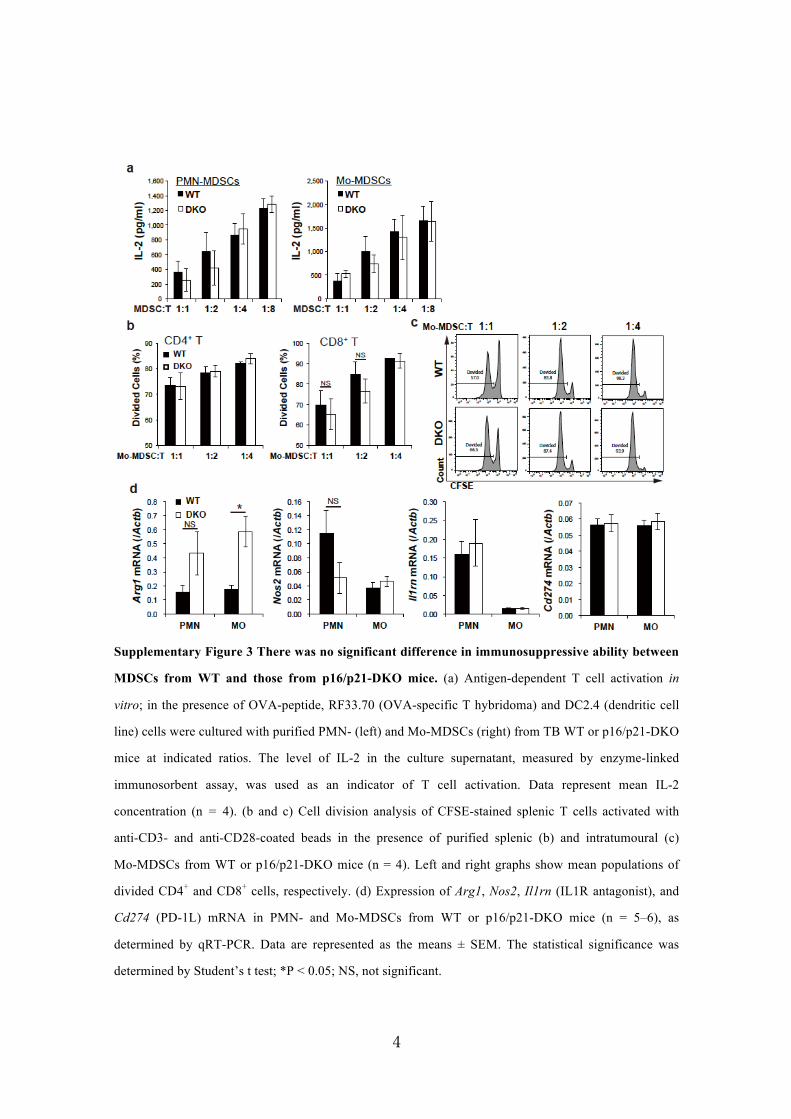
Supplementary Figure 3 There was no significant difference in immunosuppressive ability between
MDSCs from WT and those from p16/p21-DKO mice. (a) Antigen-dependent T cell activation in
vitro; in the presence of OVA-peptide, RF33.70 (OVA-specific T hybridoma) and DC2.4 (dendritic cell
line) cells were cultured with purified PMN- (left) and Mo-MDSCs (right) from TB WT or p16/p21-DKO
mice at indicated ratios. The level of IL-2 in the culture supernatant, measured by enzyme-linked
immunosorbent assay, was used as an indicator of T cell activation. Data represent mean IL-2
concentration (n = 4). (b and c) Cell division analysis of CFSE-stained splenic T cells activated with
anti-CD3- and anti-CD28-coated beads in the presence of purified splenic (b) and intratumoural (c)
Mo-MDSCs from WT or p16/p21-DKO mice (n = 4). Left and right graphs show mean populations of
divided CD4+ and CD8+ cells, respectively. (d) Expression of Arg1, Nos2, Il1rn (IL1R antagonist), and
Cd274 (PD-1L) mRNA in PMN- and Mo-MDSCs from WT or p16/p21-DKO mice (n = 5–6), as
determined by qRT-PCR. Data are represented as the means ± SEM. The statistical significance was
determined by Student’s t test; *P < 0.05; NS, not significant.

5
Supplementary Figure 4 Decreased number of intratumoral Mo-MDSCs leads to attenuation of
local immunosuppression. (a) Representative flow cytometry plots of CD8+-gated cells in draining
lymph nodes of WT and p16/p21-DKO mice 3 weeks after SCT cell injection. Cells were labelled with
CD8, CD44, and CD62L antibodies. (b) Mean populations of CD44highCD62low cells in the CD8+ gated
cells shown in (a) (n = 6); (c) Representative flow cytometry plots of CD3+CD4+-gated cells in draining
lymph nodes from WT and p16/p21-DKO mice 3 weeks after SCT cell injection. Cells were labelled with
CD3, CD4, and FoxP3 antibodies. (d) Mean number of FoxP3+ cells in the CD4+ population shown in (c)
(n = 6). (e and f) Expression of CD69 in CD8+-gated cells in intratumoural cells. Representative
histogram (e) and average of the MFI (f) (n = 4). (g and h) Population of PD-1+ cells in CD8+-gated cells
in intratumoural cells. Representative histogram (g) and mean (h) (n = 4); data are represented as means ±
SEM. The statistical significance was determined by Student’s t test; *P < 0.05 and ***P < 0.001.
6
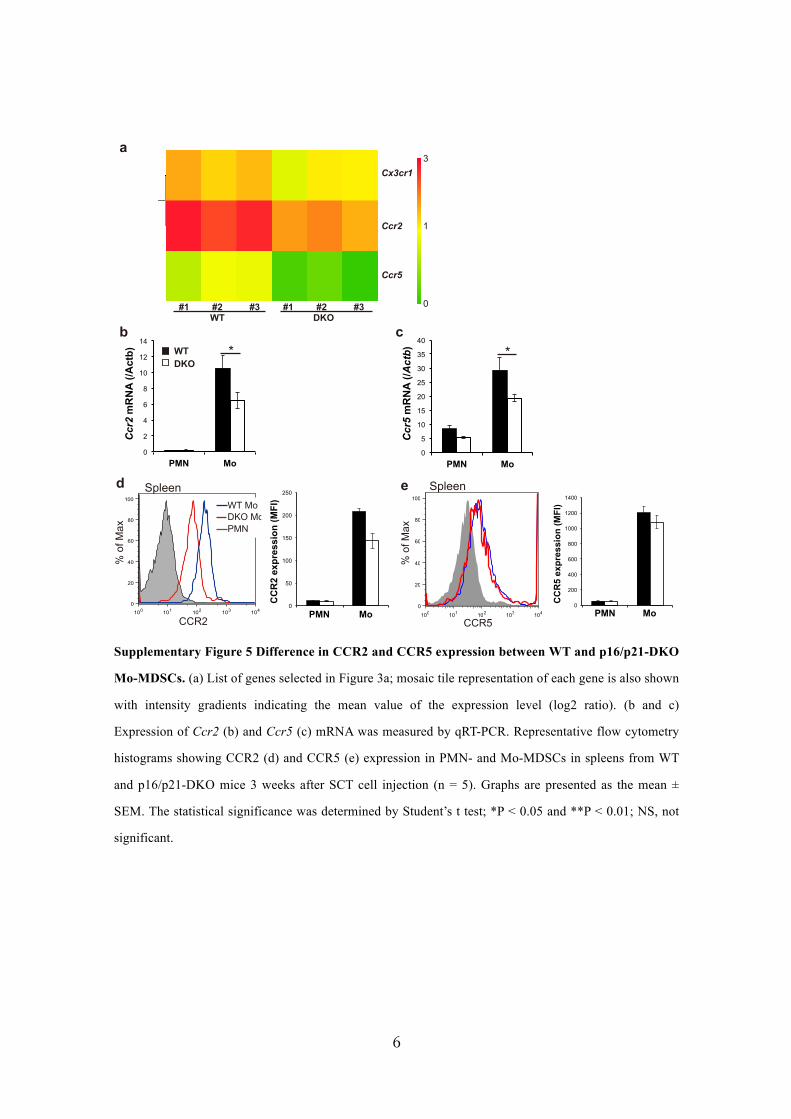
Supplementary Figure 5 Difference in CCR2 and CCR5 expression between WT and p16/p21-DKO
Mo-MDSCs. (a) List of genes selected in Figure 3a; mosaic tile representation of each gene is also shown
with intensity gradients indicating the mean value of the expression level (log2 ratio). (b and c)
Expression of Ccr2 (b) and Ccr5 (c) mRNA was measured by qRT-PCR. Representative flow cytometry
histograms showing CCR2 (d) and CCR5 (e) expression in PMN- and Mo-MDSCs in spleens from WT
and p16/p21-DKO mice 3 weeks after SCT cell injection (n = 5). Graphs are presented as the mean ±
SEM. The statistical significance was determined by Student’s t test; *P < 0.05 and **P < 0.01; NS, not
significant.
100
101
102
103
104
0
20
40
60
80
100
Spleen
**WT Mo
DKO Mo
PMN
100
101
102
103
104
0
20
40
60
80
100
Spleen
NS
d
WT
DKO
0
2
4
6
8
10
12
14
PMN Mo
Ccr2
mR
NA
(/A
ctb
)
0
5
10
15
20
25
30
35
40
PMN Mo
Ccr5
mR
NA
(/Actb)
* *
b
e
CCR5CCR2
% o
f M
ax
% o
f M
ax
WT
DKO
0
50
100
150
200
250
PMN Mo
CC
R2
ex
pre
ss
ion
(M
FI)
0
200
400
600
800
1000
1200
1400
PMN Mo
CC
R5
ex
pre
ss
ion
(M
FI)
Cx3cr1
Ccr2
Ccr5
WT DKO
#1 #2 #3 #1 #2 #3 0
3
1
c
a

7
Supplementary Figure 6 Cancer specificity for p16/p21-dependent tumour promotion and CX3CL1
expression in tumour cells. (a) Growth curves of LLC in WT and p16/p21-DKO mice. (b) Cx3cl1
mRNA expression in the LLC, SCT, and tumour derived from SCT inoculation in vivo, as determined by
qRT-PCR. (c,d) mRNA level of Ccl2 (c) and Ccl7 (d) in LLC and SCT were measured by qRT-PCR.
Graphs show the mean ± SEM. The statistical significance was determined by Student’s t test; **P < 0.01
and ***P < 0.001; NS, not significant.
8
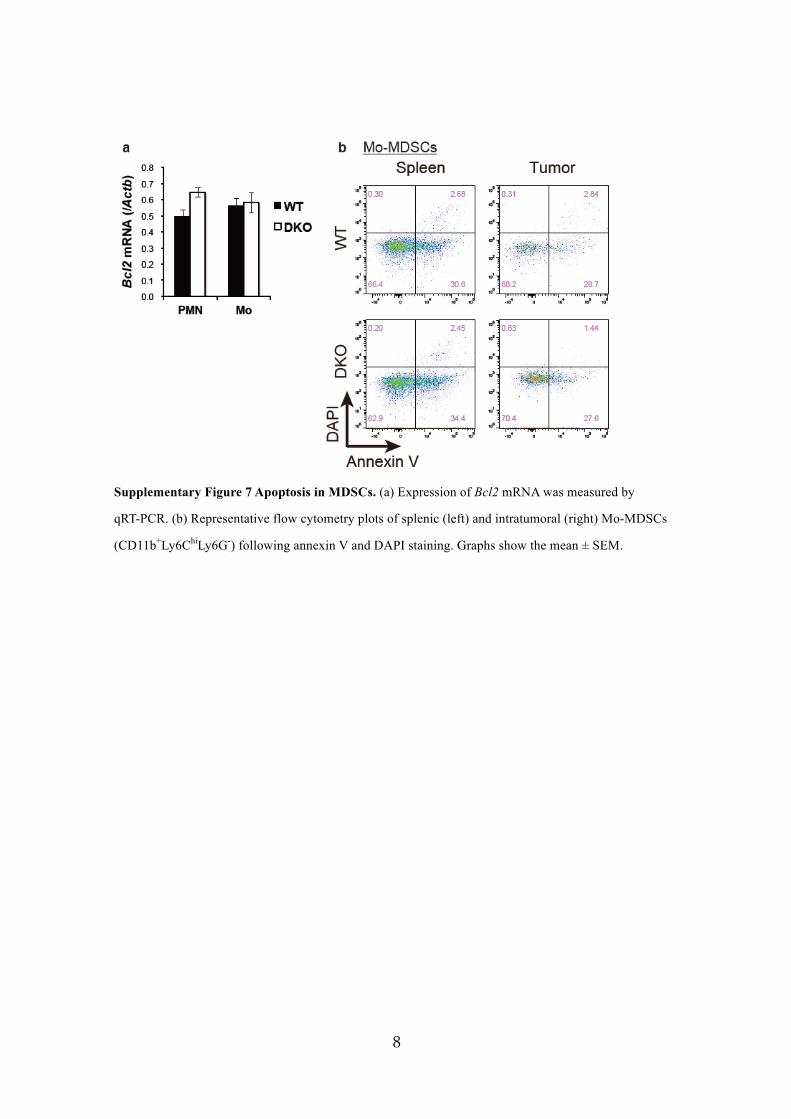
Supplementary Figure 7 Apoptosis in MDSCs. (a) Expression of Bcl2 mRNA was measured by
qRT-PCR. (b) Representative flow cytometry plots of splenic (left) and intratumoral (right) Mo-MDSCs
(CD11b+Ly6ChiLy6G-) following annexin V and DAPI staining. Graphs show the mean ± SEM.
9
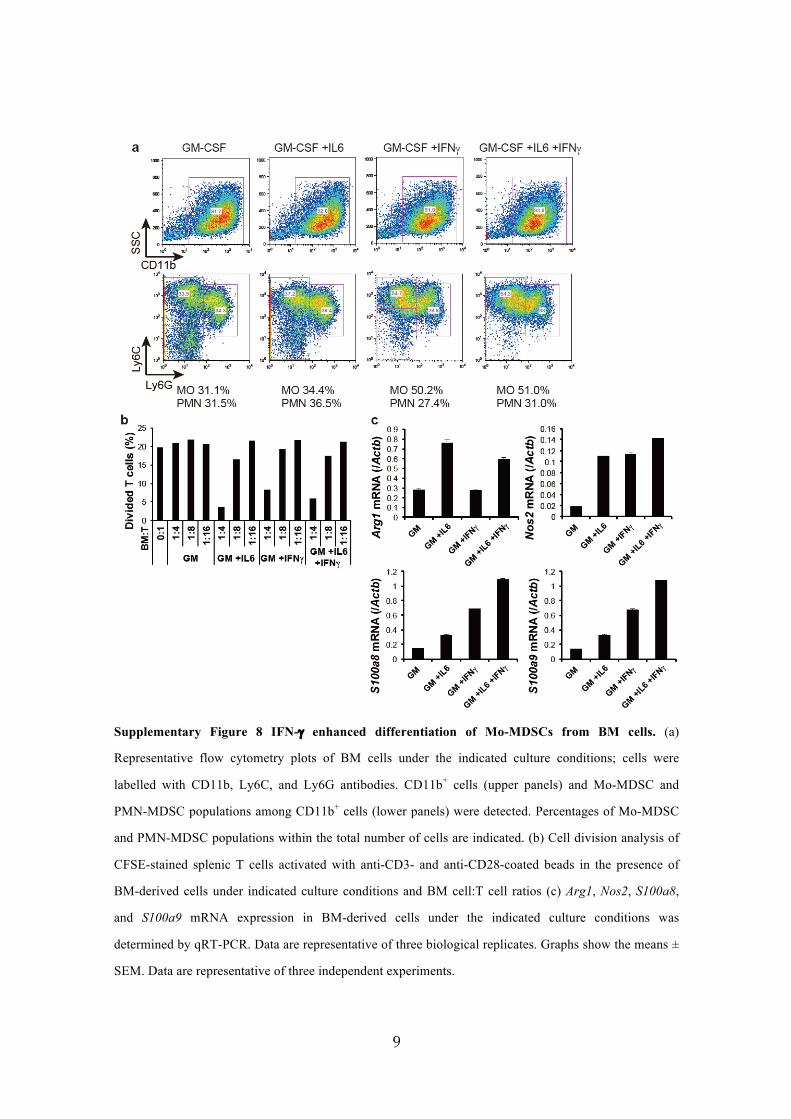
Supplementary Figure 8 IFN-g enhanced differentiation of Mo-MDSCs from BM cells. (a)
Representative flow cytometry plots of BM cells under the indicated culture conditions; cells were
labelled with CD11b, Ly6C, and Ly6G antibodies. CD11b+ cells (upper panels) and Mo-MDSC and
PMN-MDSC populations among CD11b+ cells (lower panels) were detected. Percentages of Mo-MDSC
and PMN-MDSC populations within the total number of cells are indicated. (b) Cell division analysis of
CFSE-stained splenic T cells activated with anti-CD3- and anti-CD28-coated beads in the presence of
BM-derived cells under indicated culture conditions and BM cell:T cell ratios (c) Arg1, Nos2, S100a8,
and S100a9 mRNA expression in BM-derived cells under the indicated culture conditions was
determined by qRT-PCR. Data are representative of three biological replicates. Graphs show the means ±
SEM. Data are representative of three independent experiments.

10
Supplementary Figure 9 SV40LT-expressing SCT cells are resistant to flavopiridol. (a) Expression
of SV40 large T antigen (SV40LT); lysates were prepared from mock- and SV40LT-transduced SCT
cells. Immunoblots of SV40LT are shown; a-tubulin served as a loading control. (b) Representative
images of SCTs and SV40LT-expressing SCTs treated with flavopiridol (33 or 10 µM) or DMSO control
(None).

11
Supplementary Figure 10 Tumour-promoting mechanism of p16Ink4a and p21Cip1/Waf1 in Mo-MDSCs.
(a) Mo-MDSCs express both p16Ink4a and p21Cip1/Waf1, and migrate into CX3CL1-expressing tumours.
However, loss of p16/p21 decreases CX3CR1-mediated infiltration of Mo-MDSCs into the tumour,
resulting in attenuation of immunosuppressive ability in vivo. (b) Molecular mechanism of
p16/p21-mediated CX3CR1 expression in Mo-MDSCs and experimentally demonstrated effects of
inhibition of the CX3CL1/CX3CR1 axis and CDK on tumour progression.


![The F-Box Protein OsFBK12 Targets OsSAMS1 for … · The F-Box Protein OsFBK12 Targets OsSAMS1 for Degradation and Affects Pleiotropic Phenotypes, Including Leaf Senescence, in Rice1[W][OPEN]](https://img.pdfslide.net/doc/110x75/5b92634909d3f215288dcf49/the-f-box-protein-osfbk12-targets-ossams1-for-the-f-box-protein-osfbk12-targets.jpg)